Sheep Springs, NM Map & Demographics
Sheep Springs Map
Sheep Springs Overview
$11,062
PER CAPITA INCOME
$20,417
AVG FAMILY INCOME
$19,886
AVG HOUSEHOLD INCOME
30.5%
WAGE / INCOME GAP [ % ]
69.5¢/ $1
WAGE / INCOME GAP [ $ ]
0.50
INEQUALITY / GINI INDEX
362
TOTAL POPULATION
191
MALE POPULATION
171
FEMALE POPULATION
111.70
MALES / 100 FEMALES
89.53
FEMALES / 100 MALES
30.3
MEDIAN AGE
4.6
AVG FAMILY SIZE
4.4
AVG HOUSEHOLD SIZE
124
LABOR FORCE [ PEOPLE ]
45.8%
PERCENT IN LABOR FORCE
18.5%
UNEMPLOYMENT RATE
Sheep Springs Zip Codes
Sheep Springs Area Codes
Income in Sheep Springs
Income Overview in Sheep Springs
Per Capita Income in Sheep Springs is $11,062, while median incomes of families and households are $20,417 and $19,886 respectively.
| Characteristic | Number | Measure |
| Per Capita Income | 362 | $11,062 |
| Median Family Income | 73 | $20,417 |
| Mean Family Income | 73 | $38,804 |
| Median Household Income | 83 | $19,886 |
| Mean Household Income | 83 | $37,258 |
| Income Deficit | 73 | $0 |
| Wage / Income Gap (%) | 362 | 30.49% |
| Wage / Income Gap ($) | 362 | 69.51¢ per $1 |
| Gini / Inequality Index | 362 | 0.50 |
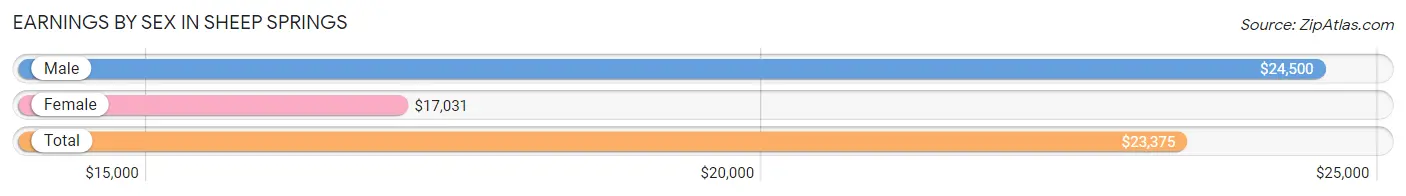
Earnings by Sex in Sheep Springs
Average Earnings in Sheep Springs are $23,375, $24,500 for men and $17,031 for women, a difference of 30.5%.
| Sex | Number | Average Earnings |
| Male | 66 (49.6%) | $24,500 |
| Female | 67 (50.4%) | $17,031 |
| Total | 133 (100.0%) | $23,375 |
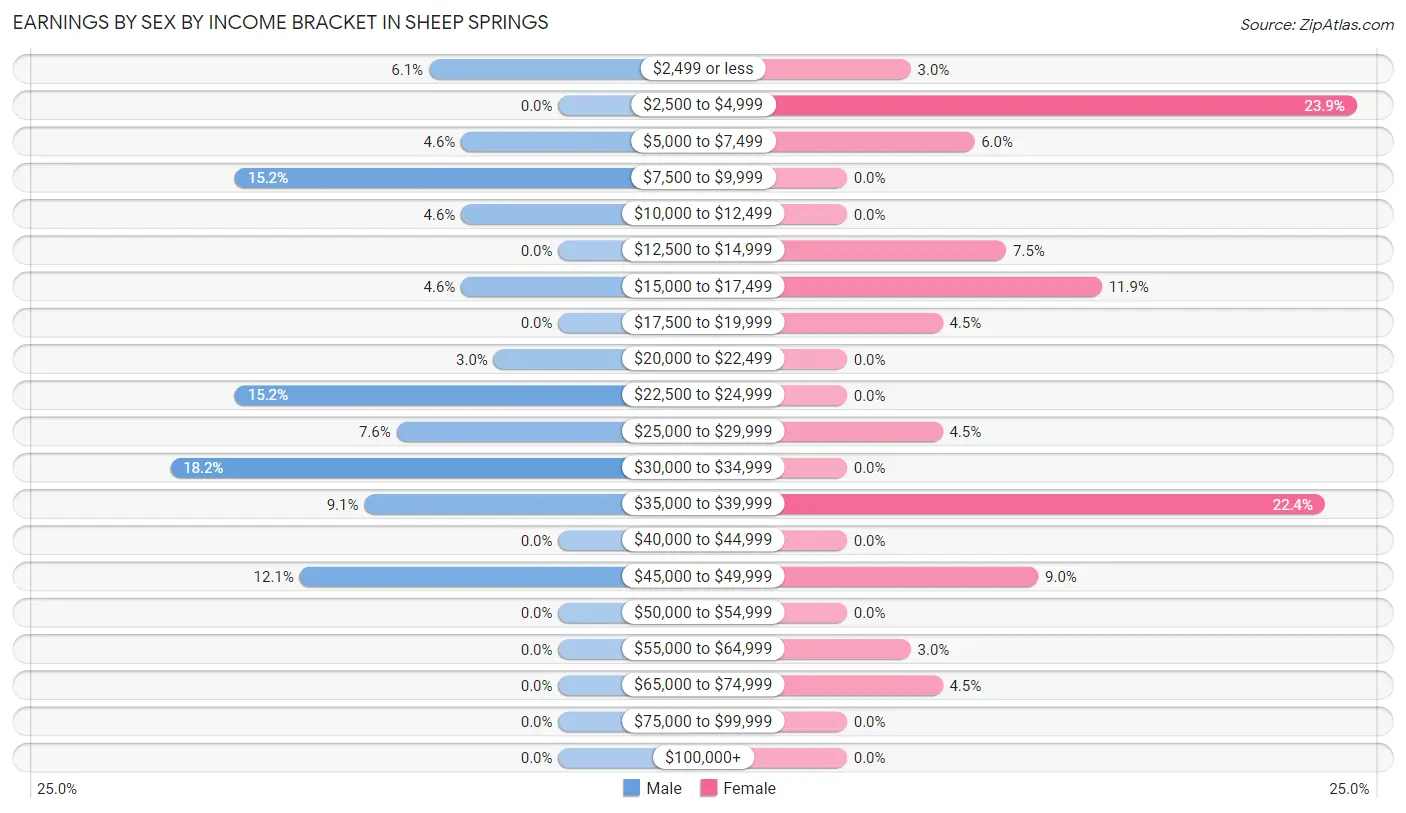
Earnings by Sex by Income Bracket in Sheep Springs
The most common earnings brackets in Sheep Springs are $30,000 to $34,999 for men (12 | 18.2%) and $2,500 to $4,999 for women (16 | 23.9%).
| Income | Male | Female |
| $2,499 or less | 4 (6.1%) | 2 (3.0%) |
| $2,500 to $4,999 | 0 (0.0%) | 16 (23.9%) |
| $5,000 to $7,499 | 3 (4.5%) | 4 (6.0%) |
| $7,500 to $9,999 | 10 (15.1%) | 0 (0.0%) |
| $10,000 to $12,499 | 3 (4.5%) | 0 (0.0%) |
| $12,500 to $14,999 | 0 (0.0%) | 5 (7.5%) |
| $15,000 to $17,499 | 3 (4.5%) | 8 (11.9%) |
| $17,500 to $19,999 | 0 (0.0%) | 3 (4.5%) |
| $20,000 to $22,499 | 2 (3.0%) | 0 (0.0%) |
| $22,500 to $24,999 | 10 (15.1%) | 0 (0.0%) |
| $25,000 to $29,999 | 5 (7.6%) | 3 (4.5%) |
| $30,000 to $34,999 | 12 (18.2%) | 0 (0.0%) |
| $35,000 to $39,999 | 6 (9.1%) | 15 (22.4%) |
| $40,000 to $44,999 | 0 (0.0%) | 0 (0.0%) |
| $45,000 to $49,999 | 8 (12.1%) | 6 (9.0%) |
| $50,000 to $54,999 | 0 (0.0%) | 0 (0.0%) |
| $55,000 to $64,999 | 0 (0.0%) | 2 (3.0%) |
| $65,000 to $74,999 | 0 (0.0%) | 3 (4.5%) |
| $75,000 to $99,999 | 0 (0.0%) | 0 (0.0%) |
| $100,000+ | 0 (0.0%) | 0 (0.0%) |
| Total | 66 (100.0%) | 67 (100.0%) |
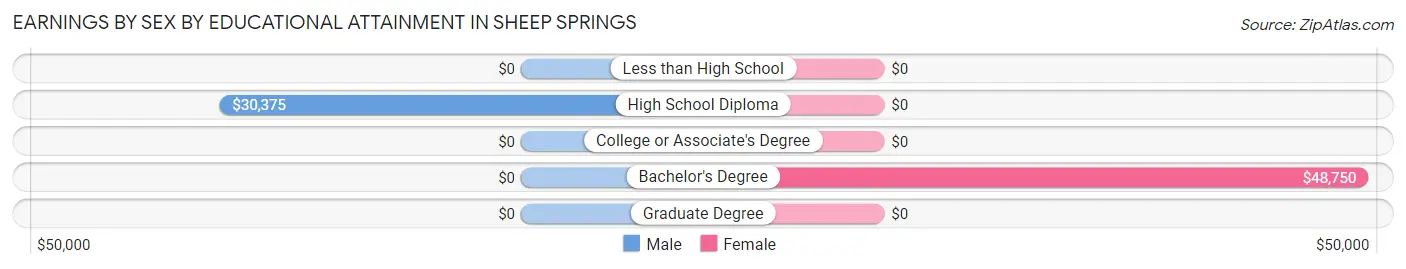
Earnings by Sex by Educational Attainment in Sheep Springs
Average earnings in Sheep Springs are $27,500 for men and $25,833 for women, a difference of 6.1%. Men with an educational attainment of high school diploma enjoy the highest average annual earnings of $30,375, while those with high school diploma education earn the least with $30,375. Women with an educational attainment of bachelor's degree earn the most with the average annual earnings of $48,750, while those with bachelor's degree education have the smallest earnings of $48,750.
| Educational Attainment | Male Income | Female Income |
| Less than High School | - | - |
| High School Diploma | $30,375 | $0 |
| College or Associate's Degree | - | - |
| Bachelor's Degree | - | - |
| Graduate Degree | - | - |
| Total | $27,500 | $25,833 |
Family Income in Sheep Springs
Family Income Brackets in Sheep Springs
According to the Sheep Springs family income data, there are 16 families falling into the $15,000 to $24,999 income range, which is the most common income bracket and makes up 21.9% of all families.
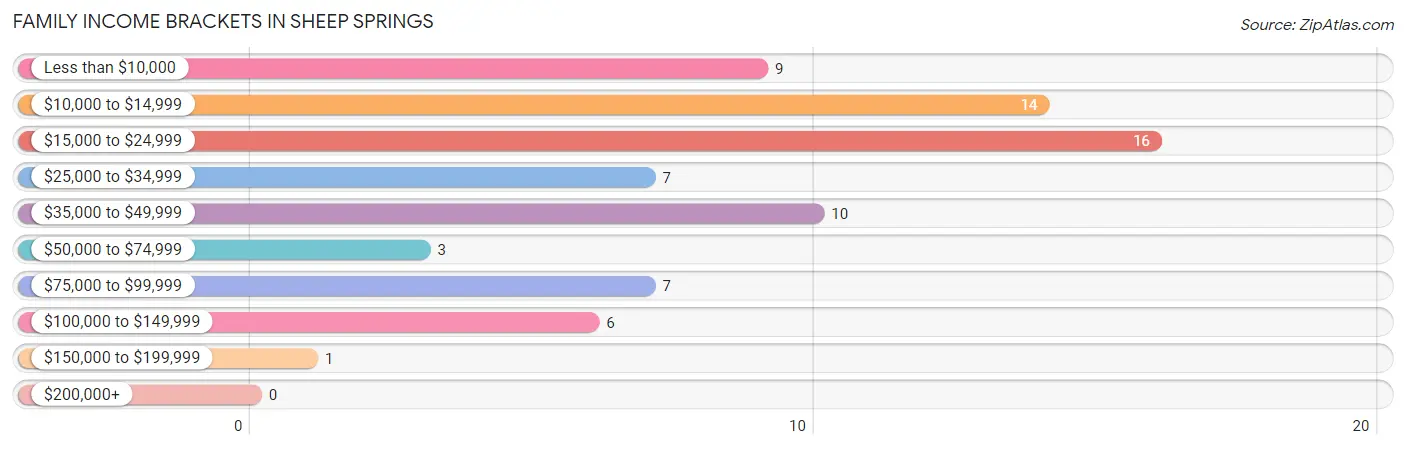
| Income Bracket | # Families | % Families |
| Less than $10,000 | 9 | 12.3% |
| $10,000 to $14,999 | 14 | 19.2% |
| $15,000 to $24,999 | 16 | 21.9% |
| $25,000 to $34,999 | 7 | 9.6% |
| $35,000 to $49,999 | 10 | 13.7% |
| $50,000 to $74,999 | 3 | 4.1% |
| $75,000 to $99,999 | 7 | 9.6% |
| $100,000 to $149,999 | 6 | 8.2% |
| $150,000 to $199,999 | 1 | 1.4% |
| $200,000+ | 0 | 0.0% |
Family Income by Famaliy Size in Sheep Springs
3-person families (31 | 42.5%) account for the highest median family income in Sheep Springs with $35,156 per family, while 3-person families (31 | 42.5%) have the highest median income of $11,719 per family member.
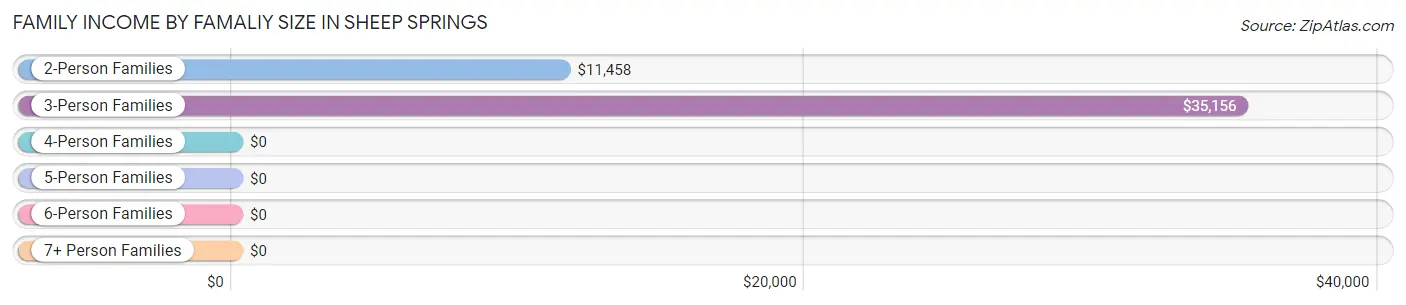
| Income Bracket | # Families | Median Income |
| 2-Person Families | 24 (32.9%) | $11,458 |
| 3-Person Families | 31 (42.5%) | $35,156 |
| 4-Person Families | 3 (4.1%) | $0 |
| 5-Person Families | 9 (12.3%) | $0 |
| 6-Person Families | 2 (2.7%) | $0 |
| 7+ Person Families | 4 (5.5%) | $0 |
| Total | 73 (100.0%) | $20,417 |
Family Income by Number of Earners in Sheep Springs
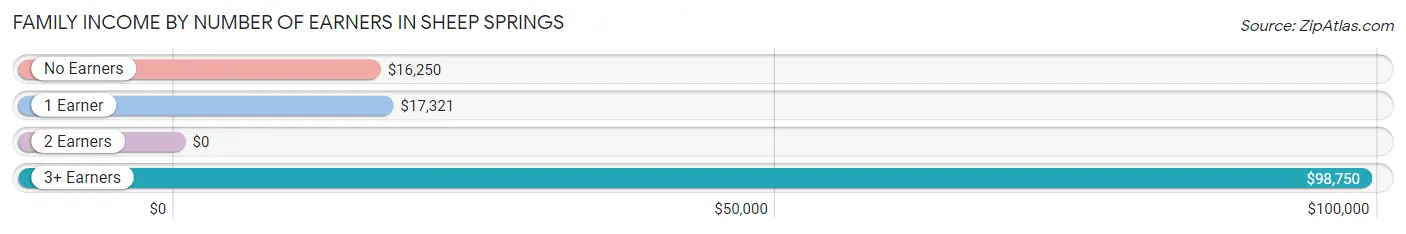
| Number of Earners | # Families | Median Income |
| No Earners | 16 (21.9%) | $16,250 |
| 1 Earner | 27 (37.0%) | $17,321 |
| 2 Earners | 21 (28.8%) | $0 |
| 3+ Earners | 9 (12.3%) | $98,750 |
| Total | 73 (100.0%) | $20,417 |
Household Income in Sheep Springs
Household Income Brackets in Sheep Springs
With 23 households falling in the category, the $15,000 to $24,999 income range is the most frequent in Sheep Springs, accounting for 27.7% of all households.
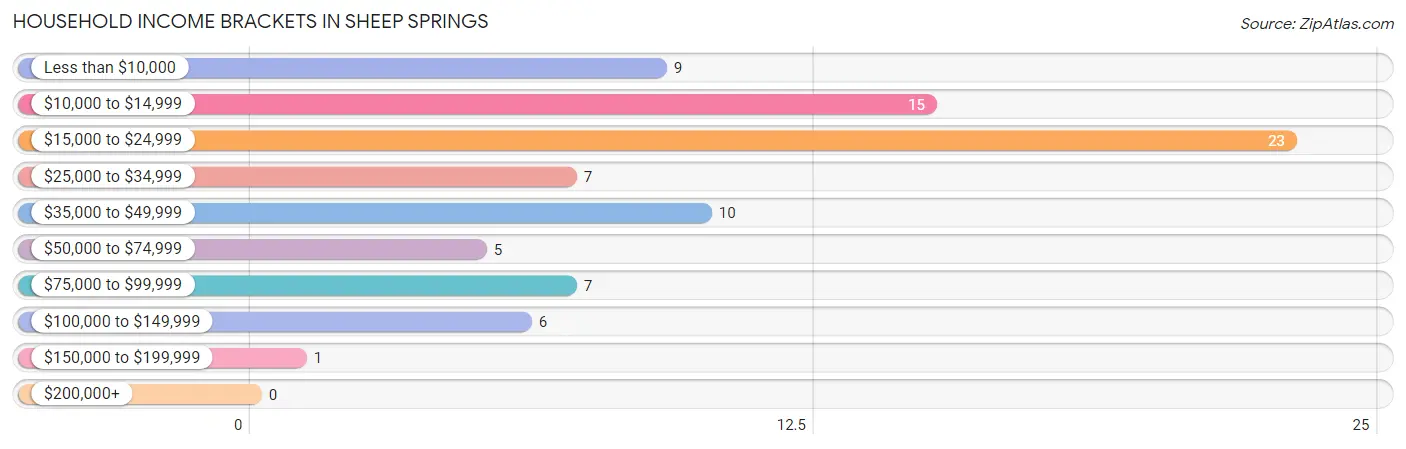
| Income Bracket | # Households | % Households |
| Less than $10,000 | 9 | 10.8% |
| $10,000 to $14,999 | 15 | 18.1% |
| $15,000 to $24,999 | 23 | 27.7% |
| $25,000 to $34,999 | 7 | 8.4% |
| $35,000 to $49,999 | 10 | 12.0% |
| $50,000 to $74,999 | 5 | 6.0% |
| $75,000 to $99,999 | 7 | 8.4% |
| $100,000 to $149,999 | 6 | 7.2% |
| $150,000 to $199,999 | 1 | 1.2% |
| $200,000+ | 0 | 0.0% |
Household Income by Householder Age in Sheep Springs
The median household income in Sheep Springs is $19,886, with the highest median household income of $35,625 found in the 25 to 44 years age bracket for the primary householder. A total of 24 households (28.9%) fall into this category.
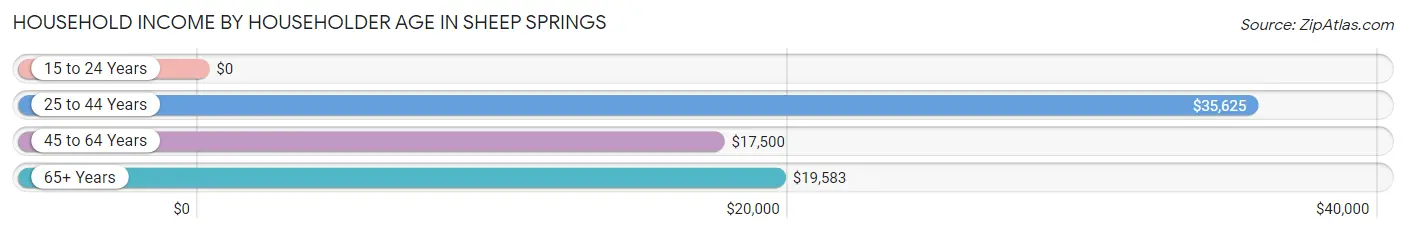
| Income Bracket | # Households | Median Income |
| 15 to 24 Years | 0 (0.0%) | $0 |
| 25 to 44 Years | 24 (28.9%) | $35,625 |
| 45 to 64 Years | 40 (48.2%) | $17,500 |
| 65+ Years | 19 (22.9%) | $19,583 |
| Total | 83 (100.0%) | $19,886 |
Poverty in Sheep Springs
Income Below Poverty by Sex and Age in Sheep Springs
With 45.6% poverty level for males and 40.2% for females among the residents of Sheep Springs, 35 to 44 year old males and 75 year old and over females are the most vulnerable to poverty, with 10 males (100.0%) and 4 females (100.0%) in their respective age groups living below the poverty level.
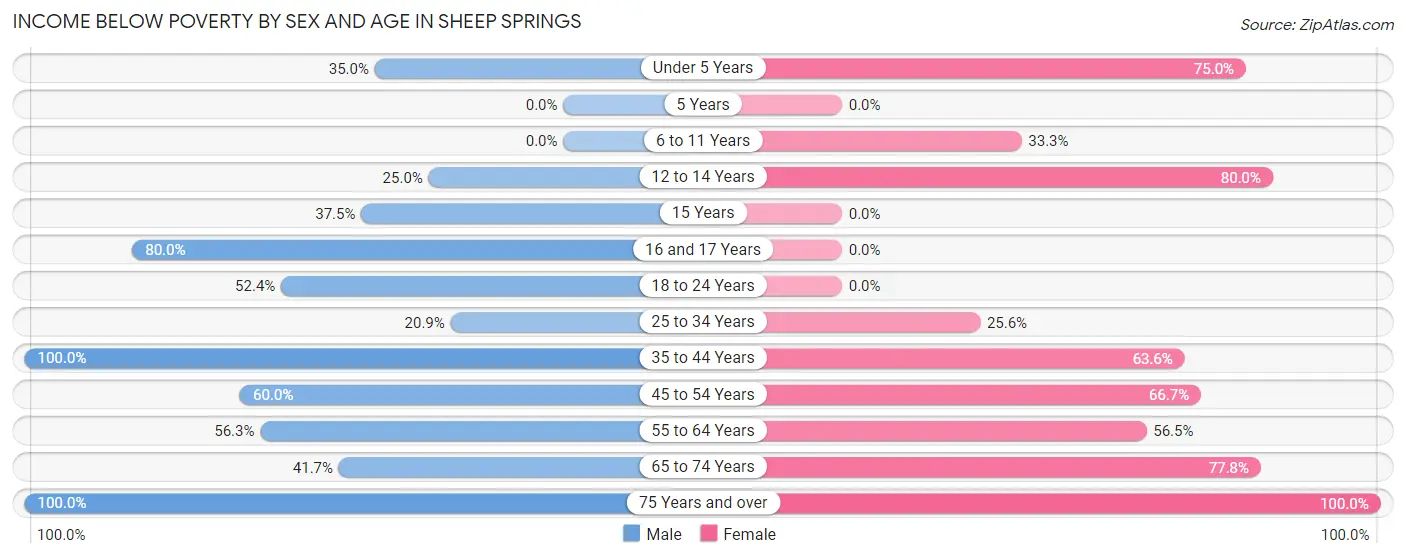
| Age Bracket | Male | Female |
| Under 5 Years | 7 (35.0%) | 6 (75.0%) |
| 5 Years | 0 (0.0%) | 0 (0.0%) |
| 6 to 11 Years | 0 (0.0%) | 11 (33.3%) |
| 12 to 14 Years | 3 (25.0%) | 4 (80.0%) |
| 15 Years | 3 (37.5%) | 0 (0.0%) |
| 16 and 17 Years | 4 (80.0%) | 0 (0.0%) |
| 18 to 24 Years | 11 (52.4%) | 0 (0.0%) |
| 25 to 34 Years | 9 (20.9%) | 10 (25.6%) |
| 35 to 44 Years | 10 (100.0%) | 7 (63.6%) |
| 45 to 54 Years | 15 (60.0%) | 6 (66.7%) |
| 55 to 64 Years | 18 (56.2%) | 13 (56.5%) |
| 65 to 74 Years | 5 (41.7%) | 7 (77.8%) |
| 75 Years and over | 2 (100.0%) | 4 (100.0%) |
| Total | 87 (45.6%) | 68 (40.2%) |
Income Above Poverty by Sex and Age in Sheep Springs
According to the poverty statistics in Sheep Springs, males aged 6 to 11 years and females aged 5 years are the age groups that are most secure financially, with 100.0% of males and 100.0% of females in these age groups living above the poverty line.
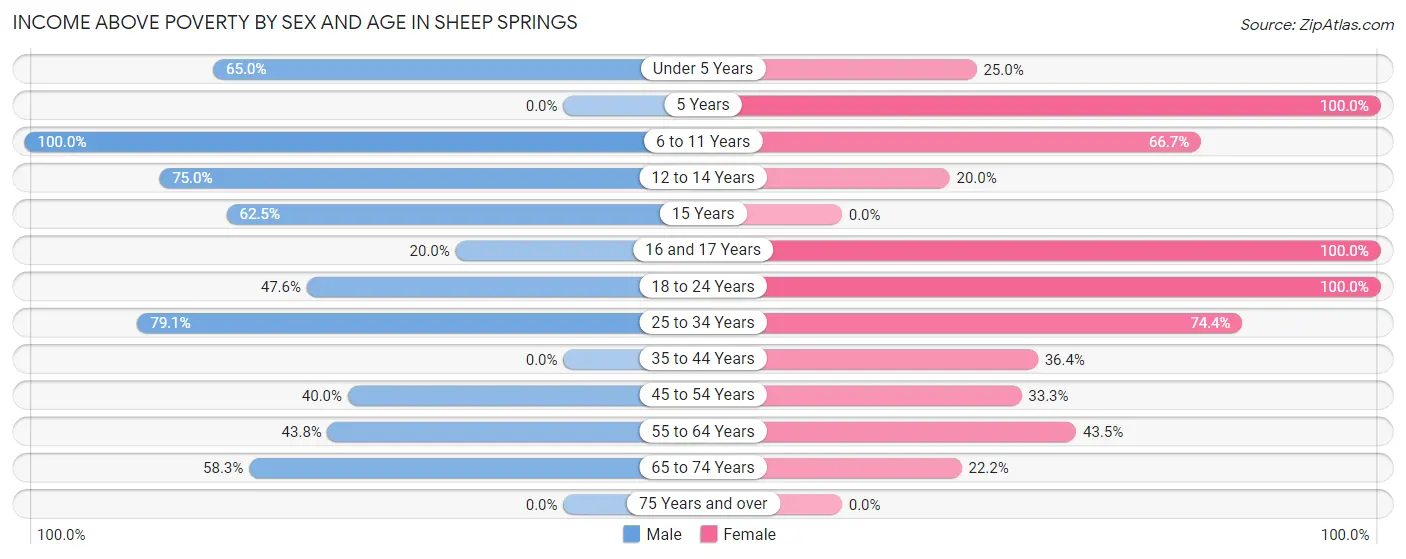
| Age Bracket | Male | Female |
| Under 5 Years | 13 (65.0%) | 2 (25.0%) |
| 5 Years | 0 (0.0%) | 2 (100.0%) |
| 6 to 11 Years | 1 (100.0%) | 22 (66.7%) |
| 12 to 14 Years | 9 (75.0%) | 1 (20.0%) |
| 15 Years | 5 (62.5%) | 0 (0.0%) |
| 16 and 17 Years | 1 (20.0%) | 3 (100.0%) |
| 18 to 24 Years | 10 (47.6%) | 23 (100.0%) |
| 25 to 34 Years | 34 (79.1%) | 29 (74.4%) |
| 35 to 44 Years | 0 (0.0%) | 4 (36.4%) |
| 45 to 54 Years | 10 (40.0%) | 3 (33.3%) |
| 55 to 64 Years | 14 (43.8%) | 10 (43.5%) |
| 65 to 74 Years | 7 (58.3%) | 2 (22.2%) |
| 75 Years and over | 0 (0.0%) | 0 (0.0%) |
| Total | 104 (54.4%) | 101 (59.8%) |
Income Below Poverty Among Married-Couple Families in Sheep Springs
The poverty statistics for married-couple families in Sheep Springs show that 69.0% or 20 of the total 29 families live below the poverty line. Families with 1 or 2 children have the highest poverty rate of 75.0%, comprising of 6 families. On the other hand, families with no children have the lowest poverty rate of 66.7%, which includes 14 families.
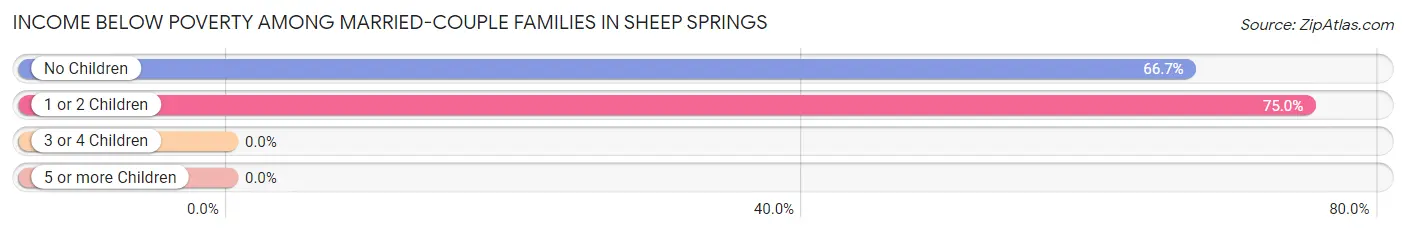
| Children | Above Poverty | Below Poverty |
| No Children | 7 (33.3%) | 14 (66.7%) |
| 1 or 2 Children | 2 (25.0%) | 6 (75.0%) |
| 3 or 4 Children | 0 (0.0%) | 0 (0.0%) |
| 5 or more Children | 0 (0.0%) | 0 (0.0%) |
| Total | 9 (31.0%) | 20 (69.0%) |
Income Below Poverty Among Single-Parent Households in Sheep Springs
According to the poverty data in Sheep Springs, 18.2% or 2 single-father households and 57.6% or 19 single-mother households are living below the poverty line. Among single-father households, those with no children have the highest poverty rate, with 2 households (22.2%) experiencing poverty. Likewise, among single-mother households, those with no children have the highest poverty rate, with 9 households (100.0%) falling below the poverty line.
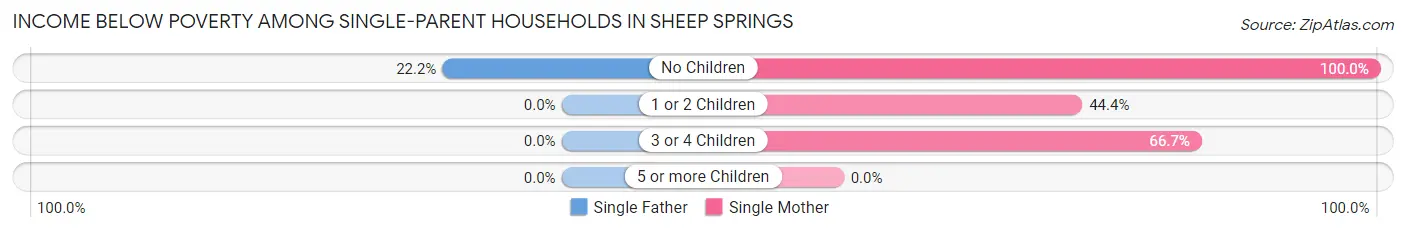
| Children | Single Father | Single Mother |
| No Children | 2 (22.2%) | 9 (100.0%) |
| 1 or 2 Children | 0 (0.0%) | 8 (44.4%) |
| 3 or 4 Children | 0 (0.0%) | 2 (66.7%) |
| 5 or more Children | 0 (0.0%) | 0 (0.0%) |
| Total | 2 (18.2%) | 19 (57.6%) |
Income Below Poverty Among Married-Couple vs Single-Parent Households in Sheep Springs
The poverty data for Sheep Springs shows that 20 of the married-couple family households (69.0%) and 21 of the single-parent households (47.7%) are living below the poverty level. Within the married-couple family households, those with 1 or 2 children have the highest poverty rate, with 6 households (75.0%) falling below the poverty line. Among the single-parent households, those with 3 or 4 children have the highest poverty rate, with 2 household (66.7%) living below poverty.
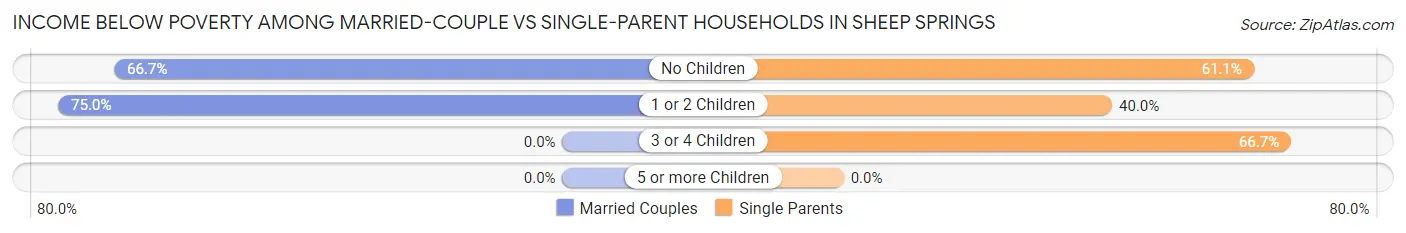
| Children | Married-Couple Families | Single-Parent Households |
| No Children | 14 (66.7%) | 11 (61.1%) |
| 1 or 2 Children | 6 (75.0%) | 8 (40.0%) |
| 3 or 4 Children | 0 (0.0%) | 2 (66.7%) |
| 5 or more Children | 0 (0.0%) | 0 (0.0%) |
| Total | 20 (69.0%) | 21 (47.7%) |
Race in Sheep Springs
The most populous races in Sheep Springs are Native / Alaskan (360 | 99.5%), Hispanic or Latino (2 | 0.5%), and Two or more Races (2 | 0.5%).
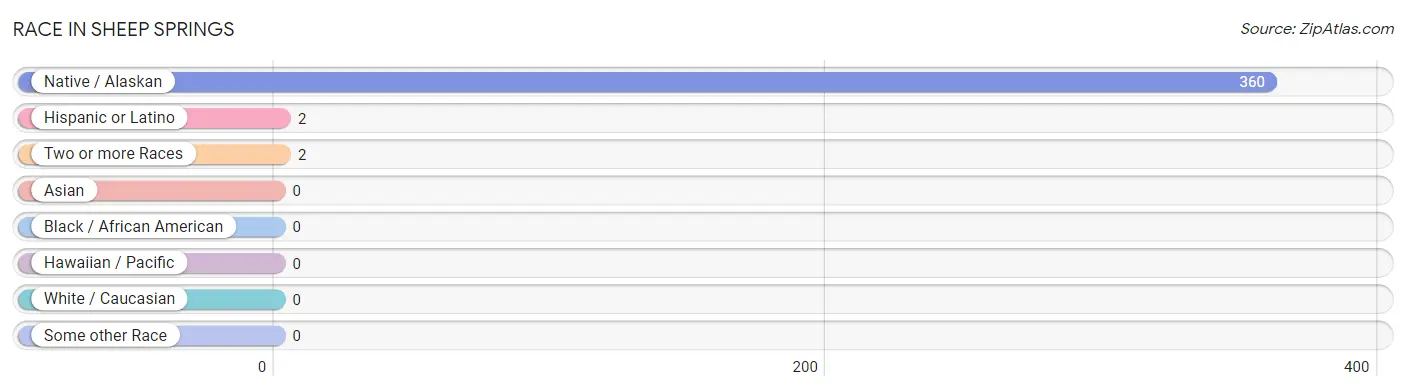
| Race | # Population | % Population |
| Asian | 0 | 0.0% |
| Black / African American | 0 | 0.0% |
| Hawaiian / Pacific | 0 | 0.0% |
| Hispanic or Latino | 2 | 0.5% |
| Native / Alaskan | 360 | 99.5% |
| White / Caucasian | 0 | 0.0% |
| Two or more Races | 2 | 0.5% |
| Some other Race | 0 | 0.0% |
| Total | 362 | 100.0% |
Ancestry in Sheep Springs
The most populous ancestries reported in Sheep Springs are Navajo (357 | 98.6%), Apache (5 | 1.4%), and Mexican (2 | 0.5%), together accounting for 100.6% of all Sheep Springs residents.
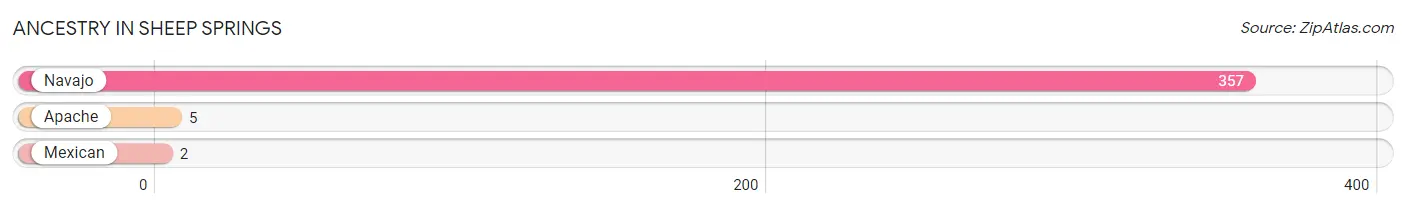
| Ancestry | # Population | % Population |
| Apache | 5 | 1.4% |
| Mexican | 2 | 0.5% |
| Navajo | 357 | 98.6% | View All 3 Rows |
Immigrants in Sheep Springs

| Immigration Origin | # Population | % Population | View All 0 Rows |
Sex and Age in Sheep Springs
Sex and Age in Sheep Springs
The most populous age groups in Sheep Springs are 30 to 34 Years (28 | 14.7%) for men and 10 to 14 Years (33 | 19.3%) for women.
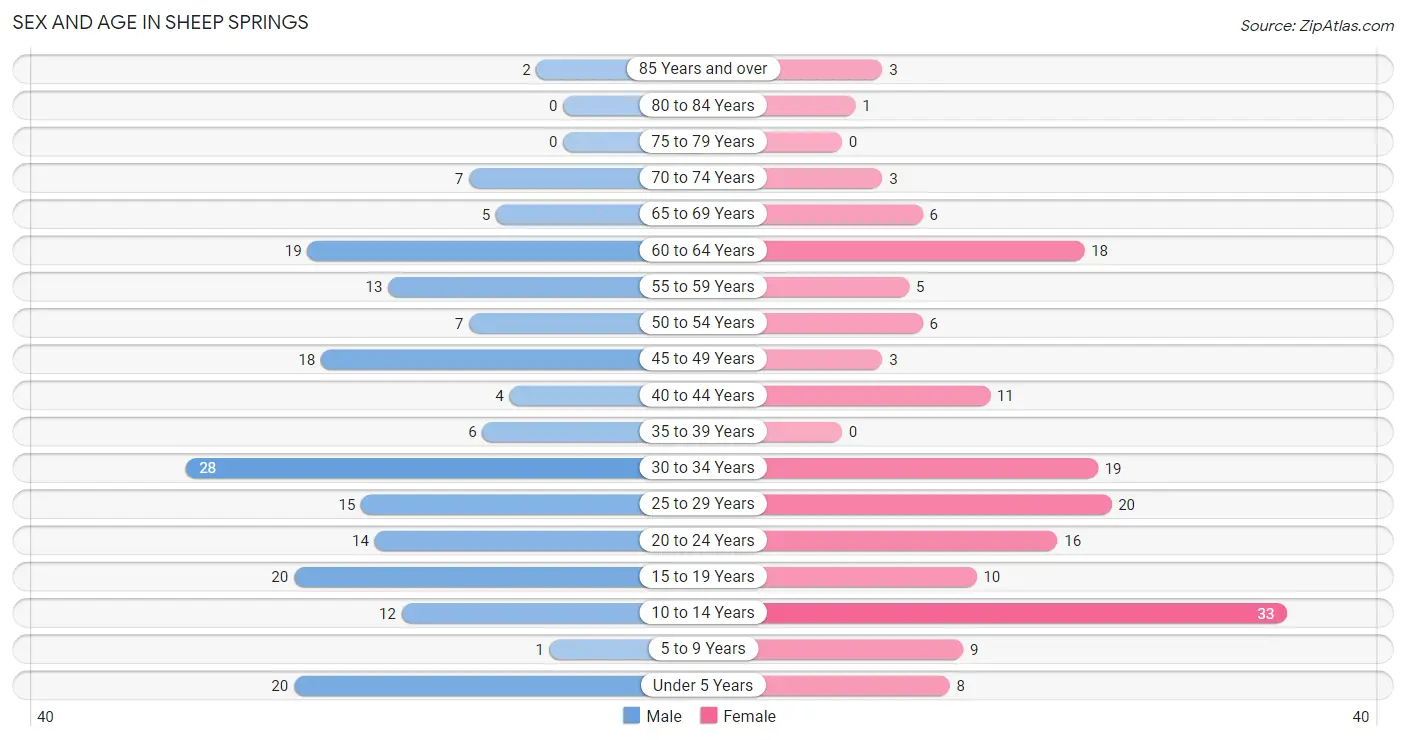
| Age Bracket | Male | Female |
| Under 5 Years | 20 (10.5%) | 8 (4.7%) |
| 5 to 9 Years | 1 (0.5%) | 9 (5.3%) |
| 10 to 14 Years | 12 (6.3%) | 33 (19.3%) |
| 15 to 19 Years | 20 (10.5%) | 10 (5.9%) |
| 20 to 24 Years | 14 (7.3%) | 16 (9.4%) |
| 25 to 29 Years | 15 (7.9%) | 20 (11.7%) |
| 30 to 34 Years | 28 (14.7%) | 19 (11.1%) |
| 35 to 39 Years | 6 (3.1%) | 0 (0.0%) |
| 40 to 44 Years | 4 (2.1%) | 11 (6.4%) |
| 45 to 49 Years | 18 (9.4%) | 3 (1.8%) |
| 50 to 54 Years | 7 (3.7%) | 6 (3.5%) |
| 55 to 59 Years | 13 (6.8%) | 5 (2.9%) |
| 60 to 64 Years | 19 (10.0%) | 18 (10.5%) |
| 65 to 69 Years | 5 (2.6%) | 6 (3.5%) |
| 70 to 74 Years | 7 (3.7%) | 3 (1.8%) |
| 75 to 79 Years | 0 (0.0%) | 0 (0.0%) |
| 80 to 84 Years | 0 (0.0%) | 1 (0.6%) |
| 85 Years and over | 2 (1.1%) | 3 (1.8%) |
| Total | 191 (100.0%) | 171 (100.0%) |
Families and Households in Sheep Springs
Median Family Size in Sheep Springs
The median family size in Sheep Springs is 4.64 persons per family, with single female/mother families (33 | 45.2%) accounting for the largest median family size of 5.82 persons per family. On the other hand, single male/father families (11 | 15.1%) represent the smallest median family size with 3.45 persons per family.
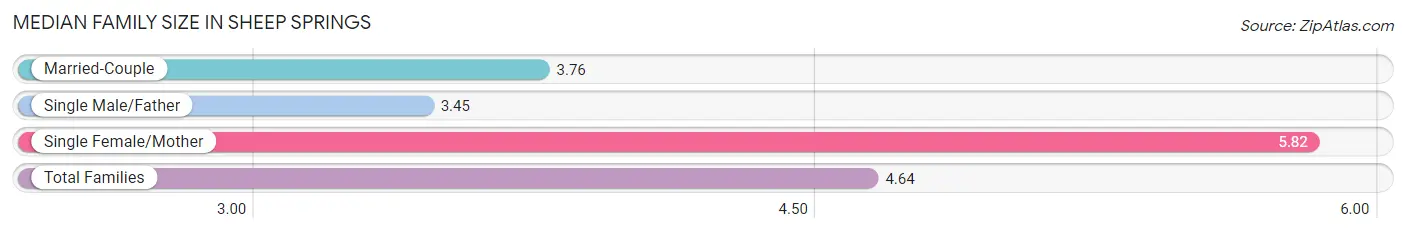
| Family Type | # Families | Family Size |
| Married-Couple | 29 (39.7%) | 3.76 |
| Single Male/Father | 11 (15.1%) | 3.45 |
| Single Female/Mother | 33 (45.2%) | 5.82 |
| Total Families | 73 (100.0%) | 4.64 |
Median Household Size in Sheep Springs
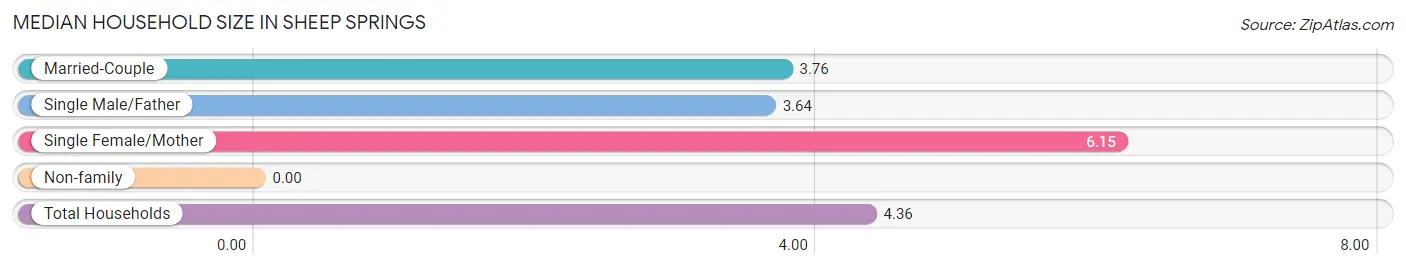
| Household Type | # Households | Household Size |
| Married-Couple | 29 (34.9%) | 3.76 |
| Single Male/Father | 11 (13.3%) | 3.64 |
| Single Female/Mother | 33 (39.8%) | 6.15 |
| Non-family | 10 (12.0%) | - |
| Total Households | 83 (100.0%) | 4.36 |
Household Size by Marriage Status in Sheep Springs
Out of a total of 83 households in Sheep Springs, 73 (87.9%) are family households, while 10 (12.0%) are nonfamily households. The most numerous type of family households are 3-person households, comprising 30, and the most common type of nonfamily households are 1-person households, comprising 10.
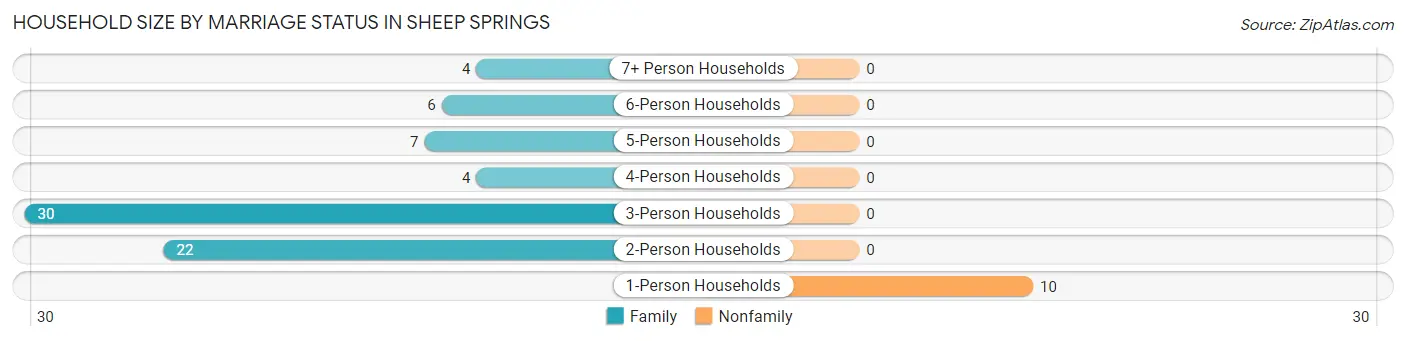
| Household Size | Family Households | Nonfamily Households |
| 1-Person Households | - | 10 (12.0%) |
| 2-Person Households | 22 (26.5%) | 0 (0.0%) |
| 3-Person Households | 30 (36.1%) | 0 (0.0%) |
| 4-Person Households | 4 (4.8%) | 0 (0.0%) |
| 5-Person Households | 7 (8.4%) | 0 (0.0%) |
| 6-Person Households | 6 (7.2%) | 0 (0.0%) |
| 7+ Person Households | 4 (4.8%) | 0 (0.0%) |
| Total | 73 (87.9%) | 10 (12.0%) |
Female Fertility in Sheep Springs
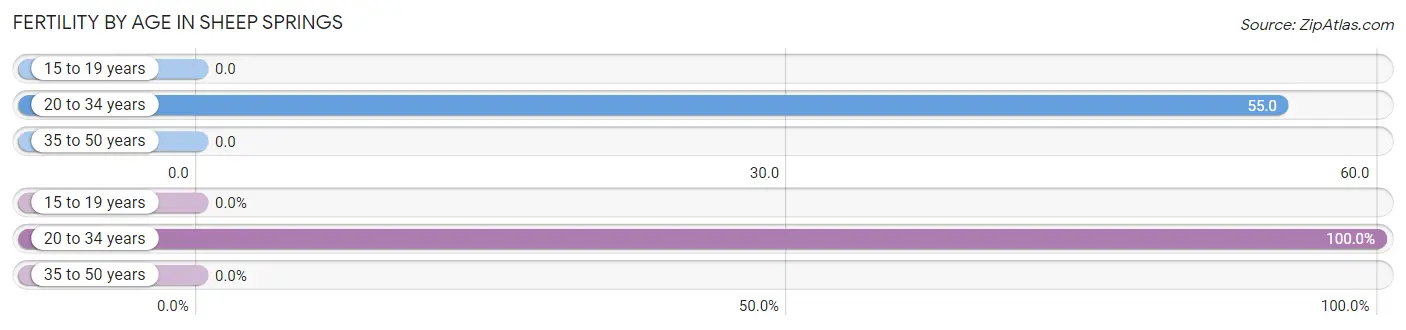
Fertility by Age in Sheep Springs
Average fertility rate in Sheep Springs is 37.0 births per 1,000 women. Women in the age bracket of 20 to 34 years have the highest fertility rate with 55.0 births per 1,000 women. Women in the age bracket of 20 to 34 years acount for 100.0% of all women with births.
| Age Bracket | Women with Births | Births / 1,000 Women |
| 15 to 19 years | 0 (0.0%) | 0.0 |
| 20 to 34 years | 3 (100.0%) | 55.0 |
| 35 to 50 years | 0 (0.0%) | 0.0 |
| Total | 3 (100.0%) | 37.0 |
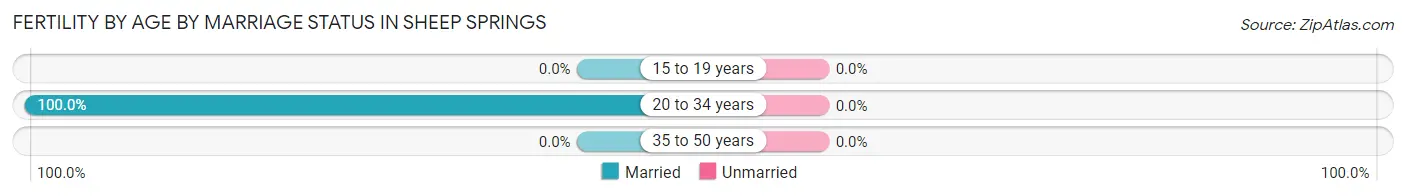
Fertility by Age by Marriage Status in Sheep Springs
| Age Bracket | Married | Unmarried |
| 15 to 19 years | 0 (0.0%) | 0 (0.0%) |
| 20 to 34 years | 3 (100.0%) | 0 (0.0%) |
| 35 to 50 years | 0 (0.0%) | 0 (0.0%) |
| Total | 3 (100.0%) | 0 (0.0%) |
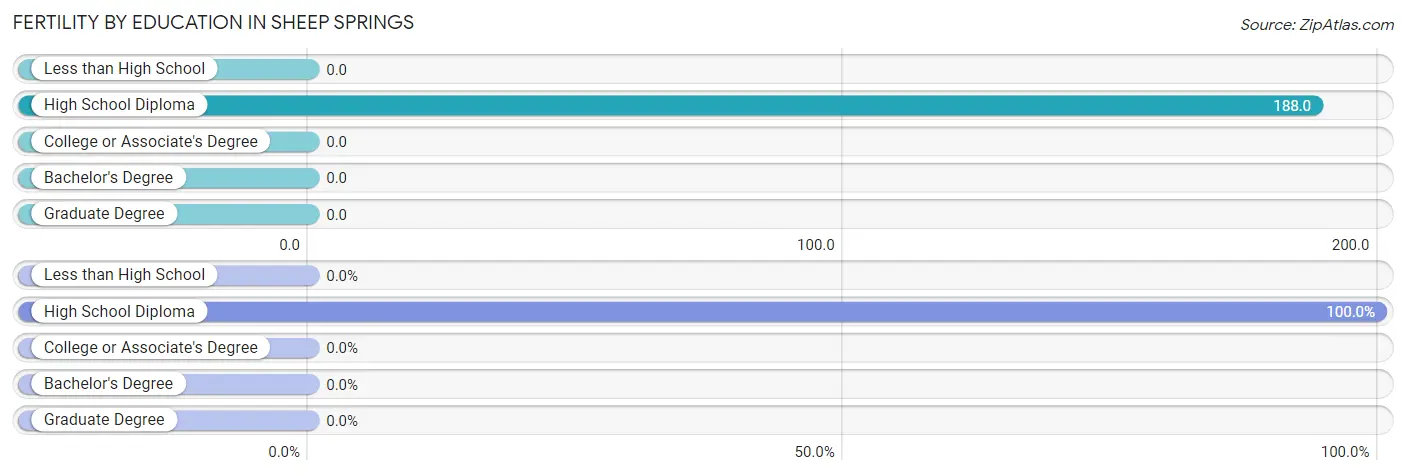
Fertility by Education in Sheep Springs
| Educational Attainment | Women with Births | Births / 1,000 Women |
| Less than High School | 0 (0.0%) | 0.0 |
| High School Diploma | 3 (100.0%) | 188.0 |
| College or Associate's Degree | 0 (0.0%) | 0.0 |
| Bachelor's Degree | 0 (0.0%) | 0.0 |
| Graduate Degree | 0 (0.0%) | 0.0 |
| Total | 3 (100.0%) | 37.0 |
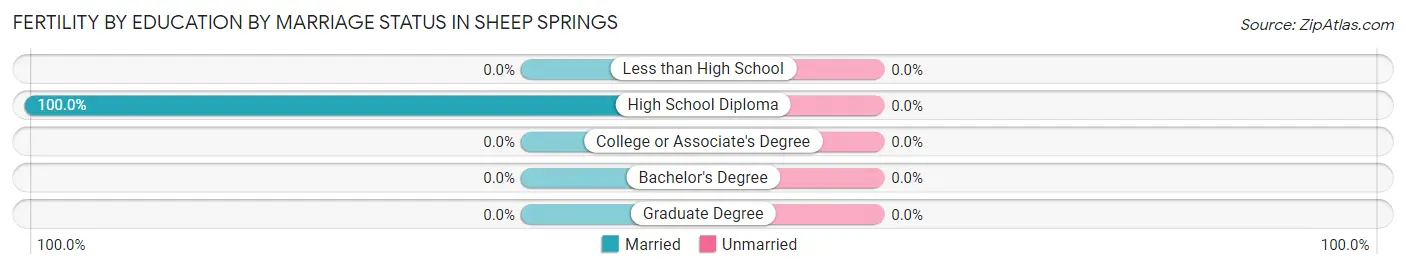
Fertility by Education by Marriage Status in Sheep Springs
| Educational Attainment | Married | Unmarried |
| Less than High School | 0 (0.0%) | 0 (0.0%) |
| High School Diploma | 3 (100.0%) | 0 (0.0%) |
| College or Associate's Degree | 0 (0.0%) | 0 (0.0%) |
| Bachelor's Degree | 0 (0.0%) | 0 (0.0%) |
| Graduate Degree | 0 (0.0%) | 0 (0.0%) |
| Total | 3 (100.0%) | 0 (0.0%) |
Employment Characteristics in Sheep Springs
Employment by Class of Employer in Sheep Springs
Among the 101 employed individuals in Sheep Springs, private company employees (49 | 48.5%), local government employees (25 | 24.7%), and state government employees (17 | 16.8%) make up the most common classes of employment.
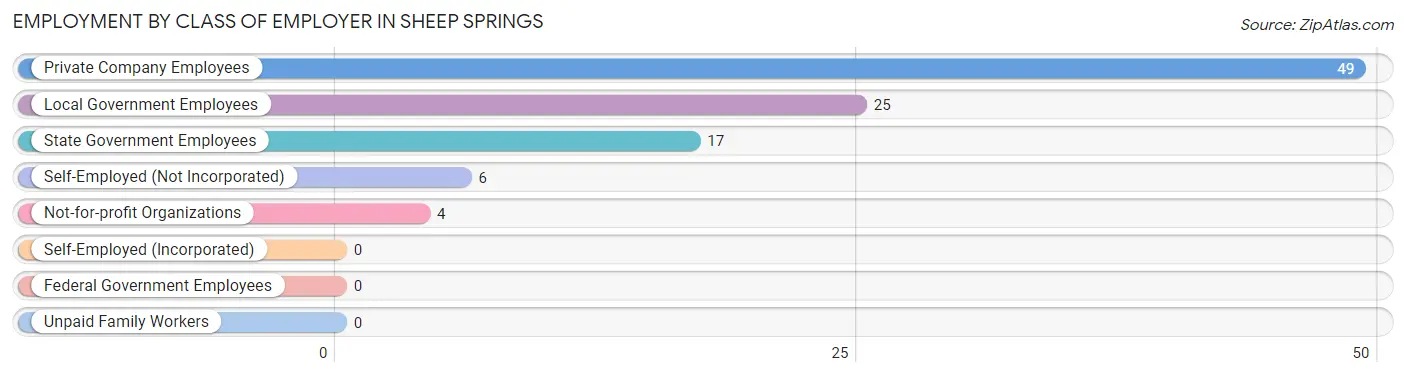
| Employer Class | # Employees | % Employees |
| Private Company Employees | 49 | 48.5% |
| Self-Employed (Incorporated) | 0 | 0.0% |
| Self-Employed (Not Incorporated) | 6 | 5.9% |
| Not-for-profit Organizations | 4 | 4.0% |
| Local Government Employees | 25 | 24.7% |
| State Government Employees | 17 | 16.8% |
| Federal Government Employees | 0 | 0.0% |
| Unpaid Family Workers | 0 | 0.0% |
| Total | 101 | 100.0% |
Employment Status by Age in Sheep Springs
According to the labor force statistics for Sheep Springs, out of the total population over 16 years of age (271), 45.8% or 124 individuals are in the labor force, with 18.5% or 23 of them unemployed. The age group with the highest labor force participation rate is 20 to 24 years, with 70.0% or 21 individuals in the labor force. Within the labor force, the 16 to 19 years age range has the highest percentage of unemployed individuals, with 100.0% or 2 of them being unemployed.
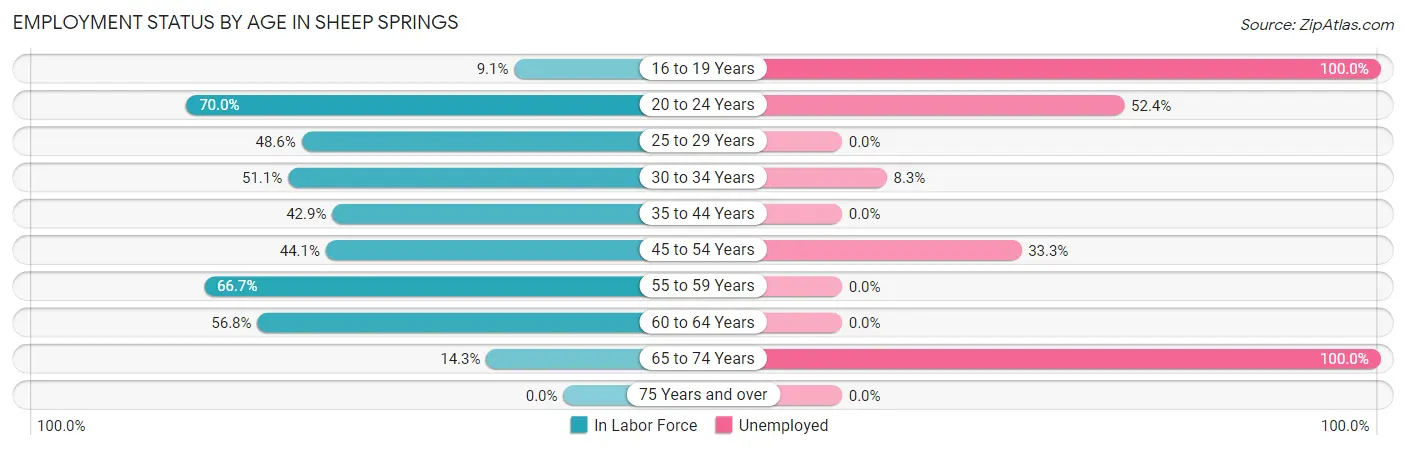
| Age Bracket | In Labor Force | Unemployed |
| 16 to 19 Years | 2 (9.1%) | 2 (100.0%) |
| 20 to 24 Years | 21 (70.0%) | 11 (52.4%) |
| 25 to 29 Years | 17 (48.6%) | 0 (0.0%) |
| 30 to 34 Years | 24 (51.1%) | 2 (8.3%) |
| 35 to 44 Years | 9 (42.9%) | 0 (0.0%) |
| 45 to 54 Years | 15 (44.1%) | 5 (33.3%) |
| 55 to 59 Years | 12 (66.7%) | 0 (0.0%) |
| 60 to 64 Years | 21 (56.8%) | 0 (0.0%) |
| 65 to 74 Years | 3 (14.3%) | 3 (100.0%) |
| 75 Years and over | 0 (0.0%) | 0 (0.0%) |
| Total | 124 (45.8%) | 23 (18.5%) |
Employment Status by Educational Attainment in Sheep Springs
According to labor force statistics for Sheep Springs, 51.0% of individuals (98) out of the total population between 25 and 64 years of age (192) are in the labor force, with 7.1% or 7 of them being unemployed. The group with the highest labor force participation rate are those with the educational attainment of bachelor's degree or higher, with 75.0% or 6 individuals in the labor force. Within the labor force, individuals with high school diploma education have the highest percentage of unemployment, with 15.6% or 5 of them being unemployed.
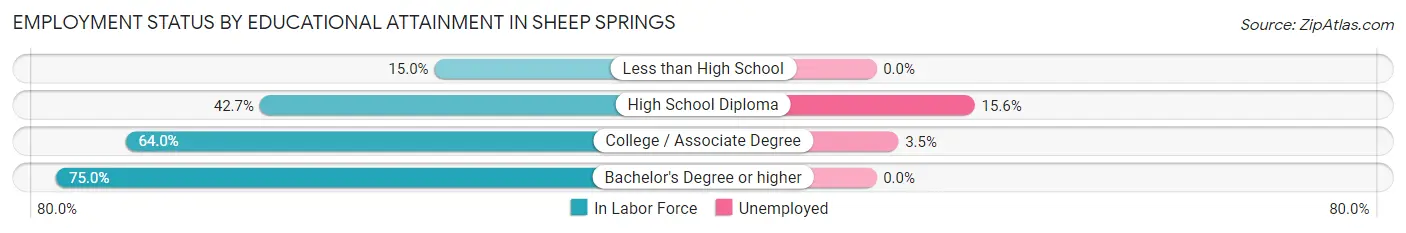
| Educational Attainment | In Labor Force | Unemployed |
| Less than High School | 3 (15.0%) | 0 (0.0%) |
| High School Diploma | 32 (42.7%) | 12 (15.6%) |
| College / Associate Degree | 57 (64.0%) | 3 (3.5%) |
| Bachelor's Degree or higher | 6 (75.0%) | 0 (0.0%) |
| Total | 98 (51.0%) | 14 (7.1%) |
Employment Occupations by Sex in Sheep Springs
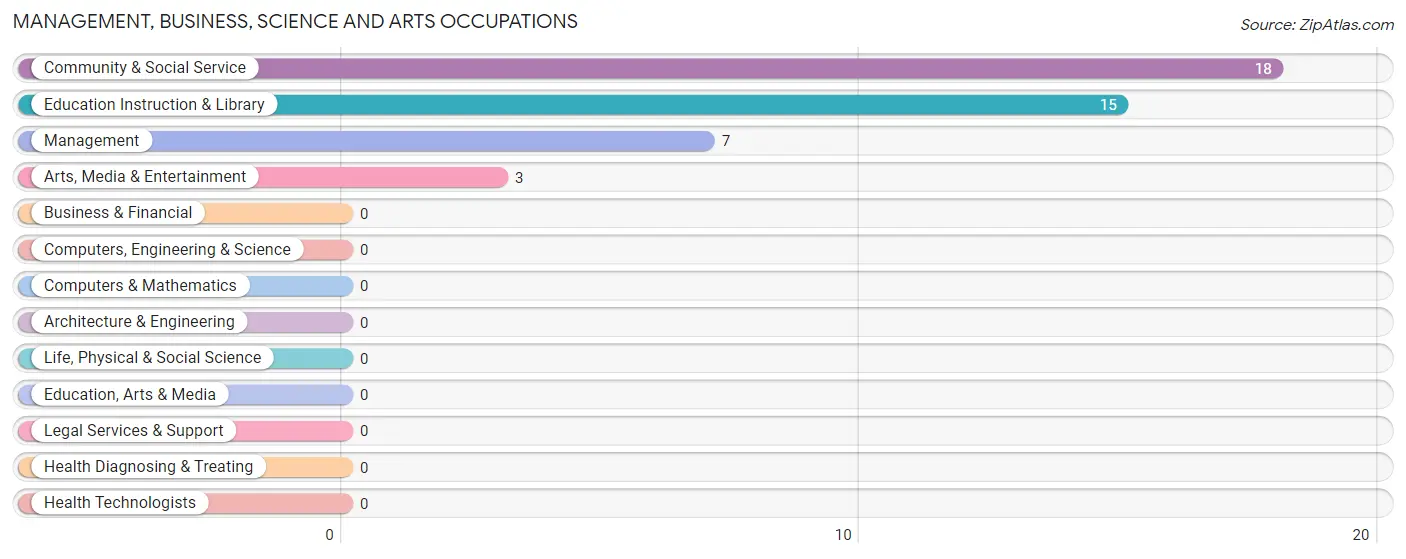
Management, Business, Science and Arts Occupations
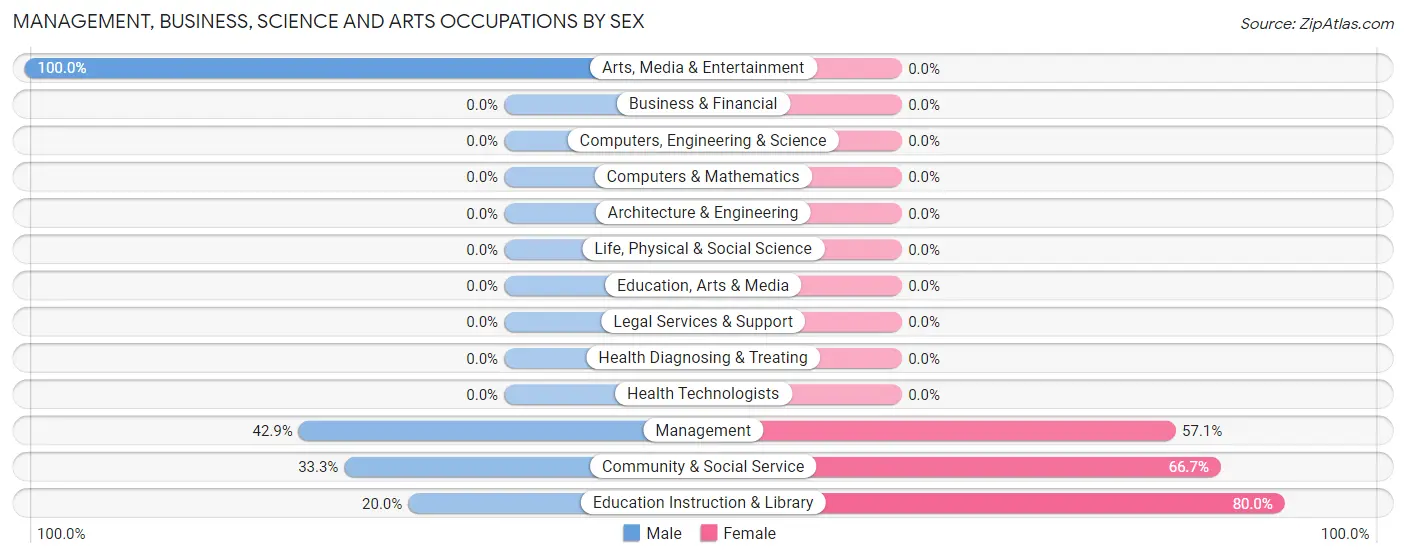
The most common Management, Business, Science and Arts occupations in Sheep Springs are Community & Social Service (18 | 17.8%), Education Instruction & Library (15 | 14.8%), Management (7 | 6.9%), and Arts, Media & Entertainment (3 | 3.0%).
Management, Business, Science and Arts Occupations by Sex
Within the Management, Business, Science and Arts occupations in Sheep Springs, the most male-oriented occupations are Arts, Media & Entertainment (100.0%), Management (42.9%), and Community & Social Service (33.3%), while the most female-oriented occupations are Education Instruction & Library (80.0%), Community & Social Service (66.7%), and Management (57.1%).
| Occupation | Male | Female |
| Management | 3 (42.9%) | 4 (57.1%) |
| Business & Financial | 0 (0.0%) | 0 (0.0%) |
| Computers, Engineering & Science | 0 (0.0%) | 0 (0.0%) |
| Computers & Mathematics | 0 (0.0%) | 0 (0.0%) |
| Architecture & Engineering | 0 (0.0%) | 0 (0.0%) |
| Life, Physical & Social Science | 0 (0.0%) | 0 (0.0%) |
| Community & Social Service | 6 (33.3%) | 12 (66.7%) |
| Education, Arts & Media | 0 (0.0%) | 0 (0.0%) |
| Legal Services & Support | 0 (0.0%) | 0 (0.0%) |
| Education Instruction & Library | 3 (20.0%) | 12 (80.0%) |
| Arts, Media & Entertainment | 3 (100.0%) | 0 (0.0%) |
| Health Diagnosing & Treating | 0 (0.0%) | 0 (0.0%) |
| Health Technologists | 0 (0.0%) | 0 (0.0%) |
| Total (Category) | 9 (36.0%) | 16 (64.0%) |
| Total (Overall) | 47 (46.5%) | 54 (53.5%) |
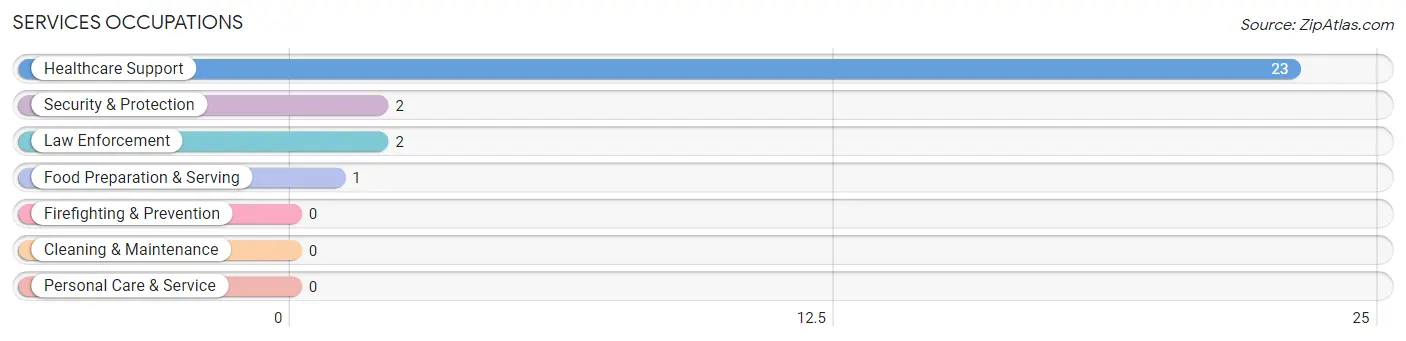
Services Occupations
The most common Services occupations in Sheep Springs are Healthcare Support (23 | 22.8%), Security & Protection (2 | 2.0%), Law Enforcement (2 | 2.0%), and Food Preparation & Serving (1 | 1.0%).
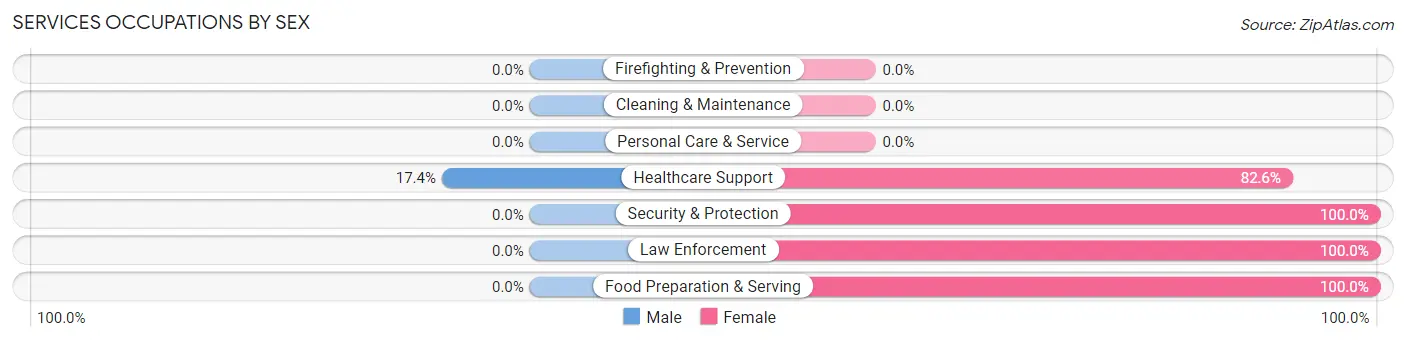
Services Occupations by Sex
| Occupation | Male | Female |
| Healthcare Support | 4 (17.4%) | 19 (82.6%) |
| Security & Protection | 0 (0.0%) | 2 (100.0%) |
| Firefighting & Prevention | 0 (0.0%) | 0 (0.0%) |
| Law Enforcement | 0 (0.0%) | 2 (100.0%) |
| Food Preparation & Serving | 0 (0.0%) | 1 (100.0%) |
| Cleaning & Maintenance | 0 (0.0%) | 0 (0.0%) |
| Personal Care & Service | 0 (0.0%) | 0 (0.0%) |
| Total (Category) | 4 (15.4%) | 22 (84.6%) |
| Total (Overall) | 47 (46.5%) | 54 (53.5%) |
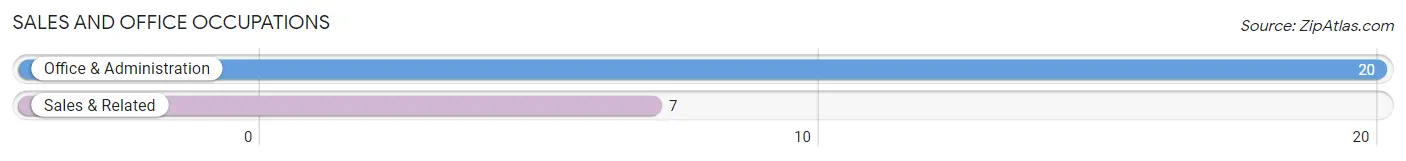
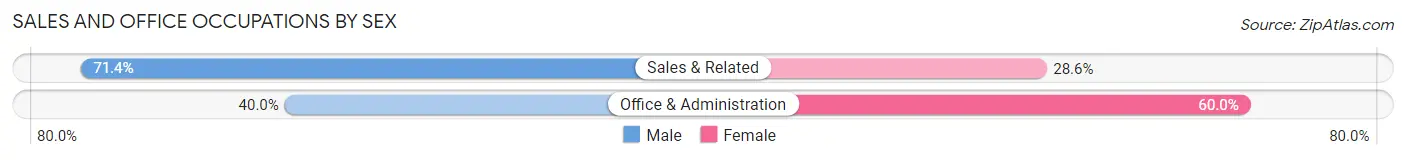
Sales and Office Occupations
The most common Sales and Office occupations in Sheep Springs are Office & Administration (20 | 19.8%), and Sales & Related (7 | 6.9%).
Sales and Office Occupations by Sex
| Occupation | Male | Female |
| Sales & Related | 5 (71.4%) | 2 (28.6%) |
| Office & Administration | 8 (40.0%) | 12 (60.0%) |
| Total (Category) | 13 (48.1%) | 14 (51.8%) |
| Total (Overall) | 47 (46.5%) | 54 (53.5%) |
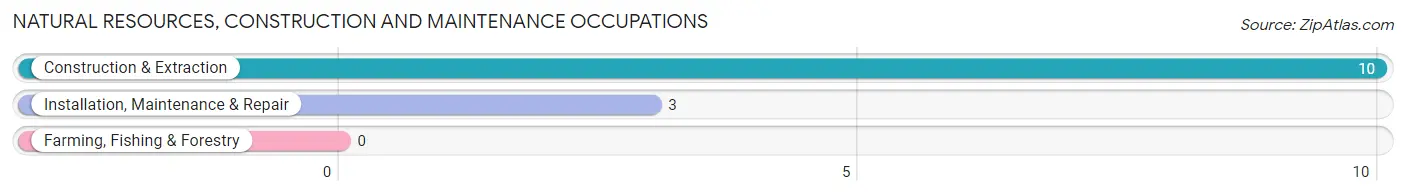
Natural Resources, Construction and Maintenance Occupations
The most common Natural Resources, Construction and Maintenance occupations in Sheep Springs are Construction & Extraction (10 | 9.9%), and Installation, Maintenance & Repair (3 | 3.0%).
Natural Resources, Construction and Maintenance Occupations by Sex
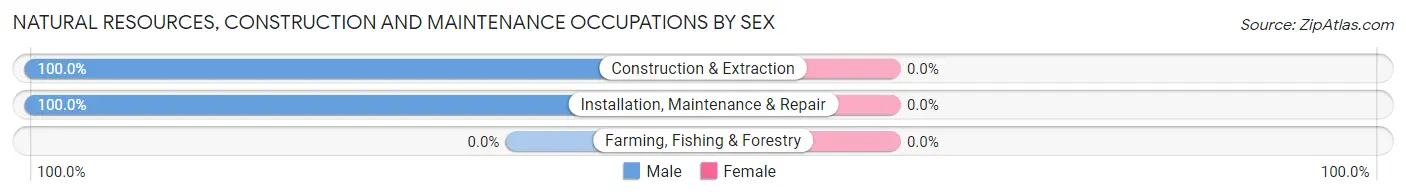
| Occupation | Male | Female |
| Farming, Fishing & Forestry | 0 (0.0%) | 0 (0.0%) |
| Construction & Extraction | 10 (100.0%) | 0 (0.0%) |
| Installation, Maintenance & Repair | 3 (100.0%) | 0 (0.0%) |
| Total (Category) | 13 (100.0%) | 0 (0.0%) |
| Total (Overall) | 47 (46.5%) | 54 (53.5%) |
Production, Transportation and Moving Occupations
The most common Production, Transportation and Moving occupations in Sheep Springs are Production (8 | 7.9%), and Material Moving (2 | 2.0%).
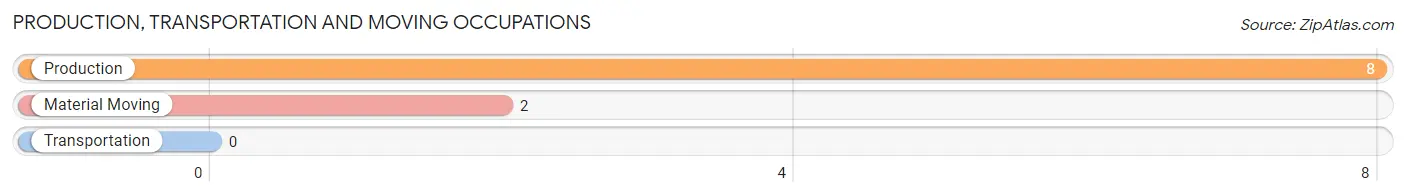
Production, Transportation and Moving Occupations by Sex
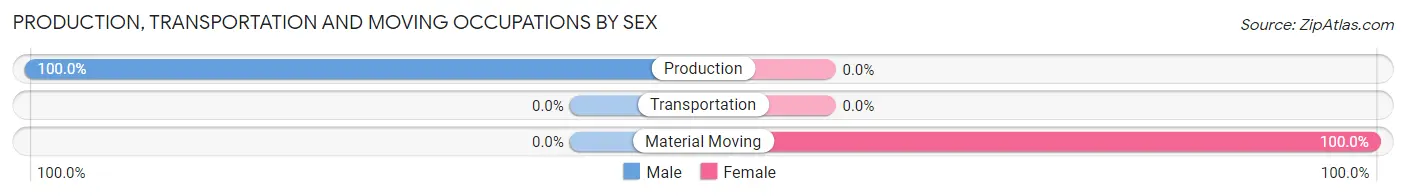
| Occupation | Male | Female |
| Production | 8 (100.0%) | 0 (0.0%) |
| Transportation | 0 (0.0%) | 0 (0.0%) |
| Material Moving | 0 (0.0%) | 2 (100.0%) |
| Total (Category) | 8 (80.0%) | 2 (20.0%) |
| Total (Overall) | 47 (46.5%) | 54 (53.5%) |
Employment Industries by Sex in Sheep Springs
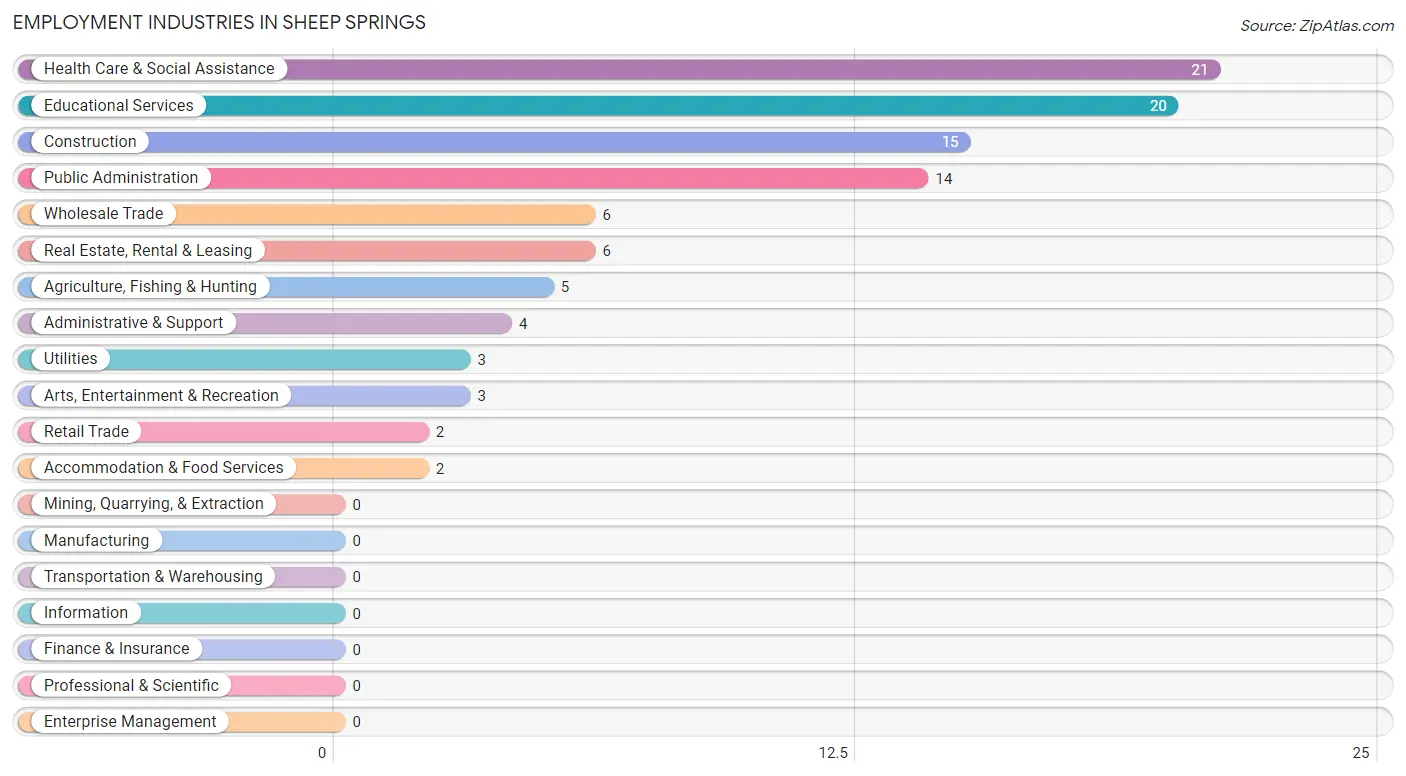
Employment Industries in Sheep Springs
The major employment industries in Sheep Springs include Health Care & Social Assistance (21 | 20.8%), Educational Services (20 | 19.8%), Construction (15 | 14.8%), Public Administration (14 | 13.9%), and Wholesale Trade (6 | 5.9%).
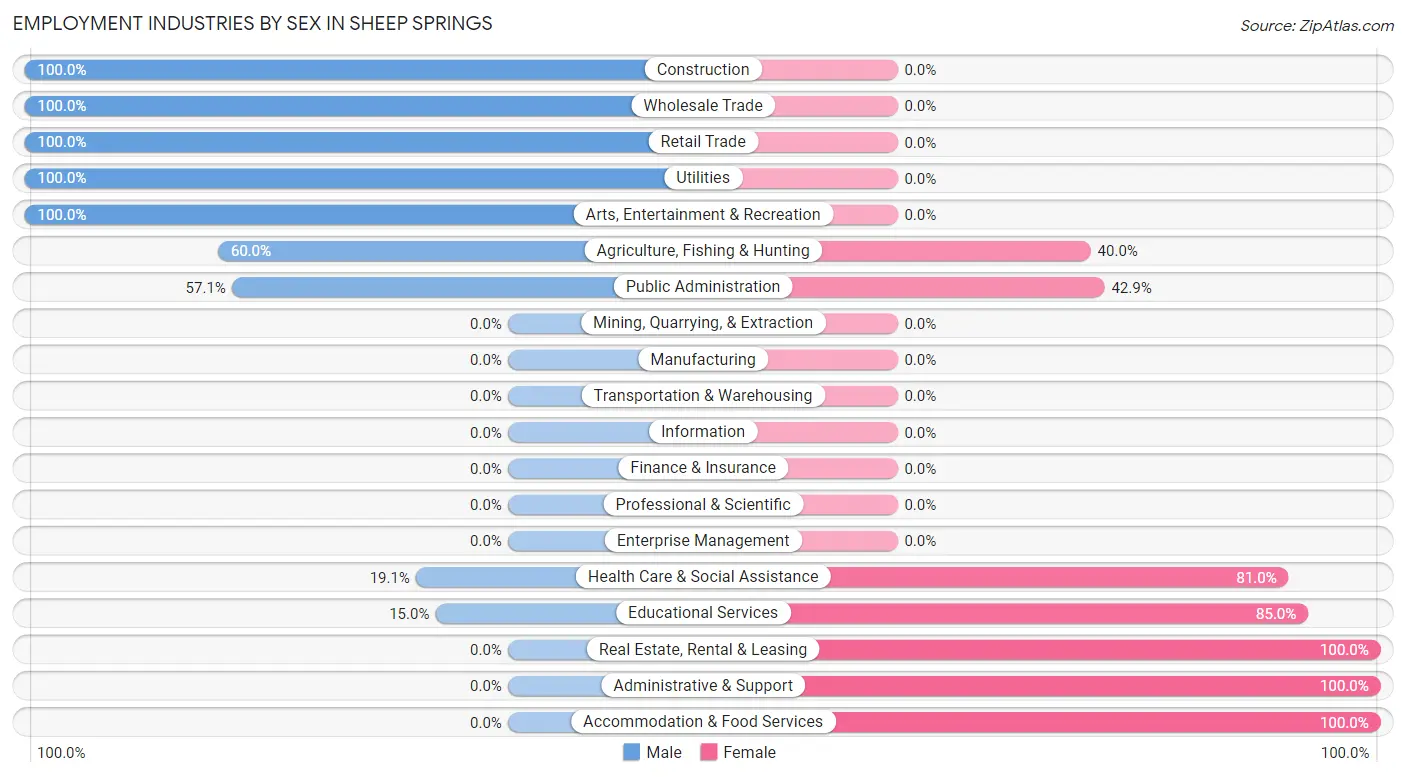
Employment Industries by Sex in Sheep Springs
The Sheep Springs industries that see more men than women are Construction (100.0%), Wholesale Trade (100.0%), and Retail Trade (100.0%), whereas the industries that tend to have a higher number of women are Real Estate, Rental & Leasing (100.0%), Administrative & Support (100.0%), and Accommodation & Food Services (100.0%).
| Industry | Male | Female |
| Agriculture, Fishing & Hunting | 3 (60.0%) | 2 (40.0%) |
| Mining, Quarrying, & Extraction | 0 (0.0%) | 0 (0.0%) |
| Construction | 15 (100.0%) | 0 (0.0%) |
| Manufacturing | 0 (0.0%) | 0 (0.0%) |
| Wholesale Trade | 6 (100.0%) | 0 (0.0%) |
| Retail Trade | 2 (100.0%) | 0 (0.0%) |
| Transportation & Warehousing | 0 (0.0%) | 0 (0.0%) |
| Utilities | 3 (100.0%) | 0 (0.0%) |
| Information | 0 (0.0%) | 0 (0.0%) |
| Finance & Insurance | 0 (0.0%) | 0 (0.0%) |
| Real Estate, Rental & Leasing | 0 (0.0%) | 6 (100.0%) |
| Professional & Scientific | 0 (0.0%) | 0 (0.0%) |
| Enterprise Management | 0 (0.0%) | 0 (0.0%) |
| Administrative & Support | 0 (0.0%) | 4 (100.0%) |
| Educational Services | 3 (15.0%) | 17 (85.0%) |
| Health Care & Social Assistance | 4 (19.1%) | 17 (80.9%) |
| Arts, Entertainment & Recreation | 3 (100.0%) | 0 (0.0%) |
| Accommodation & Food Services | 0 (0.0%) | 2 (100.0%) |
| Public Administration | 8 (57.1%) | 6 (42.9%) |
| Total | 47 (46.5%) | 54 (53.5%) |
Education in Sheep Springs
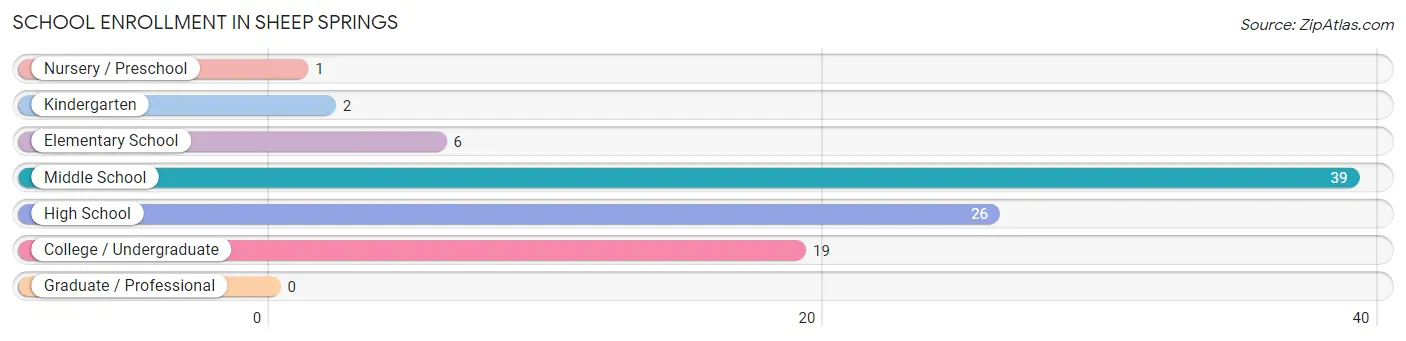
School Enrollment in Sheep Springs
The most common levels of schooling among the 93 students in Sheep Springs are middle school (39 | 41.9%), high school (26 | 28.0%), and college / undergraduate (19 | 20.4%).
| School Level | # Students | % Students |
| Nursery / Preschool | 1 | 1.1% |
| Kindergarten | 2 | 2.1% |
| Elementary School | 6 | 6.5% |
| Middle School | 39 | 41.9% |
| High School | 26 | 28.0% |
| College / Undergraduate | 19 | 20.4% |
| Graduate / Professional | 0 | 0.0% |
| Total | 93 | 100.0% |
School Enrollment by Age by Funding Source in Sheep Springs
Out of a total of 93 students who are enrolled in schools in Sheep Springs, 16 (17.2%) attend a private institution, while the remaining 77 (82.8%) are enrolled in public schools. The age group of 20 to 24 year olds has the highest likelihood of being enrolled in private schools, with 13 (76.5% in the age bracket) enrolled. Conversely, the age group of 3 to 4 year olds has the lowest likelihood of being enrolled in a private school, with 1 (100.0% in the age bracket) attending a public institution.
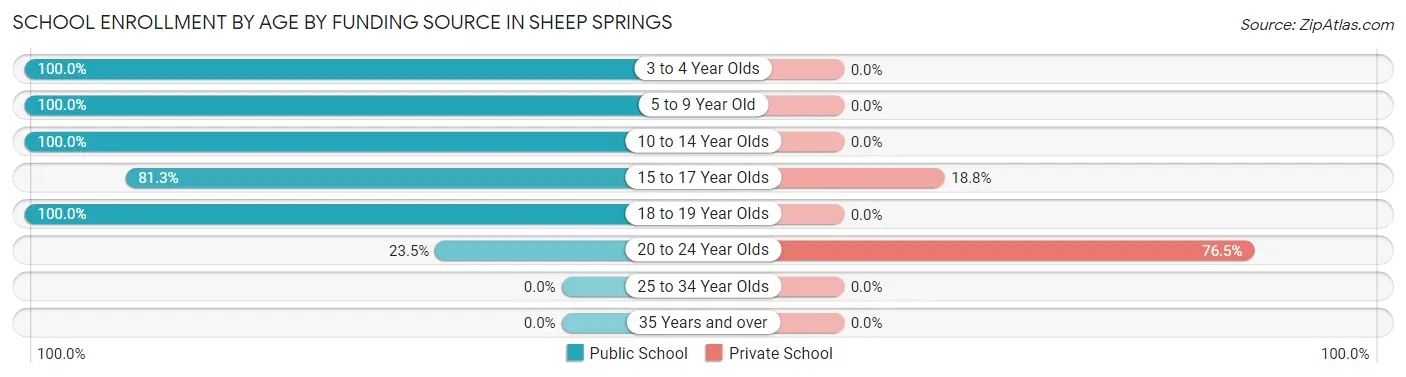
| Age Bracket | Public School | Private School |
| 3 to 4 Year Olds | 1 (100.0%) | 0 (0.0%) |
| 5 to 9 Year Old | 8 (100.0%) | 0 (0.0%) |
| 10 to 14 Year Olds | 45 (100.0%) | 0 (0.0%) |
| 15 to 17 Year Olds | 13 (81.2%) | 3 (18.8%) |
| 18 to 19 Year Olds | 6 (100.0%) | 0 (0.0%) |
| 20 to 24 Year Olds | 4 (23.5%) | 13 (76.5%) |
| 25 to 34 Year Olds | 0 (0.0%) | 0 (0.0%) |
| 35 Years and over | 0 (0.0%) | 0 (0.0%) |
| Total | 77 (82.8%) | 16 (17.2%) |
Educational Attainment by Field of Study in Sheep Springs
Social sciences (4 | 28.6%), business (4 | 28.6%), education (2 | 14.3%), literature & languages (2 | 14.3%), and arts & humanities (2 | 14.3%) are the most common fields of study among 14 individuals in Sheep Springs who have obtained a bachelor's degree or higher.
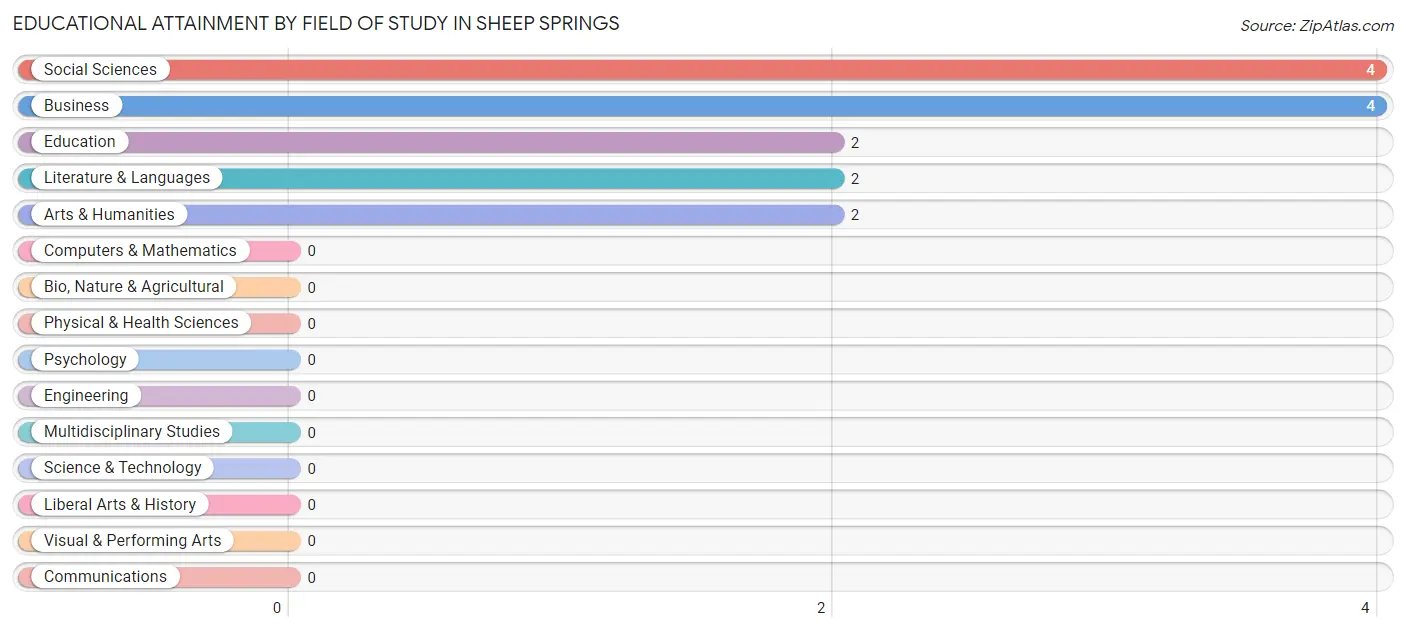
| Field of Study | # Graduates | % Graduates |
| Computers & Mathematics | 0 | 0.0% |
| Bio, Nature & Agricultural | 0 | 0.0% |
| Physical & Health Sciences | 0 | 0.0% |
| Psychology | 0 | 0.0% |
| Social Sciences | 4 | 28.6% |
| Engineering | 0 | 0.0% |
| Multidisciplinary Studies | 0 | 0.0% |
| Science & Technology | 0 | 0.0% |
| Business | 4 | 28.6% |
| Education | 2 | 14.3% |
| Literature & Languages | 2 | 14.3% |
| Liberal Arts & History | 0 | 0.0% |
| Visual & Performing Arts | 0 | 0.0% |
| Communications | 0 | 0.0% |
| Arts & Humanities | 2 | 14.3% |
| Total | 14 | 100.0% |
Transportation & Commute in Sheep Springs
Vehicle Availability by Sex in Sheep Springs
The most prevalent vehicle ownership categories in Sheep Springs are males with 1 vehicle (18, accounting for 38.3%) and females with 1 vehicle (18, making up 33.3%).
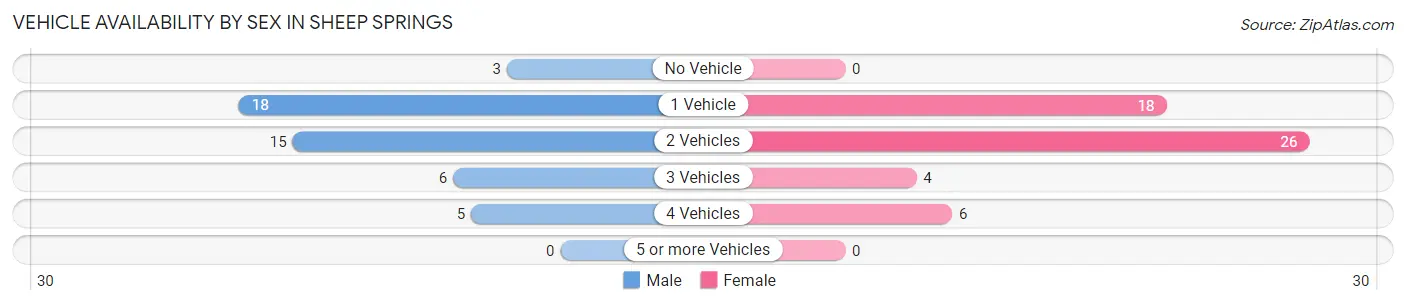
| Vehicles Available | Male | Female |
| No Vehicle | 3 (6.4%) | 0 (0.0%) |
| 1 Vehicle | 18 (38.3%) | 18 (33.3%) |
| 2 Vehicles | 15 (31.9%) | 26 (48.1%) |
| 3 Vehicles | 6 (12.8%) | 4 (7.4%) |
| 4 Vehicles | 5 (10.6%) | 6 (11.1%) |
| 5 or more Vehicles | 0 (0.0%) | 0 (0.0%) |
| Total | 47 (100.0%) | 54 (100.0%) |
Commute Time in Sheep Springs
The most frequently occuring commute durations in Sheep Springs are 60 to 89 minutes (30 commuters, 30.3%), 45 to 59 minutes (21 commuters, 21.2%), and 40 to 44 minutes (13 commuters, 13.1%).
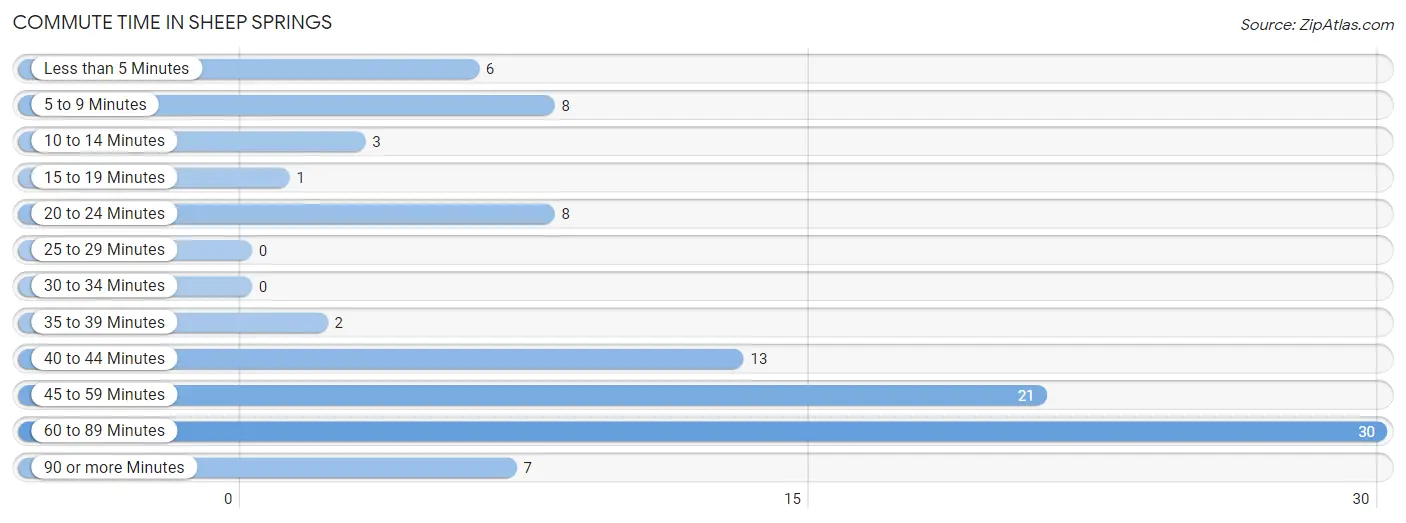
| Commute Time | # Commuters | % Commuters |
| Less than 5 Minutes | 6 | 6.1% |
| 5 to 9 Minutes | 8 | 8.1% |
| 10 to 14 Minutes | 3 | 3.0% |
| 15 to 19 Minutes | 1 | 1.0% |
| 20 to 24 Minutes | 8 | 8.1% |
| 25 to 29 Minutes | 0 | 0.0% |
| 30 to 34 Minutes | 0 | 0.0% |
| 35 to 39 Minutes | 2 | 2.0% |
| 40 to 44 Minutes | 13 | 13.1% |
| 45 to 59 Minutes | 21 | 21.2% |
| 60 to 89 Minutes | 30 | 30.3% |
| 90 or more Minutes | 7 | 7.1% |
Commute Time by Sex in Sheep Springs
The most common commute times in Sheep Springs are 45 to 59 minutes (14 commuters, 31.1%) for males and 60 to 89 minutes (16 commuters, 29.6%) for females.
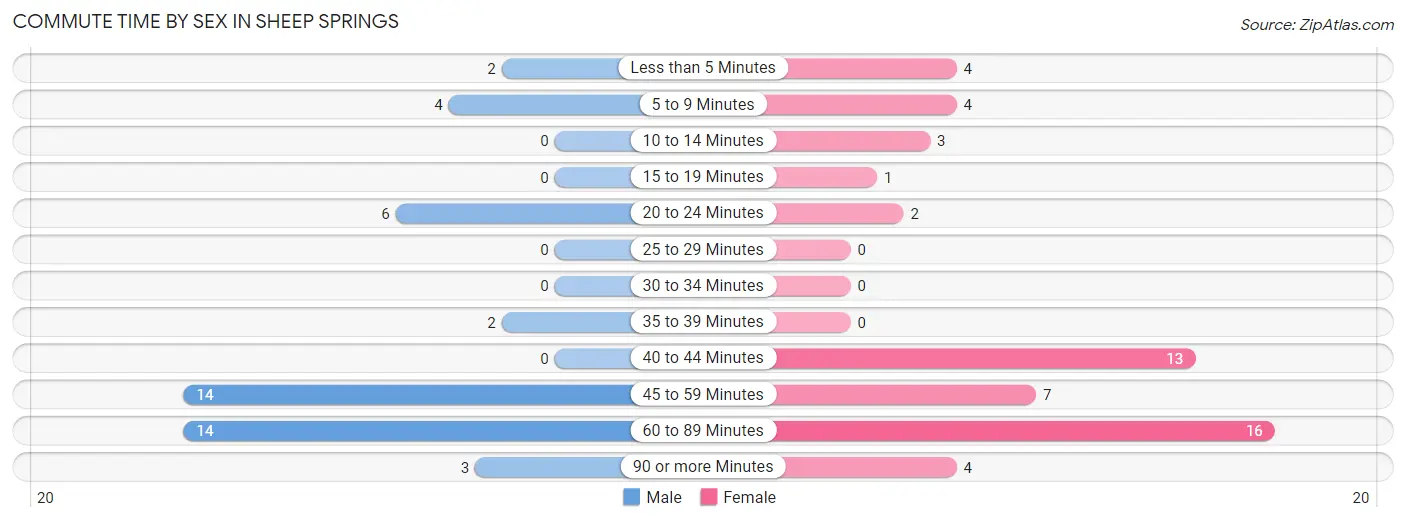
| Commute Time | Male | Female |
| Less than 5 Minutes | 2 (4.4%) | 4 (7.4%) |
| 5 to 9 Minutes | 4 (8.9%) | 4 (7.4%) |
| 10 to 14 Minutes | 0 (0.0%) | 3 (5.6%) |
| 15 to 19 Minutes | 0 (0.0%) | 1 (1.8%) |
| 20 to 24 Minutes | 6 (13.3%) | 2 (3.7%) |
| 25 to 29 Minutes | 0 (0.0%) | 0 (0.0%) |
| 30 to 34 Minutes | 0 (0.0%) | 0 (0.0%) |
| 35 to 39 Minutes | 2 (4.4%) | 0 (0.0%) |
| 40 to 44 Minutes | 0 (0.0%) | 13 (24.1%) |
| 45 to 59 Minutes | 14 (31.1%) | 7 (13.0%) |
| 60 to 89 Minutes | 14 (31.1%) | 16 (29.6%) |
| 90 or more Minutes | 3 (6.7%) | 4 (7.4%) |
Time of Departure to Work by Sex in Sheep Springs
The most frequent times of departure to work in Sheep Springs are 7:00 AM to 7:29 AM (12, 26.7%) for males and 7:00 AM to 7:29 AM (25, 46.3%) for females.
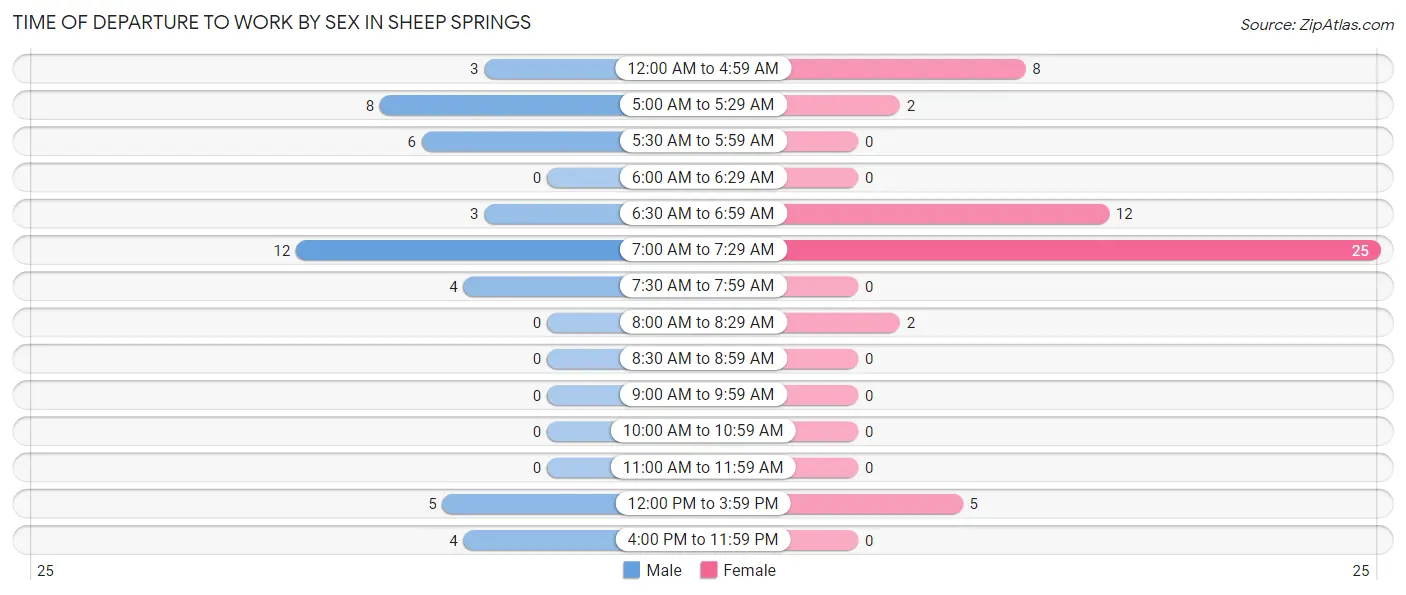
| Time of Departure | Male | Female |
| 12:00 AM to 4:59 AM | 3 (6.7%) | 8 (14.8%) |
| 5:00 AM to 5:29 AM | 8 (17.8%) | 2 (3.7%) |
| 5:30 AM to 5:59 AM | 6 (13.3%) | 0 (0.0%) |
| 6:00 AM to 6:29 AM | 0 (0.0%) | 0 (0.0%) |
| 6:30 AM to 6:59 AM | 3 (6.7%) | 12 (22.2%) |
| 7:00 AM to 7:29 AM | 12 (26.7%) | 25 (46.3%) |
| 7:30 AM to 7:59 AM | 4 (8.9%) | 0 (0.0%) |
| 8:00 AM to 8:29 AM | 0 (0.0%) | 2 (3.7%) |
| 8:30 AM to 8:59 AM | 0 (0.0%) | 0 (0.0%) |
| 9:00 AM to 9:59 AM | 0 (0.0%) | 0 (0.0%) |
| 10:00 AM to 10:59 AM | 0 (0.0%) | 0 (0.0%) |
| 11:00 AM to 11:59 AM | 0 (0.0%) | 0 (0.0%) |
| 12:00 PM to 3:59 PM | 5 (11.1%) | 5 (9.3%) |
| 4:00 PM to 11:59 PM | 4 (8.9%) | 0 (0.0%) |
| Total | 45 (100.0%) | 54 (100.0%) |
Housing Occupancy in Sheep Springs
Occupancy by Ownership in Sheep Springs
Of the total 83 dwellings in Sheep Springs, owner-occupied units account for 60 (72.3%), while renter-occupied units make up 23 (27.7%).
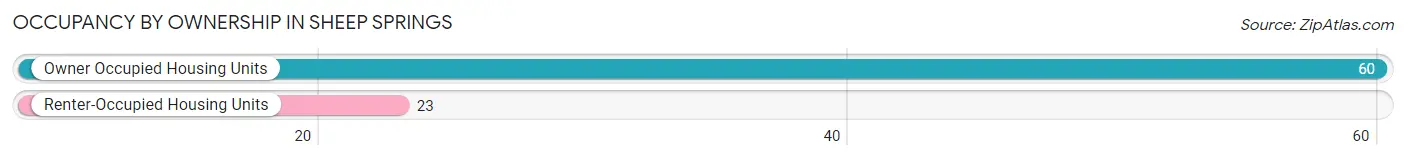
| Occupancy | # Housing Units | % Housing Units |
| Owner Occupied Housing Units | 60 | 72.3% |
| Renter-Occupied Housing Units | 23 | 27.7% |
| Total Occupied Housing Units | 83 | 100.0% |
Occupancy by Household Size in Sheep Springs
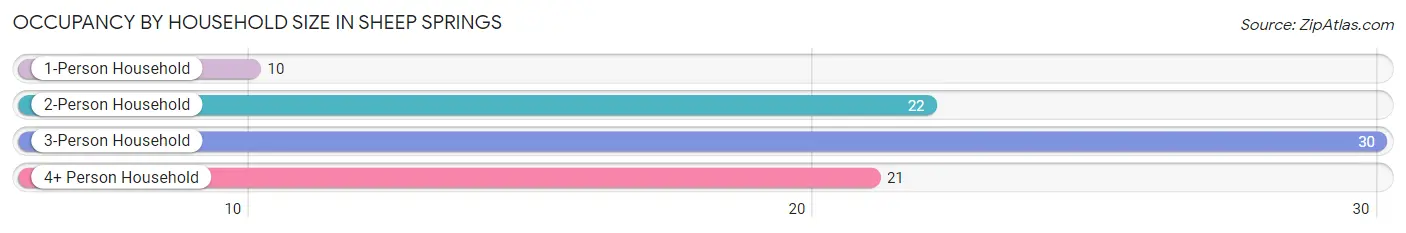
| Household Size | # Housing Units | % Housing Units |
| 1-Person Household | 10 | 12.0% |
| 2-Person Household | 22 | 26.5% |
| 3-Person Household | 30 | 36.1% |
| 4+ Person Household | 21 | 25.3% |
| Total Housing Units | 83 | 100.0% |
Occupancy by Ownership by Household Size in Sheep Springs
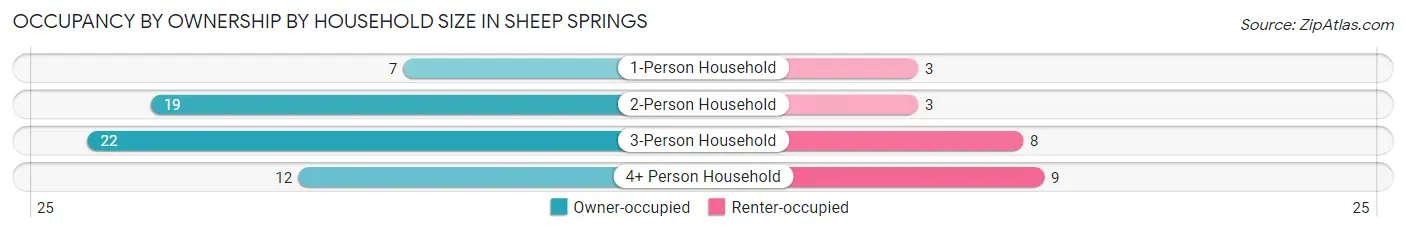
| Household Size | Owner-occupied | Renter-occupied |
| 1-Person Household | 7 (70.0%) | 3 (30.0%) |
| 2-Person Household | 19 (86.4%) | 3 (13.6%) |
| 3-Person Household | 22 (73.3%) | 8 (26.7%) |
| 4+ Person Household | 12 (57.1%) | 9 (42.9%) |
| Total Housing Units | 60 (72.3%) | 23 (27.7%) |
Occupancy by Educational Attainment in Sheep Springs
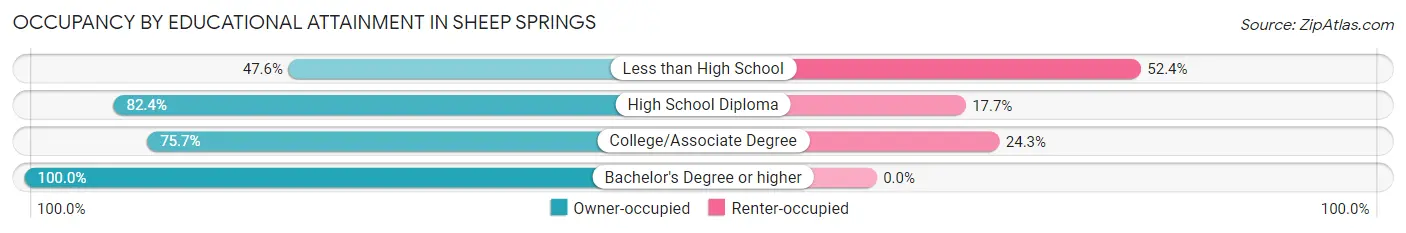
| Household Size | Owner-occupied | Renter-occupied |
| Less than High School | 10 (47.6%) | 11 (52.4%) |
| High School Diploma | 14 (82.4%) | 3 (17.6%) |
| College/Associate Degree | 28 (75.7%) | 9 (24.3%) |
| Bachelor's Degree or higher | 8 (100.0%) | 0 (0.0%) |
Occupancy by Age of Householder in Sheep Springs
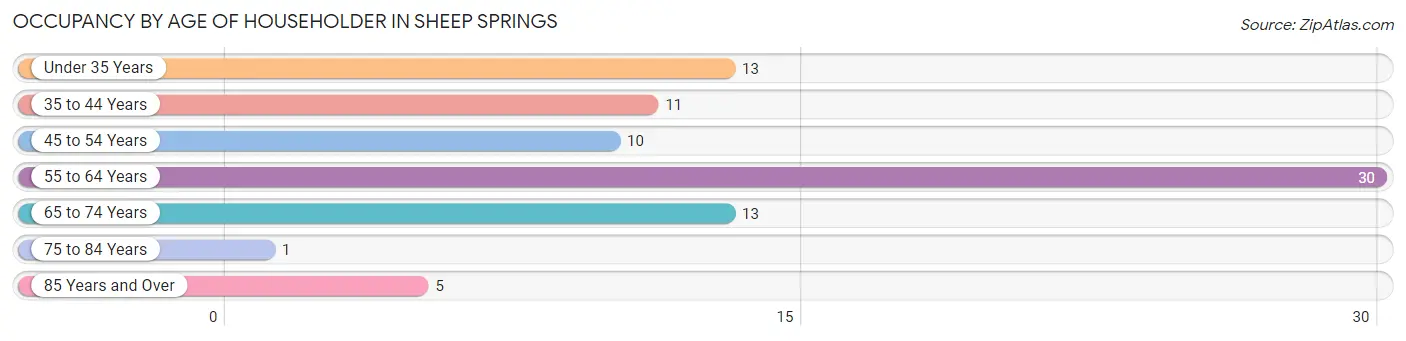
| Age Bracket | # Households | % Households |
| Under 35 Years | 13 | 15.7% |
| 35 to 44 Years | 11 | 13.3% |
| 45 to 54 Years | 10 | 12.0% |
| 55 to 64 Years | 30 | 36.1% |
| 65 to 74 Years | 13 | 15.7% |
| 75 to 84 Years | 1 | 1.2% |
| 85 Years and Over | 5 | 6.0% |
| Total | 83 | 100.0% |
Housing Finances in Sheep Springs
Median Income by Occupancy in Sheep Springs
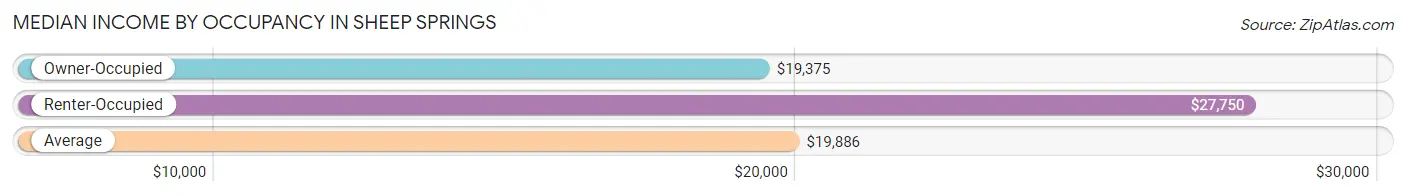
| Occupancy Type | # Households | Median Income |
| Owner-Occupied | 60 (72.3%) | $19,375 |
| Renter-Occupied | 23 (27.7%) | $27,750 |
| Average | 83 (100.0%) | $19,886 |
Occupancy by Householder Income Bracket in Sheep Springs
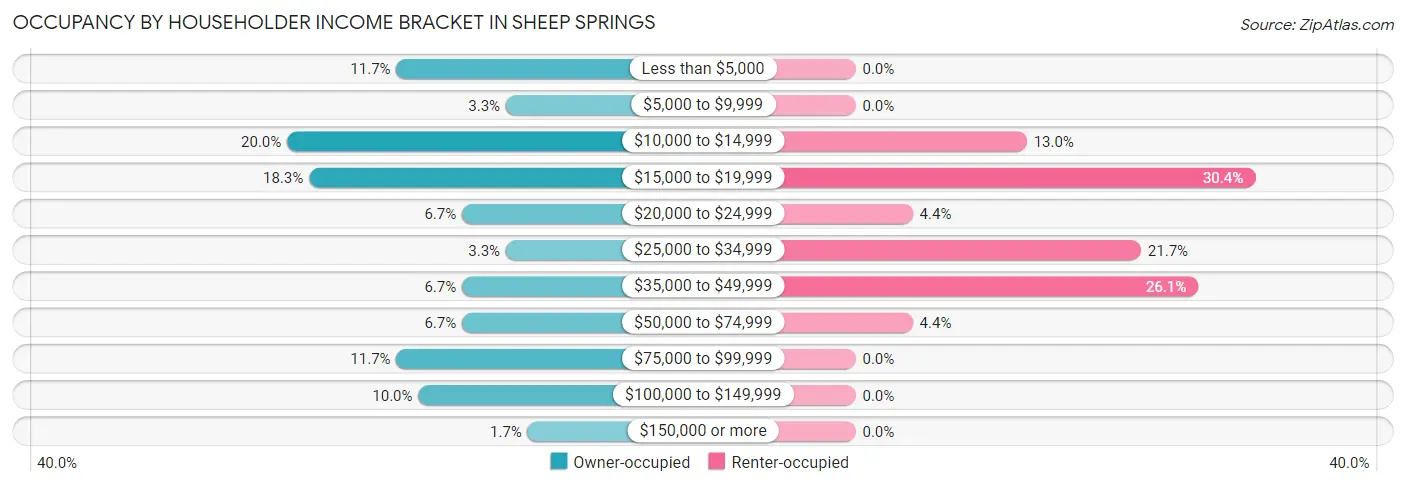
| Income Bracket | Owner-occupied | Renter-occupied |
| Less than $5,000 | 7 (11.7%) | 0 (0.0%) |
| $5,000 to $9,999 | 2 (3.3%) | 0 (0.0%) |
| $10,000 to $14,999 | 12 (20.0%) | 3 (13.0%) |
| $15,000 to $19,999 | 11 (18.3%) | 7 (30.4%) |
| $20,000 to $24,999 | 4 (6.7%) | 1 (4.3%) |
| $25,000 to $34,999 | 2 (3.3%) | 5 (21.7%) |
| $35,000 to $49,999 | 4 (6.7%) | 6 (26.1%) |
| $50,000 to $74,999 | 4 (6.7%) | 1 (4.3%) |
| $75,000 to $99,999 | 7 (11.7%) | 0 (0.0%) |
| $100,000 to $149,999 | 6 (10.0%) | 0 (0.0%) |
| $150,000 or more | 1 (1.7%) | 0 (0.0%) |
| Total | 60 (100.0%) | 23 (100.0%) |
Monthly Housing Cost Tiers in Sheep Springs
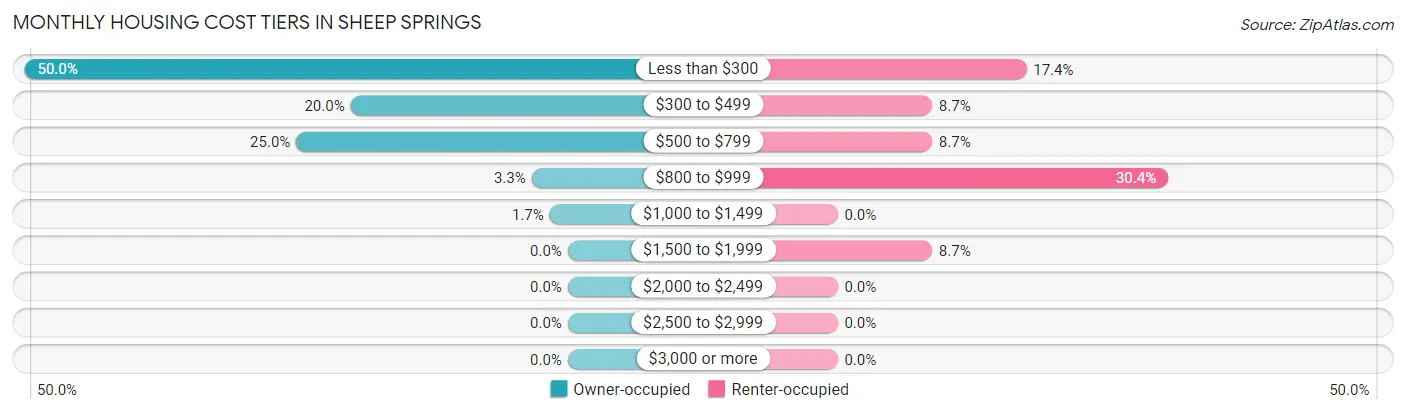
| Monthly Cost | Owner-occupied | Renter-occupied |
| Less than $300 | 30 (50.0%) | 4 (17.4%) |
| $300 to $499 | 12 (20.0%) | 2 (8.7%) |
| $500 to $799 | 15 (25.0%) | 2 (8.7%) |
| $800 to $999 | 2 (3.3%) | 7 (30.4%) |
| $1,000 to $1,499 | 1 (1.7%) | 0 (0.0%) |
| $1,500 to $1,999 | 0 (0.0%) | 2 (8.7%) |
| $2,000 to $2,499 | 0 (0.0%) | 0 (0.0%) |
| $2,500 to $2,999 | 0 (0.0%) | 0 (0.0%) |
| $3,000 or more | 0 (0.0%) | 0 (0.0%) |
| Total | 60 (100.0%) | 23 (100.0%) |
Physical Housing Characteristics in Sheep Springs
Housing Structures in Sheep Springs
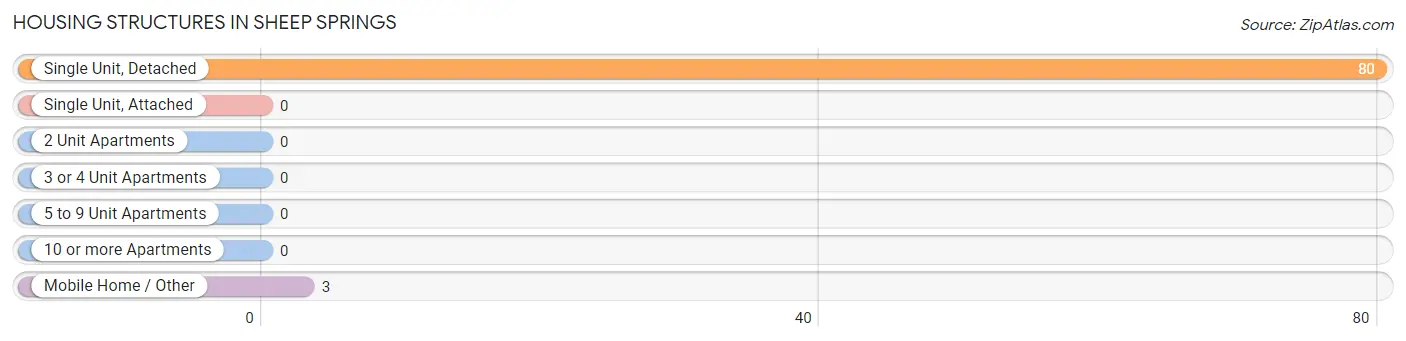
| Structure Type | # Housing Units | % Housing Units |
| Single Unit, Detached | 80 | 96.4% |
| Single Unit, Attached | 0 | 0.0% |
| 2 Unit Apartments | 0 | 0.0% |
| 3 or 4 Unit Apartments | 0 | 0.0% |
| 5 to 9 Unit Apartments | 0 | 0.0% |
| 10 or more Apartments | 0 | 0.0% |
| Mobile Home / Other | 3 | 3.6% |
| Total | 83 | 100.0% |
Housing Structures by Occupancy in Sheep Springs
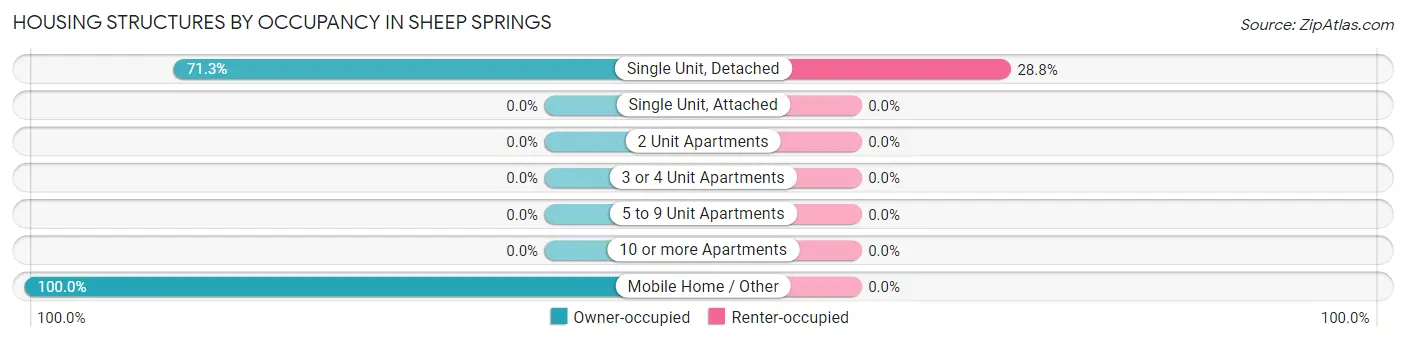
| Structure Type | Owner-occupied | Renter-occupied |
| Single Unit, Detached | 57 (71.3%) | 23 (28.7%) |
| Single Unit, Attached | 0 (0.0%) | 0 (0.0%) |
| 2 Unit Apartments | 0 (0.0%) | 0 (0.0%) |
| 3 or 4 Unit Apartments | 0 (0.0%) | 0 (0.0%) |
| 5 to 9 Unit Apartments | 0 (0.0%) | 0 (0.0%) |
| 10 or more Apartments | 0 (0.0%) | 0 (0.0%) |
| Mobile Home / Other | 3 (100.0%) | 0 (0.0%) |
| Total | 60 (72.3%) | 23 (27.7%) |
Housing Structures by Number of Rooms in Sheep Springs
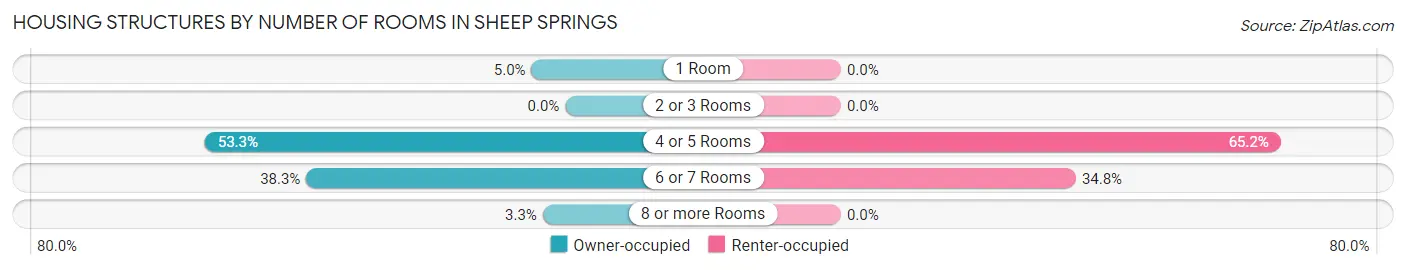
| Number of Rooms | Owner-occupied | Renter-occupied |
| 1 Room | 3 (5.0%) | 0 (0.0%) |
| 2 or 3 Rooms | 0 (0.0%) | 0 (0.0%) |
| 4 or 5 Rooms | 32 (53.3%) | 15 (65.2%) |
| 6 or 7 Rooms | 23 (38.3%) | 8 (34.8%) |
| 8 or more Rooms | 2 (3.3%) | 0 (0.0%) |
| Total | 60 (100.0%) | 23 (100.0%) |
Housing Structure by Heating Type in Sheep Springs
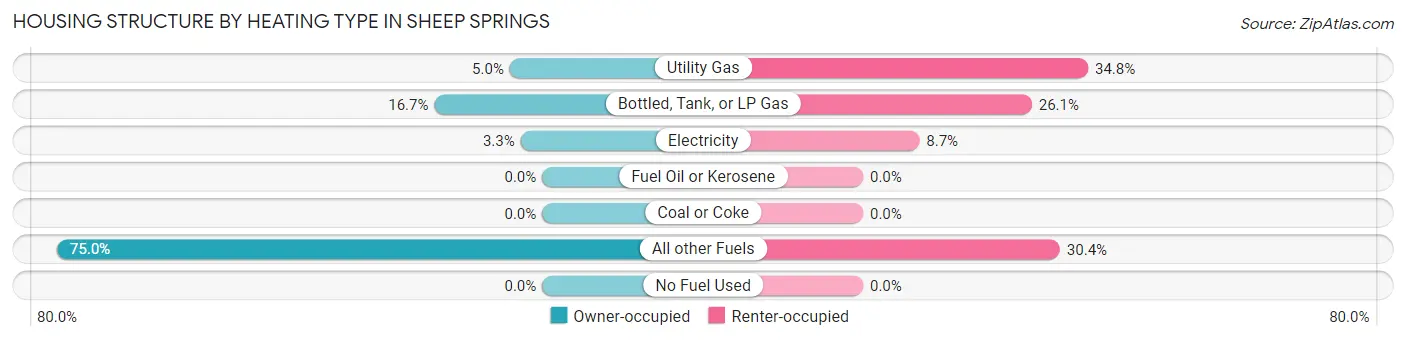
| Heating Type | Owner-occupied | Renter-occupied |
| Utility Gas | 3 (5.0%) | 8 (34.8%) |
| Bottled, Tank, or LP Gas | 10 (16.7%) | 6 (26.1%) |
| Electricity | 2 (3.3%) | 2 (8.7%) |
| Fuel Oil or Kerosene | 0 (0.0%) | 0 (0.0%) |
| Coal or Coke | 0 (0.0%) | 0 (0.0%) |
| All other Fuels | 45 (75.0%) | 7 (30.4%) |
| No Fuel Used | 0 (0.0%) | 0 (0.0%) |
| Total | 60 (100.0%) | 23 (100.0%) |
Household Vehicle Usage in Sheep Springs
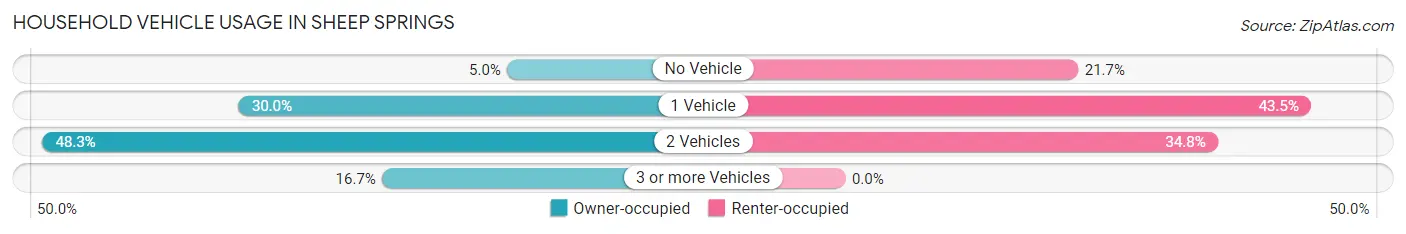
| Vehicles per Household | Owner-occupied | Renter-occupied |
| No Vehicle | 3 (5.0%) | 5 (21.7%) |
| 1 Vehicle | 18 (30.0%) | 10 (43.5%) |
| 2 Vehicles | 29 (48.3%) | 8 (34.8%) |
| 3 or more Vehicles | 10 (16.7%) | 0 (0.0%) |
| Total | 60 (100.0%) | 23 (100.0%) |
Real Estate & Mortgages in Sheep Springs
Real Estate and Mortgage Overview in Sheep Springs
| Characteristic | Without Mortgage | With Mortgage |
| Housing Units | 52 | 8 |
| Median Property Value | $90,000 | $112,500 |
| Median Household Income | $19,063 | $1 |
| Monthly Housing Costs | $225 | $0 |
| Real Estate Taxes | - | - |
Property Value by Mortgage Status in Sheep Springs
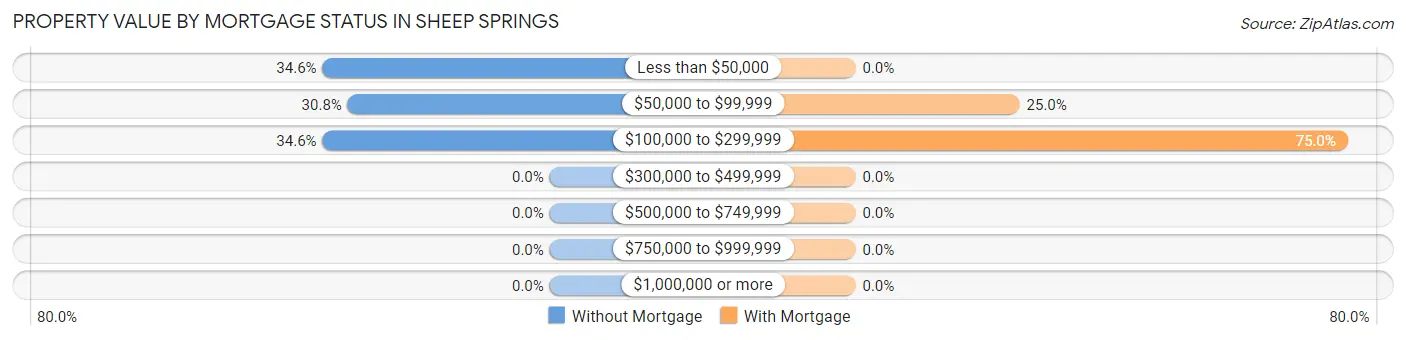
| Property Value | Without Mortgage | With Mortgage |
| Less than $50,000 | 18 (34.6%) | 0 (0.0%) |
| $50,000 to $99,999 | 16 (30.8%) | 2 (25.0%) |
| $100,000 to $299,999 | 18 (34.6%) | 6 (75.0%) |
| $300,000 to $499,999 | 0 (0.0%) | 0 (0.0%) |
| $500,000 to $749,999 | 0 (0.0%) | 0 (0.0%) |
| $750,000 to $999,999 | 0 (0.0%) | 0 (0.0%) |
| $1,000,000 or more | 0 (0.0%) | 0 (0.0%) |
| Total | 52 (100.0%) | 8 (100.0%) |
Household Income by Mortgage Status in Sheep Springs
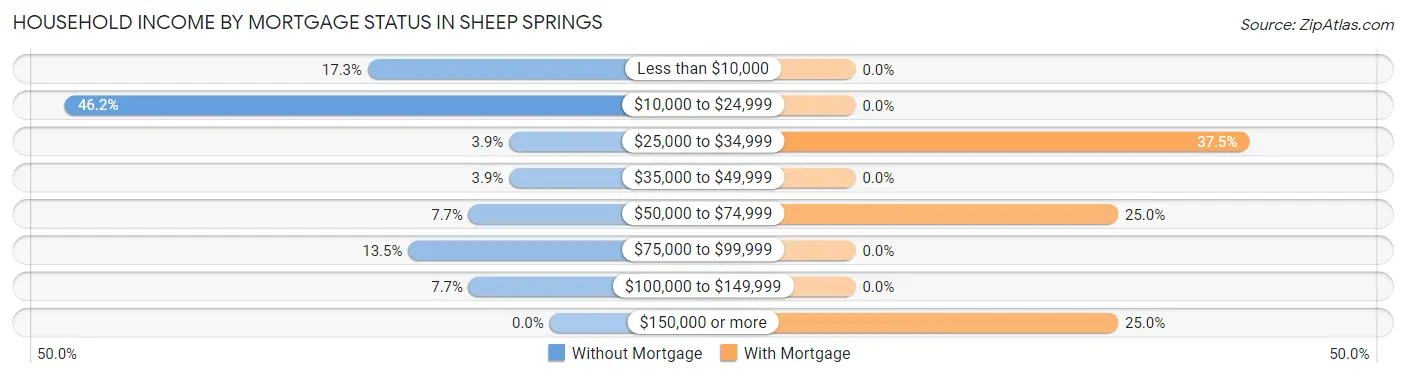
| Household Income | Without Mortgage | With Mortgage |
| Less than $10,000 | 9 (17.3%) | 0 (0.0%) |
| $10,000 to $24,999 | 24 (46.2%) | 0 (0.0%) |
| $25,000 to $34,999 | 2 (3.8%) | 3 (37.5%) |
| $35,000 to $49,999 | 2 (3.8%) | 0 (0.0%) |
| $50,000 to $74,999 | 4 (7.7%) | 2 (25.0%) |
| $75,000 to $99,999 | 7 (13.5%) | 0 (0.0%) |
| $100,000 to $149,999 | 4 (7.7%) | 0 (0.0%) |
| $150,000 or more | 0 (0.0%) | 2 (25.0%) |
| Total | 52 (100.0%) | 8 (100.0%) |
Property Value to Household Income Ratio in Sheep Springs
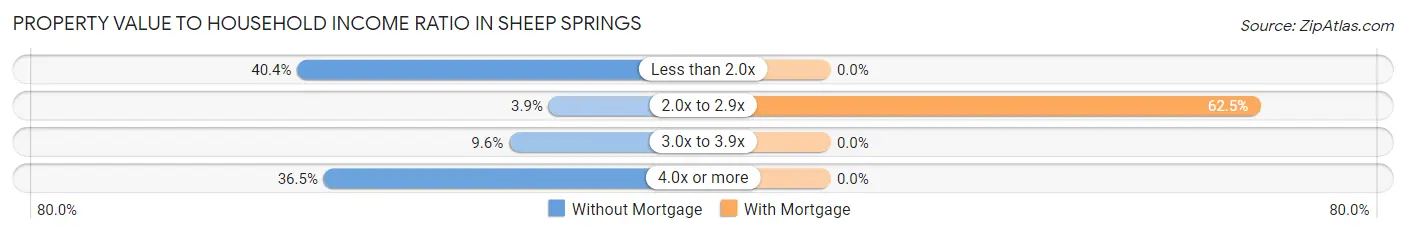
| Value-to-Income Ratio | Without Mortgage | With Mortgage |
| Less than 2.0x | 21 (40.4%) | 0 (0.0%) |
| 2.0x to 2.9x | 2 (3.8%) | 5 (62.5%) |
| 3.0x to 3.9x | 5 (9.6%) | 0 (0.0%) |
| 4.0x or more | 19 (36.5%) | 0 (0.0%) |
| Total | 52 (100.0%) | 8 (100.0%) |
Real Estate Taxes by Mortgage Status in Sheep Springs
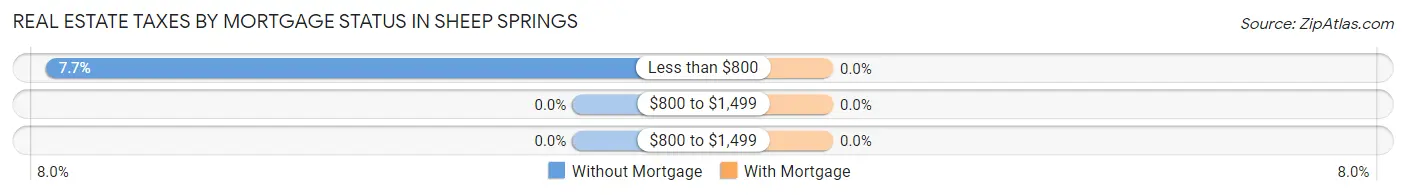
| Property Taxes | Without Mortgage | With Mortgage |
| Less than $800 | 4 (7.7%) | 0 (0.0%) |
| $800 to $1,499 | 0 (0.0%) | 0 (0.0%) |
| $800 to $1,499 | 0 (0.0%) | 0 (0.0%) |
| Total | 52 (100.0%) | 8 (100.0%) |
Health & Disability in Sheep Springs
Health Insurance Coverage by Age in Sheep Springs
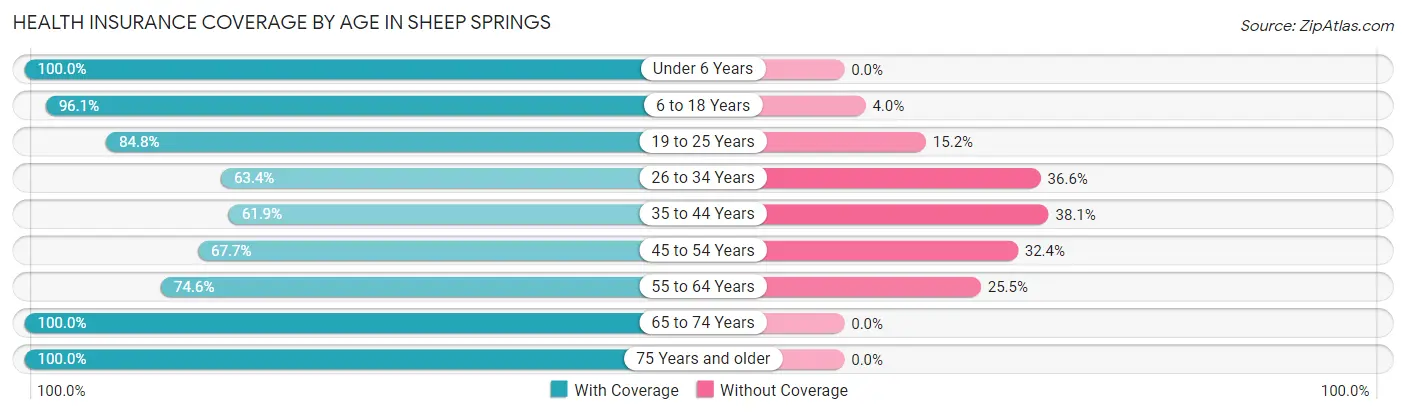
| Age Bracket | With Coverage | Without Coverage |
| Under 6 Years | 32 (100.0%) | 0 (0.0%) |
| 6 to 18 Years | 73 (96.1%) | 3 (4.0%) |
| 19 to 25 Years | 39 (84.8%) | 7 (15.2%) |
| 26 to 34 Years | 45 (63.4%) | 26 (36.6%) |
| 35 to 44 Years | 13 (61.9%) | 8 (38.1%) |
| 45 to 54 Years | 23 (67.6%) | 11 (32.4%) |
| 55 to 64 Years | 41 (74.6%) | 14 (25.5%) |
| 65 to 74 Years | 21 (100.0%) | 0 (0.0%) |
| 75 Years and older | 6 (100.0%) | 0 (0.0%) |
| Total | 293 (80.9%) | 69 (19.1%) |
Health Insurance Coverage by Citizenship Status in Sheep Springs
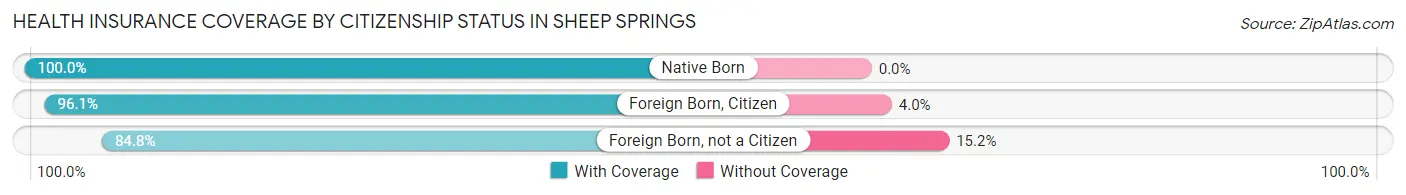
| Citizenship Status | With Coverage | Without Coverage |
| Native Born | 32 (100.0%) | 0 (0.0%) |
| Foreign Born, Citizen | 73 (96.1%) | 3 (4.0%) |
| Foreign Born, not a Citizen | 39 (84.8%) | 7 (15.2%) |
Health Insurance Coverage by Household Income in Sheep Springs
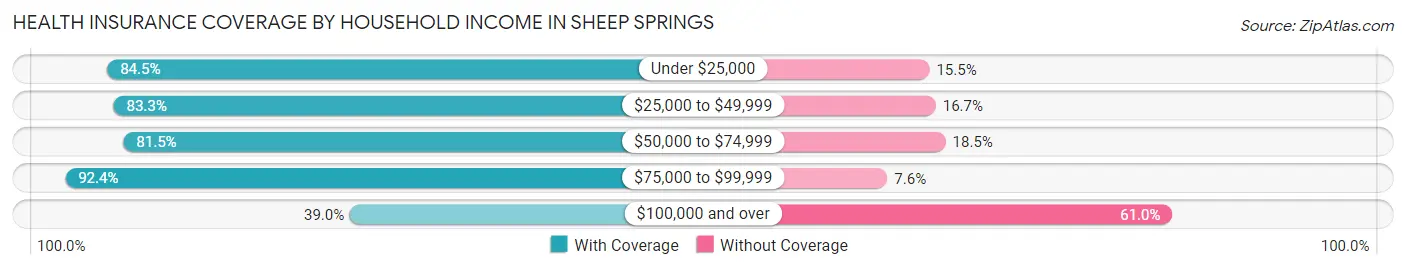
| Household Income | With Coverage | Without Coverage |
| Under $25,000 | 120 (84.5%) | 22 (15.5%) |
| $25,000 to $49,999 | 50 (83.3%) | 10 (16.7%) |
| $50,000 to $74,999 | 22 (81.5%) | 5 (18.5%) |
| $75,000 to $99,999 | 85 (92.4%) | 7 (7.6%) |
| $100,000 and over | 16 (39.0%) | 25 (61.0%) |
Public vs Private Health Insurance Coverage by Age in Sheep Springs
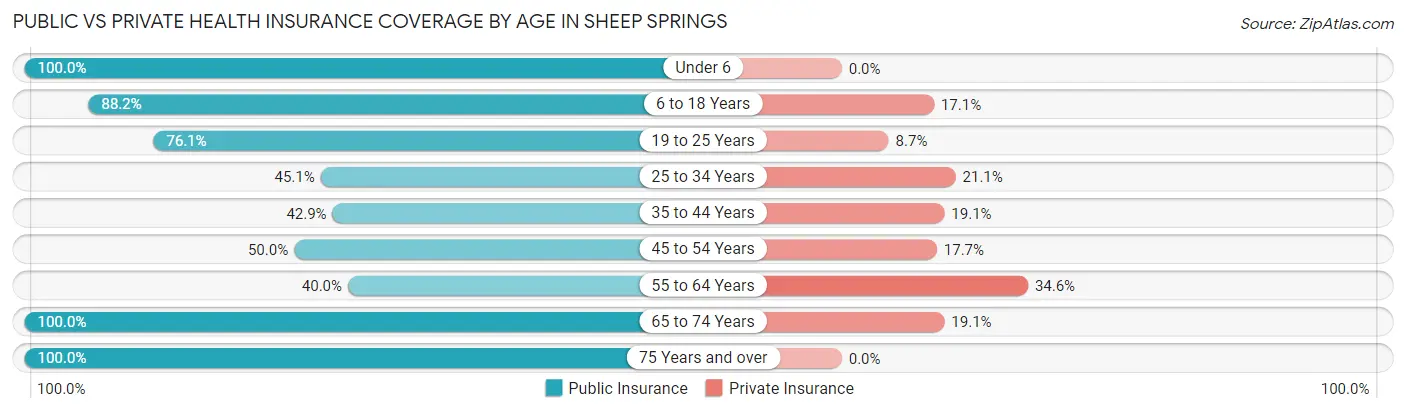
| Age Bracket | Public Insurance | Private Insurance |
| Under 6 | 32 (100.0%) | 0 (0.0%) |
| 6 to 18 Years | 67 (88.2%) | 13 (17.1%) |
| 19 to 25 Years | 35 (76.1%) | 4 (8.7%) |
| 25 to 34 Years | 32 (45.1%) | 15 (21.1%) |
| 35 to 44 Years | 9 (42.9%) | 4 (19.1%) |
| 45 to 54 Years | 17 (50.0%) | 6 (17.6%) |
| 55 to 64 Years | 22 (40.0%) | 19 (34.5%) |
| 65 to 74 Years | 21 (100.0%) | 4 (19.1%) |
| 75 Years and over | 6 (100.0%) | 0 (0.0%) |
| Total | 241 (66.6%) | 65 (18.0%) |
Disability Status by Sex by Age in Sheep Springs
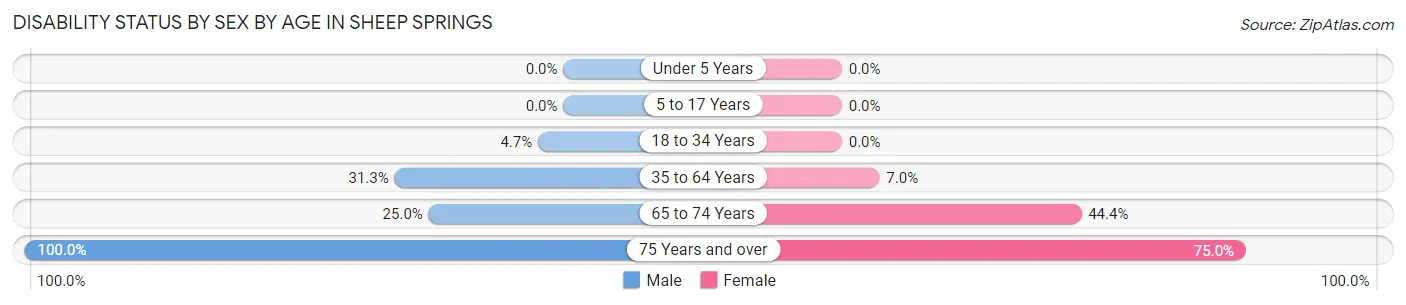
| Age Bracket | Male | Female |
| Under 5 Years | 0 (0.0%) | 0 (0.0%) |
| 5 to 17 Years | 0 (0.0%) | 0 (0.0%) |
| 18 to 34 Years | 3 (4.7%) | 0 (0.0%) |
| 35 to 64 Years | 21 (31.3%) | 3 (7.0%) |
| 65 to 74 Years | 3 (25.0%) | 4 (44.4%) |
| 75 Years and over | 2 (100.0%) | 3 (75.0%) |
Disability Class by Sex by Age in Sheep Springs
Disability Class: Hearing Difficulty
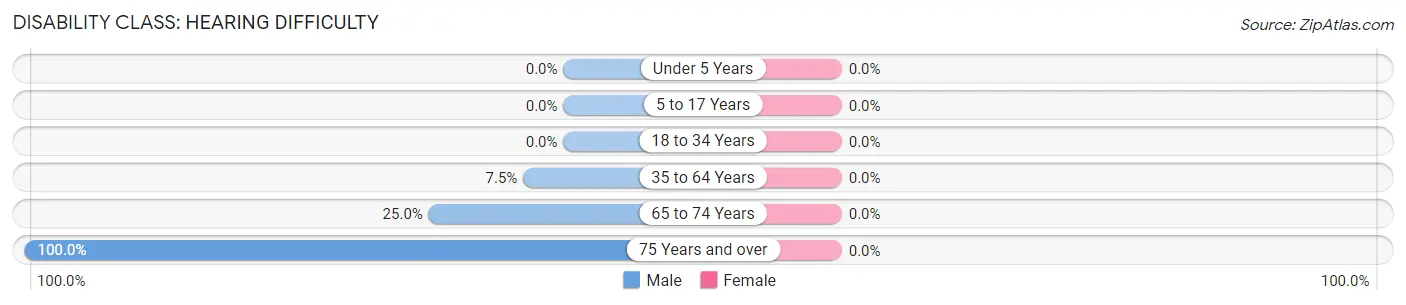
| Age Bracket | Male | Female |
| Under 5 Years | 0 (0.0%) | 0 (0.0%) |
| 5 to 17 Years | 0 (0.0%) | 0 (0.0%) |
| 18 to 34 Years | 0 (0.0%) | 0 (0.0%) |
| 35 to 64 Years | 5 (7.5%) | 0 (0.0%) |
| 65 to 74 Years | 3 (25.0%) | 0 (0.0%) |
| 75 Years and over | 2 (100.0%) | 0 (0.0%) |
Disability Class: Vision Difficulty
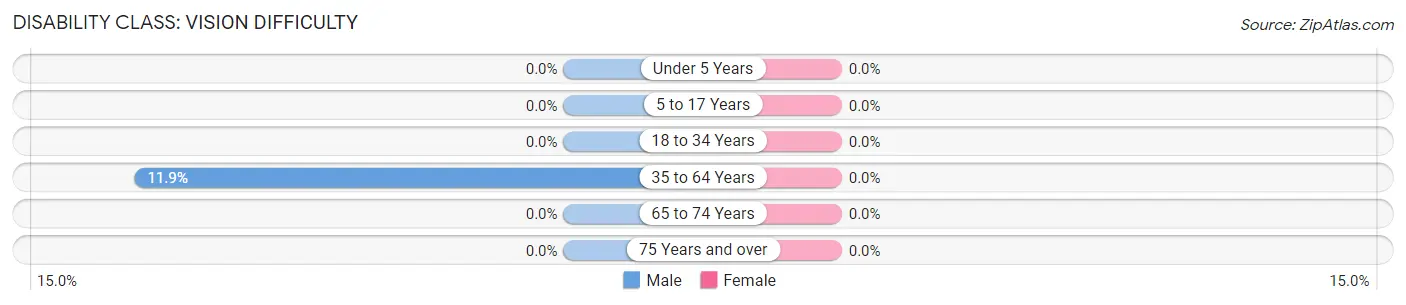
| Age Bracket | Male | Female |
| Under 5 Years | 0 (0.0%) | 0 (0.0%) |
| 5 to 17 Years | 0 (0.0%) | 0 (0.0%) |
| 18 to 34 Years | 0 (0.0%) | 0 (0.0%) |
| 35 to 64 Years | 8 (11.9%) | 0 (0.0%) |
| 65 to 74 Years | 0 (0.0%) | 0 (0.0%) |
| 75 Years and over | 0 (0.0%) | 0 (0.0%) |
Disability Class: Cognitive Difficulty
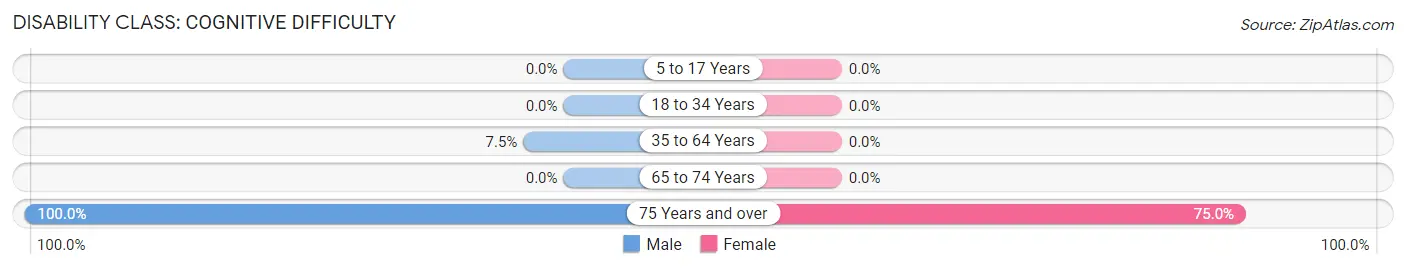
| Age Bracket | Male | Female |
| 5 to 17 Years | 0 (0.0%) | 0 (0.0%) |
| 18 to 34 Years | 0 (0.0%) | 0 (0.0%) |
| 35 to 64 Years | 5 (7.5%) | 0 (0.0%) |
| 65 to 74 Years | 0 (0.0%) | 0 (0.0%) |
| 75 Years and over | 2 (100.0%) | 3 (75.0%) |
Disability Class: Ambulatory Difficulty
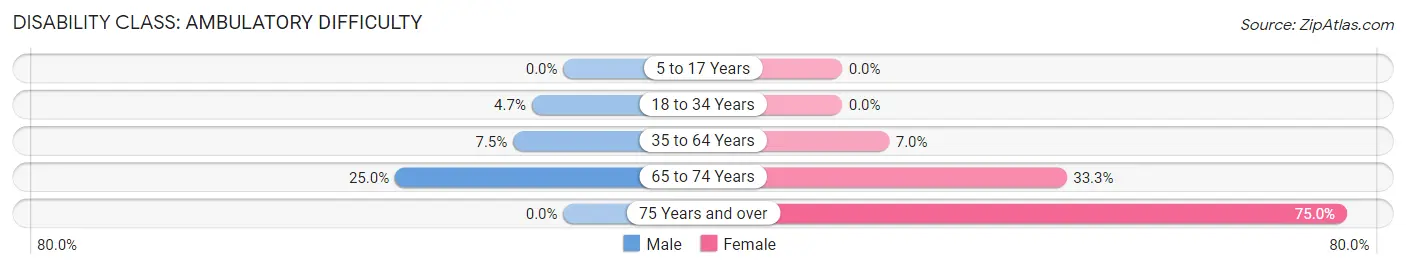
| Age Bracket | Male | Female |
| 5 to 17 Years | 0 (0.0%) | 0 (0.0%) |
| 18 to 34 Years | 3 (4.7%) | 0 (0.0%) |
| 35 to 64 Years | 5 (7.5%) | 3 (7.0%) |
| 65 to 74 Years | 3 (25.0%) | 3 (33.3%) |
| 75 Years and over | 0 (0.0%) | 3 (75.0%) |
Disability Class: Self-Care Difficulty
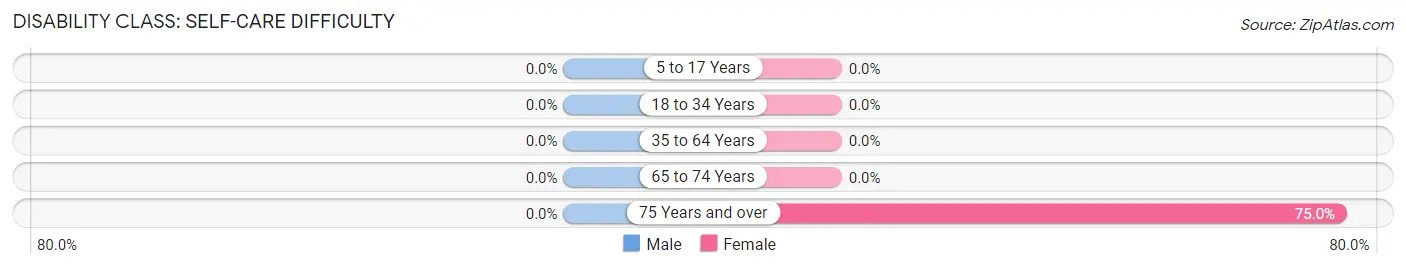
| Age Bracket | Male | Female |
| 5 to 17 Years | 0 (0.0%) | 0 (0.0%) |
| 18 to 34 Years | 0 (0.0%) | 0 (0.0%) |
| 35 to 64 Years | 0 (0.0%) | 0 (0.0%) |
| 65 to 74 Years | 0 (0.0%) | 0 (0.0%) |
| 75 Years and over | 0 (0.0%) | 3 (75.0%) |
Technology Access in Sheep Springs
Computing Device Access in Sheep Springs
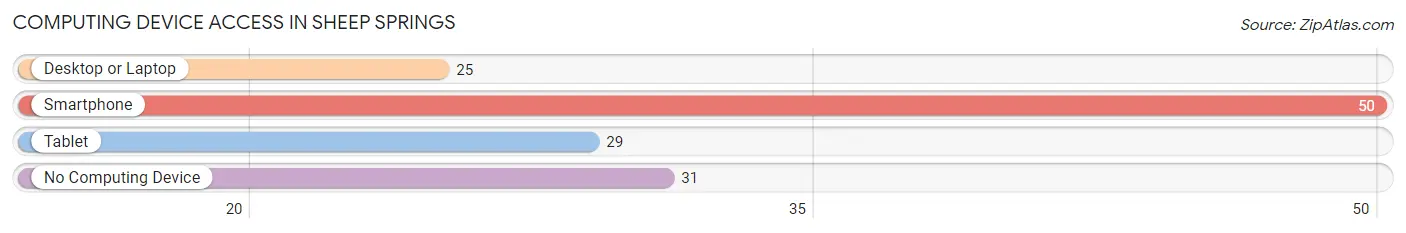
| Device Type | # Households | % Households |
| Desktop or Laptop | 25 | 30.1% |
| Smartphone | 50 | 60.2% |
| Tablet | 29 | 34.9% |
| No Computing Device | 31 | 37.3% |
| Total | 83 | 100.0% |
Internet Access in Sheep Springs
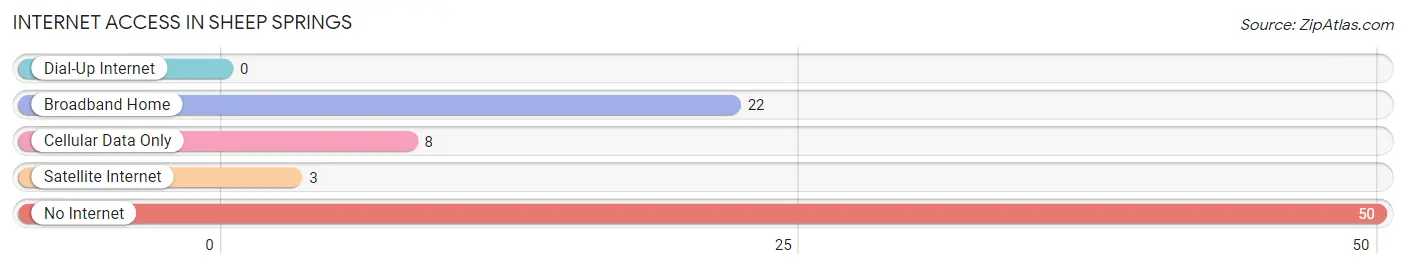
| Internet Type | # Households | % Households |
| Dial-Up Internet | 0 | 0.0% |
| Broadband Home | 22 | 26.5% |
| Cellular Data Only | 8 | 9.6% |
| Satellite Internet | 3 | 3.6% |
| No Internet | 50 | 60.2% |
| Total | 83 | 100.0% |
Sheep Springs Summary
Sheep Springs, New Mexico is a small unincorporated community located in the Navajo Nation in San Juan County, New Mexico. It is located about 25 miles east of Shiprock, New Mexico and about 40 miles west of Farmington, New Mexico. The population of Sheep Springs was estimated to be around 200 people in 2020.
History
The area around Sheep Springs has been inhabited for centuries by the Navajo people. The name “Sheep Springs” is derived from the Navajo word for “sheep”, which is “tsé”. The area was first settled by the Navajo in the late 1800s, and the community was officially established in the early 1900s.
The area around Sheep Springs was used by the Navajo for grazing their sheep and horses. The community was also used as a trading post for the Navajo people, as well as a place to gather for ceremonies and social events.
In the early 1900s, the area around Sheep Springs was also used for mining. The area was home to several uranium mines, which were operated by the United States government during the Cold War. The mines were closed in the late 1970s, and the area has since been used for grazing and farming.
Geography
Sheep Springs is located in the Four Corners region of the United States, which is the intersection of Arizona, Colorado, New Mexico, and Utah. The area is characterized by its high desert climate, with hot summers and cold winters. The area receives an average of 8 inches of precipitation per year.
The area around Sheep Springs is mostly flat, with some rolling hills. The area is mostly covered in grasslands and shrublands, with some areas of juniper and piñon pine. The area is also home to several species of wildlife, including coyotes, bobcats, and mule deer.
Economy
The economy of Sheep Springs is largely based on agriculture and livestock. The area is home to several farms and ranches, which raise sheep, cattle, and horses. The area is also home to several small businesses, including a gas station, a grocery store, and a restaurant.
The area is also home to several uranium mines, which were operated by the United States government during the Cold War. The mines were closed in the late 1970s, and the area has since been used for grazing and farming.
Demographics
The population of Sheep Springs was estimated to be around 200 people in 2020. The majority of the population is Native American, with the majority being Navajo. The median household income in Sheep Springs is around $25,000, which is lower than the national average. The area is also home to a large number of people living in poverty, with around 40% of the population living below the poverty line.
Sheep Springs is a small, rural community with a rich history and culture. The area is home to a diverse population, with a mix of Native American, Hispanic, and Anglo residents. The area is also home to a variety of businesses and industries, which provide employment opportunities for the local population.
Common Questions
What is Per Capita Income in Sheep Springs?
Per Capita income in Sheep Springs is $11,062.
What is the Median Family Income in Sheep Springs?
Median Family Income in Sheep Springs is $20,417.
What is the Median Household income in Sheep Springs?
Median Household Income in Sheep Springs is $19,886.
What is Income or Wage Gap in Sheep Springs?
Income or Wage Gap in Sheep Springs is 30.5%.
Women in Sheep Springs earn 69.5 cents for every dollar earned by a man.
What is Inequality or Gini Index in Sheep Springs?
Inequality or Gini Index in Sheep Springs is 0.50.
What is the Total Population of Sheep Springs?
Total Population of Sheep Springs is 362.
What is the Total Male Population of Sheep Springs?
Total Male Population of Sheep Springs is 191.
What is the Total Female Population of Sheep Springs?
Total Female Population of Sheep Springs is 171.
What is the Ratio of Males per 100 Females in Sheep Springs?
There are 111.70 Males per 100 Females in Sheep Springs.
What is the Ratio of Females per 100 Males in Sheep Springs?
There are 89.53 Females per 100 Males in Sheep Springs.
What is the Median Population Age in Sheep Springs?
Median Population Age in Sheep Springs is 30.3 Years.
What is the Average Family Size in Sheep Springs
Average Family Size in Sheep Springs is 4.6 People.
What is the Average Household Size in Sheep Springs
Average Household Size in Sheep Springs is 4.4 People.
How Large is the Labor Force in Sheep Springs?
There are 124 People in the Labor Forcein in Sheep Springs.
What is the Percentage of People in the Labor Force in Sheep Springs?
45.8% of People are in the Labor Force in Sheep Springs.
What is the Unemployment Rate in Sheep Springs?
Unemployment Rate in Sheep Springs is 18.5%.