Santa Teresa, NM Map & Demographics
Santa Teresa Map
Santa Teresa Overview
$25,663
PER CAPITA INCOME
$59,457
AVG FAMILY INCOME
$58,320
AVG HOUSEHOLD INCOME
44.7%
WAGE / INCOME GAP [ % ]
55.3¢/ $1
WAGE / INCOME GAP [ $ ]
$4,518
FAMILY INCOME DEFICIT
0.44
INEQUALITY / GINI INDEX
6,396
TOTAL POPULATION
3,569
MALE POPULATION
2,827
FEMALE POPULATION
126.25
MALES / 100 FEMALES
79.21
FEMALES / 100 MALES
32.7
MEDIAN AGE
3.4
AVG FAMILY SIZE
2.9
AVG HOUSEHOLD SIZE
2,746
LABOR FORCE [ PEOPLE ]
57.2%
PERCENT IN LABOR FORCE
2.1%
UNEMPLOYMENT RATE
Santa Teresa Zip Codes
Santa Teresa Area Codes
Income in Santa Teresa
Income Overview in Santa Teresa
Per Capita Income in Santa Teresa is $25,663, while median incomes of families and households are $59,457 and $58,320 respectively.
| Characteristic | Number | Measure |
| Per Capita Income | 6,396 | $25,663 |
| Median Family Income | 1,448 | $59,457 |
| Mean Family Income | 1,448 | $79,237 |
| Median Household Income | 2,233 | $58,320 |
| Mean Household Income | 2,233 | $72,468 |
| Income Deficit | 1,448 | $4,518 |
| Wage / Income Gap (%) | 6,396 | 44.69% |
| Wage / Income Gap ($) | 6,396 | 55.31¢ per $1 |
| Gini / Inequality Index | 6,396 | 0.44 |
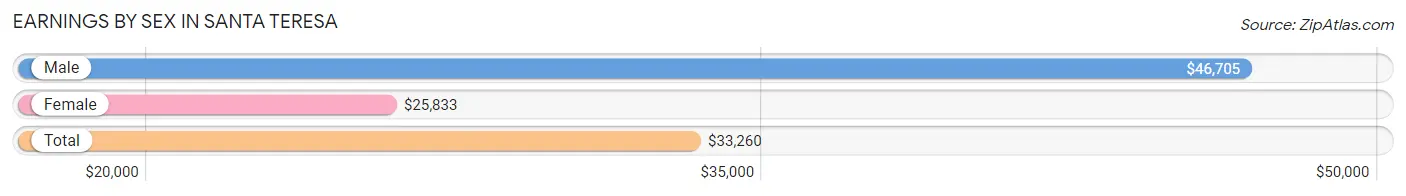
Earnings by Sex in Santa Teresa
Average Earnings in Santa Teresa are $33,260, $46,705 for men and $25,833 for women, a difference of 44.7%.
| Sex | Number | Average Earnings |
| Male | 1,548 (52.1%) | $46,705 |
| Female | 1,422 (47.9%) | $25,833 |
| Total | 2,970 (100.0%) | $33,260 |
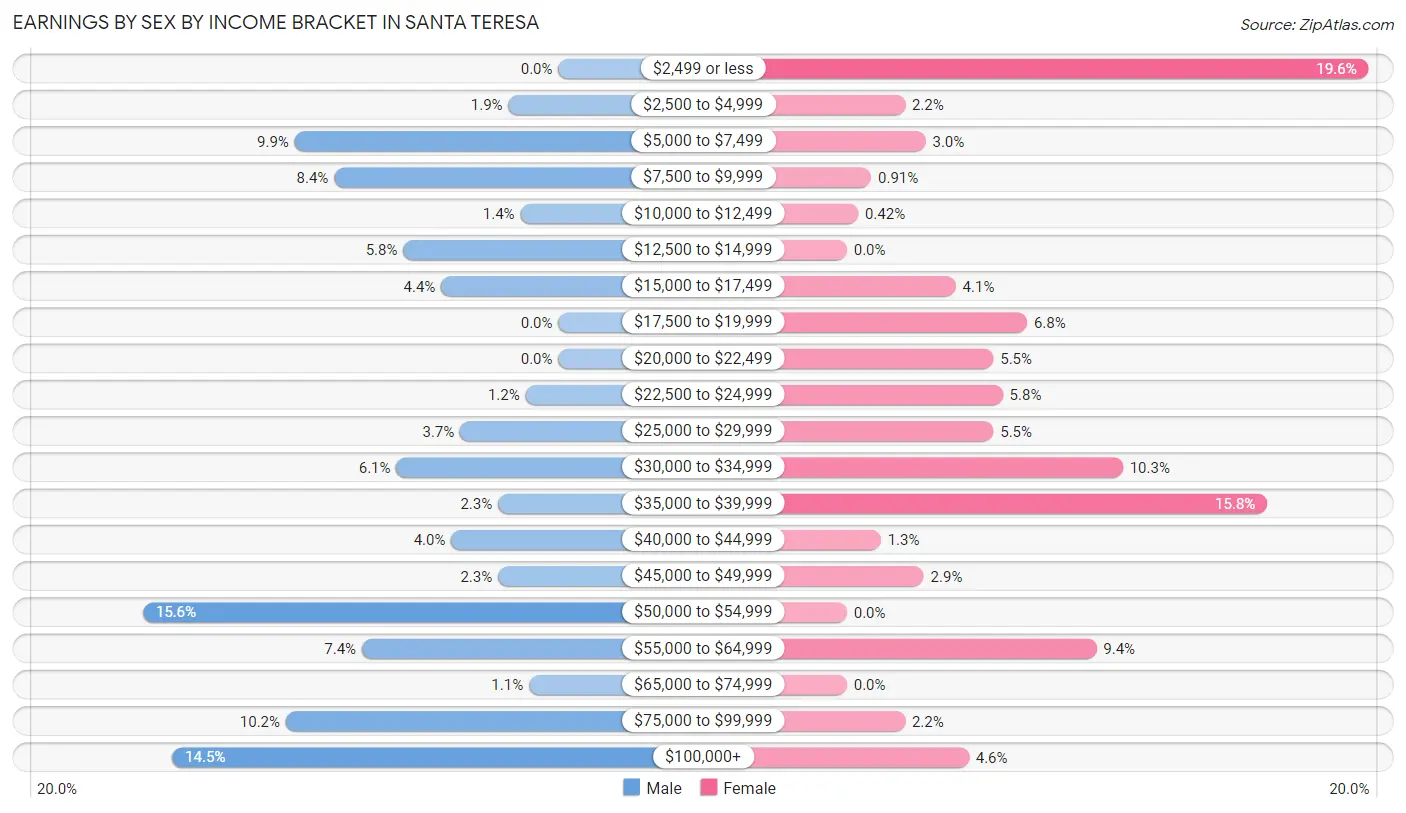
Earnings by Sex by Income Bracket in Santa Teresa
The most common earnings brackets in Santa Teresa are $50,000 to $54,999 for men (241 | 15.6%) and $2,499 or less for women (278 | 19.6%).
| Income | Male | Female |
| $2,499 or less | 0 (0.0%) | 278 (19.6%) |
| $2,500 to $4,999 | 29 (1.9%) | 31 (2.2%) |
| $5,000 to $7,499 | 153 (9.9%) | 42 (2.9%) |
| $7,500 to $9,999 | 130 (8.4%) | 13 (0.9%) |
| $10,000 to $12,499 | 22 (1.4%) | 6 (0.4%) |
| $12,500 to $14,999 | 90 (5.8%) | 0 (0.0%) |
| $15,000 to $17,499 | 68 (4.4%) | 58 (4.1%) |
| $17,500 to $19,999 | 0 (0.0%) | 96 (6.8%) |
| $20,000 to $22,499 | 0 (0.0%) | 78 (5.5%) |
| $22,500 to $24,999 | 19 (1.2%) | 83 (5.8%) |
| $25,000 to $29,999 | 57 (3.7%) | 78 (5.5%) |
| $30,000 to $34,999 | 94 (6.1%) | 147 (10.3%) |
| $35,000 to $39,999 | 35 (2.3%) | 224 (15.8%) |
| $40,000 to $44,999 | 62 (4.0%) | 18 (1.3%) |
| $45,000 to $49,999 | 35 (2.3%) | 41 (2.9%) |
| $50,000 to $54,999 | 241 (15.6%) | 0 (0.0%) |
| $55,000 to $64,999 | 114 (7.4%) | 133 (9.3%) |
| $65,000 to $74,999 | 17 (1.1%) | 0 (0.0%) |
| $75,000 to $99,999 | 158 (10.2%) | 31 (2.2%) |
| $100,000+ | 224 (14.5%) | 65 (4.6%) |
| Total | 1,548 (100.0%) | 1,422 (100.0%) |
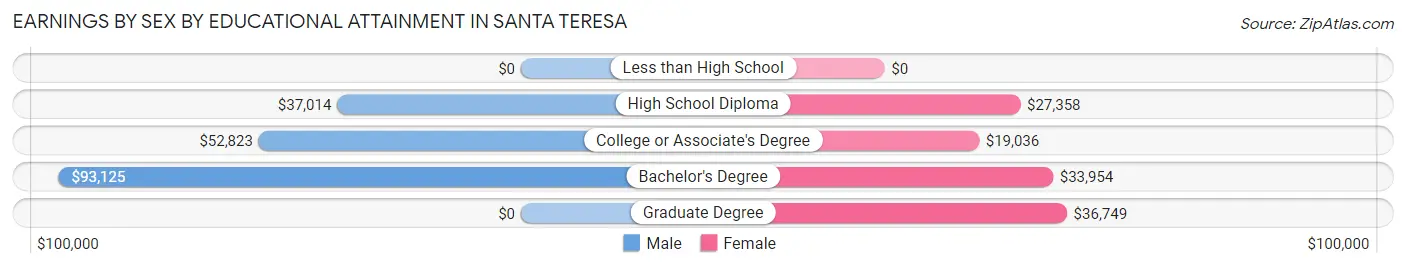
Earnings by Sex by Educational Attainment in Santa Teresa
Average earnings in Santa Teresa are $53,039 for men and $32,413 for women, a difference of 38.9%. Men with an educational attainment of bachelor's degree enjoy the highest average annual earnings of $93,125, while those with high school diploma education earn the least with $37,014. Women with an educational attainment of graduate degree earn the most with the average annual earnings of $36,749, while those with college or associate's degree education have the smallest earnings of $19,036.
| Educational Attainment | Male Income | Female Income |
| Less than High School | - | - |
| High School Diploma | $37,014 | $27,358 |
| College or Associate's Degree | $52,823 | $19,036 |
| Bachelor's Degree | $93,125 | $33,954 |
| Graduate Degree | - | - |
| Total | $53,039 | $32,413 |
Family Income in Santa Teresa
Family Income Brackets in Santa Teresa
According to the Santa Teresa family income data, there are 395 families falling into the $50,000 to $74,999 income range, which is the most common income bracket and makes up 27.3% of all families. Conversely, the $10,000 to $14,999 income bracket is the least frequent group with only 13 families (0.9%) belonging to this category.
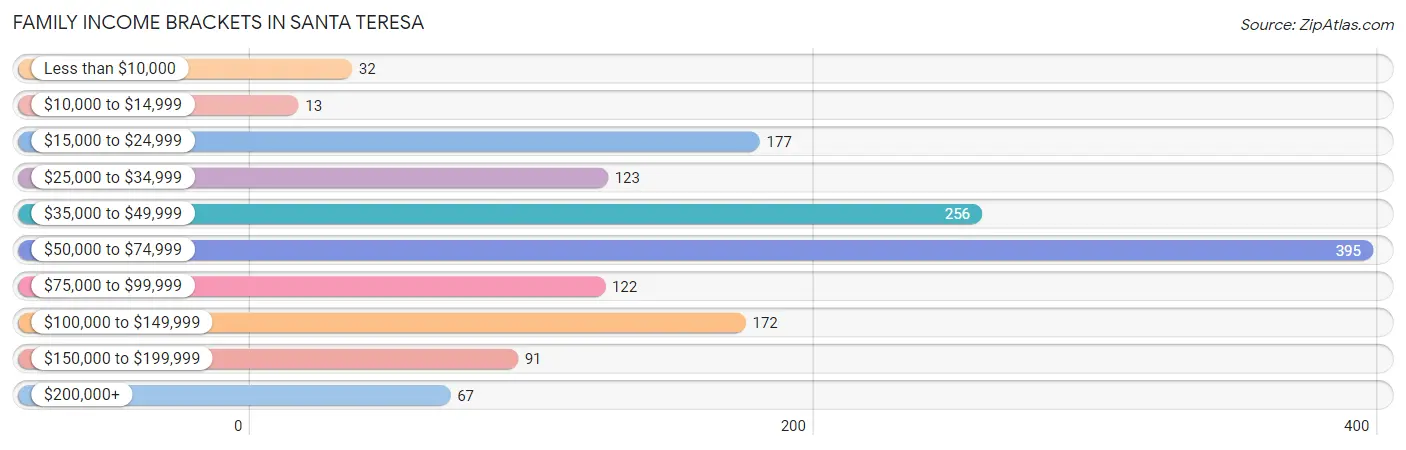
| Income Bracket | # Families | % Families |
| Less than $10,000 | 32 | 2.2% |
| $10,000 to $14,999 | 13 | 0.9% |
| $15,000 to $24,999 | 177 | 12.2% |
| $25,000 to $34,999 | 123 | 8.5% |
| $35,000 to $49,999 | 256 | 17.7% |
| $50,000 to $74,999 | 395 | 27.3% |
| $75,000 to $99,999 | 122 | 8.4% |
| $100,000 to $149,999 | 172 | 11.9% |
| $150,000 to $199,999 | 91 | 6.3% |
| $200,000+ | 67 | 4.6% |
Family Income by Famaliy Size in Santa Teresa
4-person families (247 | 17.1%) account for the highest median family income in Santa Teresa with $80,078 per family, while 3-person families (640 | 44.2%) have the highest median income of $20,234 per family member.
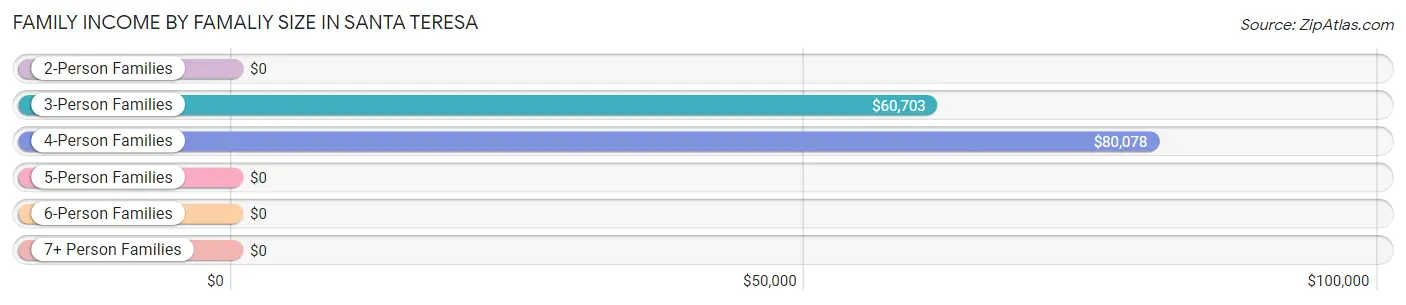
| Income Bracket | # Families | Median Income |
| 2-Person Families | 404 (27.9%) | $0 |
| 3-Person Families | 640 (44.2%) | $60,703 |
| 4-Person Families | 247 (17.1%) | $80,078 |
| 5-Person Families | 49 (3.4%) | $0 |
| 6-Person Families | 19 (1.3%) | $0 |
| 7+ Person Families | 89 (6.1%) | $0 |
| Total | 1,448 (100.0%) | $59,457 |
Family Income by Number of Earners in Santa Teresa
The median family income in Santa Teresa is $59,457, with families comprising 3+ earners (95) having the highest median family income of $96,979, while families with 1 earner (798) have the lowest median family income of $41,918, accounting for 6.6% and 55.1% of families, respectively.
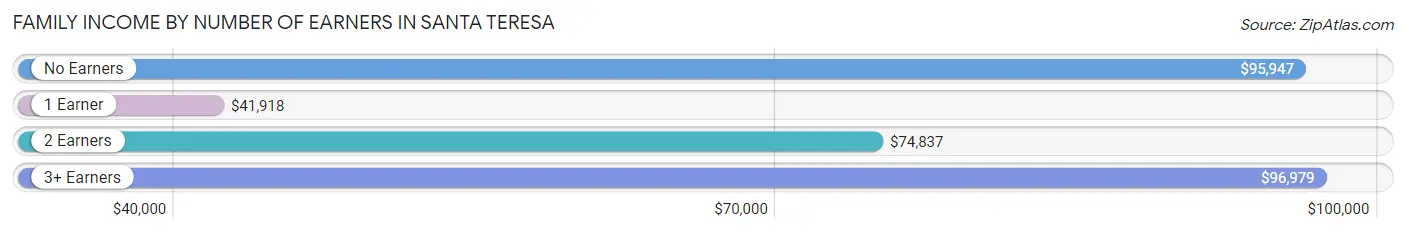
| Number of Earners | # Families | Median Income |
| No Earners | 79 (5.5%) | $95,947 |
| 1 Earner | 798 (55.1%) | $41,918 |
| 2 Earners | 476 (32.9%) | $74,837 |
| 3+ Earners | 95 (6.6%) | $96,979 |
| Total | 1,448 (100.0%) | $59,457 |
Household Income in Santa Teresa
Household Income Brackets in Santa Teresa
With 543 households falling in the category, the $50,000 to $74,999 income range is the most frequent in Santa Teresa, accounting for 24.3% of all households. In contrast, only 67 households (3.0%) fall into the $200,000+ income bracket, making it the least populous group.
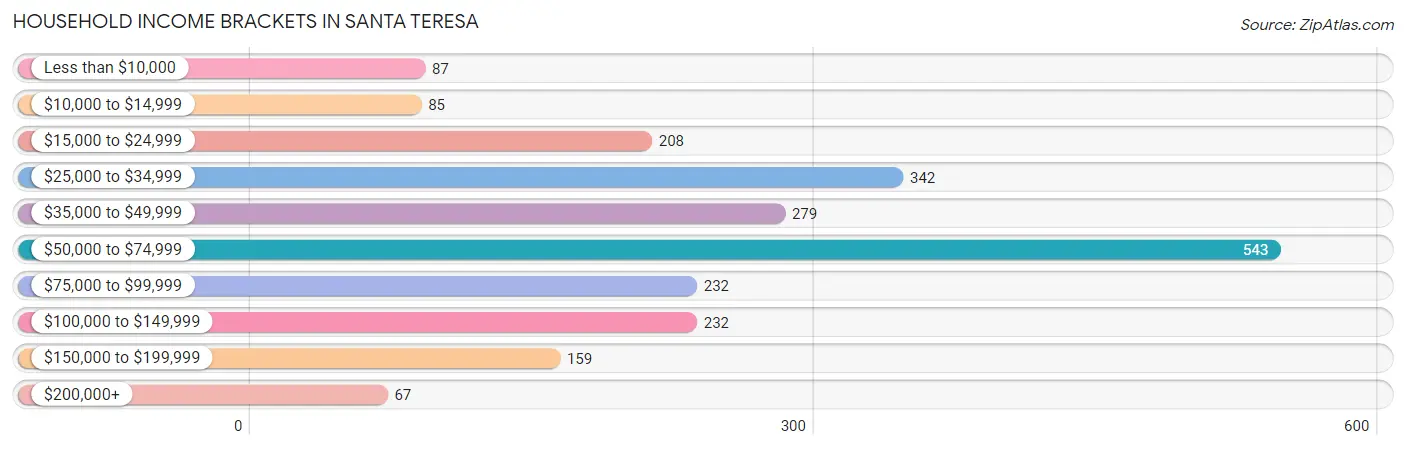
| Income Bracket | # Households | % Households |
| Less than $10,000 | 87 | 3.9% |
| $10,000 to $14,999 | 85 | 3.8% |
| $15,000 to $24,999 | 208 | 9.3% |
| $25,000 to $34,999 | 342 | 15.3% |
| $35,000 to $49,999 | 279 | 12.5% |
| $50,000 to $74,999 | 543 | 24.3% |
| $75,000 to $99,999 | 232 | 10.4% |
| $100,000 to $149,999 | 232 | 10.4% |
| $150,000 to $199,999 | 159 | 7.1% |
| $200,000+ | 67 | 3.0% |
Household Income by Householder Age in Santa Teresa
The median household income in Santa Teresa is $58,320, with the highest median household income of $60,784 found in the 45 to 64 years age bracket for the primary householder. A total of 774 households (34.7%) fall into this category. Meanwhile, the 65+ years age bracket for the primary householder has the lowest median household income of $40,163, with 529 households (23.7%) in this group.
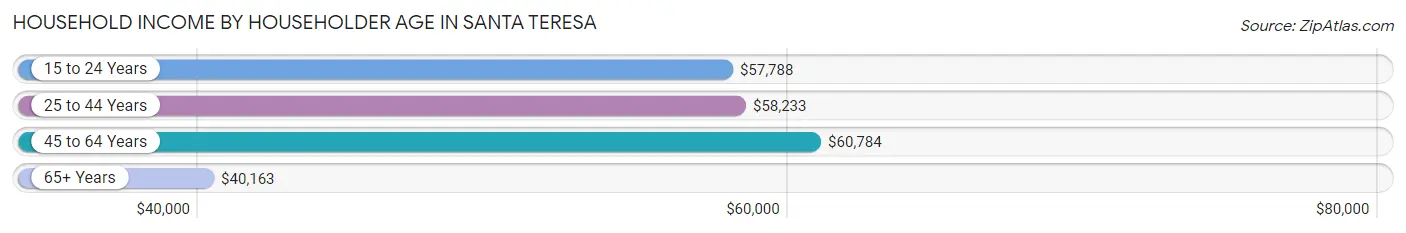
| Income Bracket | # Households | Median Income |
| 15 to 24 Years | 230 (10.3%) | $57,788 |
| 25 to 44 Years | 700 (31.4%) | $58,233 |
| 45 to 64 Years | 774 (34.7%) | $60,784 |
| 65+ Years | 529 (23.7%) | $40,163 |
| Total | 2,233 (100.0%) | $58,320 |
Poverty in Santa Teresa
Income Below Poverty by Sex and Age in Santa Teresa
With 32.7% poverty level for males and 30.7% for females among the residents of Santa Teresa, under 5 year old males and 5 year old females are the most vulnerable to poverty, with 233 males (91.7%) and 1 females (100.0%) in their respective age groups living below the poverty level.

| Age Bracket | Male | Female |
| Under 5 Years | 233 (91.7%) | 146 (52.7%) |
| 5 Years | 0 (0.0%) | 1 (100.0%) |
| 6 to 11 Years | 198 (67.1%) | 37 (20.4%) |
| 12 to 14 Years | 52 (34.0%) | 78 (61.4%) |
| 15 Years | 0 (0.0%) | 0 (0.0%) |
| 16 and 17 Years | 17 (25.4%) | 18 (28.1%) |
| 18 to 24 Years | 347 (54.7%) | 114 (34.4%) |
| 25 to 34 Years | 17 (3.5%) | 120 (38.2%) |
| 35 to 44 Years | 103 (29.3%) | 152 (42.6%) |
| 45 to 54 Years | 41 (14.1%) | 154 (39.8%) |
| 55 to 64 Years | 49 (12.3%) | 6 (1.6%) |
| 65 to 74 Years | 15 (6.9%) | 0 (0.0%) |
| 75 Years and over | 64 (40.5%) | 29 (14.6%) |
| Total | 1,136 (32.7%) | 855 (30.7%) |
Income Above Poverty by Sex and Age in Santa Teresa
According to the poverty statistics in Santa Teresa, males aged 5 years and females aged 65 to 74 years are the age groups that are most secure financially, with 100.0% of males and 100.0% of females in these age groups living above the poverty line.
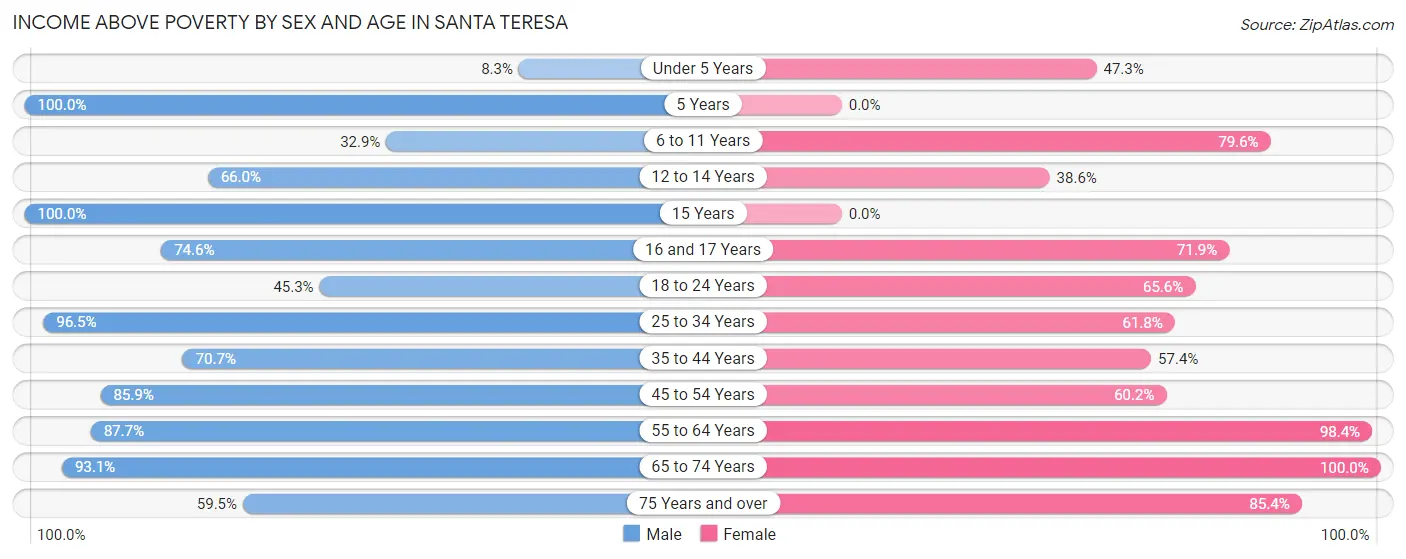
| Age Bracket | Male | Female |
| Under 5 Years | 21 (8.3%) | 131 (47.3%) |
| 5 Years | 45 (100.0%) | 0 (0.0%) |
| 6 to 11 Years | 97 (32.9%) | 144 (79.6%) |
| 12 to 14 Years | 101 (66.0%) | 49 (38.6%) |
| 15 Years | 126 (100.0%) | 0 (0.0%) |
| 16 and 17 Years | 50 (74.6%) | 46 (71.9%) |
| 18 to 24 Years | 287 (45.3%) | 217 (65.6%) |
| 25 to 34 Years | 471 (96.5%) | 194 (61.8%) |
| 35 to 44 Years | 248 (70.7%) | 205 (57.4%) |
| 45 to 54 Years | 250 (85.9%) | 233 (60.2%) |
| 55 to 64 Years | 350 (87.7%) | 369 (98.4%) |
| 65 to 74 Years | 201 (93.1%) | 171 (100.0%) |
| 75 Years and over | 94 (59.5%) | 169 (85.4%) |
| Total | 2,341 (67.3%) | 1,928 (69.3%) |
Income Below Poverty Among Married-Couple Families in Santa Teresa
The poverty statistics for married-couple families in Santa Teresa show that 12.4% or 140 of the total 1,130 families live below the poverty line. Families with 3 or 4 children have the highest poverty rate of 75.5%, comprising of 105 families. On the other hand, families with no children have the lowest poverty rate of 2.1%, which includes 13 families.
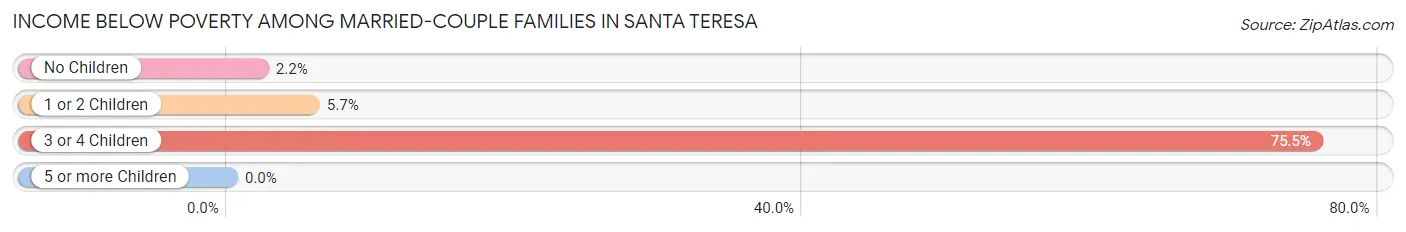
| Children | Above Poverty | Below Poverty |
| No Children | 592 (97.9%) | 13 (2.1%) |
| 1 or 2 Children | 364 (94.3%) | 22 (5.7%) |
| 3 or 4 Children | 34 (24.5%) | 105 (75.5%) |
| 5 or more Children | 0 (0.0%) | 0 (0.0%) |
| Total | 990 (87.6%) | 140 (12.4%) |
Income Below Poverty Among Single-Parent Households in Santa Teresa
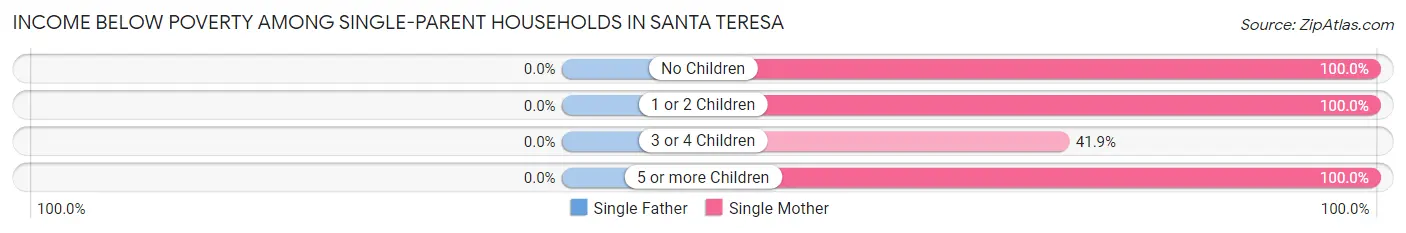
| Children | Single Father | Single Mother |
| No Children | 0 (0.0%) | 14 (100.0%) |
| 1 or 2 Children | 0 (0.0%) | 159 (100.0%) |
| 3 or 4 Children | 0 (0.0%) | 13 (41.9%) |
| 5 or more Children | 0 (0.0%) | 3 (100.0%) |
| Total | 0 (0.0%) | 189 (91.3%) |
Income Below Poverty Among Married-Couple vs Single-Parent Households in Santa Teresa
The poverty data for Santa Teresa shows that 140 of the married-couple family households (12.4%) and 189 of the single-parent households (59.4%) are living below the poverty level. Within the married-couple family households, those with 3 or 4 children have the highest poverty rate, with 105 households (75.5%) falling below the poverty line. Among the single-parent households, those with 5 or more children have the highest poverty rate, with 3 household (100.0%) living below poverty.
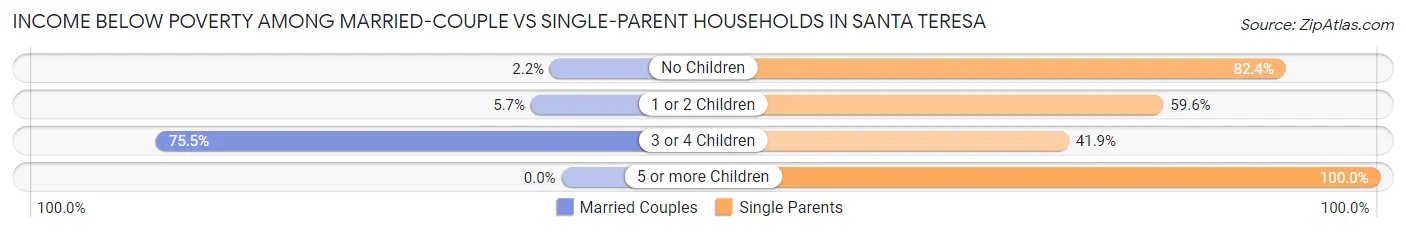
| Children | Married-Couple Families | Single-Parent Households |
| No Children | 13 (2.1%) | 14 (82.4%) |
| 1 or 2 Children | 22 (5.7%) | 159 (59.6%) |
| 3 or 4 Children | 105 (75.5%) | 13 (41.9%) |
| 5 or more Children | 0 (0.0%) | 3 (100.0%) |
| Total | 140 (12.4%) | 189 (59.4%) |
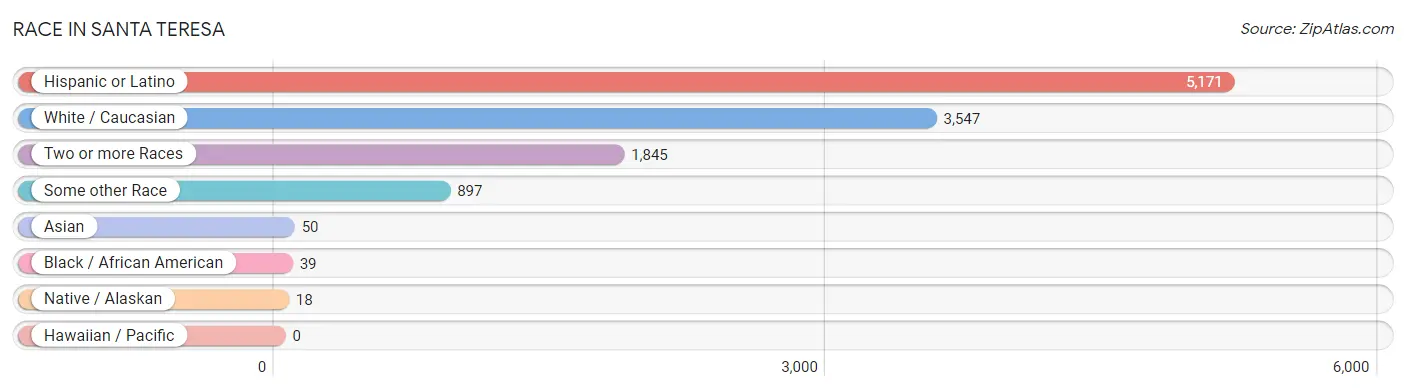
Race in Santa Teresa
The most populous races in Santa Teresa are Hispanic or Latino (5,171 | 80.8%), White / Caucasian (3,547 | 55.5%), and Two or more Races (1,845 | 28.8%).
| Race | # Population | % Population |
| Asian | 50 | 0.8% |
| Black / African American | 39 | 0.6% |
| Hawaiian / Pacific | 0 | 0.0% |
| Hispanic or Latino | 5,171 | 80.8% |
| Native / Alaskan | 18 | 0.3% |
| White / Caucasian | 3,547 | 55.5% |
| Two or more Races | 1,845 | 28.8% |
| Some other Race | 897 | 14.0% |
| Total | 6,396 | 100.0% |
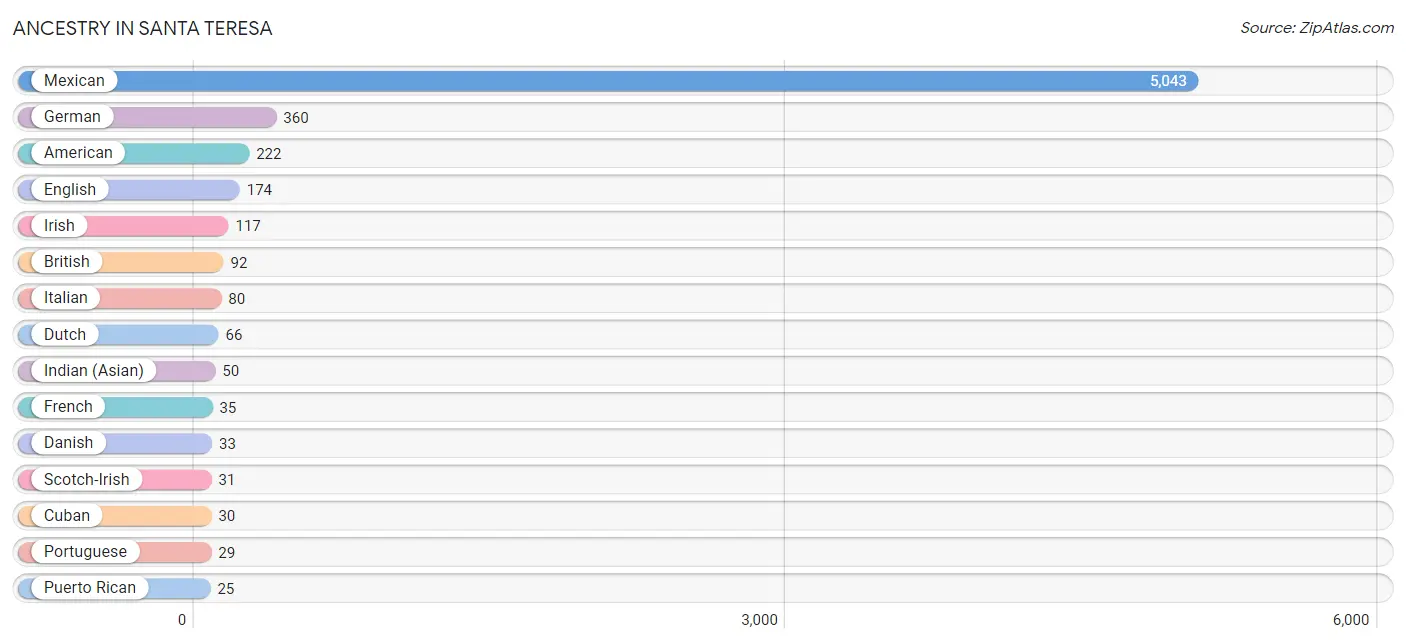
Ancestry in Santa Teresa
The most populous ancestries reported in Santa Teresa are Mexican (5,043 | 78.8%), German (360 | 5.6%), American (222 | 3.5%), English (174 | 2.7%), and Irish (117 | 1.8%), together accounting for 92.5% of all Santa Teresa residents.
| Ancestry | # Population | % Population |
| African | 13 | 0.2% |
| American | 222 | 3.5% |
| British | 92 | 1.4% |
| Cuban | 30 | 0.5% |
| Czech | 11 | 0.2% |
| Danish | 33 | 0.5% |
| Dutch | 66 | 1.0% |
| English | 174 | 2.7% |
| French | 35 | 0.5% |
| German | 360 | 5.6% |
| Indian (Asian) | 50 | 0.8% |
| Irish | 117 | 1.8% |
| Italian | 80 | 1.3% |
| Mexican | 5,043 | 78.8% |
| Norwegian | 24 | 0.4% |
| Portuguese | 29 | 0.4% |
| Puerto Rican | 25 | 0.4% |
| Scotch-Irish | 31 | 0.5% |
| Scottish | 25 | 0.4% |
| Spanish American Indian | 18 | 0.3% |
| Subsaharan African | 13 | 0.2% |
| Swiss | 18 | 0.3% |
| Yugoslavian | 11 | 0.2% | View All 23 Rows |
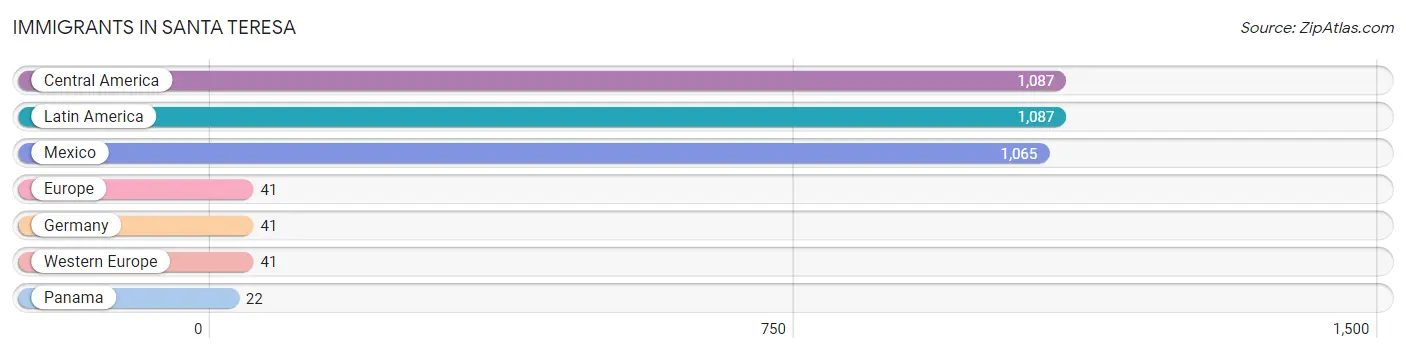
Immigrants in Santa Teresa
The most numerous immigrant groups reported in Santa Teresa came from Central America (1,087 | 17.0%), Latin America (1,087 | 17.0%), Mexico (1,065 | 16.7%), Europe (41 | 0.6%), and Germany (41 | 0.6%), together accounting for 51.9% of all Santa Teresa residents.
| Immigration Origin | # Population | % Population |
| Central America | 1,087 | 17.0% |
| Europe | 41 | 0.6% |
| Germany | 41 | 0.6% |
| Latin America | 1,087 | 17.0% |
| Mexico | 1,065 | 16.7% |
| Panama | 22 | 0.3% |
| Western Europe | 41 | 0.6% | View All 7 Rows |
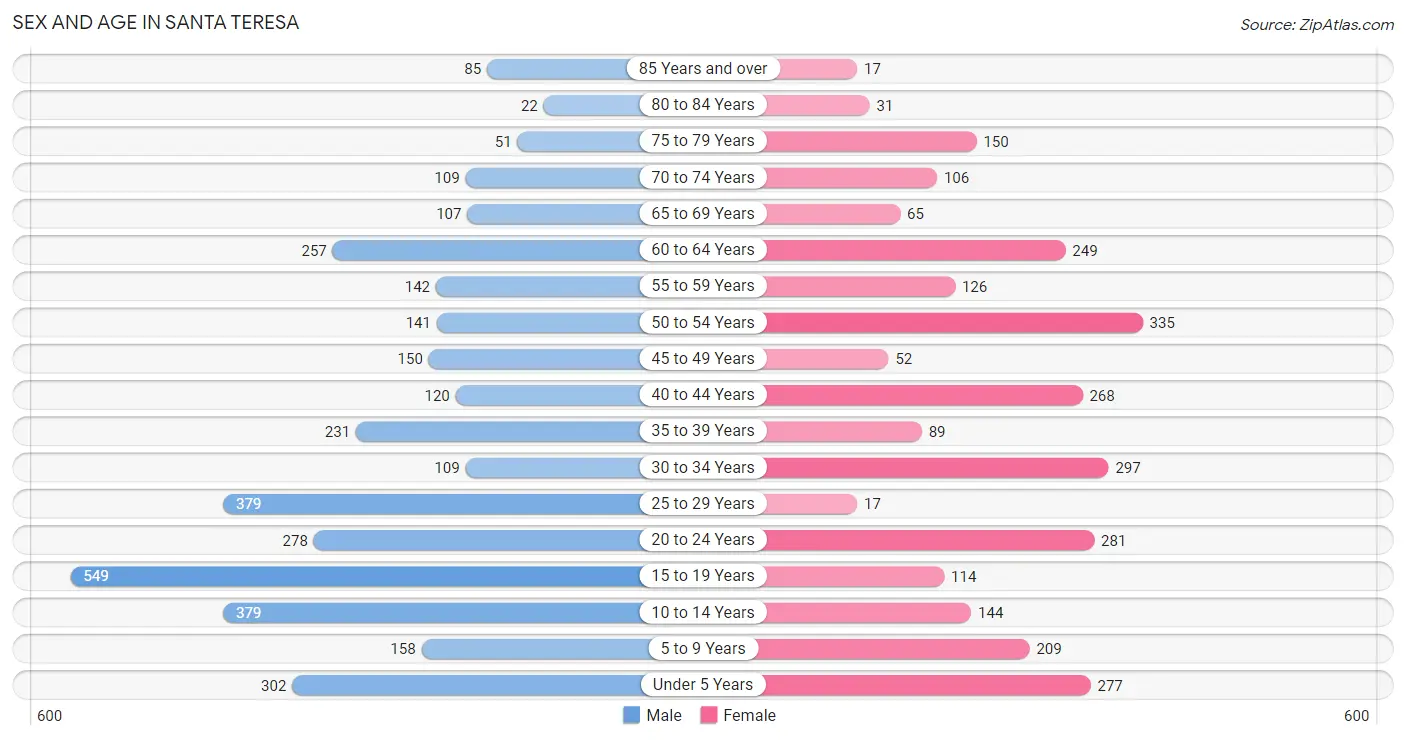
Sex and Age in Santa Teresa
Sex and Age in Santa Teresa
The most populous age groups in Santa Teresa are 15 to 19 Years (549 | 15.4%) for men and 50 to 54 Years (335 | 11.8%) for women.
| Age Bracket | Male | Female |
| Under 5 Years | 302 (8.5%) | 277 (9.8%) |
| 5 to 9 Years | 158 (4.4%) | 209 (7.4%) |
| 10 to 14 Years | 379 (10.6%) | 144 (5.1%) |
| 15 to 19 Years | 549 (15.4%) | 114 (4.0%) |
| 20 to 24 Years | 278 (7.8%) | 281 (9.9%) |
| 25 to 29 Years | 379 (10.6%) | 17 (0.6%) |
| 30 to 34 Years | 109 (3.0%) | 297 (10.5%) |
| 35 to 39 Years | 231 (6.5%) | 89 (3.2%) |
| 40 to 44 Years | 120 (3.4%) | 268 (9.5%) |
| 45 to 49 Years | 150 (4.2%) | 52 (1.8%) |
| 50 to 54 Years | 141 (4.0%) | 335 (11.8%) |
| 55 to 59 Years | 142 (4.0%) | 126 (4.5%) |
| 60 to 64 Years | 257 (7.2%) | 249 (8.8%) |
| 65 to 69 Years | 107 (3.0%) | 65 (2.3%) |
| 70 to 74 Years | 109 (3.0%) | 106 (3.7%) |
| 75 to 79 Years | 51 (1.4%) | 150 (5.3%) |
| 80 to 84 Years | 22 (0.6%) | 31 (1.1%) |
| 85 Years and over | 85 (2.4%) | 17 (0.6%) |
| Total | 3,569 (100.0%) | 2,827 (100.0%) |
Families and Households in Santa Teresa
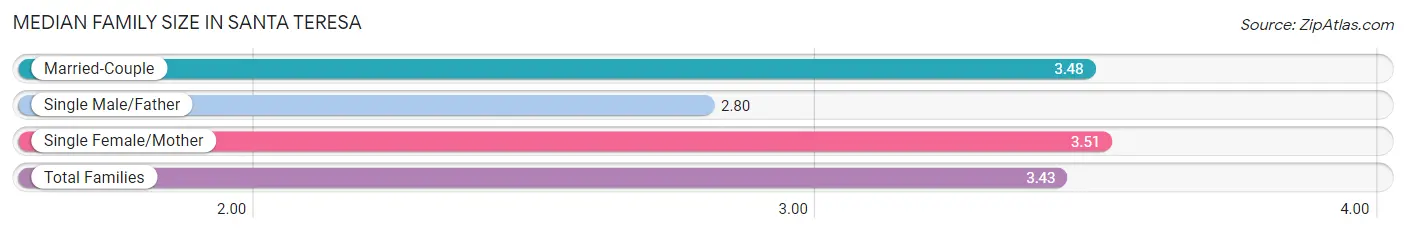
Median Family Size in Santa Teresa
The median family size in Santa Teresa is 3.43 persons per family, with single female/mother families (207 | 14.3%) accounting for the largest median family size of 3.51 persons per family. On the other hand, single male/father families (111 | 7.7%) represent the smallest median family size with 2.80 persons per family.
| Family Type | # Families | Family Size |
| Married-Couple | 1,130 (78.0%) | 3.48 |
| Single Male/Father | 111 (7.7%) | 2.80 |
| Single Female/Mother | 207 (14.3%) | 3.51 |
| Total Families | 1,448 (100.0%) | 3.43 |
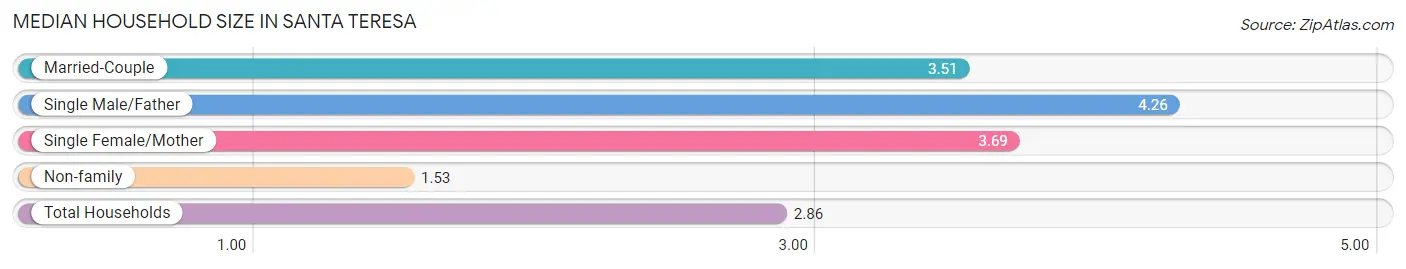
Median Household Size in Santa Teresa
The median household size in Santa Teresa is 2.86 persons per household, with single male/father households (111 | 5.0%) accounting for the largest median household size of 4.26 persons per household. non-family households (785 | 35.1%) represent the smallest median household size with 1.53 persons per household.
| Household Type | # Households | Household Size |
| Married-Couple | 1,130 (50.6%) | 3.51 |
| Single Male/Father | 111 (5.0%) | 4.26 |
| Single Female/Mother | 207 (9.3%) | 3.69 |
| Non-family | 785 (35.1%) | 1.53 |
| Total Households | 2,233 (100.0%) | 2.86 |
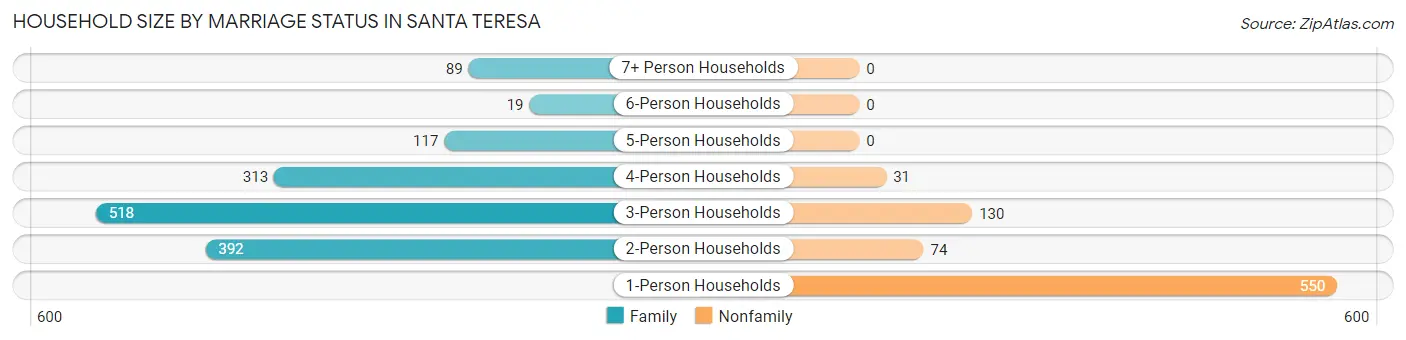
Household Size by Marriage Status in Santa Teresa
Out of a total of 2,233 households in Santa Teresa, 1,448 (64.8%) are family households, while 785 (35.1%) are nonfamily households. The most numerous type of family households are 3-person households, comprising 518, and the most common type of nonfamily households are 1-person households, comprising 550.
| Household Size | Family Households | Nonfamily Households |
| 1-Person Households | - | 550 (24.6%) |
| 2-Person Households | 392 (17.5%) | 74 (3.3%) |
| 3-Person Households | 518 (23.2%) | 130 (5.8%) |
| 4-Person Households | 313 (14.0%) | 31 (1.4%) |
| 5-Person Households | 117 (5.2%) | 0 (0.0%) |
| 6-Person Households | 19 (0.9%) | 0 (0.0%) |
| 7+ Person Households | 89 (4.0%) | 0 (0.0%) |
| Total | 1,448 (64.8%) | 785 (35.1%) |
Female Fertility in Santa Teresa
Fertility by Age in Santa Teresa
Average fertility rate in Santa Teresa is 150.0 births per 1,000 women. Women in the age bracket of 20 to 34 years have the highest fertility rate with 297.0 births per 1,000 women. Women in the age bracket of 20 to 34 years acount for 100.0% of all women with births.
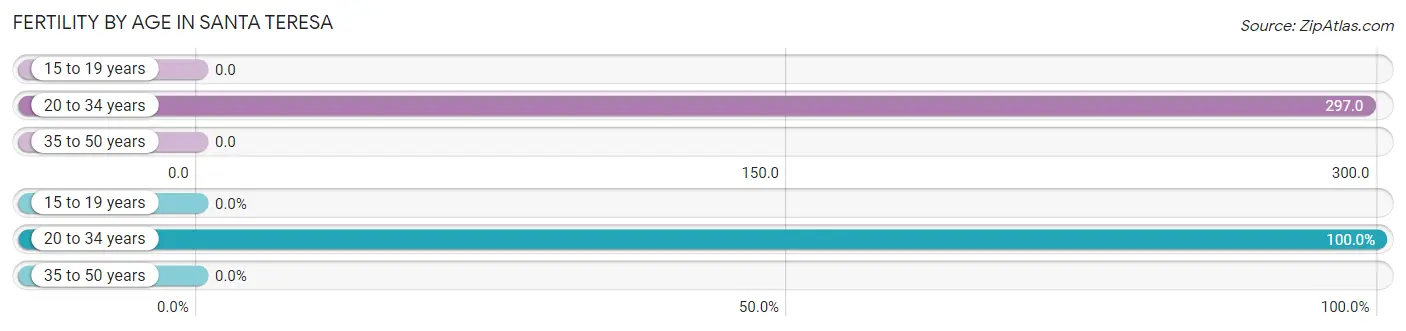
| Age Bracket | Women with Births | Births / 1,000 Women |
| 15 to 19 years | 0 (0.0%) | 0.0 |
| 20 to 34 years | 177 (100.0%) | 297.0 |
| 35 to 50 years | 0 (0.0%) | 0.0 |
| Total | 177 (100.0%) | 150.0 |
Fertility by Age by Marriage Status in Santa Teresa
50.3% of women with births (177) in Santa Teresa are married. The highest percentage of unmarried women with births falls into 20 to 34 years age bracket with 49.7% of them unmarried at the time of birth, while the lowest percentage of unmarried women with births belong to 20 to 34 years age bracket with 49.7% of them unmarried.
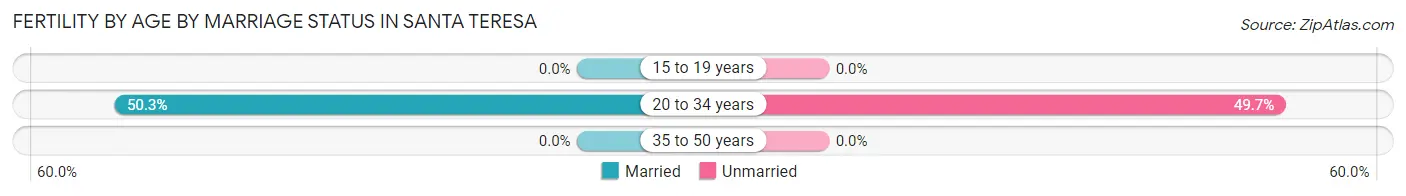
| Age Bracket | Married | Unmarried |
| 15 to 19 years | 0 (0.0%) | 0 (0.0%) |
| 20 to 34 years | 89 (50.3%) | 88 (49.7%) |
| 35 to 50 years | 0 (0.0%) | 0 (0.0%) |
| Total | 89 (50.3%) | 88 (49.7%) |
Fertility by Education in Santa Teresa
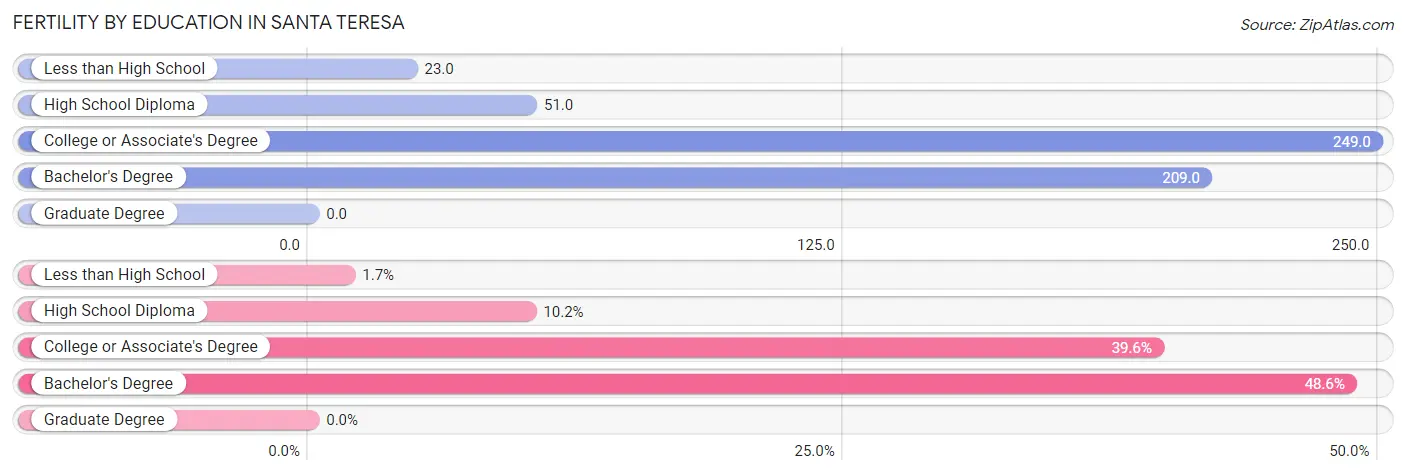
| Educational Attainment | Women with Births | Births / 1,000 Women |
| Less than High School | 3 (1.7%) | 23.0 |
| High School Diploma | 18 (10.2%) | 51.0 |
| College or Associate's Degree | 70 (39.6%) | 249.0 |
| Bachelor's Degree | 86 (48.6%) | 209.0 |
| Graduate Degree | 0 (0.0%) | 0.0 |
| Total | 177 (100.0%) | 150.0 |
Fertility by Education by Marriage Status in Santa Teresa
49.7% of women with births in Santa Teresa are unmarried. Women with the educational attainment of less than high school are most likely to be married with 100.0% of them married at childbirth, while women with the educational attainment of high school diploma are least likely to be married with 100.0% of them unmarried at childbirth.
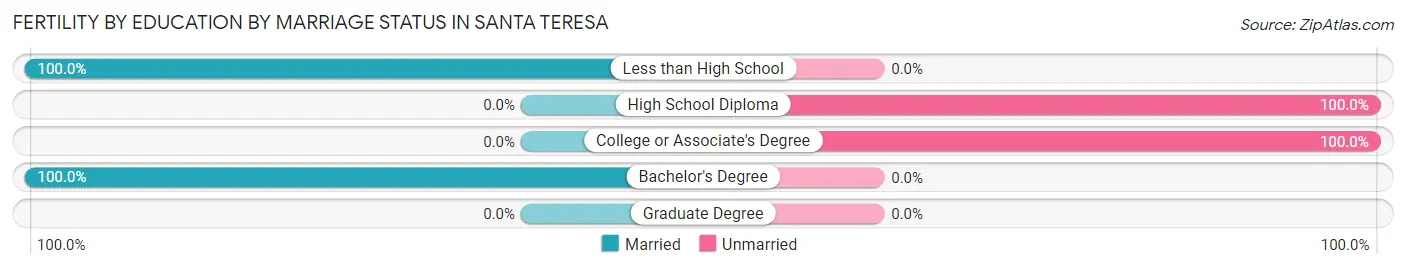
| Educational Attainment | Married | Unmarried |
| Less than High School | 3 (100.0%) | 0 (0.0%) |
| High School Diploma | 0 (0.0%) | 18 (100.0%) |
| College or Associate's Degree | 0 (0.0%) | 70 (100.0%) |
| Bachelor's Degree | 86 (100.0%) | 0 (0.0%) |
| Graduate Degree | 0 (0.0%) | 0 (0.0%) |
| Total | 89 (50.3%) | 88 (49.7%) |
Employment Characteristics in Santa Teresa
Employment by Class of Employer in Santa Teresa
Among the 2,638 employed individuals in Santa Teresa, private company employees (1,578 | 59.8%), local government employees (278 | 10.5%), and federal government employees (234 | 8.9%) make up the most common classes of employment.
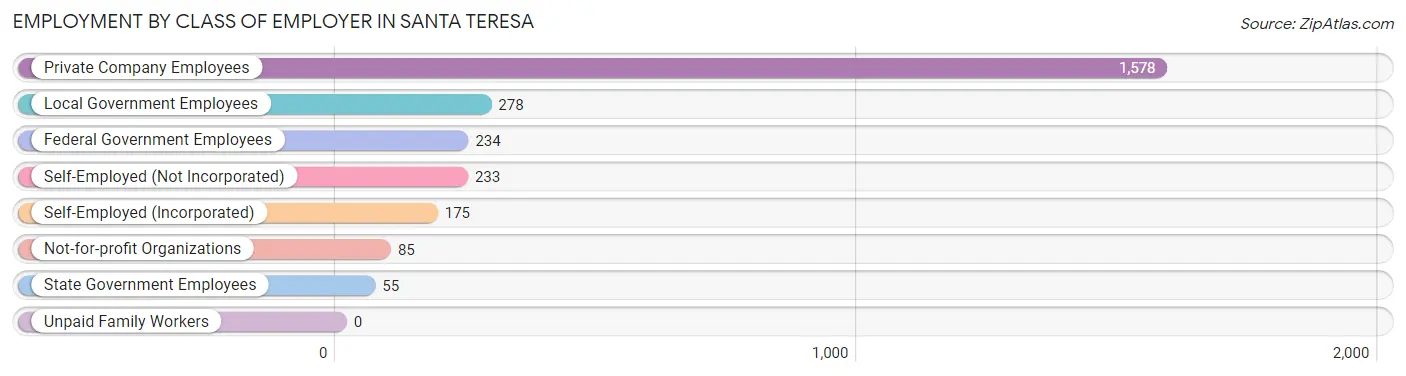
| Employer Class | # Employees | % Employees |
| Private Company Employees | 1,578 | 59.8% |
| Self-Employed (Incorporated) | 175 | 6.6% |
| Self-Employed (Not Incorporated) | 233 | 8.8% |
| Not-for-profit Organizations | 85 | 3.2% |
| Local Government Employees | 278 | 10.5% |
| State Government Employees | 55 | 2.1% |
| Federal Government Employees | 234 | 8.9% |
| Unpaid Family Workers | 0 | 0.0% |
| Total | 2,638 | 100.0% |
Employment Status by Age in Santa Teresa
According to the labor force statistics for Santa Teresa, out of the total population over 16 years of age (4,801), 57.2% or 2,746 individuals are in the labor force, with 2.1% or 58 of them unemployed. The age group with the highest labor force participation rate is 55 to 59 years, with 89.9% or 241 individuals in the labor force. Within the labor force, the 35 to 44 years age range has the highest percentage of unemployed individuals, with 10.0% or 55 of them being unemployed.
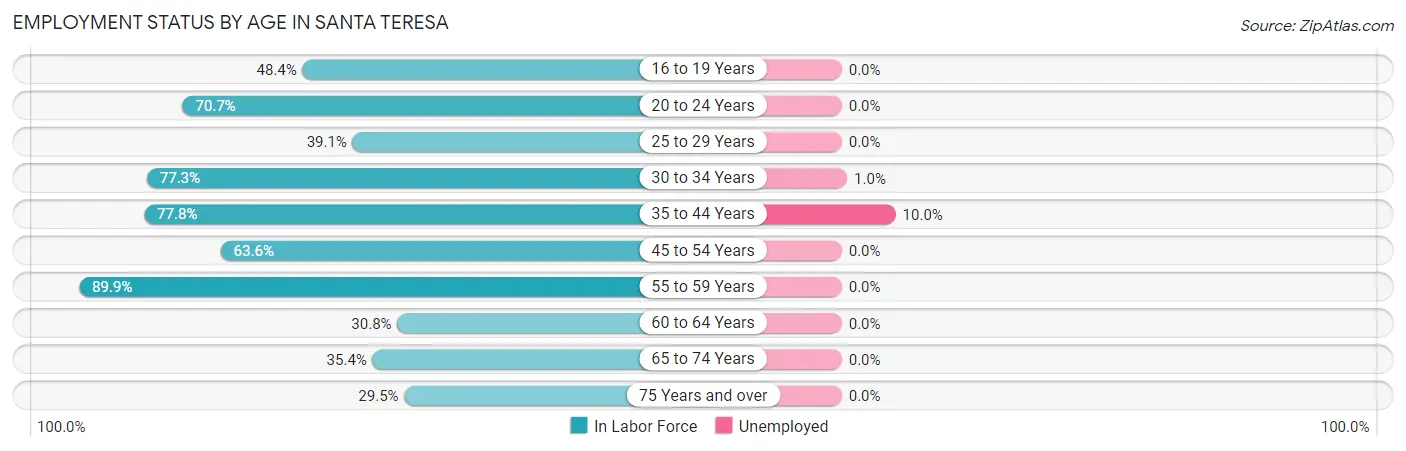
| Age Bracket | In Labor Force | Unemployed |
| 16 to 19 Years | 260 (48.4%) | 0 (0.0%) |
| 20 to 24 Years | 395 (70.7%) | 0 (0.0%) |
| 25 to 29 Years | 155 (39.1%) | 0 (0.0%) |
| 30 to 34 Years | 314 (77.3%) | 3 (1.0%) |
| 35 to 44 Years | 551 (77.8%) | 55 (10.0%) |
| 45 to 54 Years | 431 (63.6%) | 0 (0.0%) |
| 55 to 59 Years | 241 (89.9%) | 0 (0.0%) |
| 60 to 64 Years | 156 (30.8%) | 0 (0.0%) |
| 65 to 74 Years | 137 (35.4%) | 0 (0.0%) |
| 75 Years and over | 105 (29.5%) | 0 (0.0%) |
| Total | 2,746 (57.2%) | 58 (2.1%) |
Employment Status by Educational Attainment in Santa Teresa
According to labor force statistics for Santa Teresa, 62.4% of individuals (1,848) out of the total population between 25 and 64 years of age (2,962) are in the labor force, with 3.1% or 57 of them being unemployed. The group with the highest labor force participation rate are those with the educational attainment of college / associate degree, with 88.1% or 716 individuals in the labor force. Within the labor force, individuals with high school diploma education have the highest percentage of unemployment, with 12.7% or 41 of them being unemployed.
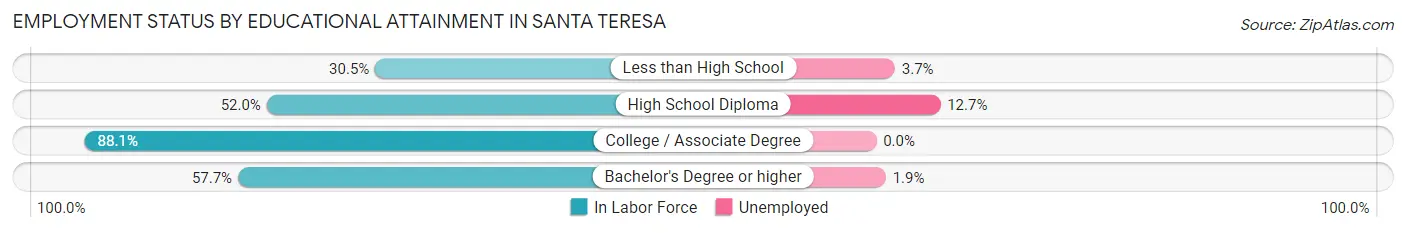
| Educational Attainment | In Labor Force | Unemployed |
| Less than High School | 81 (30.5%) | 10 (3.7%) |
| High School Diploma | 322 (52.0%) | 79 (12.7%) |
| College / Associate Degree | 716 (88.1%) | 0 (0.0%) |
| Bachelor's Degree or higher | 729 (57.7%) | 24 (1.9%) |
| Total | 1,848 (62.4%) | 92 (3.1%) |
Employment Occupations by Sex in Santa Teresa
Management, Business, Science and Arts Occupations
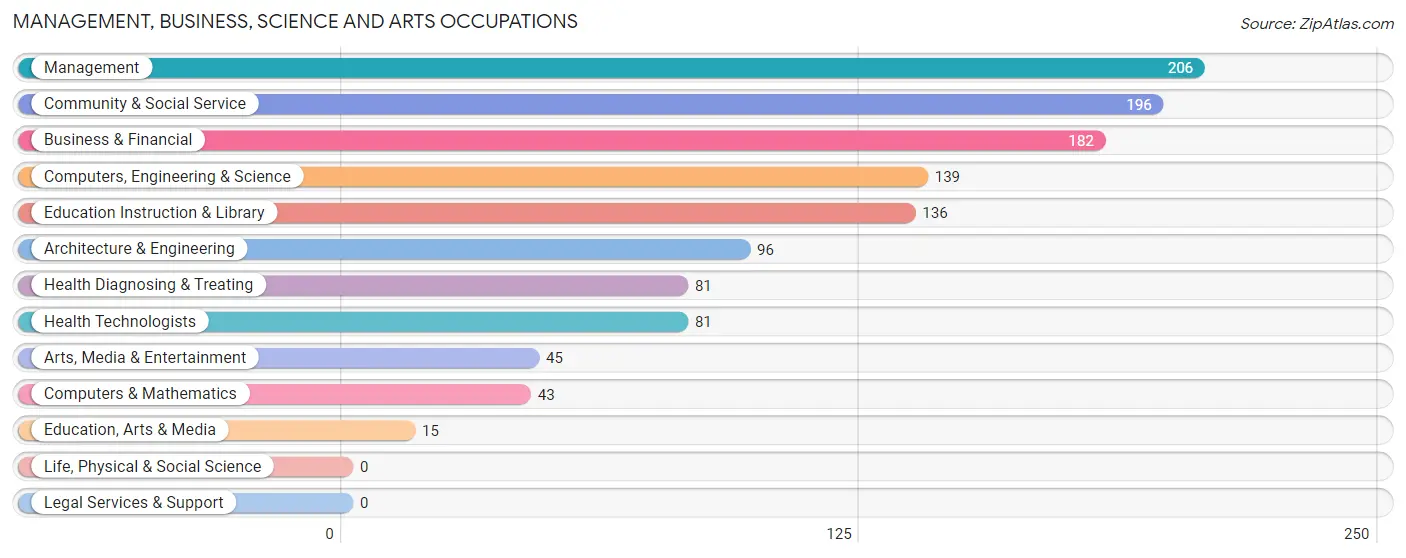
The most common Management, Business, Science and Arts occupations in Santa Teresa are Management (206 | 7.7%), Community & Social Service (196 | 7.3%), Business & Financial (182 | 6.8%), Computers, Engineering & Science (139 | 5.2%), and Education Instruction & Library (136 | 5.1%).
Management, Business, Science and Arts Occupations by Sex
Within the Management, Business, Science and Arts occupations in Santa Teresa, the most male-oriented occupations are Computers, Engineering & Science (100.0%), Computers & Mathematics (100.0%), and Architecture & Engineering (100.0%), while the most female-oriented occupations are Education Instruction & Library (100.0%), Business & Financial (83.0%), and Community & Social Service (80.6%).
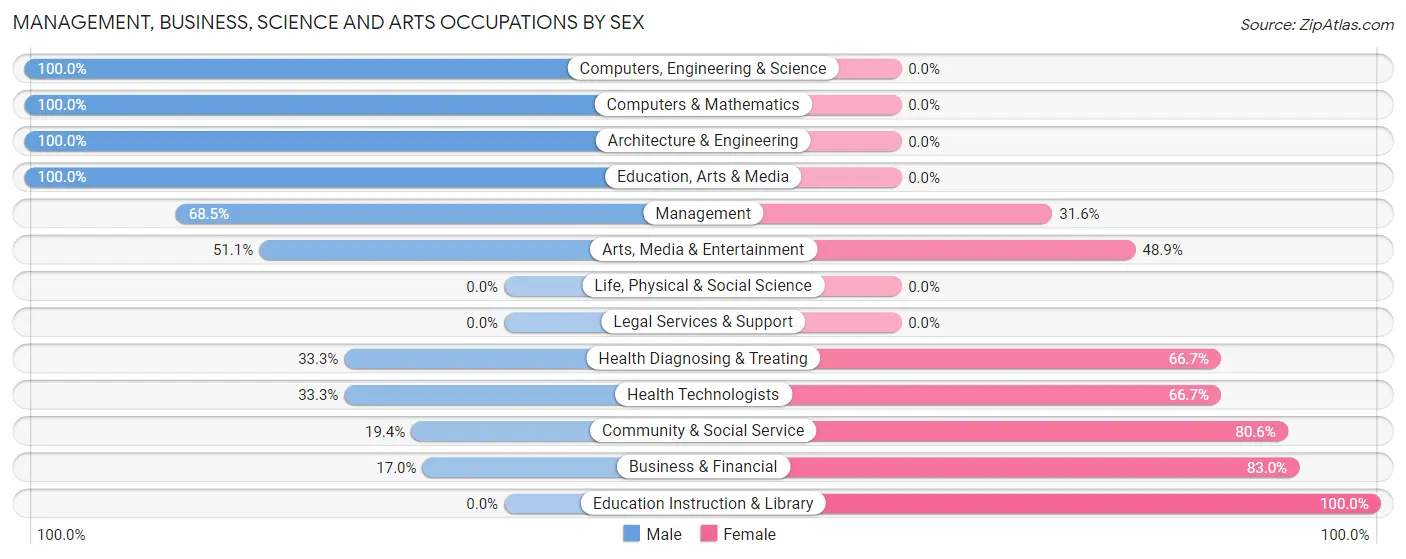
| Occupation | Male | Female |
| Management | 141 (68.4%) | 65 (31.6%) |
| Business & Financial | 31 (17.0%) | 151 (83.0%) |
| Computers, Engineering & Science | 139 (100.0%) | 0 (0.0%) |
| Computers & Mathematics | 43 (100.0%) | 0 (0.0%) |
| Architecture & Engineering | 96 (100.0%) | 0 (0.0%) |
| Life, Physical & Social Science | 0 (0.0%) | 0 (0.0%) |
| Community & Social Service | 38 (19.4%) | 158 (80.6%) |
| Education, Arts & Media | 15 (100.0%) | 0 (0.0%) |
| Legal Services & Support | 0 (0.0%) | 0 (0.0%) |
| Education Instruction & Library | 0 (0.0%) | 136 (100.0%) |
| Arts, Media & Entertainment | 23 (51.1%) | 22 (48.9%) |
| Health Diagnosing & Treating | 27 (33.3%) | 54 (66.7%) |
| Health Technologists | 27 (33.3%) | 54 (66.7%) |
| Total (Category) | 376 (46.8%) | 428 (53.2%) |
| Total (Overall) | 1,494 (55.6%) | 1,193 (44.4%) |
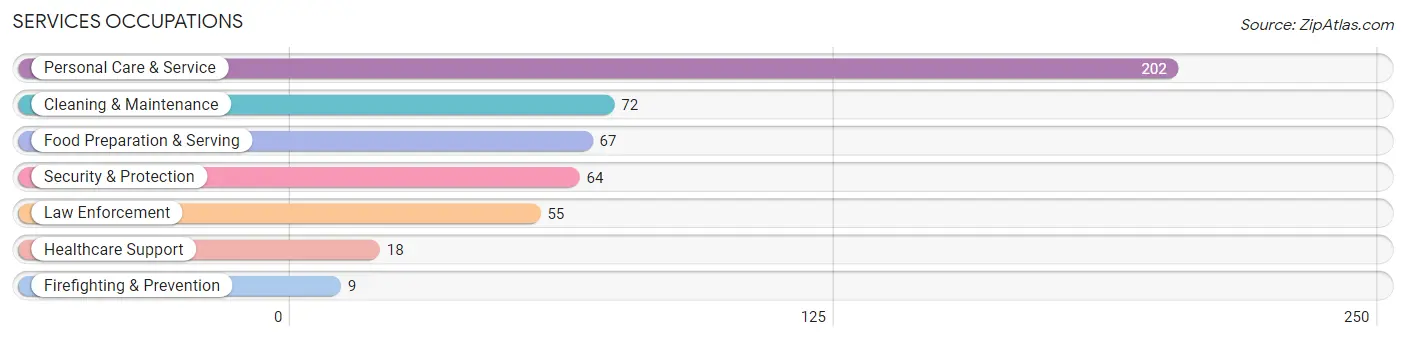
Services Occupations
The most common Services occupations in Santa Teresa are Personal Care & Service (202 | 7.5%), Cleaning & Maintenance (72 | 2.7%), Food Preparation & Serving (67 | 2.5%), Security & Protection (64 | 2.4%), and Law Enforcement (55 | 2.1%).
Services Occupations by Sex
Within the Services occupations in Santa Teresa, the most male-oriented occupations are Security & Protection (100.0%), Firefighting & Prevention (100.0%), and Law Enforcement (100.0%), while the most female-oriented occupations are Healthcare Support (100.0%), Personal Care & Service (83.7%), and Food Preparation & Serving (53.7%).
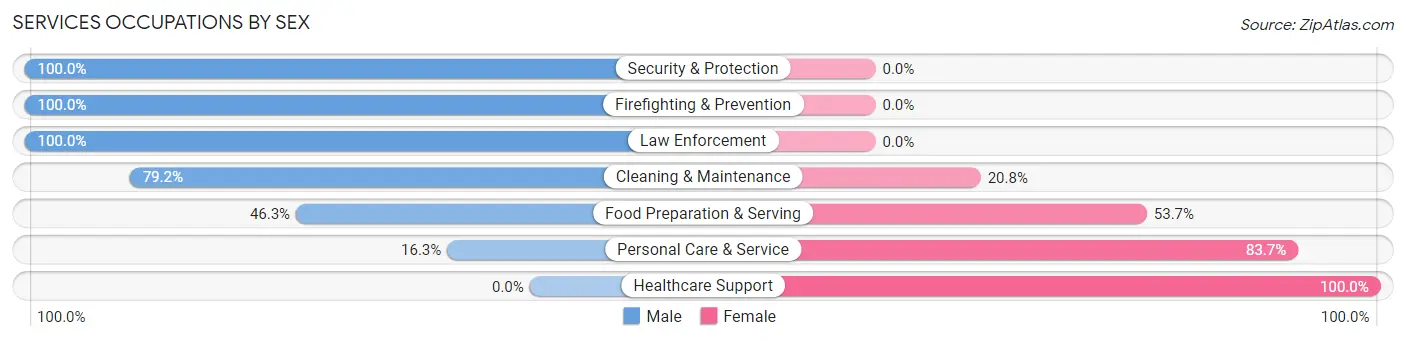
| Occupation | Male | Female |
| Healthcare Support | 0 (0.0%) | 18 (100.0%) |
| Security & Protection | 64 (100.0%) | 0 (0.0%) |
| Firefighting & Prevention | 9 (100.0%) | 0 (0.0%) |
| Law Enforcement | 55 (100.0%) | 0 (0.0%) |
| Food Preparation & Serving | 31 (46.3%) | 36 (53.7%) |
| Cleaning & Maintenance | 57 (79.2%) | 15 (20.8%) |
| Personal Care & Service | 33 (16.3%) | 169 (83.7%) |
| Total (Category) | 185 (43.7%) | 238 (56.3%) |
| Total (Overall) | 1,494 (55.6%) | 1,193 (44.4%) |
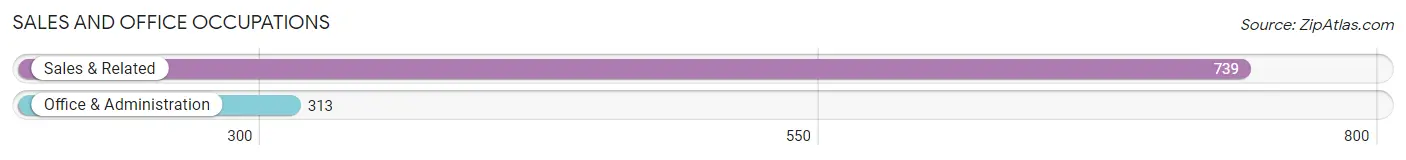
Sales and Office Occupations
The most common Sales and Office occupations in Santa Teresa are Sales & Related (739 | 27.5%), and Office & Administration (313 | 11.7%).
Sales and Office Occupations by Sex
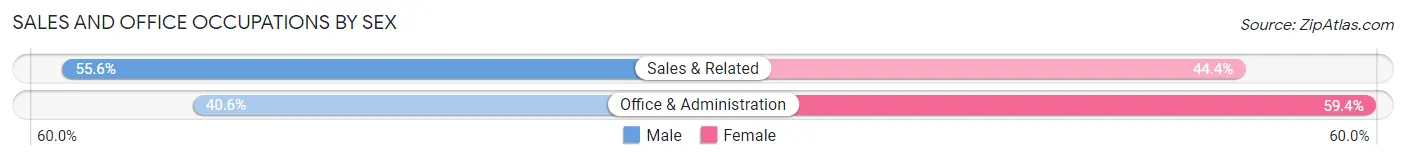
| Occupation | Male | Female |
| Sales & Related | 411 (55.6%) | 328 (44.4%) |
| Office & Administration | 127 (40.6%) | 186 (59.4%) |
| Total (Category) | 538 (51.1%) | 514 (48.9%) |
| Total (Overall) | 1,494 (55.6%) | 1,193 (44.4%) |
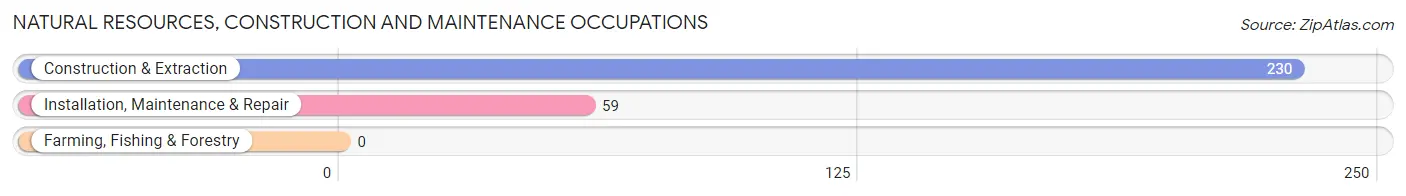
Natural Resources, Construction and Maintenance Occupations
The most common Natural Resources, Construction and Maintenance occupations in Santa Teresa are Construction & Extraction (230 | 8.6%), and Installation, Maintenance & Repair (59 | 2.2%).
Natural Resources, Construction and Maintenance Occupations by Sex
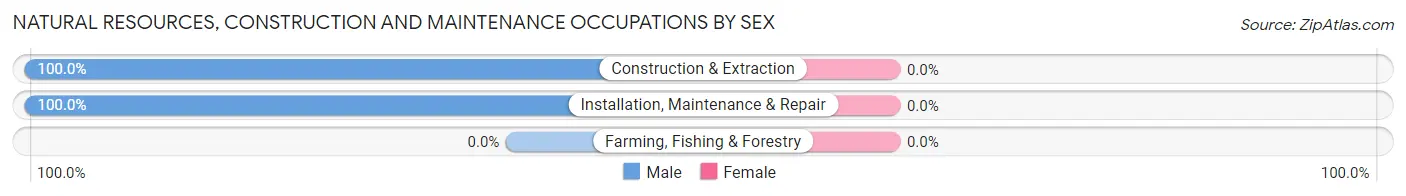
| Occupation | Male | Female |
| Farming, Fishing & Forestry | 0 (0.0%) | 0 (0.0%) |
| Construction & Extraction | 230 (100.0%) | 0 (0.0%) |
| Installation, Maintenance & Repair | 59 (100.0%) | 0 (0.0%) |
| Total (Category) | 289 (100.0%) | 0 (0.0%) |
| Total (Overall) | 1,494 (55.6%) | 1,193 (44.4%) |
Production, Transportation and Moving Occupations
The most common Production, Transportation and Moving occupations in Santa Teresa are Production (69 | 2.6%), Transportation (37 | 1.4%), and Material Moving (13 | 0.5%).
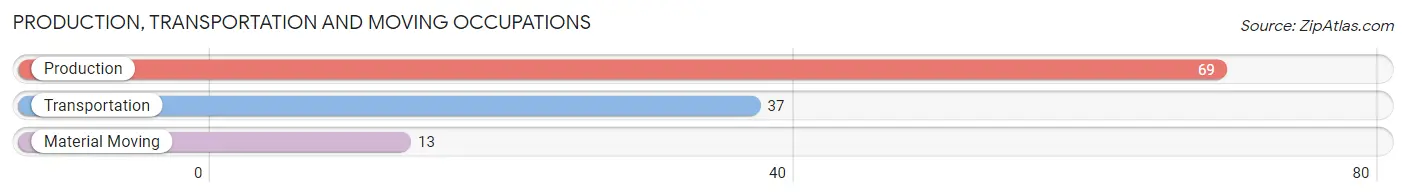
Production, Transportation and Moving Occupations by Sex
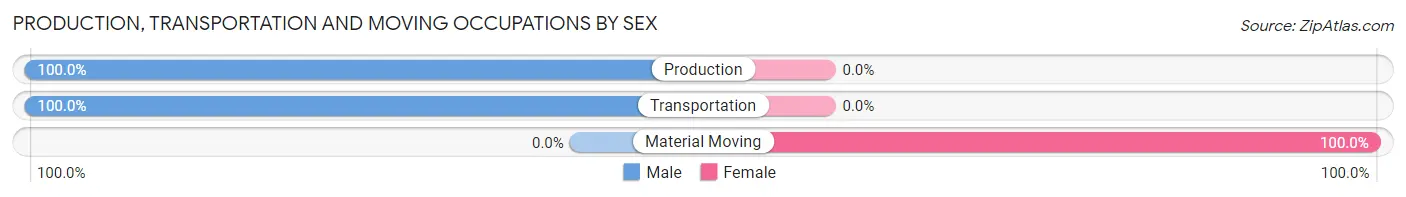
| Occupation | Male | Female |
| Production | 69 (100.0%) | 0 (0.0%) |
| Transportation | 37 (100.0%) | 0 (0.0%) |
| Material Moving | 0 (0.0%) | 13 (100.0%) |
| Total (Category) | 106 (89.1%) | 13 (10.9%) |
| Total (Overall) | 1,494 (55.6%) | 1,193 (44.4%) |
Employment Industries by Sex in Santa Teresa
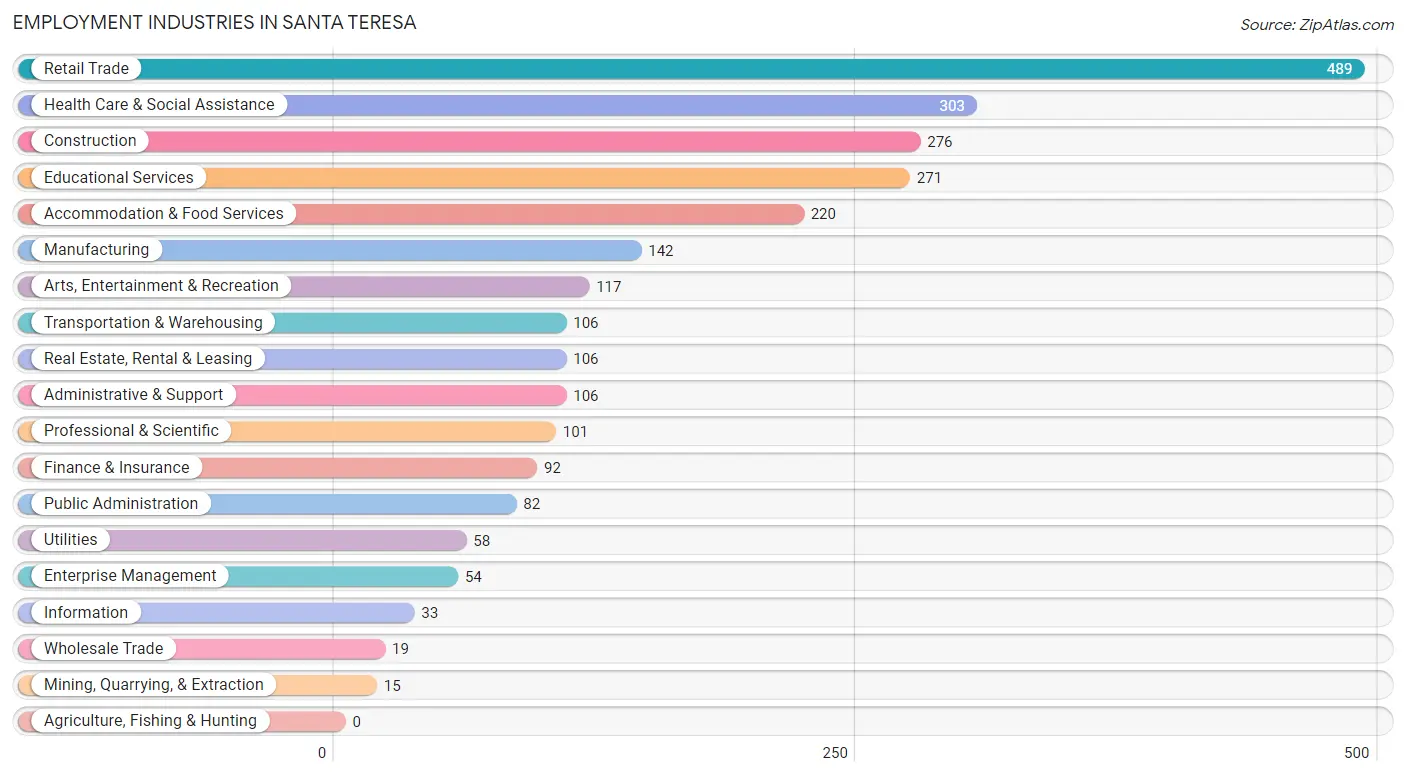
Employment Industries in Santa Teresa
The major employment industries in Santa Teresa include Retail Trade (489 | 18.2%), Health Care & Social Assistance (303 | 11.3%), Construction (276 | 10.3%), Educational Services (271 | 10.1%), and Accommodation & Food Services (220 | 8.2%).
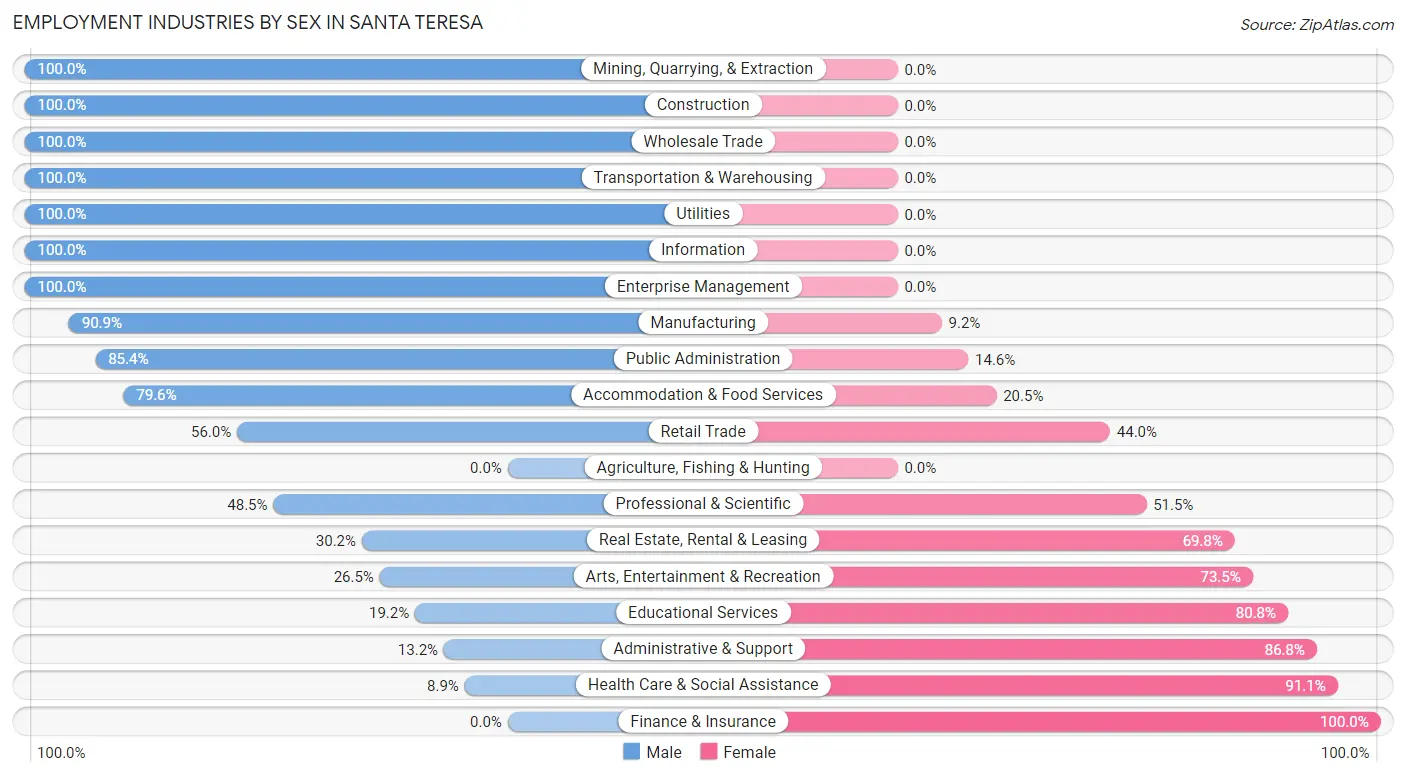
Employment Industries by Sex in Santa Teresa
The Santa Teresa industries that see more men than women are Mining, Quarrying, & Extraction (100.0%), Construction (100.0%), and Wholesale Trade (100.0%), whereas the industries that tend to have a higher number of women are Finance & Insurance (100.0%), Health Care & Social Assistance (91.1%), and Administrative & Support (86.8%).
| Industry | Male | Female |
| Agriculture, Fishing & Hunting | 0 (0.0%) | 0 (0.0%) |
| Mining, Quarrying, & Extraction | 15 (100.0%) | 0 (0.0%) |
| Construction | 276 (100.0%) | 0 (0.0%) |
| Manufacturing | 129 (90.8%) | 13 (9.1%) |
| Wholesale Trade | 19 (100.0%) | 0 (0.0%) |
| Retail Trade | 274 (56.0%) | 215 (44.0%) |
| Transportation & Warehousing | 106 (100.0%) | 0 (0.0%) |
| Utilities | 58 (100.0%) | 0 (0.0%) |
| Information | 33 (100.0%) | 0 (0.0%) |
| Finance & Insurance | 0 (0.0%) | 92 (100.0%) |
| Real Estate, Rental & Leasing | 32 (30.2%) | 74 (69.8%) |
| Professional & Scientific | 49 (48.5%) | 52 (51.5%) |
| Enterprise Management | 54 (100.0%) | 0 (0.0%) |
| Administrative & Support | 14 (13.2%) | 92 (86.8%) |
| Educational Services | 52 (19.2%) | 219 (80.8%) |
| Health Care & Social Assistance | 27 (8.9%) | 276 (91.1%) |
| Arts, Entertainment & Recreation | 31 (26.5%) | 86 (73.5%) |
| Accommodation & Food Services | 175 (79.5%) | 45 (20.4%) |
| Public Administration | 70 (85.4%) | 12 (14.6%) |
| Total | 1,494 (55.6%) | 1,193 (44.4%) |
Education in Santa Teresa
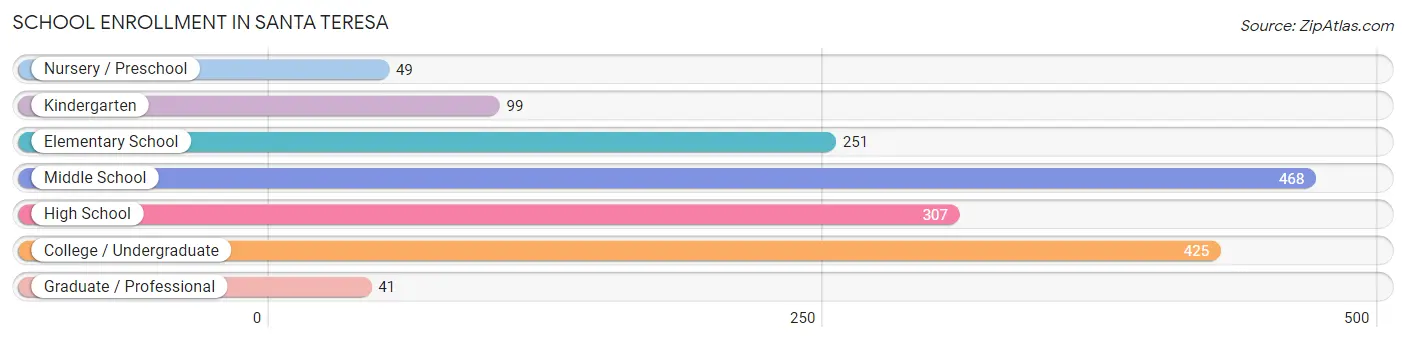
School Enrollment in Santa Teresa
The most common levels of schooling among the 1,640 students in Santa Teresa are middle school (468 | 28.5%), college / undergraduate (425 | 25.9%), and high school (307 | 18.7%).
| School Level | # Students | % Students |
| Nursery / Preschool | 49 | 3.0% |
| Kindergarten | 99 | 6.0% |
| Elementary School | 251 | 15.3% |
| Middle School | 468 | 28.5% |
| High School | 307 | 18.7% |
| College / Undergraduate | 425 | 25.9% |
| Graduate / Professional | 41 | 2.5% |
| Total | 1,640 | 100.0% |
School Enrollment by Age by Funding Source in Santa Teresa
Out of a total of 1,640 students who are enrolled in schools in Santa Teresa, 75 (4.6%) attend a private institution, while the remaining 1,565 (95.4%) are enrolled in public schools. The age group of 35 years and over has the highest likelihood of being enrolled in private schools, with 19 (16.7% in the age bracket) enrolled. Conversely, the age group of 3 to 4 year olds has the lowest likelihood of being enrolled in a private school, with 48 (100.0% in the age bracket) attending a public institution.
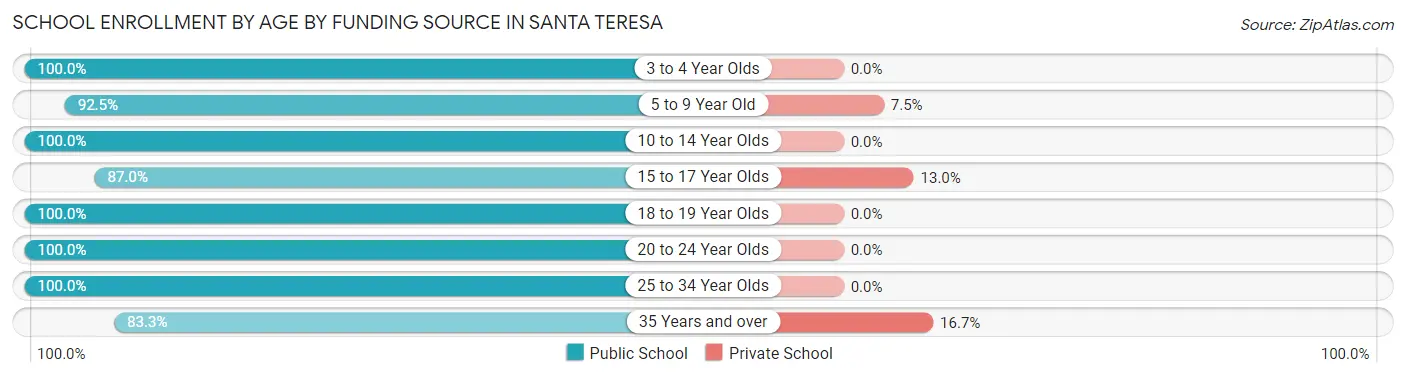
| Age Bracket | Public School | Private School |
| 3 to 4 Year Olds | 48 (100.0%) | 0 (0.0%) |
| 5 to 9 Year Old | 309 (92.5%) | 25 (7.5%) |
| 10 to 14 Year Olds | 523 (100.0%) | 0 (0.0%) |
| 15 to 17 Year Olds | 207 (87.0%) | 31 (13.0%) |
| 18 to 19 Year Olds | 159 (100.0%) | 0 (0.0%) |
| 20 to 24 Year Olds | 151 (100.0%) | 0 (0.0%) |
| 25 to 34 Year Olds | 73 (100.0%) | 0 (0.0%) |
| 35 Years and over | 95 (83.3%) | 19 (16.7%) |
| Total | 1,565 (95.4%) | 75 (4.6%) |
Educational Attainment by Field of Study in Santa Teresa
Bio, nature & agricultural (250 | 15.8%), business (242 | 15.3%), literature & languages (212 | 13.4%), arts & humanities (208 | 13.2%), and science & technology (185 | 11.7%) are the most common fields of study among 1,582 individuals in Santa Teresa who have obtained a bachelor's degree or higher.
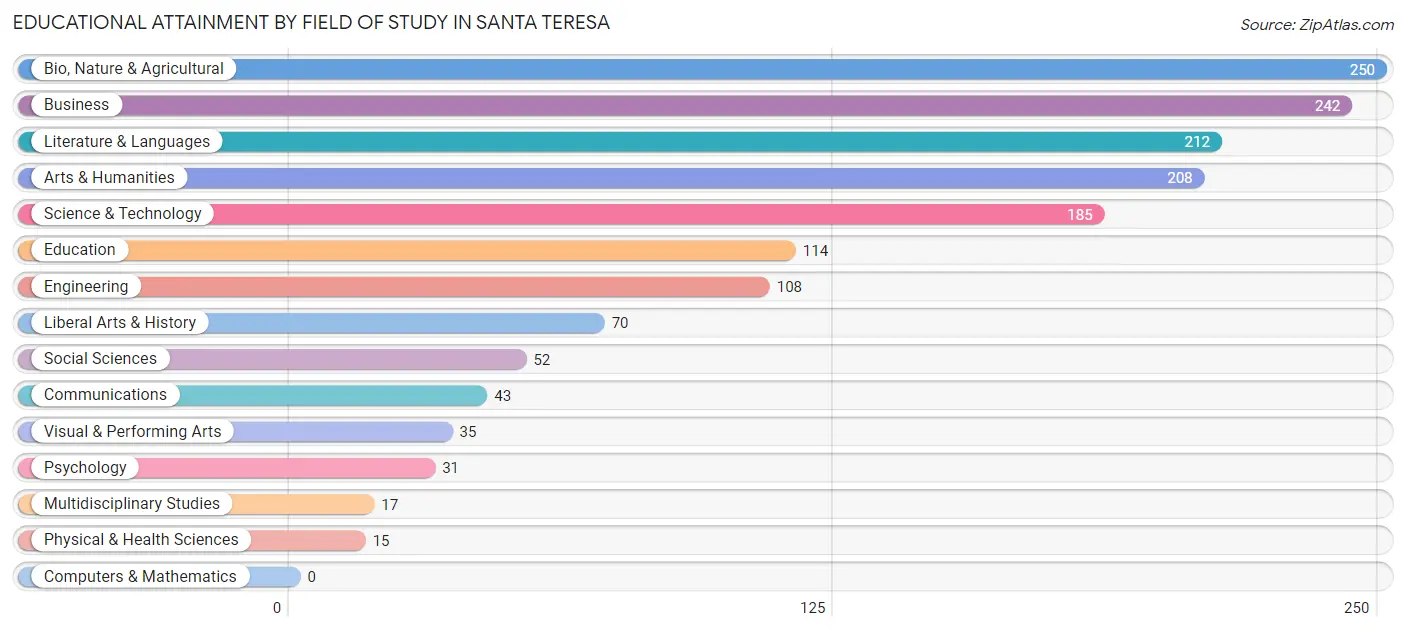
| Field of Study | # Graduates | % Graduates |
| Computers & Mathematics | 0 | 0.0% |
| Bio, Nature & Agricultural | 250 | 15.8% |
| Physical & Health Sciences | 15 | 0.9% |
| Psychology | 31 | 2.0% |
| Social Sciences | 52 | 3.3% |
| Engineering | 108 | 6.8% |
| Multidisciplinary Studies | 17 | 1.1% |
| Science & Technology | 185 | 11.7% |
| Business | 242 | 15.3% |
| Education | 114 | 7.2% |
| Literature & Languages | 212 | 13.4% |
| Liberal Arts & History | 70 | 4.4% |
| Visual & Performing Arts | 35 | 2.2% |
| Communications | 43 | 2.7% |
| Arts & Humanities | 208 | 13.2% |
| Total | 1,582 | 100.0% |
Transportation & Commute in Santa Teresa
Vehicle Availability by Sex in Santa Teresa
The most prevalent vehicle ownership categories in Santa Teresa are males with 3 vehicles (627, accounting for 43.4%) and females with 3 vehicles (368, making up 52.6%).
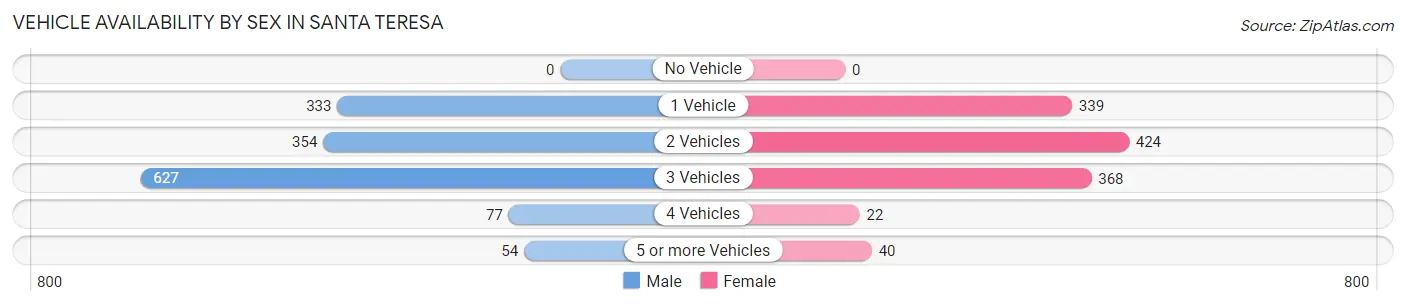
| Vehicles Available | Male | Female |
| No Vehicle | 0 (0.0%) | 0 (0.0%) |
| 1 Vehicle | 333 (23.0%) | 339 (28.4%) |
| 2 Vehicles | 354 (24.5%) | 424 (35.5%) |
| 3 Vehicles | 627 (43.4%) | 368 (30.8%) |
| 4 Vehicles | 77 (5.3%) | 22 (1.8%) |
| 5 or more Vehicles | 54 (3.7%) | 40 (3.4%) |
| Total | 1,445 (100.0%) | 1,193 (100.0%) |
Commute Time in Santa Teresa
The most frequently occuring commute durations in Santa Teresa are 15 to 19 minutes (472 commuters, 19.3%), 5 to 9 minutes (378 commuters, 15.4%), and 30 to 34 minutes (364 commuters, 14.9%).
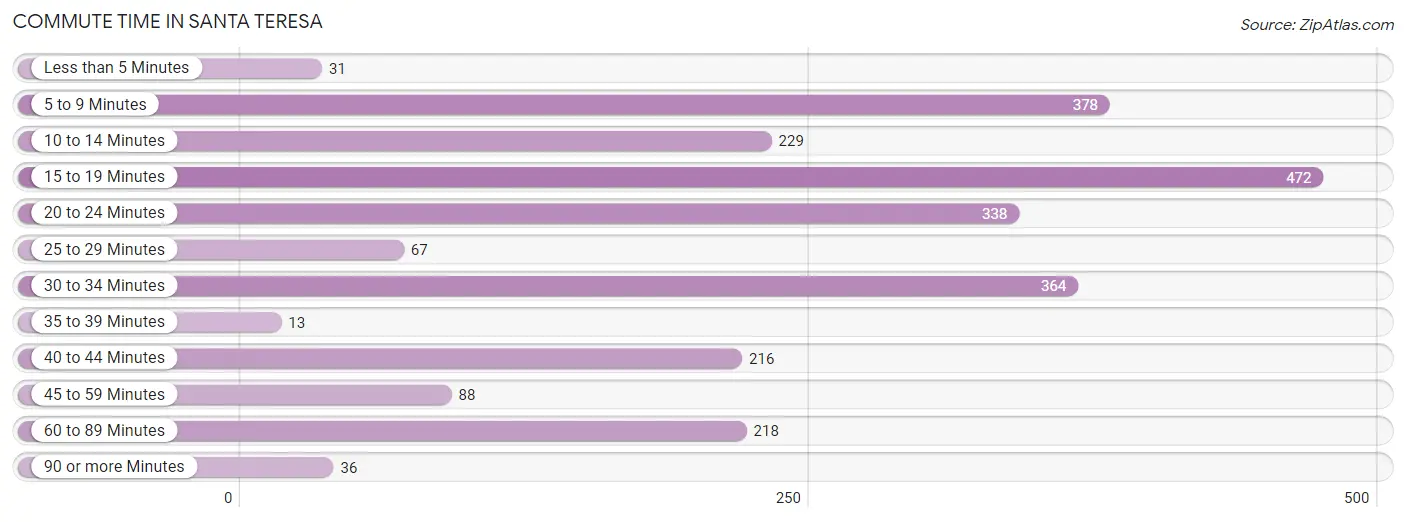
| Commute Time | # Commuters | % Commuters |
| Less than 5 Minutes | 31 | 1.3% |
| 5 to 9 Minutes | 378 | 15.4% |
| 10 to 14 Minutes | 229 | 9.3% |
| 15 to 19 Minutes | 472 | 19.3% |
| 20 to 24 Minutes | 338 | 13.8% |
| 25 to 29 Minutes | 67 | 2.7% |
| 30 to 34 Minutes | 364 | 14.9% |
| 35 to 39 Minutes | 13 | 0.5% |
| 40 to 44 Minutes | 216 | 8.8% |
| 45 to 59 Minutes | 88 | 3.6% |
| 60 to 89 Minutes | 218 | 8.9% |
| 90 or more Minutes | 36 | 1.5% |
Commute Time by Sex in Santa Teresa
The most common commute times in Santa Teresa are 15 to 19 minutes (303 commuters, 22.5%) for males and 30 to 34 minutes (275 commuters, 24.9%) for females.
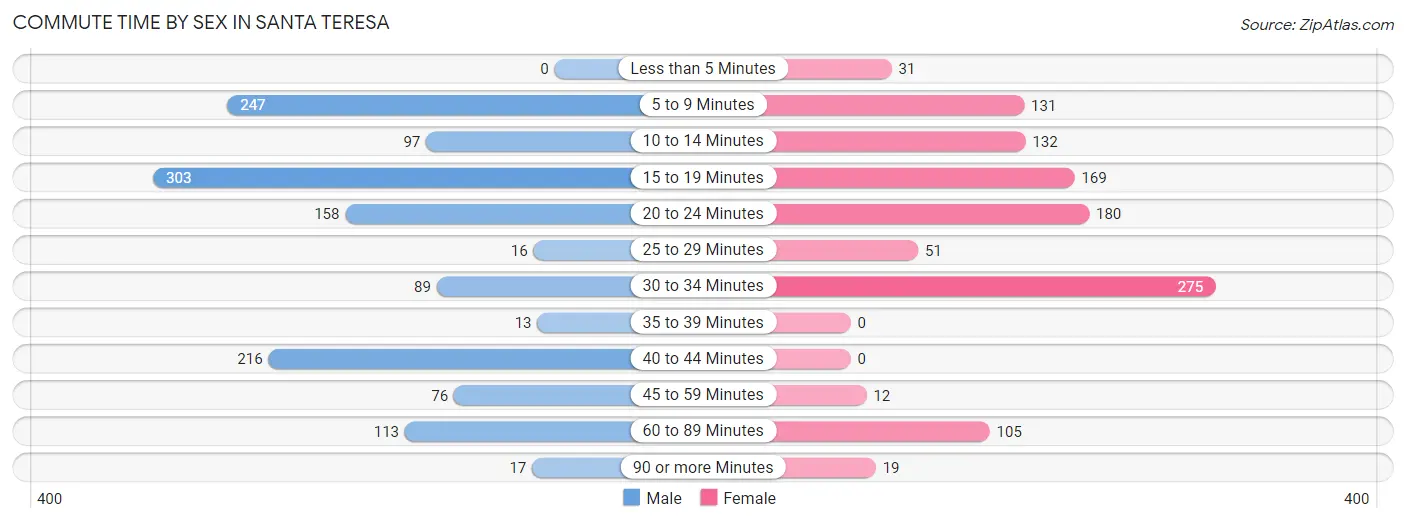
| Commute Time | Male | Female |
| Less than 5 Minutes | 0 (0.0%) | 31 (2.8%) |
| 5 to 9 Minutes | 247 (18.4%) | 131 (11.9%) |
| 10 to 14 Minutes | 97 (7.2%) | 132 (11.9%) |
| 15 to 19 Minutes | 303 (22.5%) | 169 (15.3%) |
| 20 to 24 Minutes | 158 (11.7%) | 180 (16.3%) |
| 25 to 29 Minutes | 16 (1.2%) | 51 (4.6%) |
| 30 to 34 Minutes | 89 (6.6%) | 275 (24.9%) |
| 35 to 39 Minutes | 13 (1.0%) | 0 (0.0%) |
| 40 to 44 Minutes | 216 (16.1%) | 0 (0.0%) |
| 45 to 59 Minutes | 76 (5.7%) | 12 (1.1%) |
| 60 to 89 Minutes | 113 (8.4%) | 105 (9.5%) |
| 90 or more Minutes | 17 (1.3%) | 19 (1.7%) |
Time of Departure to Work by Sex in Santa Teresa
The most frequent times of departure to work in Santa Teresa are 5:00 AM to 5:29 AM (258, 19.2%) for males and 11:00 AM to 11:59 AM (183, 16.6%) for females.
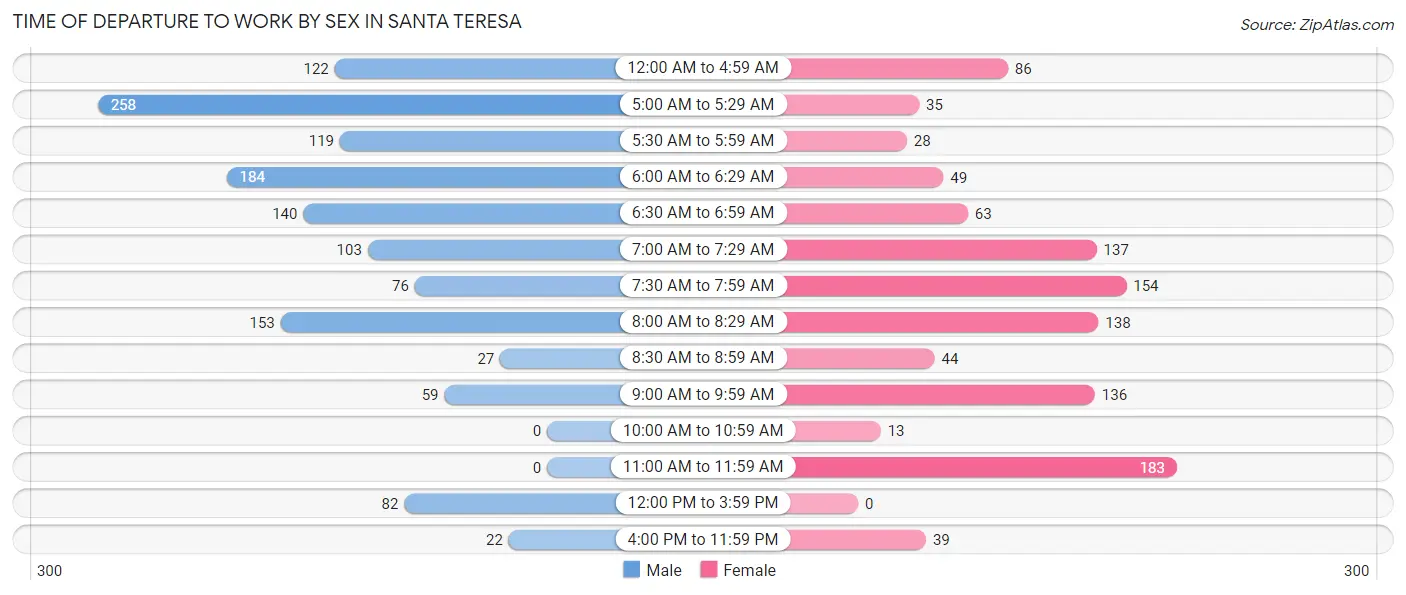
| Time of Departure | Male | Female |
| 12:00 AM to 4:59 AM | 122 (9.1%) | 86 (7.8%) |
| 5:00 AM to 5:29 AM | 258 (19.2%) | 35 (3.2%) |
| 5:30 AM to 5:59 AM | 119 (8.8%) | 28 (2.5%) |
| 6:00 AM to 6:29 AM | 184 (13.7%) | 49 (4.4%) |
| 6:30 AM to 6:59 AM | 140 (10.4%) | 63 (5.7%) |
| 7:00 AM to 7:29 AM | 103 (7.7%) | 137 (12.4%) |
| 7:30 AM to 7:59 AM | 76 (5.7%) | 154 (13.9%) |
| 8:00 AM to 8:29 AM | 153 (11.4%) | 138 (12.5%) |
| 8:30 AM to 8:59 AM | 27 (2.0%) | 44 (4.0%) |
| 9:00 AM to 9:59 AM | 59 (4.4%) | 136 (12.3%) |
| 10:00 AM to 10:59 AM | 0 (0.0%) | 13 (1.2%) |
| 11:00 AM to 11:59 AM | 0 (0.0%) | 183 (16.6%) |
| 12:00 PM to 3:59 PM | 82 (6.1%) | 0 (0.0%) |
| 4:00 PM to 11:59 PM | 22 (1.6%) | 39 (3.5%) |
| Total | 1,345 (100.0%) | 1,105 (100.0%) |
Housing Occupancy in Santa Teresa
Occupancy by Ownership in Santa Teresa
Of the total 2,233 dwellings in Santa Teresa, owner-occupied units account for 1,552 (69.5%), while renter-occupied units make up 681 (30.5%).
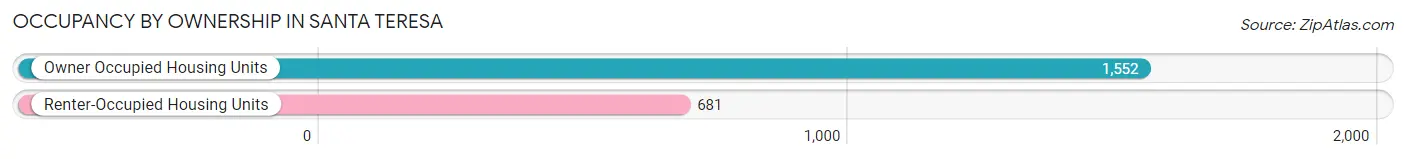
| Occupancy | # Housing Units | % Housing Units |
| Owner Occupied Housing Units | 1,552 | 69.5% |
| Renter-Occupied Housing Units | 681 | 30.5% |
| Total Occupied Housing Units | 2,233 | 100.0% |
Occupancy by Household Size in Santa Teresa
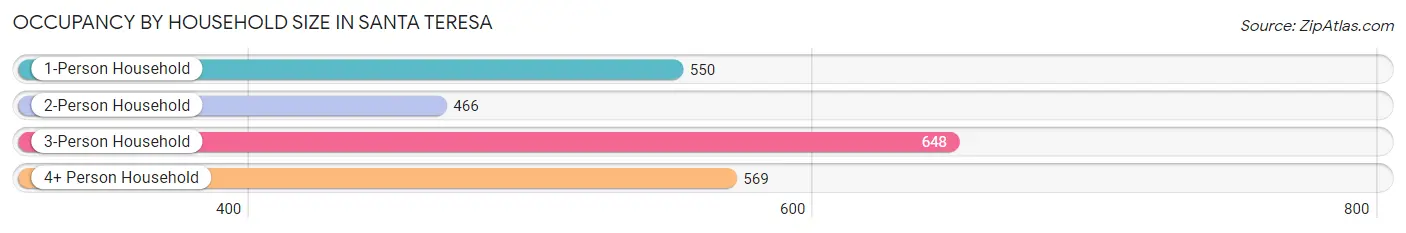
| Household Size | # Housing Units | % Housing Units |
| 1-Person Household | 550 | 24.6% |
| 2-Person Household | 466 | 20.9% |
| 3-Person Household | 648 | 29.0% |
| 4+ Person Household | 569 | 25.5% |
| Total Housing Units | 2,233 | 100.0% |
Occupancy by Ownership by Household Size in Santa Teresa
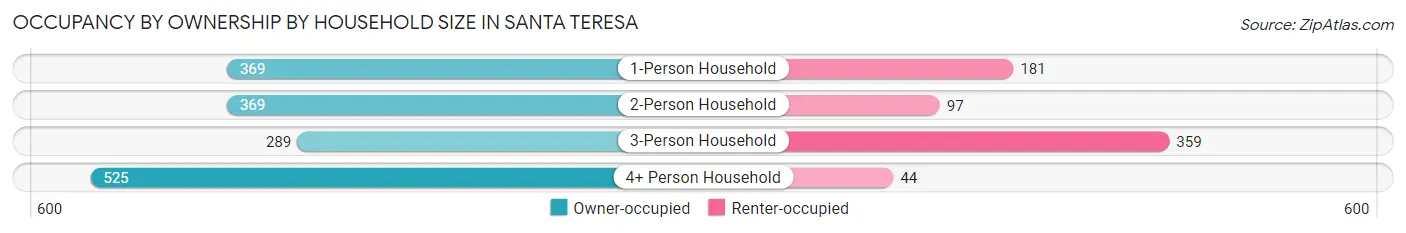
| Household Size | Owner-occupied | Renter-occupied |
| 1-Person Household | 369 (67.1%) | 181 (32.9%) |
| 2-Person Household | 369 (79.2%) | 97 (20.8%) |
| 3-Person Household | 289 (44.6%) | 359 (55.4%) |
| 4+ Person Household | 525 (92.3%) | 44 (7.7%) |
| Total Housing Units | 1,552 (69.5%) | 681 (30.5%) |
Occupancy by Educational Attainment in Santa Teresa
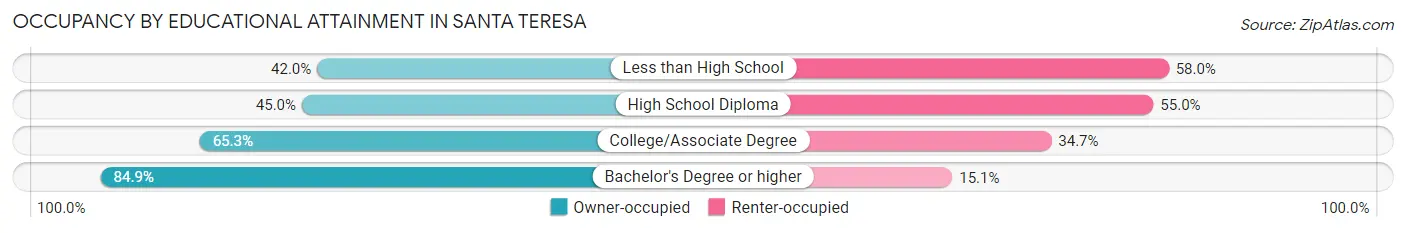
| Household Size | Owner-occupied | Renter-occupied |
| Less than High School | 105 (42.0%) | 145 (58.0%) |
| High School Diploma | 77 (45.0%) | 94 (55.0%) |
| College/Associate Degree | 560 (65.3%) | 298 (34.7%) |
| Bachelor's Degree or higher | 810 (84.9%) | 144 (15.1%) |
Occupancy by Age of Householder in Santa Teresa
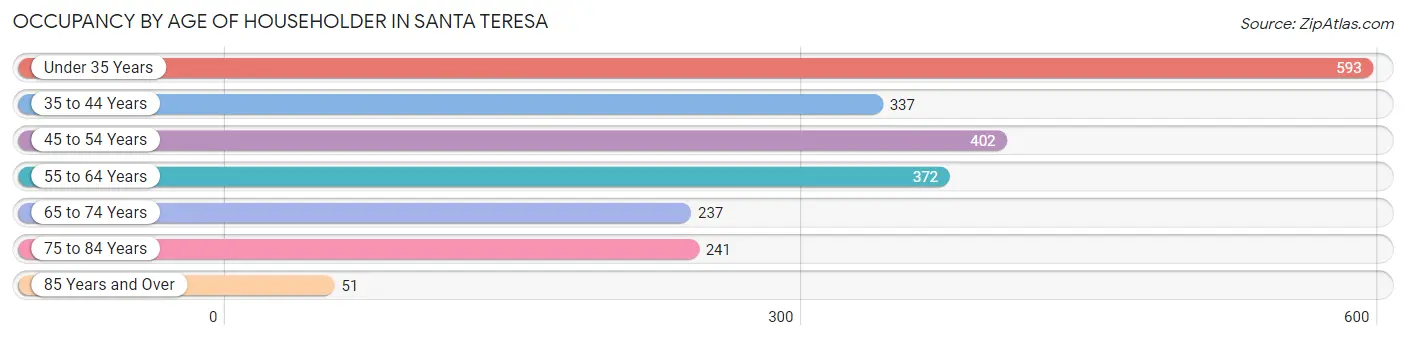
| Age Bracket | # Households | % Households |
| Under 35 Years | 593 | 26.6% |
| 35 to 44 Years | 337 | 15.1% |
| 45 to 54 Years | 402 | 18.0% |
| 55 to 64 Years | 372 | 16.7% |
| 65 to 74 Years | 237 | 10.6% |
| 75 to 84 Years | 241 | 10.8% |
| 85 Years and Over | 51 | 2.3% |
| Total | 2,233 | 100.0% |
Housing Finances in Santa Teresa
Median Income by Occupancy in Santa Teresa
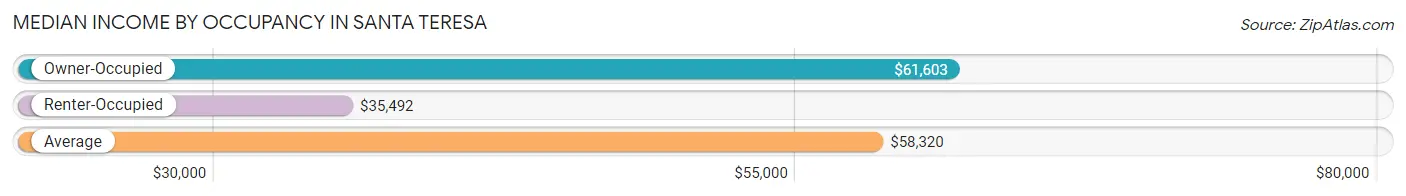
| Occupancy Type | # Households | Median Income |
| Owner-Occupied | 1,552 (69.5%) | $61,603 |
| Renter-Occupied | 681 (30.5%) | $35,492 |
| Average | 2,233 (100.0%) | $58,320 |
Occupancy by Householder Income Bracket in Santa Teresa
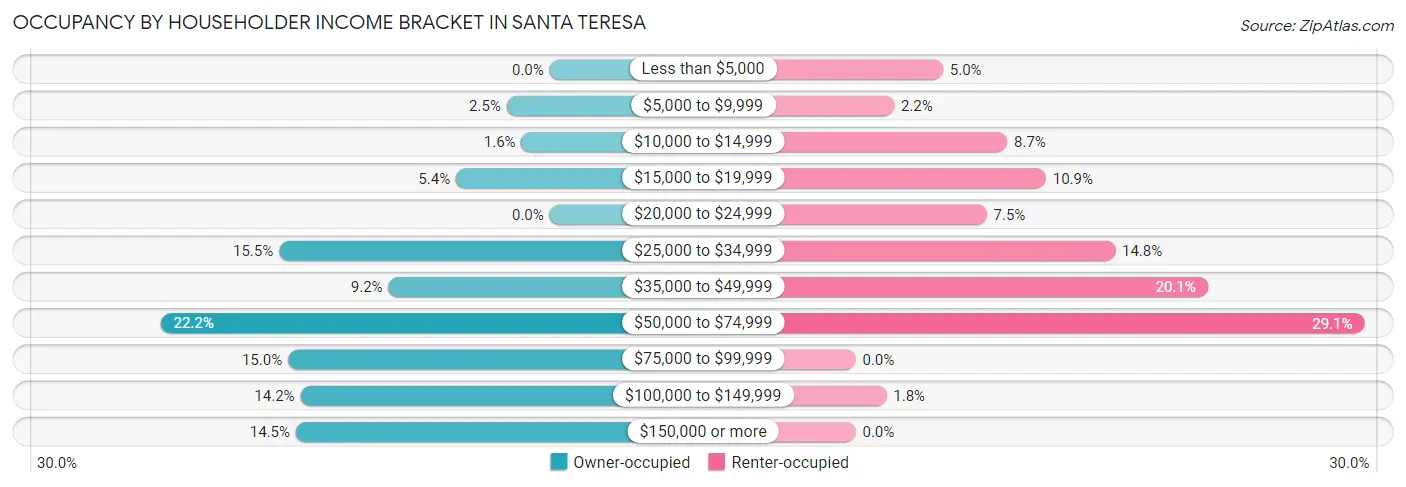
| Income Bracket | Owner-occupied | Renter-occupied |
| Less than $5,000 | 0 (0.0%) | 34 (5.0%) |
| $5,000 to $9,999 | 38 (2.5%) | 15 (2.2%) |
| $10,000 to $14,999 | 25 (1.6%) | 59 (8.7%) |
| $15,000 to $19,999 | 83 (5.3%) | 74 (10.9%) |
| $20,000 to $24,999 | 0 (0.0%) | 51 (7.5%) |
| $25,000 to $34,999 | 240 (15.5%) | 101 (14.8%) |
| $35,000 to $49,999 | 143 (9.2%) | 137 (20.1%) |
| $50,000 to $74,999 | 345 (22.2%) | 198 (29.1%) |
| $75,000 to $99,999 | 232 (14.9%) | 0 (0.0%) |
| $100,000 to $149,999 | 221 (14.2%) | 12 (1.8%) |
| $150,000 or more | 225 (14.5%) | 0 (0.0%) |
| Total | 1,552 (100.0%) | 681 (100.0%) |
Monthly Housing Cost Tiers in Santa Teresa
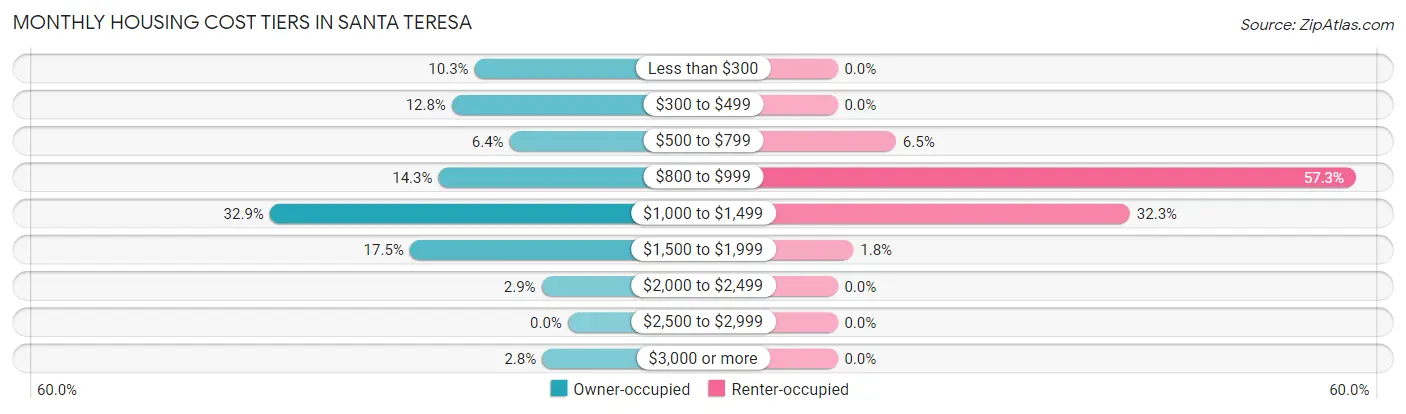
| Monthly Cost | Owner-occupied | Renter-occupied |
| Less than $300 | 160 (10.3%) | 0 (0.0%) |
| $300 to $499 | 199 (12.8%) | 0 (0.0%) |
| $500 to $799 | 100 (6.4%) | 44 (6.5%) |
| $800 to $999 | 222 (14.3%) | 390 (57.3%) |
| $1,000 to $1,499 | 511 (32.9%) | 220 (32.3%) |
| $1,500 to $1,999 | 271 (17.5%) | 12 (1.8%) |
| $2,000 to $2,499 | 45 (2.9%) | 0 (0.0%) |
| $2,500 to $2,999 | 0 (0.0%) | 0 (0.0%) |
| $3,000 or more | 44 (2.8%) | 0 (0.0%) |
| Total | 1,552 (100.0%) | 681 (100.0%) |
Physical Housing Characteristics in Santa Teresa
Housing Structures in Santa Teresa
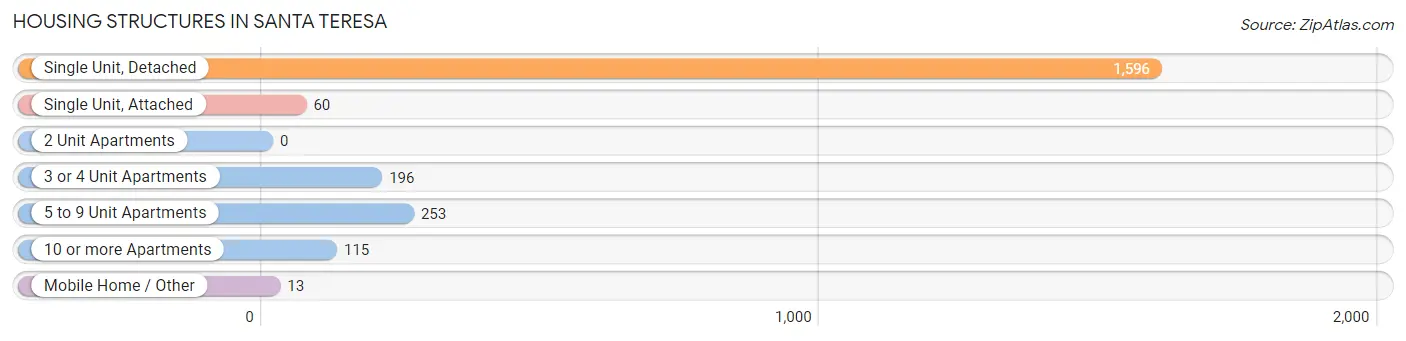
| Structure Type | # Housing Units | % Housing Units |
| Single Unit, Detached | 1,596 | 71.5% |
| Single Unit, Attached | 60 | 2.7% |
| 2 Unit Apartments | 0 | 0.0% |
| 3 or 4 Unit Apartments | 196 | 8.8% |
| 5 to 9 Unit Apartments | 253 | 11.3% |
| 10 or more Apartments | 115 | 5.1% |
| Mobile Home / Other | 13 | 0.6% |
| Total | 2,233 | 100.0% |
Housing Structures by Occupancy in Santa Teresa
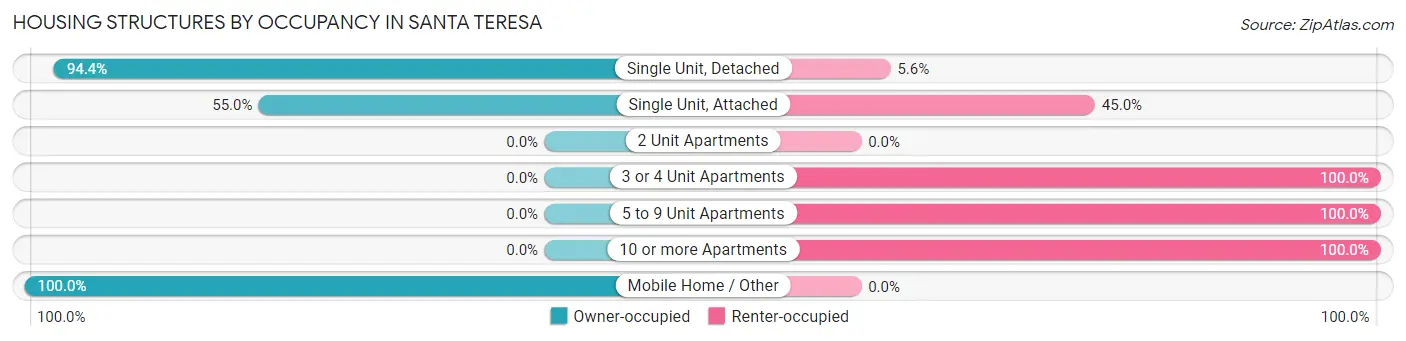
| Structure Type | Owner-occupied | Renter-occupied |
| Single Unit, Detached | 1,506 (94.4%) | 90 (5.6%) |
| Single Unit, Attached | 33 (55.0%) | 27 (45.0%) |
| 2 Unit Apartments | 0 (0.0%) | 0 (0.0%) |
| 3 or 4 Unit Apartments | 0 (0.0%) | 196 (100.0%) |
| 5 to 9 Unit Apartments | 0 (0.0%) | 253 (100.0%) |
| 10 or more Apartments | 0 (0.0%) | 115 (100.0%) |
| Mobile Home / Other | 13 (100.0%) | 0 (0.0%) |
| Total | 1,552 (69.5%) | 681 (30.5%) |
Housing Structures by Number of Rooms in Santa Teresa
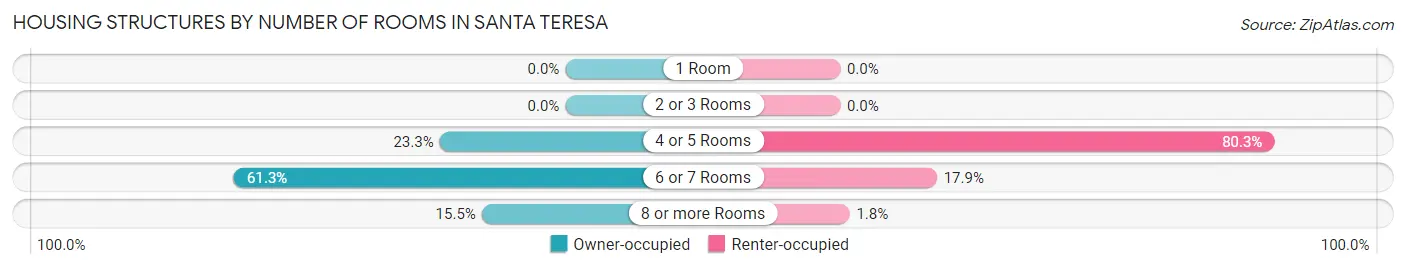
| Number of Rooms | Owner-occupied | Renter-occupied |
| 1 Room | 0 (0.0%) | 0 (0.0%) |
| 2 or 3 Rooms | 0 (0.0%) | 0 (0.0%) |
| 4 or 5 Rooms | 361 (23.3%) | 547 (80.3%) |
| 6 or 7 Rooms | 951 (61.3%) | 122 (17.9%) |
| 8 or more Rooms | 240 (15.5%) | 12 (1.8%) |
| Total | 1,552 (100.0%) | 681 (100.0%) |
Housing Structure by Heating Type in Santa Teresa
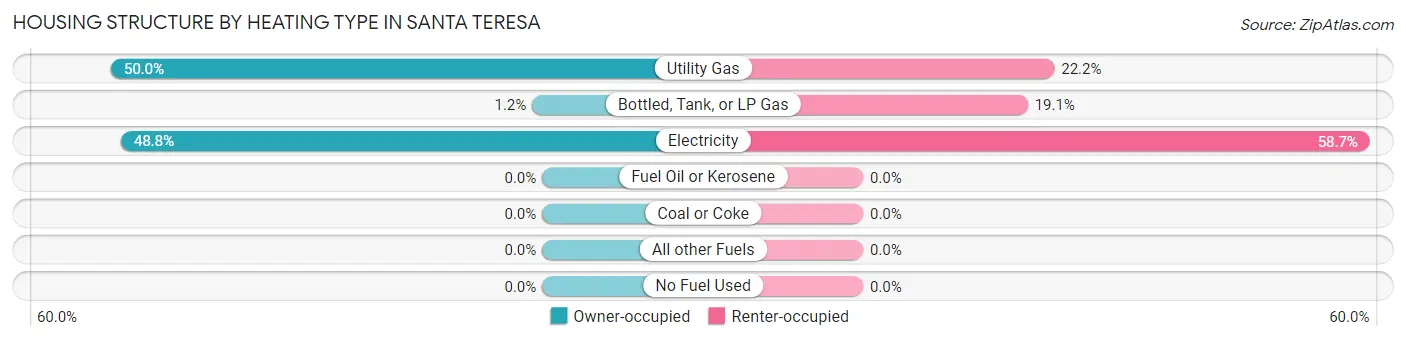
| Heating Type | Owner-occupied | Renter-occupied |
| Utility Gas | 776 (50.0%) | 151 (22.2%) |
| Bottled, Tank, or LP Gas | 18 (1.2%) | 130 (19.1%) |
| Electricity | 758 (48.8%) | 400 (58.7%) |
| Fuel Oil or Kerosene | 0 (0.0%) | 0 (0.0%) |
| Coal or Coke | 0 (0.0%) | 0 (0.0%) |
| All other Fuels | 0 (0.0%) | 0 (0.0%) |
| No Fuel Used | 0 (0.0%) | 0 (0.0%) |
| Total | 1,552 (100.0%) | 681 (100.0%) |
Household Vehicle Usage in Santa Teresa
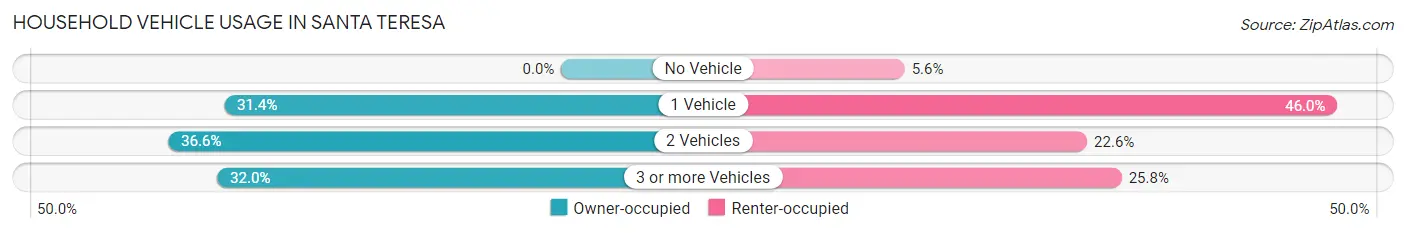
| Vehicles per Household | Owner-occupied | Renter-occupied |
| No Vehicle | 0 (0.0%) | 38 (5.6%) |
| 1 Vehicle | 487 (31.4%) | 313 (46.0%) |
| 2 Vehicles | 568 (36.6%) | 154 (22.6%) |
| 3 or more Vehicles | 497 (32.0%) | 176 (25.8%) |
| Total | 1,552 (100.0%) | 681 (100.0%) |
Real Estate & Mortgages in Santa Teresa
Real Estate and Mortgage Overview in Santa Teresa
| Characteristic | Without Mortgage | With Mortgage |
| Housing Units | 410 | 1,142 |
| Median Property Value | $196,000 | $217,600 |
| Median Household Income | - | - |
| Monthly Housing Costs | $401 | $44 |
| Real Estate Taxes | $2,239 | $1 |
Property Value by Mortgage Status in Santa Teresa
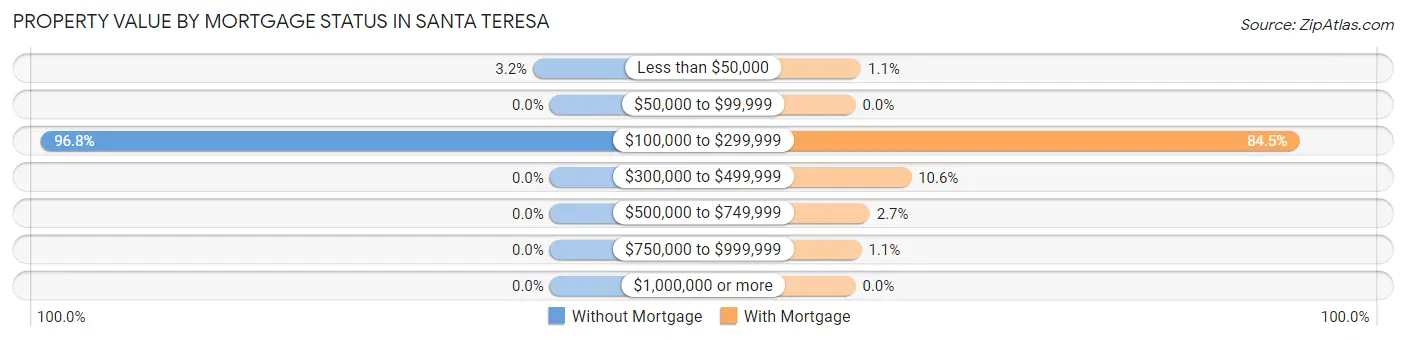
| Property Value | Without Mortgage | With Mortgage |
| Less than $50,000 | 13 (3.2%) | 12 (1.1%) |
| $50,000 to $99,999 | 0 (0.0%) | 0 (0.0%) |
| $100,000 to $299,999 | 397 (96.8%) | 965 (84.5%) |
| $300,000 to $499,999 | 0 (0.0%) | 121 (10.6%) |
| $500,000 to $749,999 | 0 (0.0%) | 31 (2.7%) |
| $750,000 to $999,999 | 0 (0.0%) | 13 (1.1%) |
| $1,000,000 or more | 0 (0.0%) | 0 (0.0%) |
| Total | 410 (100.0%) | 1,142 (100.0%) |
Household Income by Mortgage Status in Santa Teresa
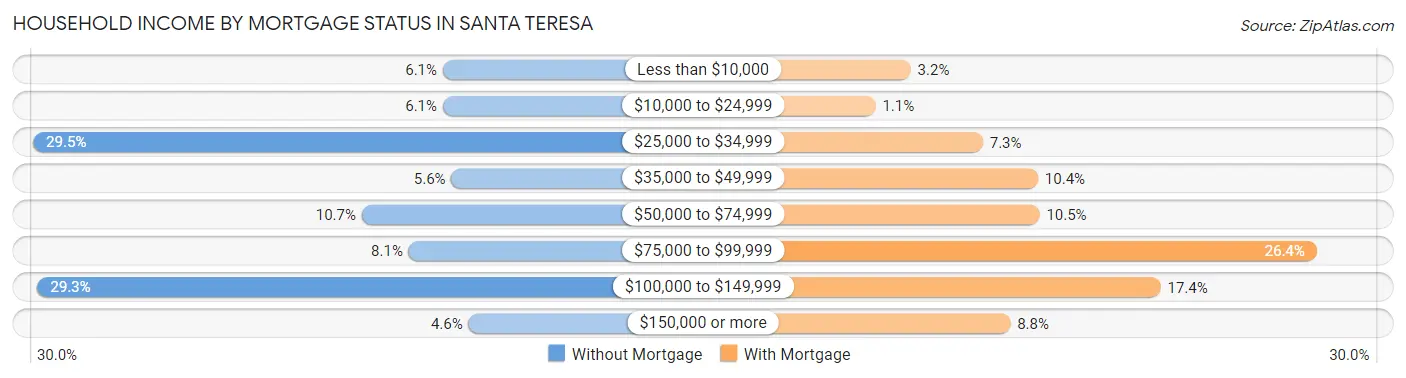
| Household Income | Without Mortgage | With Mortgage |
| Less than $10,000 | 25 (6.1%) | 36 (3.2%) |
| $10,000 to $24,999 | 25 (6.1%) | 13 (1.1%) |
| $25,000 to $34,999 | 121 (29.5%) | 83 (7.3%) |
| $35,000 to $49,999 | 23 (5.6%) | 119 (10.4%) |
| $50,000 to $74,999 | 44 (10.7%) | 120 (10.5%) |
| $75,000 to $99,999 | 33 (8.1%) | 301 (26.4%) |
| $100,000 to $149,999 | 120 (29.3%) | 199 (17.4%) |
| $150,000 or more | 19 (4.6%) | 101 (8.8%) |
| Total | 410 (100.0%) | 1,142 (100.0%) |
Property Value to Household Income Ratio in Santa Teresa
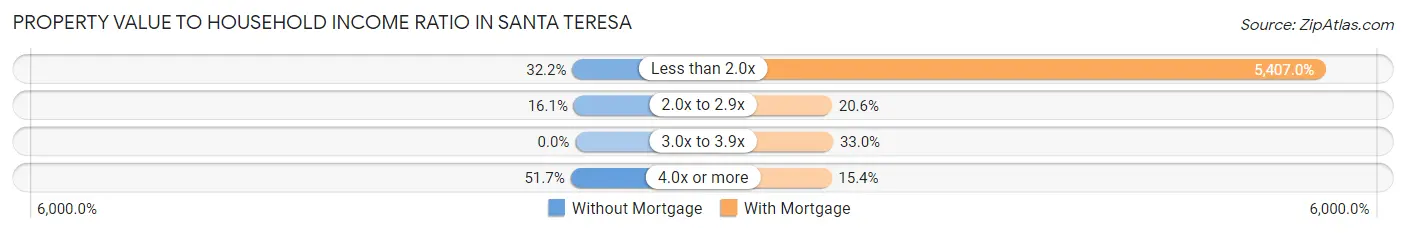
| Value-to-Income Ratio | Without Mortgage | With Mortgage |
| Less than 2.0x | 132 (32.2%) | 61,748 (5,407.0%) |
| 2.0x to 2.9x | 66 (16.1%) | 235 (20.6%) |
| 3.0x to 3.9x | 0 (0.0%) | 377 (33.0%) |
| 4.0x or more | 212 (51.7%) | 176 (15.4%) |
| Total | 410 (100.0%) | 1,142 (100.0%) |
Real Estate Taxes by Mortgage Status in Santa Teresa
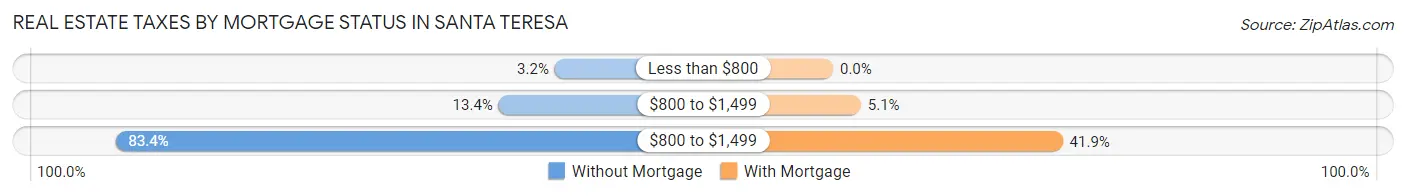
| Property Taxes | Without Mortgage | With Mortgage |
| Less than $800 | 13 (3.2%) | 0 (0.0%) |
| $800 to $1,499 | 55 (13.4%) | 58 (5.1%) |
| $800 to $1,499 | 342 (83.4%) | 479 (41.9%) |
| Total | 410 (100.0%) | 1,142 (100.0%) |
Health & Disability in Santa Teresa
Health Insurance Coverage by Age in Santa Teresa
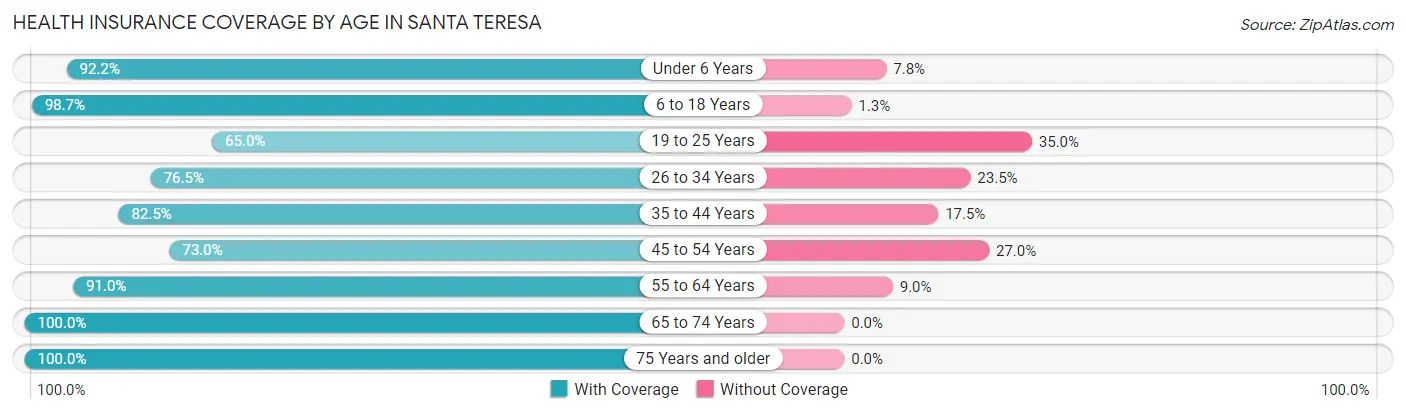
| Age Bracket | With Coverage | Without Coverage |
| Under 6 Years | 576 (92.2%) | 49 (7.8%) |
| 6 to 18 Years | 1,117 (98.7%) | 15 (1.3%) |
| 19 to 25 Years | 645 (65.0%) | 347 (35.0%) |
| 26 to 34 Years | 569 (76.5%) | 175 (23.5%) |
| 35 to 44 Years | 584 (82.5%) | 124 (17.5%) |
| 45 to 54 Years | 495 (73.0%) | 183 (27.0%) |
| 55 to 64 Years | 704 (91.0%) | 70 (9.0%) |
| 65 to 74 Years | 387 (100.0%) | 0 (0.0%) |
| 75 Years and older | 356 (100.0%) | 0 (0.0%) |
| Total | 5,433 (84.9%) | 963 (15.1%) |
Health Insurance Coverage by Citizenship Status in Santa Teresa
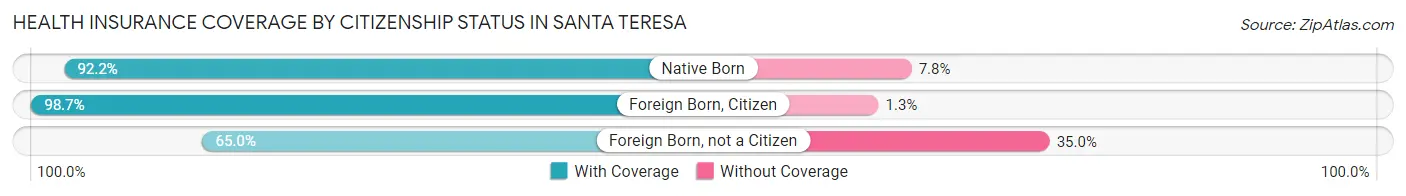
| Citizenship Status | With Coverage | Without Coverage |
| Native Born | 576 (92.2%) | 49 (7.8%) |
| Foreign Born, Citizen | 1,117 (98.7%) | 15 (1.3%) |
| Foreign Born, not a Citizen | 645 (65.0%) | 347 (35.0%) |
Health Insurance Coverage by Household Income in Santa Teresa
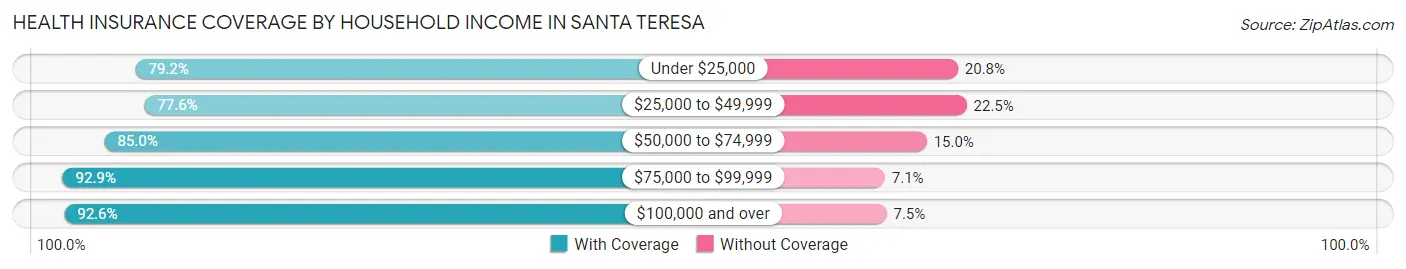
| Household Income | With Coverage | Without Coverage |
| Under $25,000 | 723 (79.2%) | 190 (20.8%) |
| $25,000 to $49,999 | 1,230 (77.5%) | 356 (22.5%) |
| $50,000 to $74,999 | 1,460 (85.0%) | 257 (15.0%) |
| $75,000 to $99,999 | 690 (92.9%) | 53 (7.1%) |
| $100,000 and over | 1,330 (92.5%) | 107 (7.4%) |
Public vs Private Health Insurance Coverage by Age in Santa Teresa
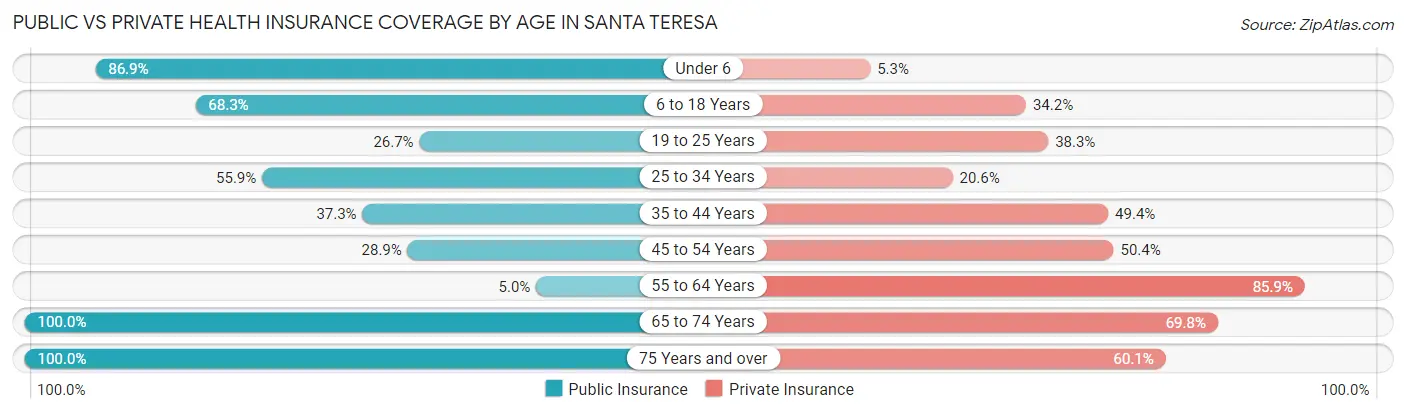
| Age Bracket | Public Insurance | Private Insurance |
| Under 6 | 543 (86.9%) | 33 (5.3%) |
| 6 to 18 Years | 773 (68.3%) | 387 (34.2%) |
| 19 to 25 Years | 265 (26.7%) | 380 (38.3%) |
| 25 to 34 Years | 416 (55.9%) | 153 (20.6%) |
| 35 to 44 Years | 264 (37.3%) | 350 (49.4%) |
| 45 to 54 Years | 196 (28.9%) | 342 (50.4%) |
| 55 to 64 Years | 39 (5.0%) | 665 (85.9%) |
| 65 to 74 Years | 387 (100.0%) | 270 (69.8%) |
| 75 Years and over | 356 (100.0%) | 214 (60.1%) |
| Total | 3,239 (50.6%) | 2,794 (43.7%) |
Disability Status by Sex by Age in Santa Teresa
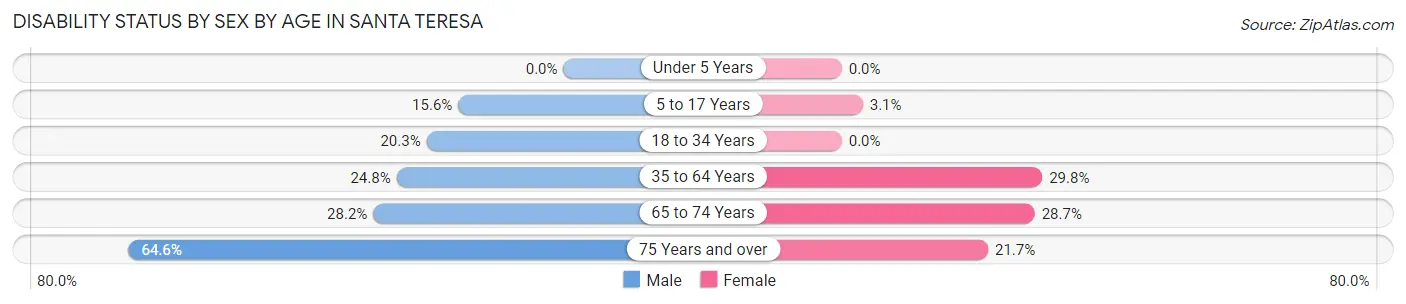
| Age Bracket | Male | Female |
| Under 5 Years | 0 (0.0%) | 0 (0.0%) |
| 5 to 17 Years | 114 (15.6%) | 13 (3.1%) |
| 18 to 34 Years | 228 (20.3%) | 0 (0.0%) |
| 35 to 64 Years | 258 (24.8%) | 333 (29.8%) |
| 65 to 74 Years | 61 (28.2%) | 49 (28.6%) |
| 75 Years and over | 102 (64.6%) | 43 (21.7%) |
Disability Class by Sex by Age in Santa Teresa
Disability Class: Hearing Difficulty
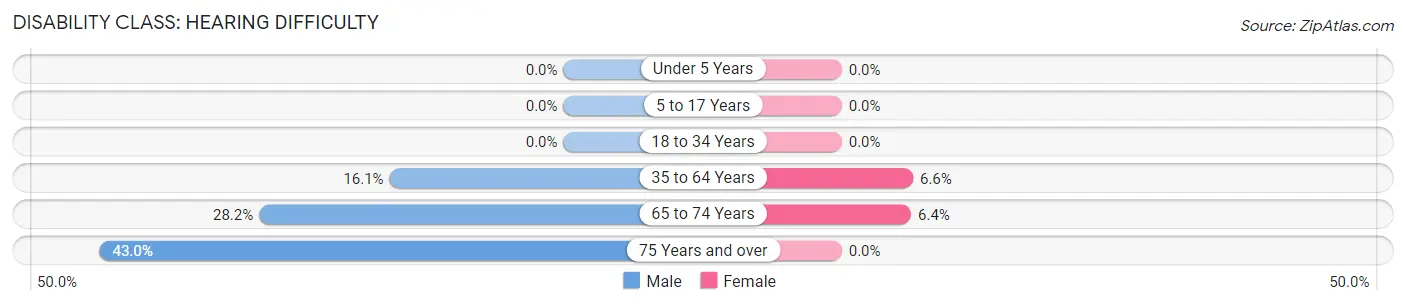
| Age Bracket | Male | Female |
| Under 5 Years | 0 (0.0%) | 0 (0.0%) |
| 5 to 17 Years | 0 (0.0%) | 0 (0.0%) |
| 18 to 34 Years | 0 (0.0%) | 0 (0.0%) |
| 35 to 64 Years | 168 (16.1%) | 74 (6.6%) |
| 65 to 74 Years | 61 (28.2%) | 11 (6.4%) |
| 75 Years and over | 68 (43.0%) | 0 (0.0%) |
Disability Class: Vision Difficulty
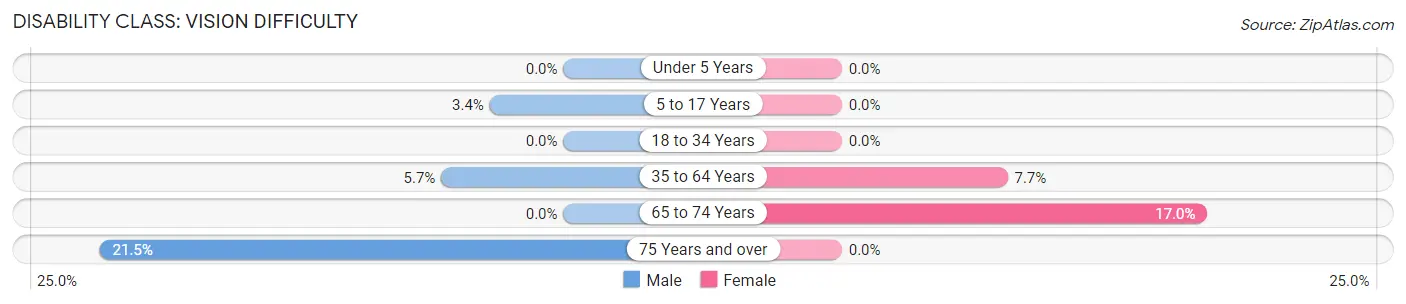
| Age Bracket | Male | Female |
| Under 5 Years | 0 (0.0%) | 0 (0.0%) |
| 5 to 17 Years | 25 (3.4%) | 0 (0.0%) |
| 18 to 34 Years | 0 (0.0%) | 0 (0.0%) |
| 35 to 64 Years | 59 (5.7%) | 86 (7.7%) |
| 65 to 74 Years | 0 (0.0%) | 29 (17.0%) |
| 75 Years and over | 34 (21.5%) | 0 (0.0%) |
Disability Class: Cognitive Difficulty
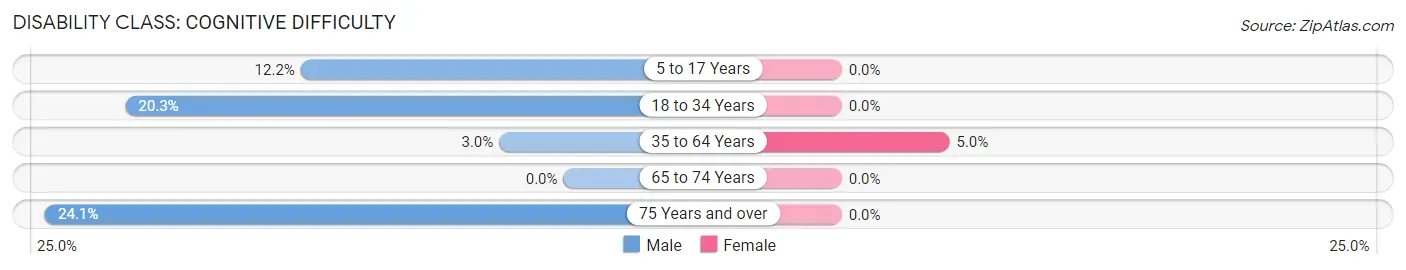
| Age Bracket | Male | Female |
| 5 to 17 Years | 89 (12.2%) | 0 (0.0%) |
| 18 to 34 Years | 228 (20.3%) | 0 (0.0%) |
| 35 to 64 Years | 31 (3.0%) | 56 (5.0%) |
| 65 to 74 Years | 0 (0.0%) | 0 (0.0%) |
| 75 Years and over | 38 (24.0%) | 0 (0.0%) |
Disability Class: Ambulatory Difficulty
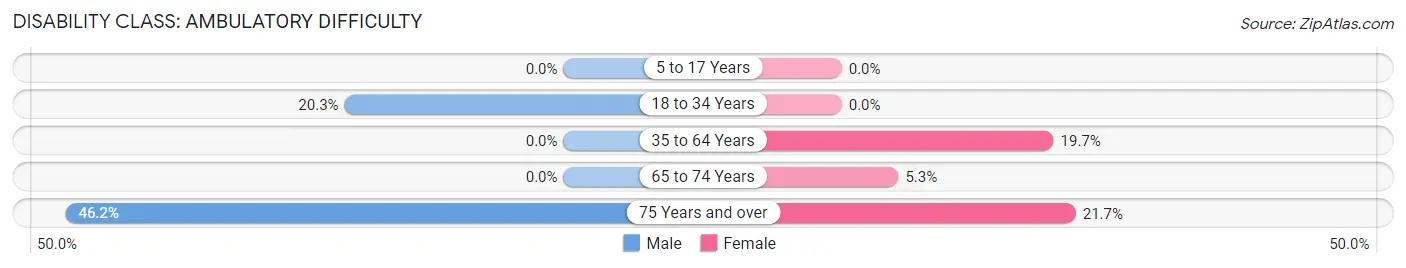
| Age Bracket | Male | Female |
| 5 to 17 Years | 0 (0.0%) | 0 (0.0%) |
| 18 to 34 Years | 228 (20.3%) | 0 (0.0%) |
| 35 to 64 Years | 0 (0.0%) | 220 (19.7%) |
| 65 to 74 Years | 0 (0.0%) | 9 (5.3%) |
| 75 Years and over | 73 (46.2%) | 43 (21.7%) |
Disability Class: Self-Care Difficulty
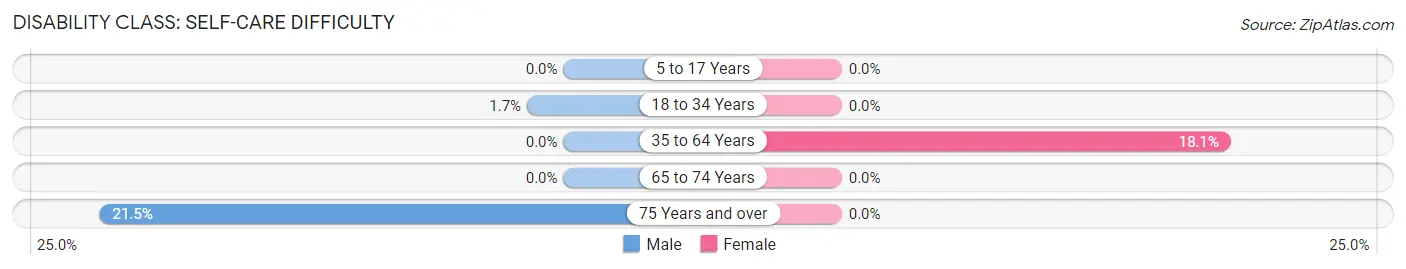
| Age Bracket | Male | Female |
| 5 to 17 Years | 0 (0.0%) | 0 (0.0%) |
| 18 to 34 Years | 19 (1.7%) | 0 (0.0%) |
| 35 to 64 Years | 0 (0.0%) | 202 (18.0%) |
| 65 to 74 Years | 0 (0.0%) | 0 (0.0%) |
| 75 Years and over | 34 (21.5%) | 0 (0.0%) |
Technology Access in Santa Teresa
Computing Device Access in Santa Teresa
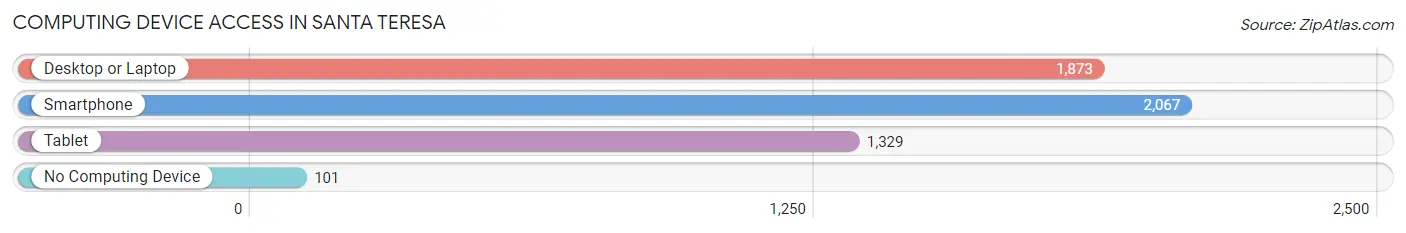
| Device Type | # Households | % Households |
| Desktop or Laptop | 1,873 | 83.9% |
| Smartphone | 2,067 | 92.6% |
| Tablet | 1,329 | 59.5% |
| No Computing Device | 101 | 4.5% |
| Total | 2,233 | 100.0% |
Internet Access in Santa Teresa
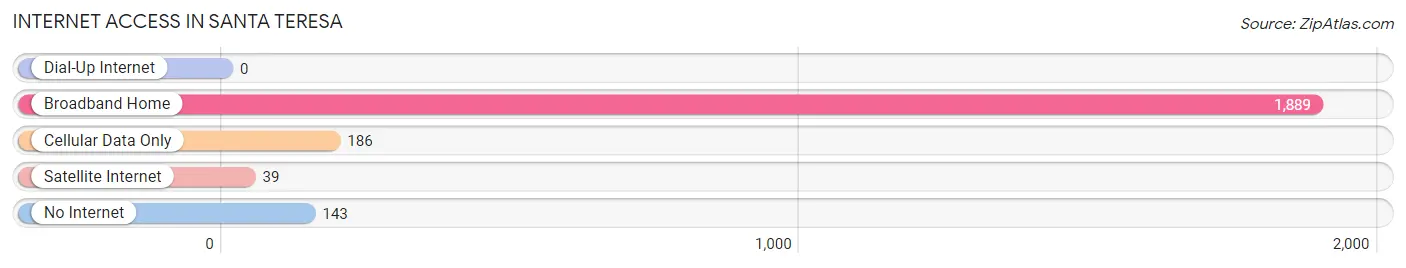
| Internet Type | # Households | % Households |
| Dial-Up Internet | 0 | 0.0% |
| Broadband Home | 1,889 | 84.6% |
| Cellular Data Only | 186 | 8.3% |
| Satellite Internet | 39 | 1.8% |
| No Internet | 143 | 6.4% |
| Total | 2,233 | 100.0% |
Santa Teresa Summary
History
Santa Teresa is a small unincorporated community located in Doña Ana County, New Mexico. It is situated on the U.S.-Mexico border, just south of El Paso, Texas. The area was first settled by Spanish colonists in the late 1700s, and the town was officially established in 1881. The town was named after Saint Teresa of Avila, a Spanish mystic and saint.
Santa Teresa has a long and rich history. During the Mexican-American War, the area was the site of a major battle between the U.S. and Mexican forces. In the late 1800s, the town was a major stop on the Butterfield Overland Mail route, which connected St. Louis, Missouri to San Francisco, California. The town was also a major stop on the Southern Pacific Railroad, which connected El Paso to Tucson, Arizona.
In the early 1900s, Santa Teresa was a major agricultural center, producing cotton, alfalfa, and other crops. The town was also home to several large ranches, including the Santa Teresa Ranch, which was owned by the prominent Chávez family.
In the mid-1900s, Santa Teresa began to experience rapid growth due to its proximity to El Paso and the U.S.-Mexico border. The town became a major hub for trade and commerce between the two countries. In the late 1900s, the town experienced a population boom due to the influx of Mexican immigrants.
Geography
Santa Teresa is located in the Chihuahuan Desert of southern New Mexico. The town is situated on the U.S.-Mexico border, just south of El Paso, Texas. The town is located at an elevation of 3,845 feet above sea level.
The town is surrounded by several mountain ranges, including the Franklin Mountains to the north, the Organ Mountains to the east, and the Sierra de las Uvas to the south. The Rio Grande River forms the western border of the town.
The climate in Santa Teresa is arid and semi-arid, with hot summers and mild winters. The average annual temperature is 68°F, and the average annual precipitation is 8.5 inches.
Economy
Santa Teresa is a major hub for trade and commerce between the U.S. and Mexico. The town is home to several large industrial parks, including the Santa Teresa Industrial Park, which is home to several major companies, including Intel, Hewlett-Packard, and Dell.
The town is also home to several large retail stores, including Walmart, Target, and Home Depot. The town is also home to several restaurants, bars, and other businesses.
The town is also home to several educational institutions, including Santa Teresa High School, Santa Teresa Middle School, and Santa Teresa Elementary School.
Demographics
As of the 2010 census, the population of Santa Teresa was 8,945. The racial makeup of the town was 79.3% Hispanic or Latino, 16.2% White, 1.2% African American, 0.7% Native American, 0.3% Asian, and 2.5% from other races.
The median household income in Santa Teresa was $30,938, and the median family income was $35,938. The per capita income was $14,938. The town had a poverty rate of 28.3%.
Conclusion
Santa Teresa is a small unincorporated community located in Doña Ana County, New Mexico. It is situated on the U.S.-Mexico border, just south of El Paso, Texas. The town has a long and rich history, and it is a major hub for trade and commerce between the two countries. The town has a population of 8,945, and the racial makeup of the town is 79.3% Hispanic or Latino, 16.2% White, 1.2% African American, 0.7% Native American, 0.3% Asian, and 2.5% from other races. The town is home to several large industrial parks, retail stores, restaurants, bars, and other businesses. The median household income in Santa Teresa is $30,938, and the poverty rate is 28.3%.
Common Questions
What is Per Capita Income in Santa Teresa?
Per Capita income in Santa Teresa is $25,663.
What is the Median Family Income in Santa Teresa?
Median Family Income in Santa Teresa is $59,457.
What is the Median Household income in Santa Teresa?
Median Household Income in Santa Teresa is $58,320.
What is Income or Wage Gap in Santa Teresa?
Income or Wage Gap in Santa Teresa is 44.7%.
Women in Santa Teresa earn 55.3 cents for every dollar earned by a man.
What is Family Income Deficit in Santa Teresa?
Family Income Deficit in Santa Teresa is $4,518.
Families that are below poverty line in Santa Teresa earn $4,518 less on average than the poverty threshold level.
What is Inequality or Gini Index in Santa Teresa?
Inequality or Gini Index in Santa Teresa is 0.44.
What is the Total Population of Santa Teresa?
Total Population of Santa Teresa is 6,396.
What is the Total Male Population of Santa Teresa?
Total Male Population of Santa Teresa is 3,569.
What is the Total Female Population of Santa Teresa?
Total Female Population of Santa Teresa is 2,827.
What is the Ratio of Males per 100 Females in Santa Teresa?
There are 126.25 Males per 100 Females in Santa Teresa.
What is the Ratio of Females per 100 Males in Santa Teresa?
There are 79.21 Females per 100 Males in Santa Teresa.
What is the Median Population Age in Santa Teresa?
Median Population Age in Santa Teresa is 32.7 Years.
What is the Average Family Size in Santa Teresa
Average Family Size in Santa Teresa is 3.4 People.
What is the Average Household Size in Santa Teresa
Average Household Size in Santa Teresa is 2.9 People.
How Large is the Labor Force in Santa Teresa?
There are 2,746 People in the Labor Forcein in Santa Teresa.
What is the Percentage of People in the Labor Force in Santa Teresa?
57.2% of People are in the Labor Force in Santa Teresa.
What is the Unemployment Rate in Santa Teresa?
Unemployment Rate in Santa Teresa is 2.1%.