Santa Rosa, NM Map & Demographics
Santa Rosa Map
Santa Rosa Overview
$24,108
PER CAPITA INCOME
$60,625
AVG FAMILY INCOME
$41,250
AVG HOUSEHOLD INCOME
8.0%
WAGE / INCOME GAP [ % ]
92.0¢/ $1
WAGE / INCOME GAP [ $ ]
0.56
INEQUALITY / GINI INDEX
2,741
TOTAL POPULATION
1,587
MALE POPULATION
1,154
FEMALE POPULATION
137.52
MALES / 100 FEMALES
72.72
FEMALES / 100 MALES
39.5
MEDIAN AGE
4.7
AVG FAMILY SIZE
3.2
AVG HOUSEHOLD SIZE
933
LABOR FORCE [ PEOPLE ]
42.3%
PERCENT IN LABOR FORCE
7.9%
UNEMPLOYMENT RATE
Santa Rosa Zip Codes
Santa Rosa Area Codes
Income in Santa Rosa
Income Overview in Santa Rosa
Per Capita Income in Santa Rosa is $24,108, while median incomes of families and households are $60,625 and $41,250 respectively.
| Characteristic | Number | Measure |
| Per Capita Income | 2,741 | $24,108 |
| Median Family Income | 402 | $60,625 |
| Mean Family Income | 402 | $110,989 |
| Median Household Income | 680 | $41,250 |
| Mean Household Income | 680 | $80,793 |
| Income Deficit | 402 | $0 |
| Wage / Income Gap (%) | 2,741 | 7.99% |
| Wage / Income Gap ($) | 2,741 | 92.01¢ per $1 |
| Gini / Inequality Index | 2,741 | 0.56 |
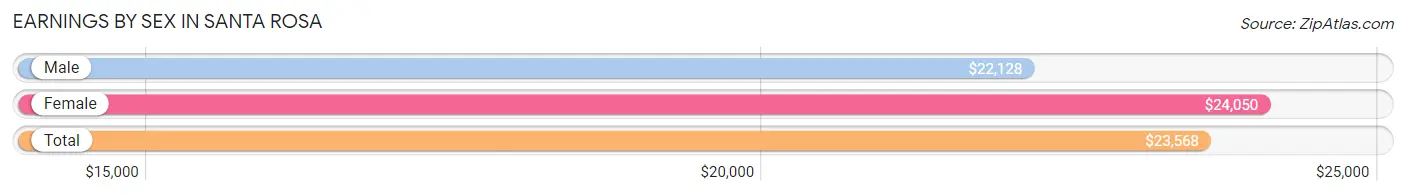
Earnings by Sex in Santa Rosa
Average Earnings in Santa Rosa are $23,568, $22,128 for men and $24,050 for women, a difference of 8.0%.
| Sex | Number | Average Earnings |
| Male | 469 (46.1%) | $22,128 |
| Female | 549 (53.9%) | $24,050 |
| Total | 1,018 (100.0%) | $23,568 |
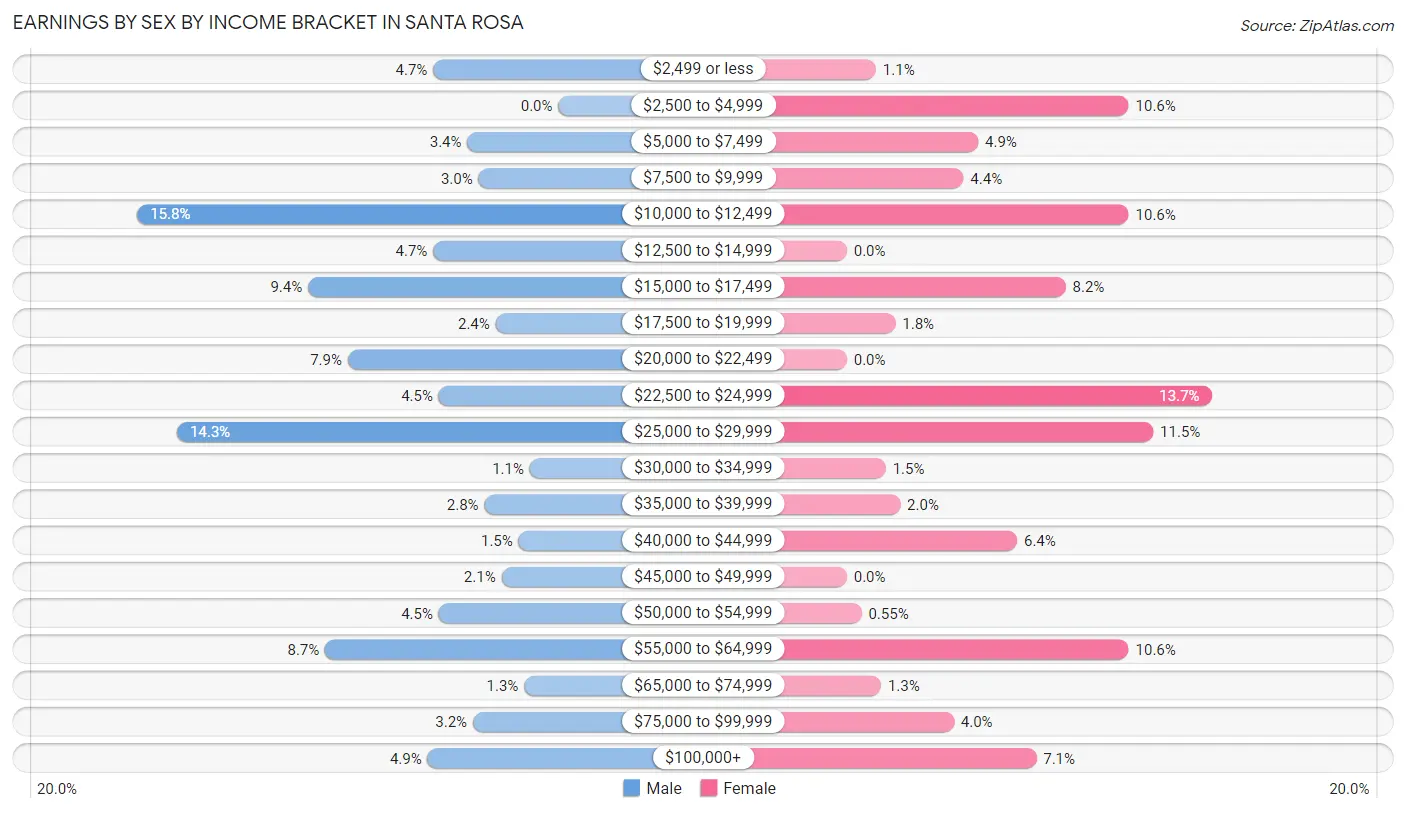
Earnings by Sex by Income Bracket in Santa Rosa
The most common earnings brackets in Santa Rosa are $10,000 to $12,499 for men (74 | 15.8%) and $22,500 to $24,999 for women (75 | 13.7%).
| Income | Male | Female |
| $2,499 or less | 22 (4.7%) | 6 (1.1%) |
| $2,500 to $4,999 | 0 (0.0%) | 58 (10.6%) |
| $5,000 to $7,499 | 16 (3.4%) | 27 (4.9%) |
| $7,500 to $9,999 | 14 (3.0%) | 24 (4.4%) |
| $10,000 to $12,499 | 74 (15.8%) | 58 (10.6%) |
| $12,500 to $14,999 | 22 (4.7%) | 0 (0.0%) |
| $15,000 to $17,499 | 44 (9.4%) | 45 (8.2%) |
| $17,500 to $19,999 | 11 (2.4%) | 10 (1.8%) |
| $20,000 to $22,499 | 37 (7.9%) | 0 (0.0%) |
| $22,500 to $24,999 | 21 (4.5%) | 75 (13.7%) |
| $25,000 to $29,999 | 67 (14.3%) | 63 (11.5%) |
| $30,000 to $34,999 | 5 (1.1%) | 8 (1.5%) |
| $35,000 to $39,999 | 13 (2.8%) | 11 (2.0%) |
| $40,000 to $44,999 | 7 (1.5%) | 35 (6.4%) |
| $45,000 to $49,999 | 10 (2.1%) | 0 (0.0%) |
| $50,000 to $54,999 | 21 (4.5%) | 3 (0.5%) |
| $55,000 to $64,999 | 41 (8.7%) | 58 (10.6%) |
| $65,000 to $74,999 | 6 (1.3%) | 7 (1.3%) |
| $75,000 to $99,999 | 15 (3.2%) | 22 (4.0%) |
| $100,000+ | 23 (4.9%) | 39 (7.1%) |
| Total | 469 (100.0%) | 549 (100.0%) |
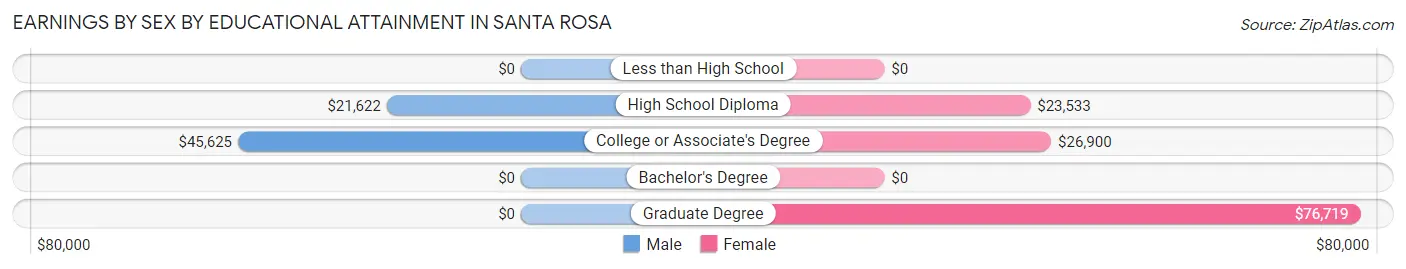
Earnings by Sex by Educational Attainment in Santa Rosa
Average earnings in Santa Rosa are $25,709 for men and $24,117 for women, a difference of 6.2%. Men with an educational attainment of college or associate's degree enjoy the highest average annual earnings of $45,625, while those with high school diploma education earn the least with $21,622. Women with an educational attainment of graduate degree earn the most with the average annual earnings of $76,719, while those with high school diploma education have the smallest earnings of $23,533.
| Educational Attainment | Male Income | Female Income |
| Less than High School | - | - |
| High School Diploma | $21,622 | $23,533 |
| College or Associate's Degree | $45,625 | $26,900 |
| Bachelor's Degree | - | - |
| Graduate Degree | - | - |
| Total | $25,709 | $24,117 |
Family Income in Santa Rosa
Family Income Brackets in Santa Rosa
According to the Santa Rosa family income data, there are 84 families falling into the $50,000 to $74,999 income range, which is the most common income bracket and makes up 20.9% of all families.
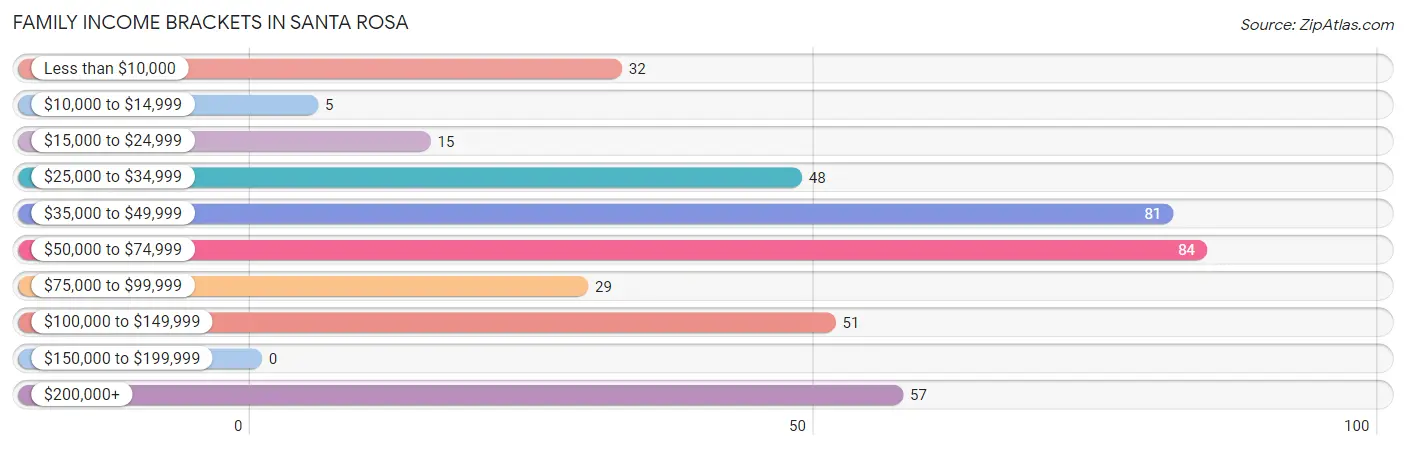
| Income Bracket | # Families | % Families |
| Less than $10,000 | 32 | 8.0% |
| $10,000 to $14,999 | 5 | 1.2% |
| $15,000 to $24,999 | 15 | 3.7% |
| $25,000 to $34,999 | 48 | 11.9% |
| $35,000 to $49,999 | 81 | 20.1% |
| $50,000 to $74,999 | 84 | 20.9% |
| $75,000 to $99,999 | 29 | 7.2% |
| $100,000 to $149,999 | 51 | 12.7% |
| $150,000 to $199,999 | 0 | 0.0% |
| $200,000+ | 57 | 14.2% |
Family Income by Famaliy Size in Santa Rosa
5-person families (29 | 7.2%) account for the highest median family income in Santa Rosa with $116,458 per family, while 2-person families (179 | 44.5%) have the highest median income of $24,636 per family member.
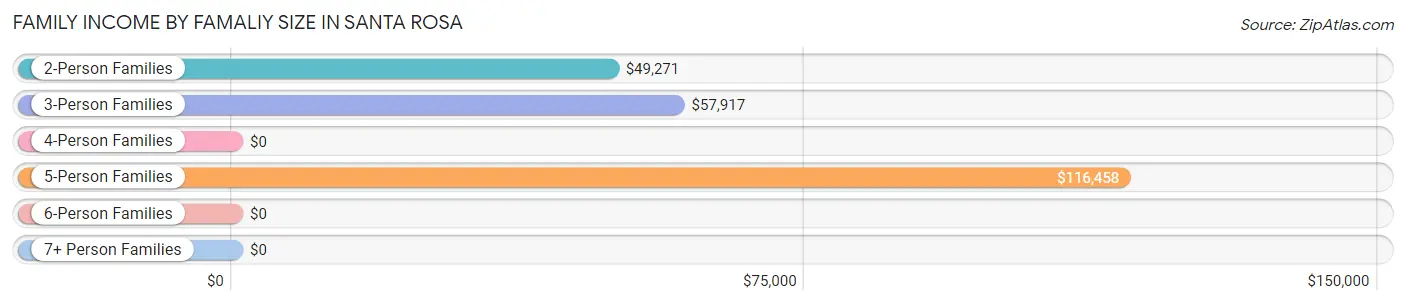
| Income Bracket | # Families | Median Income |
| 2-Person Families | 179 (44.5%) | $49,271 |
| 3-Person Families | 81 (20.2%) | $57,917 |
| 4-Person Families | 99 (24.6%) | $0 |
| 5-Person Families | 29 (7.2%) | $116,458 |
| 6-Person Families | 14 (3.5%) | $0 |
| 7+ Person Families | 0 (0.0%) | $0 |
| Total | 402 (100.0%) | $60,625 |
Family Income by Number of Earners in Santa Rosa
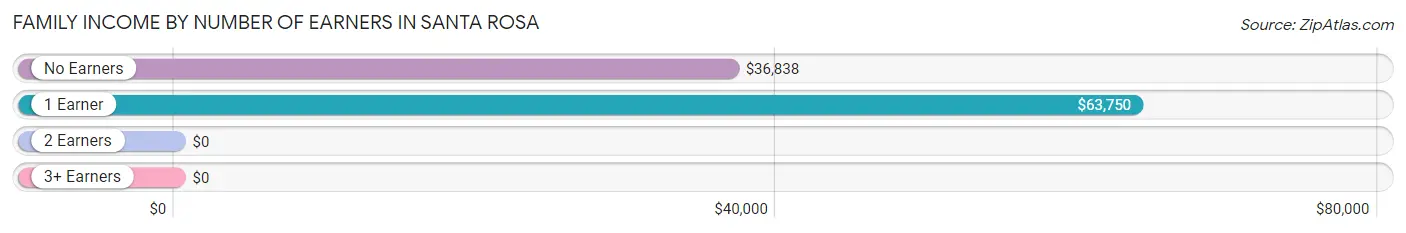
| Number of Earners | # Families | Median Income |
| No Earners | 97 (24.1%) | $36,838 |
| 1 Earner | 100 (24.9%) | $63,750 |
| 2 Earners | 192 (47.8%) | $0 |
| 3+ Earners | 13 (3.2%) | $0 |
| Total | 402 (100.0%) | $60,625 |
Household Income in Santa Rosa
Household Income Brackets in Santa Rosa
With 147 households falling in the category, the $35,000 to $49,999 income range is the most frequent in Santa Rosa, accounting for 21.6% of all households.
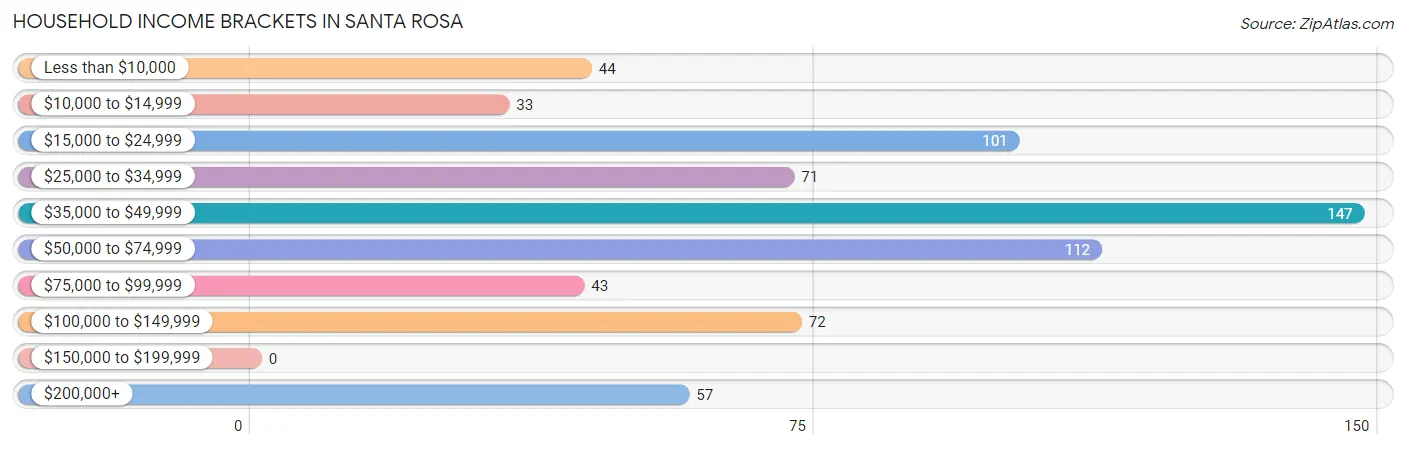
| Income Bracket | # Households | % Households |
| Less than $10,000 | 44 | 6.5% |
| $10,000 to $14,999 | 33 | 4.9% |
| $15,000 to $24,999 | 101 | 14.9% |
| $25,000 to $34,999 | 71 | 10.4% |
| $35,000 to $49,999 | 147 | 21.6% |
| $50,000 to $74,999 | 112 | 16.5% |
| $75,000 to $99,999 | 43 | 6.3% |
| $100,000 to $149,999 | 72 | 10.6% |
| $150,000 to $199,999 | 0 | 0.0% |
| $200,000+ | 57 | 8.4% |
Household Income by Householder Age in Santa Rosa
The median household income in Santa Rosa is $41,250, with the highest median household income of $66,042 found in the 25 to 44 years age bracket for the primary householder. A total of 134 households (19.7%) fall into this category. Meanwhile, the 15 to 24 years age bracket for the primary householder has the lowest median household income of $0, with 19 households (2.8%) in this group.
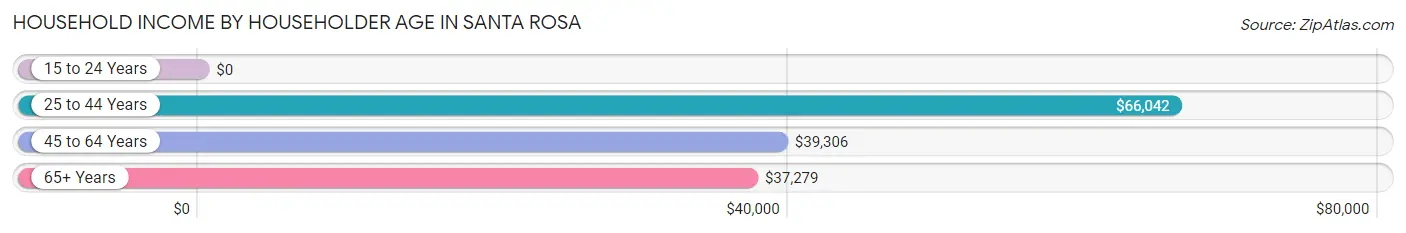
| Income Bracket | # Households | Median Income |
| 15 to 24 Years | 19 (2.8%) | $0 |
| 25 to 44 Years | 134 (19.7%) | $66,042 |
| 45 to 64 Years | 286 (42.1%) | $39,306 |
| 65+ Years | 241 (35.4%) | $37,279 |
| Total | 680 (100.0%) | $41,250 |
Poverty in Santa Rosa
Income Below Poverty by Sex and Age in Santa Rosa
With 17.7% poverty level for males and 16.1% for females among the residents of Santa Rosa, 5 year old males and 15 year old females are the most vulnerable to poverty, with 27 males (100.0%) and 5 females (100.0%) in their respective age groups living below the poverty level.
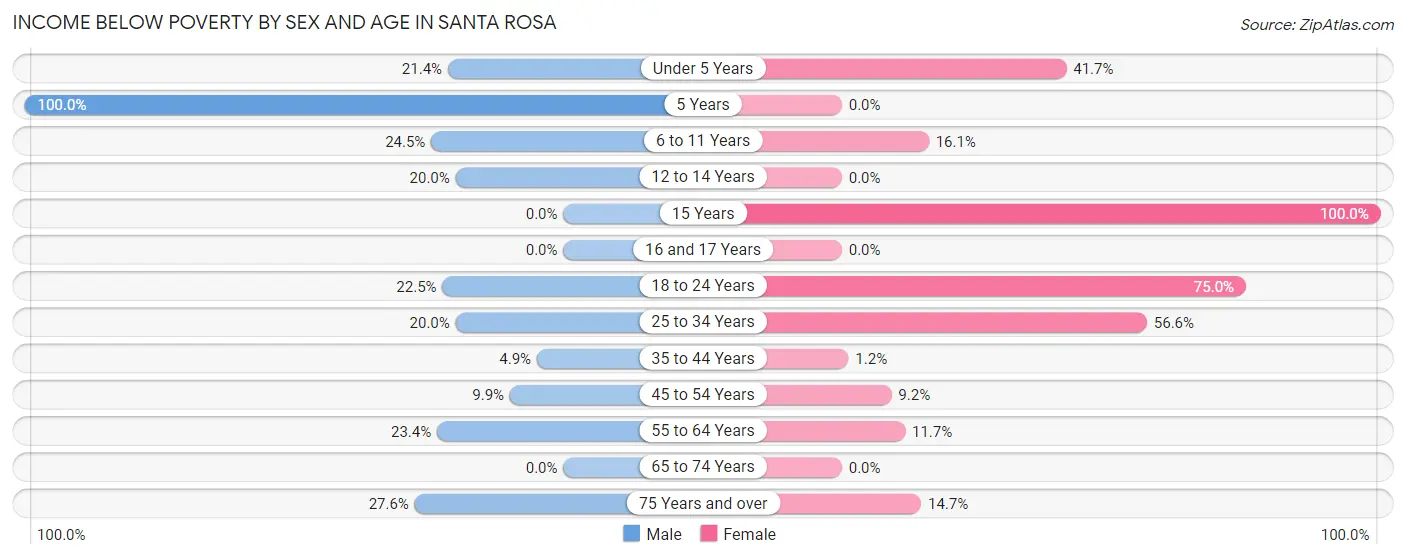
| Age Bracket | Male | Female |
| Under 5 Years | 15 (21.4%) | 30 (41.7%) |
| 5 Years | 27 (100.0%) | 0 (0.0%) |
| 6 to 11 Years | 13 (24.5%) | 20 (16.1%) |
| 12 to 14 Years | 20 (20.0%) | 0 (0.0%) |
| 15 Years | 0 (0.0%) | 5 (100.0%) |
| 16 and 17 Years | 0 (0.0%) | 0 (0.0%) |
| 18 to 24 Years | 11 (22.5%) | 6 (75.0%) |
| 25 to 34 Years | 11 (20.0%) | 77 (56.6%) |
| 35 to 44 Years | 5 (4.9%) | 3 (1.2%) |
| 45 to 54 Years | 11 (9.9%) | 7 (9.2%) |
| 55 to 64 Years | 49 (23.4%) | 27 (11.7%) |
| 65 to 74 Years | 0 (0.0%) | 0 (0.0%) |
| 75 Years and over | 24 (27.6%) | 10 (14.7%) |
| Total | 186 (17.7%) | 185 (16.1%) |
Income Above Poverty by Sex and Age in Santa Rosa
According to the poverty statistics in Santa Rosa, males aged 15 years and females aged 12 to 14 years are the age groups that are most secure financially, with 100.0% of males and 100.0% of females in these age groups living above the poverty line.
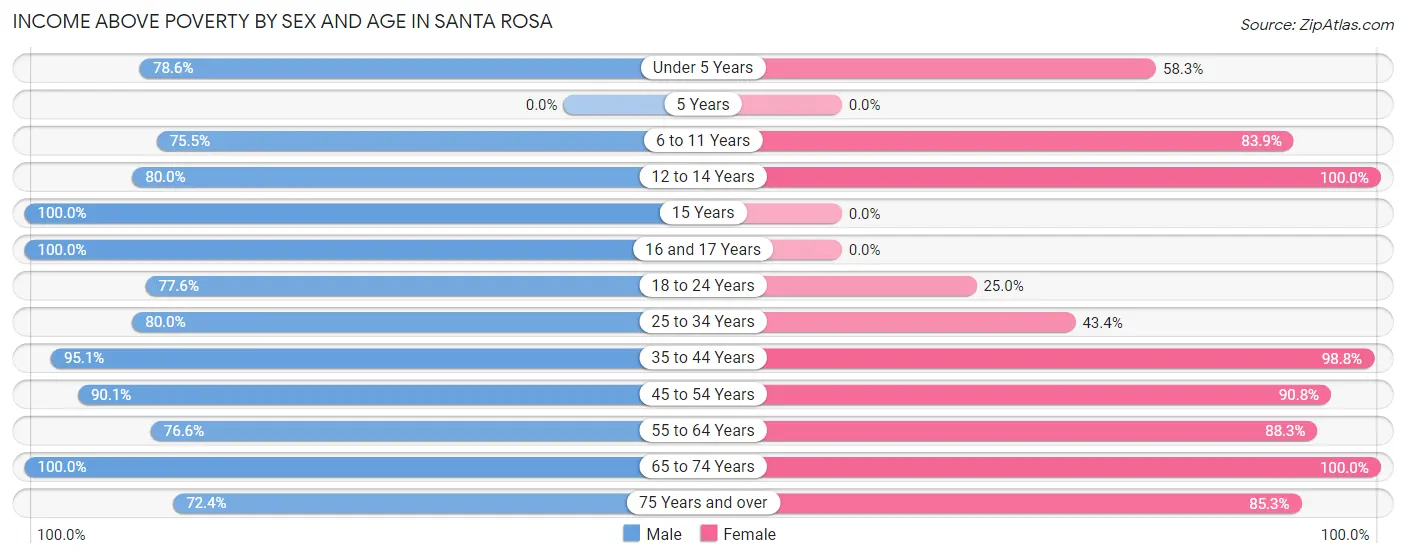
| Age Bracket | Male | Female |
| Under 5 Years | 55 (78.6%) | 42 (58.3%) |
| 5 Years | 0 (0.0%) | 0 (0.0%) |
| 6 to 11 Years | 40 (75.5%) | 104 (83.9%) |
| 12 to 14 Years | 80 (80.0%) | 65 (100.0%) |
| 15 Years | 20 (100.0%) | 0 (0.0%) |
| 16 and 17 Years | 49 (100.0%) | 0 (0.0%) |
| 18 to 24 Years | 38 (77.5%) | 2 (25.0%) |
| 25 to 34 Years | 44 (80.0%) | 59 (43.4%) |
| 35 to 44 Years | 97 (95.1%) | 241 (98.8%) |
| 45 to 54 Years | 100 (90.1%) | 69 (90.8%) |
| 55 to 64 Years | 160 (76.6%) | 203 (88.3%) |
| 65 to 74 Years | 120 (100.0%) | 125 (100.0%) |
| 75 Years and over | 63 (72.4%) | 58 (85.3%) |
| Total | 866 (82.3%) | 968 (84.0%) |
Income Below Poverty Among Married-Couple Families in Santa Rosa
The poverty statistics for married-couple families in Santa Rosa show that 12.4% or 35 of the total 283 families live below the poverty line. Families with 3 or 4 children have the highest poverty rate of 32.0%, comprising of 8 families. On the other hand, families with no children have the lowest poverty rate of 7.4%, which includes 12 families.
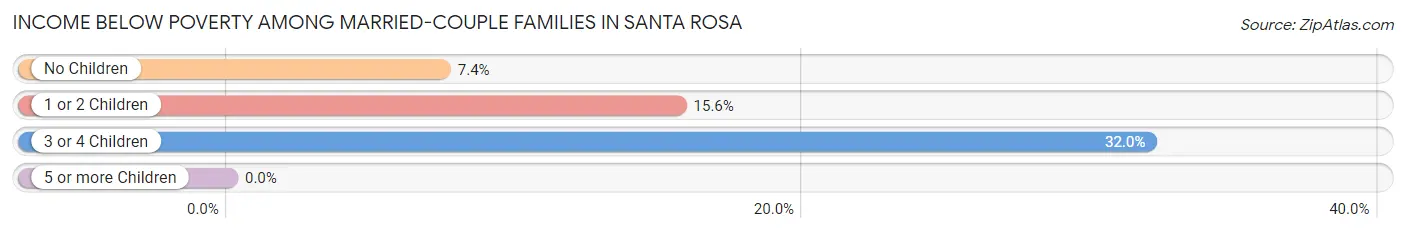
| Children | Above Poverty | Below Poverty |
| No Children | 150 (92.6%) | 12 (7.4%) |
| 1 or 2 Children | 81 (84.4%) | 15 (15.6%) |
| 3 or 4 Children | 17 (68.0%) | 8 (32.0%) |
| 5 or more Children | 0 (0.0%) | 0 (0.0%) |
| Total | 248 (87.6%) | 35 (12.4%) |
Income Below Poverty Among Single-Parent Households in Santa Rosa
According to the poverty data in Santa Rosa, 15.6% or 7 single-father households and 2.7% or 2 single-mother households are living below the poverty line. Among single-father households, those with 1 or 2 children have the highest poverty rate, with 7 households (58.3%) experiencing poverty. Likewise, among single-mother households, those with 5 or more children have the highest poverty rate, with 2 households (100.0%) falling below the poverty line.
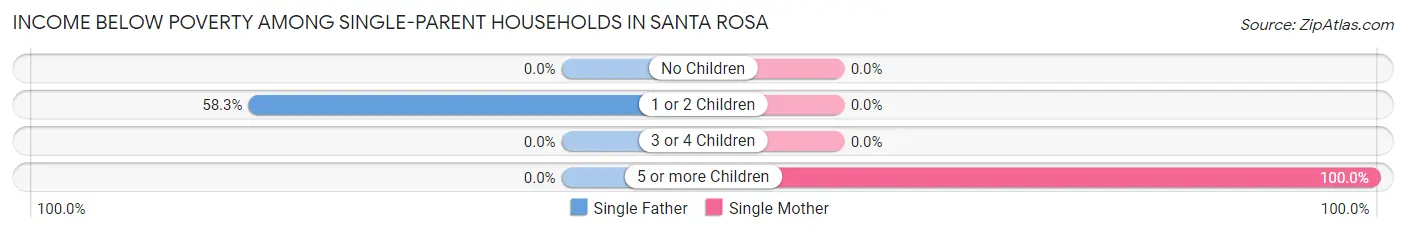
| Children | Single Father | Single Mother |
| No Children | 0 (0.0%) | 0 (0.0%) |
| 1 or 2 Children | 7 (58.3%) | 0 (0.0%) |
| 3 or 4 Children | 0 (0.0%) | 0 (0.0%) |
| 5 or more Children | 0 (0.0%) | 2 (100.0%) |
| Total | 7 (15.6%) | 2 (2.7%) |
Income Below Poverty Among Married-Couple vs Single-Parent Households in Santa Rosa
The poverty data for Santa Rosa shows that 35 of the married-couple family households (12.4%) and 9 of the single-parent households (7.6%) are living below the poverty level. Within the married-couple family households, those with 3 or 4 children have the highest poverty rate, with 8 households (32.0%) falling below the poverty line. Among the single-parent households, those with 5 or more children have the highest poverty rate, with 2 household (100.0%) living below poverty.
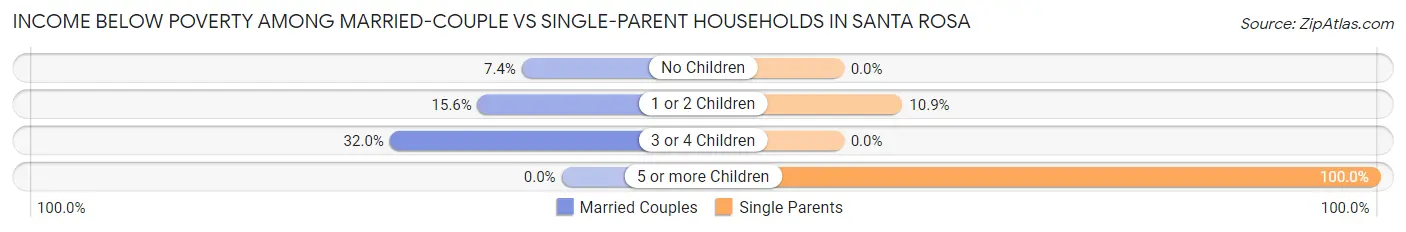
| Children | Married-Couple Families | Single-Parent Households |
| No Children | 12 (7.4%) | 0 (0.0%) |
| 1 or 2 Children | 15 (15.6%) | 7 (10.9%) |
| 3 or 4 Children | 8 (32.0%) | 0 (0.0%) |
| 5 or more Children | 0 (0.0%) | 2 (100.0%) |
| Total | 35 (12.4%) | 9 (7.6%) |
Race in Santa Rosa
The most populous races in Santa Rosa are Hispanic or Latino (2,047 | 74.7%), White / Caucasian (1,311 | 47.8%), and Some other Race (626 | 22.8%).
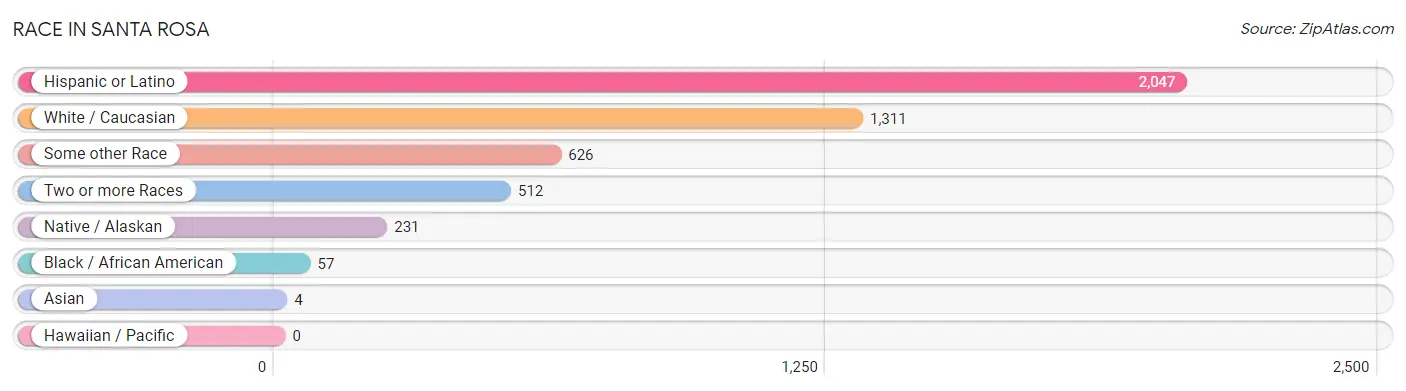
| Race | # Population | % Population |
| Asian | 4 | 0.2% |
| Black / African American | 57 | 2.1% |
| Hawaiian / Pacific | 0 | 0.0% |
| Hispanic or Latino | 2,047 | 74.7% |
| Native / Alaskan | 231 | 8.4% |
| White / Caucasian | 1,311 | 47.8% |
| Two or more Races | 512 | 18.7% |
| Some other Race | 626 | 22.8% |
| Total | 2,741 | 100.0% |
Ancestry in Santa Rosa
The most populous ancestries reported in Santa Rosa are Mexican (1,187 | 43.3%), Spanish (238 | 8.7%), English (171 | 6.2%), American (143 | 5.2%), and Pueblo (138 | 5.0%), together accounting for 68.5% of all Santa Rosa residents.
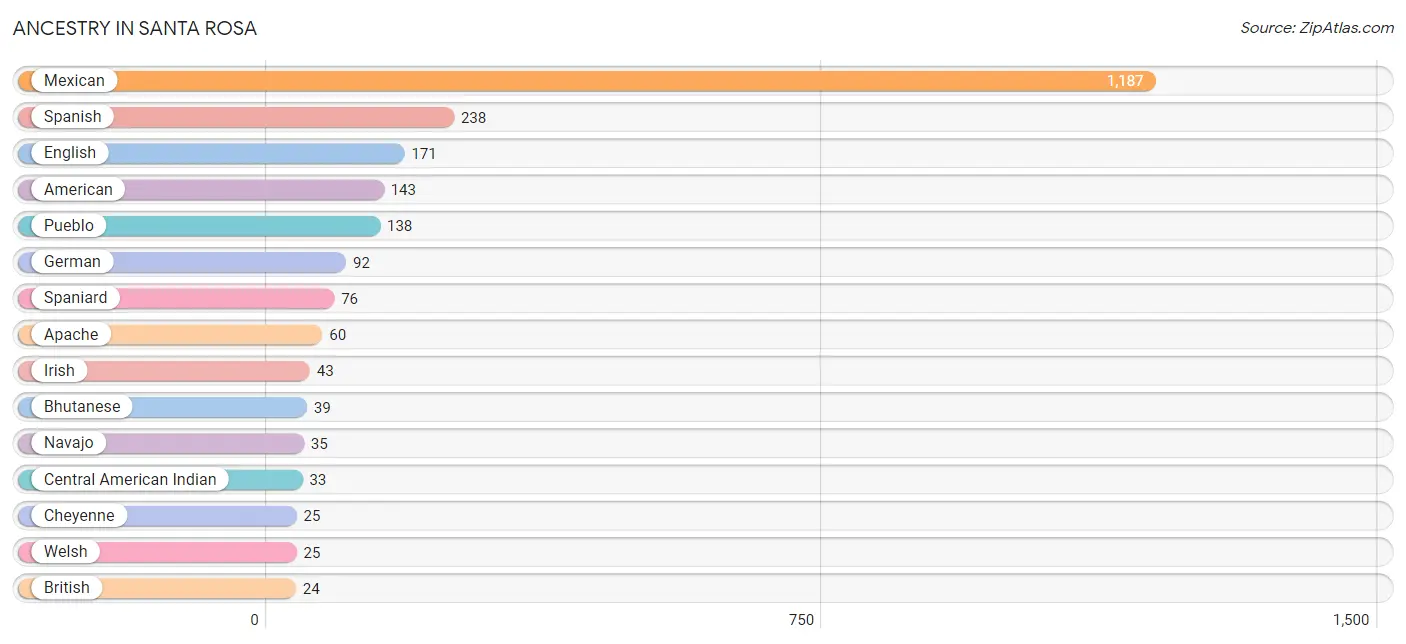
| Ancestry | # Population | % Population |
| American | 143 | 5.2% |
| Apache | 60 | 2.2% |
| Arab | 5 | 0.2% |
| Basque | 3 | 0.1% |
| Bhutanese | 39 | 1.4% |
| British | 24 | 0.9% |
| Central American Indian | 33 | 1.2% |
| Cheyenne | 25 | 0.9% |
| Dutch | 4 | 0.2% |
| English | 171 | 6.2% |
| European | 4 | 0.2% |
| French | 24 | 0.9% |
| German | 92 | 3.4% |
| Irish | 43 | 1.6% |
| Italian | 3 | 0.1% |
| Mexican | 1,187 | 43.3% |
| Moroccan | 5 | 0.2% |
| Navajo | 35 | 1.3% |
| Pueblo | 138 | 5.0% |
| Russian | 5 | 0.2% |
| Samoan | 5 | 0.2% |
| Scottish | 18 | 0.7% |
| Sioux | 5 | 0.2% |
| South American | 4 | 0.2% |
| Spaniard | 76 | 2.8% |
| Spanish | 238 | 8.7% |
| Thai | 4 | 0.2% |
| Venezuelan | 4 | 0.2% |
| Welsh | 25 | 0.9% | View All 29 Rows |
Immigrants in Santa Rosa
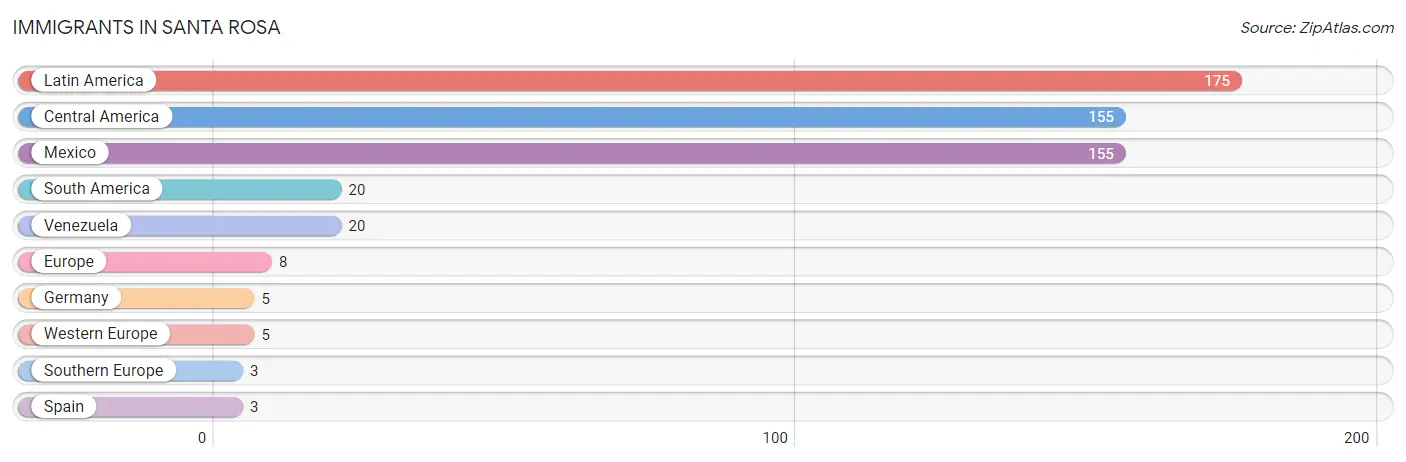
The most numerous immigrant groups reported in Santa Rosa came from Latin America (175 | 6.4%), Central America (155 | 5.7%), Mexico (155 | 5.7%), South America (20 | 0.7%), and Venezuela (20 | 0.7%), together accounting for 19.1% of all Santa Rosa residents.
| Immigration Origin | # Population | % Population |
| Central America | 155 | 5.7% |
| Europe | 8 | 0.3% |
| Germany | 5 | 0.2% |
| Latin America | 175 | 6.4% |
| Mexico | 155 | 5.7% |
| South America | 20 | 0.7% |
| Southern Europe | 3 | 0.1% |
| Spain | 3 | 0.1% |
| Venezuela | 20 | 0.7% |
| Western Europe | 5 | 0.2% | View All 10 Rows |
Sex and Age in Santa Rosa
Sex and Age in Santa Rosa
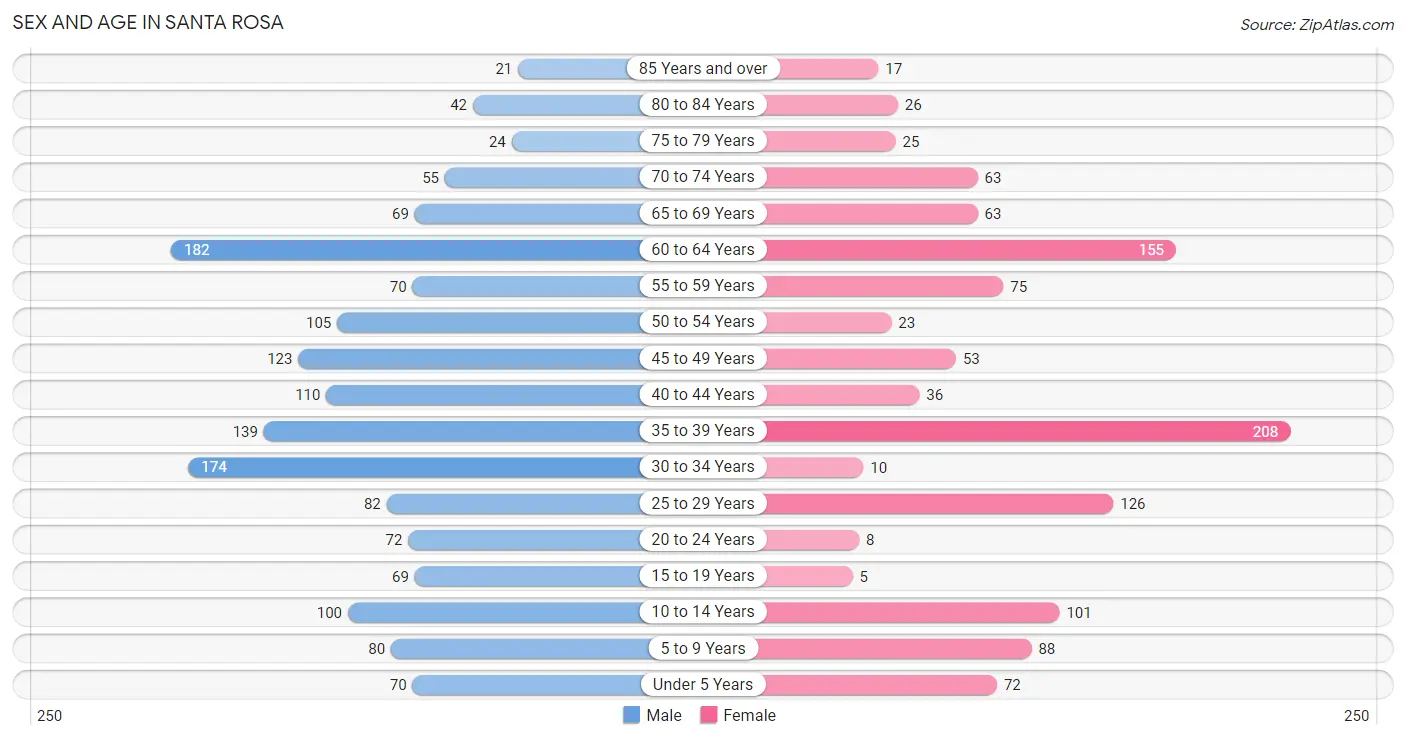
The most populous age groups in Santa Rosa are 60 to 64 Years (182 | 11.5%) for men and 35 to 39 Years (208 | 18.0%) for women.
| Age Bracket | Male | Female |
| Under 5 Years | 70 (4.4%) | 72 (6.2%) |
| 5 to 9 Years | 80 (5.0%) | 88 (7.6%) |
| 10 to 14 Years | 100 (6.3%) | 101 (8.7%) |
| 15 to 19 Years | 69 (4.3%) | 5 (0.4%) |
| 20 to 24 Years | 72 (4.5%) | 8 (0.7%) |
| 25 to 29 Years | 82 (5.2%) | 126 (10.9%) |
| 30 to 34 Years | 174 (11.0%) | 10 (0.9%) |
| 35 to 39 Years | 139 (8.8%) | 208 (18.0%) |
| 40 to 44 Years | 110 (6.9%) | 36 (3.1%) |
| 45 to 49 Years | 123 (7.7%) | 53 (4.6%) |
| 50 to 54 Years | 105 (6.6%) | 23 (2.0%) |
| 55 to 59 Years | 70 (4.4%) | 75 (6.5%) |
| 60 to 64 Years | 182 (11.5%) | 155 (13.4%) |
| 65 to 69 Years | 69 (4.3%) | 63 (5.5%) |
| 70 to 74 Years | 55 (3.5%) | 63 (5.5%) |
| 75 to 79 Years | 24 (1.5%) | 25 (2.2%) |
| 80 to 84 Years | 42 (2.6%) | 26 (2.2%) |
| 85 Years and over | 21 (1.3%) | 17 (1.5%) |
| Total | 1,587 (100.0%) | 1,154 (100.0%) |
Families and Households in Santa Rosa
Median Family Size in Santa Rosa
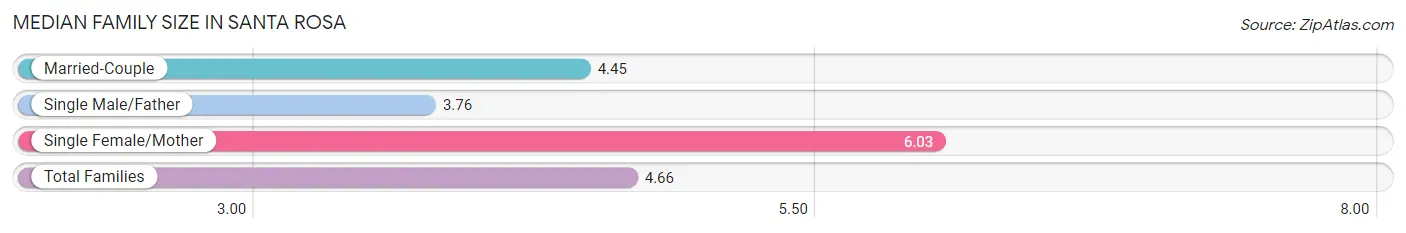
The median family size in Santa Rosa is 4.66 persons per family, with single female/mother families (74 | 18.4%) accounting for the largest median family size of 6.03 persons per family. On the other hand, single male/father families (45 | 11.2%) represent the smallest median family size with 3.76 persons per family.
| Family Type | # Families | Family Size |
| Married-Couple | 283 (70.4%) | 4.45 |
| Single Male/Father | 45 (11.2%) | 3.76 |
| Single Female/Mother | 74 (18.4%) | 6.03 |
| Total Families | 402 (100.0%) | 4.66 |
Median Household Size in Santa Rosa
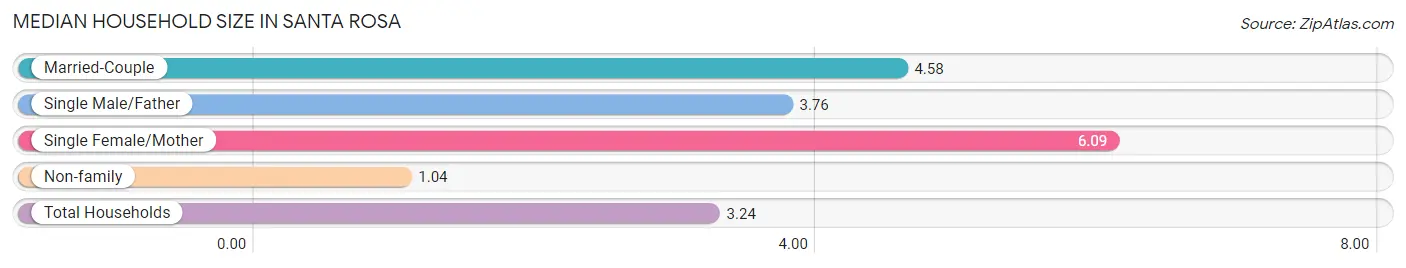
The median household size in Santa Rosa is 3.24 persons per household, with single female/mother households (74 | 10.9%) accounting for the largest median household size of 6.09 persons per household. non-family households (278 | 40.9%) represent the smallest median household size with 1.04 persons per household.
| Household Type | # Households | Household Size |
| Married-Couple | 283 (41.6%) | 4.58 |
| Single Male/Father | 45 (6.6%) | 3.76 |
| Single Female/Mother | 74 (10.9%) | 6.09 |
| Non-family | 278 (40.9%) | 1.04 |
| Total Households | 680 (100.0%) | 3.24 |
Household Size by Marriage Status in Santa Rosa
Out of a total of 680 households in Santa Rosa, 402 (59.1%) are family households, while 278 (40.9%) are nonfamily households. The most numerous type of family households are 2-person households, comprising 179, and the most common type of nonfamily households are 1-person households, comprising 263.
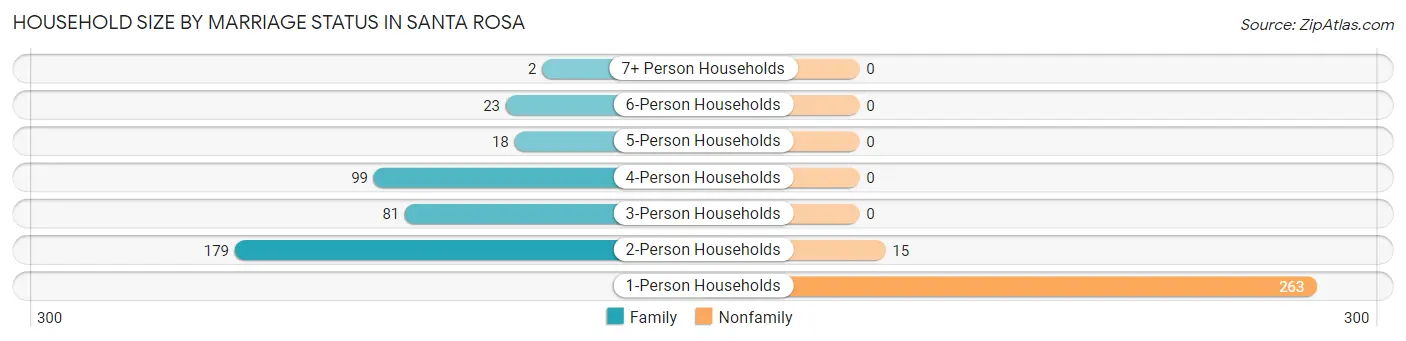
| Household Size | Family Households | Nonfamily Households |
| 1-Person Households | - | 263 (38.7%) |
| 2-Person Households | 179 (26.3%) | 15 (2.2%) |
| 3-Person Households | 81 (11.9%) | 0 (0.0%) |
| 4-Person Households | 99 (14.6%) | 0 (0.0%) |
| 5-Person Households | 18 (2.6%) | 0 (0.0%) |
| 6-Person Households | 23 (3.4%) | 0 (0.0%) |
| 7+ Person Households | 2 (0.3%) | 0 (0.0%) |
| Total | 402 (59.1%) | 278 (40.9%) |
Female Fertility in Santa Rosa
Fertility by Age in Santa Rosa
Average fertility rate in Santa Rosa is 61.0 births per 1,000 women. Women in the age bracket of 20 to 34 years have the highest fertility rate with 188.0 births per 1,000 women. Women in the age bracket of 20 to 34 years acount for 100.0% of all women with births.
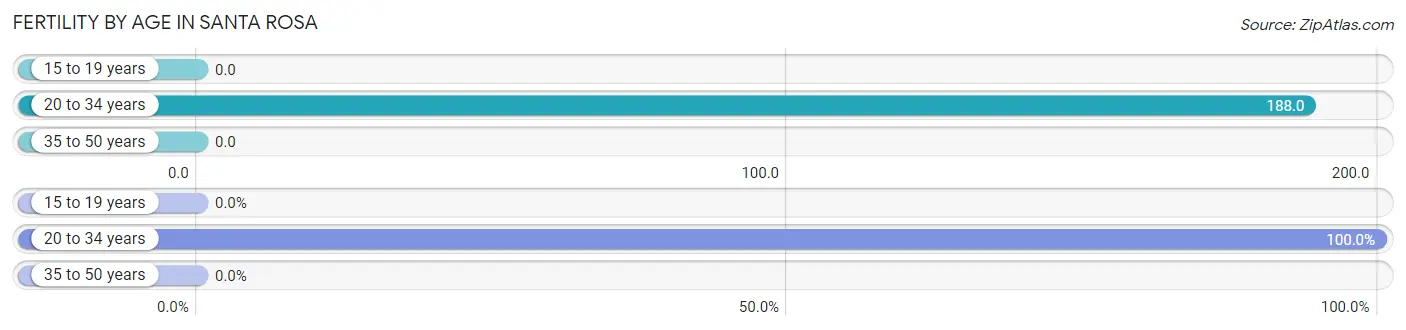
| Age Bracket | Women with Births | Births / 1,000 Women |
| 15 to 19 years | 0 (0.0%) | 0.0 |
| 20 to 34 years | 27 (100.0%) | 188.0 |
| 35 to 50 years | 0 (0.0%) | 0.0 |
| Total | 27 (100.0%) | 61.0 |
Fertility by Age by Marriage Status in Santa Rosa
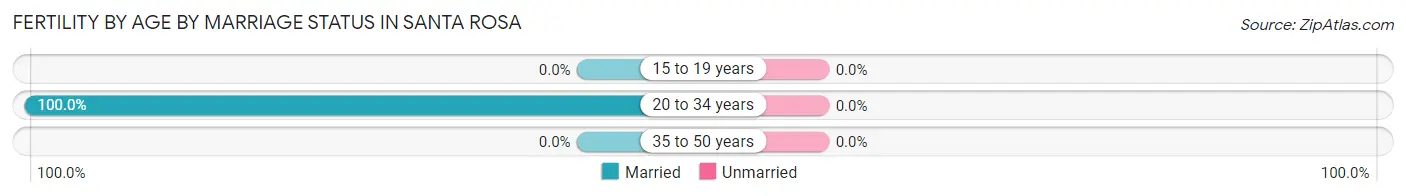
| Age Bracket | Married | Unmarried |
| 15 to 19 years | 0 (0.0%) | 0 (0.0%) |
| 20 to 34 years | 27 (100.0%) | 0 (0.0%) |
| 35 to 50 years | 0 (0.0%) | 0 (0.0%) |
| Total | 27 (100.0%) | 0 (0.0%) |
Fertility by Education in Santa Rosa
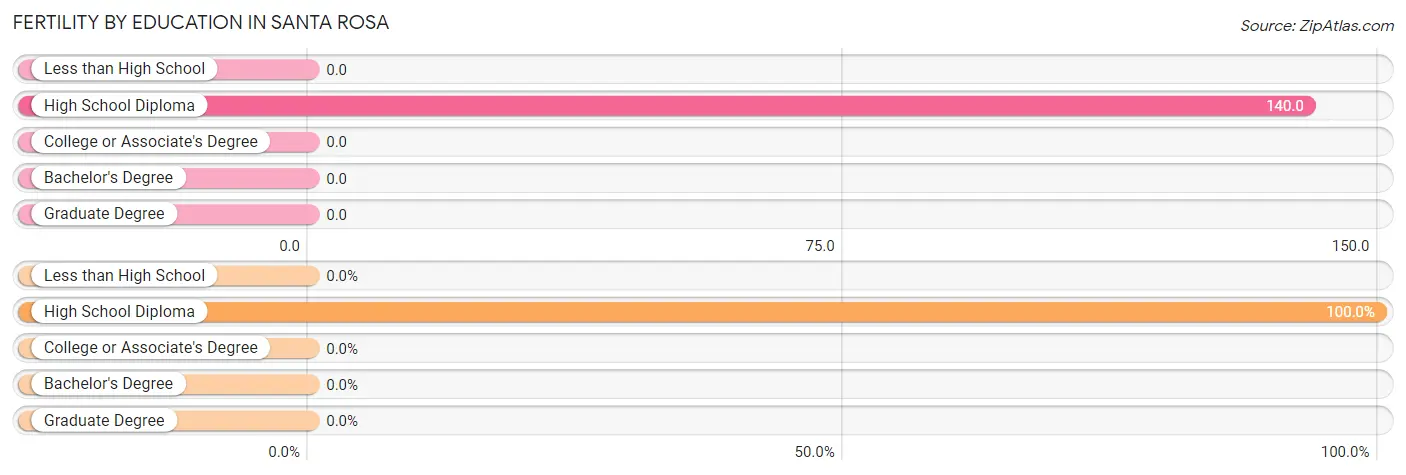
| Educational Attainment | Women with Births | Births / 1,000 Women |
| Less than High School | 0 (0.0%) | 0.0 |
| High School Diploma | 27 (100.0%) | 140.0 |
| College or Associate's Degree | 0 (0.0%) | 0.0 |
| Bachelor's Degree | 0 (0.0%) | 0.0 |
| Graduate Degree | 0 (0.0%) | 0.0 |
| Total | 27 (100.0%) | 61.0 |
Fertility by Education by Marriage Status in Santa Rosa
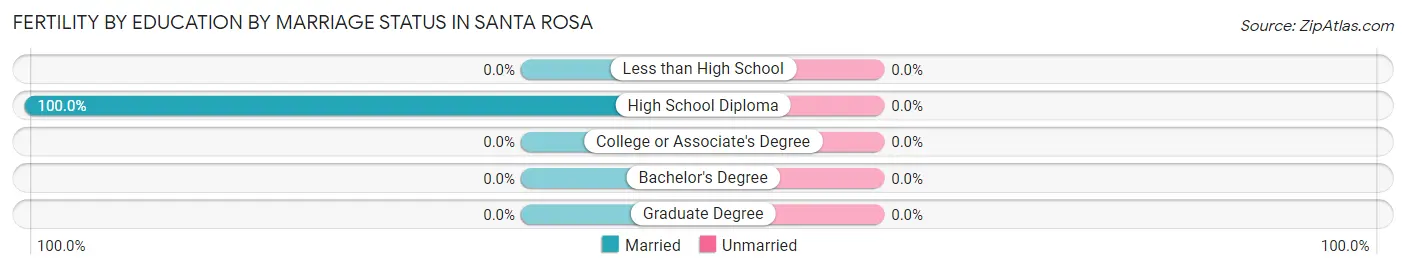
| Educational Attainment | Married | Unmarried |
| Less than High School | 0 (0.0%) | 0 (0.0%) |
| High School Diploma | 27 (100.0%) | 0 (0.0%) |
| College or Associate's Degree | 0 (0.0%) | 0 (0.0%) |
| Bachelor's Degree | 0 (0.0%) | 0 (0.0%) |
| Graduate Degree | 0 (0.0%) | 0 (0.0%) |
| Total | 27 (100.0%) | 0 (0.0%) |
Employment Characteristics in Santa Rosa
Employment by Class of Employer in Santa Rosa
Among the 856 employed individuals in Santa Rosa, private company employees (340 | 39.7%), state government employees (133 | 15.5%), and not-for-profit organizations (126 | 14.7%) make up the most common classes of employment.
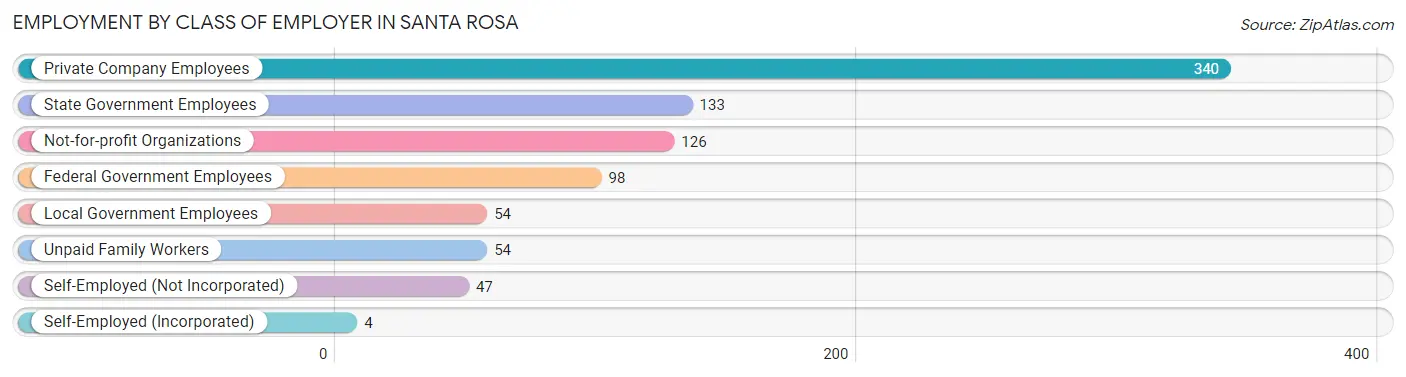
| Employer Class | # Employees | % Employees |
| Private Company Employees | 340 | 39.7% |
| Self-Employed (Incorporated) | 4 | 0.5% |
| Self-Employed (Not Incorporated) | 47 | 5.5% |
| Not-for-profit Organizations | 126 | 14.7% |
| Local Government Employees | 54 | 6.3% |
| State Government Employees | 133 | 15.5% |
| Federal Government Employees | 98 | 11.5% |
| Unpaid Family Workers | 54 | 6.3% |
| Total | 856 | 100.0% |
Employment Status by Age in Santa Rosa
According to the labor force statistics for Santa Rosa, out of the total population over 16 years of age (2,205), 42.3% or 933 individuals are in the labor force, with 7.9% or 74 of them unemployed. The age group with the highest labor force participation rate is 16 to 19 years, with 93.9% or 46 individuals in the labor force. Within the labor force, the 25 to 29 years age range has the highest percentage of unemployed individuals, with 58.2% or 39 of them being unemployed.
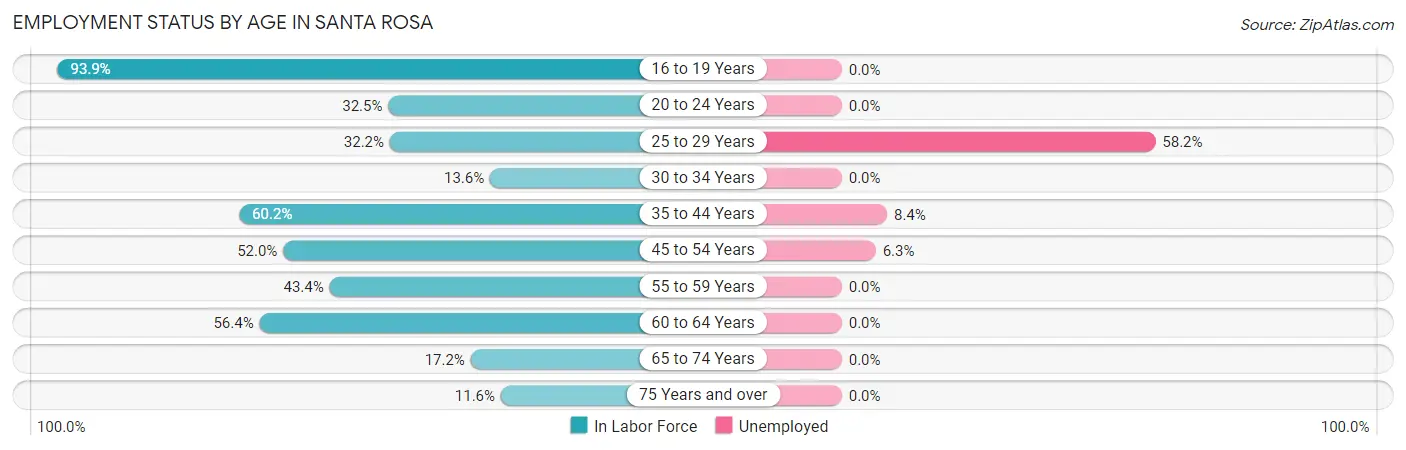
| Age Bracket | In Labor Force | Unemployed |
| 16 to 19 Years | 46 (93.9%) | 0 (0.0%) |
| 20 to 24 Years | 26 (32.5%) | 0 (0.0%) |
| 25 to 29 Years | 67 (32.2%) | 39 (58.2%) |
| 30 to 34 Years | 25 (13.6%) | 0 (0.0%) |
| 35 to 44 Years | 297 (60.2%) | 25 (8.4%) |
| 45 to 54 Years | 158 (52.0%) | 10 (6.3%) |
| 55 to 59 Years | 63 (43.4%) | 0 (0.0%) |
| 60 to 64 Years | 190 (56.4%) | 0 (0.0%) |
| 65 to 74 Years | 43 (17.2%) | 0 (0.0%) |
| 75 Years and over | 18 (11.6%) | 0 (0.0%) |
| Total | 933 (42.3%) | 74 (7.9%) |
Employment Status by Educational Attainment in Santa Rosa
According to labor force statistics for Santa Rosa, 47.9% of individuals (800) out of the total population between 25 and 64 years of age (1,671) are in the labor force, with 9.3% or 74 of them being unemployed. The group with the highest labor force participation rate are those with the educational attainment of bachelor's degree or higher, with 62.9% or 166 individuals in the labor force. Within the labor force, individuals with less than high school education have the highest percentage of unemployment, with 70.9% or 39 of them being unemployed.
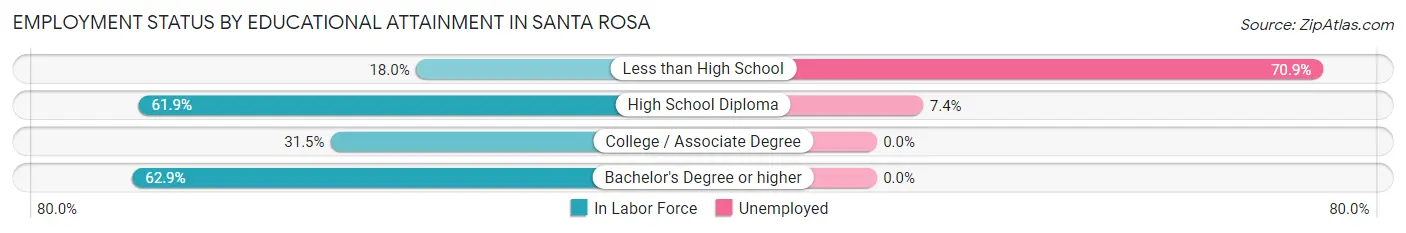
| Educational Attainment | In Labor Force | Unemployed |
| Less than High School | 55 (18.0%) | 216 (70.9%) |
| High School Diploma | 472 (61.9%) | 56 (7.4%) |
| College / Associate Degree | 107 (31.5%) | 0 (0.0%) |
| Bachelor's Degree or higher | 166 (62.9%) | 0 (0.0%) |
| Total | 800 (47.9%) | 155 (9.3%) |
Employment Occupations by Sex in Santa Rosa
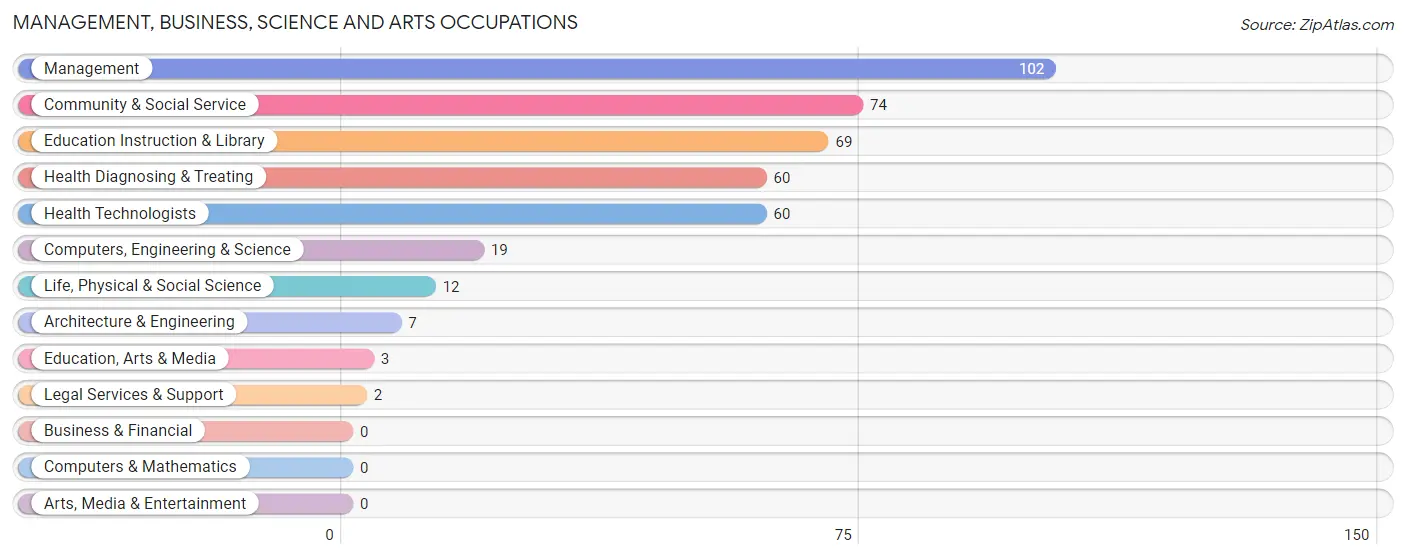
Management, Business, Science and Arts Occupations
The most common Management, Business, Science and Arts occupations in Santa Rosa are Management (102 | 11.9%), Community & Social Service (74 | 8.6%), Education Instruction & Library (69 | 8.0%), Health Diagnosing & Treating (60 | 7.0%), and Health Technologists (60 | 7.0%).
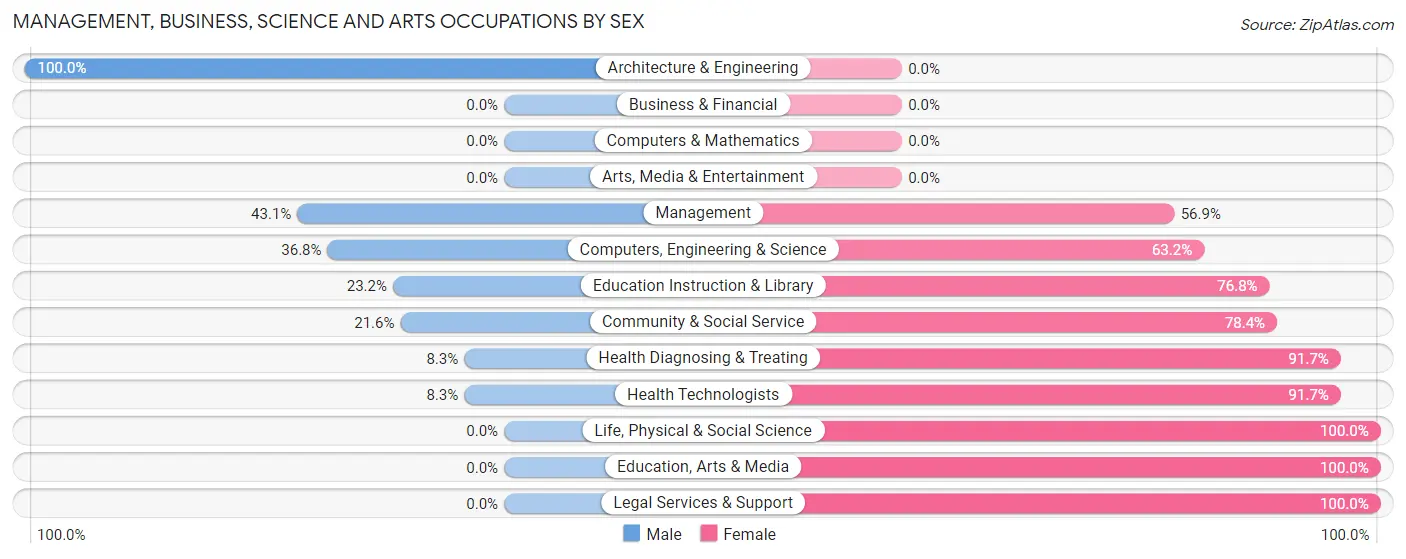
Management, Business, Science and Arts Occupations by Sex
Within the Management, Business, Science and Arts occupations in Santa Rosa, the most male-oriented occupations are Architecture & Engineering (100.0%), Management (43.1%), and Computers, Engineering & Science (36.8%), while the most female-oriented occupations are Life, Physical & Social Science (100.0%), Education, Arts & Media (100.0%), and Legal Services & Support (100.0%).
| Occupation | Male | Female |
| Management | 44 (43.1%) | 58 (56.9%) |
| Business & Financial | 0 (0.0%) | 0 (0.0%) |
| Computers, Engineering & Science | 7 (36.8%) | 12 (63.2%) |
| Computers & Mathematics | 0 (0.0%) | 0 (0.0%) |
| Architecture & Engineering | 7 (100.0%) | 0 (0.0%) |
| Life, Physical & Social Science | 0 (0.0%) | 12 (100.0%) |
| Community & Social Service | 16 (21.6%) | 58 (78.4%) |
| Education, Arts & Media | 0 (0.0%) | 3 (100.0%) |
| Legal Services & Support | 0 (0.0%) | 2 (100.0%) |
| Education Instruction & Library | 16 (23.2%) | 53 (76.8%) |
| Arts, Media & Entertainment | 0 (0.0%) | 0 (0.0%) |
| Health Diagnosing & Treating | 5 (8.3%) | 55 (91.7%) |
| Health Technologists | 5 (8.3%) | 55 (91.7%) |
| Total (Category) | 72 (28.2%) | 183 (71.8%) |
| Total (Overall) | 444 (51.7%) | 415 (48.3%) |
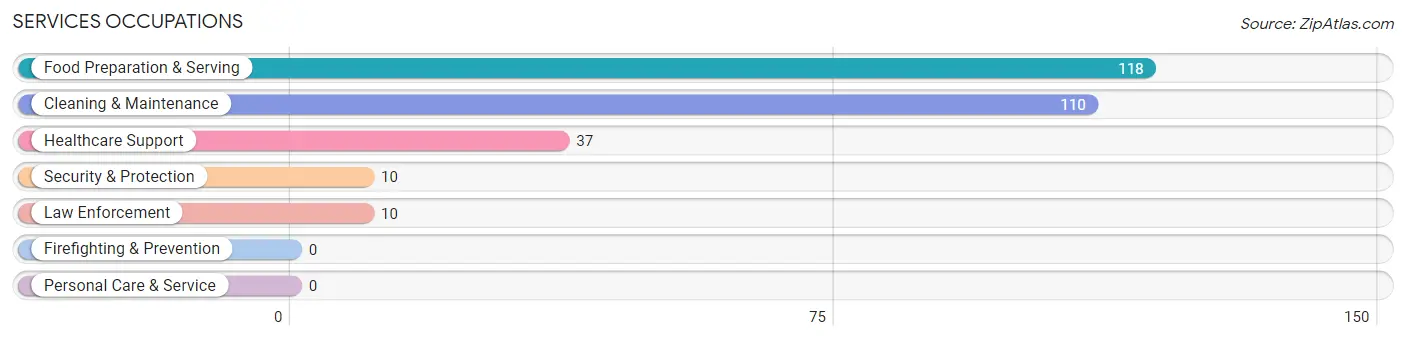
Services Occupations
The most common Services occupations in Santa Rosa are Food Preparation & Serving (118 | 13.7%), Cleaning & Maintenance (110 | 12.8%), Healthcare Support (37 | 4.3%), Security & Protection (10 | 1.2%), and Law Enforcement (10 | 1.2%).
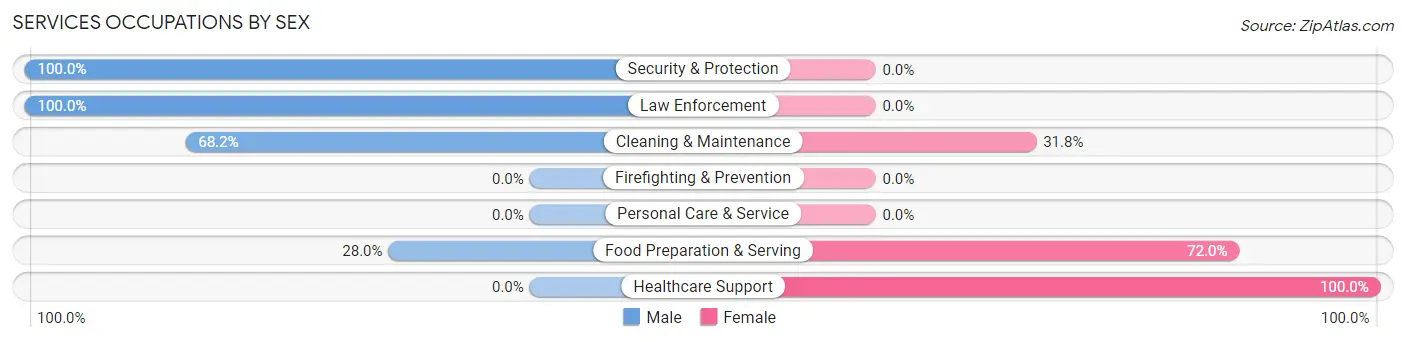
Services Occupations by Sex
Within the Services occupations in Santa Rosa, the most male-oriented occupations are Security & Protection (100.0%), Law Enforcement (100.0%), and Cleaning & Maintenance (68.2%), while the most female-oriented occupations are Healthcare Support (100.0%), Food Preparation & Serving (72.0%), and Cleaning & Maintenance (31.8%).
| Occupation | Male | Female |
| Healthcare Support | 0 (0.0%) | 37 (100.0%) |
| Security & Protection | 10 (100.0%) | 0 (0.0%) |
| Firefighting & Prevention | 0 (0.0%) | 0 (0.0%) |
| Law Enforcement | 10 (100.0%) | 0 (0.0%) |
| Food Preparation & Serving | 33 (28.0%) | 85 (72.0%) |
| Cleaning & Maintenance | 75 (68.2%) | 35 (31.8%) |
| Personal Care & Service | 0 (0.0%) | 0 (0.0%) |
| Total (Category) | 118 (42.9%) | 157 (57.1%) |
| Total (Overall) | 444 (51.7%) | 415 (48.3%) |
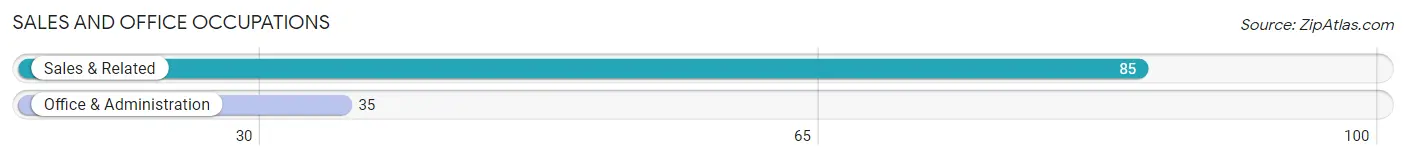
Sales and Office Occupations
The most common Sales and Office occupations in Santa Rosa are Sales & Related (85 | 9.9%), and Office & Administration (35 | 4.1%).
Sales and Office Occupations by Sex
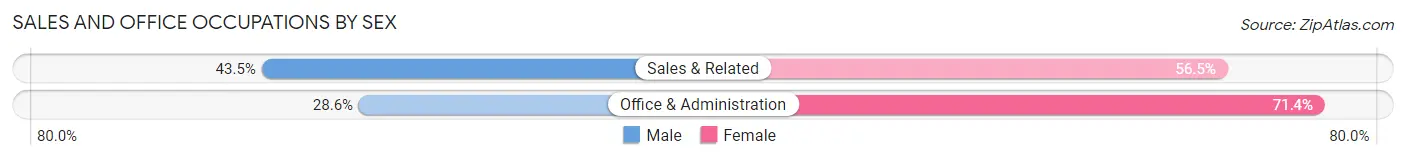
| Occupation | Male | Female |
| Sales & Related | 37 (43.5%) | 48 (56.5%) |
| Office & Administration | 10 (28.6%) | 25 (71.4%) |
| Total (Category) | 47 (39.2%) | 73 (60.8%) |
| Total (Overall) | 444 (51.7%) | 415 (48.3%) |
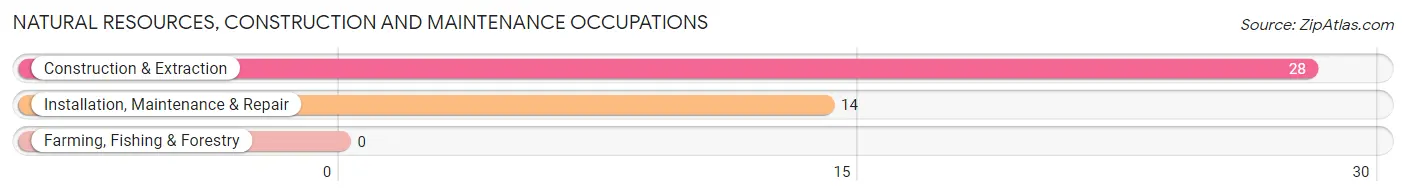
Natural Resources, Construction and Maintenance Occupations
The most common Natural Resources, Construction and Maintenance occupations in Santa Rosa are Construction & Extraction (28 | 3.3%), and Installation, Maintenance & Repair (14 | 1.6%).
Natural Resources, Construction and Maintenance Occupations by Sex
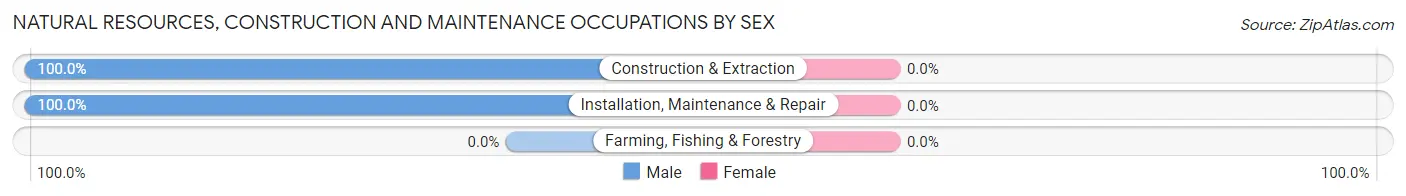
| Occupation | Male | Female |
| Farming, Fishing & Forestry | 0 (0.0%) | 0 (0.0%) |
| Construction & Extraction | 28 (100.0%) | 0 (0.0%) |
| Installation, Maintenance & Repair | 14 (100.0%) | 0 (0.0%) |
| Total (Category) | 42 (100.0%) | 0 (0.0%) |
| Total (Overall) | 444 (51.7%) | 415 (48.3%) |
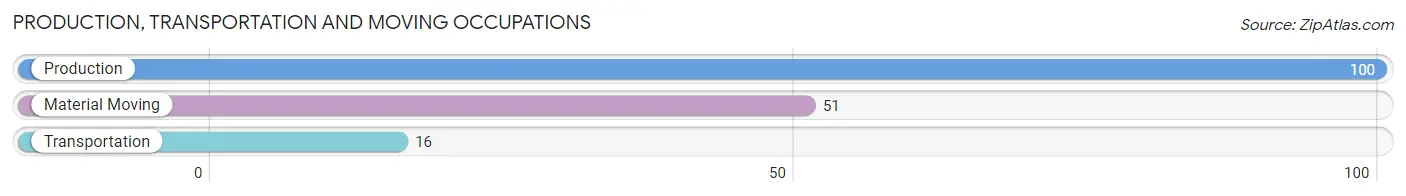
Production, Transportation and Moving Occupations
The most common Production, Transportation and Moving occupations in Santa Rosa are Production (100 | 11.6%), Material Moving (51 | 5.9%), and Transportation (16 | 1.9%).
Production, Transportation and Moving Occupations by Sex
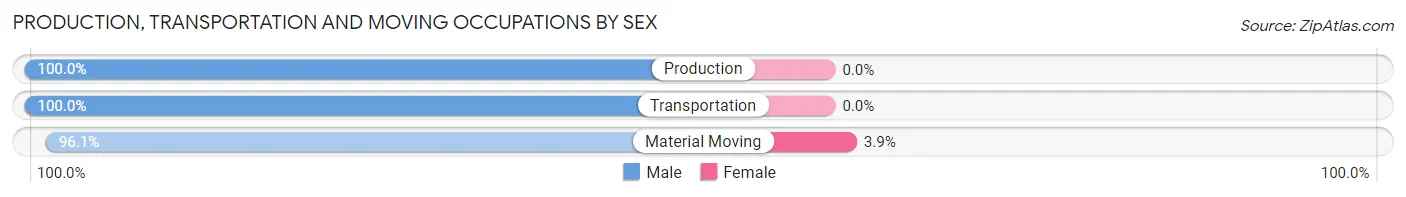
| Occupation | Male | Female |
| Production | 100 (100.0%) | 0 (0.0%) |
| Transportation | 16 (100.0%) | 0 (0.0%) |
| Material Moving | 49 (96.1%) | 2 (3.9%) |
| Total (Category) | 165 (98.8%) | 2 (1.2%) |
| Total (Overall) | 444 (51.7%) | 415 (48.3%) |
Employment Industries by Sex in Santa Rosa
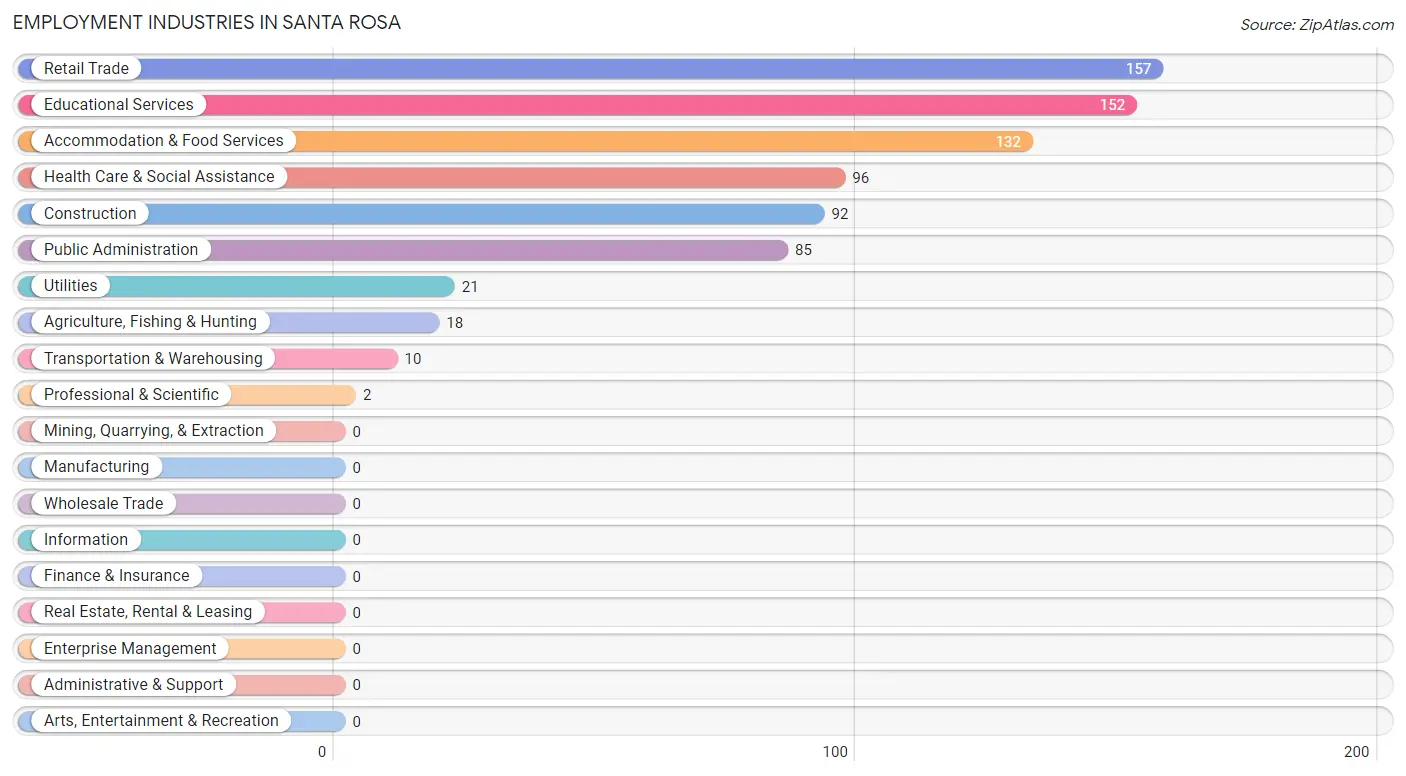
Employment Industries in Santa Rosa
The major employment industries in Santa Rosa include Retail Trade (157 | 18.3%), Educational Services (152 | 17.7%), Accommodation & Food Services (132 | 15.4%), Health Care & Social Assistance (96 | 11.2%), and Construction (92 | 10.7%).
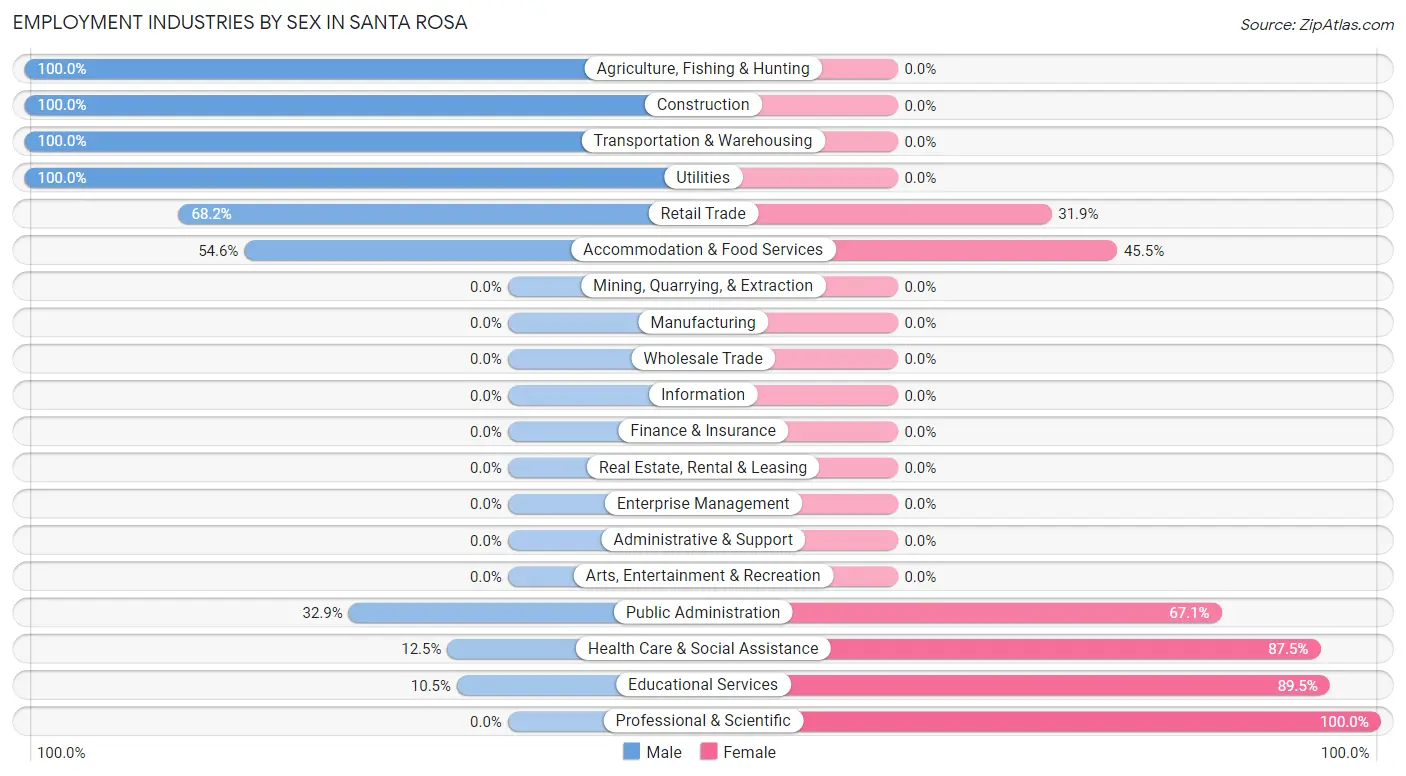
Employment Industries by Sex in Santa Rosa
The Santa Rosa industries that see more men than women are Agriculture, Fishing & Hunting (100.0%), Construction (100.0%), and Transportation & Warehousing (100.0%), whereas the industries that tend to have a higher number of women are Professional & Scientific (100.0%), Educational Services (89.5%), and Health Care & Social Assistance (87.5%).
| Industry | Male | Female |
| Agriculture, Fishing & Hunting | 18 (100.0%) | 0 (0.0%) |
| Mining, Quarrying, & Extraction | 0 (0.0%) | 0 (0.0%) |
| Construction | 92 (100.0%) | 0 (0.0%) |
| Manufacturing | 0 (0.0%) | 0 (0.0%) |
| Wholesale Trade | 0 (0.0%) | 0 (0.0%) |
| Retail Trade | 107 (68.1%) | 50 (31.9%) |
| Transportation & Warehousing | 10 (100.0%) | 0 (0.0%) |
| Utilities | 21 (100.0%) | 0 (0.0%) |
| Information | 0 (0.0%) | 0 (0.0%) |
| Finance & Insurance | 0 (0.0%) | 0 (0.0%) |
| Real Estate, Rental & Leasing | 0 (0.0%) | 0 (0.0%) |
| Professional & Scientific | 0 (0.0%) | 2 (100.0%) |
| Enterprise Management | 0 (0.0%) | 0 (0.0%) |
| Administrative & Support | 0 (0.0%) | 0 (0.0%) |
| Educational Services | 16 (10.5%) | 136 (89.5%) |
| Health Care & Social Assistance | 12 (12.5%) | 84 (87.5%) |
| Arts, Entertainment & Recreation | 0 (0.0%) | 0 (0.0%) |
| Accommodation & Food Services | 72 (54.5%) | 60 (45.5%) |
| Public Administration | 28 (32.9%) | 57 (67.1%) |
| Total | 444 (51.7%) | 415 (48.3%) |
Education in Santa Rosa
School Enrollment in Santa Rosa
The most common levels of schooling among the 537 students in Santa Rosa are middle school (160 | 29.8%), high school (145 | 27.0%), and elementary school (115 | 21.4%).
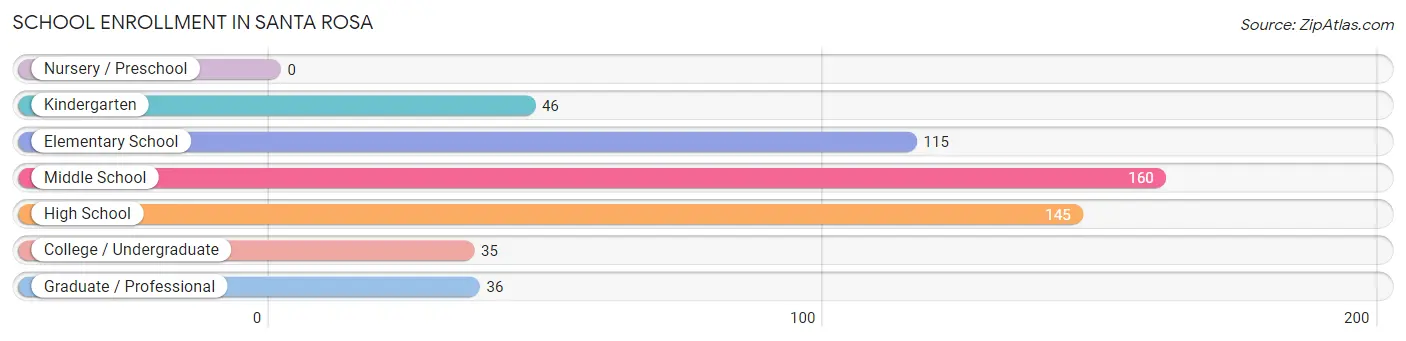
| School Level | # Students | % Students |
| Nursery / Preschool | 0 | 0.0% |
| Kindergarten | 46 | 8.6% |
| Elementary School | 115 | 21.4% |
| Middle School | 160 | 29.8% |
| High School | 145 | 27.0% |
| College / Undergraduate | 35 | 6.5% |
| Graduate / Professional | 36 | 6.7% |
| Total | 537 | 100.0% |
School Enrollment by Age by Funding Source in Santa Rosa
Out of a total of 537 students who are enrolled in schools in Santa Rosa, 78 (14.5%) attend a private institution, while the remaining 459 (85.5%) are enrolled in public schools. The age group of 35 years and over has the highest likelihood of being enrolled in private schools, with 36 (73.5% in the age bracket) enrolled. Conversely, the age group of 5 to 9 year old has the lowest likelihood of being enrolled in a private school, with 161 (100.0% in the age bracket) attending a public institution.
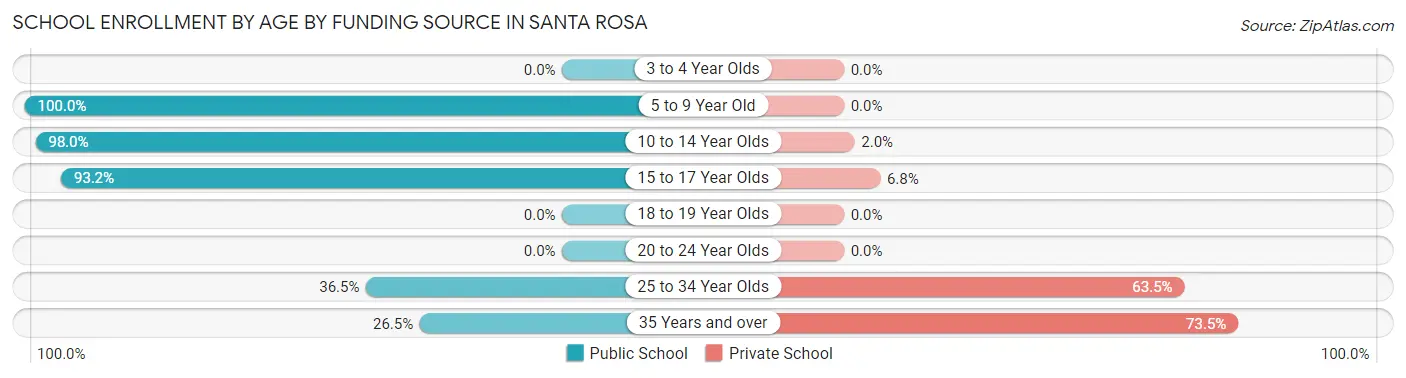
| Age Bracket | Public School | Private School |
| 3 to 4 Year Olds | 0 (0.0%) | 0 (0.0%) |
| 5 to 9 Year Old | 161 (100.0%) | 0 (0.0%) |
| 10 to 14 Year Olds | 197 (98.0%) | 4 (2.0%) |
| 15 to 17 Year Olds | 69 (93.2%) | 5 (6.8%) |
| 18 to 19 Year Olds | 0 (0.0%) | 0 (0.0%) |
| 20 to 24 Year Olds | 0 (0.0%) | 0 (0.0%) |
| 25 to 34 Year Olds | 19 (36.5%) | 33 (63.5%) |
| 35 Years and over | 13 (26.5%) | 36 (73.5%) |
| Total | 459 (85.5%) | 78 (14.5%) |
Educational Attainment by Field of Study in Santa Rosa
Science & technology (108 | 33.2%), education (67 | 20.6%), social sciences (34 | 10.5%), arts & humanities (27 | 8.3%), and bio, nature & agricultural (22 | 6.8%) are the most common fields of study among 325 individuals in Santa Rosa who have obtained a bachelor's degree or higher.
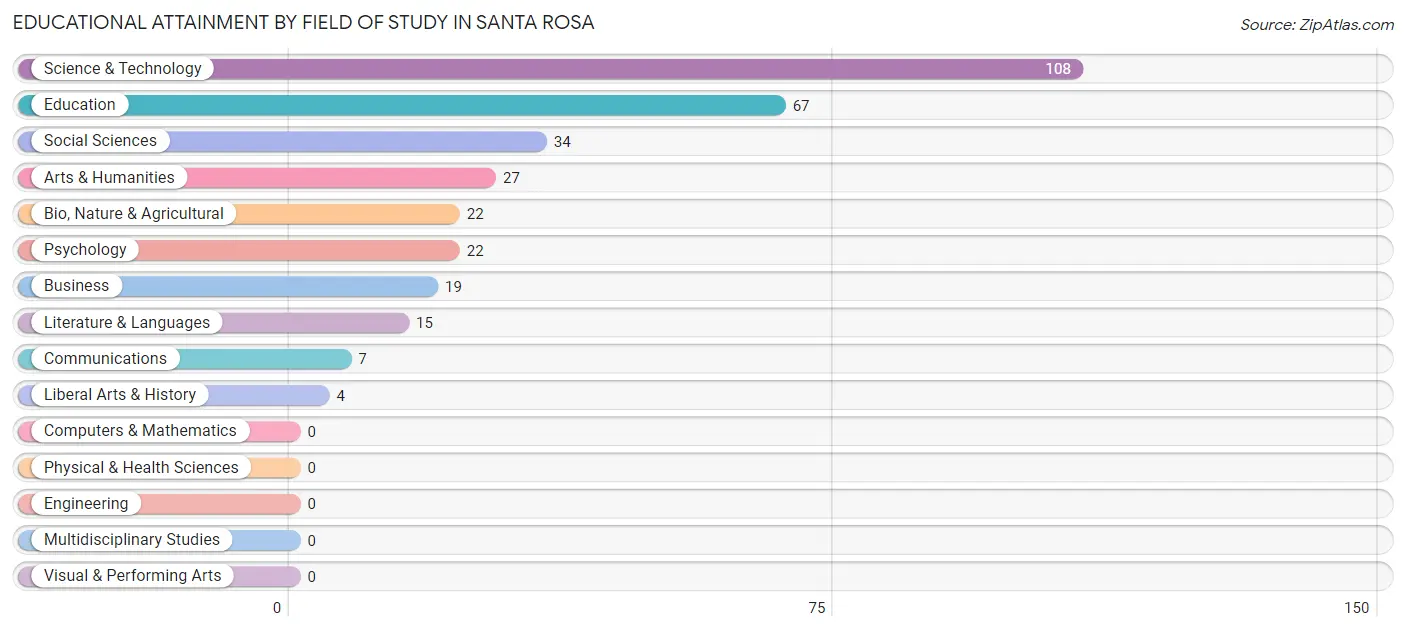
| Field of Study | # Graduates | % Graduates |
| Computers & Mathematics | 0 | 0.0% |
| Bio, Nature & Agricultural | 22 | 6.8% |
| Physical & Health Sciences | 0 | 0.0% |
| Psychology | 22 | 6.8% |
| Social Sciences | 34 | 10.5% |
| Engineering | 0 | 0.0% |
| Multidisciplinary Studies | 0 | 0.0% |
| Science & Technology | 108 | 33.2% |
| Business | 19 | 5.9% |
| Education | 67 | 20.6% |
| Literature & Languages | 15 | 4.6% |
| Liberal Arts & History | 4 | 1.2% |
| Visual & Performing Arts | 0 | 0.0% |
| Communications | 7 | 2.1% |
| Arts & Humanities | 27 | 8.3% |
| Total | 325 | 100.0% |
Transportation & Commute in Santa Rosa
Vehicle Availability by Sex in Santa Rosa
The most prevalent vehicle ownership categories in Santa Rosa are males with 2 vehicles (234, accounting for 53.1%) and females with 2 vehicles (82, making up 56.7%).
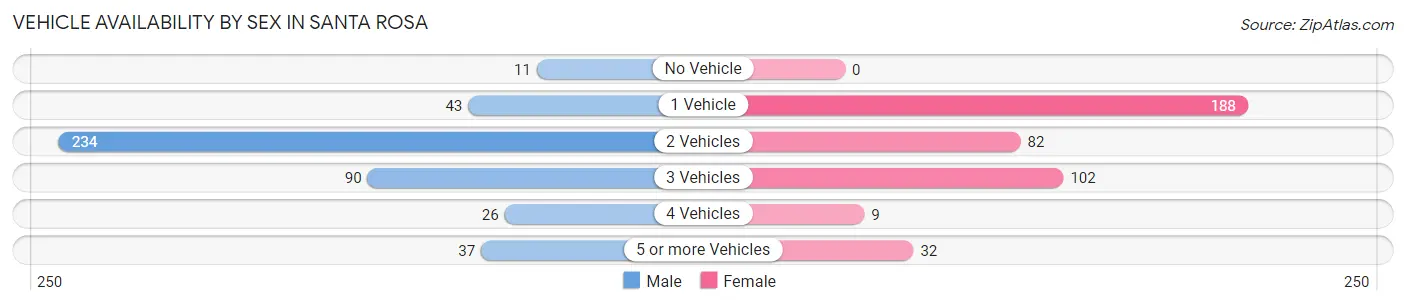
| Vehicles Available | Male | Female |
| No Vehicle | 11 (2.5%) | 0 (0.0%) |
| 1 Vehicle | 43 (9.8%) | 188 (45.5%) |
| 2 Vehicles | 234 (53.1%) | 82 (19.9%) |
| 3 Vehicles | 90 (20.4%) | 102 (24.7%) |
| 4 Vehicles | 26 (5.9%) | 9 (2.2%) |
| 5 or more Vehicles | 37 (8.4%) | 32 (7.7%) |
| Total | 441 (100.0%) | 413 (100.0%) |
Commute Time in Santa Rosa
The most frequently occuring commute durations in Santa Rosa are 5 to 9 minutes (252 commuters, 29.7%), less than 5 minutes (249 commuters, 29.4%), and 10 to 14 minutes (120 commuters, 14.1%).
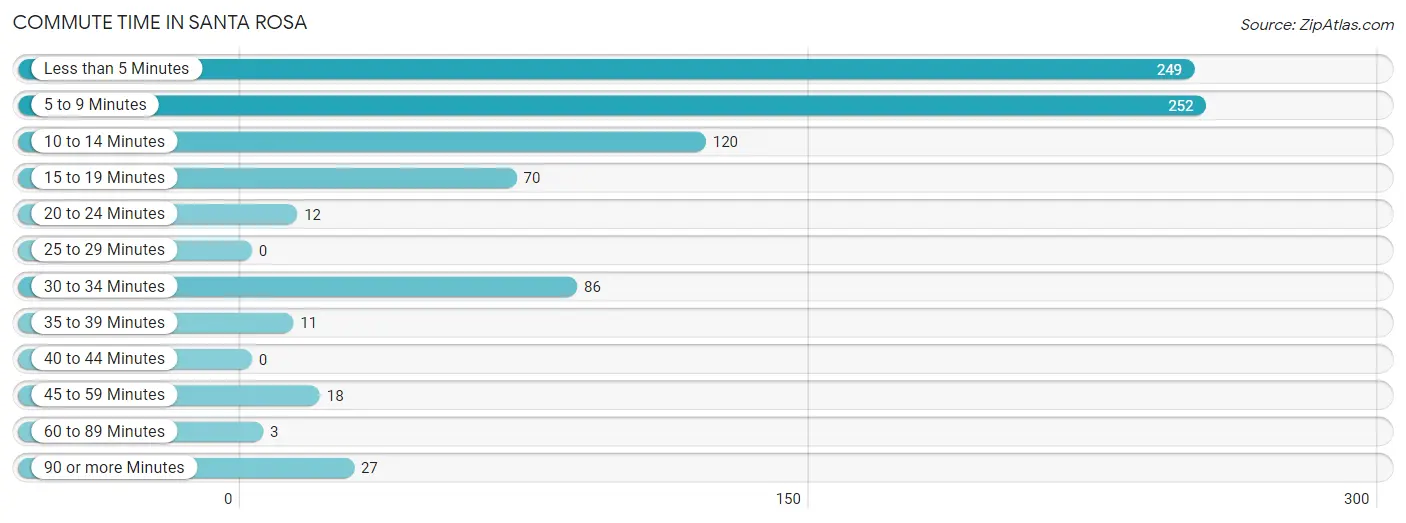
| Commute Time | # Commuters | % Commuters |
| Less than 5 Minutes | 249 | 29.4% |
| 5 to 9 Minutes | 252 | 29.7% |
| 10 to 14 Minutes | 120 | 14.1% |
| 15 to 19 Minutes | 70 | 8.3% |
| 20 to 24 Minutes | 12 | 1.4% |
| 25 to 29 Minutes | 0 | 0.0% |
| 30 to 34 Minutes | 86 | 10.1% |
| 35 to 39 Minutes | 11 | 1.3% |
| 40 to 44 Minutes | 0 | 0.0% |
| 45 to 59 Minutes | 18 | 2.1% |
| 60 to 89 Minutes | 3 | 0.4% |
| 90 or more Minutes | 27 | 3.2% |
Commute Time by Sex in Santa Rosa
The most common commute times in Santa Rosa are less than 5 minutes (145 commuters, 32.9%) for males and 5 to 9 minutes (158 commuters, 38.8%) for females.
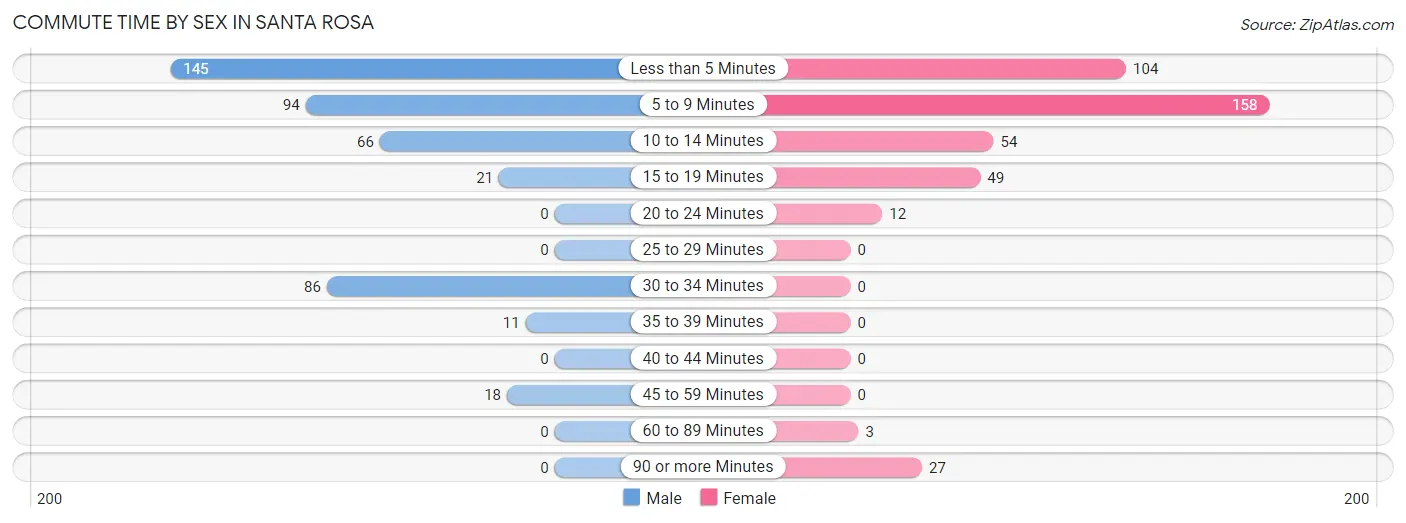
| Commute Time | Male | Female |
| Less than 5 Minutes | 145 (32.9%) | 104 (25.6%) |
| 5 to 9 Minutes | 94 (21.3%) | 158 (38.8%) |
| 10 to 14 Minutes | 66 (15.0%) | 54 (13.3%) |
| 15 to 19 Minutes | 21 (4.8%) | 49 (12.0%) |
| 20 to 24 Minutes | 0 (0.0%) | 12 (2.9%) |
| 25 to 29 Minutes | 0 (0.0%) | 0 (0.0%) |
| 30 to 34 Minutes | 86 (19.5%) | 0 (0.0%) |
| 35 to 39 Minutes | 11 (2.5%) | 0 (0.0%) |
| 40 to 44 Minutes | 0 (0.0%) | 0 (0.0%) |
| 45 to 59 Minutes | 18 (4.1%) | 0 (0.0%) |
| 60 to 89 Minutes | 0 (0.0%) | 3 (0.7%) |
| 90 or more Minutes | 0 (0.0%) | 27 (6.6%) |
Time of Departure to Work by Sex in Santa Rosa
The most frequent times of departure to work in Santa Rosa are 6:30 AM to 6:59 AM (94, 21.3%) for males and 7:30 AM to 7:59 AM (127, 31.2%) for females.
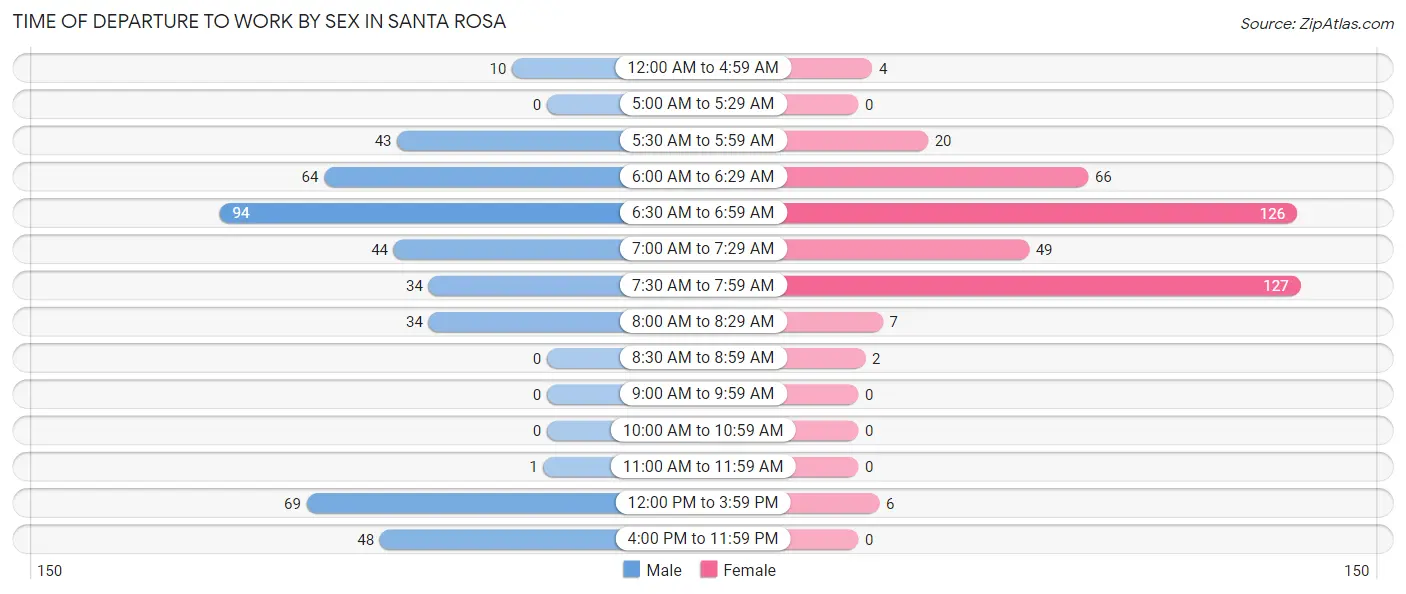
| Time of Departure | Male | Female |
| 12:00 AM to 4:59 AM | 10 (2.3%) | 4 (1.0%) |
| 5:00 AM to 5:29 AM | 0 (0.0%) | 0 (0.0%) |
| 5:30 AM to 5:59 AM | 43 (9.8%) | 20 (4.9%) |
| 6:00 AM to 6:29 AM | 64 (14.5%) | 66 (16.2%) |
| 6:30 AM to 6:59 AM | 94 (21.3%) | 126 (31.0%) |
| 7:00 AM to 7:29 AM | 44 (10.0%) | 49 (12.0%) |
| 7:30 AM to 7:59 AM | 34 (7.7%) | 127 (31.2%) |
| 8:00 AM to 8:29 AM | 34 (7.7%) | 7 (1.7%) |
| 8:30 AM to 8:59 AM | 0 (0.0%) | 2 (0.5%) |
| 9:00 AM to 9:59 AM | 0 (0.0%) | 0 (0.0%) |
| 10:00 AM to 10:59 AM | 0 (0.0%) | 0 (0.0%) |
| 11:00 AM to 11:59 AM | 1 (0.2%) | 0 (0.0%) |
| 12:00 PM to 3:59 PM | 69 (15.7%) | 6 (1.5%) |
| 4:00 PM to 11:59 PM | 48 (10.9%) | 0 (0.0%) |
| Total | 441 (100.0%) | 407 (100.0%) |
Housing Occupancy in Santa Rosa
Occupancy by Ownership in Santa Rosa
Of the total 680 dwellings in Santa Rosa, owner-occupied units account for 522 (76.8%), while renter-occupied units make up 158 (23.2%).
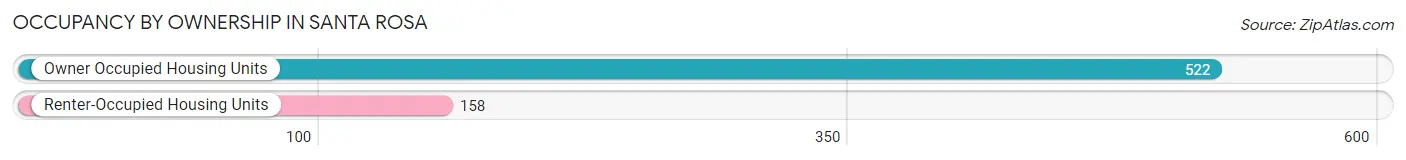
| Occupancy | # Housing Units | % Housing Units |
| Owner Occupied Housing Units | 522 | 76.8% |
| Renter-Occupied Housing Units | 158 | 23.2% |
| Total Occupied Housing Units | 680 | 100.0% |
Occupancy by Household Size in Santa Rosa
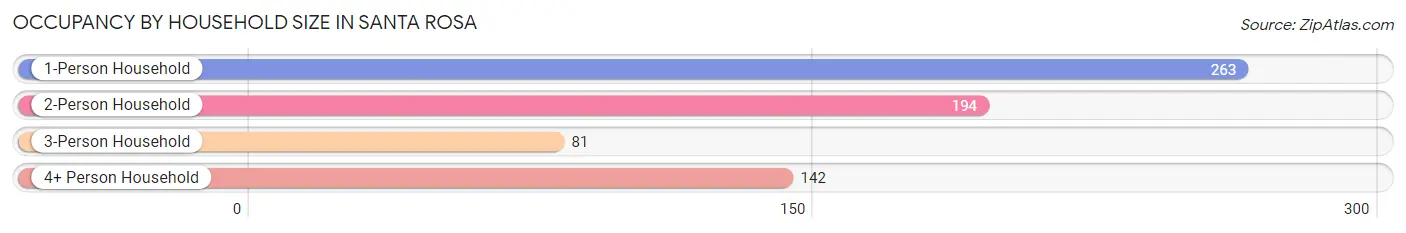
| Household Size | # Housing Units | % Housing Units |
| 1-Person Household | 263 | 38.7% |
| 2-Person Household | 194 | 28.5% |
| 3-Person Household | 81 | 11.9% |
| 4+ Person Household | 142 | 20.9% |
| Total Housing Units | 680 | 100.0% |
Occupancy by Ownership by Household Size in Santa Rosa
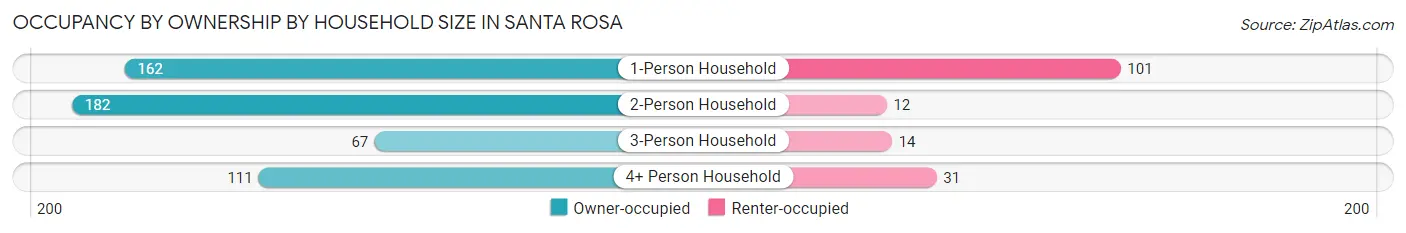
| Household Size | Owner-occupied | Renter-occupied |
| 1-Person Household | 162 (61.6%) | 101 (38.4%) |
| 2-Person Household | 182 (93.8%) | 12 (6.2%) |
| 3-Person Household | 67 (82.7%) | 14 (17.3%) |
| 4+ Person Household | 111 (78.2%) | 31 (21.8%) |
| Total Housing Units | 522 (76.8%) | 158 (23.2%) |
Occupancy by Educational Attainment in Santa Rosa
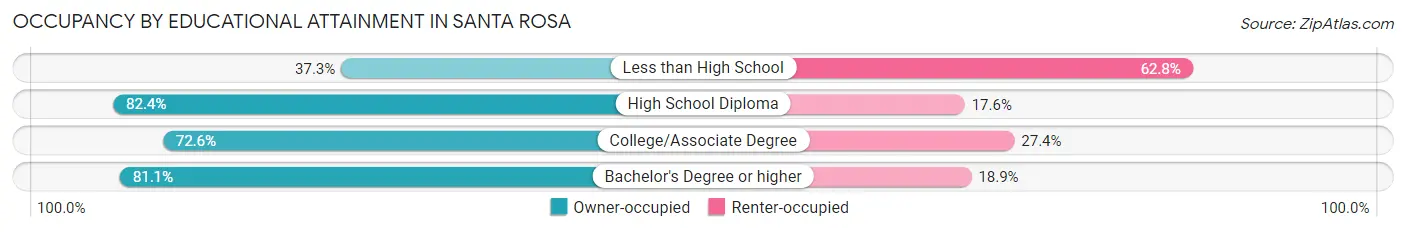
| Household Size | Owner-occupied | Renter-occupied |
| Less than High School | 19 (37.2%) | 32 (62.7%) |
| High School Diploma | 324 (82.4%) | 69 (17.6%) |
| College/Associate Degree | 106 (72.6%) | 40 (27.4%) |
| Bachelor's Degree or higher | 73 (81.1%) | 17 (18.9%) |
Occupancy by Age of Householder in Santa Rosa
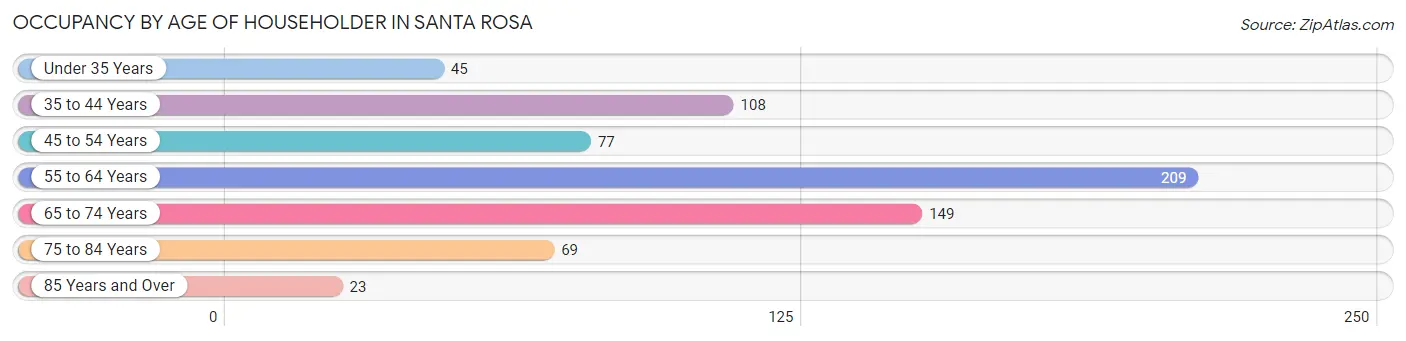
| Age Bracket | # Households | % Households |
| Under 35 Years | 45 | 6.6% |
| 35 to 44 Years | 108 | 15.9% |
| 45 to 54 Years | 77 | 11.3% |
| 55 to 64 Years | 209 | 30.7% |
| 65 to 74 Years | 149 | 21.9% |
| 75 to 84 Years | 69 | 10.2% |
| 85 Years and Over | 23 | 3.4% |
| Total | 680 | 100.0% |
Housing Finances in Santa Rosa
Median Income by Occupancy in Santa Rosa
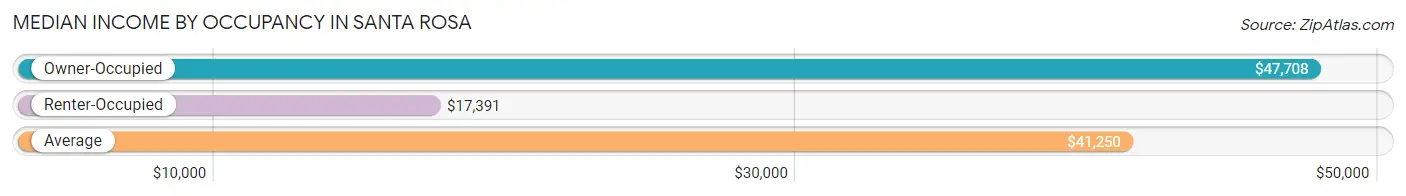
| Occupancy Type | # Households | Median Income |
| Owner-Occupied | 522 (76.8%) | $47,708 |
| Renter-Occupied | 158 (23.2%) | $17,391 |
| Average | 680 (100.0%) | $41,250 |
Occupancy by Householder Income Bracket in Santa Rosa
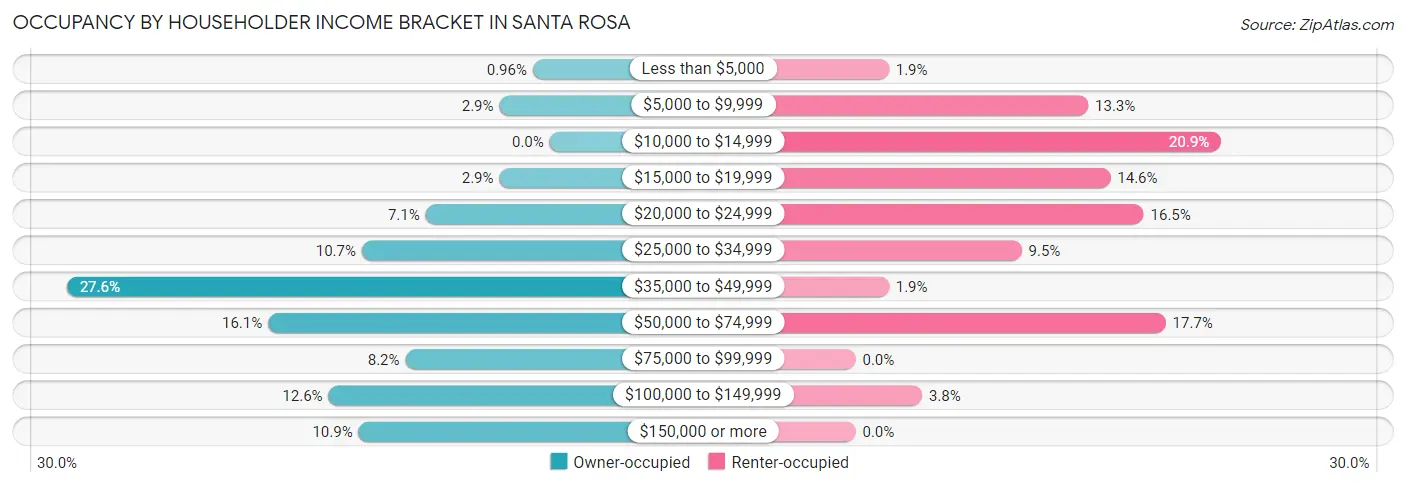
| Income Bracket | Owner-occupied | Renter-occupied |
| Less than $5,000 | 5 (1.0%) | 3 (1.9%) |
| $5,000 to $9,999 | 15 (2.9%) | 21 (13.3%) |
| $10,000 to $14,999 | 0 (0.0%) | 33 (20.9%) |
| $15,000 to $19,999 | 15 (2.9%) | 23 (14.6%) |
| $20,000 to $24,999 | 37 (7.1%) | 26 (16.5%) |
| $25,000 to $34,999 | 56 (10.7%) | 15 (9.5%) |
| $35,000 to $49,999 | 144 (27.6%) | 3 (1.9%) |
| $50,000 to $74,999 | 84 (16.1%) | 28 (17.7%) |
| $75,000 to $99,999 | 43 (8.2%) | 0 (0.0%) |
| $100,000 to $149,999 | 66 (12.6%) | 6 (3.8%) |
| $150,000 or more | 57 (10.9%) | 0 (0.0%) |
| Total | 522 (100.0%) | 158 (100.0%) |
Monthly Housing Cost Tiers in Santa Rosa
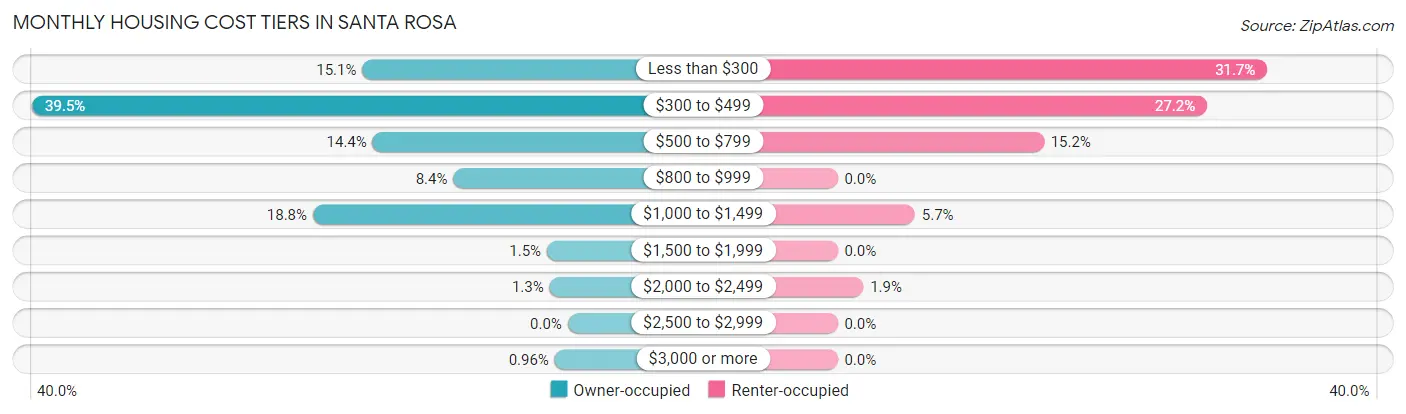
| Monthly Cost | Owner-occupied | Renter-occupied |
| Less than $300 | 79 (15.1%) | 50 (31.7%) |
| $300 to $499 | 206 (39.5%) | 43 (27.2%) |
| $500 to $799 | 75 (14.4%) | 24 (15.2%) |
| $800 to $999 | 44 (8.4%) | 0 (0.0%) |
| $1,000 to $1,499 | 98 (18.8%) | 9 (5.7%) |
| $1,500 to $1,999 | 8 (1.5%) | 0 (0.0%) |
| $2,000 to $2,499 | 7 (1.3%) | 3 (1.9%) |
| $2,500 to $2,999 | 0 (0.0%) | 0 (0.0%) |
| $3,000 or more | 5 (1.0%) | 0 (0.0%) |
| Total | 522 (100.0%) | 158 (100.0%) |
Physical Housing Characteristics in Santa Rosa
Housing Structures in Santa Rosa
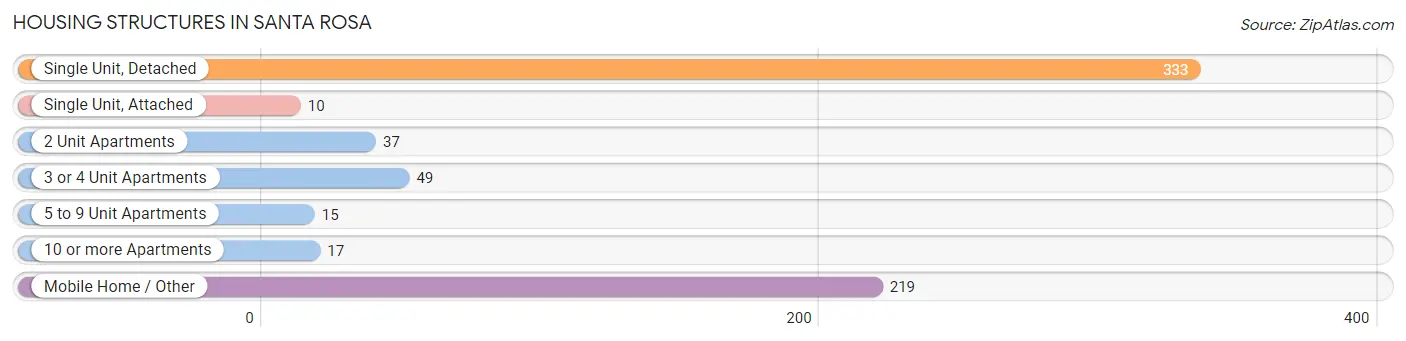
| Structure Type | # Housing Units | % Housing Units |
| Single Unit, Detached | 333 | 49.0% |
| Single Unit, Attached | 10 | 1.5% |
| 2 Unit Apartments | 37 | 5.4% |
| 3 or 4 Unit Apartments | 49 | 7.2% |
| 5 to 9 Unit Apartments | 15 | 2.2% |
| 10 or more Apartments | 17 | 2.5% |
| Mobile Home / Other | 219 | 32.2% |
| Total | 680 | 100.0% |
Housing Structures by Occupancy in Santa Rosa
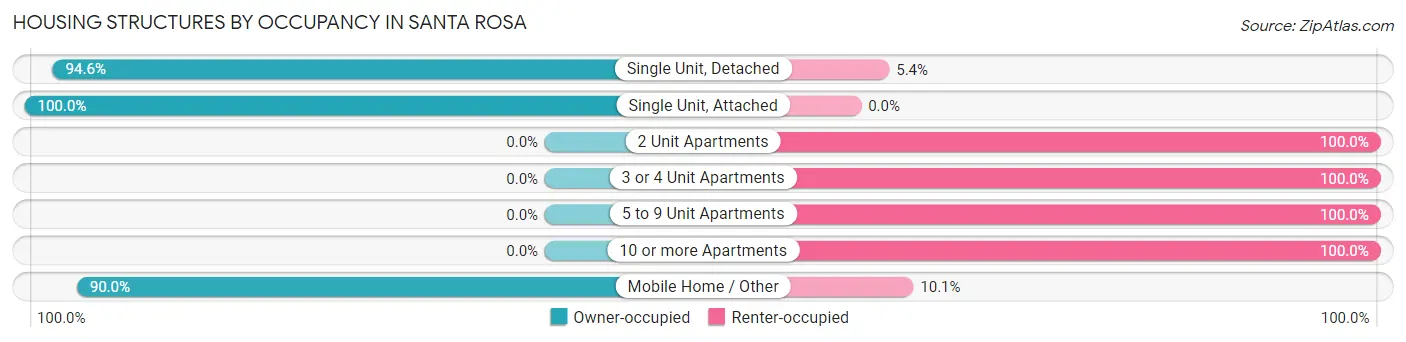
| Structure Type | Owner-occupied | Renter-occupied |
| Single Unit, Detached | 315 (94.6%) | 18 (5.4%) |
| Single Unit, Attached | 10 (100.0%) | 0 (0.0%) |
| 2 Unit Apartments | 0 (0.0%) | 37 (100.0%) |
| 3 or 4 Unit Apartments | 0 (0.0%) | 49 (100.0%) |
| 5 to 9 Unit Apartments | 0 (0.0%) | 15 (100.0%) |
| 10 or more Apartments | 0 (0.0%) | 17 (100.0%) |
| Mobile Home / Other | 197 (89.9%) | 22 (10.1%) |
| Total | 522 (76.8%) | 158 (23.2%) |
Housing Structures by Number of Rooms in Santa Rosa
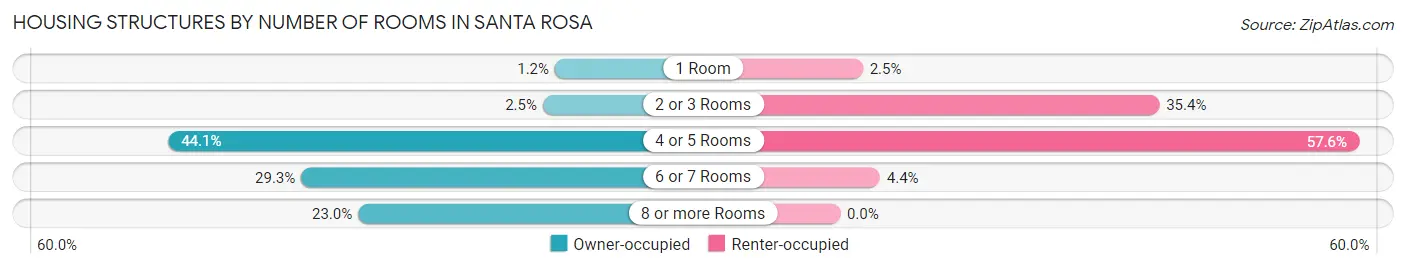
| Number of Rooms | Owner-occupied | Renter-occupied |
| 1 Room | 6 (1.1%) | 4 (2.5%) |
| 2 or 3 Rooms | 13 (2.5%) | 56 (35.4%) |
| 4 or 5 Rooms | 230 (44.1%) | 91 (57.6%) |
| 6 or 7 Rooms | 153 (29.3%) | 7 (4.4%) |
| 8 or more Rooms | 120 (23.0%) | 0 (0.0%) |
| Total | 522 (100.0%) | 158 (100.0%) |
Housing Structure by Heating Type in Santa Rosa
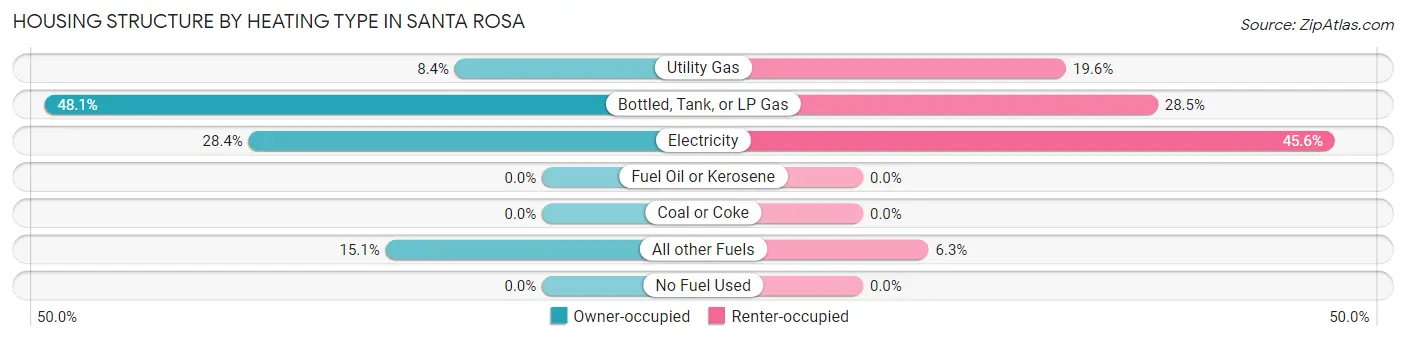
| Heating Type | Owner-occupied | Renter-occupied |
| Utility Gas | 44 (8.4%) | 31 (19.6%) |
| Bottled, Tank, or LP Gas | 251 (48.1%) | 45 (28.5%) |
| Electricity | 148 (28.3%) | 72 (45.6%) |
| Fuel Oil or Kerosene | 0 (0.0%) | 0 (0.0%) |
| Coal or Coke | 0 (0.0%) | 0 (0.0%) |
| All other Fuels | 79 (15.1%) | 10 (6.3%) |
| No Fuel Used | 0 (0.0%) | 0 (0.0%) |
| Total | 522 (100.0%) | 158 (100.0%) |
Household Vehicle Usage in Santa Rosa
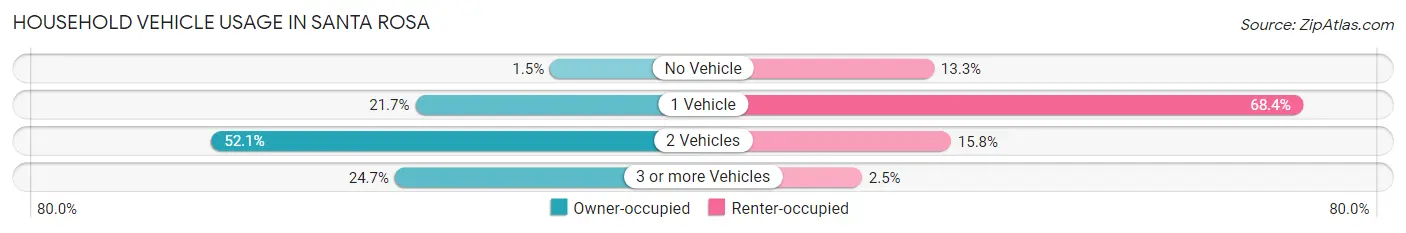
| Vehicles per Household | Owner-occupied | Renter-occupied |
| No Vehicle | 8 (1.5%) | 21 (13.3%) |
| 1 Vehicle | 113 (21.6%) | 108 (68.3%) |
| 2 Vehicles | 272 (52.1%) | 25 (15.8%) |
| 3 or more Vehicles | 129 (24.7%) | 4 (2.5%) |
| Total | 522 (100.0%) | 158 (100.0%) |
Real Estate & Mortgages in Santa Rosa
Real Estate and Mortgage Overview in Santa Rosa
| Characteristic | Without Mortgage | With Mortgage |
| Housing Units | 357 | 165 |
| Median Property Value | $107,300 | $139,800 |
| Median Household Income | $39,983 | $44 |
| Monthly Housing Costs | $374 | $5 |
| Real Estate Taxes | $331 | $0 |
Property Value by Mortgage Status in Santa Rosa
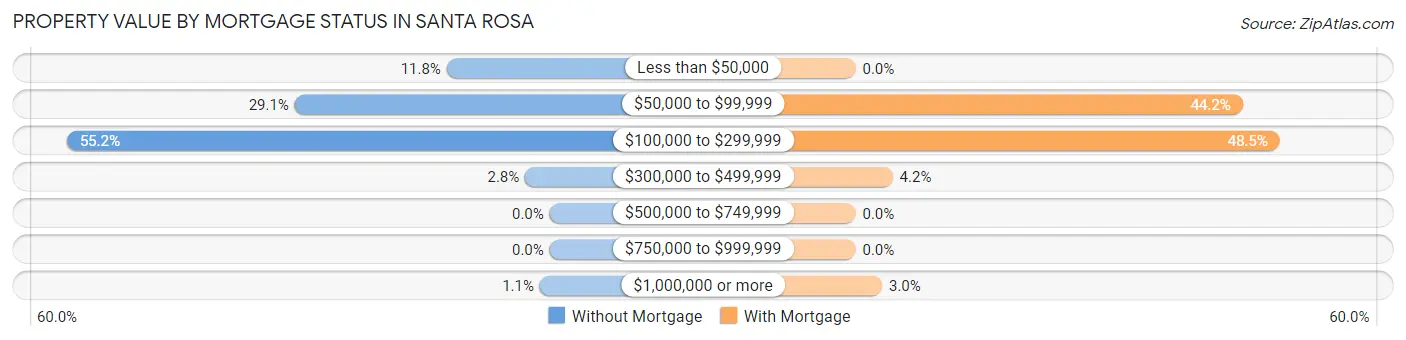
| Property Value | Without Mortgage | With Mortgage |
| Less than $50,000 | 42 (11.8%) | 0 (0.0%) |
| $50,000 to $99,999 | 104 (29.1%) | 73 (44.2%) |
| $100,000 to $299,999 | 197 (55.2%) | 80 (48.5%) |
| $300,000 to $499,999 | 10 (2.8%) | 7 (4.2%) |
| $500,000 to $749,999 | 0 (0.0%) | 0 (0.0%) |
| $750,000 to $999,999 | 0 (0.0%) | 0 (0.0%) |
| $1,000,000 or more | 4 (1.1%) | 5 (3.0%) |
| Total | 357 (100.0%) | 165 (100.0%) |
Household Income by Mortgage Status in Santa Rosa
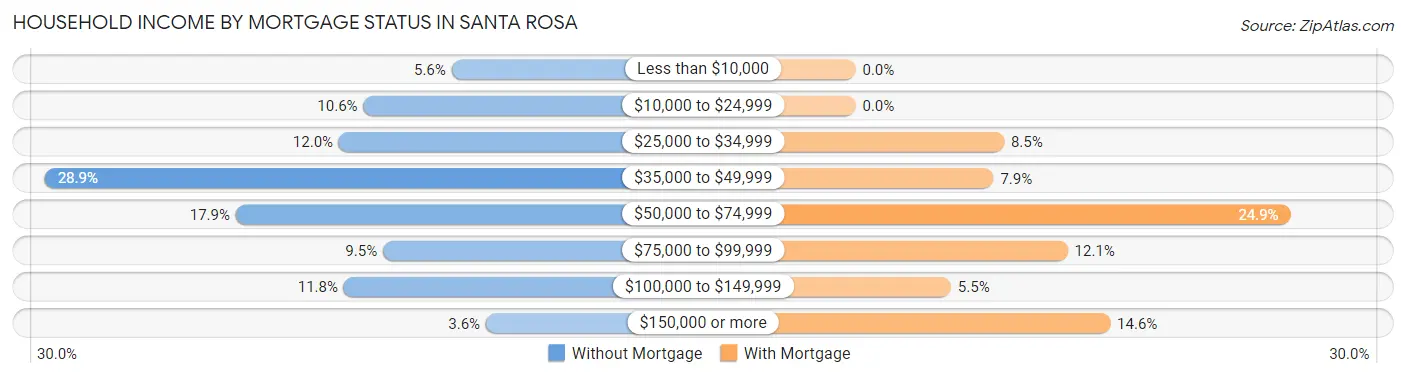
| Household Income | Without Mortgage | With Mortgage |
| Less than $10,000 | 20 (5.6%) | 0 (0.0%) |
| $10,000 to $24,999 | 38 (10.6%) | 0 (0.0%) |
| $25,000 to $34,999 | 43 (12.0%) | 14 (8.5%) |
| $35,000 to $49,999 | 103 (28.8%) | 13 (7.9%) |
| $50,000 to $74,999 | 64 (17.9%) | 41 (24.8%) |
| $75,000 to $99,999 | 34 (9.5%) | 20 (12.1%) |
| $100,000 to $149,999 | 42 (11.8%) | 9 (5.4%) |
| $150,000 or more | 13 (3.6%) | 24 (14.5%) |
| Total | 357 (100.0%) | 165 (100.0%) |
Property Value to Household Income Ratio in Santa Rosa
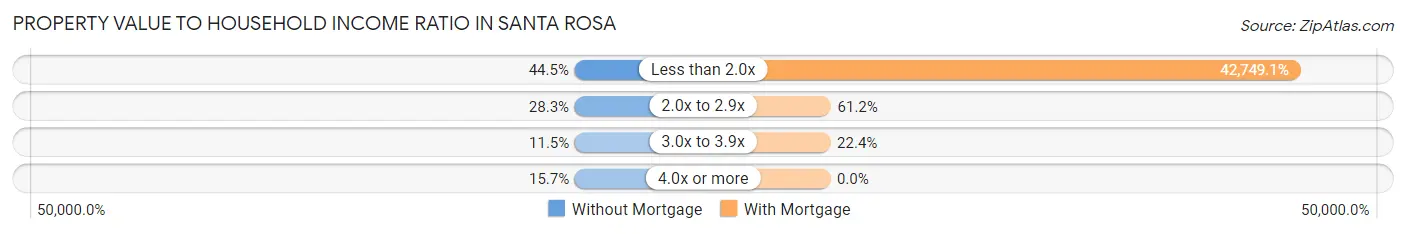
| Value-to-Income Ratio | Without Mortgage | With Mortgage |
| Less than 2.0x | 159 (44.5%) | 70,536 (42,749.1%) |
| 2.0x to 2.9x | 101 (28.3%) | 101 (61.2%) |
| 3.0x to 3.9x | 41 (11.5%) | 37 (22.4%) |
| 4.0x or more | 56 (15.7%) | 0 (0.0%) |
| Total | 357 (100.0%) | 165 (100.0%) |
Real Estate Taxes by Mortgage Status in Santa Rosa
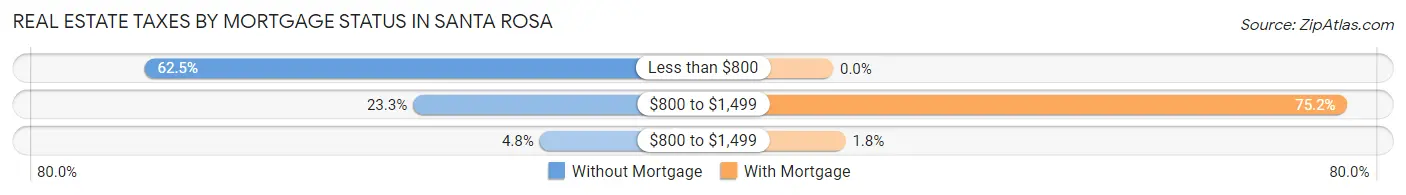
| Property Taxes | Without Mortgage | With Mortgage |
| Less than $800 | 223 (62.5%) | 0 (0.0%) |
| $800 to $1,499 | 83 (23.3%) | 124 (75.1%) |
| $800 to $1,499 | 17 (4.8%) | 3 (1.8%) |
| Total | 357 (100.0%) | 165 (100.0%) |
Health & Disability in Santa Rosa
Health Insurance Coverage by Age in Santa Rosa
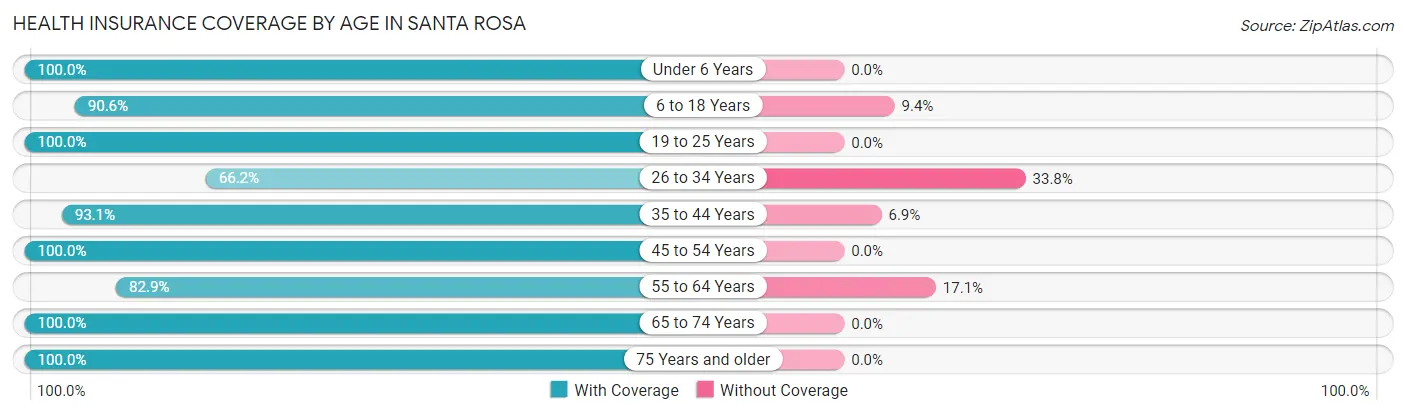
| Age Bracket | With Coverage | Without Coverage |
| Under 6 Years | 169 (100.0%) | 0 (0.0%) |
| 6 to 18 Years | 377 (90.6%) | 39 (9.4%) |
| 19 to 25 Years | 109 (100.0%) | 0 (0.0%) |
| 26 to 34 Years | 92 (66.2%) | 47 (33.8%) |
| 35 to 44 Years | 322 (93.1%) | 24 (6.9%) |
| 45 to 54 Years | 187 (100.0%) | 0 (0.0%) |
| 55 to 64 Years | 364 (82.9%) | 75 (17.1%) |
| 65 to 74 Years | 245 (100.0%) | 0 (0.0%) |
| 75 Years and older | 155 (100.0%) | 0 (0.0%) |
| Total | 2,020 (91.6%) | 185 (8.4%) |
Health Insurance Coverage by Citizenship Status in Santa Rosa
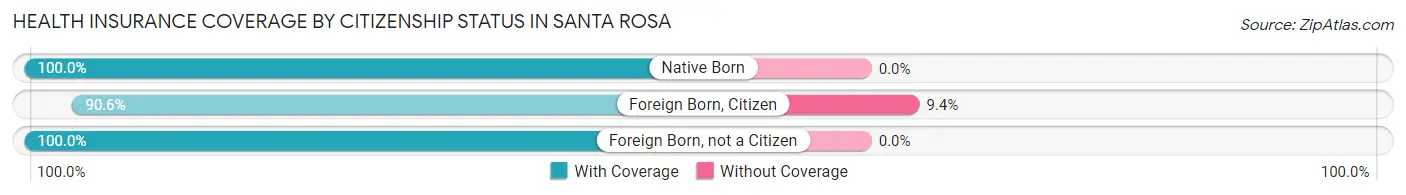
| Citizenship Status | With Coverage | Without Coverage |
| Native Born | 169 (100.0%) | 0 (0.0%) |
| Foreign Born, Citizen | 377 (90.6%) | 39 (9.4%) |
| Foreign Born, not a Citizen | 109 (100.0%) | 0 (0.0%) |
Health Insurance Coverage by Household Income in Santa Rosa
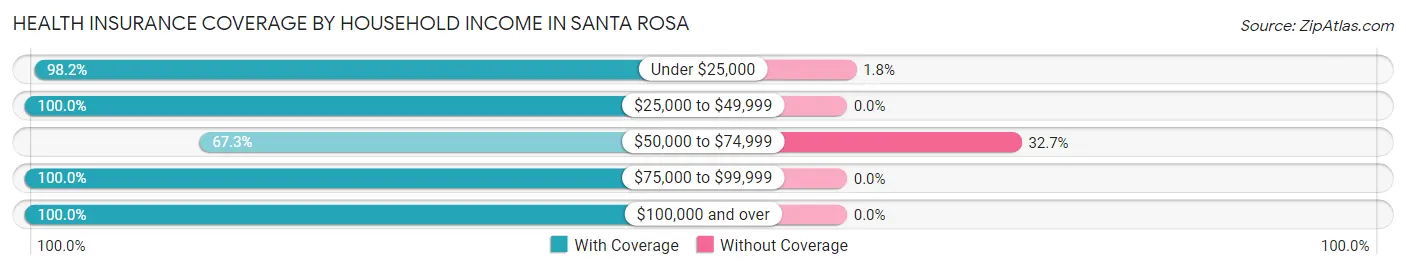
| Household Income | With Coverage | Without Coverage |
| Under $25,000 | 446 (98.2%) | 8 (1.8%) |
| $25,000 to $49,999 | 580 (100.0%) | 0 (0.0%) |
| $50,000 to $74,999 | 364 (67.3%) | 177 (32.7%) |
| $75,000 to $99,999 | 107 (100.0%) | 0 (0.0%) |
| $100,000 and over | 521 (100.0%) | 0 (0.0%) |
Public vs Private Health Insurance Coverage by Age in Santa Rosa
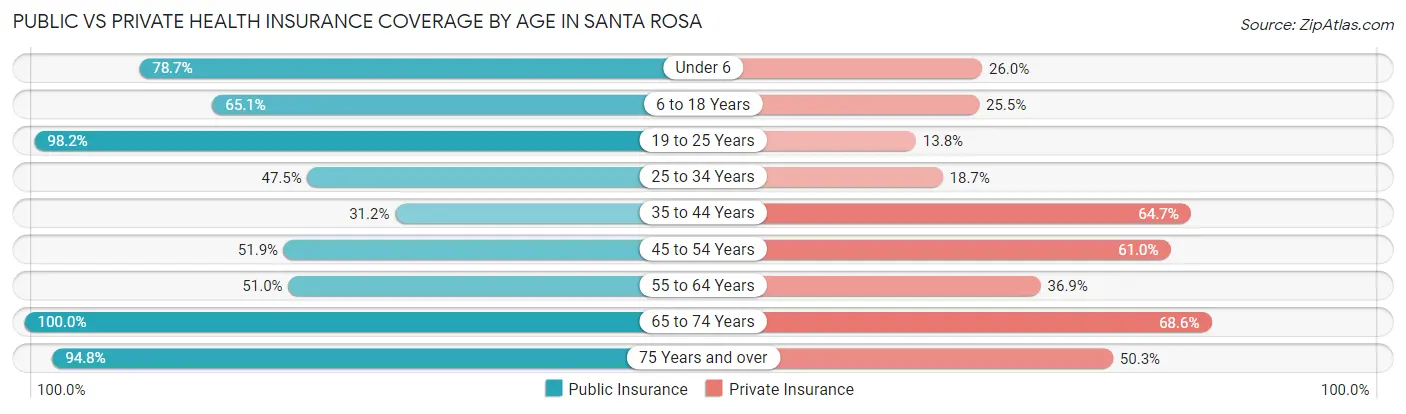
| Age Bracket | Public Insurance | Private Insurance |
| Under 6 | 133 (78.7%) | 44 (26.0%) |
| 6 to 18 Years | 271 (65.1%) | 106 (25.5%) |
| 19 to 25 Years | 107 (98.2%) | 15 (13.8%) |
| 25 to 34 Years | 66 (47.5%) | 26 (18.7%) |
| 35 to 44 Years | 108 (31.2%) | 224 (64.7%) |
| 45 to 54 Years | 97 (51.9%) | 114 (61.0%) |
| 55 to 64 Years | 224 (51.0%) | 162 (36.9%) |
| 65 to 74 Years | 245 (100.0%) | 168 (68.6%) |
| 75 Years and over | 147 (94.8%) | 78 (50.3%) |
| Total | 1,398 (63.4%) | 937 (42.5%) |
Disability Status by Sex by Age in Santa Rosa
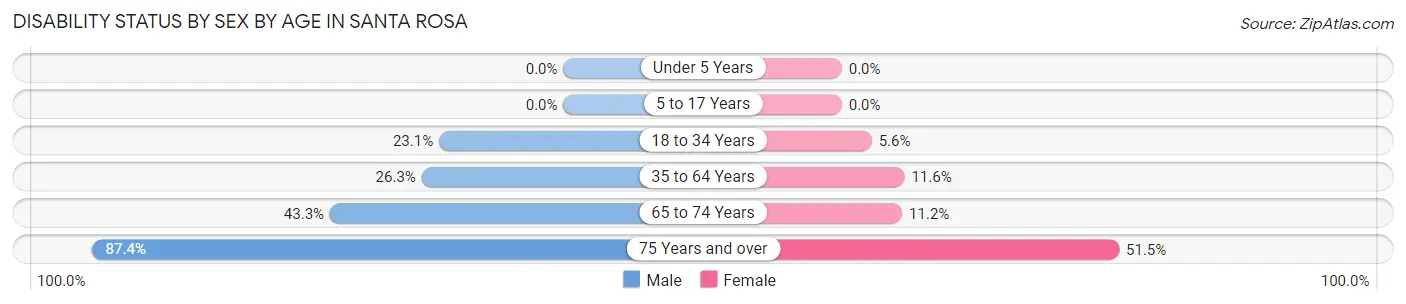
| Age Bracket | Male | Female |
| Under 5 Years | 0 (0.0%) | 0 (0.0%) |
| 5 to 17 Years | 0 (0.0%) | 0 (0.0%) |
| 18 to 34 Years | 24 (23.1%) | 8 (5.6%) |
| 35 to 64 Years | 111 (26.3%) | 64 (11.6%) |
| 65 to 74 Years | 52 (43.3%) | 14 (11.2%) |
| 75 Years and over | 76 (87.4%) | 35 (51.5%) |
Disability Class by Sex by Age in Santa Rosa
Disability Class: Hearing Difficulty
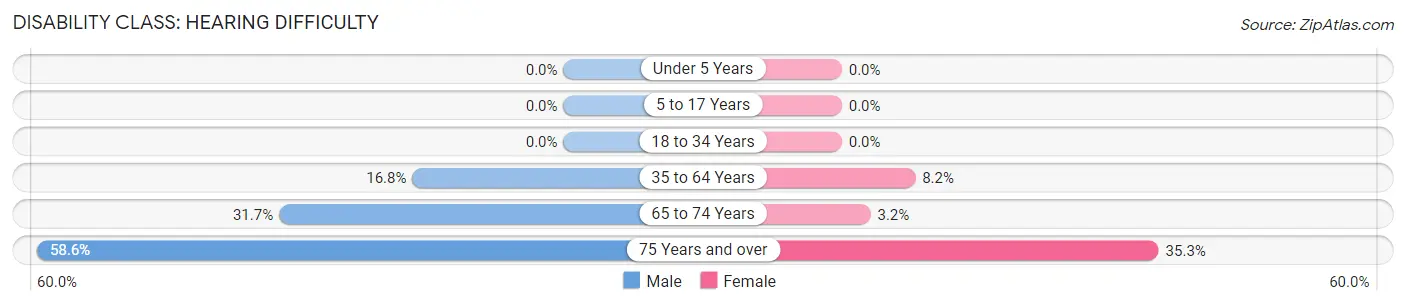
| Age Bracket | Male | Female |
| Under 5 Years | 0 (0.0%) | 0 (0.0%) |
| 5 to 17 Years | 0 (0.0%) | 0 (0.0%) |
| 18 to 34 Years | 0 (0.0%) | 0 (0.0%) |
| 35 to 64 Years | 71 (16.8%) | 45 (8.2%) |
| 65 to 74 Years | 38 (31.7%) | 4 (3.2%) |
| 75 Years and over | 51 (58.6%) | 24 (35.3%) |
Disability Class: Vision Difficulty
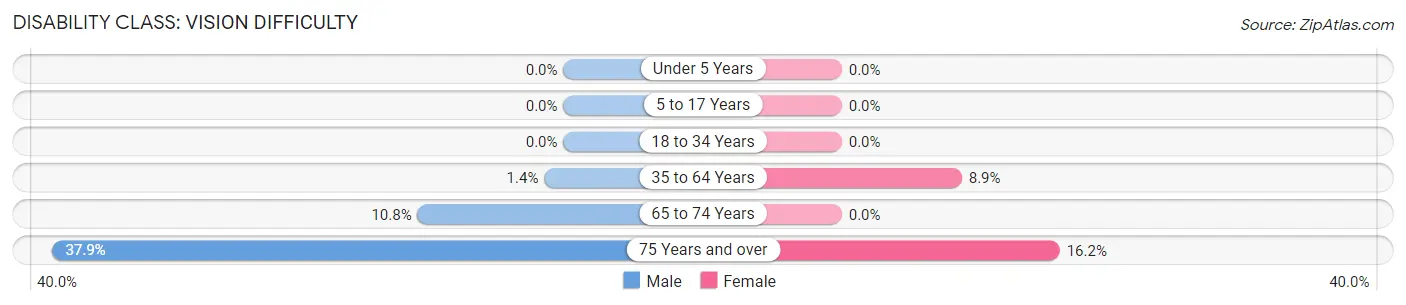
| Age Bracket | Male | Female |
| Under 5 Years | 0 (0.0%) | 0 (0.0%) |
| 5 to 17 Years | 0 (0.0%) | 0 (0.0%) |
| 18 to 34 Years | 0 (0.0%) | 0 (0.0%) |
| 35 to 64 Years | 6 (1.4%) | 49 (8.9%) |
| 65 to 74 Years | 13 (10.8%) | 0 (0.0%) |
| 75 Years and over | 33 (37.9%) | 11 (16.2%) |
Disability Class: Cognitive Difficulty
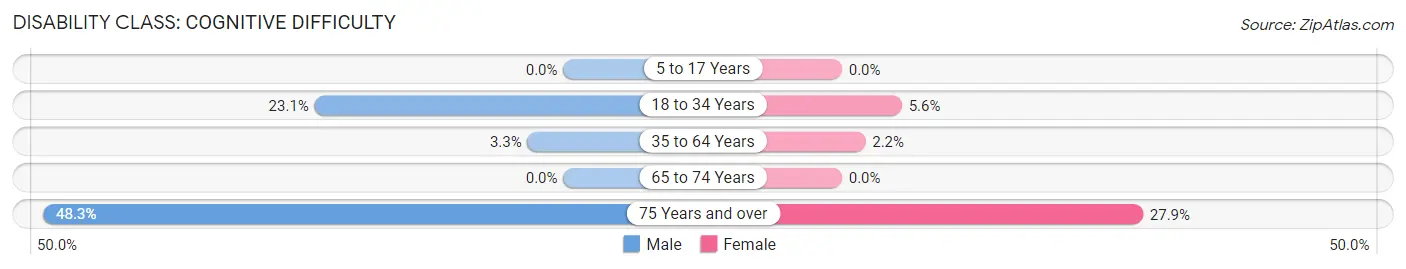
| Age Bracket | Male | Female |
| 5 to 17 Years | 0 (0.0%) | 0 (0.0%) |
| 18 to 34 Years | 24 (23.1%) | 8 (5.6%) |
| 35 to 64 Years | 14 (3.3%) | 12 (2.2%) |
| 65 to 74 Years | 0 (0.0%) | 0 (0.0%) |
| 75 Years and over | 42 (48.3%) | 19 (27.9%) |
Disability Class: Ambulatory Difficulty
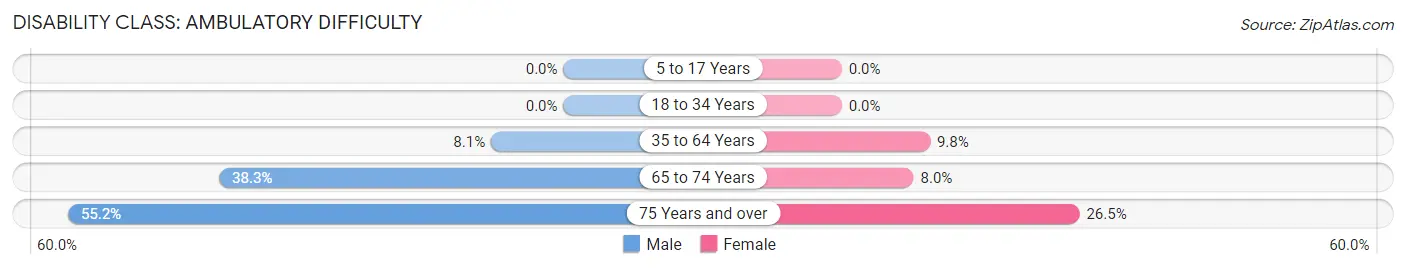
| Age Bracket | Male | Female |
| 5 to 17 Years | 0 (0.0%) | 0 (0.0%) |
| 18 to 34 Years | 0 (0.0%) | 0 (0.0%) |
| 35 to 64 Years | 34 (8.1%) | 54 (9.8%) |
| 65 to 74 Years | 46 (38.3%) | 10 (8.0%) |
| 75 Years and over | 48 (55.2%) | 18 (26.5%) |
Disability Class: Self-Care Difficulty
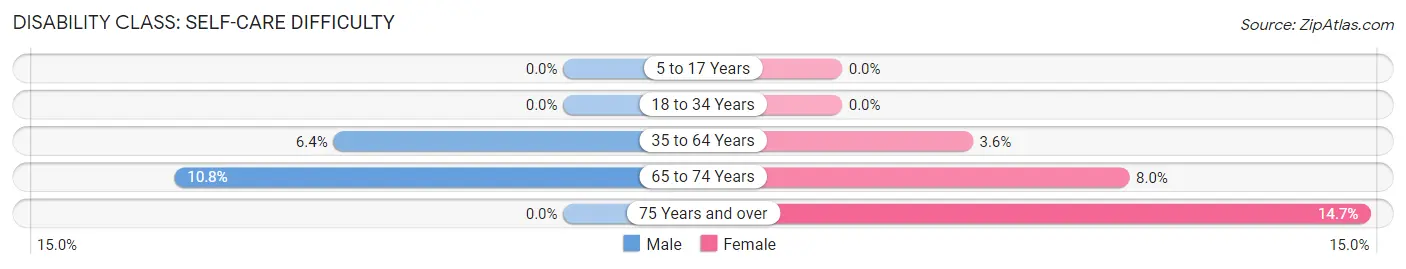
| Age Bracket | Male | Female |
| 5 to 17 Years | 0 (0.0%) | 0 (0.0%) |
| 18 to 34 Years | 0 (0.0%) | 0 (0.0%) |
| 35 to 64 Years | 27 (6.4%) | 20 (3.6%) |
| 65 to 74 Years | 13 (10.8%) | 10 (8.0%) |
| 75 Years and over | 0 (0.0%) | 10 (14.7%) |
Technology Access in Santa Rosa
Computing Device Access in Santa Rosa
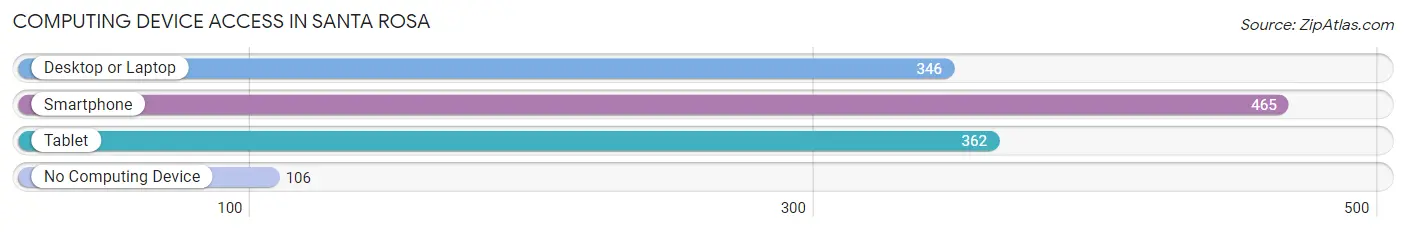
| Device Type | # Households | % Households |
| Desktop or Laptop | 346 | 50.9% |
| Smartphone | 465 | 68.4% |
| Tablet | 362 | 53.2% |
| No Computing Device | 106 | 15.6% |
| Total | 680 | 100.0% |
Internet Access in Santa Rosa
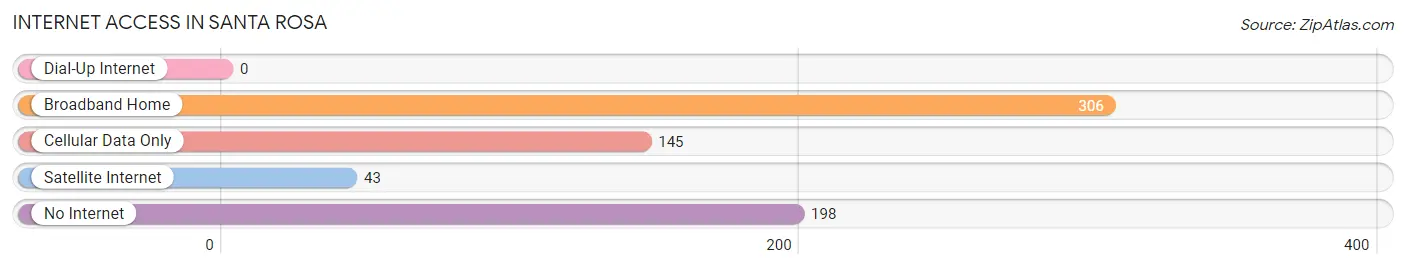
| Internet Type | # Households | % Households |
| Dial-Up Internet | 0 | 0.0% |
| Broadband Home | 306 | 45.0% |
| Cellular Data Only | 145 | 21.3% |
| Satellite Internet | 43 | 6.3% |
| No Internet | 198 | 29.1% |
| Total | 680 | 100.0% |
Santa Rosa Summary
Santa Rosa, New Mexico is a small town located in the eastern part of the state, about an hour and a half east of Albuquerque. It is the county seat of Guadalupe County and is home to a population of approximately 2,700 people. The town is situated in the high desert of the Great Plains, and is surrounded by rolling hills and mesas.
History
Santa Rosa was founded in 1794 by Spanish settlers, who named it after the city of Santa Rosa de Viterbo in Spain. The town was originally a mission and trading post, and was the first settlement in the area. In 1835, the town was officially incorporated as a municipality.
In the late 1800s, Santa Rosa became a popular stop on the Santa Fe Trail, and the town grew rapidly. The railroad arrived in 1881, and the town became a major shipping center for the region. The town was also home to a number of businesses, including a brewery, a flour mill, and a brickyard.
In the early 1900s, Santa Rosa was a bustling town with a population of over 3,000 people. The town was home to a number of businesses, including a hotel, a bank, a movie theater, and a number of stores.
Geography
Santa Rosa is located in the eastern part of New Mexico, about an hour and a half east of Albuquerque. The town is situated in the high desert of the Great Plains, and is surrounded by rolling hills and mesas. The town is located at an elevation of 4,400 feet, and the climate is semi-arid, with hot summers and cold winters.
Economy
Santa Rosa’s economy is largely based on agriculture and tourism. The town is home to a number of farms, which produce a variety of crops, including alfalfa, corn, wheat, and cotton. The town is also home to a number of tourist attractions, including the Santa Rosa Lake State Park, the Santa Rosa Museum, and the Santa Rosa Historic District.
Demographics
As of the 2010 census, Santa Rosa had a population of 2,744 people. The racial makeup of the town was 73.3% White, 0.7% African American, 1.2% Native American, 0.3% Asian, 0.1% Pacific Islander, 22.2% from other races, and 2.3% from two or more races. Hispanic or Latino of any race were 44.3% of the population.
The median household income in Santa Rosa was $25,938, and the median family income was $30,938. The per capita income for the town was $13,845. About 22.2% of families and 25.3% of the population were below the poverty line, including 33.3% of those under age 18 and 16.2% of those age 65 or over.
Conclusion
Santa Rosa, New Mexico is a small town located in the eastern part of the state, about an hour and a half east of Albuquerque. It is the county seat of Guadalupe County and is home to a population of approximately 2,700 people. The town is situated in the high desert of the Great Plains, and is surrounded by rolling hills and mesas. Santa Rosa’s economy is largely based on agriculture and tourism, and the town is home to a number of farms, tourist attractions, and businesses. The racial makeup of the town is 73.3% White, 0.7% African American, 1.2% Native American, 0.3% Asian, 0.1% Pacific Islander, 22.2% from other races, and 2.3% from two or more races. The median household income in Santa Rosa was $25,938, and the median family income was $30,938. About 22.2% of families and 25.3% of the population were below the poverty line.
Common Questions
What is Per Capita Income in Santa Rosa?
Per Capita income in Santa Rosa is $24,108.
What is the Median Family Income in Santa Rosa?
Median Family Income in Santa Rosa is $60,625.
What is the Median Household income in Santa Rosa?
Median Household Income in Santa Rosa is $41,250.
What is Income or Wage Gap in Santa Rosa?
Income or Wage Gap in Santa Rosa is 8.0%.
Women in Santa Rosa earn 92.0 cents for every dollar earned by a man.
What is Inequality or Gini Index in Santa Rosa?
Inequality or Gini Index in Santa Rosa is 0.56.
What is the Total Population of Santa Rosa?
Total Population of Santa Rosa is 2,741.
What is the Total Male Population of Santa Rosa?
Total Male Population of Santa Rosa is 1,587.
What is the Total Female Population of Santa Rosa?
Total Female Population of Santa Rosa is 1,154.
What is the Ratio of Males per 100 Females in Santa Rosa?
There are 137.52 Males per 100 Females in Santa Rosa.
What is the Ratio of Females per 100 Males in Santa Rosa?
There are 72.72 Females per 100 Males in Santa Rosa.
What is the Median Population Age in Santa Rosa?
Median Population Age in Santa Rosa is 39.5 Years.
What is the Average Family Size in Santa Rosa
Average Family Size in Santa Rosa is 4.7 People.
What is the Average Household Size in Santa Rosa
Average Household Size in Santa Rosa is 3.2 People.
How Large is the Labor Force in Santa Rosa?
There are 933 People in the Labor Forcein in Santa Rosa.
What is the Percentage of People in the Labor Force in Santa Rosa?
42.3% of People are in the Labor Force in Santa Rosa.
What is the Unemployment Rate in Santa Rosa?
Unemployment Rate in Santa Rosa is 7.9%.