Santa Cruz, NM Map & Demographics
Santa Cruz Map
Santa Cruz Overview
$18,503
PER CAPITA INCOME
$34,853
AVG FAMILY INCOME
$33,676
AVG HOUSEHOLD INCOME
22.3%
WAGE / INCOME GAP [ % ]
77.7¢/ $1
WAGE / INCOME GAP [ $ ]
0.37
INEQUALITY / GINI INDEX
219
TOTAL POPULATION
96
MALE POPULATION
123
FEMALE POPULATION
78.05
MALES / 100 FEMALES
128.12
FEMALES / 100 MALES
31.3
MEDIAN AGE
2.7
AVG FAMILY SIZE
2.0
AVG HOUSEHOLD SIZE
100
LABOR FORCE [ PEOPLE ]
57.1%
PERCENT IN LABOR FORCE
9.0%
UNEMPLOYMENT RATE
Santa Cruz Zip Codes
Santa Cruz Area Codes
Income in Santa Cruz
Income Overview in Santa Cruz
Per Capita Income in Santa Cruz is $18,503, while median incomes of families and households are $34,853 and $33,676 respectively.
| Characteristic | Number | Measure |
| Per Capita Income | 219 | $18,503 |
| Median Family Income | 58 | $34,853 |
| Mean Family Income | 58 | $42,164 |
| Median Household Income | 108 | $33,676 |
| Mean Household Income | 108 | $37,193 |
| Income Deficit | 58 | $0 |
| Wage / Income Gap (%) | 219 | 22.27% |
| Wage / Income Gap ($) | 219 | 77.73¢ per $1 |
| Gini / Inequality Index | 219 | 0.37 |
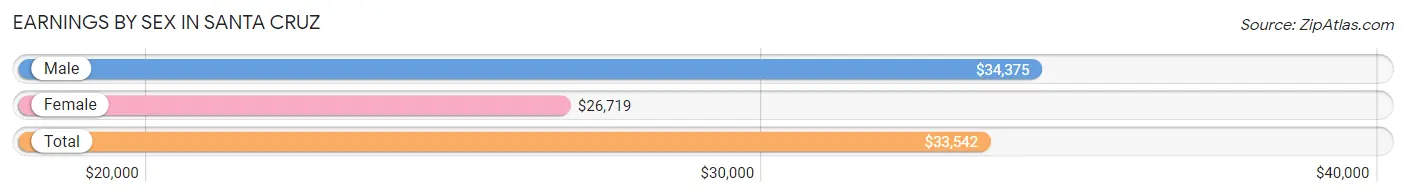
Earnings by Sex in Santa Cruz
Average Earnings in Santa Cruz are $33,542, $34,375 for men and $26,719 for women, a difference of 22.3%.
| Sex | Number | Average Earnings |
| Male | 43 (43.0%) | $34,375 |
| Female | 57 (57.0%) | $26,719 |
| Total | 100 (100.0%) | $33,542 |
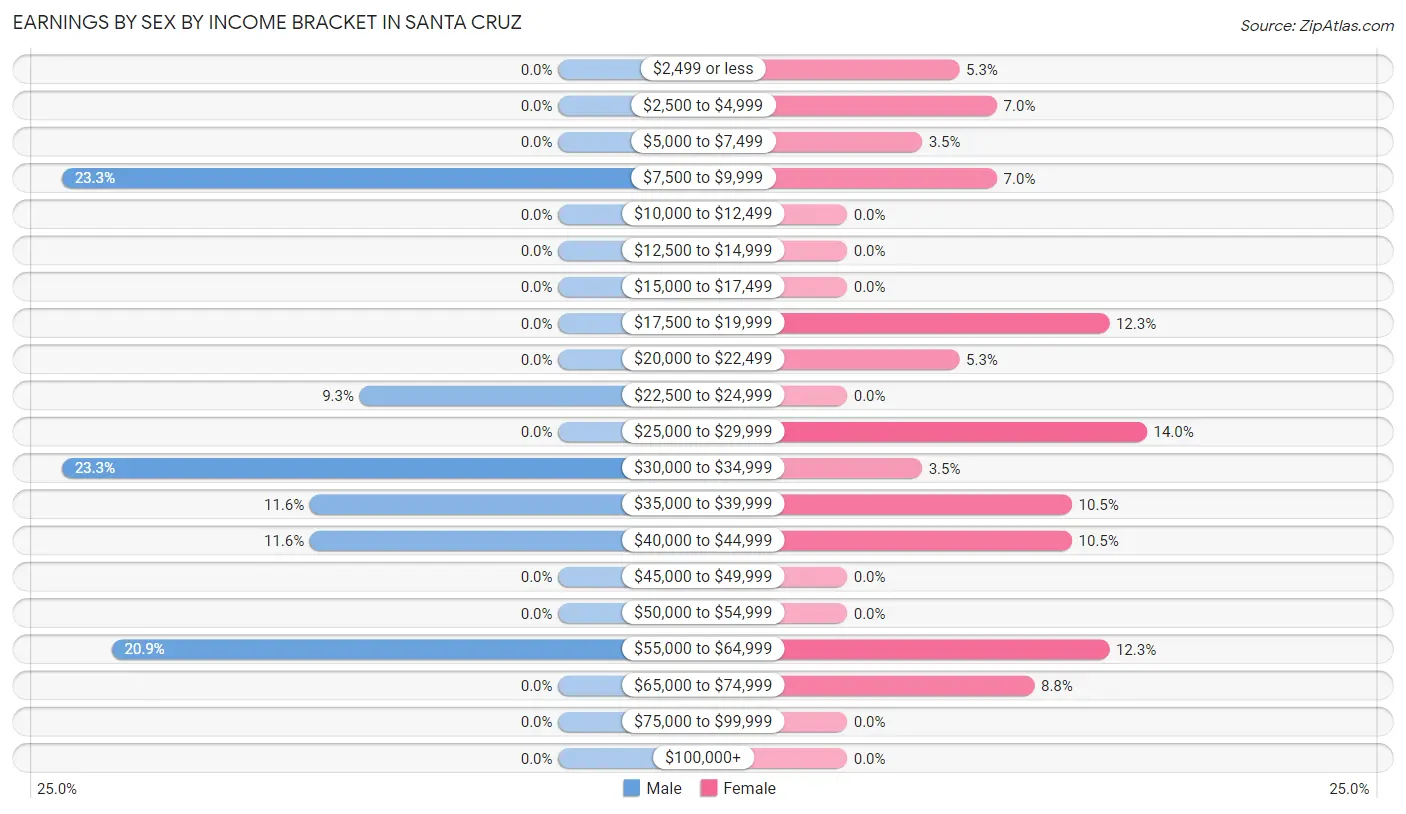
Earnings by Sex by Income Bracket in Santa Cruz
The most common earnings brackets in Santa Cruz are $7,500 to $9,999 for men (10 | 23.3%) and $25,000 to $29,999 for women (8 | 14.0%).
| Income | Male | Female |
| $2,499 or less | 0 (0.0%) | 3 (5.3%) |
| $2,500 to $4,999 | 0 (0.0%) | 4 (7.0%) |
| $5,000 to $7,499 | 0 (0.0%) | 2 (3.5%) |
| $7,500 to $9,999 | 10 (23.3%) | 4 (7.0%) |
| $10,000 to $12,499 | 0 (0.0%) | 0 (0.0%) |
| $12,500 to $14,999 | 0 (0.0%) | 0 (0.0%) |
| $15,000 to $17,499 | 0 (0.0%) | 0 (0.0%) |
| $17,500 to $19,999 | 0 (0.0%) | 7 (12.3%) |
| $20,000 to $22,499 | 0 (0.0%) | 3 (5.3%) |
| $22,500 to $24,999 | 4 (9.3%) | 0 (0.0%) |
| $25,000 to $29,999 | 0 (0.0%) | 8 (14.0%) |
| $30,000 to $34,999 | 10 (23.3%) | 2 (3.5%) |
| $35,000 to $39,999 | 5 (11.6%) | 6 (10.5%) |
| $40,000 to $44,999 | 5 (11.6%) | 6 (10.5%) |
| $45,000 to $49,999 | 0 (0.0%) | 0 (0.0%) |
| $50,000 to $54,999 | 0 (0.0%) | 0 (0.0%) |
| $55,000 to $64,999 | 9 (20.9%) | 7 (12.3%) |
| $65,000 to $74,999 | 0 (0.0%) | 5 (8.8%) |
| $75,000 to $99,999 | 0 (0.0%) | 0 (0.0%) |
| $100,000+ | 0 (0.0%) | 0 (0.0%) |
| Total | 43 (100.0%) | 57 (100.0%) |
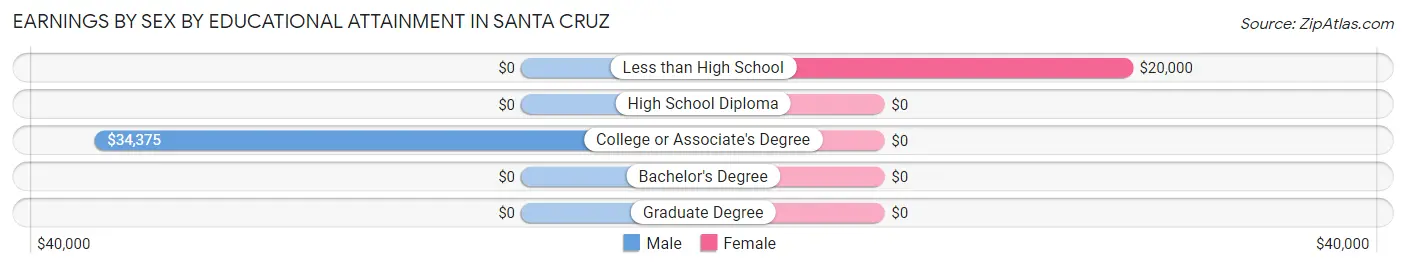
Earnings by Sex by Educational Attainment in Santa Cruz
Average earnings in Santa Cruz are $36,250 for men and $26,875 for women, a difference of 25.9%. Men with an educational attainment of college or associate's degree enjoy the highest average annual earnings of $34,375, while those with college or associate's degree education earn the least with $34,375. Women with an educational attainment of less than high school earn the most with the average annual earnings of $20,000, while those with less than high school education have the smallest earnings of $20,000.
| Educational Attainment | Male Income | Female Income |
| Less than High School | - | - |
| High School Diploma | - | - |
| College or Associate's Degree | $34,375 | $0 |
| Bachelor's Degree | - | - |
| Graduate Degree | - | - |
| Total | $36,250 | $26,875 |
Family Income in Santa Cruz
Family Income Brackets in Santa Cruz
According to the Santa Cruz family income data, there are 17 families falling into the $25,000 to $34,999 income range, which is the most common income bracket and makes up 29.3% of all families.
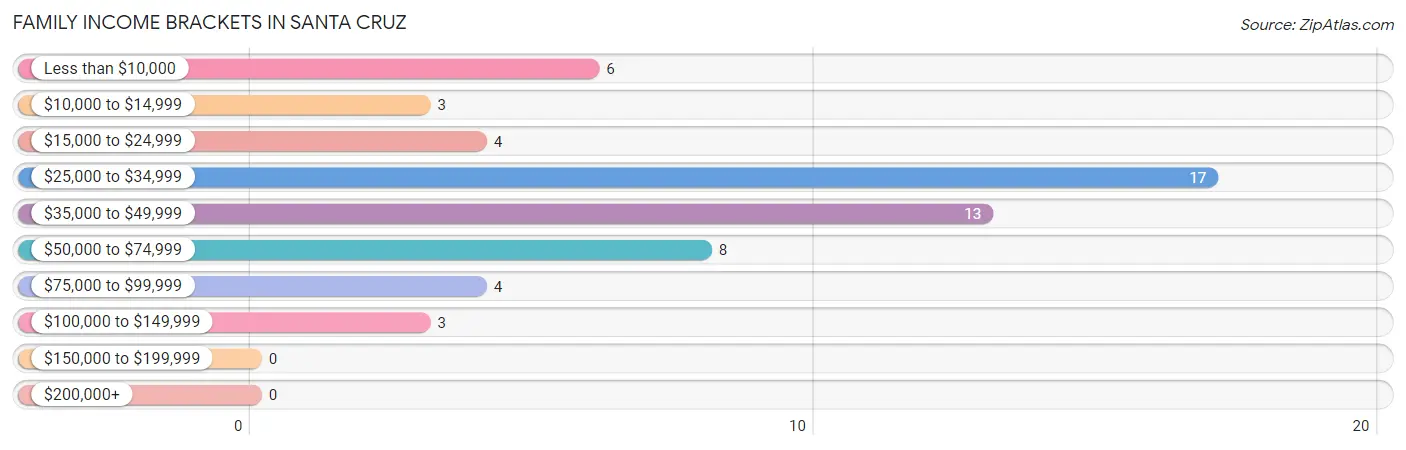
| Income Bracket | # Families | % Families |
| Less than $10,000 | 6 | 10.3% |
| $10,000 to $14,999 | 3 | 5.2% |
| $15,000 to $24,999 | 4 | 6.9% |
| $25,000 to $34,999 | 17 | 29.3% |
| $35,000 to $49,999 | 13 | 22.4% |
| $50,000 to $74,999 | 8 | 13.8% |
| $75,000 to $99,999 | 4 | 6.9% |
| $100,000 to $149,999 | 3 | 5.2% |
| $150,000 to $199,999 | 0 | 0.0% |
| $200,000+ | 0 | 0.0% |
Family Income by Famaliy Size in Santa Cruz
3-person families (13 | 22.4%) account for the highest median family income in Santa Cruz with $60,313 per family, while 3-person families (13 | 22.4%) have the highest median income of $20,104 per family member.
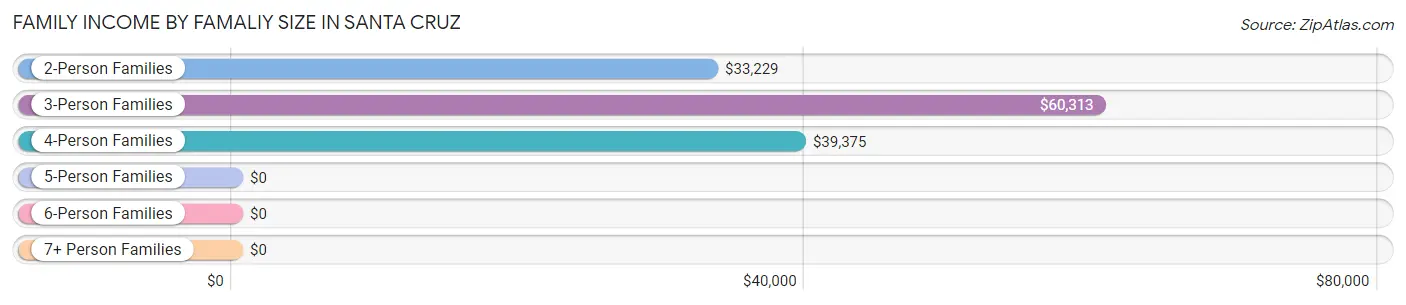
| Income Bracket | # Families | Median Income |
| 2-Person Families | 33 (56.9%) | $33,229 |
| 3-Person Families | 13 (22.4%) | $60,313 |
| 4-Person Families | 12 (20.7%) | $39,375 |
| 5-Person Families | 0 (0.0%) | $0 |
| 6-Person Families | 0 (0.0%) | $0 |
| 7+ Person Families | 0 (0.0%) | $0 |
| Total | 58 (100.0%) | $34,853 |
Family Income by Number of Earners in Santa Cruz
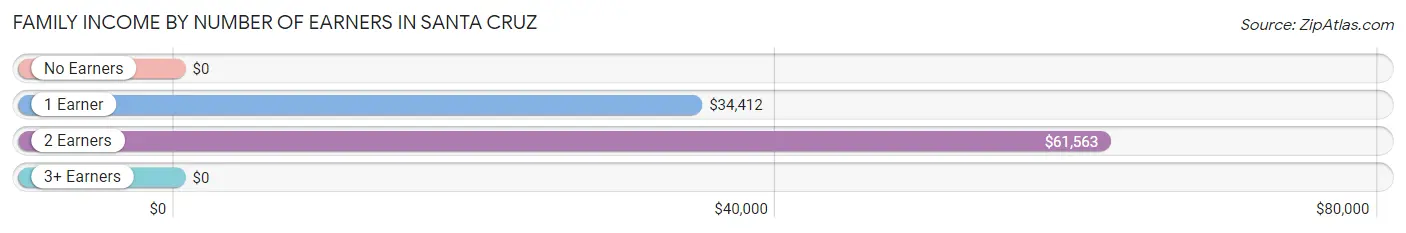
| Number of Earners | # Families | Median Income |
| No Earners | 15 (25.9%) | $0 |
| 1 Earner | 26 (44.8%) | $34,412 |
| 2 Earners | 17 (29.3%) | $61,563 |
| 3+ Earners | 0 (0.0%) | $0 |
| Total | 58 (100.0%) | $34,853 |
Household Income in Santa Cruz
Household Income Brackets in Santa Cruz
With 25 households falling in the category, the $25,000 to $34,999 income range is the most frequent in Santa Cruz, accounting for 23.2% of all households.
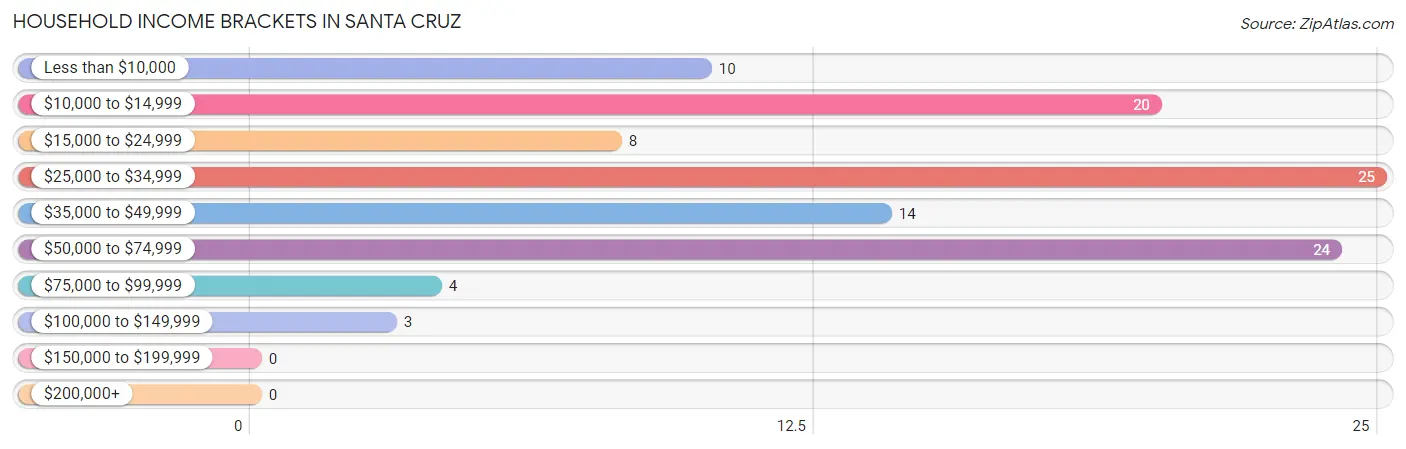
| Income Bracket | # Households | % Households |
| Less than $10,000 | 10 | 9.3% |
| $10,000 to $14,999 | 20 | 18.5% |
| $15,000 to $24,999 | 8 | 7.4% |
| $25,000 to $34,999 | 25 | 23.1% |
| $35,000 to $49,999 | 14 | 13.0% |
| $50,000 to $74,999 | 24 | 22.2% |
| $75,000 to $99,999 | 4 | 3.7% |
| $100,000 to $149,999 | 3 | 2.8% |
| $150,000 to $199,999 | 0 | 0.0% |
| $200,000+ | 0 | 0.0% |
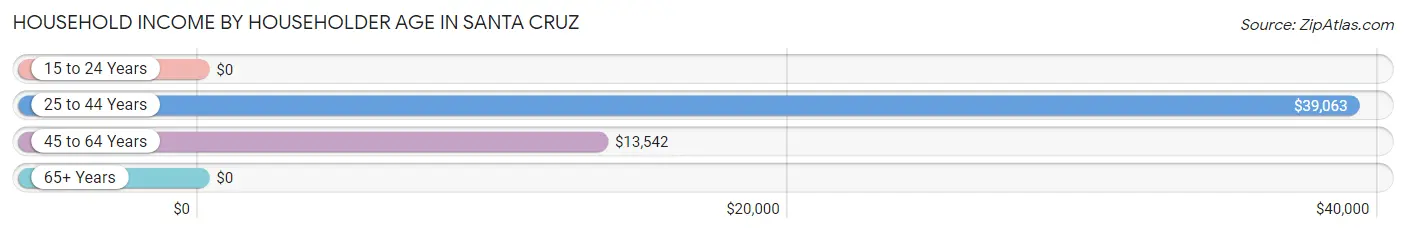
Household Income by Householder Age in Santa Cruz
The median household income in Santa Cruz is $33,676, with the highest median household income of $39,063 found in the 25 to 44 years age bracket for the primary householder. A total of 55 households (50.9%) fall into this category. Meanwhile, the 15 to 24 years age bracket for the primary householder has the lowest median household income of $0, with 4 households (3.7%) in this group.
| Income Bracket | # Households | Median Income |
| 15 to 24 Years | 4 (3.7%) | $0 |
| 25 to 44 Years | 55 (50.9%) | $39,063 |
| 45 to 64 Years | 33 (30.6%) | $13,542 |
| 65+ Years | 16 (14.8%) | $0 |
| Total | 108 (100.0%) | $33,676 |
Poverty in Santa Cruz
Income Below Poverty by Sex and Age in Santa Cruz
With 19.8% poverty level for males and 22.0% for females among the residents of Santa Cruz, 75 year old and over males and 75 year old and over females are the most vulnerable to poverty, with 2 males (100.0%) and 5 females (100.0%) in their respective age groups living below the poverty level.
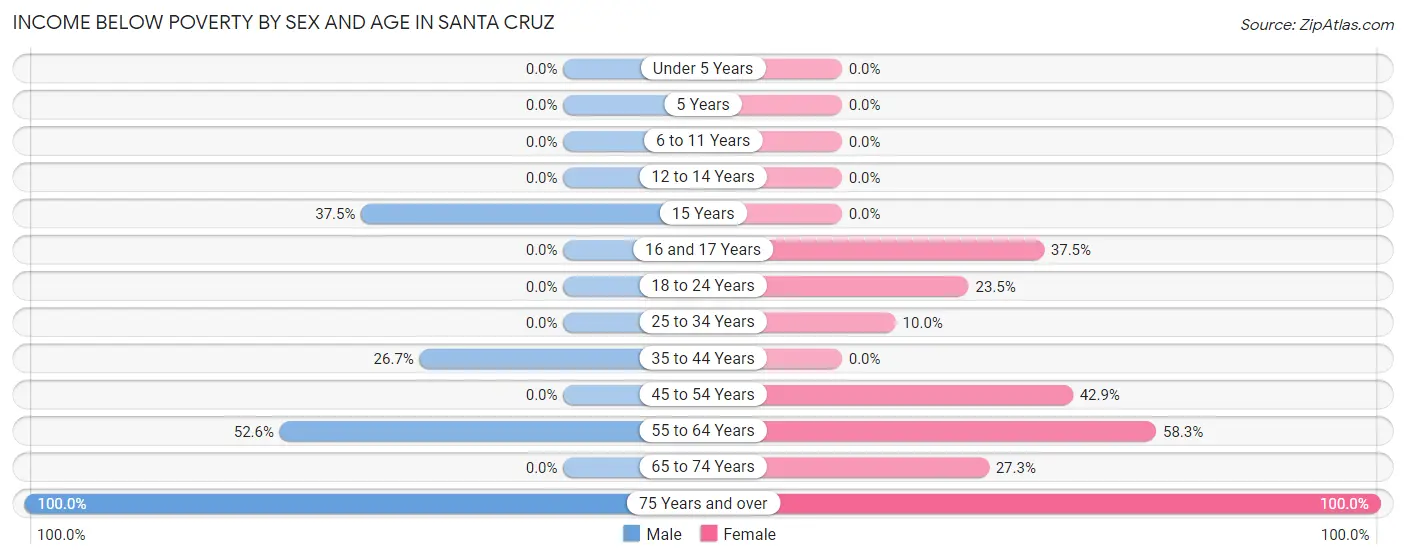
| Age Bracket | Male | Female |
| Under 5 Years | 0 (0.0%) | 0 (0.0%) |
| 5 Years | 0 (0.0%) | 0 (0.0%) |
| 6 to 11 Years | 0 (0.0%) | 0 (0.0%) |
| 12 to 14 Years | 0 (0.0%) | 0 (0.0%) |
| 15 Years | 3 (37.5%) | 0 (0.0%) |
| 16 and 17 Years | 0 (0.0%) | 3 (37.5%) |
| 18 to 24 Years | 0 (0.0%) | 4 (23.5%) |
| 25 to 34 Years | 0 (0.0%) | 2 (10.0%) |
| 35 to 44 Years | 4 (26.7%) | 0 (0.0%) |
| 45 to 54 Years | 0 (0.0%) | 3 (42.9%) |
| 55 to 64 Years | 10 (52.6%) | 7 (58.3%) |
| 65 to 74 Years | 0 (0.0%) | 3 (27.3%) |
| 75 Years and over | 2 (100.0%) | 5 (100.0%) |
| Total | 19 (19.8%) | 27 (22.0%) |
Income Above Poverty by Sex and Age in Santa Cruz
According to the poverty statistics in Santa Cruz, males aged under 5 years and females aged 6 to 11 years are the age groups that are most secure financially, with 100.0% of males and 100.0% of females in these age groups living above the poverty line.
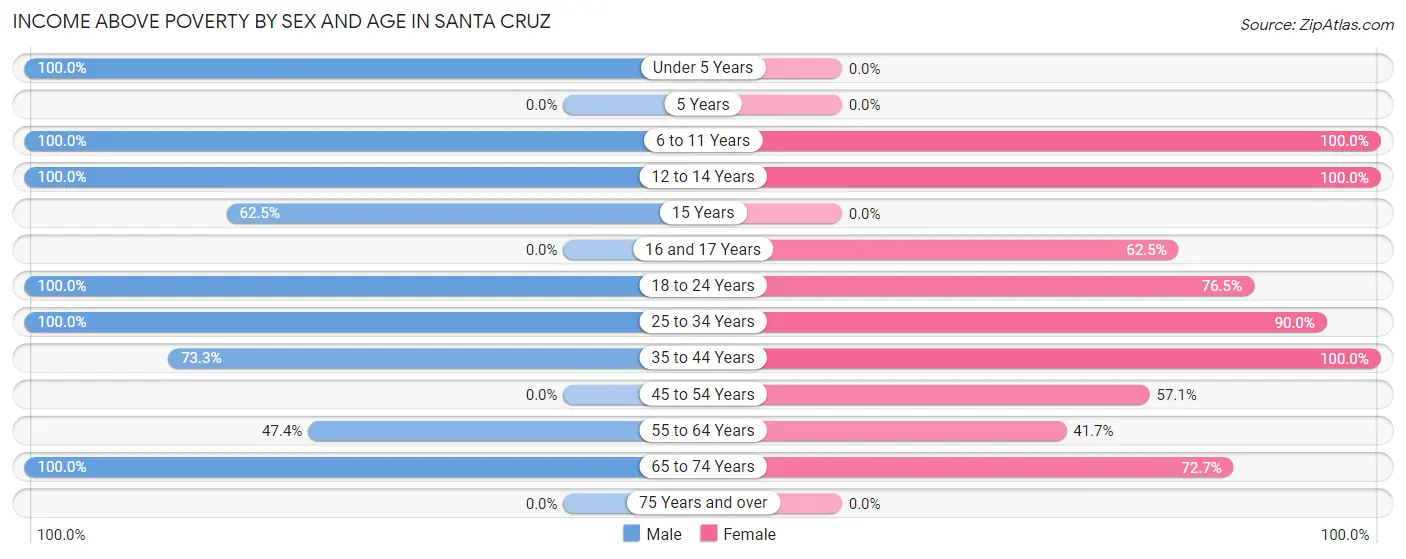
| Age Bracket | Male | Female |
| Under 5 Years | 3 (100.0%) | 0 (0.0%) |
| 5 Years | 0 (0.0%) | 0 (0.0%) |
| 6 to 11 Years | 6 (100.0%) | 15 (100.0%) |
| 12 to 14 Years | 2 (100.0%) | 10 (100.0%) |
| 15 Years | 5 (62.5%) | 0 (0.0%) |
| 16 and 17 Years | 0 (0.0%) | 5 (62.5%) |
| 18 to 24 Years | 15 (100.0%) | 13 (76.5%) |
| 25 to 34 Years | 18 (100.0%) | 18 (90.0%) |
| 35 to 44 Years | 11 (73.3%) | 18 (100.0%) |
| 45 to 54 Years | 0 (0.0%) | 4 (57.1%) |
| 55 to 64 Years | 9 (47.4%) | 5 (41.7%) |
| 65 to 74 Years | 8 (100.0%) | 8 (72.7%) |
| 75 Years and over | 0 (0.0%) | 0 (0.0%) |
| Total | 77 (80.2%) | 96 (78.0%) |
Income Below Poverty Among Married-Couple Families in Santa Cruz
The poverty statistics for married-couple families in Santa Cruz show that 15.8% or 3 of the total 19 families live below the poverty line. Families with no children have the highest poverty rate of 23.1%, comprising of 3 families. On the other hand, families with 1 or 2 children have the lowest poverty rate of 0.0%, which includes 0 families.
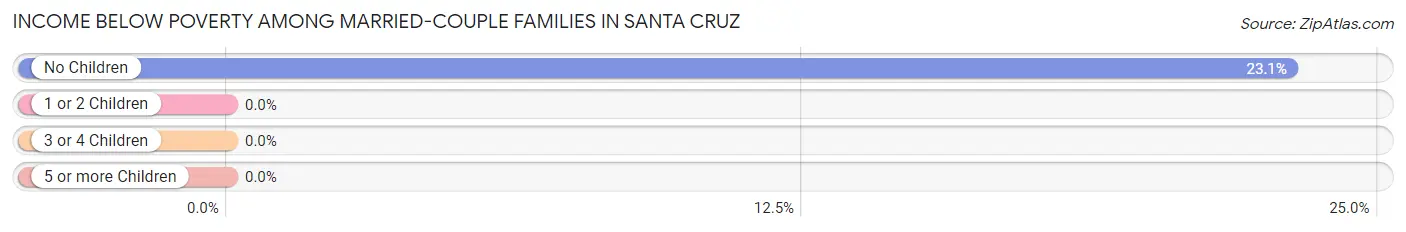
| Children | Above Poverty | Below Poverty |
| No Children | 10 (76.9%) | 3 (23.1%) |
| 1 or 2 Children | 6 (100.0%) | 0 (0.0%) |
| 3 or 4 Children | 0 (0.0%) | 0 (0.0%) |
| 5 or more Children | 0 (0.0%) | 0 (0.0%) |
| Total | 16 (84.2%) | 3 (15.8%) |
Income Below Poverty Among Single-Parent Households in Santa Cruz
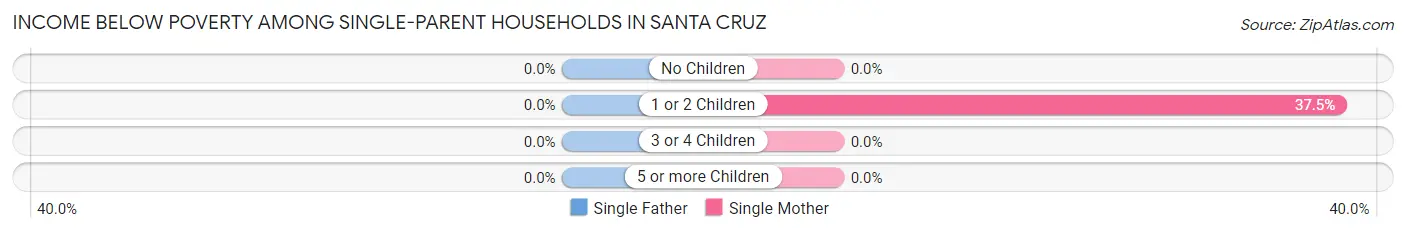
| Children | Single Father | Single Mother |
| No Children | 0 (0.0%) | 0 (0.0%) |
| 1 or 2 Children | 0 (0.0%) | 6 (37.5%) |
| 3 or 4 Children | 0 (0.0%) | 0 (0.0%) |
| 5 or more Children | 0 (0.0%) | 0 (0.0%) |
| Total | 0 (0.0%) | 6 (25.0%) |
Income Below Poverty Among Married-Couple vs Single-Parent Households in Santa Cruz
The poverty data for Santa Cruz shows that 3 of the married-couple family households (15.8%) and 6 of the single-parent households (15.4%) are living below the poverty level. Within the married-couple family households, those with no children have the highest poverty rate, with 3 households (23.1%) falling below the poverty line. Among the single-parent households, those with 1 or 2 children have the highest poverty rate, with 6 household (23.1%) living below poverty.
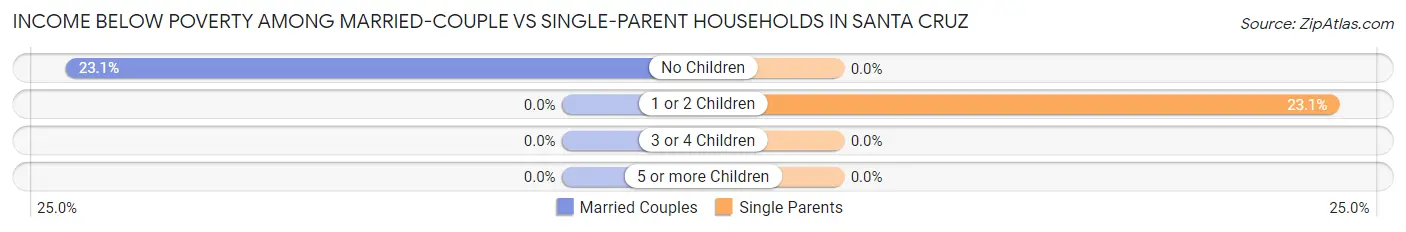
| Children | Married-Couple Families | Single-Parent Households |
| No Children | 3 (23.1%) | 0 (0.0%) |
| 1 or 2 Children | 0 (0.0%) | 6 (23.1%) |
| 3 or 4 Children | 0 (0.0%) | 0 (0.0%) |
| 5 or more Children | 0 (0.0%) | 0 (0.0%) |
| Total | 3 (15.8%) | 6 (15.4%) |
Race in Santa Cruz
The most populous races in Santa Cruz are Hispanic or Latino (200 | 91.3%), Some other Race (137 | 62.6%), and White / Caucasian (63 | 28.8%).
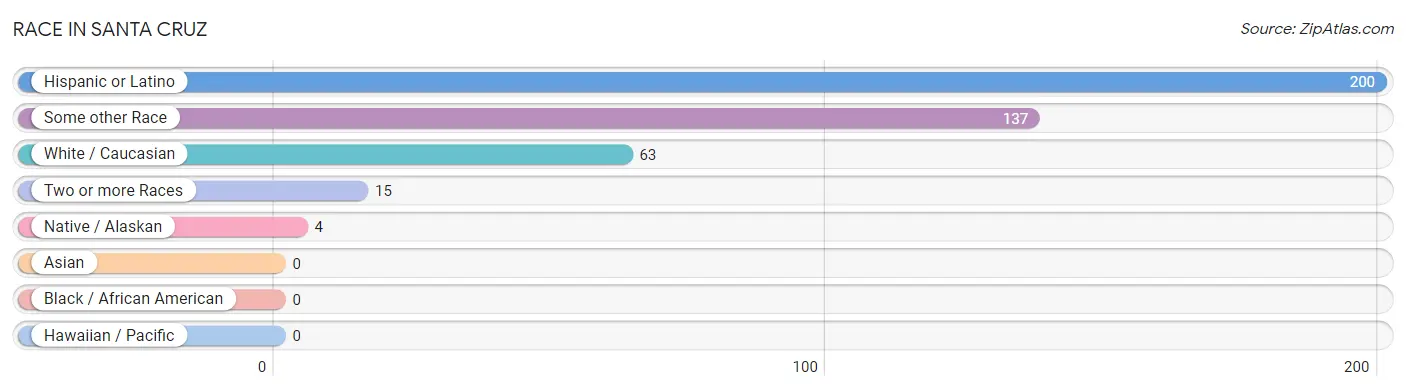
| Race | # Population | % Population |
| Asian | 0 | 0.0% |
| Black / African American | 0 | 0.0% |
| Hawaiian / Pacific | 0 | 0.0% |
| Hispanic or Latino | 200 | 91.3% |
| Native / Alaskan | 4 | 1.8% |
| White / Caucasian | 63 | 28.8% |
| Two or more Races | 15 | 6.9% |
| Some other Race | 137 | 62.6% |
| Total | 219 | 100.0% |
Ancestry in Santa Cruz
The most populous ancestries reported in Santa Cruz are Mexican (76 | 34.7%), Spanish (31 | 14.2%), Spaniard (30 | 13.7%), American (18 | 8.2%), and Central American (10 | 4.6%), together accounting for 75.3% of all Santa Cruz residents.
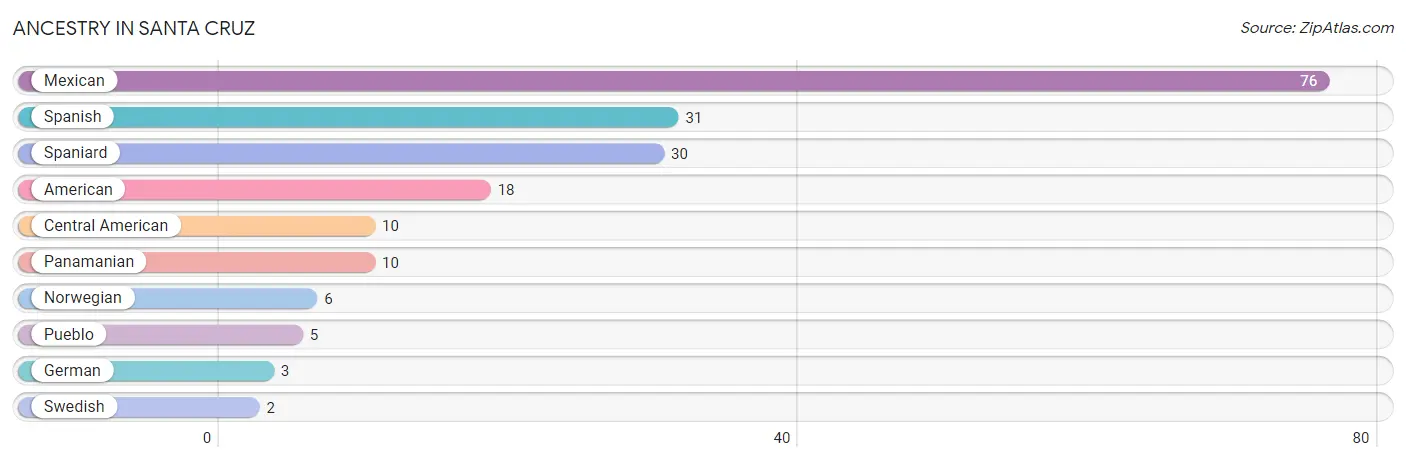
| Ancestry | # Population | % Population |
| American | 18 | 8.2% |
| Central American | 10 | 4.6% |
| German | 3 | 1.4% |
| Mexican | 76 | 34.7% |
| Norwegian | 6 | 2.7% |
| Panamanian | 10 | 4.6% |
| Pueblo | 5 | 2.3% |
| Spaniard | 30 | 13.7% |
| Spanish | 31 | 14.2% |
| Swedish | 2 | 0.9% | View All 10 Rows |
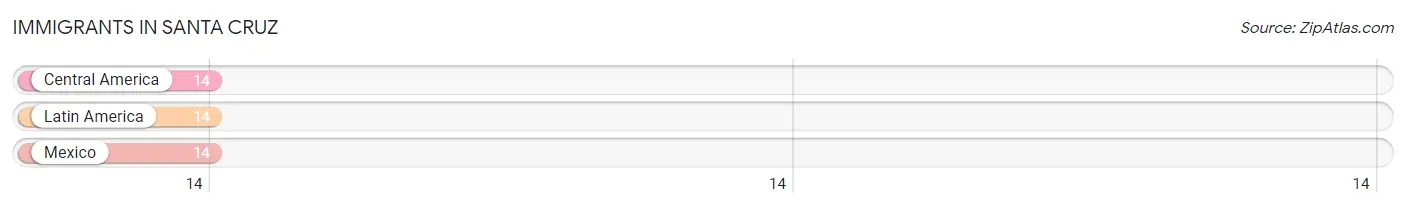
Immigrants in Santa Cruz
The most numerous immigrant groups reported in Santa Cruz came from Central America (14 | 6.4%), Latin America (14 | 6.4%), and Mexico (14 | 6.4%), together accounting for 19.2% of all Santa Cruz residents.
| Immigration Origin | # Population | % Population |
| Central America | 14 | 6.4% |
| Latin America | 14 | 6.4% |
| Mexico | 14 | 6.4% | View All 3 Rows |
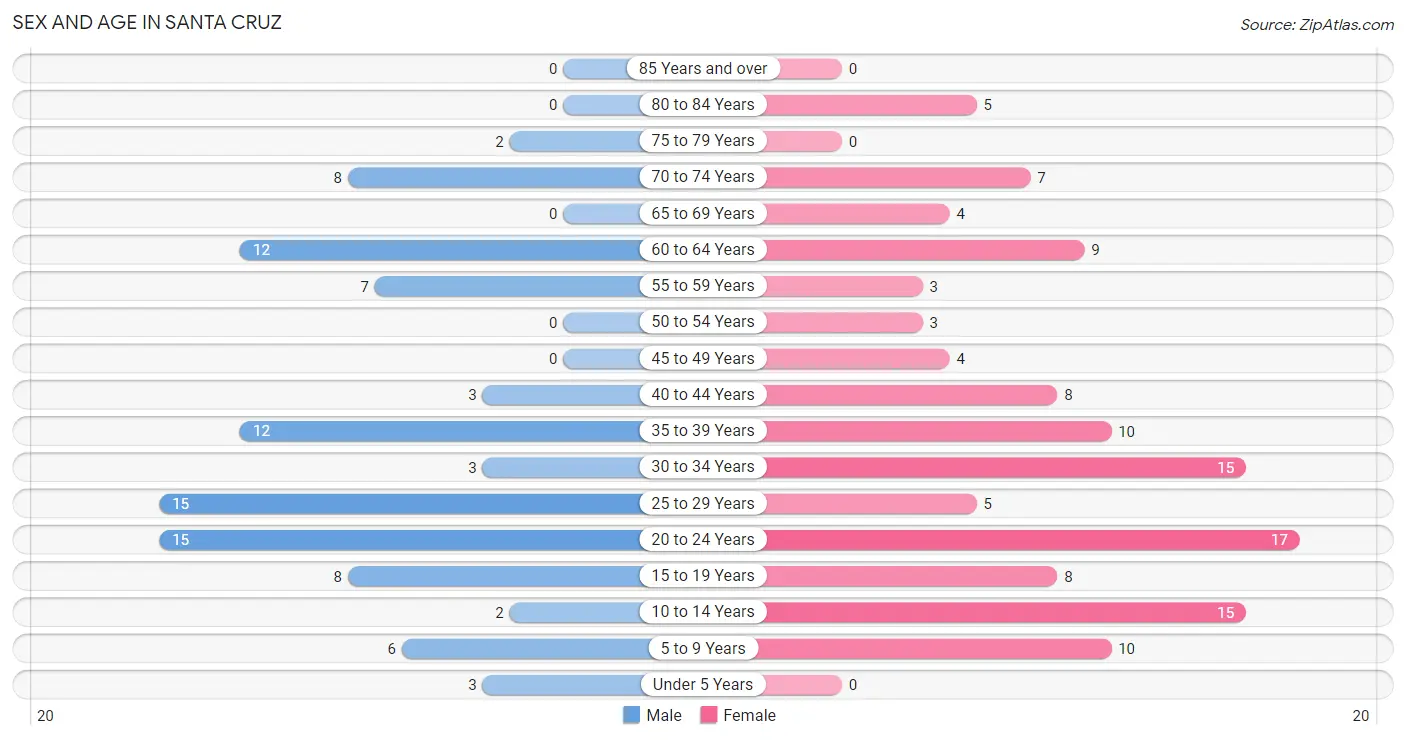
Sex and Age in Santa Cruz
Sex and Age in Santa Cruz
The most populous age groups in Santa Cruz are 20 to 24 Years (15 | 15.6%) for men and 20 to 24 Years (17 | 13.8%) for women.
| Age Bracket | Male | Female |
| Under 5 Years | 3 (3.1%) | 0 (0.0%) |
| 5 to 9 Years | 6 (6.2%) | 10 (8.1%) |
| 10 to 14 Years | 2 (2.1%) | 15 (12.2%) |
| 15 to 19 Years | 8 (8.3%) | 8 (6.5%) |
| 20 to 24 Years | 15 (15.6%) | 17 (13.8%) |
| 25 to 29 Years | 15 (15.6%) | 5 (4.1%) |
| 30 to 34 Years | 3 (3.1%) | 15 (12.2%) |
| 35 to 39 Years | 12 (12.5%) | 10 (8.1%) |
| 40 to 44 Years | 3 (3.1%) | 8 (6.5%) |
| 45 to 49 Years | 0 (0.0%) | 4 (3.3%) |
| 50 to 54 Years | 0 (0.0%) | 3 (2.4%) |
| 55 to 59 Years | 7 (7.3%) | 3 (2.4%) |
| 60 to 64 Years | 12 (12.5%) | 9 (7.3%) |
| 65 to 69 Years | 0 (0.0%) | 4 (3.3%) |
| 70 to 74 Years | 8 (8.3%) | 7 (5.7%) |
| 75 to 79 Years | 2 (2.1%) | 0 (0.0%) |
| 80 to 84 Years | 0 (0.0%) | 5 (4.1%) |
| 85 Years and over | 0 (0.0%) | 0 (0.0%) |
| Total | 96 (100.0%) | 123 (100.0%) |
Families and Households in Santa Cruz
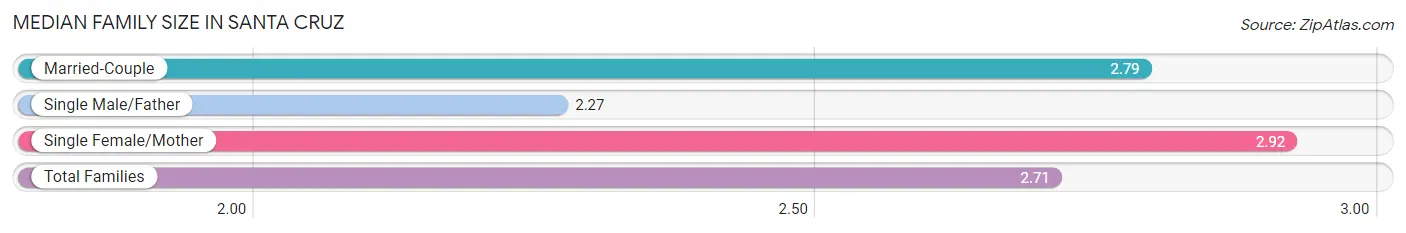
Median Family Size in Santa Cruz
The median family size in Santa Cruz is 2.71 persons per family, with single female/mother families (24 | 41.4%) accounting for the largest median family size of 2.92 persons per family. On the other hand, single male/father families (15 | 25.9%) represent the smallest median family size with 2.27 persons per family.
| Family Type | # Families | Family Size |
| Married-Couple | 19 (32.8%) | 2.79 |
| Single Male/Father | 15 (25.9%) | 2.27 |
| Single Female/Mother | 24 (41.4%) | 2.92 |
| Total Families | 58 (100.0%) | 2.71 |
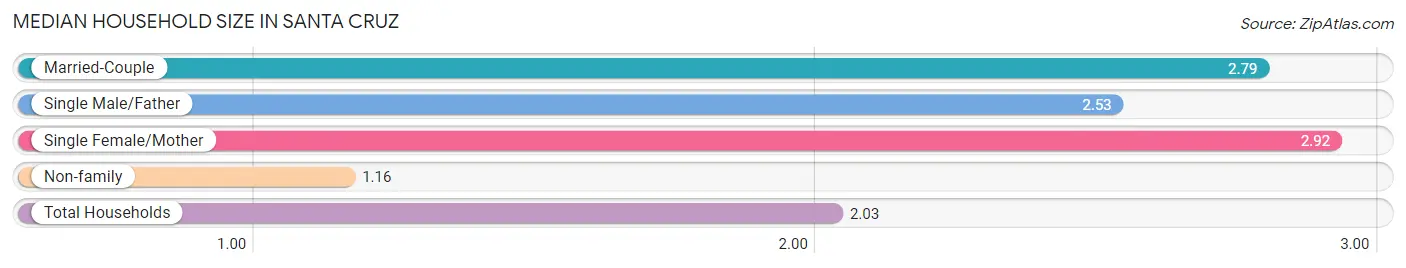
Median Household Size in Santa Cruz
The median household size in Santa Cruz is 2.03 persons per household, with single female/mother households (24 | 22.2%) accounting for the largest median household size of 2.92 persons per household. non-family households (50 | 46.3%) represent the smallest median household size with 1.16 persons per household.
| Household Type | # Households | Household Size |
| Married-Couple | 19 (17.6%) | 2.79 |
| Single Male/Father | 15 (13.9%) | 2.53 |
| Single Female/Mother | 24 (22.2%) | 2.92 |
| Non-family | 50 (46.3%) | 1.16 |
| Total Households | 108 (100.0%) | 2.03 |
Household Size by Marriage Status in Santa Cruz
Out of a total of 108 households in Santa Cruz, 58 (53.7%) are family households, while 50 (46.3%) are nonfamily households. The most numerous type of family households are 2-person households, comprising 33, and the most common type of nonfamily households are 1-person households, comprising 42.
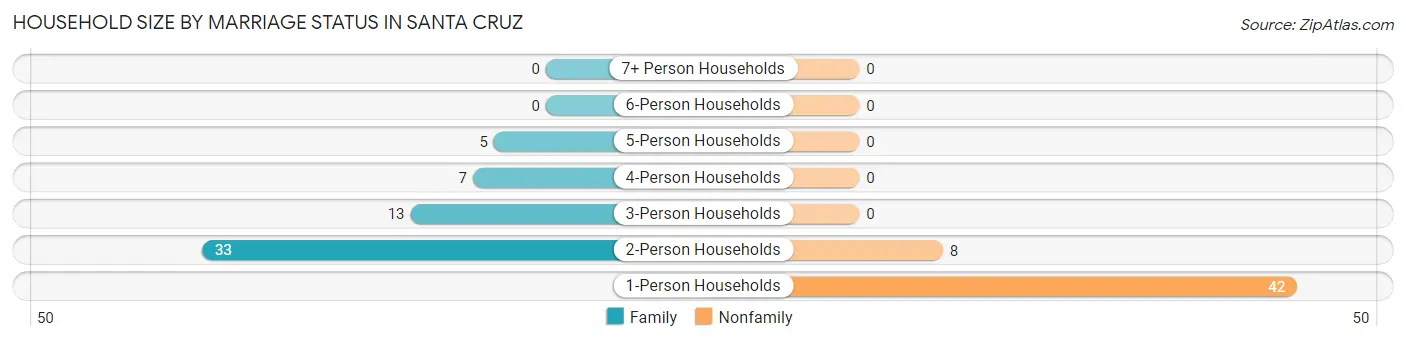
| Household Size | Family Households | Nonfamily Households |
| 1-Person Households | - | 42 (38.9%) |
| 2-Person Households | 33 (30.6%) | 8 (7.4%) |
| 3-Person Households | 13 (12.0%) | 0 (0.0%) |
| 4-Person Households | 7 (6.5%) | 0 (0.0%) |
| 5-Person Households | 5 (4.6%) | 0 (0.0%) |
| 6-Person Households | 0 (0.0%) | 0 (0.0%) |
| 7+ Person Households | 0 (0.0%) | 0 (0.0%) |
| Total | 58 (53.7%) | 50 (46.3%) |
Female Fertility in Santa Cruz
Fertility by Age in Santa Cruz
Average fertility rate in Santa Cruz is 45.0 births per 1,000 women. Women in the age bracket of 20 to 34 years have the highest fertility rate with 81.0 births per 1,000 women. Women in the age bracket of 20 to 34 years acount for 100.0% of all women with births.
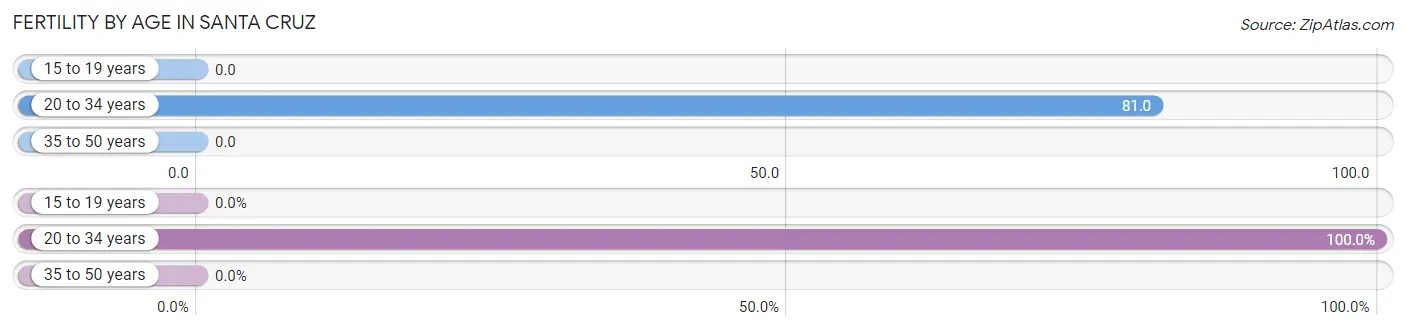
| Age Bracket | Women with Births | Births / 1,000 Women |
| 15 to 19 years | 0 (0.0%) | 0.0 |
| 20 to 34 years | 3 (100.0%) | 81.0 |
| 35 to 50 years | 0 (0.0%) | 0.0 |
| Total | 3 (100.0%) | 45.0 |
Fertility by Age by Marriage Status in Santa Cruz
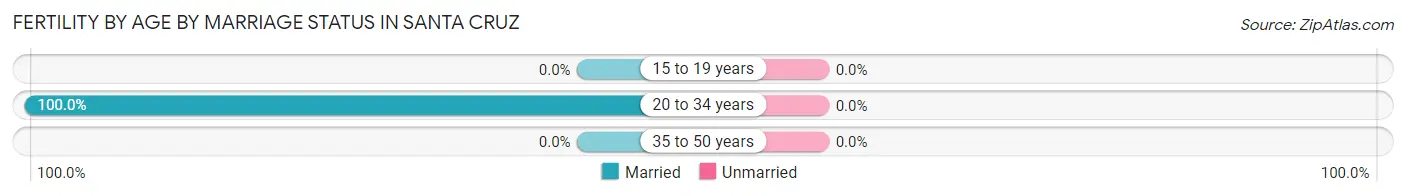
| Age Bracket | Married | Unmarried |
| 15 to 19 years | 0 (0.0%) | 0 (0.0%) |
| 20 to 34 years | 3 (100.0%) | 0 (0.0%) |
| 35 to 50 years | 0 (0.0%) | 0 (0.0%) |
| Total | 3 (100.0%) | 0 (0.0%) |
Fertility by Education in Santa Cruz
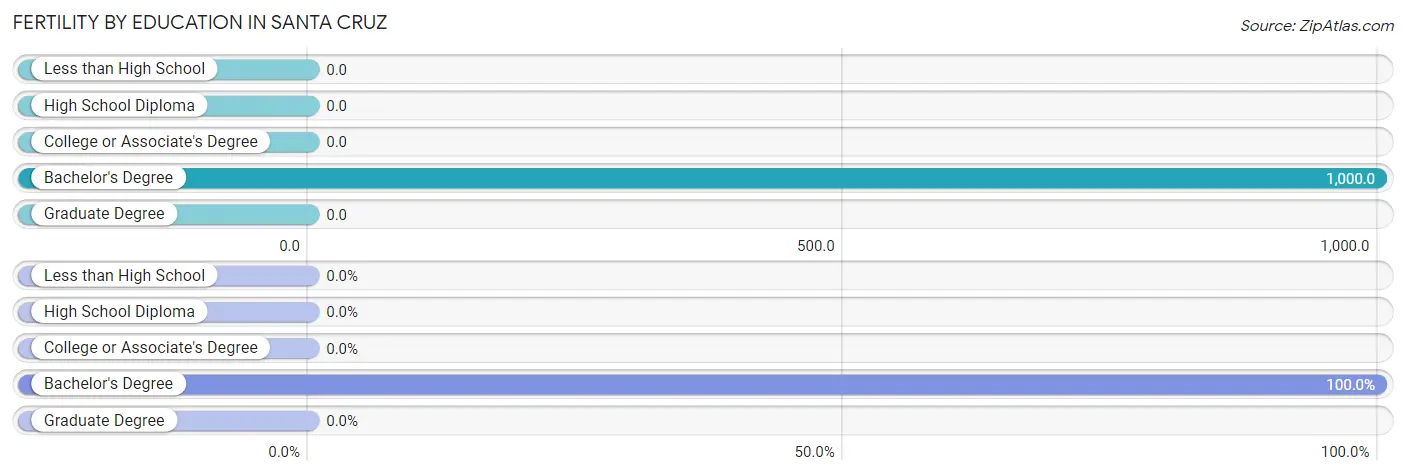
| Educational Attainment | Women with Births | Births / 1,000 Women |
| Less than High School | 0 (0.0%) | 0.0 |
| High School Diploma | 0 (0.0%) | 0.0 |
| College or Associate's Degree | 0 (0.0%) | 0.0 |
| Bachelor's Degree | 3 (100.0%) | 1,000.0 |
| Graduate Degree | 0 (0.0%) | 0.0 |
| Total | 3 (100.0%) | 45.0 |
Fertility by Education by Marriage Status in Santa Cruz
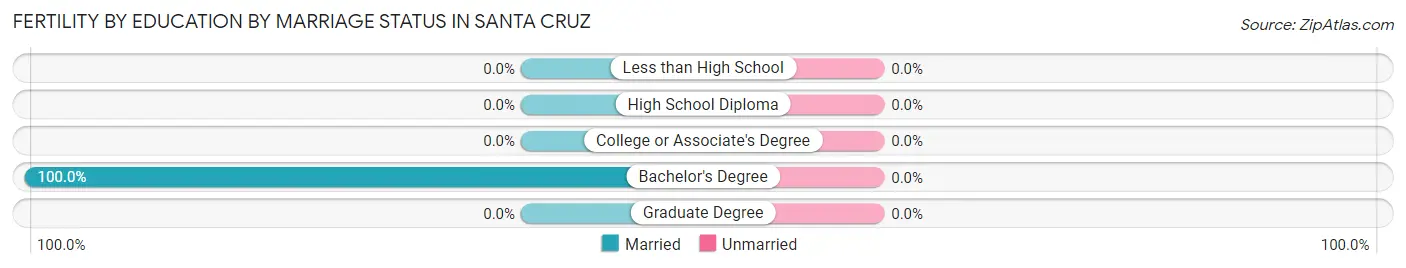
| Educational Attainment | Married | Unmarried |
| Less than High School | 0 (0.0%) | 0 (0.0%) |
| High School Diploma | 0 (0.0%) | 0 (0.0%) |
| College or Associate's Degree | 0 (0.0%) | 0 (0.0%) |
| Bachelor's Degree | 3 (100.0%) | 0 (0.0%) |
| Graduate Degree | 0 (0.0%) | 0 (0.0%) |
| Total | 3 (100.0%) | 0 (0.0%) |
Employment Characteristics in Santa Cruz
Employment by Class of Employer in Santa Cruz
Among the 91 employed individuals in Santa Cruz, private company employees (57 | 62.6%), federal government employees (13 | 14.3%), and state government employees (11 | 12.1%) make up the most common classes of employment.
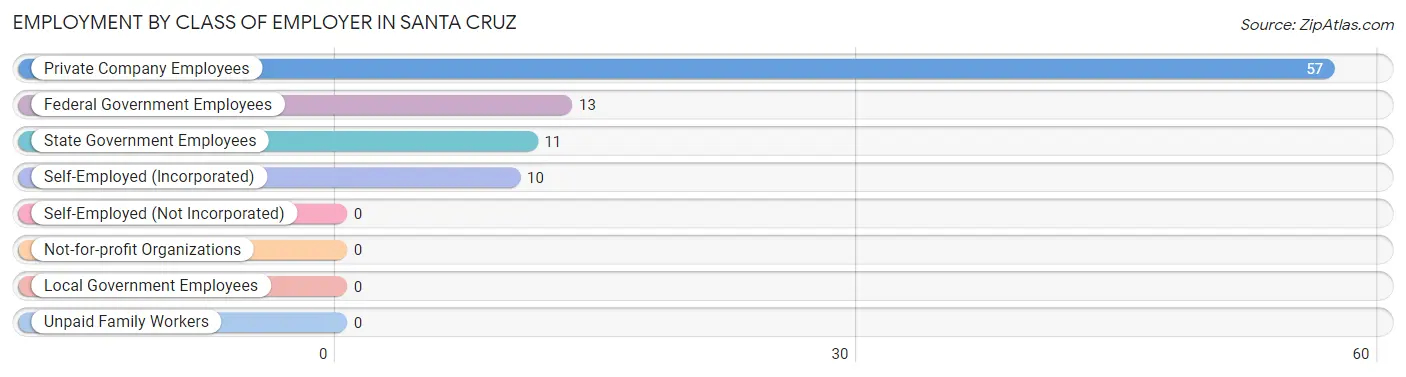
| Employer Class | # Employees | % Employees |
| Private Company Employees | 57 | 62.6% |
| Self-Employed (Incorporated) | 10 | 11.0% |
| Self-Employed (Not Incorporated) | 0 | 0.0% |
| Not-for-profit Organizations | 0 | 0.0% |
| Local Government Employees | 0 | 0.0% |
| State Government Employees | 11 | 12.1% |
| Federal Government Employees | 13 | 14.3% |
| Unpaid Family Workers | 0 | 0.0% |
| Total | 91 | 100.0% |
Employment Status by Age in Santa Cruz
According to the labor force statistics for Santa Cruz, out of the total population over 16 years of age (175), 57.1% or 100 individuals are in the labor force, with 9.0% or 9 of them unemployed. The age group with the highest labor force participation rate is 25 to 29 years, with 100.0% or 20 individuals in the labor force. Within the labor force, the 60 to 64 years age range has the highest percentage of unemployed individuals, with 100.0% or 2 of them being unemployed.
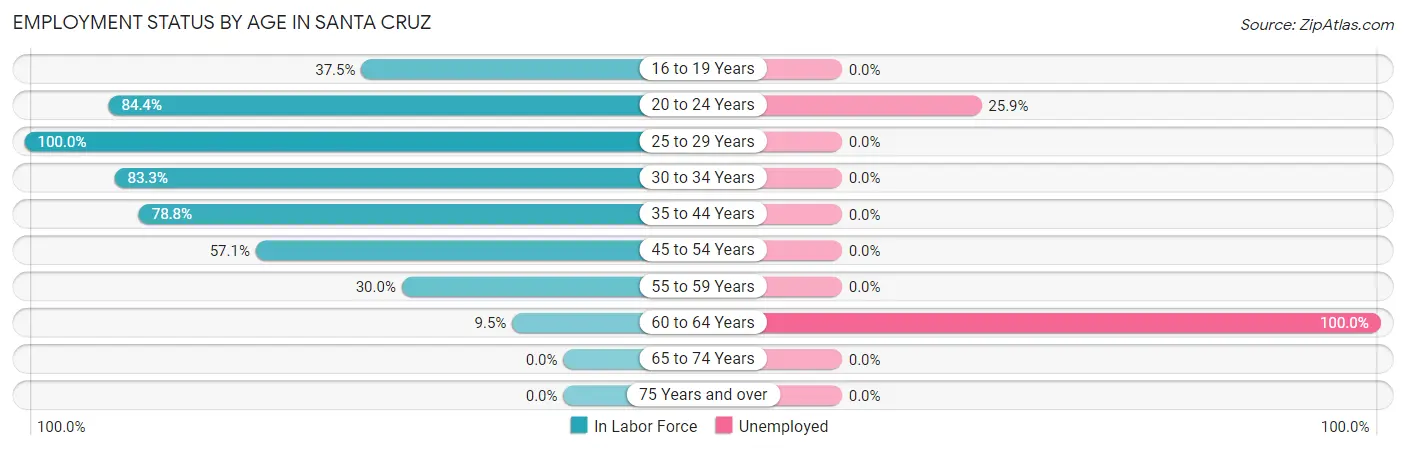
| Age Bracket | In Labor Force | Unemployed |
| 16 to 19 Years | 3 (37.5%) | 0 (0.0%) |
| 20 to 24 Years | 27 (84.4%) | 7 (25.9%) |
| 25 to 29 Years | 20 (100.0%) | 0 (0.0%) |
| 30 to 34 Years | 15 (83.3%) | 0 (0.0%) |
| 35 to 44 Years | 26 (78.8%) | 0 (0.0%) |
| 45 to 54 Years | 4 (57.1%) | 0 (0.0%) |
| 55 to 59 Years | 3 (30.0%) | 0 (0.0%) |
| 60 to 64 Years | 2 (9.5%) | 2 (100.0%) |
| 65 to 74 Years | 0 (0.0%) | 0 (0.0%) |
| 75 Years and over | 0 (0.0%) | 0 (0.0%) |
| Total | 100 (57.1%) | 9 (9.0%) |
Employment Status by Educational Attainment in Santa Cruz
According to labor force statistics for Santa Cruz, 64.2% of individuals (70) out of the total population between 25 and 64 years of age (109) are in the labor force, with 2.9% or 2 of them being unemployed. The group with the highest labor force participation rate are those with the educational attainment of bachelor's degree or higher, with 100.0% or 10 individuals in the labor force. Within the labor force, individuals with bachelor's degree or higher education have the highest percentage of unemployment, with 20.0% or 2 of them being unemployed.
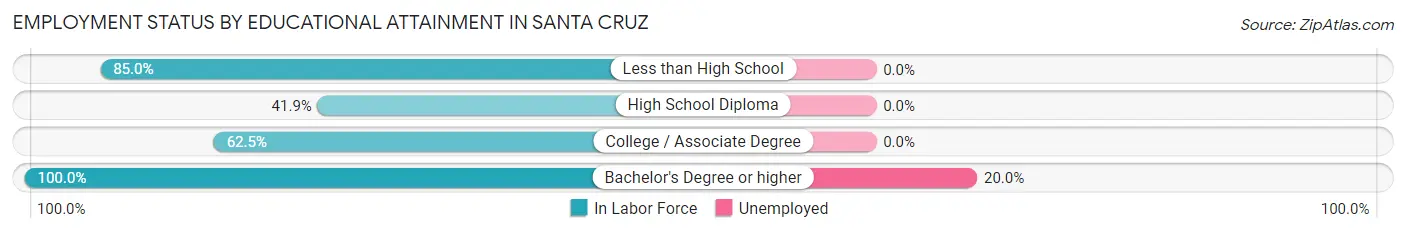
| Educational Attainment | In Labor Force | Unemployed |
| Less than High School | 17 (85.0%) | 0 (0.0%) |
| High School Diploma | 13 (41.9%) | 0 (0.0%) |
| College / Associate Degree | 30 (62.5%) | 0 (0.0%) |
| Bachelor's Degree or higher | 10 (100.0%) | 2 (20.0%) |
| Total | 70 (64.2%) | 3 (2.9%) |
Employment Occupations by Sex in Santa Cruz
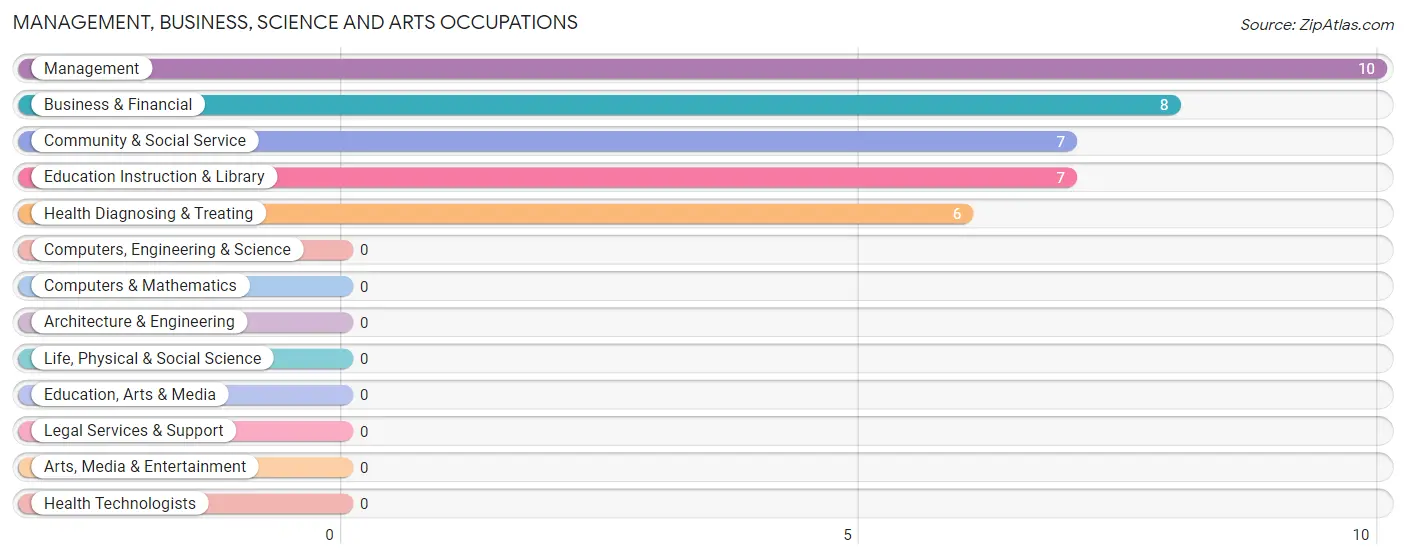
Management, Business, Science and Arts Occupations
The most common Management, Business, Science and Arts occupations in Santa Cruz are Management (10 | 11.0%), Business & Financial (8 | 8.8%), Community & Social Service (7 | 7.7%), Education Instruction & Library (7 | 7.7%), and Health Diagnosing & Treating (6 | 6.6%).
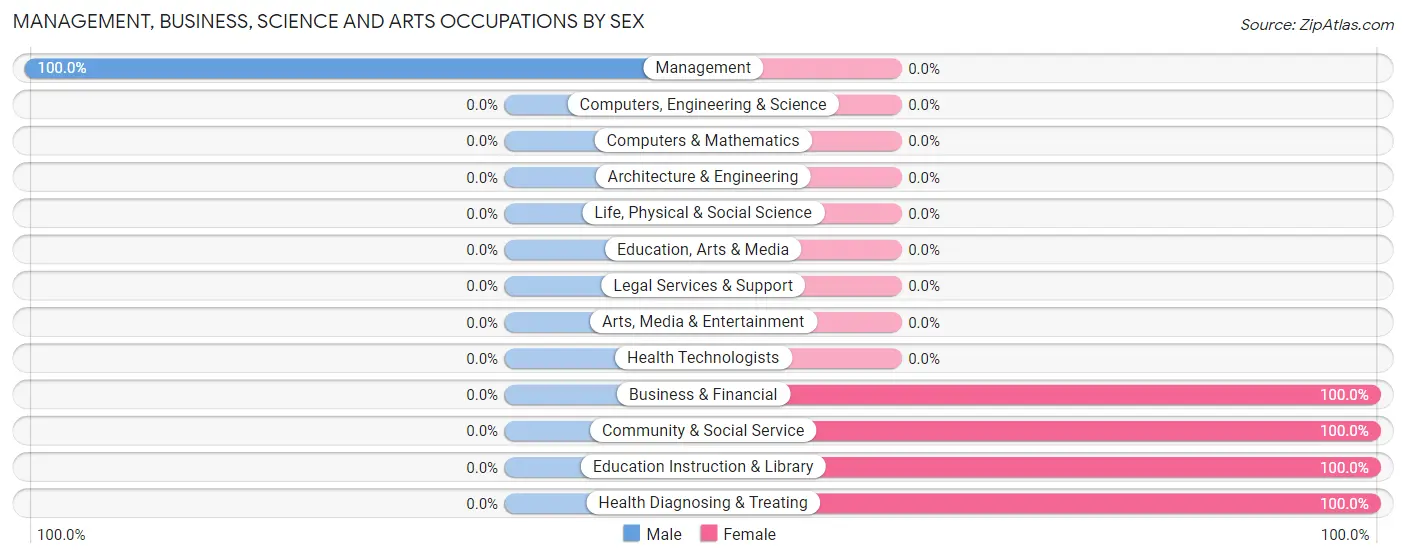
Management, Business, Science and Arts Occupations by Sex
| Occupation | Male | Female |
| Management | 10 (100.0%) | 0 (0.0%) |
| Business & Financial | 0 (0.0%) | 8 (100.0%) |
| Computers, Engineering & Science | 0 (0.0%) | 0 (0.0%) |
| Computers & Mathematics | 0 (0.0%) | 0 (0.0%) |
| Architecture & Engineering | 0 (0.0%) | 0 (0.0%) |
| Life, Physical & Social Science | 0 (0.0%) | 0 (0.0%) |
| Community & Social Service | 0 (0.0%) | 7 (100.0%) |
| Education, Arts & Media | 0 (0.0%) | 0 (0.0%) |
| Legal Services & Support | 0 (0.0%) | 0 (0.0%) |
| Education Instruction & Library | 0 (0.0%) | 7 (100.0%) |
| Arts, Media & Entertainment | 0 (0.0%) | 0 (0.0%) |
| Health Diagnosing & Treating | 0 (0.0%) | 6 (100.0%) |
| Health Technologists | 0 (0.0%) | 0 (0.0%) |
| Total (Category) | 10 (32.3%) | 21 (67.7%) |
| Total (Overall) | 43 (47.2%) | 48 (52.7%) |
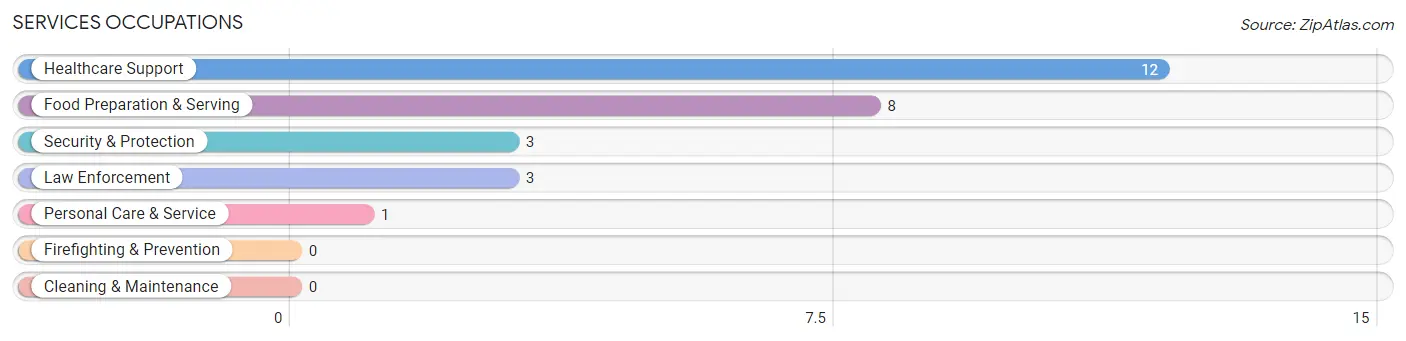
Services Occupations
The most common Services occupations in Santa Cruz are Healthcare Support (12 | 13.2%), Food Preparation & Serving (8 | 8.8%), Security & Protection (3 | 3.3%), Law Enforcement (3 | 3.3%), and Personal Care & Service (1 | 1.1%).
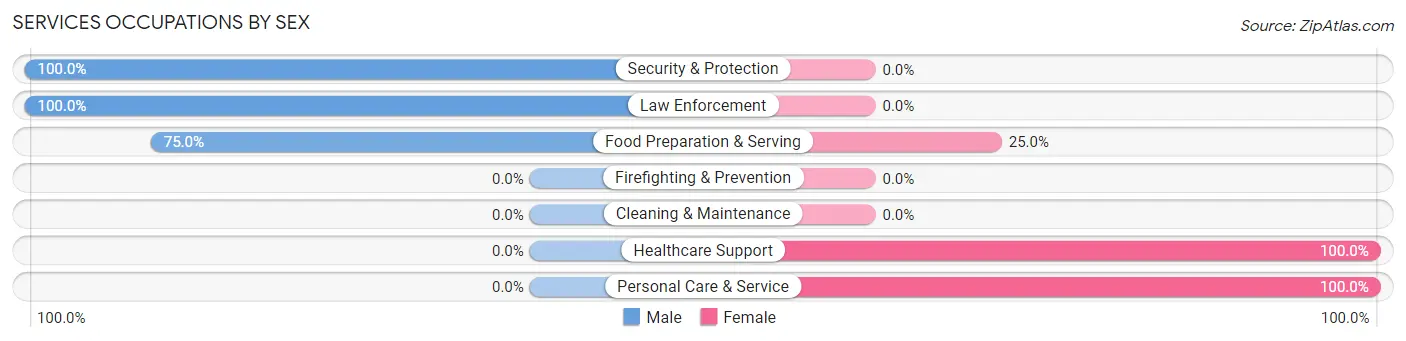
Services Occupations by Sex
Within the Services occupations in Santa Cruz, the most male-oriented occupations are Security & Protection (100.0%), Law Enforcement (100.0%), and Food Preparation & Serving (75.0%), while the most female-oriented occupations are Healthcare Support (100.0%), Personal Care & Service (100.0%), and Food Preparation & Serving (25.0%).
| Occupation | Male | Female |
| Healthcare Support | 0 (0.0%) | 12 (100.0%) |
| Security & Protection | 3 (100.0%) | 0 (0.0%) |
| Firefighting & Prevention | 0 (0.0%) | 0 (0.0%) |
| Law Enforcement | 3 (100.0%) | 0 (0.0%) |
| Food Preparation & Serving | 6 (75.0%) | 2 (25.0%) |
| Cleaning & Maintenance | 0 (0.0%) | 0 (0.0%) |
| Personal Care & Service | 0 (0.0%) | 1 (100.0%) |
| Total (Category) | 9 (37.5%) | 15 (62.5%) |
| Total (Overall) | 43 (47.2%) | 48 (52.7%) |
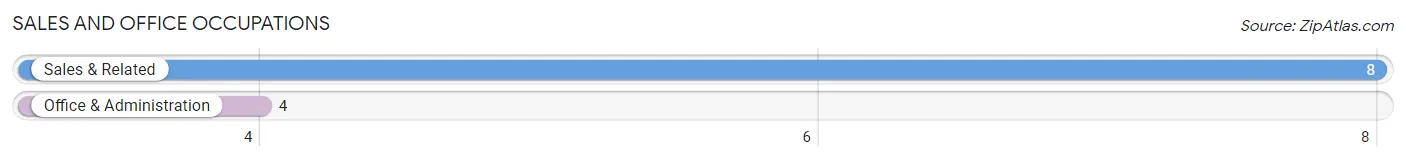
Sales and Office Occupations
The most common Sales and Office occupations in Santa Cruz are Sales & Related (8 | 8.8%), and Office & Administration (4 | 4.4%).
Sales and Office Occupations by Sex
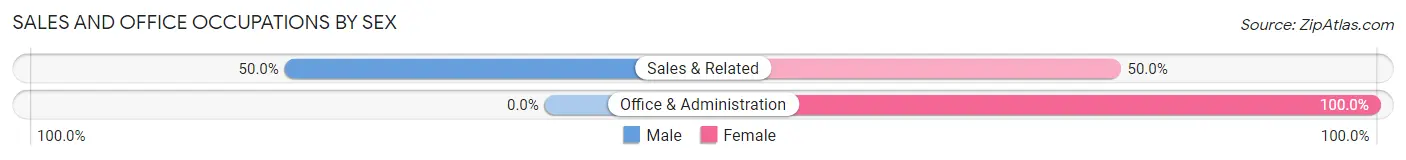
| Occupation | Male | Female |
| Sales & Related | 4 (50.0%) | 4 (50.0%) |
| Office & Administration | 0 (0.0%) | 4 (100.0%) |
| Total (Category) | 4 (33.3%) | 8 (66.7%) |
| Total (Overall) | 43 (47.2%) | 48 (52.7%) |
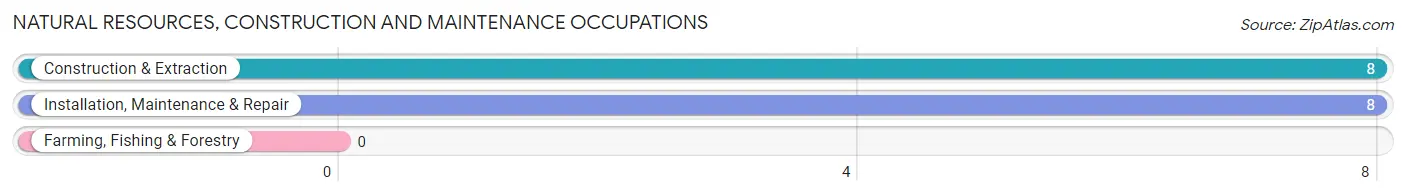
Natural Resources, Construction and Maintenance Occupations
The most common Natural Resources, Construction and Maintenance occupations in Santa Cruz are Construction & Extraction (8 | 8.8%), and Installation, Maintenance & Repair (8 | 8.8%).
Natural Resources, Construction and Maintenance Occupations by Sex
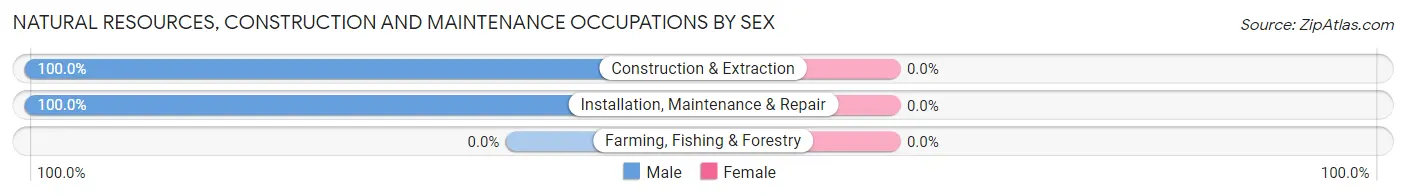
| Occupation | Male | Female |
| Farming, Fishing & Forestry | 0 (0.0%) | 0 (0.0%) |
| Construction & Extraction | 8 (100.0%) | 0 (0.0%) |
| Installation, Maintenance & Repair | 8 (100.0%) | 0 (0.0%) |
| Total (Category) | 16 (100.0%) | 0 (0.0%) |
| Total (Overall) | 43 (47.2%) | 48 (52.7%) |
Production, Transportation and Moving Occupations
The most common Production, Transportation and Moving occupations in Santa Cruz are , and Production (8 | 8.8%).
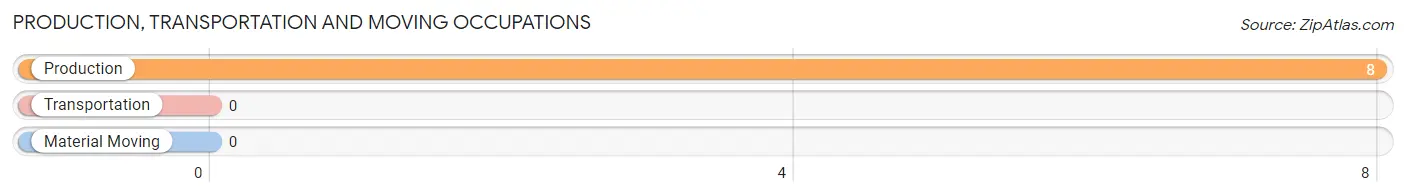
Production, Transportation and Moving Occupations by Sex
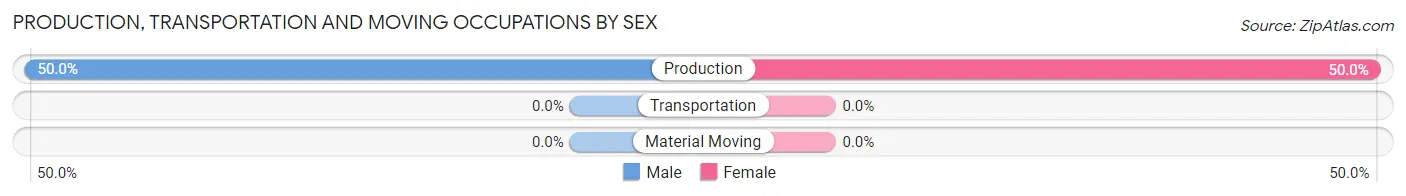
| Occupation | Male | Female |
| Production | 4 (50.0%) | 4 (50.0%) |
| Transportation | 0 (0.0%) | 0 (0.0%) |
| Material Moving | 0 (0.0%) | 0 (0.0%) |
| Total (Category) | 4 (50.0%) | 4 (50.0%) |
| Total (Overall) | 43 (47.2%) | 48 (52.7%) |
Employment Industries by Sex in Santa Cruz
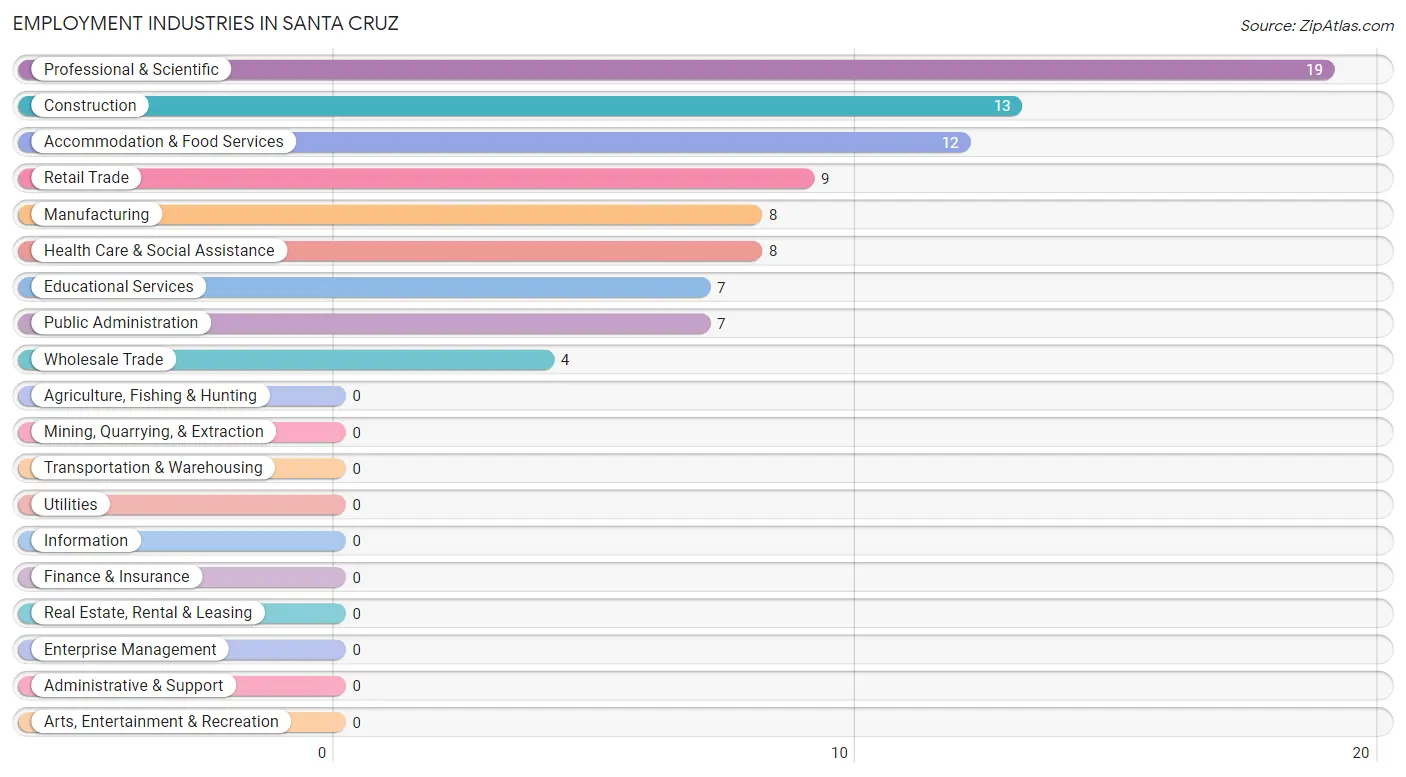
Employment Industries in Santa Cruz
The major employment industries in Santa Cruz include Professional & Scientific (19 | 20.9%), Construction (13 | 14.3%), Accommodation & Food Services (12 | 13.2%), Retail Trade (9 | 9.9%), and Manufacturing (8 | 8.8%).
Employment Industries by Sex in Santa Cruz
The Santa Cruz industries that see more men than women are Construction (100.0%), Wholesale Trade (100.0%), and Retail Trade (55.6%), whereas the industries that tend to have a higher number of women are Educational Services (100.0%), Health Care & Social Assistance (100.0%), and Professional & Scientific (73.7%).
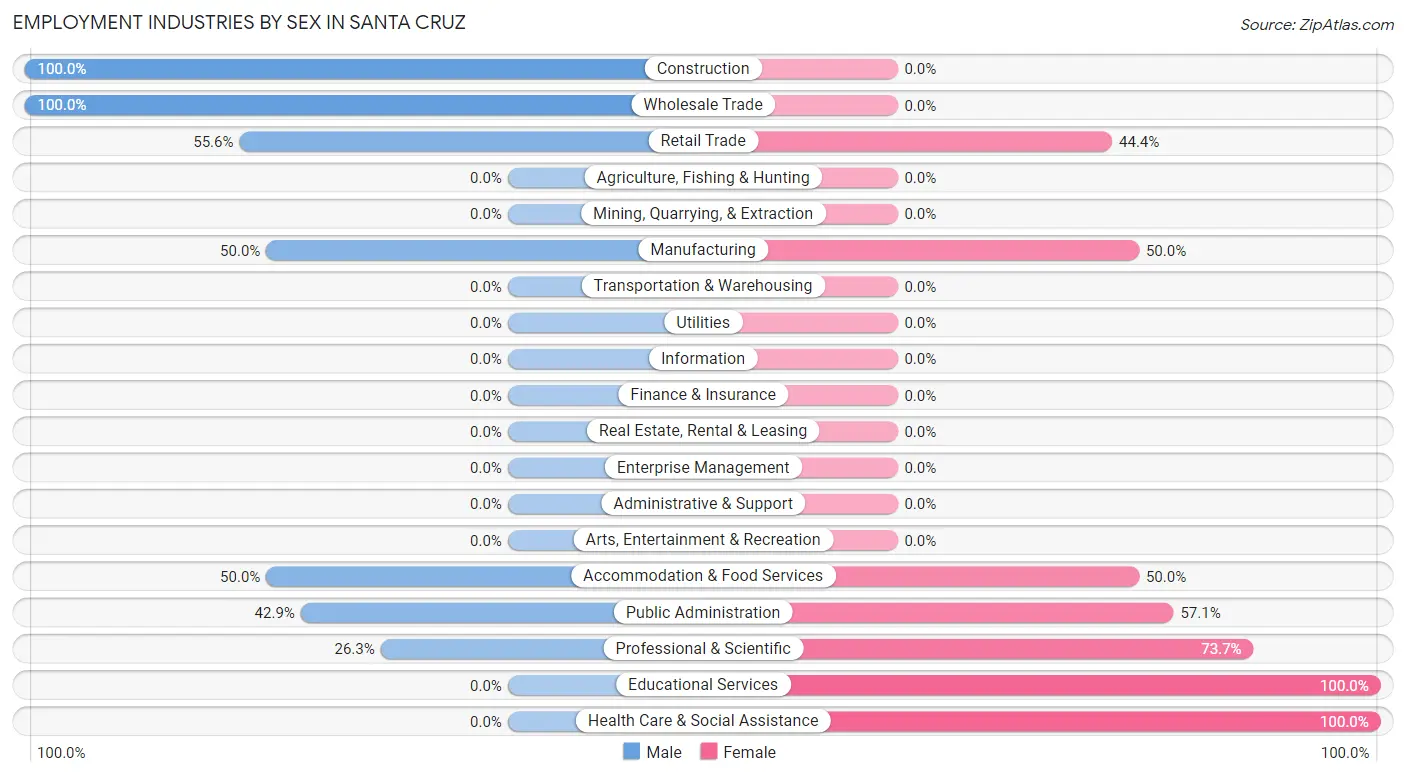
| Industry | Male | Female |
| Agriculture, Fishing & Hunting | 0 (0.0%) | 0 (0.0%) |
| Mining, Quarrying, & Extraction | 0 (0.0%) | 0 (0.0%) |
| Construction | 13 (100.0%) | 0 (0.0%) |
| Manufacturing | 4 (50.0%) | 4 (50.0%) |
| Wholesale Trade | 4 (100.0%) | 0 (0.0%) |
| Retail Trade | 5 (55.6%) | 4 (44.4%) |
| Transportation & Warehousing | 0 (0.0%) | 0 (0.0%) |
| Utilities | 0 (0.0%) | 0 (0.0%) |
| Information | 0 (0.0%) | 0 (0.0%) |
| Finance & Insurance | 0 (0.0%) | 0 (0.0%) |
| Real Estate, Rental & Leasing | 0 (0.0%) | 0 (0.0%) |
| Professional & Scientific | 5 (26.3%) | 14 (73.7%) |
| Enterprise Management | 0 (0.0%) | 0 (0.0%) |
| Administrative & Support | 0 (0.0%) | 0 (0.0%) |
| Educational Services | 0 (0.0%) | 7 (100.0%) |
| Health Care & Social Assistance | 0 (0.0%) | 8 (100.0%) |
| Arts, Entertainment & Recreation | 0 (0.0%) | 0 (0.0%) |
| Accommodation & Food Services | 6 (50.0%) | 6 (50.0%) |
| Public Administration | 3 (42.9%) | 4 (57.1%) |
| Total | 43 (47.2%) | 48 (52.7%) |
Education in Santa Cruz
School Enrollment in Santa Cruz
The most common levels of schooling among the 54 students in Santa Cruz are middle school (17 | 31.5%), elementary school (16 | 29.6%), and high school (11 | 20.4%).
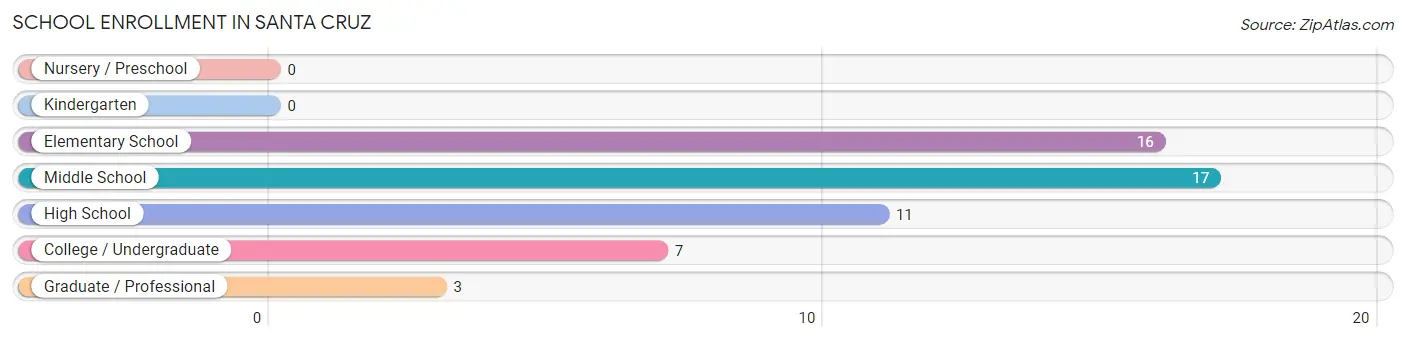
| School Level | # Students | % Students |
| Nursery / Preschool | 0 | 0.0% |
| Kindergarten | 0 | 0.0% |
| Elementary School | 16 | 29.6% |
| Middle School | 17 | 31.5% |
| High School | 11 | 20.4% |
| College / Undergraduate | 7 | 13.0% |
| Graduate / Professional | 3 | 5.6% |
| Total | 54 | 100.0% |
School Enrollment by Age by Funding Source in Santa Cruz
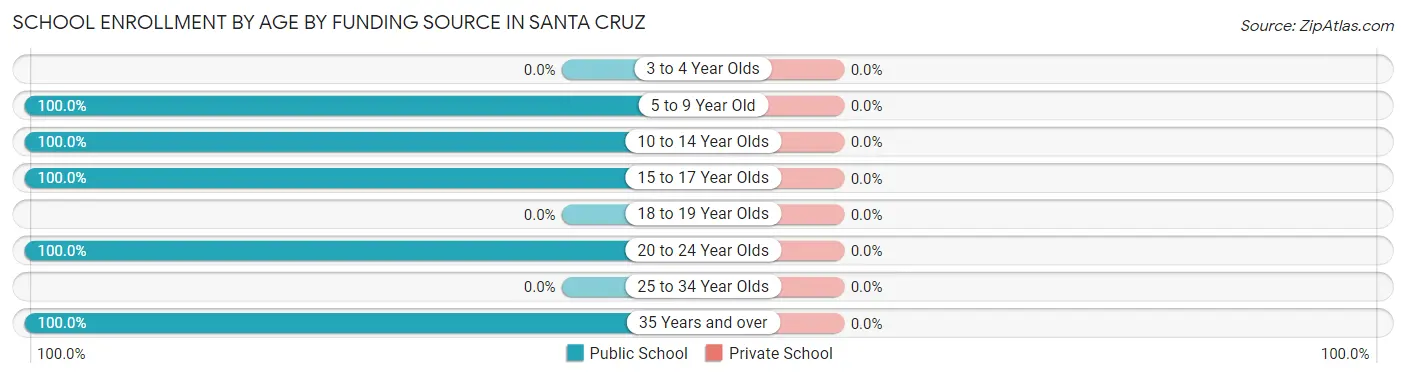
| Age Bracket | Public School | Private School |
| 3 to 4 Year Olds | 0 (0.0%) | 0 (0.0%) |
| 5 to 9 Year Old | 16 (100.0%) | 0 (0.0%) |
| 10 to 14 Year Olds | 17 (100.0%) | 0 (0.0%) |
| 15 to 17 Year Olds | 11 (100.0%) | 0 (0.0%) |
| 18 to 19 Year Olds | 0 (0.0%) | 0 (0.0%) |
| 20 to 24 Year Olds | 7 (100.0%) | 0 (0.0%) |
| 25 to 34 Year Olds | 0 (0.0%) | 0 (0.0%) |
| 35 Years and over | 3 (100.0%) | 0 (0.0%) |
| Total | 54 (100.0%) | 0 (0.0%) |
Educational Attainment by Field of Study in Santa Cruz
Business (5 | 50.0%), physical & health sciences (3 | 30.0%), and arts & humanities (2 | 20.0%) are the most common fields of study among 10 individuals in Santa Cruz who have obtained a bachelor's degree or higher.
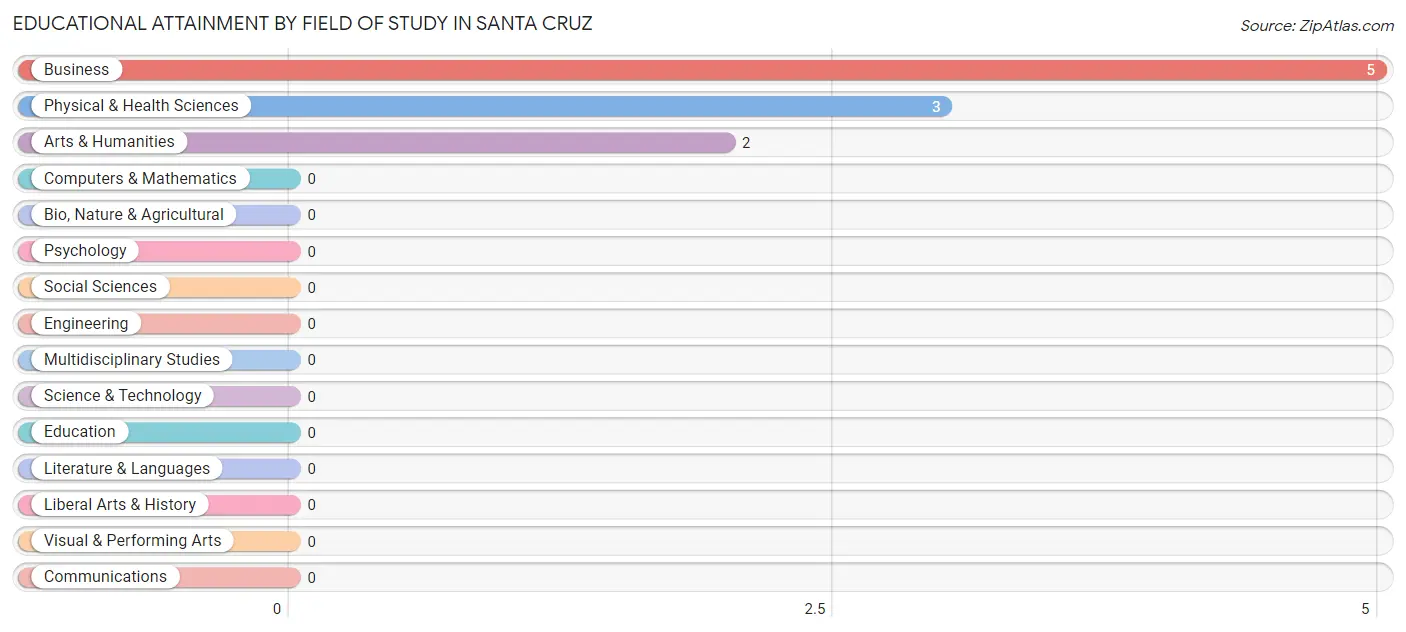
| Field of Study | # Graduates | % Graduates |
| Computers & Mathematics | 0 | 0.0% |
| Bio, Nature & Agricultural | 0 | 0.0% |
| Physical & Health Sciences | 3 | 30.0% |
| Psychology | 0 | 0.0% |
| Social Sciences | 0 | 0.0% |
| Engineering | 0 | 0.0% |
| Multidisciplinary Studies | 0 | 0.0% |
| Science & Technology | 0 | 0.0% |
| Business | 5 | 50.0% |
| Education | 0 | 0.0% |
| Literature & Languages | 0 | 0.0% |
| Liberal Arts & History | 0 | 0.0% |
| Visual & Performing Arts | 0 | 0.0% |
| Communications | 0 | 0.0% |
| Arts & Humanities | 2 | 20.0% |
| Total | 10 | 100.0% |
Transportation & Commute in Santa Cruz
Vehicle Availability by Sex in Santa Cruz
The most prevalent vehicle ownership categories in Santa Cruz are males with 2 vehicles (29, accounting for 67.4%) and females with 2 vehicles (27, making up 60.4%).
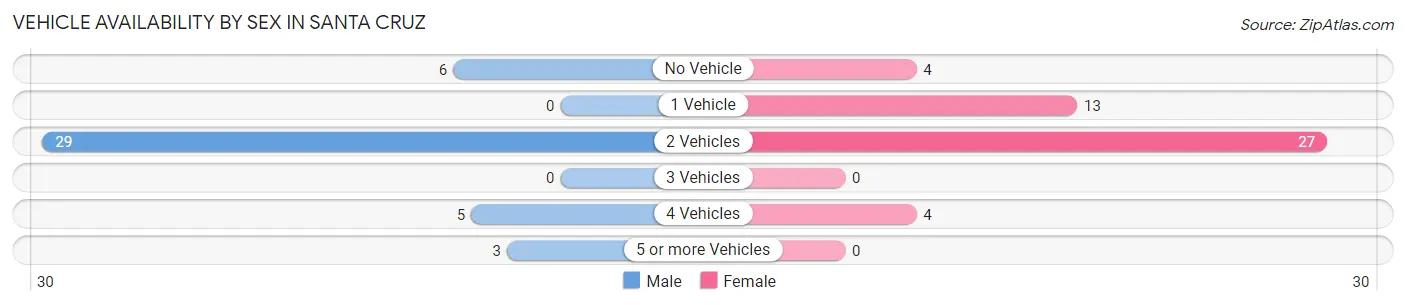
| Vehicles Available | Male | Female |
| No Vehicle | 6 (14.0%) | 4 (8.3%) |
| 1 Vehicle | 0 (0.0%) | 13 (27.1%) |
| 2 Vehicles | 29 (67.4%) | 27 (56.2%) |
| 3 Vehicles | 0 (0.0%) | 0 (0.0%) |
| 4 Vehicles | 5 (11.6%) | 4 (8.3%) |
| 5 or more Vehicles | 3 (7.0%) | 0 (0.0%) |
| Total | 43 (100.0%) | 48 (100.0%) |
Commute Time in Santa Cruz
The most frequently occuring commute durations in Santa Cruz are 20 to 24 minutes (19 commuters, 20.9%), less than 5 minutes (14 commuters, 15.4%), and 15 to 19 minutes (13 commuters, 14.3%).
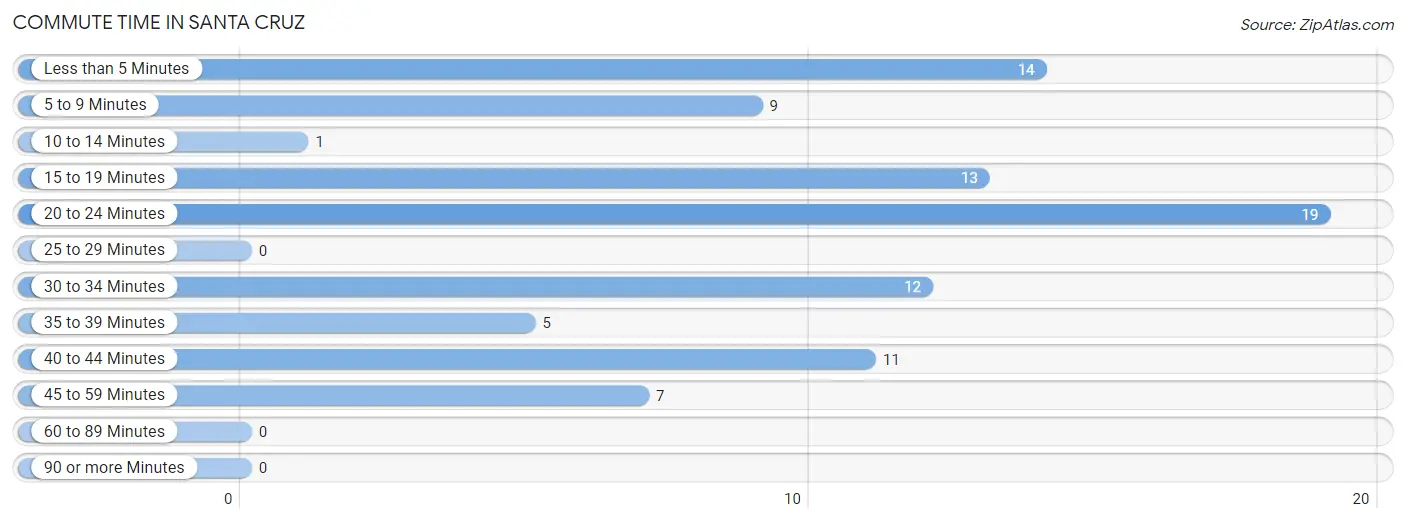
| Commute Time | # Commuters | % Commuters |
| Less than 5 Minutes | 14 | 15.4% |
| 5 to 9 Minutes | 9 | 9.9% |
| 10 to 14 Minutes | 1 | 1.1% |
| 15 to 19 Minutes | 13 | 14.3% |
| 20 to 24 Minutes | 19 | 20.9% |
| 25 to 29 Minutes | 0 | 0.0% |
| 30 to 34 Minutes | 12 | 13.2% |
| 35 to 39 Minutes | 5 | 5.5% |
| 40 to 44 Minutes | 11 | 12.1% |
| 45 to 59 Minutes | 7 | 7.7% |
| 60 to 89 Minutes | 0 | 0.0% |
| 90 or more Minutes | 0 | 0.0% |
Commute Time by Sex in Santa Cruz
The most common commute times in Santa Cruz are 20 to 24 minutes (17 commuters, 39.5%) for males and less than 5 minutes (14 commuters, 29.2%) for females.
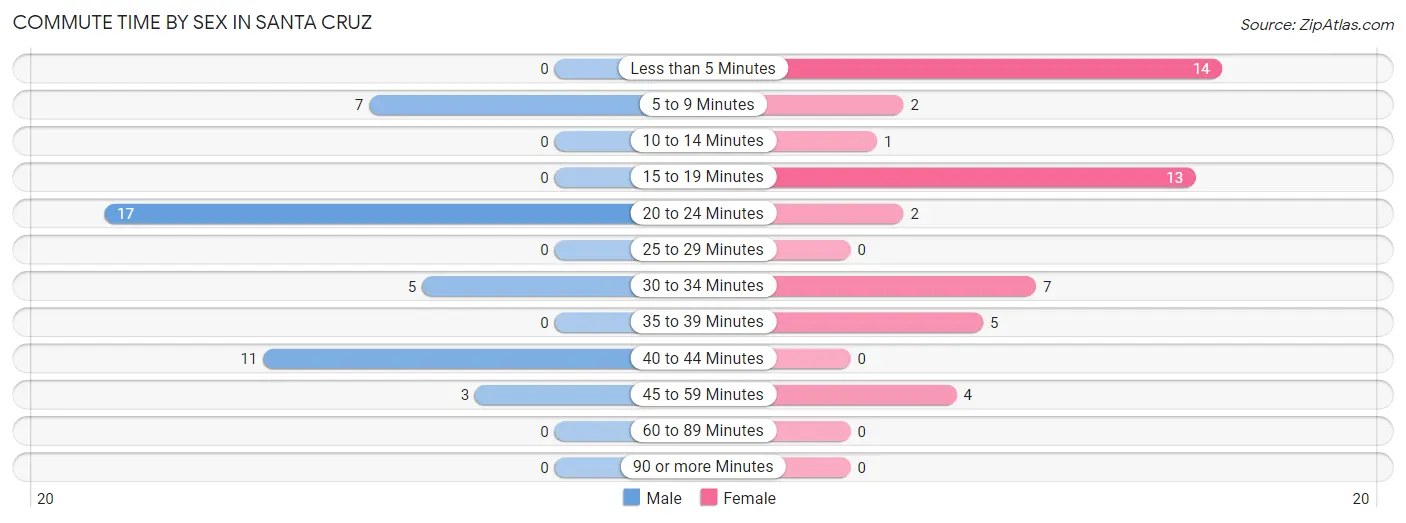
| Commute Time | Male | Female |
| Less than 5 Minutes | 0 (0.0%) | 14 (29.2%) |
| 5 to 9 Minutes | 7 (16.3%) | 2 (4.2%) |
| 10 to 14 Minutes | 0 (0.0%) | 1 (2.1%) |
| 15 to 19 Minutes | 0 (0.0%) | 13 (27.1%) |
| 20 to 24 Minutes | 17 (39.5%) | 2 (4.2%) |
| 25 to 29 Minutes | 0 (0.0%) | 0 (0.0%) |
| 30 to 34 Minutes | 5 (11.6%) | 7 (14.6%) |
| 35 to 39 Minutes | 0 (0.0%) | 5 (10.4%) |
| 40 to 44 Minutes | 11 (25.6%) | 0 (0.0%) |
| 45 to 59 Minutes | 3 (7.0%) | 4 (8.3%) |
| 60 to 89 Minutes | 0 (0.0%) | 0 (0.0%) |
| 90 or more Minutes | 0 (0.0%) | 0 (0.0%) |
Time of Departure to Work by Sex in Santa Cruz
The most frequent times of departure to work in Santa Cruz are 7:00 AM to 7:29 AM (13, 30.2%) for males and 8:00 AM to 8:29 AM (16, 33.3%) for females.
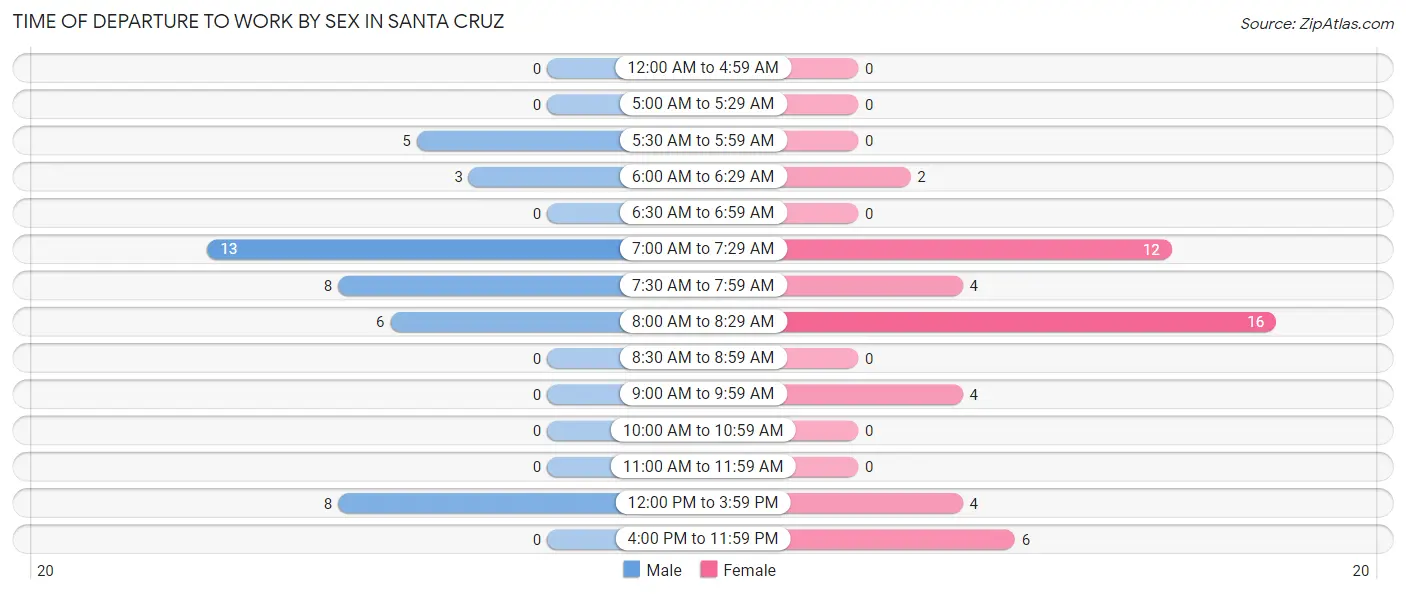
| Time of Departure | Male | Female |
| 12:00 AM to 4:59 AM | 0 (0.0%) | 0 (0.0%) |
| 5:00 AM to 5:29 AM | 0 (0.0%) | 0 (0.0%) |
| 5:30 AM to 5:59 AM | 5 (11.6%) | 0 (0.0%) |
| 6:00 AM to 6:29 AM | 3 (7.0%) | 2 (4.2%) |
| 6:30 AM to 6:59 AM | 0 (0.0%) | 0 (0.0%) |
| 7:00 AM to 7:29 AM | 13 (30.2%) | 12 (25.0%) |
| 7:30 AM to 7:59 AM | 8 (18.6%) | 4 (8.3%) |
| 8:00 AM to 8:29 AM | 6 (14.0%) | 16 (33.3%) |
| 8:30 AM to 8:59 AM | 0 (0.0%) | 0 (0.0%) |
| 9:00 AM to 9:59 AM | 0 (0.0%) | 4 (8.3%) |
| 10:00 AM to 10:59 AM | 0 (0.0%) | 0 (0.0%) |
| 11:00 AM to 11:59 AM | 0 (0.0%) | 0 (0.0%) |
| 12:00 PM to 3:59 PM | 8 (18.6%) | 4 (8.3%) |
| 4:00 PM to 11:59 PM | 0 (0.0%) | 6 (12.5%) |
| Total | 43 (100.0%) | 48 (100.0%) |
Housing Occupancy in Santa Cruz
Occupancy by Ownership in Santa Cruz
Of the total 108 dwellings in Santa Cruz, owner-occupied units account for 22 (20.4%), while renter-occupied units make up 86 (79.6%).
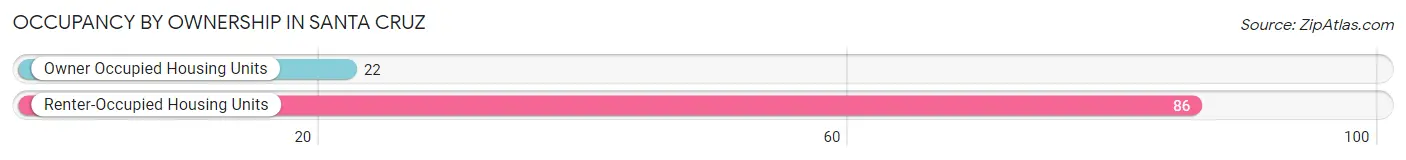
| Occupancy | # Housing Units | % Housing Units |
| Owner Occupied Housing Units | 22 | 20.4% |
| Renter-Occupied Housing Units | 86 | 79.6% |
| Total Occupied Housing Units | 108 | 100.0% |
Occupancy by Household Size in Santa Cruz
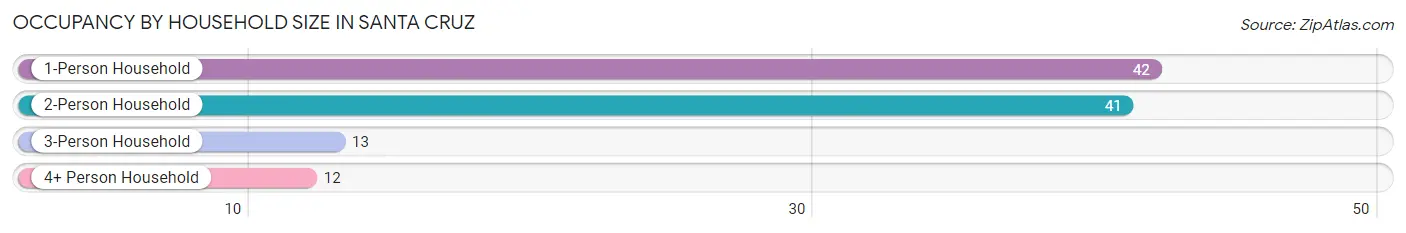
| Household Size | # Housing Units | % Housing Units |
| 1-Person Household | 42 | 38.9% |
| 2-Person Household | 41 | 38.0% |
| 3-Person Household | 13 | 12.0% |
| 4+ Person Household | 12 | 11.1% |
| Total Housing Units | 108 | 100.0% |
Occupancy by Ownership by Household Size in Santa Cruz
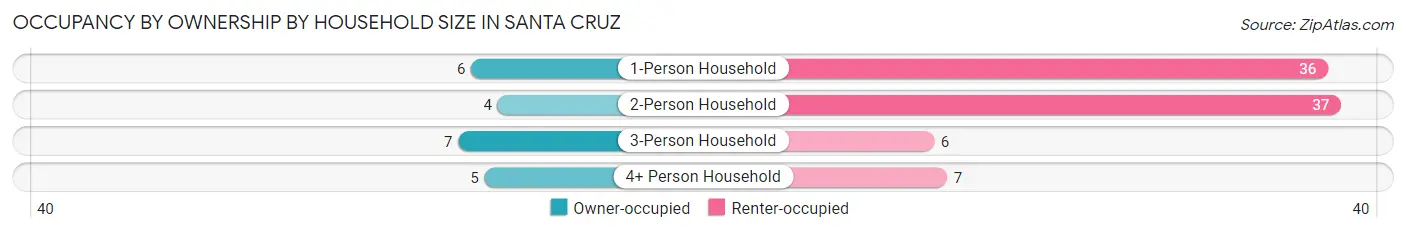
| Household Size | Owner-occupied | Renter-occupied |
| 1-Person Household | 6 (14.3%) | 36 (85.7%) |
| 2-Person Household | 4 (9.8%) | 37 (90.2%) |
| 3-Person Household | 7 (53.8%) | 6 (46.2%) |
| 4+ Person Household | 5 (41.7%) | 7 (58.3%) |
| Total Housing Units | 22 (20.4%) | 86 (79.6%) |
Occupancy by Educational Attainment in Santa Cruz
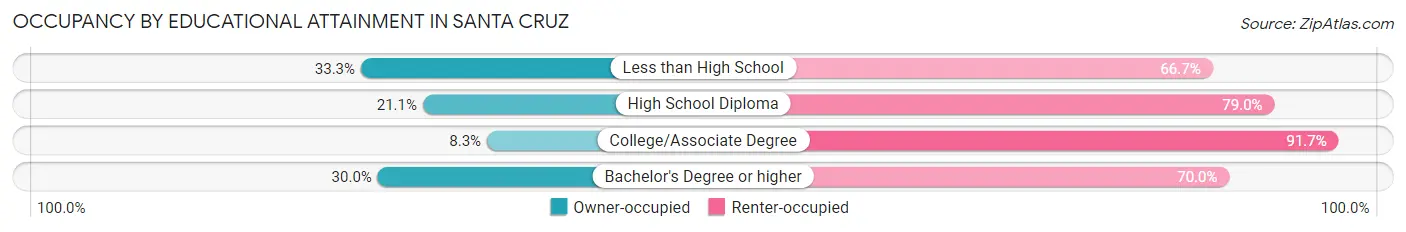
| Household Size | Owner-occupied | Renter-occupied |
| Less than High School | 8 (33.3%) | 16 (66.7%) |
| High School Diploma | 8 (21.0%) | 30 (78.9%) |
| College/Associate Degree | 3 (8.3%) | 33 (91.7%) |
| Bachelor's Degree or higher | 3 (30.0%) | 7 (70.0%) |
Occupancy by Age of Householder in Santa Cruz
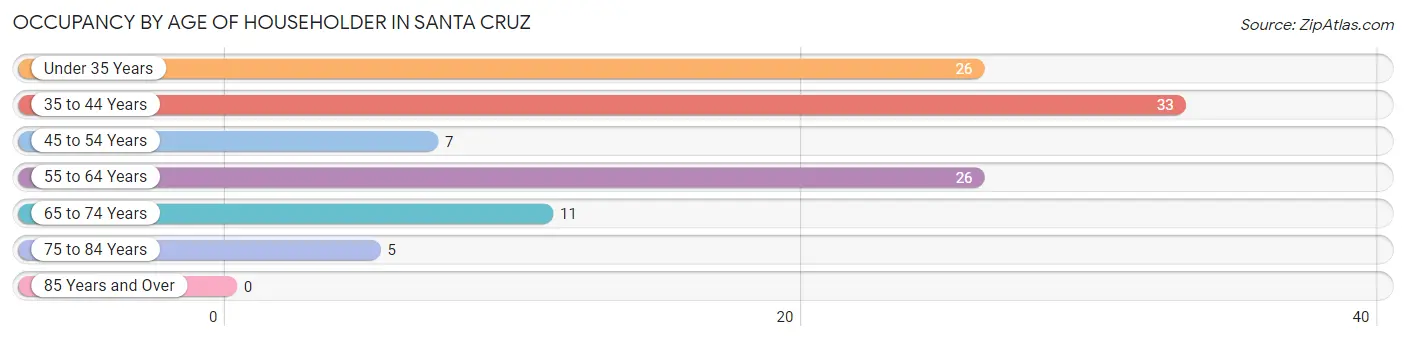
| Age Bracket | # Households | % Households |
| Under 35 Years | 26 | 24.1% |
| 35 to 44 Years | 33 | 30.6% |
| 45 to 54 Years | 7 | 6.5% |
| 55 to 64 Years | 26 | 24.1% |
| 65 to 74 Years | 11 | 10.2% |
| 75 to 84 Years | 5 | 4.6% |
| 85 Years and Over | 0 | 0.0% |
| Total | 108 | 100.0% |
Housing Finances in Santa Cruz
Median Income by Occupancy in Santa Cruz
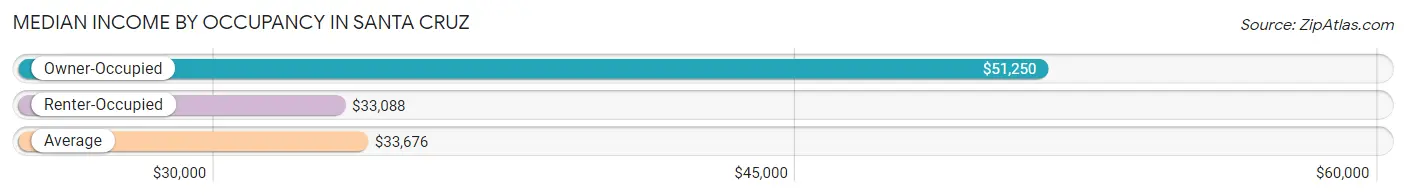
| Occupancy Type | # Households | Median Income |
| Owner-Occupied | 22 (20.4%) | $51,250 |
| Renter-Occupied | 86 (79.6%) | $33,088 |
| Average | 108 (100.0%) | $33,676 |
Occupancy by Householder Income Bracket in Santa Cruz
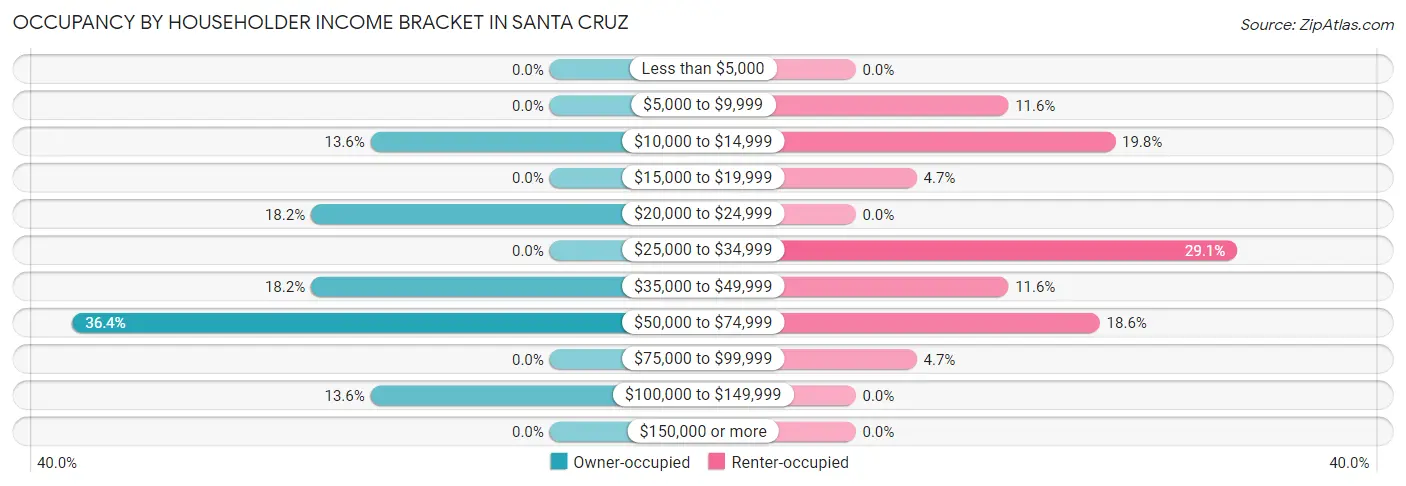
| Income Bracket | Owner-occupied | Renter-occupied |
| Less than $5,000 | 0 (0.0%) | 0 (0.0%) |
| $5,000 to $9,999 | 0 (0.0%) | 10 (11.6%) |
| $10,000 to $14,999 | 3 (13.6%) | 17 (19.8%) |
| $15,000 to $19,999 | 0 (0.0%) | 4 (4.6%) |
| $20,000 to $24,999 | 4 (18.2%) | 0 (0.0%) |
| $25,000 to $34,999 | 0 (0.0%) | 25 (29.1%) |
| $35,000 to $49,999 | 4 (18.2%) | 10 (11.6%) |
| $50,000 to $74,999 | 8 (36.4%) | 16 (18.6%) |
| $75,000 to $99,999 | 0 (0.0%) | 4 (4.6%) |
| $100,000 to $149,999 | 3 (13.6%) | 0 (0.0%) |
| $150,000 or more | 0 (0.0%) | 0 (0.0%) |
| Total | 22 (100.0%) | 86 (100.0%) |
Monthly Housing Cost Tiers in Santa Cruz
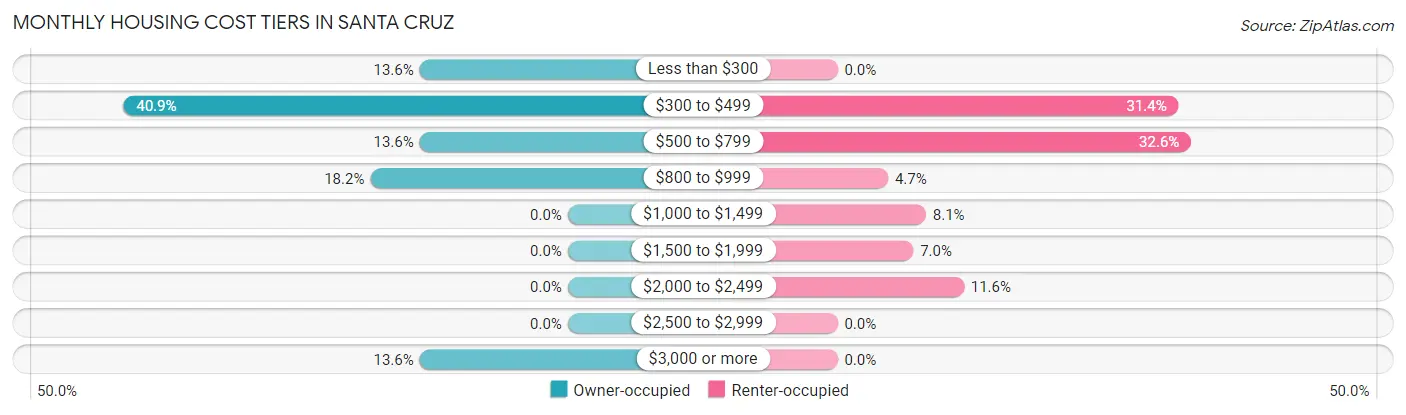
| Monthly Cost | Owner-occupied | Renter-occupied |
| Less than $300 | 3 (13.6%) | 0 (0.0%) |
| $300 to $499 | 9 (40.9%) | 27 (31.4%) |
| $500 to $799 | 3 (13.6%) | 28 (32.6%) |
| $800 to $999 | 4 (18.2%) | 4 (4.6%) |
| $1,000 to $1,499 | 0 (0.0%) | 7 (8.1%) |
| $1,500 to $1,999 | 0 (0.0%) | 6 (7.0%) |
| $2,000 to $2,499 | 0 (0.0%) | 10 (11.6%) |
| $2,500 to $2,999 | 0 (0.0%) | 0 (0.0%) |
| $3,000 or more | 3 (13.6%) | 0 (0.0%) |
| Total | 22 (100.0%) | 86 (100.0%) |
Physical Housing Characteristics in Santa Cruz
Housing Structures in Santa Cruz
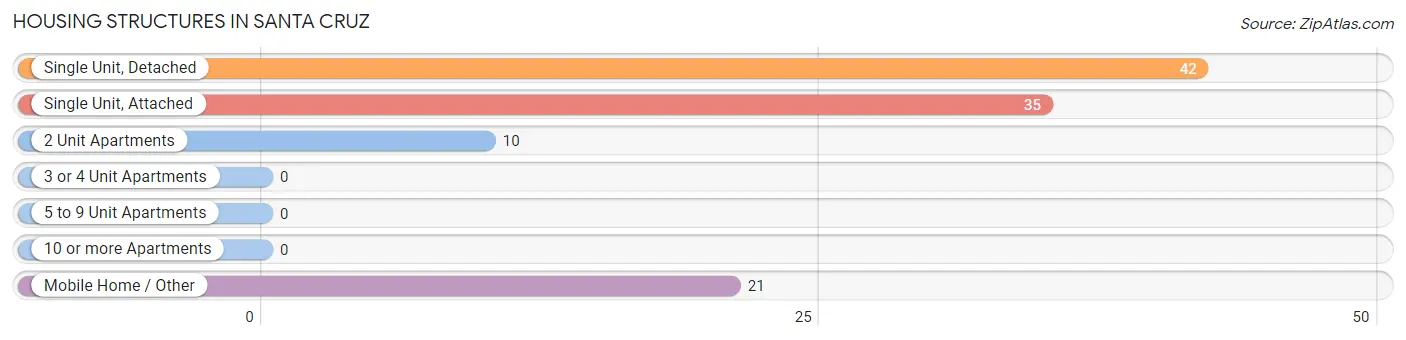
| Structure Type | # Housing Units | % Housing Units |
| Single Unit, Detached | 42 | 38.9% |
| Single Unit, Attached | 35 | 32.4% |
| 2 Unit Apartments | 10 | 9.3% |
| 3 or 4 Unit Apartments | 0 | 0.0% |
| 5 to 9 Unit Apartments | 0 | 0.0% |
| 10 or more Apartments | 0 | 0.0% |
| Mobile Home / Other | 21 | 19.4% |
| Total | 108 | 100.0% |
Housing Structures by Occupancy in Santa Cruz
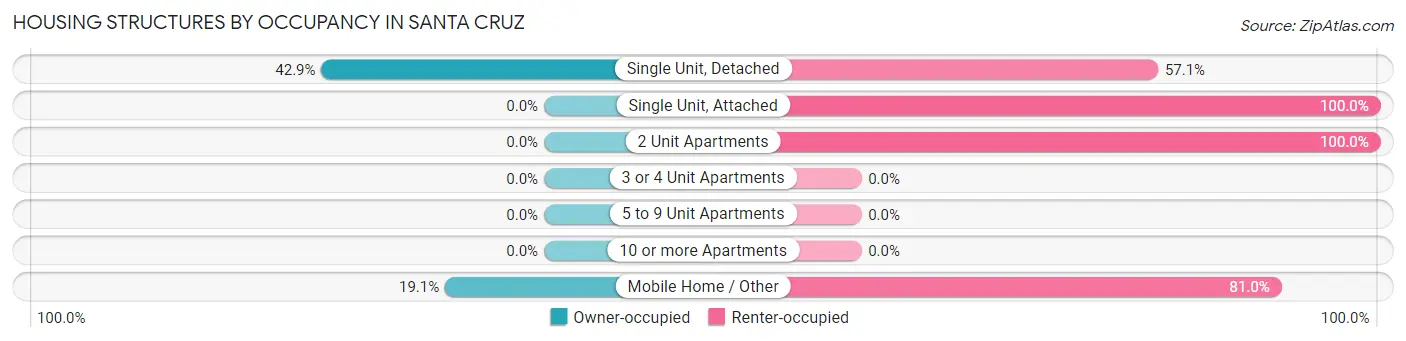
| Structure Type | Owner-occupied | Renter-occupied |
| Single Unit, Detached | 18 (42.9%) | 24 (57.1%) |
| Single Unit, Attached | 0 (0.0%) | 35 (100.0%) |
| 2 Unit Apartments | 0 (0.0%) | 10 (100.0%) |
| 3 or 4 Unit Apartments | 0 (0.0%) | 0 (0.0%) |
| 5 to 9 Unit Apartments | 0 (0.0%) | 0 (0.0%) |
| 10 or more Apartments | 0 (0.0%) | 0 (0.0%) |
| Mobile Home / Other | 4 (19.1%) | 17 (80.9%) |
| Total | 22 (20.4%) | 86 (79.6%) |
Housing Structures by Number of Rooms in Santa Cruz
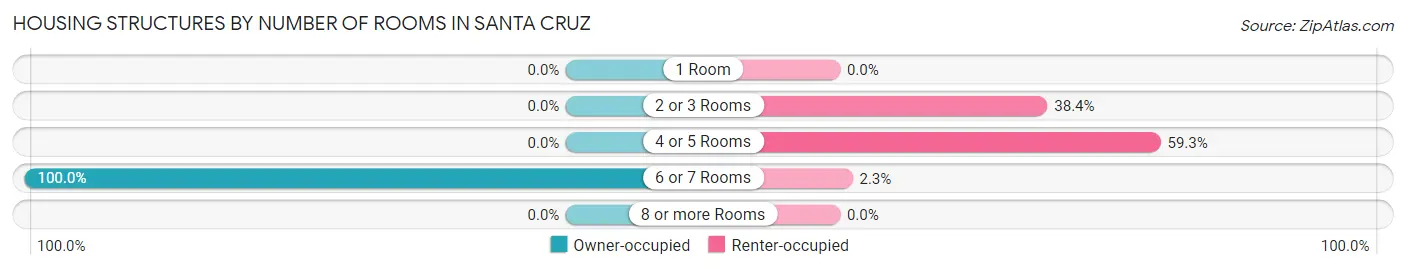
| Number of Rooms | Owner-occupied | Renter-occupied |
| 1 Room | 0 (0.0%) | 0 (0.0%) |
| 2 or 3 Rooms | 0 (0.0%) | 33 (38.4%) |
| 4 or 5 Rooms | 0 (0.0%) | 51 (59.3%) |
| 6 or 7 Rooms | 22 (100.0%) | 2 (2.3%) |
| 8 or more Rooms | 0 (0.0%) | 0 (0.0%) |
| Total | 22 (100.0%) | 86 (100.0%) |
Housing Structure by Heating Type in Santa Cruz
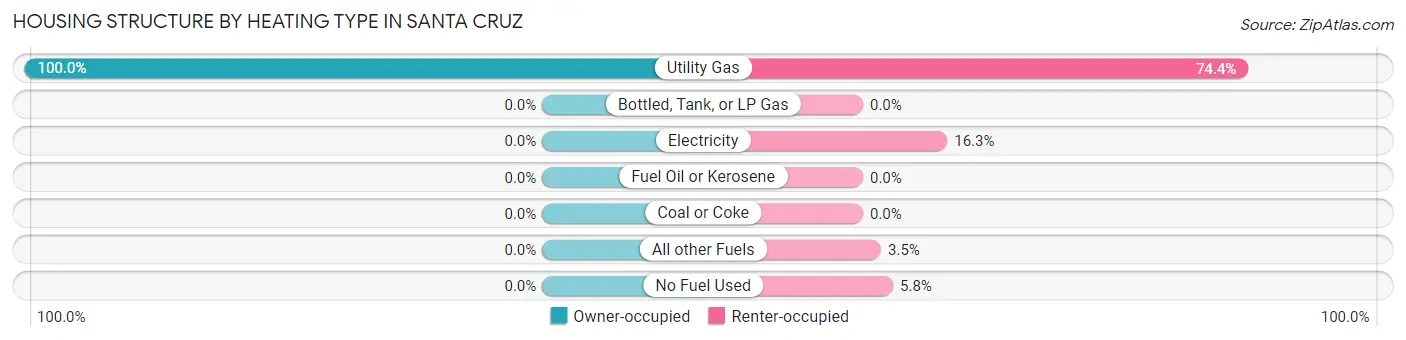
| Heating Type | Owner-occupied | Renter-occupied |
| Utility Gas | 22 (100.0%) | 64 (74.4%) |
| Bottled, Tank, or LP Gas | 0 (0.0%) | 0 (0.0%) |
| Electricity | 0 (0.0%) | 14 (16.3%) |
| Fuel Oil or Kerosene | 0 (0.0%) | 0 (0.0%) |
| Coal or Coke | 0 (0.0%) | 0 (0.0%) |
| All other Fuels | 0 (0.0%) | 3 (3.5%) |
| No Fuel Used | 0 (0.0%) | 5 (5.8%) |
| Total | 22 (100.0%) | 86 (100.0%) |
Household Vehicle Usage in Santa Cruz
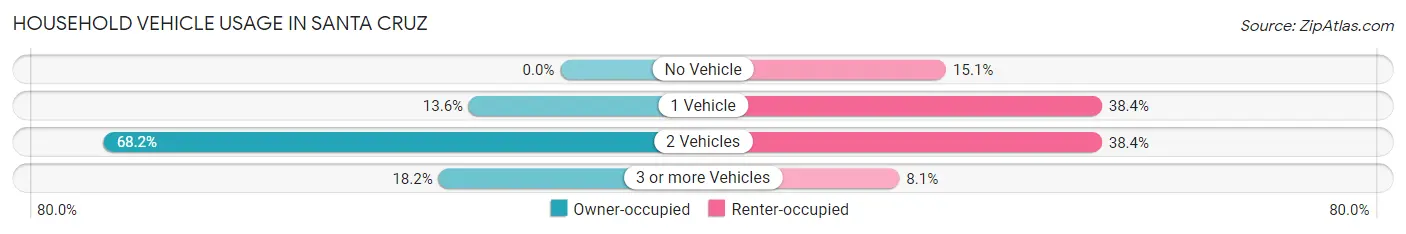
| Vehicles per Household | Owner-occupied | Renter-occupied |
| No Vehicle | 0 (0.0%) | 13 (15.1%) |
| 1 Vehicle | 3 (13.6%) | 33 (38.4%) |
| 2 Vehicles | 15 (68.2%) | 33 (38.4%) |
| 3 or more Vehicles | 4 (18.2%) | 7 (8.1%) |
| Total | 22 (100.0%) | 86 (100.0%) |
Real Estate & Mortgages in Santa Cruz
Real Estate and Mortgage Overview in Santa Cruz
| Characteristic | Without Mortgage | With Mortgage |
| Housing Units | 15 | 7 |
| Median Property Value | - | - |
| Median Household Income | $57,917 | $0 |
| Monthly Housing Costs | $395 | $3 |
| Real Estate Taxes | $820 | $0 |
Property Value by Mortgage Status in Santa Cruz
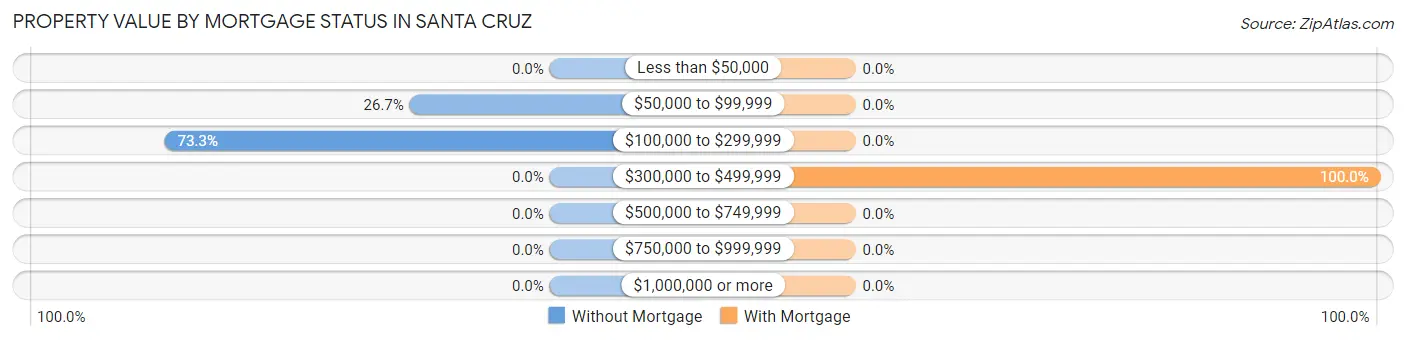
| Property Value | Without Mortgage | With Mortgage |
| Less than $50,000 | 0 (0.0%) | 0 (0.0%) |
| $50,000 to $99,999 | 4 (26.7%) | 0 (0.0%) |
| $100,000 to $299,999 | 11 (73.3%) | 0 (0.0%) |
| $300,000 to $499,999 | 0 (0.0%) | 7 (100.0%) |
| $500,000 to $749,999 | 0 (0.0%) | 0 (0.0%) |
| $750,000 to $999,999 | 0 (0.0%) | 0 (0.0%) |
| $1,000,000 or more | 0 (0.0%) | 0 (0.0%) |
| Total | 15 (100.0%) | 7 (100.0%) |
Household Income by Mortgage Status in Santa Cruz
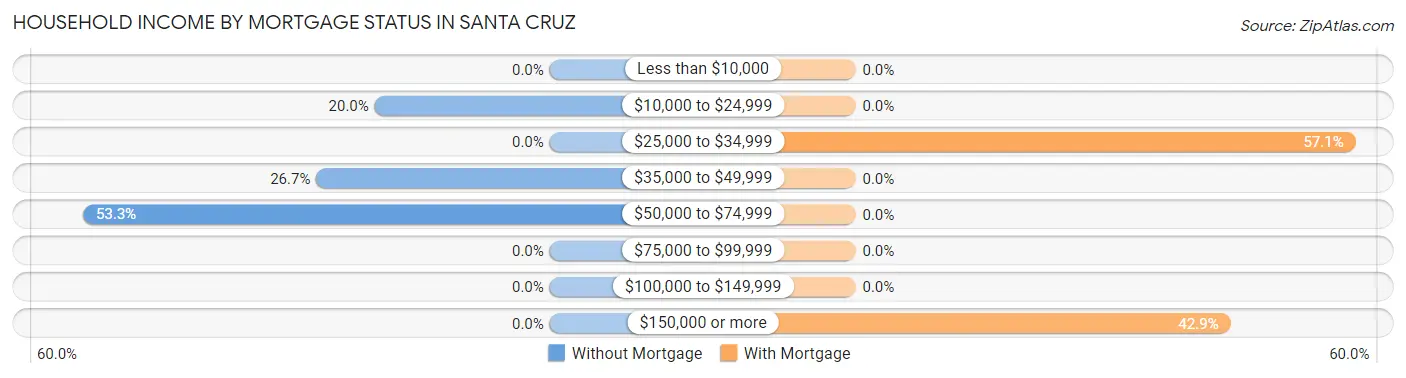
| Household Income | Without Mortgage | With Mortgage |
| Less than $10,000 | 0 (0.0%) | 0 (0.0%) |
| $10,000 to $24,999 | 3 (20.0%) | 0 (0.0%) |
| $25,000 to $34,999 | 0 (0.0%) | 4 (57.1%) |
| $35,000 to $49,999 | 4 (26.7%) | 0 (0.0%) |
| $50,000 to $74,999 | 8 (53.3%) | 0 (0.0%) |
| $75,000 to $99,999 | 0 (0.0%) | 0 (0.0%) |
| $100,000 to $149,999 | 0 (0.0%) | 0 (0.0%) |
| $150,000 or more | 0 (0.0%) | 3 (42.9%) |
| Total | 15 (100.0%) | 7 (100.0%) |
Property Value to Household Income Ratio in Santa Cruz
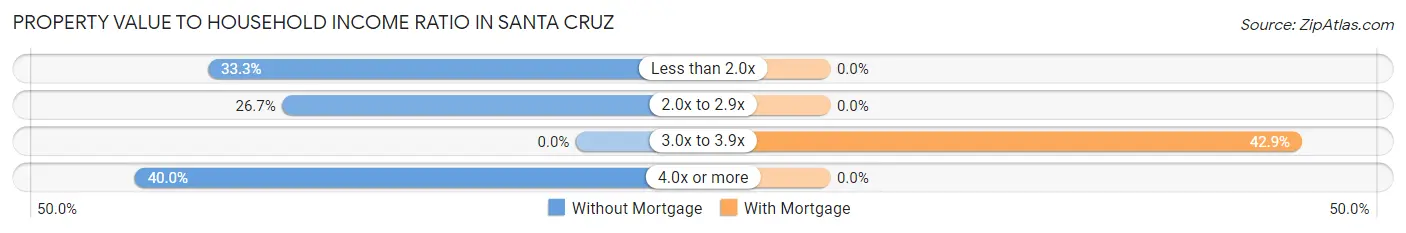
| Value-to-Income Ratio | Without Mortgage | With Mortgage |
| Less than 2.0x | 5 (33.3%) | 0 (0.0%) |
| 2.0x to 2.9x | 4 (26.7%) | 0 (0.0%) |
| 3.0x to 3.9x | 0 (0.0%) | 3 (42.9%) |
| 4.0x or more | 6 (40.0%) | 0 (0.0%) |
| Total | 15 (100.0%) | 7 (100.0%) |
Real Estate Taxes by Mortgage Status in Santa Cruz
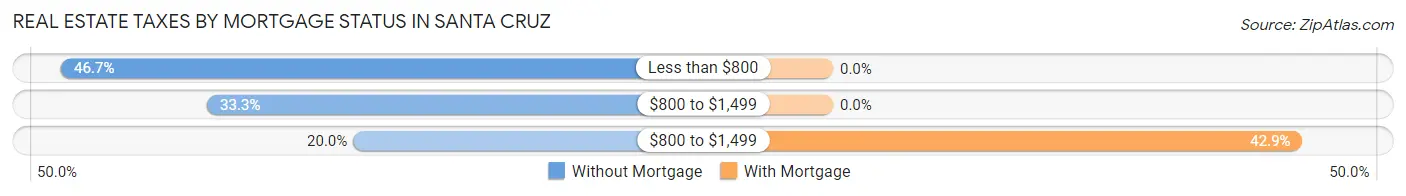
| Property Taxes | Without Mortgage | With Mortgage |
| Less than $800 | 7 (46.7%) | 0 (0.0%) |
| $800 to $1,499 | 5 (33.3%) | 0 (0.0%) |
| $800 to $1,499 | 3 (20.0%) | 3 (42.9%) |
| Total | 15 (100.0%) | 7 (100.0%) |
Health & Disability in Santa Cruz
Health Insurance Coverage by Age in Santa Cruz
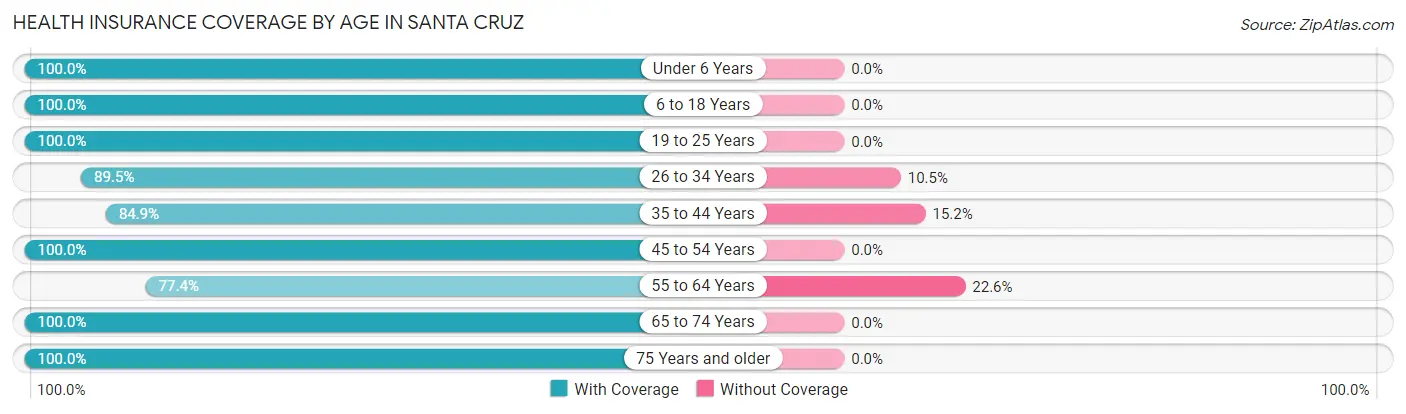
| Age Bracket | With Coverage | Without Coverage |
| Under 6 Years | 3 (100.0%) | 0 (0.0%) |
| 6 to 18 Years | 49 (100.0%) | 0 (0.0%) |
| 19 to 25 Years | 32 (100.0%) | 0 (0.0%) |
| 26 to 34 Years | 34 (89.5%) | 4 (10.5%) |
| 35 to 44 Years | 28 (84.9%) | 5 (15.1%) |
| 45 to 54 Years | 7 (100.0%) | 0 (0.0%) |
| 55 to 64 Years | 24 (77.4%) | 7 (22.6%) |
| 65 to 74 Years | 19 (100.0%) | 0 (0.0%) |
| 75 Years and older | 7 (100.0%) | 0 (0.0%) |
| Total | 203 (92.7%) | 16 (7.3%) |
Health Insurance Coverage by Citizenship Status in Santa Cruz
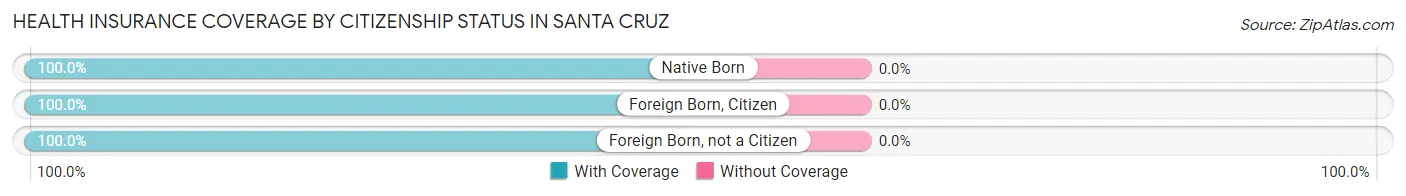
| Citizenship Status | With Coverage | Without Coverage |
| Native Born | 3 (100.0%) | 0 (0.0%) |
| Foreign Born, Citizen | 49 (100.0%) | 0 (0.0%) |
| Foreign Born, not a Citizen | 32 (100.0%) | 0 (0.0%) |
Health Insurance Coverage by Household Income in Santa Cruz
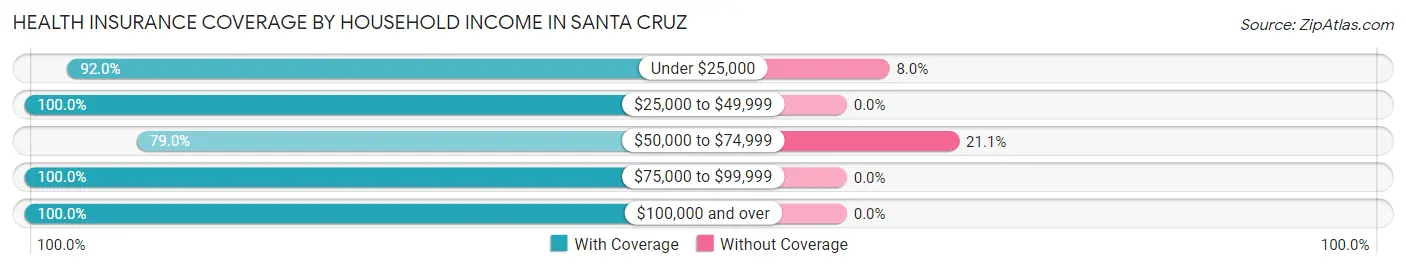
| Household Income | With Coverage | Without Coverage |
| Under $25,000 | 46 (92.0%) | 4 (8.0%) |
| $25,000 to $49,999 | 95 (100.0%) | 0 (0.0%) |
| $50,000 to $74,999 | 45 (78.9%) | 12 (21.0%) |
| $75,000 to $99,999 | 8 (100.0%) | 0 (0.0%) |
| $100,000 and over | 9 (100.0%) | 0 (0.0%) |
Public vs Private Health Insurance Coverage by Age in Santa Cruz
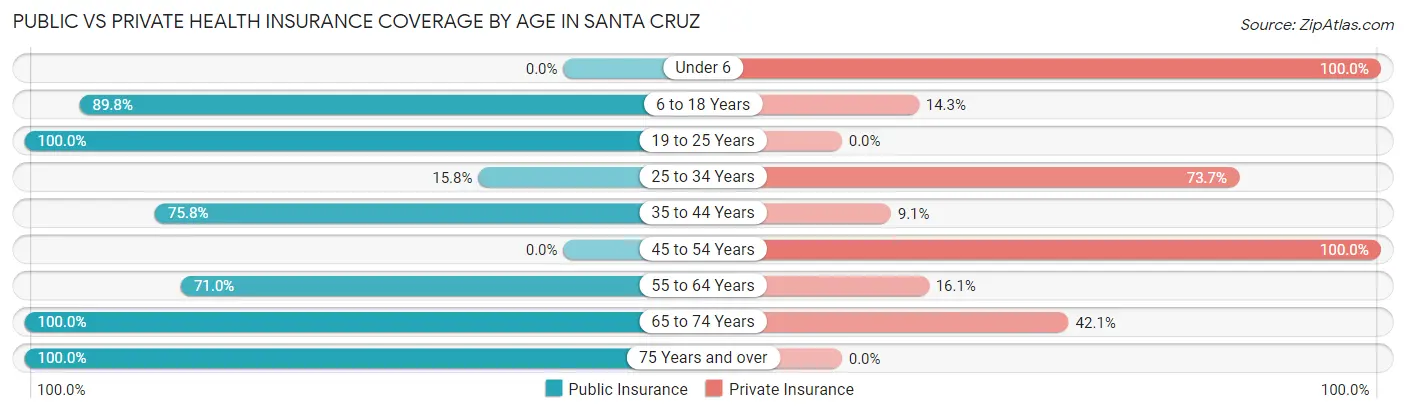
| Age Bracket | Public Insurance | Private Insurance |
| Under 6 | 0 (0.0%) | 3 (100.0%) |
| 6 to 18 Years | 44 (89.8%) | 7 (14.3%) |
| 19 to 25 Years | 32 (100.0%) | 0 (0.0%) |
| 25 to 34 Years | 6 (15.8%) | 28 (73.7%) |
| 35 to 44 Years | 25 (75.8%) | 3 (9.1%) |
| 45 to 54 Years | 0 (0.0%) | 7 (100.0%) |
| 55 to 64 Years | 22 (71.0%) | 5 (16.1%) |
| 65 to 74 Years | 19 (100.0%) | 8 (42.1%) |
| 75 Years and over | 7 (100.0%) | 0 (0.0%) |
| Total | 155 (70.8%) | 61 (27.9%) |
Disability Status by Sex by Age in Santa Cruz
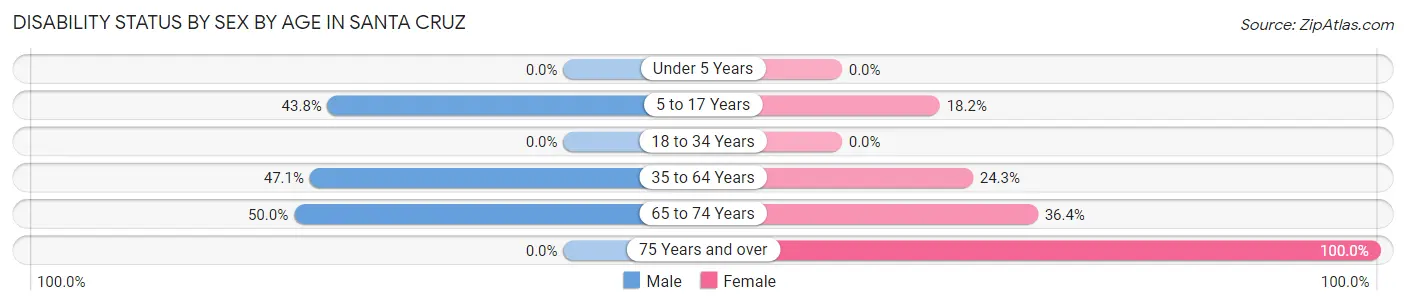
| Age Bracket | Male | Female |
| Under 5 Years | 0 (0.0%) | 0 (0.0%) |
| 5 to 17 Years | 7 (43.8%) | 6 (18.2%) |
| 18 to 34 Years | 0 (0.0%) | 0 (0.0%) |
| 35 to 64 Years | 16 (47.1%) | 9 (24.3%) |
| 65 to 74 Years | 4 (50.0%) | 4 (36.4%) |
| 75 Years and over | 0 (0.0%) | 5 (100.0%) |
Disability Class by Sex by Age in Santa Cruz
Disability Class: Hearing Difficulty
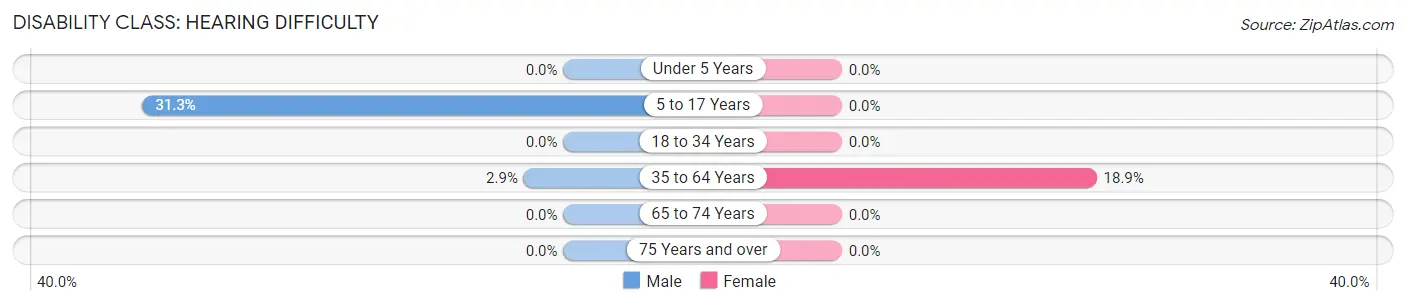
| Age Bracket | Male | Female |
| Under 5 Years | 0 (0.0%) | 0 (0.0%) |
| 5 to 17 Years | 5 (31.2%) | 0 (0.0%) |
| 18 to 34 Years | 0 (0.0%) | 0 (0.0%) |
| 35 to 64 Years | 1 (2.9%) | 7 (18.9%) |
| 65 to 74 Years | 0 (0.0%) | 0 (0.0%) |
| 75 Years and over | 0 (0.0%) | 0 (0.0%) |
Disability Class: Vision Difficulty
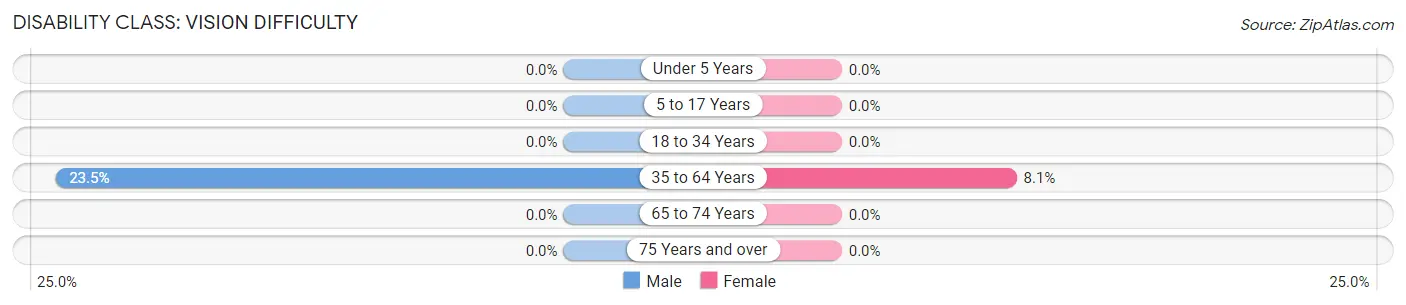
| Age Bracket | Male | Female |
| Under 5 Years | 0 (0.0%) | 0 (0.0%) |
| 5 to 17 Years | 0 (0.0%) | 0 (0.0%) |
| 18 to 34 Years | 0 (0.0%) | 0 (0.0%) |
| 35 to 64 Years | 8 (23.5%) | 3 (8.1%) |
| 65 to 74 Years | 0 (0.0%) | 0 (0.0%) |
| 75 Years and over | 0 (0.0%) | 0 (0.0%) |
Disability Class: Cognitive Difficulty
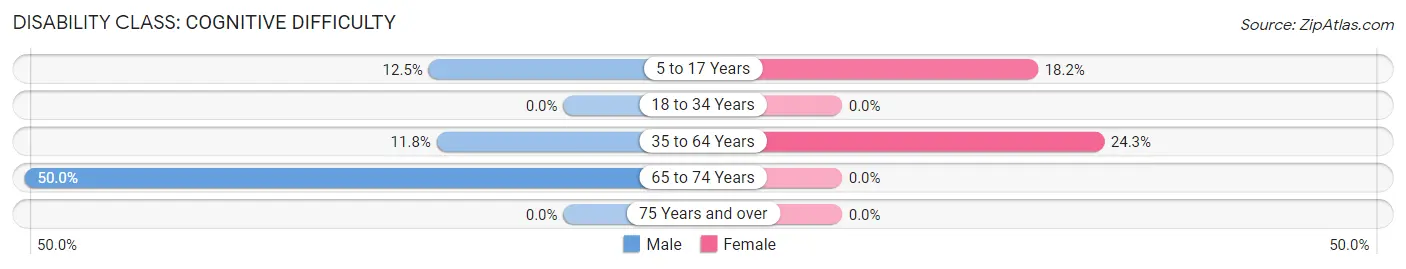
| Age Bracket | Male | Female |
| 5 to 17 Years | 2 (12.5%) | 6 (18.2%) |
| 18 to 34 Years | 0 (0.0%) | 0 (0.0%) |
| 35 to 64 Years | 4 (11.8%) | 9 (24.3%) |
| 65 to 74 Years | 4 (50.0%) | 0 (0.0%) |
| 75 Years and over | 0 (0.0%) | 0 (0.0%) |
Disability Class: Ambulatory Difficulty
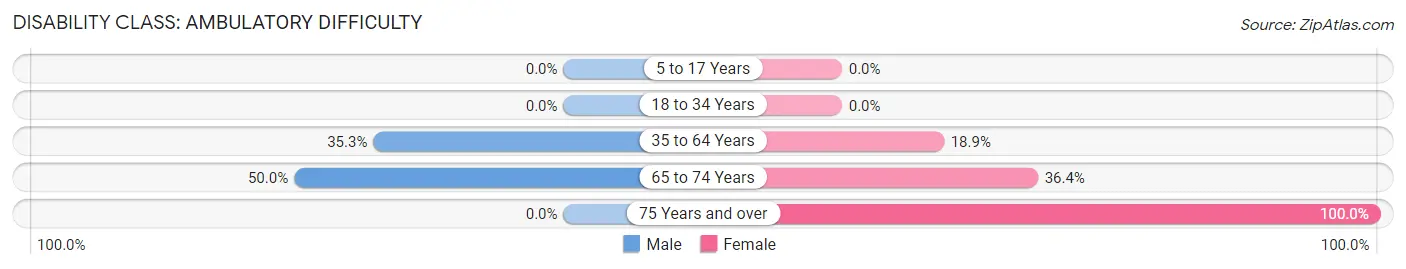
| Age Bracket | Male | Female |
| 5 to 17 Years | 0 (0.0%) | 0 (0.0%) |
| 18 to 34 Years | 0 (0.0%) | 0 (0.0%) |
| 35 to 64 Years | 12 (35.3%) | 7 (18.9%) |
| 65 to 74 Years | 4 (50.0%) | 4 (36.4%) |
| 75 Years and over | 0 (0.0%) | 5 (100.0%) |
Disability Class: Self-Care Difficulty
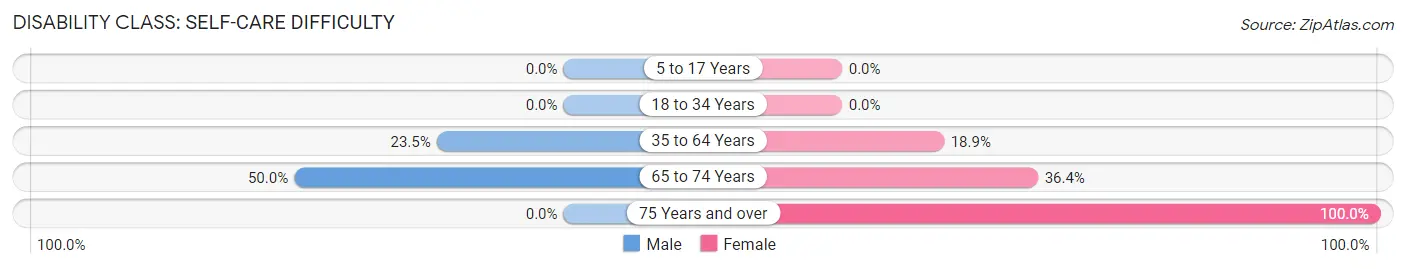
| Age Bracket | Male | Female |
| 5 to 17 Years | 0 (0.0%) | 0 (0.0%) |
| 18 to 34 Years | 0 (0.0%) | 0 (0.0%) |
| 35 to 64 Years | 8 (23.5%) | 7 (18.9%) |
| 65 to 74 Years | 4 (50.0%) | 4 (36.4%) |
| 75 Years and over | 0 (0.0%) | 5 (100.0%) |
Technology Access in Santa Cruz
Computing Device Access in Santa Cruz
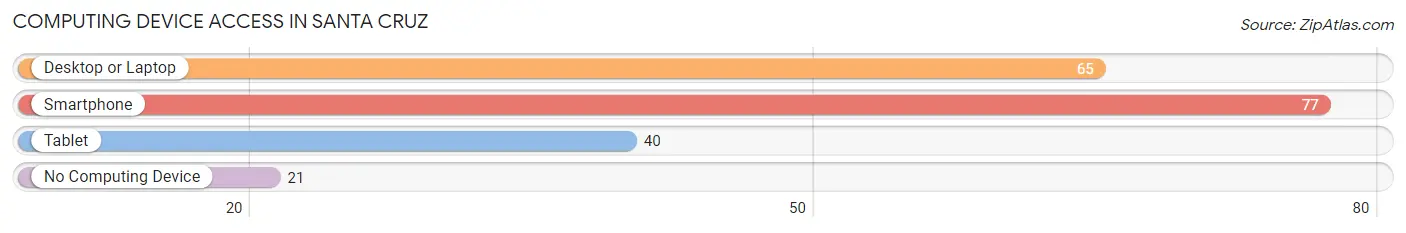
| Device Type | # Households | % Households |
| Desktop or Laptop | 65 | 60.2% |
| Smartphone | 77 | 71.3% |
| Tablet | 40 | 37.0% |
| No Computing Device | 21 | 19.4% |
| Total | 108 | 100.0% |
Internet Access in Santa Cruz
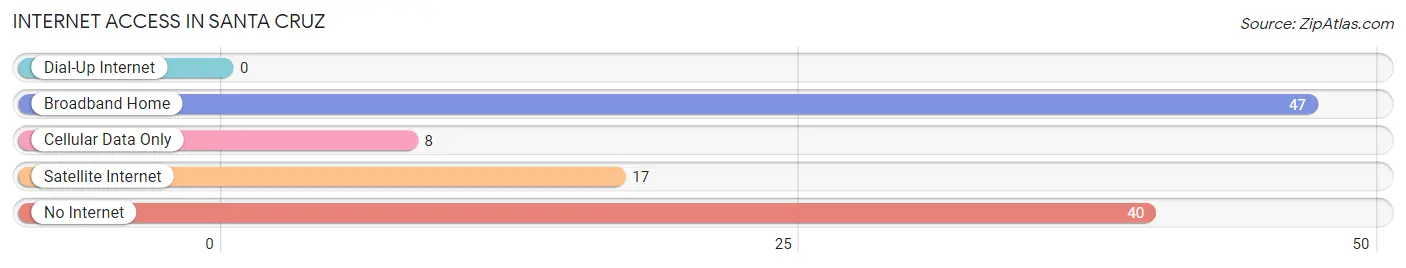
| Internet Type | # Households | % Households |
| Dial-Up Internet | 0 | 0.0% |
| Broadband Home | 47 | 43.5% |
| Cellular Data Only | 8 | 7.4% |
| Satellite Internet | 17 | 15.7% |
| No Internet | 40 | 37.0% |
| Total | 108 | 100.0% |
Santa Cruz Summary
Santa Cruz, New Mexico is a small town located in the Rio Grande Valley of New Mexico. It is situated in the northern part of the state, about 25 miles south of the state capital, Santa Fe. The town is located in Santa Fe County and has a population of approximately 1,500 people.
History
Santa Cruz was founded in 1851 by a group of settlers from the nearby town of Santa Fe. The settlers were looking for a place to settle and farm, and they chose the area around Santa Cruz because of its fertile soil and abundant water supply. The town was originally called San Francisco de Santa Cruz, but the name was later shortened to Santa Cruz.
The town grew quickly, and by the late 1800s, it had become a thriving agricultural center. The town was known for its production of wheat, corn, and other grains, as well as for its dairy products. In the early 1900s, the town also became a popular tourist destination, with many visitors coming to enjoy the area’s natural beauty.
Geography
Santa Cruz is located in the northern part of New Mexico, in the Rio Grande Valley. The town is situated at an elevation of 5,000 feet, and the surrounding area is characterized by rolling hills and mesas. The town is located near the Rio Grande River, which provides a source of irrigation for the area’s agricultural production.
The climate in Santa Cruz is semi-arid, with hot summers and mild winters. The average annual temperature is around 60 degrees Fahrenheit, and the average annual precipitation is around 12 inches.
Economy
The economy of Santa Cruz is largely based on agriculture. The town is known for its production of wheat, corn, and other grains, as well as for its dairy products. In addition, the town is home to several small businesses, including restaurants, shops, and other services.
The town is also home to a number of tourist attractions, including the Santa Cruz Museum of Art and History, the Santa Cruz County Historical Society, and the Santa Cruz County Fairgrounds. These attractions draw visitors from all over the state and beyond.
Demographics
As of the 2010 census, the population of Santa Cruz was 1,500 people. The racial makeup of the town was 94.2% White, 0.7% African American, 0.7% Native American, 0.7% Asian, 0.7% from other races, and 2.7% from two or more races. The median household income was $35,000, and the median family income was $41,000.
Conclusion
Santa Cruz, New Mexico is a small town located in the Rio Grande Valley of New Mexico. It is situated in the northern part of the state, about 25 miles south of the state capital, Santa Fe. The town is known for its production of wheat, corn, and other grains, as well as for its dairy products. The town is also home to a number of tourist attractions, including the Santa Cruz Museum of Art and History, the Santa Cruz County Historical Society, and the Santa Cruz County Fairgrounds. The population of Santa Cruz was 1,500 people as of the 2010 census, and the median household income was $35,000.
Common Questions
What is Per Capita Income in Santa Cruz?
Per Capita income in Santa Cruz is $18,503.
What is the Median Family Income in Santa Cruz?
Median Family Income in Santa Cruz is $34,853.
What is the Median Household income in Santa Cruz?
Median Household Income in Santa Cruz is $33,676.
What is Income or Wage Gap in Santa Cruz?
Income or Wage Gap in Santa Cruz is 22.3%.
Women in Santa Cruz earn 77.7 cents for every dollar earned by a man.
What is Inequality or Gini Index in Santa Cruz?
Inequality or Gini Index in Santa Cruz is 0.37.
What is the Total Population of Santa Cruz?
Total Population of Santa Cruz is 219.
What is the Total Male Population of Santa Cruz?
Total Male Population of Santa Cruz is 96.
What is the Total Female Population of Santa Cruz?
Total Female Population of Santa Cruz is 123.
What is the Ratio of Males per 100 Females in Santa Cruz?
There are 78.05 Males per 100 Females in Santa Cruz.
What is the Ratio of Females per 100 Males in Santa Cruz?
There are 128.12 Females per 100 Males in Santa Cruz.
What is the Median Population Age in Santa Cruz?
Median Population Age in Santa Cruz is 31.3 Years.
What is the Average Family Size in Santa Cruz
Average Family Size in Santa Cruz is 2.7 People.
What is the Average Household Size in Santa Cruz
Average Household Size in Santa Cruz is 2.0 People.
How Large is the Labor Force in Santa Cruz?
There are 100 People in the Labor Forcein in Santa Cruz.
What is the Percentage of People in the Labor Force in Santa Cruz?
57.1% of People are in the Labor Force in Santa Cruz.
What is the Unemployment Rate in Santa Cruz?
Unemployment Rate in Santa Cruz is 9.0%.