Sandia Park, NM Map & Demographics
Sandia Park Map
Sandia Park Overview
$44,932
PER CAPITA INCOME
$136,000
AVG FAMILY INCOME
$127,045
AVG HOUSEHOLD INCOME
0.22
INEQUALITY / GINI INDEX
411
TOTAL POPULATION
226
MALE POPULATION
185
FEMALE POPULATION
122.16
MALES / 100 FEMALES
81.86
FEMALES / 100 MALES
43.3
MEDIAN AGE
3.2
AVG FAMILY SIZE
2.6
AVG HOUSEHOLD SIZE
231
LABOR FORCE [ PEOPLE ]
73.3%
PERCENT IN LABOR FORCE
Sandia Park Zip Codes
Sandia Park Area Codes
Income in Sandia Park
Income Overview in Sandia Park
Per Capita Income in Sandia Park is $44,932, while median incomes of families and households are $136,000 and $127,045 respectively.
| Characteristic | Number | Measure |
| Per Capita Income | 411 | $44,932 |
| Median Family Income | 116 | $136,000 |
| Mean Family Income | 116 | $134,744 |
| Median Household Income | 158 | $127,045 |
| Mean Household Income | 158 | $116,786 |
| Income Deficit | 116 | $0 |
| Wage / Income Gap (%) | 411 | 0.00% |
| Wage / Income Gap ($) | 411 | 100.00¢ per $1 |
| Gini / Inequality Index | 411 | 0.22 |
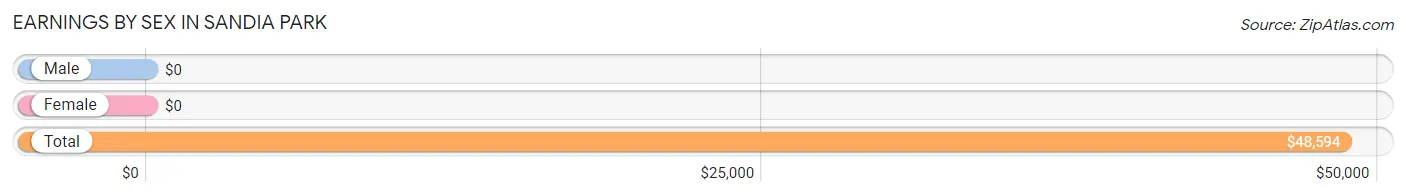
Earnings by Sex in Sandia Park
| Sex | Number | Average Earnings |
| Male | 104 (45.0%) | $0 |
| Female | 127 (55.0%) | $0 |
| Total | 231 (100.0%) | $48,594 |
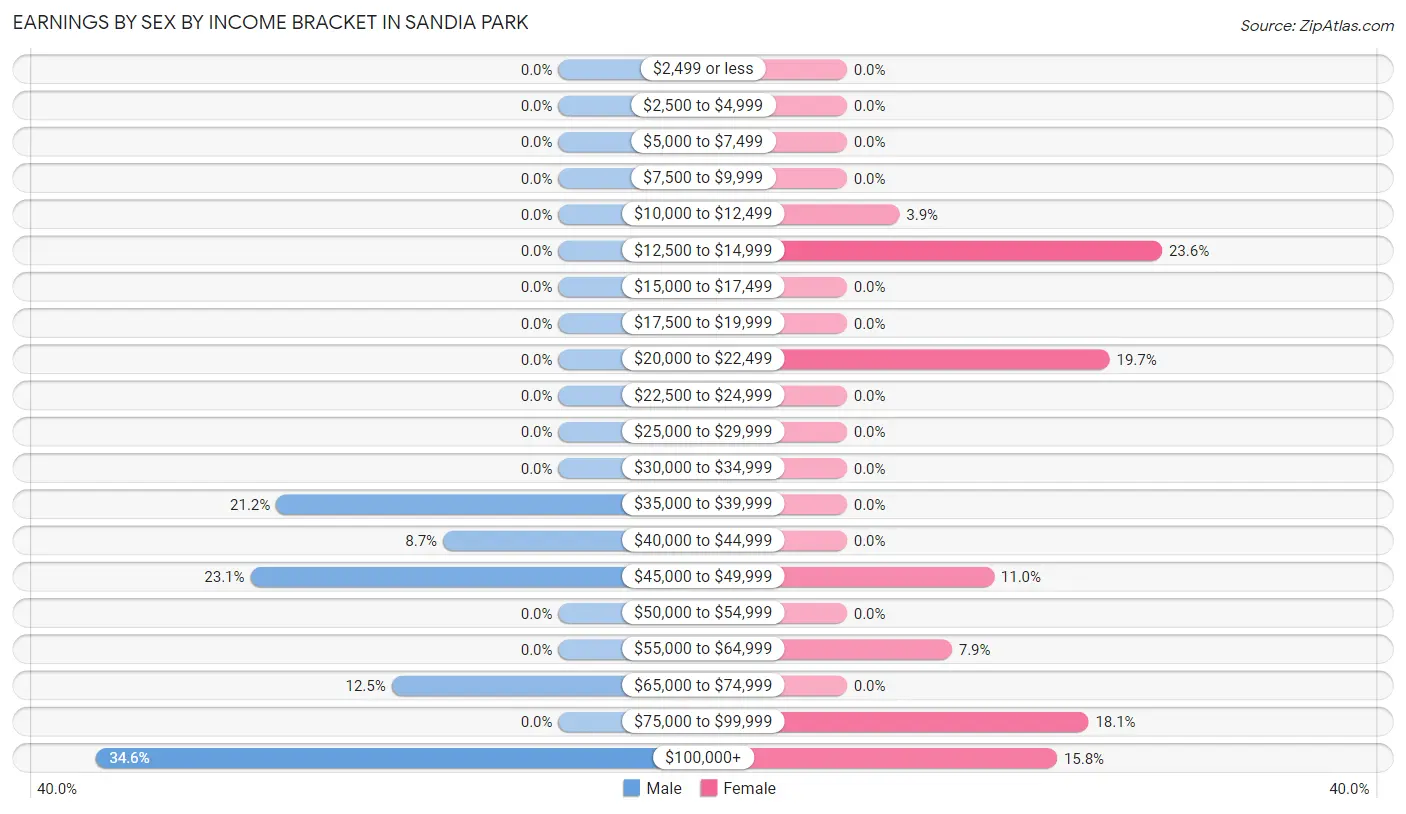
Earnings by Sex by Income Bracket in Sandia Park
The most common earnings brackets in Sandia Park are $100,000+ for men (36 | 34.6%) and $12,500 to $14,999 for women (30 | 23.6%).
| Income | Male | Female |
| $2,499 or less | 0 (0.0%) | 0 (0.0%) |
| $2,500 to $4,999 | 0 (0.0%) | 0 (0.0%) |
| $5,000 to $7,499 | 0 (0.0%) | 0 (0.0%) |
| $7,500 to $9,999 | 0 (0.0%) | 0 (0.0%) |
| $10,000 to $12,499 | 0 (0.0%) | 5 (3.9%) |
| $12,500 to $14,999 | 0 (0.0%) | 30 (23.6%) |
| $15,000 to $17,499 | 0 (0.0%) | 0 (0.0%) |
| $17,500 to $19,999 | 0 (0.0%) | 0 (0.0%) |
| $20,000 to $22,499 | 0 (0.0%) | 25 (19.7%) |
| $22,500 to $24,999 | 0 (0.0%) | 0 (0.0%) |
| $25,000 to $29,999 | 0 (0.0%) | 0 (0.0%) |
| $30,000 to $34,999 | 0 (0.0%) | 0 (0.0%) |
| $35,000 to $39,999 | 22 (21.1%) | 0 (0.0%) |
| $40,000 to $44,999 | 9 (8.6%) | 0 (0.0%) |
| $45,000 to $49,999 | 24 (23.1%) | 14 (11.0%) |
| $50,000 to $54,999 | 0 (0.0%) | 0 (0.0%) |
| $55,000 to $64,999 | 0 (0.0%) | 10 (7.9%) |
| $65,000 to $74,999 | 13 (12.5%) | 0 (0.0%) |
| $75,000 to $99,999 | 0 (0.0%) | 23 (18.1%) |
| $100,000+ | 36 (34.6%) | 20 (15.8%) |
| Total | 104 (100.0%) | 127 (100.0%) |
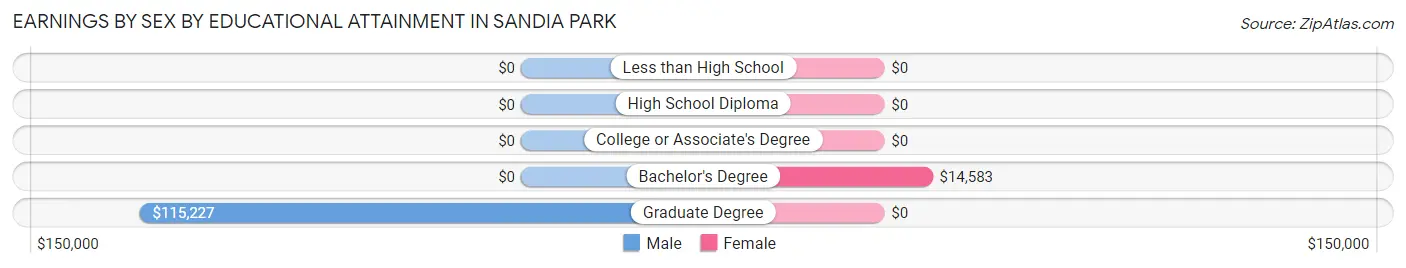
Earnings by Sex by Educational Attainment in Sandia Park
| Educational Attainment | Male Income | Female Income |
| Less than High School | - | - |
| High School Diploma | - | - |
| College or Associate's Degree | - | - |
| Bachelor's Degree | - | - |
| Graduate Degree | $115,227 | $0 |
| Total | - | - |
Family Income in Sandia Park
Family Income Brackets in Sandia Park
According to the Sandia Park family income data, there are 50 families falling into the $100,000 to $149,999 income range, which is the most common income bracket and makes up 43.1% of all families.
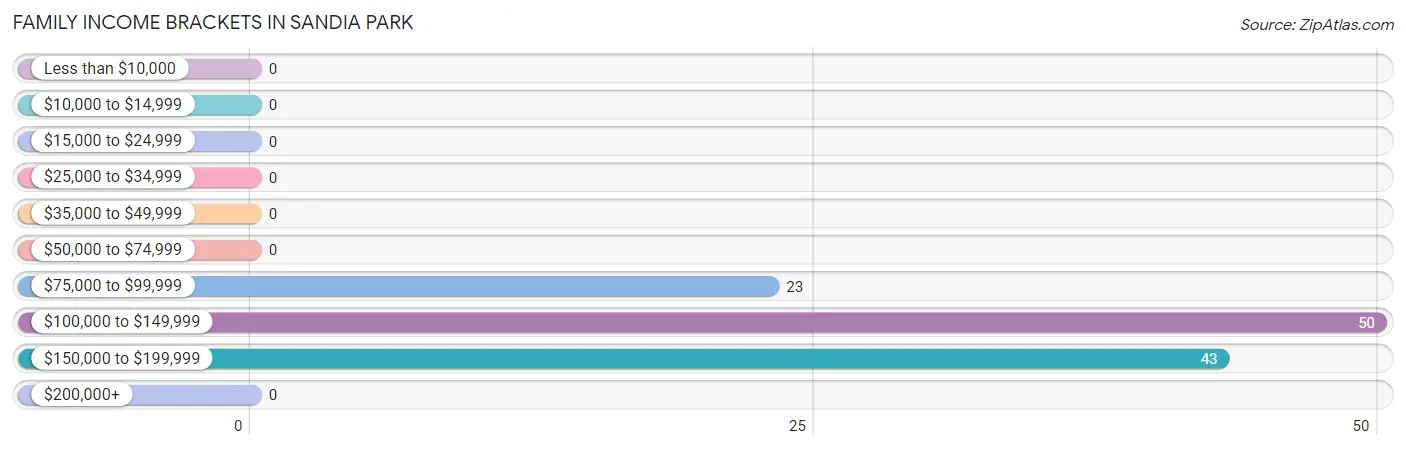
| Income Bracket | # Families | % Families |
| Less than $10,000 | 0 | 0.0% |
| $10,000 to $14,999 | 0 | 0.0% |
| $15,000 to $24,999 | 0 | 0.0% |
| $25,000 to $34,999 | 0 | 0.0% |
| $35,000 to $49,999 | 0 | 0.0% |
| $50,000 to $74,999 | 0 | 0.0% |
| $75,000 to $99,999 | 23 | 19.8% |
| $100,000 to $149,999 | 50 | 43.1% |
| $150,000 to $199,999 | 43 | 37.1% |
| $200,000+ | 0 | 0.0% |
Family Income by Famaliy Size in Sandia Park
2-person families (40 | 34.5%) account for the highest median family income in Sandia Park with $152,500 per family, while 2-person families (40 | 34.5%) have the highest median income of $76,250 per family member.
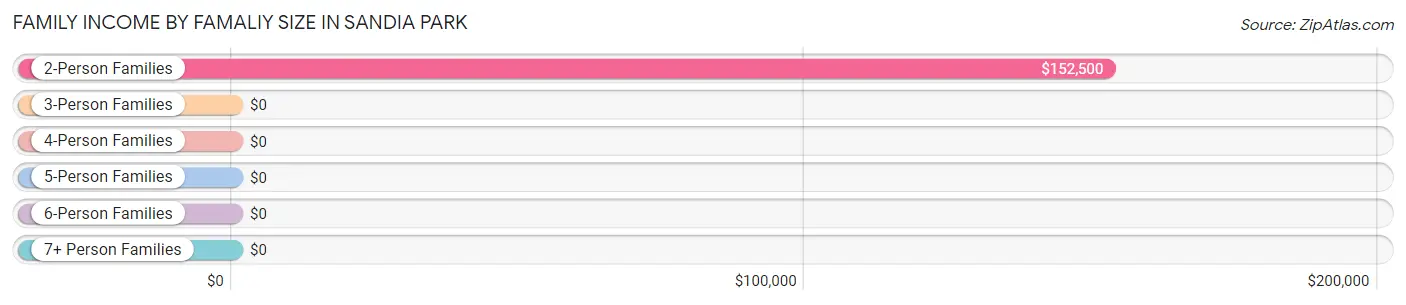
| Income Bracket | # Families | Median Income |
| 2-Person Families | 40 (34.5%) | $152,500 |
| 3-Person Families | 28 (24.1%) | $0 |
| 4-Person Families | 34 (29.3%) | $0 |
| 5-Person Families | 14 (12.1%) | $0 |
| 6-Person Families | 0 (0.0%) | $0 |
| 7+ Person Families | 0 (0.0%) | $0 |
| Total | 116 (100.0%) | $136,000 |
Family Income by Number of Earners in Sandia Park
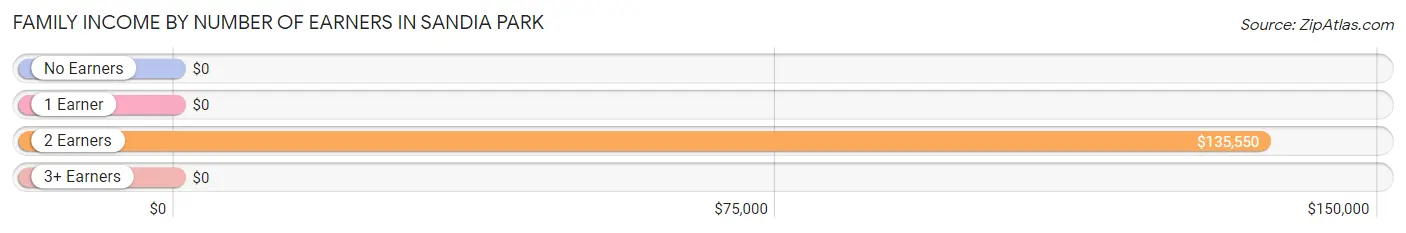
| Number of Earners | # Families | Median Income |
| No Earners | 0 (0.0%) | $0 |
| 1 Earner | 31 (26.7%) | $0 |
| 2 Earners | 85 (73.3%) | $135,550 |
| 3+ Earners | 0 (0.0%) | $0 |
| Total | 116 (100.0%) | $136,000 |
Household Income in Sandia Park
Household Income Brackets in Sandia Park
With 61 households falling in the category, the $100,000 to $149,999 income range is the most frequent in Sandia Park, accounting for 38.6% of all households.
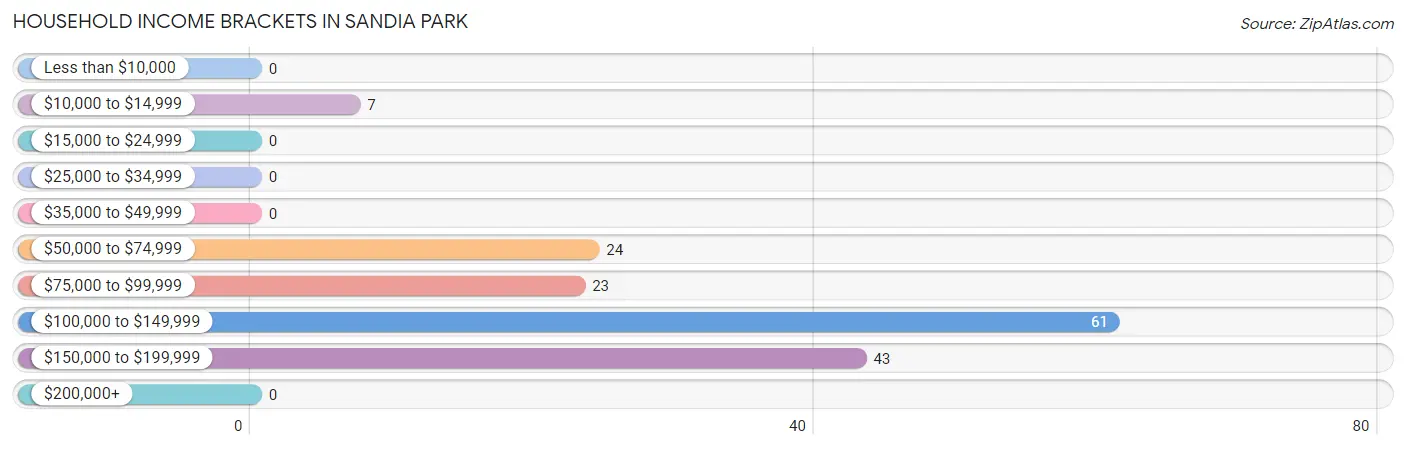
| Income Bracket | # Households | % Households |
| Less than $10,000 | 0 | 0.0% |
| $10,000 to $14,999 | 7 | 4.4% |
| $15,000 to $24,999 | 0 | 0.0% |
| $25,000 to $34,999 | 0 | 0.0% |
| $35,000 to $49,999 | 0 | 0.0% |
| $50,000 to $74,999 | 24 | 15.2% |
| $75,000 to $99,999 | 23 | 14.6% |
| $100,000 to $149,999 | 61 | 38.6% |
| $150,000 to $199,999 | 43 | 27.2% |
| $200,000+ | 0 | 0.0% |
Household Income by Householder Age in Sandia Park
The median household income in Sandia Park is $127,045, with the highest median household income of $175,125 found in the 65+ years age bracket for the primary householder. A total of 38 households (24.0%) fall into this category.
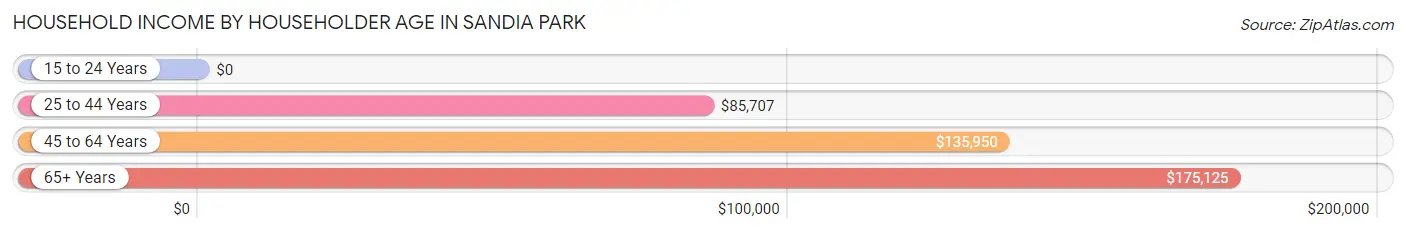
| Income Bracket | # Households | Median Income |
| 15 to 24 Years | 0 (0.0%) | $0 |
| 25 to 44 Years | 61 (38.6%) | $85,707 |
| 45 to 64 Years | 59 (37.3%) | $135,950 |
| 65+ Years | 38 (24.0%) | $175,125 |
| Total | 158 (100.0%) | $127,045 |
Poverty in Sandia Park
Income Below Poverty by Sex and Age in Sandia Park
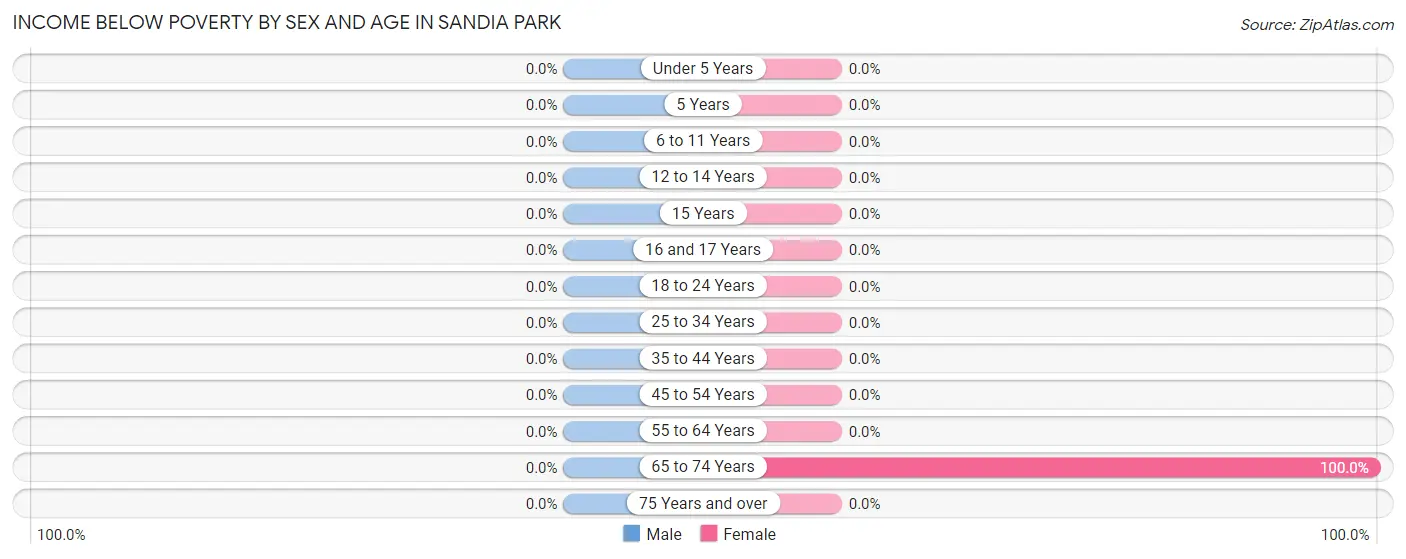
| Age Bracket | Male | Female |
| Under 5 Years | 0 (0.0%) | 0 (0.0%) |
| 5 Years | 0 (0.0%) | 0 (0.0%) |
| 6 to 11 Years | 0 (0.0%) | 0 (0.0%) |
| 12 to 14 Years | 0 (0.0%) | 0 (0.0%) |
| 15 Years | 0 (0.0%) | 0 (0.0%) |
| 16 and 17 Years | 0 (0.0%) | 0 (0.0%) |
| 18 to 24 Years | 0 (0.0%) | 0 (0.0%) |
| 25 to 34 Years | 0 (0.0%) | 0 (0.0%) |
| 35 to 44 Years | 0 (0.0%) | 0 (0.0%) |
| 45 to 54 Years | 0 (0.0%) | 0 (0.0%) |
| 55 to 64 Years | 0 (0.0%) | 0 (0.0%) |
| 65 to 74 Years | 0 (0.0%) | 7 (100.0%) |
| 75 Years and over | 0 (0.0%) | 0 (0.0%) |
| Total | 0 (0.0%) | 7 (3.8%) |
Income Above Poverty by Sex and Age in Sandia Park
According to the poverty statistics in Sandia Park, males aged under 5 years and females aged 6 to 11 years are the age groups that are most secure financially, with 100.0% of males and 100.0% of females in these age groups living above the poverty line.
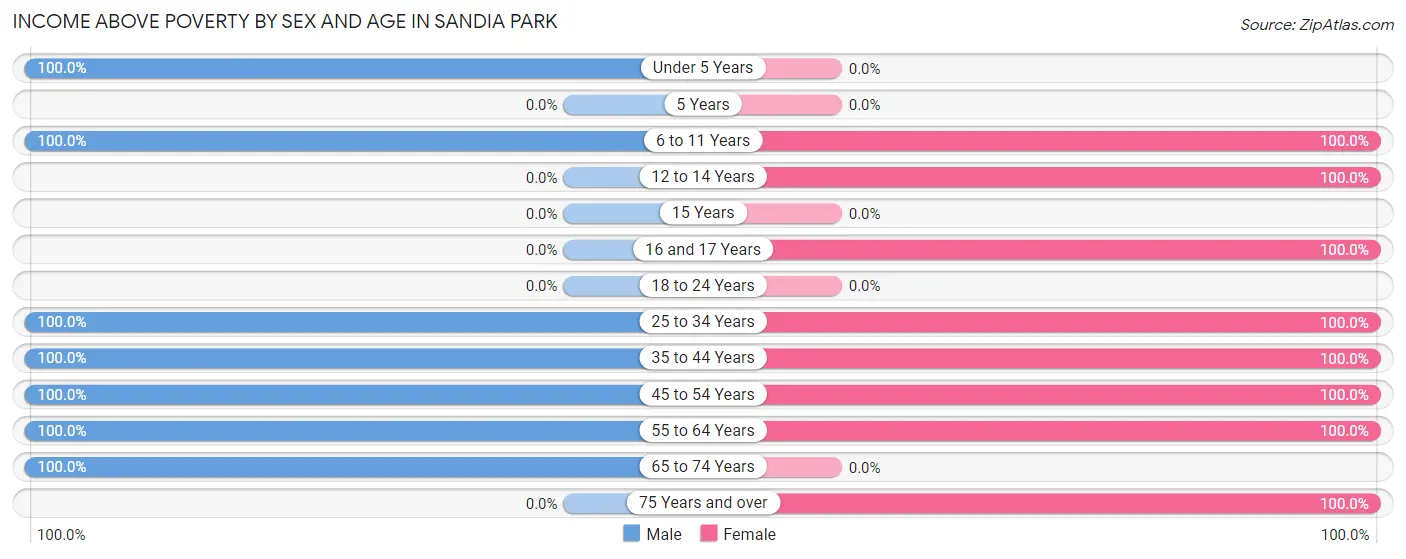
| Age Bracket | Male | Female |
| Under 5 Years | 5 (100.0%) | 0 (0.0%) |
| 5 Years | 0 (0.0%) | 0 (0.0%) |
| 6 to 11 Years | 65 (100.0%) | 13 (100.0%) |
| 12 to 14 Years | 0 (0.0%) | 13 (100.0%) |
| 15 Years | 0 (0.0%) | 0 (0.0%) |
| 16 and 17 Years | 0 (0.0%) | 10 (100.0%) |
| 18 to 24 Years | 0 (0.0%) | 0 (0.0%) |
| 25 to 34 Years | 27 (100.0%) | 42 (100.0%) |
| 35 to 44 Years | 46 (100.0%) | 10 (100.0%) |
| 45 to 54 Years | 22 (100.0%) | 39 (100.0%) |
| 55 to 64 Years | 41 (100.0%) | 40 (100.0%) |
| 65 to 74 Years | 20 (100.0%) | 0 (0.0%) |
| 75 Years and over | 0 (0.0%) | 11 (100.0%) |
| Total | 226 (100.0%) | 178 (96.2%) |
Income Below Poverty Among Married-Couple Families in Sandia Park
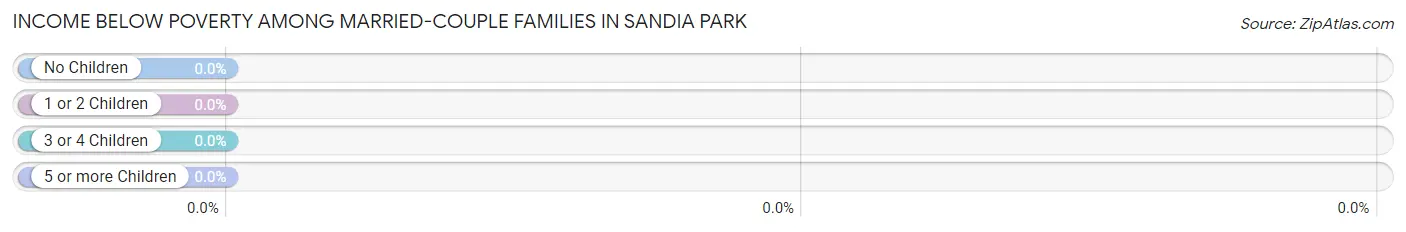
| Children | Above Poverty | Below Poverty |
| No Children | 52 (100.0%) | 0 (0.0%) |
| 1 or 2 Children | 39 (100.0%) | 0 (0.0%) |
| 3 or 4 Children | 14 (100.0%) | 0 (0.0%) |
| 5 or more Children | 0 (0.0%) | 0 (0.0%) |
| Total | 105 (100.0%) | 0 (0.0%) |
Income Below Poverty Among Single-Parent Households in Sandia Park
| Children | Single Father | Single Mother |
| No Children | 0 (0.0%) | 0 (0.0%) |
| 1 or 2 Children | 0 (0.0%) | 0 (0.0%) |
| 3 or 4 Children | 0 (0.0%) | 0 (0.0%) |
| 5 or more Children | 0 (0.0%) | 0 (0.0%) |
| Total | 0 (0.0%) | 0 (0.0%) |
Income Below Poverty Among Married-Couple vs Single-Parent Households in Sandia Park
| Children | Married-Couple Families | Single-Parent Households |
| No Children | 0 (0.0%) | 0 (0.0%) |
| 1 or 2 Children | 0 (0.0%) | 0 (0.0%) |
| 3 or 4 Children | 0 (0.0%) | 0 (0.0%) |
| 5 or more Children | 0 (0.0%) | 0 (0.0%) |
| Total | 0 (0.0%) | 0 (0.0%) |
Race in Sandia Park
The most populous races in Sandia Park are White / Caucasian (379 | 92.2%), Hispanic or Latino (34 | 8.3%), and Asian (22 | 5.3%).
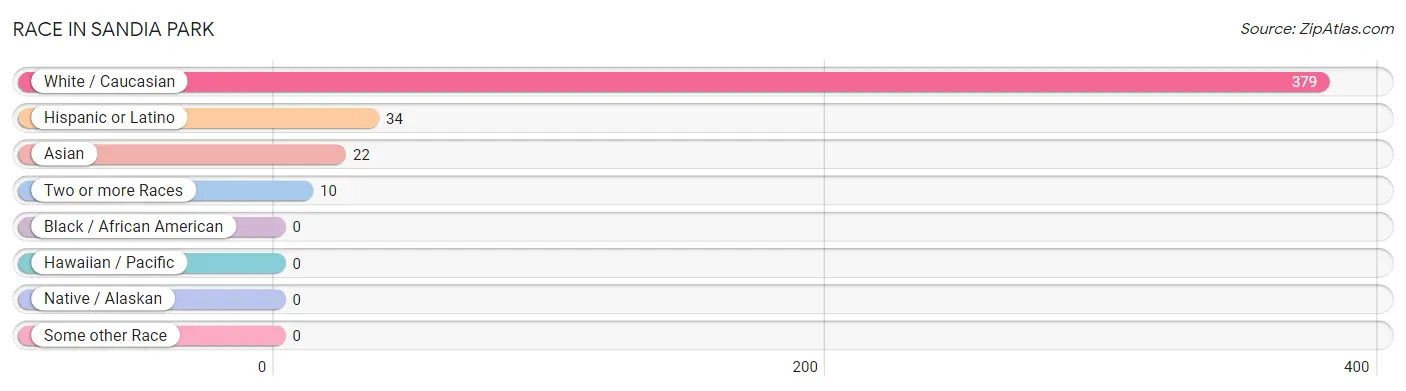
| Race | # Population | % Population |
| Asian | 22 | 5.3% |
| Black / African American | 0 | 0.0% |
| Hawaiian / Pacific | 0 | 0.0% |
| Hispanic or Latino | 34 | 8.3% |
| Native / Alaskan | 0 | 0.0% |
| White / Caucasian | 379 | 92.2% |
| Two or more Races | 10 | 2.4% |
| Some other Race | 0 | 0.0% |
| Total | 411 | 100.0% |
Ancestry in Sandia Park
The most populous ancestries reported in Sandia Park are European (106 | 25.8%), Dutch (55 | 13.4%), German (40 | 9.7%), British (25 | 6.1%), and Malaysian (22 | 5.3%), together accounting for 60.3% of all Sandia Park residents.
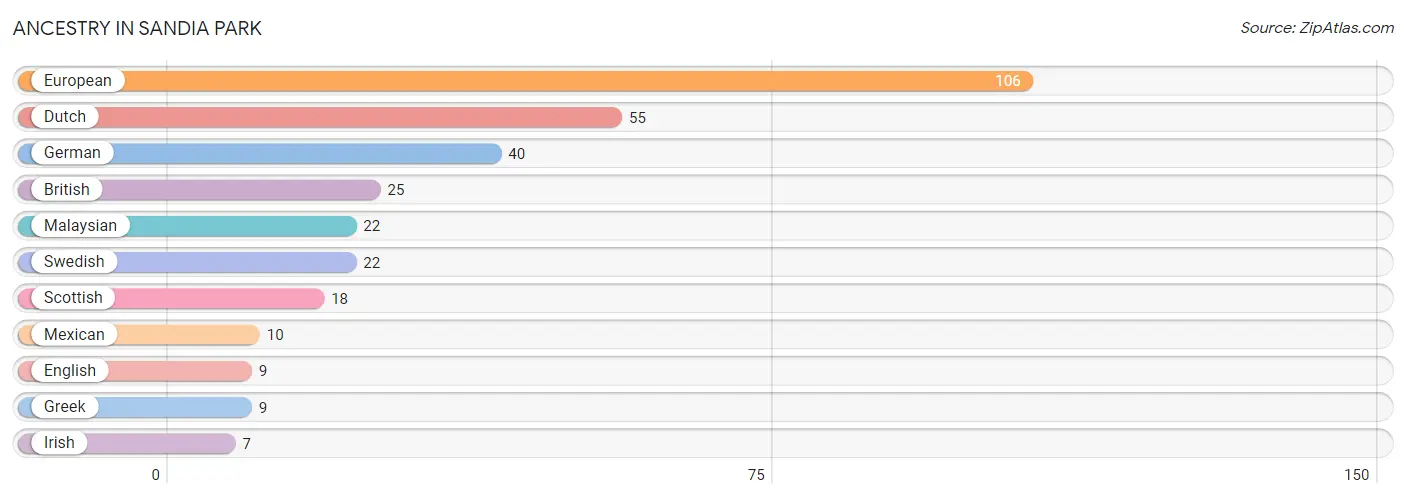
| Ancestry | # Population | % Population |
| British | 25 | 6.1% |
| Dutch | 55 | 13.4% |
| English | 9 | 2.2% |
| European | 106 | 25.8% |
| German | 40 | 9.7% |
| Greek | 9 | 2.2% |
| Irish | 7 | 1.7% |
| Malaysian | 22 | 5.3% |
| Mexican | 10 | 2.4% |
| Scottish | 18 | 4.4% |
| Swedish | 22 | 5.3% | View All 11 Rows |
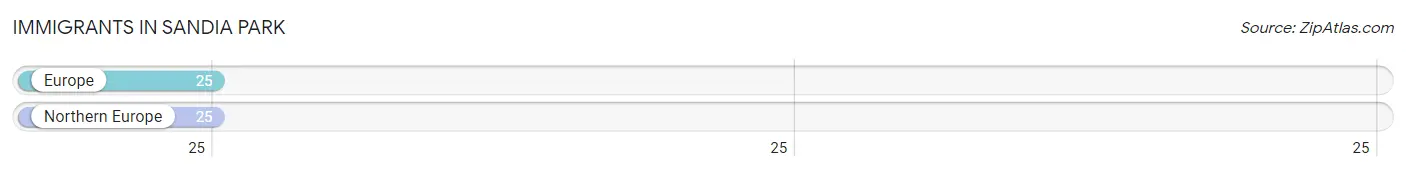
Immigrants in Sandia Park
The most numerous immigrant groups reported in Sandia Park came from Europe (25 | 6.1%), and Northern Europe (25 | 6.1%), together accounting for 12.2% of all Sandia Park residents.
| Immigration Origin | # Population | % Population |
| Europe | 25 | 6.1% |
| Northern Europe | 25 | 6.1% | View All 2 Rows |
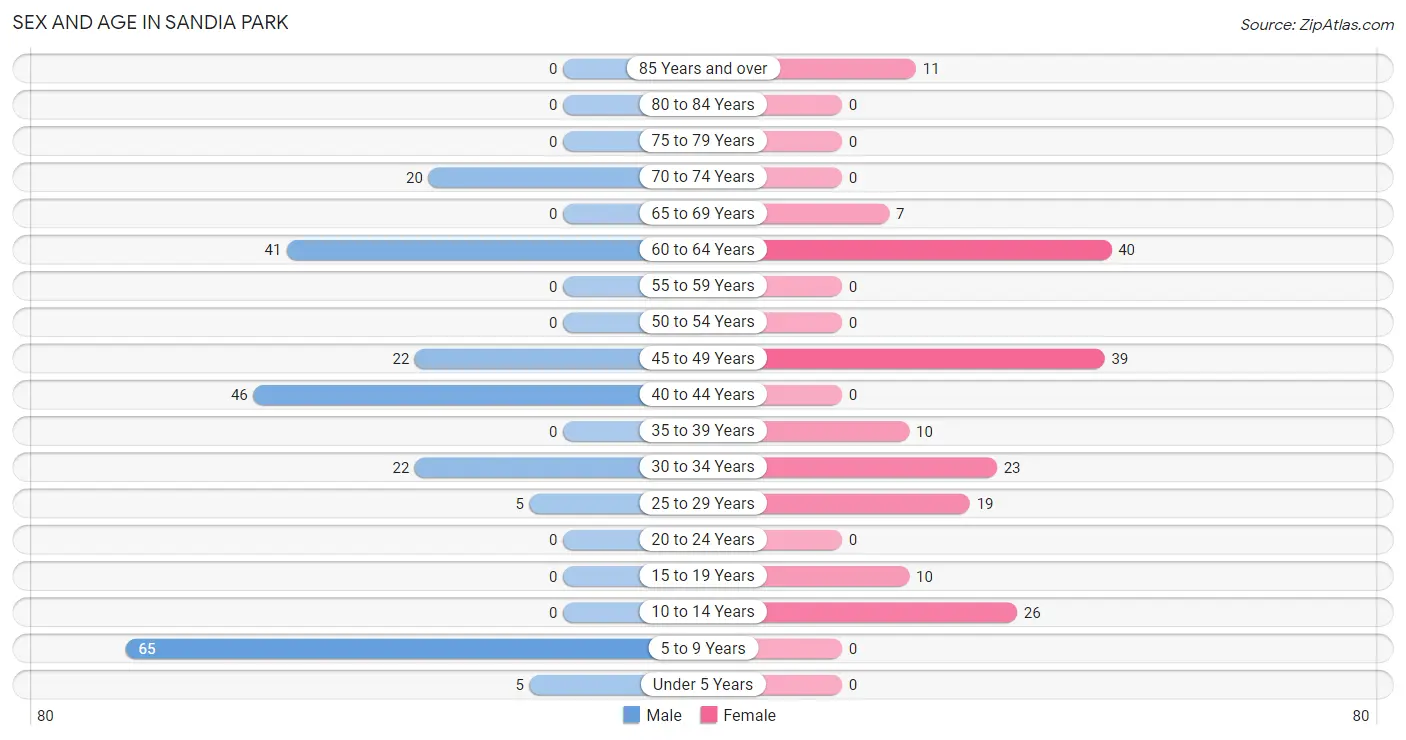
Sex and Age in Sandia Park
Sex and Age in Sandia Park
The most populous age groups in Sandia Park are 5 to 9 Years (65 | 28.8%) for men and 60 to 64 Years (40 | 21.6%) for women.
| Age Bracket | Male | Female |
| Under 5 Years | 5 (2.2%) | 0 (0.0%) |
| 5 to 9 Years | 65 (28.8%) | 0 (0.0%) |
| 10 to 14 Years | 0 (0.0%) | 26 (14.1%) |
| 15 to 19 Years | 0 (0.0%) | 10 (5.4%) |
| 20 to 24 Years | 0 (0.0%) | 0 (0.0%) |
| 25 to 29 Years | 5 (2.2%) | 19 (10.3%) |
| 30 to 34 Years | 22 (9.7%) | 23 (12.4%) |
| 35 to 39 Years | 0 (0.0%) | 10 (5.4%) |
| 40 to 44 Years | 46 (20.3%) | 0 (0.0%) |
| 45 to 49 Years | 22 (9.7%) | 39 (21.1%) |
| 50 to 54 Years | 0 (0.0%) | 0 (0.0%) |
| 55 to 59 Years | 0 (0.0%) | 0 (0.0%) |
| 60 to 64 Years | 41 (18.1%) | 40 (21.6%) |
| 65 to 69 Years | 0 (0.0%) | 7 (3.8%) |
| 70 to 74 Years | 20 (8.8%) | 0 (0.0%) |
| 75 to 79 Years | 0 (0.0%) | 0 (0.0%) |
| 80 to 84 Years | 0 (0.0%) | 0 (0.0%) |
| 85 Years and over | 0 (0.0%) | 11 (5.9%) |
| Total | 226 (100.0%) | 185 (100.0%) |
Families and Households in Sandia Park
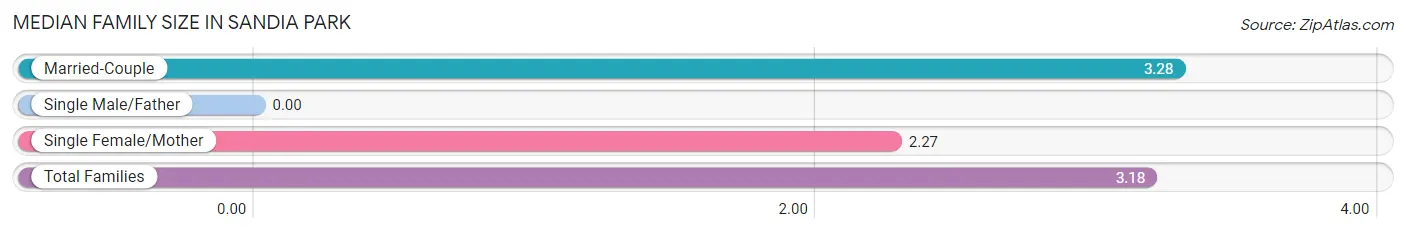
Median Family Size in Sandia Park
| Family Type | # Families | Family Size |
| Married-Couple | 105 (90.5%) | 3.28 |
| Single Male/Father | 0 (0.0%) | - |
| Single Female/Mother | 11 (9.5%) | 2.27 |
| Total Families | 116 (100.0%) | 3.18 |
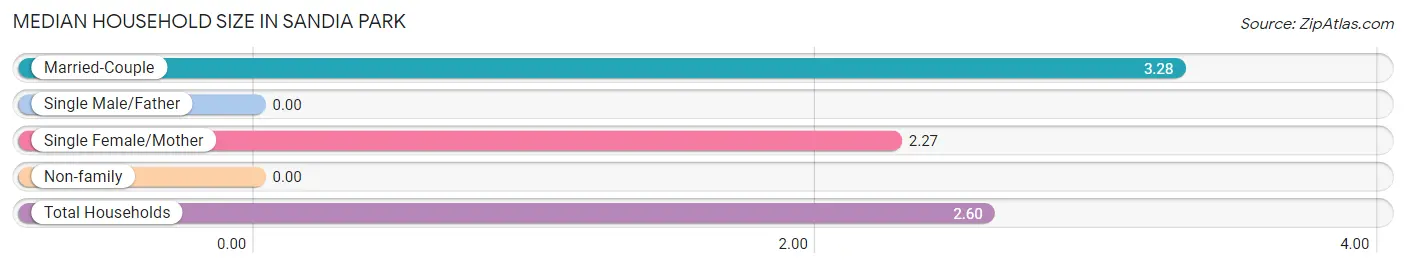
Median Household Size in Sandia Park
| Household Type | # Households | Household Size |
| Married-Couple | 105 (66.5%) | 3.28 |
| Single Male/Father | 0 (0.0%) | - |
| Single Female/Mother | 11 (7.0%) | 2.27 |
| Non-family | 42 (26.6%) | - |
| Total Households | 158 (100.0%) | 2.60 |
Household Size by Marriage Status in Sandia Park
Out of a total of 158 households in Sandia Park, 116 (73.4%) are family households, while 42 (26.6%) are nonfamily households. The most numerous type of family households are 2-person households, comprising 40, and the most common type of nonfamily households are 1-person households, comprising 42.
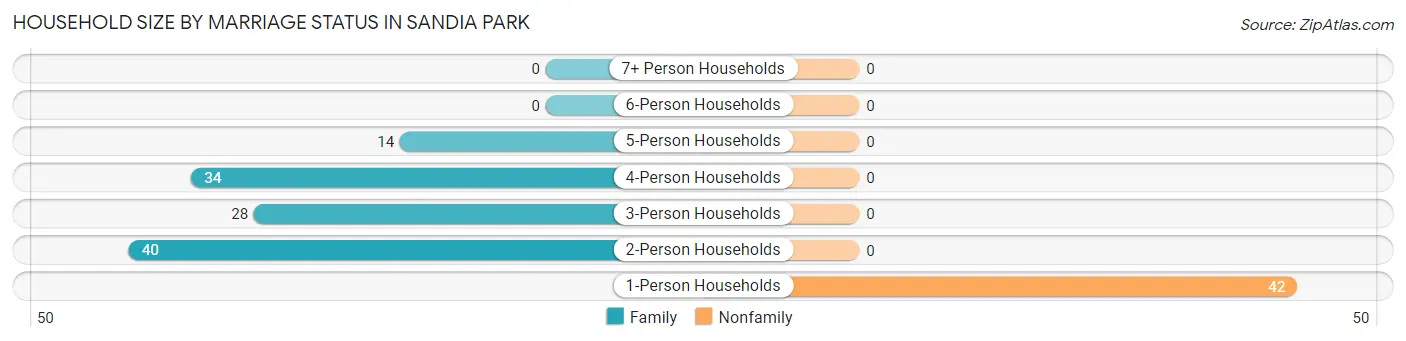
| Household Size | Family Households | Nonfamily Households |
| 1-Person Households | - | 42 (26.6%) |
| 2-Person Households | 40 (25.3%) | 0 (0.0%) |
| 3-Person Households | 28 (17.7%) | 0 (0.0%) |
| 4-Person Households | 34 (21.5%) | 0 (0.0%) |
| 5-Person Households | 14 (8.9%) | 0 (0.0%) |
| 6-Person Households | 0 (0.0%) | 0 (0.0%) |
| 7+ Person Households | 0 (0.0%) | 0 (0.0%) |
| Total | 116 (73.4%) | 42 (26.6%) |
Female Fertility in Sandia Park
Fertility by Age in Sandia Park
| Age Bracket | Women with Births | Births / 1,000 Women |
| 15 to 19 years | 0 (0.0%) | 0.0 |
| 20 to 34 years | 0 (0.0%) | 0.0 |
| 35 to 50 years | 0 (0.0%) | 0.0 |
| Total | 0 (0.0%) | 0.0 |
Fertility by Age by Marriage Status in Sandia Park
| Age Bracket | Married | Unmarried |
| 15 to 19 years | 0 (0.0%) | 0 (0.0%) |
| 20 to 34 years | 0 (0.0%) | 0 (0.0%) |
| 35 to 50 years | 0 (0.0%) | 0 (0.0%) |
| Total | 0 (0.0%) | 0 (0.0%) |
Fertility by Education in Sandia Park
| Educational Attainment | Women with Births | Births / 1,000 Women |
| Less than High School | 0 (0.0%) | 0.0 |
| High School Diploma | 0 (0.0%) | 0.0 |
| College or Associate's Degree | 0 (0.0%) | 0.0 |
| Bachelor's Degree | 0 (0.0%) | 0.0 |
| Graduate Degree | 0 (0.0%) | 0.0 |
| Total | 0 (0.0%) | 0.0 |
Fertility by Education by Marriage Status in Sandia Park
| Educational Attainment | Married | Unmarried |
| Less than High School | 0 (0.0%) | 0 (0.0%) |
| High School Diploma | 0 (0.0%) | 0 (0.0%) |
| College or Associate's Degree | 0 (0.0%) | 0 (0.0%) |
| Bachelor's Degree | 0 (0.0%) | 0 (0.0%) |
| Graduate Degree | 0 (0.0%) | 0 (0.0%) |
| Total | 0 (0.0%) | 0 (0.0%) |
Employment Characteristics in Sandia Park
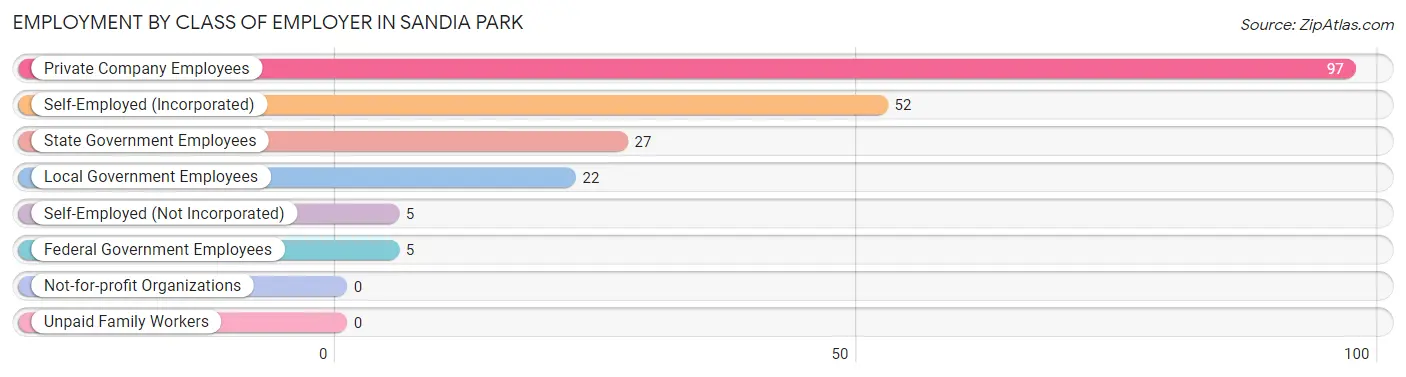
Employment by Class of Employer in Sandia Park
Among the 208 employed individuals in Sandia Park, private company employees (97 | 46.6%), self-employed (incorporated) (52 | 25.0%), and state government employees (27 | 13.0%) make up the most common classes of employment.
| Employer Class | # Employees | % Employees |
| Private Company Employees | 97 | 46.6% |
| Self-Employed (Incorporated) | 52 | 25.0% |
| Self-Employed (Not Incorporated) | 5 | 2.4% |
| Not-for-profit Organizations | 0 | 0.0% |
| Local Government Employees | 22 | 10.6% |
| State Government Employees | 27 | 13.0% |
| Federal Government Employees | 5 | 2.4% |
| Unpaid Family Workers | 0 | 0.0% |
| Total | 208 | 100.0% |
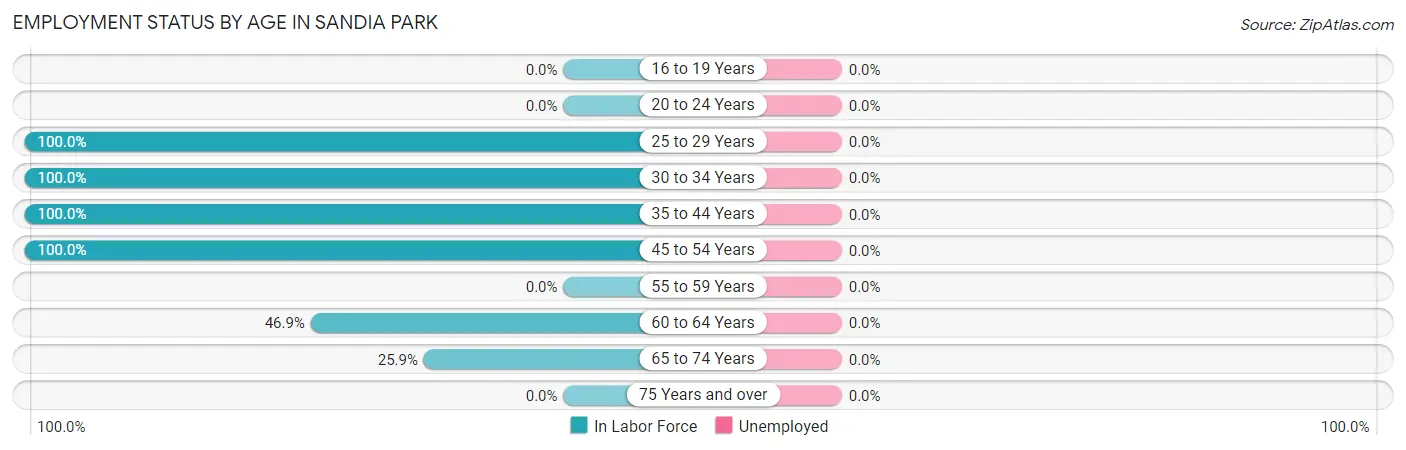
Employment Status by Age in Sandia Park
| Age Bracket | In Labor Force | Unemployed |
| 16 to 19 Years | 0 (0.0%) | 0 (0.0%) |
| 20 to 24 Years | 0 (0.0%) | 0 (0.0%) |
| 25 to 29 Years | 24 (100.0%) | 0 (0.0%) |
| 30 to 34 Years | 45 (100.0%) | 0 (0.0%) |
| 35 to 44 Years | 56 (100.0%) | 0 (0.0%) |
| 45 to 54 Years | 61 (100.0%) | 0 (0.0%) |
| 55 to 59 Years | 0 (0.0%) | 0 (0.0%) |
| 60 to 64 Years | 38 (46.9%) | 0 (0.0%) |
| 65 to 74 Years | 7 (25.9%) | 0 (0.0%) |
| 75 Years and over | 0 (0.0%) | 0 (0.0%) |
| Total | 231 (73.3%) | 0 (0.0%) |
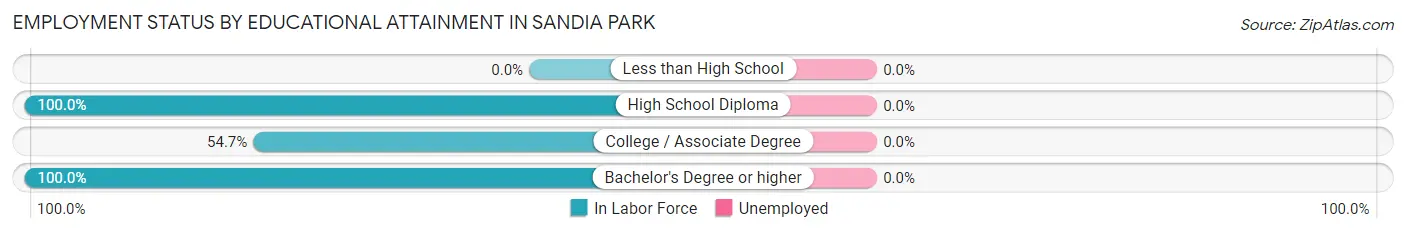
Employment Status by Educational Attainment in Sandia Park
| Educational Attainment | In Labor Force | Unemployed |
| Less than High School | 0 (0.0%) | 0 (0.0%) |
| High School Diploma | 23 (100.0%) | 0 (0.0%) |
| College / Associate Degree | 52 (54.7%) | 0 (0.0%) |
| Bachelor's Degree or higher | 149 (100.0%) | 0 (0.0%) |
| Total | 224 (83.9%) | 0 (0.0%) |
Employment Occupations by Sex in Sandia Park
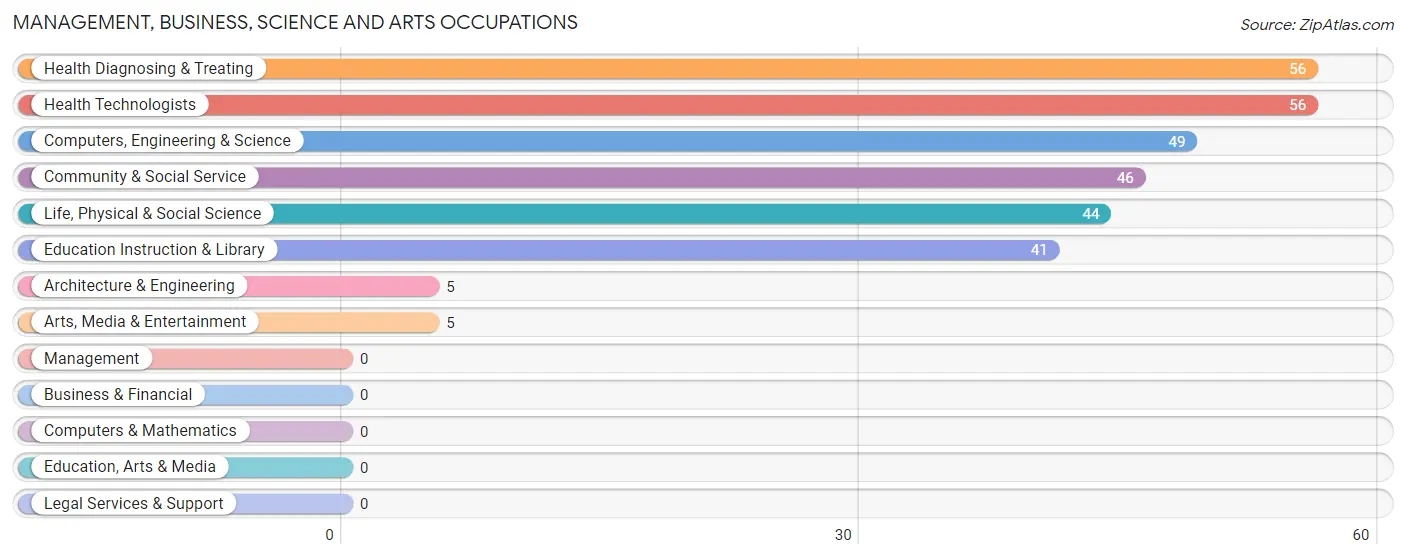
Management, Business, Science and Arts Occupations
The most common Management, Business, Science and Arts occupations in Sandia Park are Health Diagnosing & Treating (56 | 24.2%), Health Technologists (56 | 24.2%), Computers, Engineering & Science (49 | 21.2%), Community & Social Service (46 | 19.9%), and Life, Physical & Social Science (44 | 19.1%).
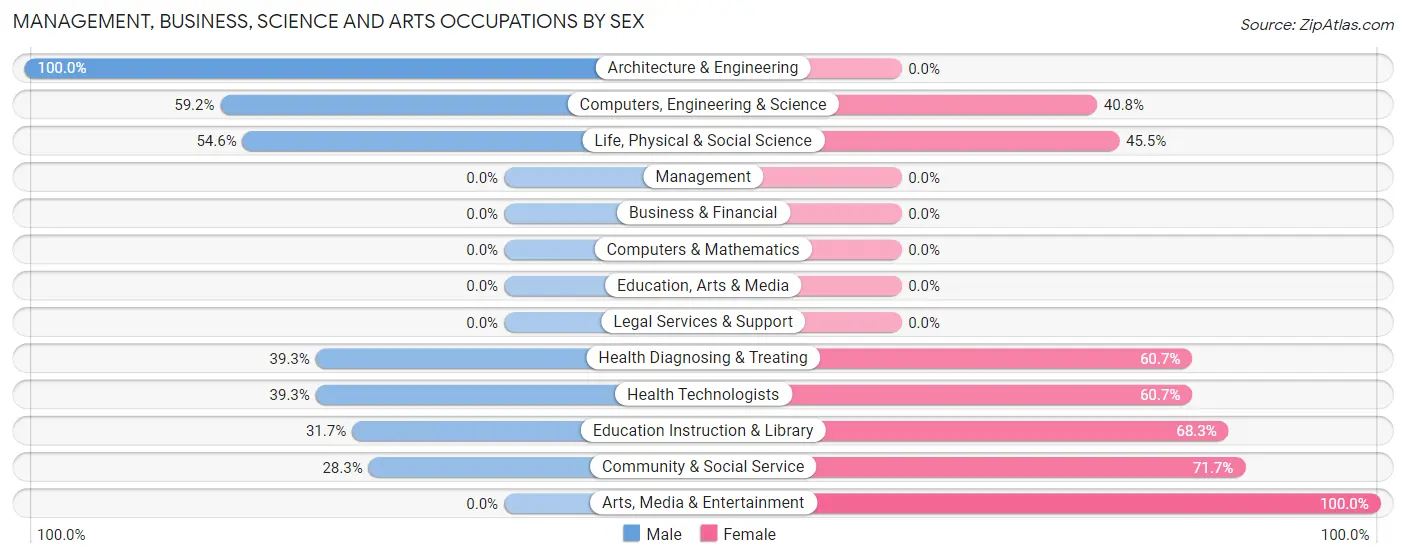
Management, Business, Science and Arts Occupations by Sex
Within the Management, Business, Science and Arts occupations in Sandia Park, the most male-oriented occupations are Architecture & Engineering (100.0%), Computers, Engineering & Science (59.2%), and Life, Physical & Social Science (54.5%), while the most female-oriented occupations are Arts, Media & Entertainment (100.0%), Community & Social Service (71.7%), and Education Instruction & Library (68.3%).
| Occupation | Male | Female |
| Management | 0 (0.0%) | 0 (0.0%) |
| Business & Financial | 0 (0.0%) | 0 (0.0%) |
| Computers, Engineering & Science | 29 (59.2%) | 20 (40.8%) |
| Computers & Mathematics | 0 (0.0%) | 0 (0.0%) |
| Architecture & Engineering | 5 (100.0%) | 0 (0.0%) |
| Life, Physical & Social Science | 24 (54.5%) | 20 (45.5%) |
| Community & Social Service | 13 (28.3%) | 33 (71.7%) |
| Education, Arts & Media | 0 (0.0%) | 0 (0.0%) |
| Legal Services & Support | 0 (0.0%) | 0 (0.0%) |
| Education Instruction & Library | 13 (31.7%) | 28 (68.3%) |
| Arts, Media & Entertainment | 0 (0.0%) | 5 (100.0%) |
| Health Diagnosing & Treating | 22 (39.3%) | 34 (60.7%) |
| Health Technologists | 22 (39.3%) | 34 (60.7%) |
| Total (Category) | 64 (42.4%) | 87 (57.6%) |
| Total (Overall) | 104 (45.0%) | 127 (55.0%) |
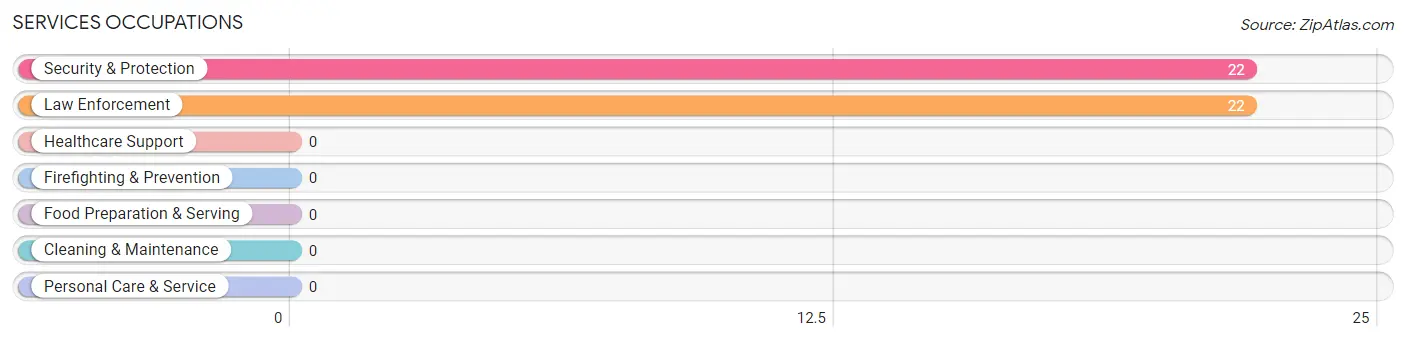
Services Occupations
The most common Services occupations in Sandia Park are Security & Protection (22 | 9.5%), and Law Enforcement (22 | 9.5%).
Services Occupations by Sex
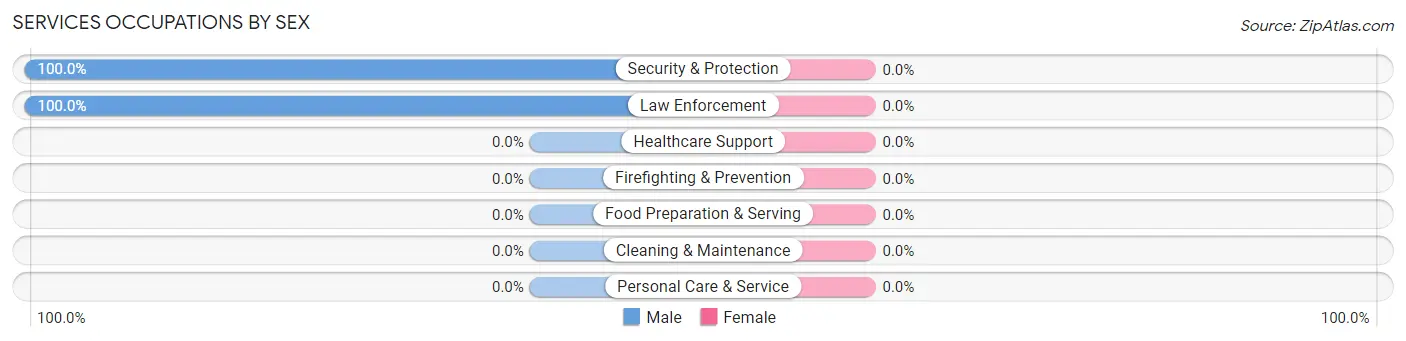
| Occupation | Male | Female |
| Healthcare Support | 0 (0.0%) | 0 (0.0%) |
| Security & Protection | 22 (100.0%) | 0 (0.0%) |
| Firefighting & Prevention | 0 (0.0%) | 0 (0.0%) |
| Law Enforcement | 22 (100.0%) | 0 (0.0%) |
| Food Preparation & Serving | 0 (0.0%) | 0 (0.0%) |
| Cleaning & Maintenance | 0 (0.0%) | 0 (0.0%) |
| Personal Care & Service | 0 (0.0%) | 0 (0.0%) |
| Total (Category) | 22 (100.0%) | 0 (0.0%) |
| Total (Overall) | 104 (45.0%) | 127 (55.0%) |
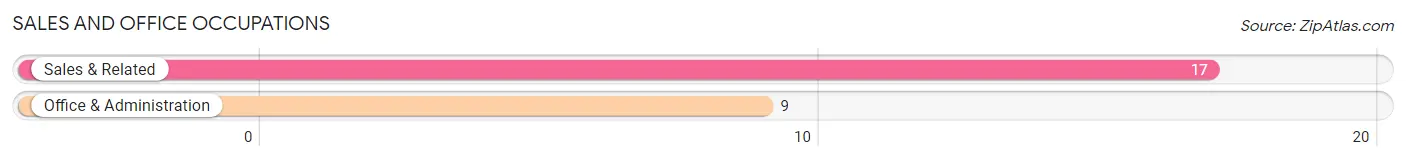
Sales and Office Occupations
The most common Sales and Office occupations in Sandia Park are Sales & Related (17 | 7.4%), and Office & Administration (9 | 3.9%).
Sales and Office Occupations by Sex
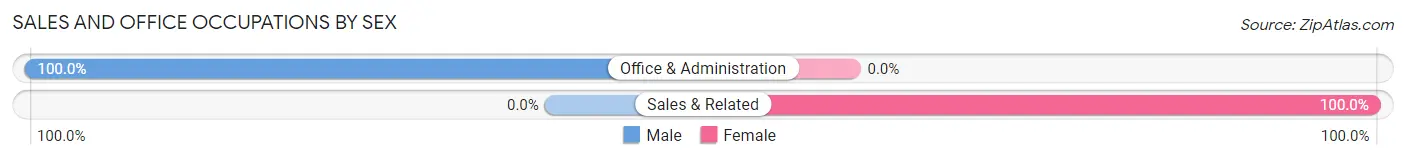
| Occupation | Male | Female |
| Sales & Related | 0 (0.0%) | 17 (100.0%) |
| Office & Administration | 9 (100.0%) | 0 (0.0%) |
| Total (Category) | 9 (34.6%) | 17 (65.4%) |
| Total (Overall) | 104 (45.0%) | 127 (55.0%) |
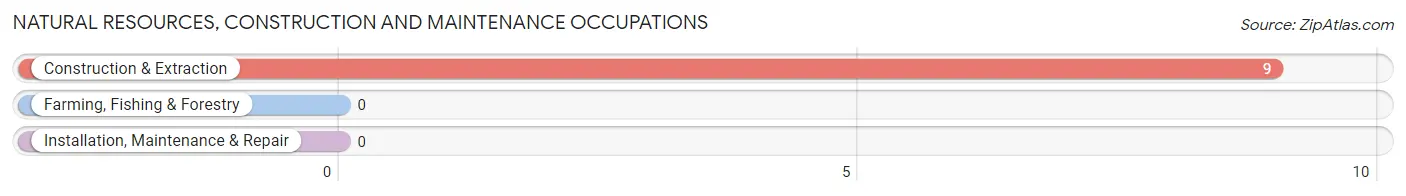
Natural Resources, Construction and Maintenance Occupations
The most common Natural Resources, Construction and Maintenance occupations in Sandia Park are , and Construction & Extraction (9 | 3.9%).
Natural Resources, Construction and Maintenance Occupations by Sex
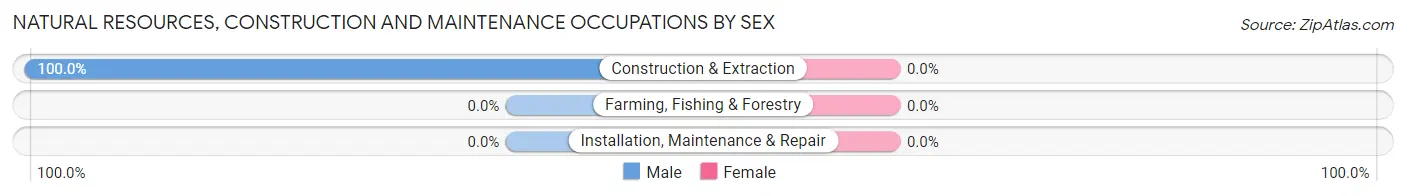
| Occupation | Male | Female |
| Farming, Fishing & Forestry | 0 (0.0%) | 0 (0.0%) |
| Construction & Extraction | 9 (100.0%) | 0 (0.0%) |
| Installation, Maintenance & Repair | 0 (0.0%) | 0 (0.0%) |
| Total (Category) | 9 (100.0%) | 0 (0.0%) |
| Total (Overall) | 104 (45.0%) | 127 (55.0%) |
Production, Transportation and Moving Occupations
The most common Production, Transportation and Moving occupations in Sandia Park are , and Transportation (23 | 10.0%).
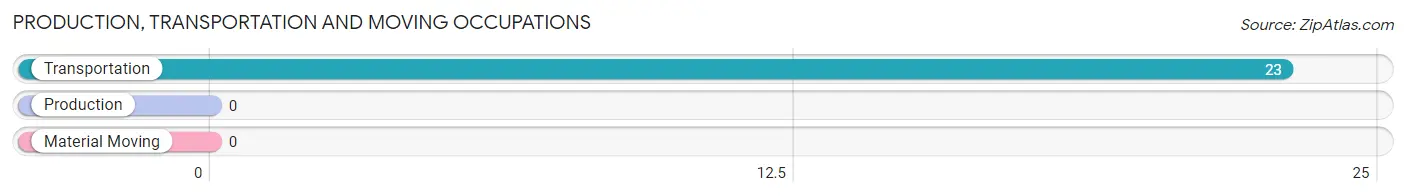
Production, Transportation and Moving Occupations by Sex
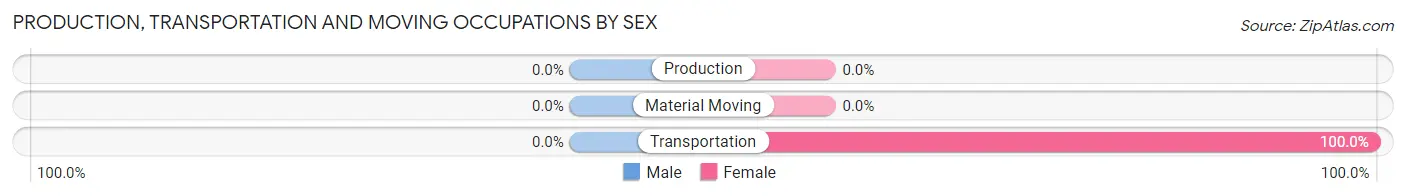
| Occupation | Male | Female |
| Production | 0 (0.0%) | 0 (0.0%) |
| Transportation | 0 (0.0%) | 23 (100.0%) |
| Material Moving | 0 (0.0%) | 0 (0.0%) |
| Total (Category) | 0 (0.0%) | 23 (100.0%) |
| Total (Overall) | 104 (45.0%) | 127 (55.0%) |
Employment Industries by Sex in Sandia Park
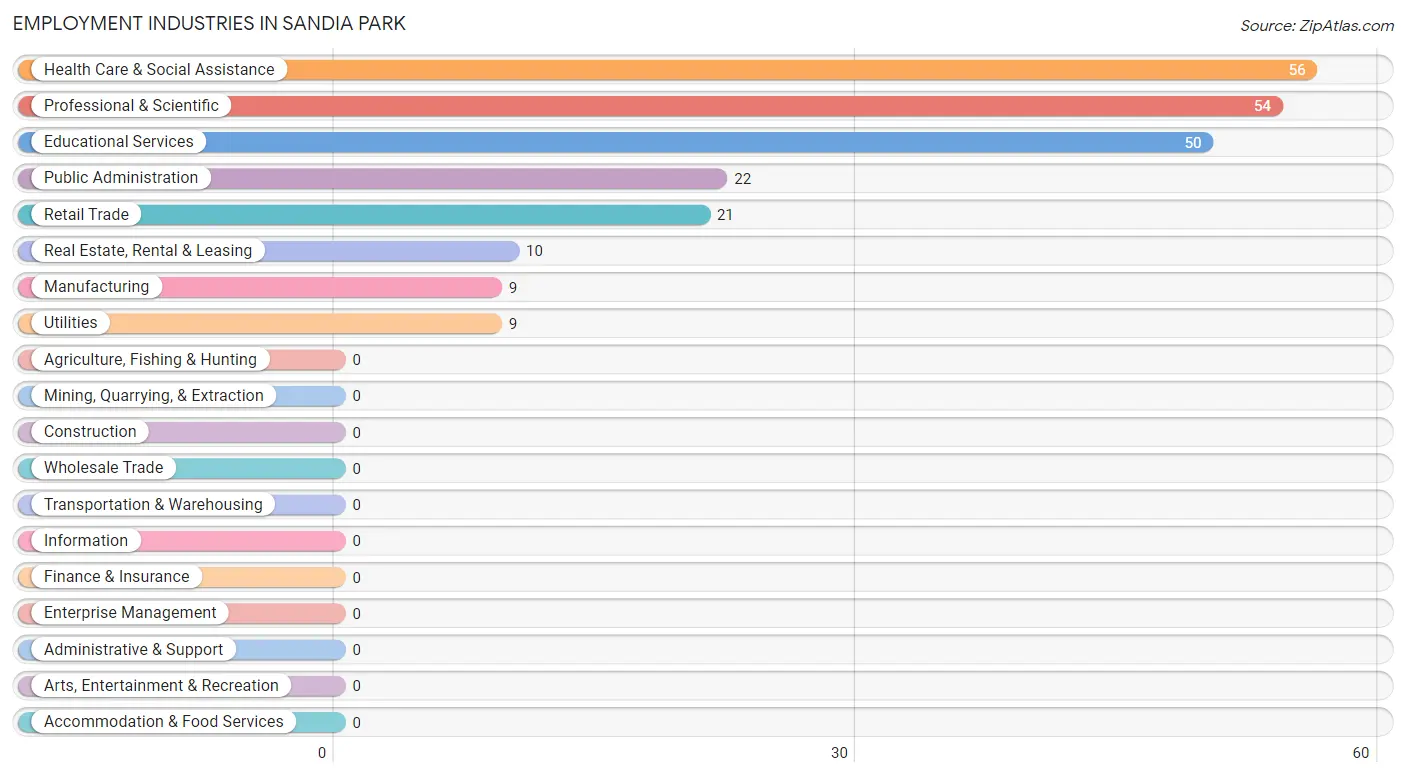
Employment Industries in Sandia Park
The major employment industries in Sandia Park include Health Care & Social Assistance (56 | 24.2%), Professional & Scientific (54 | 23.4%), Educational Services (50 | 21.6%), Public Administration (22 | 9.5%), and Retail Trade (21 | 9.1%).
Employment Industries by Sex in Sandia Park
The Sandia Park industries that see more men than women are Manufacturing (100.0%), Utilities (100.0%), and Public Administration (100.0%), whereas the industries that tend to have a higher number of women are Retail Trade (100.0%), Real Estate, Rental & Leasing (100.0%), and Educational Services (74.0%).
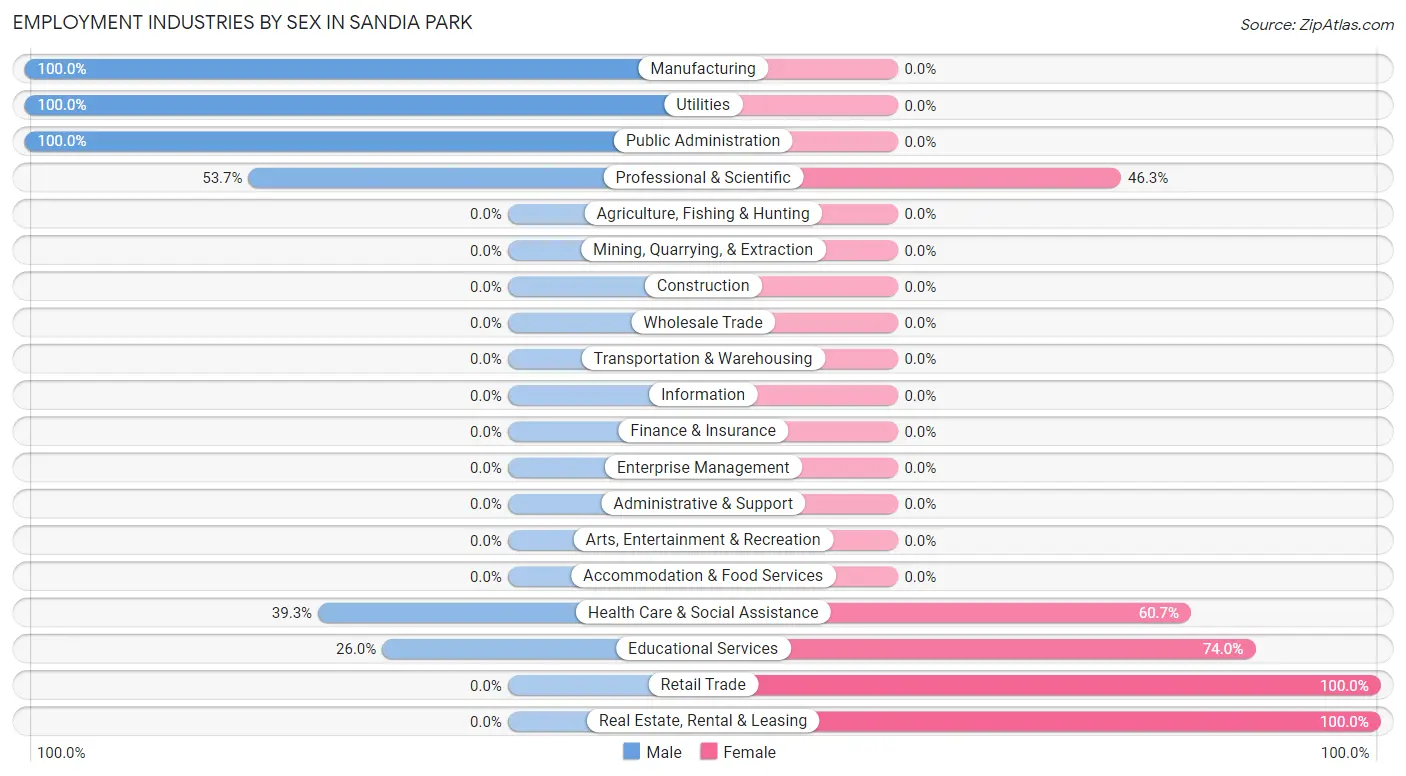
| Industry | Male | Female |
| Agriculture, Fishing & Hunting | 0 (0.0%) | 0 (0.0%) |
| Mining, Quarrying, & Extraction | 0 (0.0%) | 0 (0.0%) |
| Construction | 0 (0.0%) | 0 (0.0%) |
| Manufacturing | 9 (100.0%) | 0 (0.0%) |
| Wholesale Trade | 0 (0.0%) | 0 (0.0%) |
| Retail Trade | 0 (0.0%) | 21 (100.0%) |
| Transportation & Warehousing | 0 (0.0%) | 0 (0.0%) |
| Utilities | 9 (100.0%) | 0 (0.0%) |
| Information | 0 (0.0%) | 0 (0.0%) |
| Finance & Insurance | 0 (0.0%) | 0 (0.0%) |
| Real Estate, Rental & Leasing | 0 (0.0%) | 10 (100.0%) |
| Professional & Scientific | 29 (53.7%) | 25 (46.3%) |
| Enterprise Management | 0 (0.0%) | 0 (0.0%) |
| Administrative & Support | 0 (0.0%) | 0 (0.0%) |
| Educational Services | 13 (26.0%) | 37 (74.0%) |
| Health Care & Social Assistance | 22 (39.3%) | 34 (60.7%) |
| Arts, Entertainment & Recreation | 0 (0.0%) | 0 (0.0%) |
| Accommodation & Food Services | 0 (0.0%) | 0 (0.0%) |
| Public Administration | 22 (100.0%) | 0 (0.0%) |
| Total | 104 (45.0%) | 127 (55.0%) |
Education in Sandia Park
School Enrollment in Sandia Park
The most common levels of schooling among the 126 students in Sandia Park are elementary school (53 | 42.1%), middle school (26 | 20.6%), and graduate / professional (25 | 19.8%).
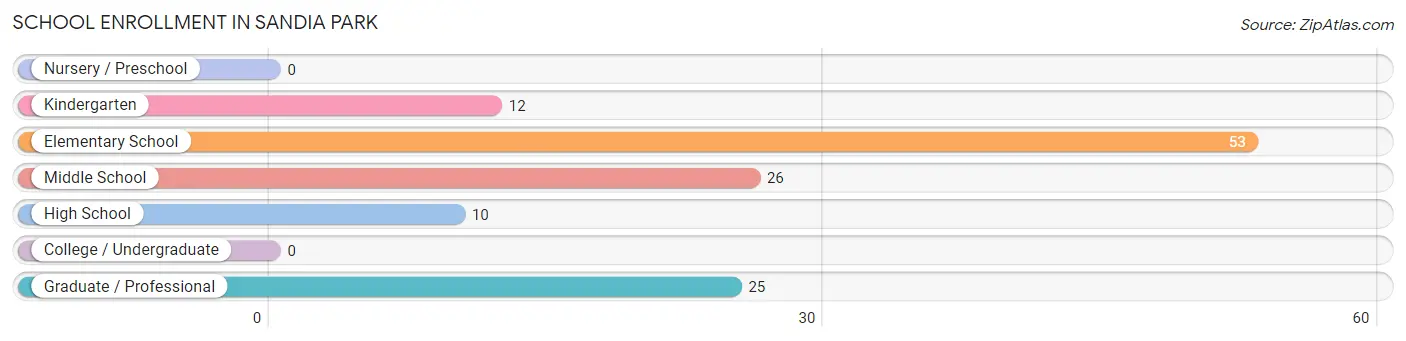
| School Level | # Students | % Students |
| Nursery / Preschool | 0 | 0.0% |
| Kindergarten | 12 | 9.5% |
| Elementary School | 53 | 42.1% |
| Middle School | 26 | 20.6% |
| High School | 10 | 7.9% |
| College / Undergraduate | 0 | 0.0% |
| Graduate / Professional | 25 | 19.8% |
| Total | 126 | 100.0% |
School Enrollment by Age by Funding Source in Sandia Park
Out of a total of 126 students who are enrolled in schools in Sandia Park, 9 (7.1%) attend a private institution, while the remaining 117 (92.9%) are enrolled in public schools. The age group of 5 to 9 year old has the highest likelihood of being enrolled in private schools, with 9 (13.9% in the age bracket) enrolled. Conversely, the age group of 10 to 14 year olds has the lowest likelihood of being enrolled in a private school, with 26 (100.0% in the age bracket) attending a public institution.
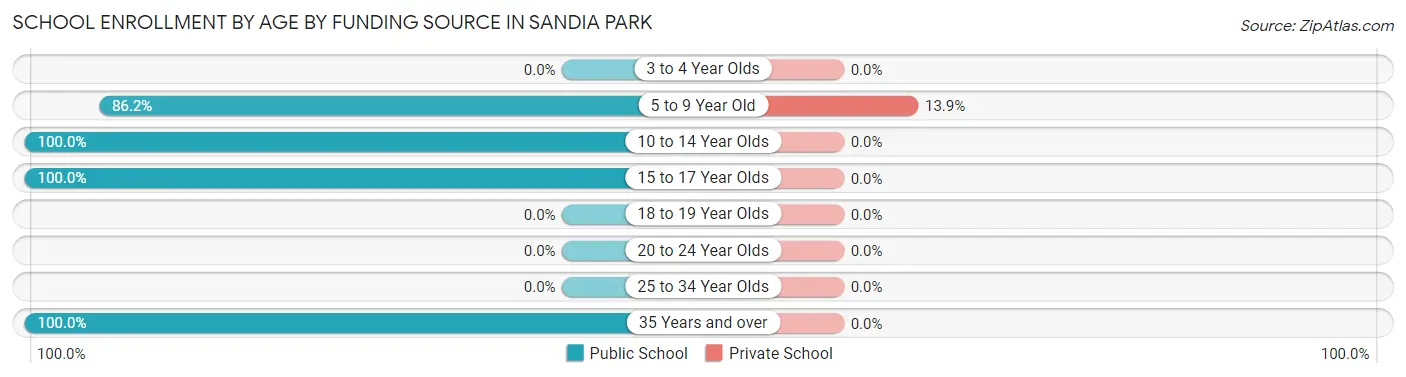
| Age Bracket | Public School | Private School |
| 3 to 4 Year Olds | 0 (0.0%) | 0 (0.0%) |
| 5 to 9 Year Old | 56 (86.2%) | 9 (13.9%) |
| 10 to 14 Year Olds | 26 (100.0%) | 0 (0.0%) |
| 15 to 17 Year Olds | 10 (100.0%) | 0 (0.0%) |
| 18 to 19 Year Olds | 0 (0.0%) | 0 (0.0%) |
| 20 to 24 Year Olds | 0 (0.0%) | 0 (0.0%) |
| 25 to 34 Year Olds | 0 (0.0%) | 0 (0.0%) |
| 35 Years and over | 25 (100.0%) | 0 (0.0%) |
| Total | 117 (92.9%) | 9 (7.1%) |
Educational Attainment by Field of Study in Sandia Park
Science & technology (39 | 19.0%), engineering (27 | 13.2%), social sciences (23 | 11.2%), computers & mathematics (22 | 10.7%), and bio, nature & agricultural (22 | 10.7%) are the most common fields of study among 205 individuals in Sandia Park who have obtained a bachelor's degree or higher.
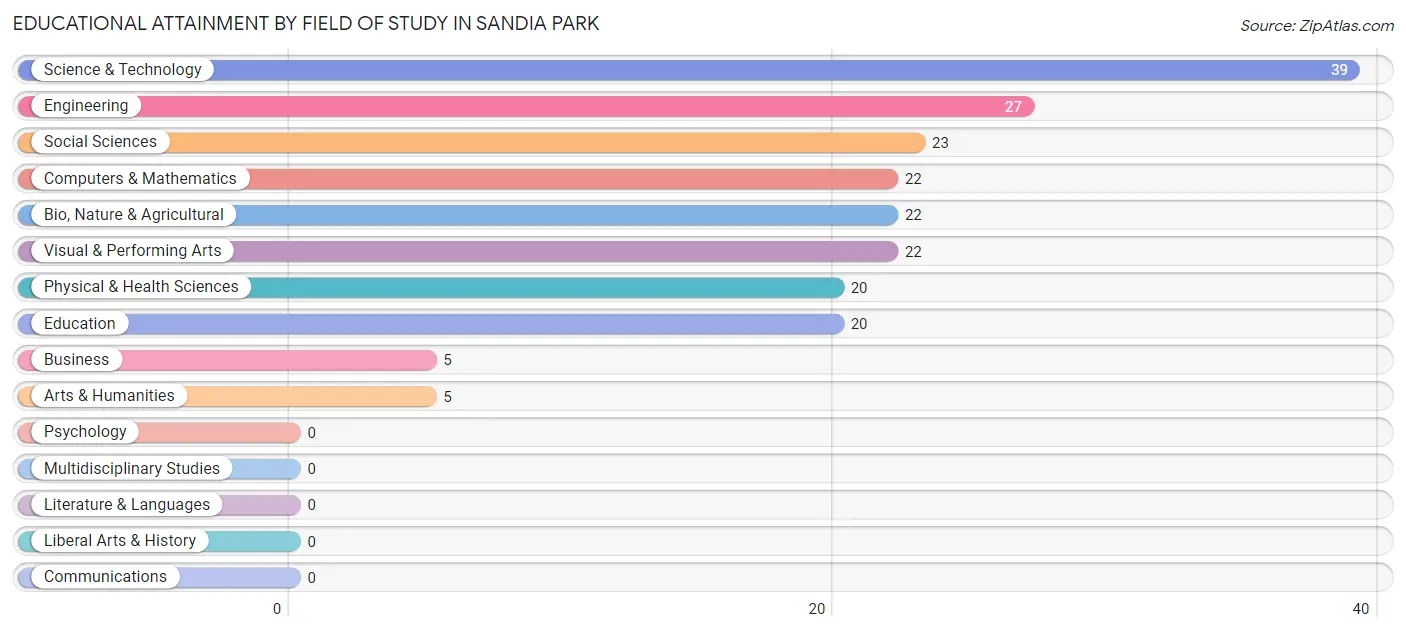
| Field of Study | # Graduates | % Graduates |
| Computers & Mathematics | 22 | 10.7% |
| Bio, Nature & Agricultural | 22 | 10.7% |
| Physical & Health Sciences | 20 | 9.8% |
| Psychology | 0 | 0.0% |
| Social Sciences | 23 | 11.2% |
| Engineering | 27 | 13.2% |
| Multidisciplinary Studies | 0 | 0.0% |
| Science & Technology | 39 | 19.0% |
| Business | 5 | 2.4% |
| Education | 20 | 9.8% |
| Literature & Languages | 0 | 0.0% |
| Liberal Arts & History | 0 | 0.0% |
| Visual & Performing Arts | 22 | 10.7% |
| Communications | 0 | 0.0% |
| Arts & Humanities | 5 | 2.4% |
| Total | 205 | 100.0% |
Transportation & Commute in Sandia Park
Vehicle Availability by Sex in Sandia Park
The most prevalent vehicle ownership categories in Sandia Park are males with 3 vehicles (36, accounting for 34.6%) and females with 3 vehicles (39, making up 34.6%).
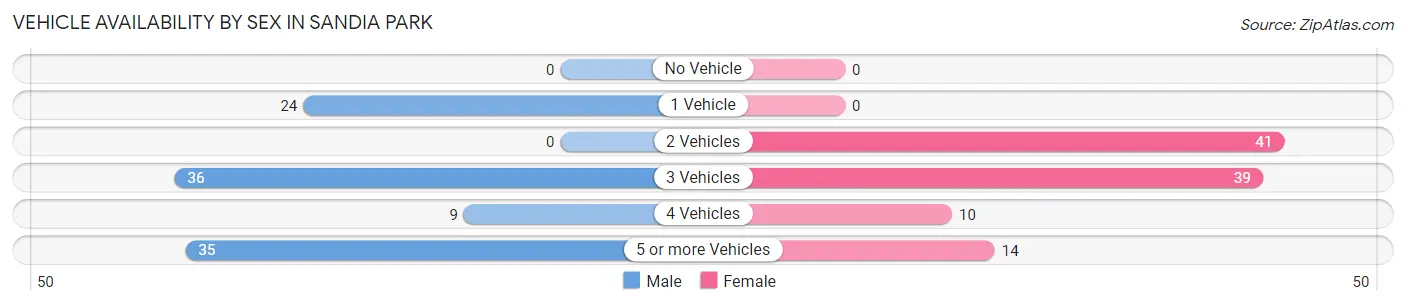
| Vehicles Available | Male | Female |
| No Vehicle | 0 (0.0%) | 0 (0.0%) |
| 1 Vehicle | 24 (23.1%) | 0 (0.0%) |
| 2 Vehicles | 0 (0.0%) | 41 (39.4%) |
| 3 Vehicles | 36 (34.6%) | 39 (37.5%) |
| 4 Vehicles | 9 (8.6%) | 10 (9.6%) |
| 5 or more Vehicles | 35 (33.7%) | 14 (13.5%) |
| Total | 104 (100.0%) | 104 (100.0%) |
Commute Time in Sandia Park
The most frequently occuring commute durations in Sandia Park are 30 to 34 minutes (124 commuters, 67.8%), 35 to 39 minutes (36 commuters, 19.7%), and 25 to 29 minutes (14 commuters, 7.6%).
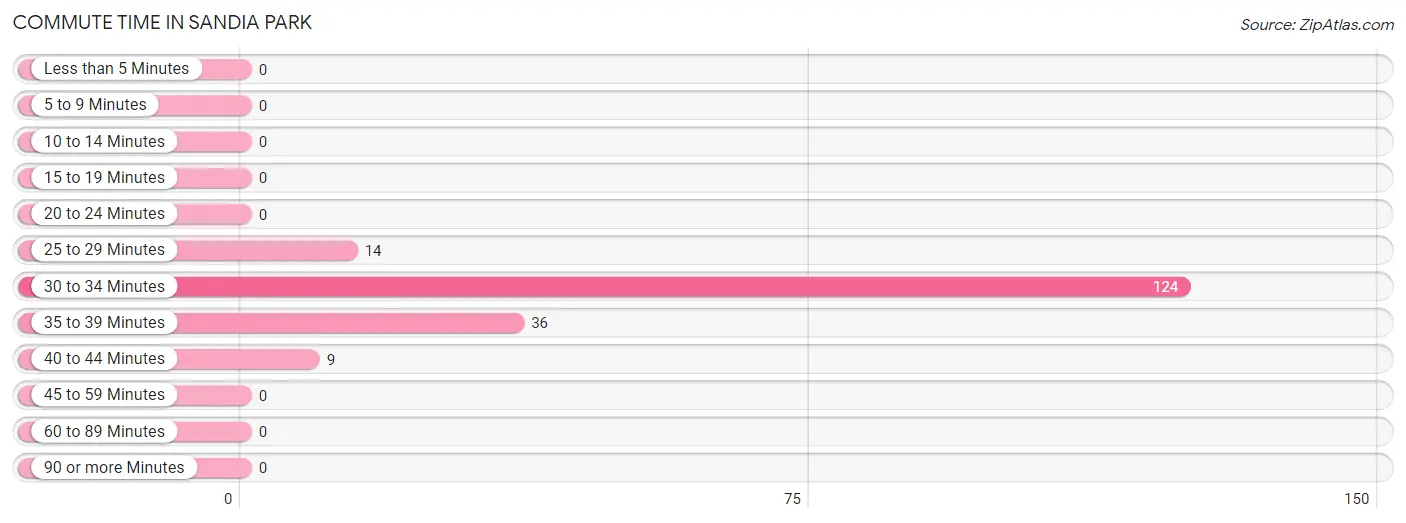
| Commute Time | # Commuters | % Commuters |
| Less than 5 Minutes | 0 | 0.0% |
| 5 to 9 Minutes | 0 | 0.0% |
| 10 to 14 Minutes | 0 | 0.0% |
| 15 to 19 Minutes | 0 | 0.0% |
| 20 to 24 Minutes | 0 | 0.0% |
| 25 to 29 Minutes | 14 | 7.6% |
| 30 to 34 Minutes | 124 | 67.8% |
| 35 to 39 Minutes | 36 | 19.7% |
| 40 to 44 Minutes | 9 | 4.9% |
| 45 to 59 Minutes | 0 | 0.0% |
| 60 to 89 Minutes | 0 | 0.0% |
| 90 or more Minutes | 0 | 0.0% |
Commute Time by Sex in Sandia Park
The most common commute times in Sandia Park are 30 to 34 minutes (68 commuters, 65.4%) for males and 30 to 34 minutes (56 commuters, 70.9%) for females.
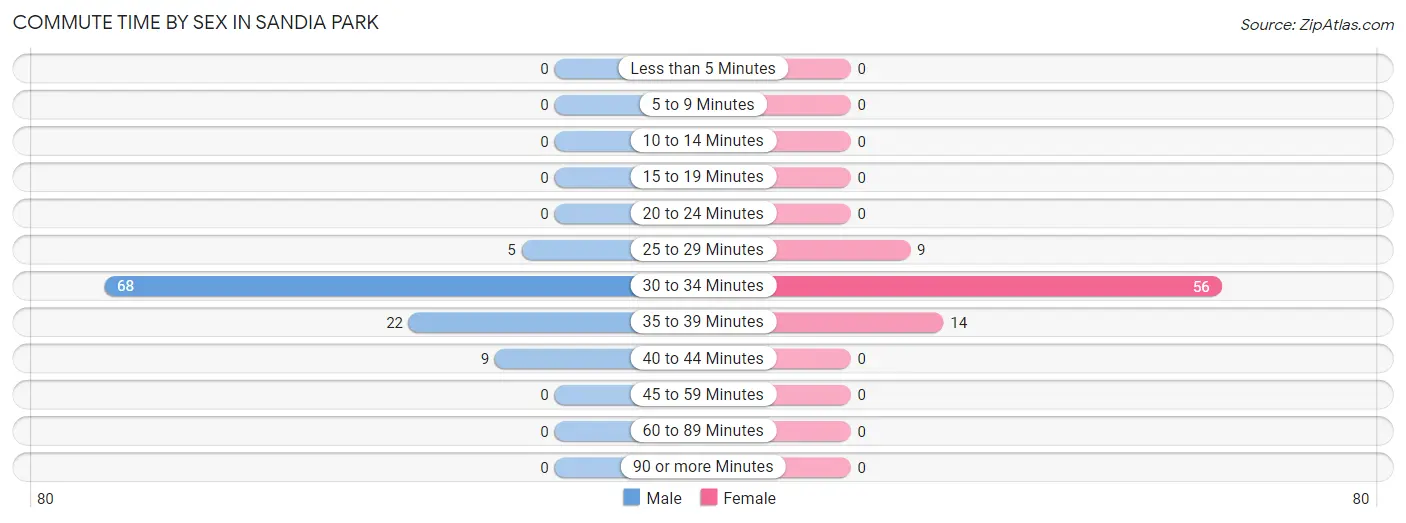
| Commute Time | Male | Female |
| Less than 5 Minutes | 0 (0.0%) | 0 (0.0%) |
| 5 to 9 Minutes | 0 (0.0%) | 0 (0.0%) |
| 10 to 14 Minutes | 0 (0.0%) | 0 (0.0%) |
| 15 to 19 Minutes | 0 (0.0%) | 0 (0.0%) |
| 20 to 24 Minutes | 0 (0.0%) | 0 (0.0%) |
| 25 to 29 Minutes | 5 (4.8%) | 9 (11.4%) |
| 30 to 34 Minutes | 68 (65.4%) | 56 (70.9%) |
| 35 to 39 Minutes | 22 (21.1%) | 14 (17.7%) |
| 40 to 44 Minutes | 9 (8.6%) | 0 (0.0%) |
| 45 to 59 Minutes | 0 (0.0%) | 0 (0.0%) |
| 60 to 89 Minutes | 0 (0.0%) | 0 (0.0%) |
| 90 or more Minutes | 0 (0.0%) | 0 (0.0%) |
Time of Departure to Work by Sex in Sandia Park
The most frequent times of departure to work in Sandia Park are 6:30 AM to 6:59 AM (29, 27.9%) for males and 8:00 AM to 8:29 AM (28, 35.4%) for females.
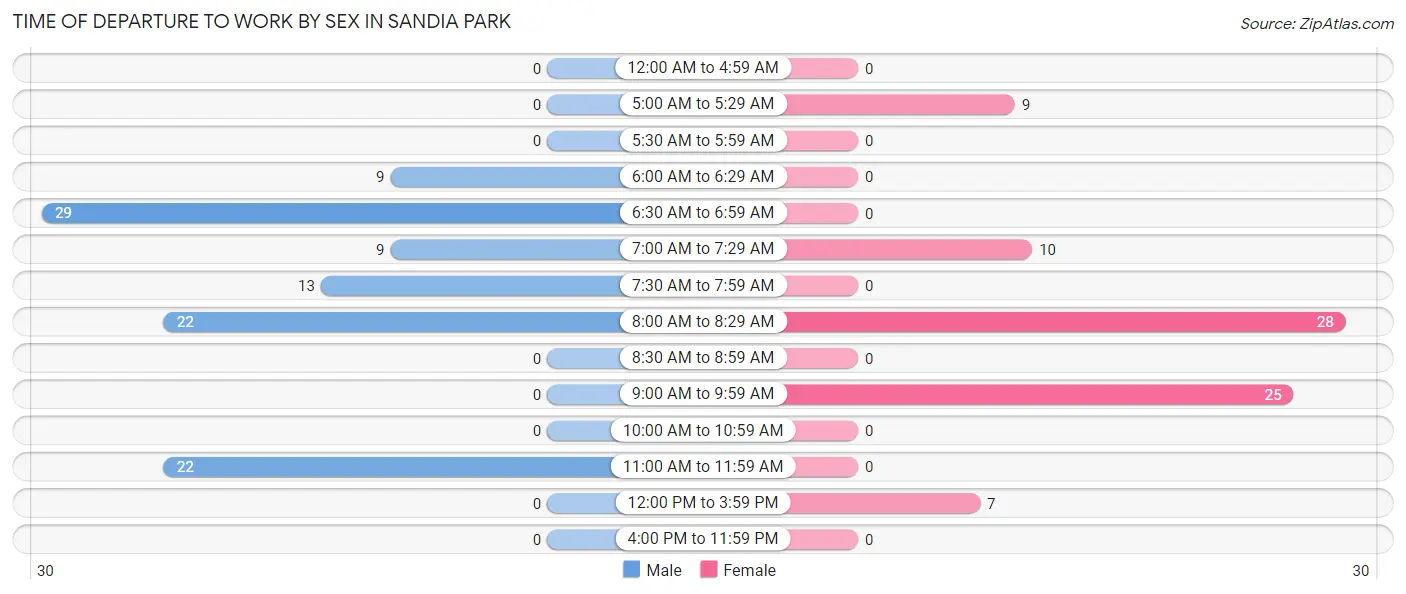
| Time of Departure | Male | Female |
| 12:00 AM to 4:59 AM | 0 (0.0%) | 0 (0.0%) |
| 5:00 AM to 5:29 AM | 0 (0.0%) | 9 (11.4%) |
| 5:30 AM to 5:59 AM | 0 (0.0%) | 0 (0.0%) |
| 6:00 AM to 6:29 AM | 9 (8.6%) | 0 (0.0%) |
| 6:30 AM to 6:59 AM | 29 (27.9%) | 0 (0.0%) |
| 7:00 AM to 7:29 AM | 9 (8.6%) | 10 (12.7%) |
| 7:30 AM to 7:59 AM | 13 (12.5%) | 0 (0.0%) |
| 8:00 AM to 8:29 AM | 22 (21.1%) | 28 (35.4%) |
| 8:30 AM to 8:59 AM | 0 (0.0%) | 0 (0.0%) |
| 9:00 AM to 9:59 AM | 0 (0.0%) | 25 (31.7%) |
| 10:00 AM to 10:59 AM | 0 (0.0%) | 0 (0.0%) |
| 11:00 AM to 11:59 AM | 22 (21.1%) | 0 (0.0%) |
| 12:00 PM to 3:59 PM | 0 (0.0%) | 7 (8.9%) |
| 4:00 PM to 11:59 PM | 0 (0.0%) | 0 (0.0%) |
| Total | 104 (100.0%) | 79 (100.0%) |
Housing Occupancy in Sandia Park
Occupancy by Ownership in Sandia Park
Of the total 158 dwellings in Sandia Park, owner-occupied units account for 134 (84.8%), while renter-occupied units make up 24 (15.2%).
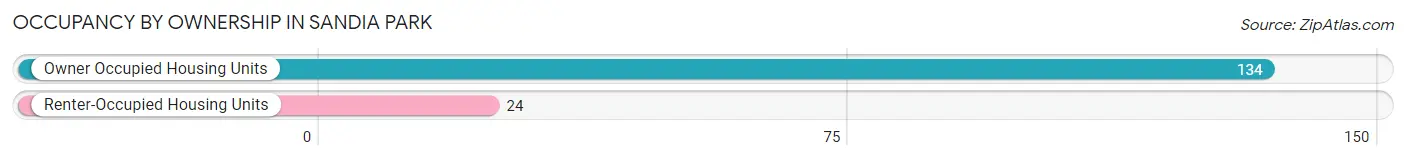
| Occupancy | # Housing Units | % Housing Units |
| Owner Occupied Housing Units | 134 | 84.8% |
| Renter-Occupied Housing Units | 24 | 15.2% |
| Total Occupied Housing Units | 158 | 100.0% |
Occupancy by Household Size in Sandia Park
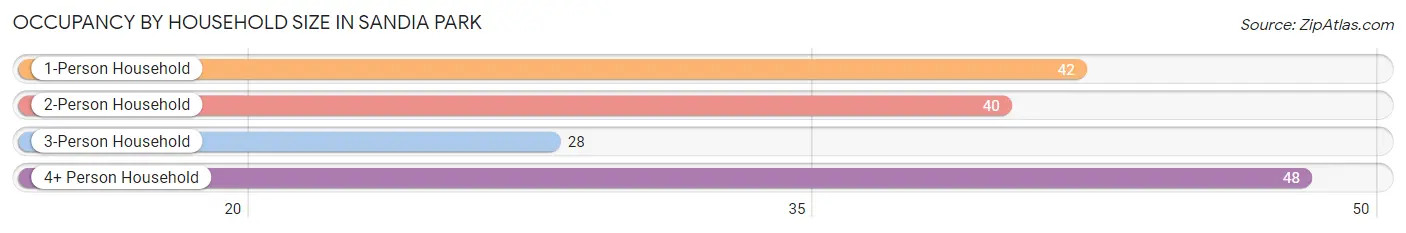
| Household Size | # Housing Units | % Housing Units |
| 1-Person Household | 42 | 26.6% |
| 2-Person Household | 40 | 25.3% |
| 3-Person Household | 28 | 17.7% |
| 4+ Person Household | 48 | 30.4% |
| Total Housing Units | 158 | 100.0% |
Occupancy by Ownership by Household Size in Sandia Park
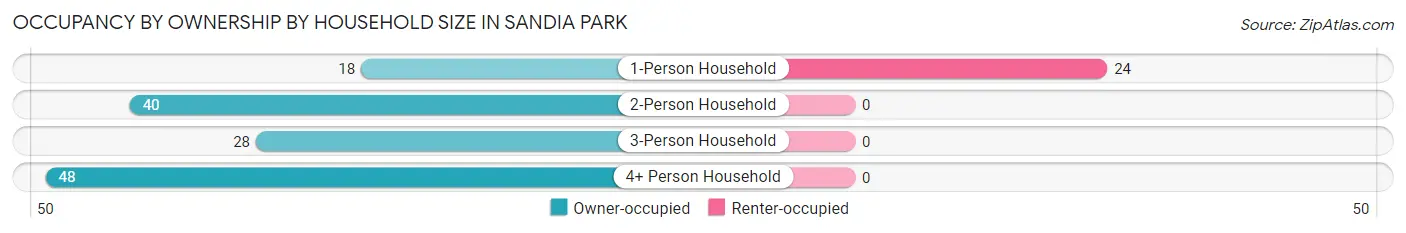
| Household Size | Owner-occupied | Renter-occupied |
| 1-Person Household | 18 (42.9%) | 24 (57.1%) |
| 2-Person Household | 40 (100.0%) | 0 (0.0%) |
| 3-Person Household | 28 (100.0%) | 0 (0.0%) |
| 4+ Person Household | 48 (100.0%) | 0 (0.0%) |
| Total Housing Units | 134 (84.8%) | 24 (15.2%) |
Occupancy by Educational Attainment in Sandia Park
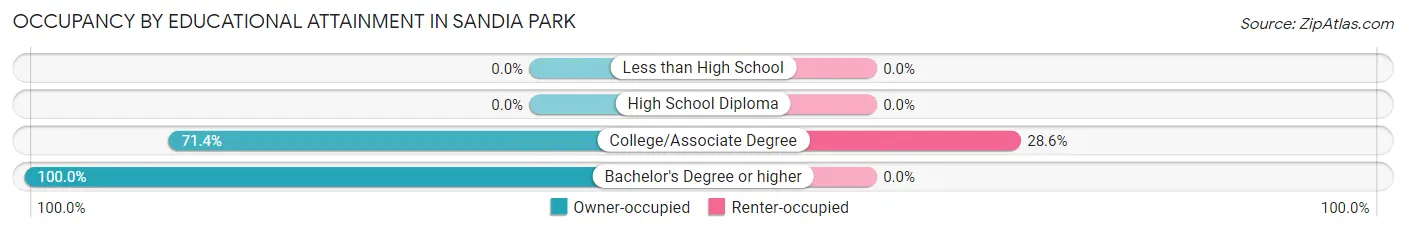
| Household Size | Owner-occupied | Renter-occupied |
| Less than High School | 0 (0.0%) | 0 (0.0%) |
| High School Diploma | 0 (0.0%) | 0 (0.0%) |
| College/Associate Degree | 60 (71.4%) | 24 (28.6%) |
| Bachelor's Degree or higher | 74 (100.0%) | 0 (0.0%) |
Occupancy by Age of Householder in Sandia Park
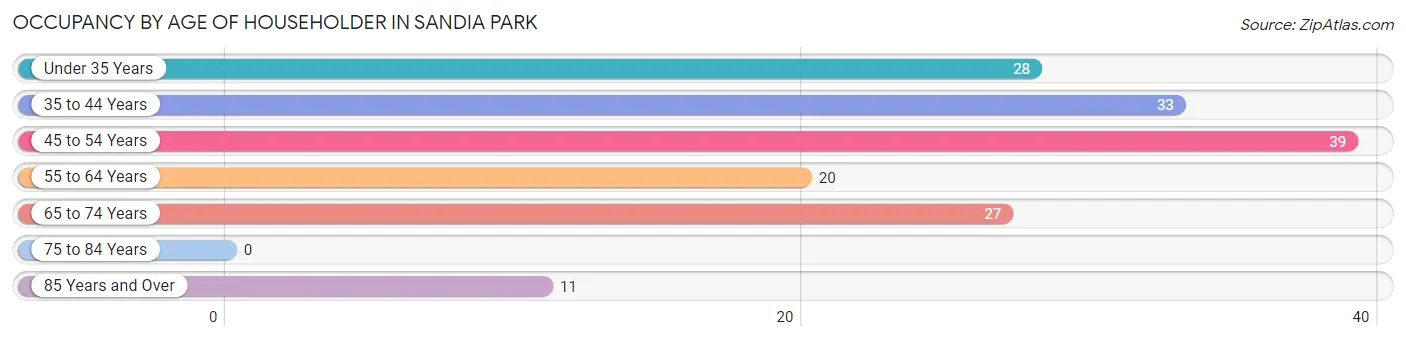
| Age Bracket | # Households | % Households |
| Under 35 Years | 28 | 17.7% |
| 35 to 44 Years | 33 | 20.9% |
| 45 to 54 Years | 39 | 24.7% |
| 55 to 64 Years | 20 | 12.7% |
| 65 to 74 Years | 27 | 17.1% |
| 75 to 84 Years | 0 | 0.0% |
| 85 Years and Over | 11 | 7.0% |
| Total | 158 | 100.0% |
Housing Finances in Sandia Park
Median Income by Occupancy in Sandia Park
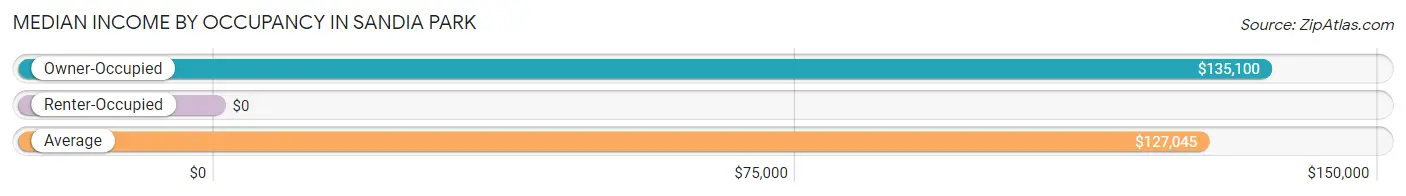
| Occupancy Type | # Households | Median Income |
| Owner-Occupied | 134 (84.8%) | $135,100 |
| Renter-Occupied | 24 (15.2%) | $0 |
| Average | 158 (100.0%) | $127,045 |
Occupancy by Householder Income Bracket in Sandia Park
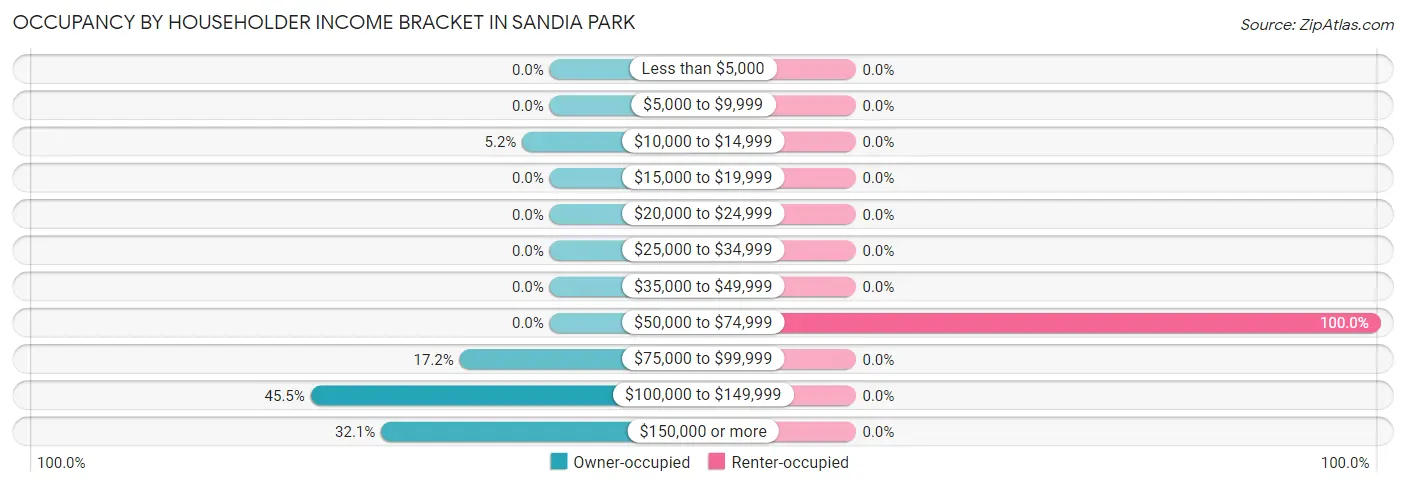
| Income Bracket | Owner-occupied | Renter-occupied |
| Less than $5,000 | 0 (0.0%) | 0 (0.0%) |
| $5,000 to $9,999 | 0 (0.0%) | 0 (0.0%) |
| $10,000 to $14,999 | 7 (5.2%) | 0 (0.0%) |
| $15,000 to $19,999 | 0 (0.0%) | 0 (0.0%) |
| $20,000 to $24,999 | 0 (0.0%) | 0 (0.0%) |
| $25,000 to $34,999 | 0 (0.0%) | 0 (0.0%) |
| $35,000 to $49,999 | 0 (0.0%) | 0 (0.0%) |
| $50,000 to $74,999 | 0 (0.0%) | 24 (100.0%) |
| $75,000 to $99,999 | 23 (17.2%) | 0 (0.0%) |
| $100,000 to $149,999 | 61 (45.5%) | 0 (0.0%) |
| $150,000 or more | 43 (32.1%) | 0 (0.0%) |
| Total | 134 (100.0%) | 24 (100.0%) |
Monthly Housing Cost Tiers in Sandia Park
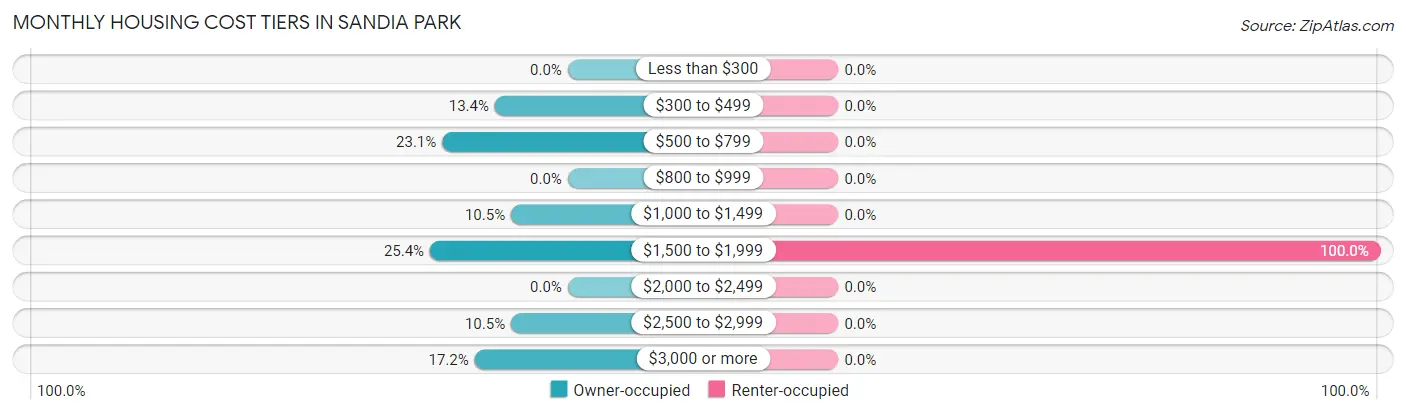
| Monthly Cost | Owner-occupied | Renter-occupied |
| Less than $300 | 0 (0.0%) | 0 (0.0%) |
| $300 to $499 | 18 (13.4%) | 0 (0.0%) |
| $500 to $799 | 31 (23.1%) | 0 (0.0%) |
| $800 to $999 | 0 (0.0%) | 0 (0.0%) |
| $1,000 to $1,499 | 14 (10.4%) | 0 (0.0%) |
| $1,500 to $1,999 | 34 (25.4%) | 24 (100.0%) |
| $2,000 to $2,499 | 0 (0.0%) | 0 (0.0%) |
| $2,500 to $2,999 | 14 (10.4%) | 0 (0.0%) |
| $3,000 or more | 23 (17.2%) | 0 (0.0%) |
| Total | 134 (100.0%) | 24 (100.0%) |
Physical Housing Characteristics in Sandia Park
Housing Structures in Sandia Park
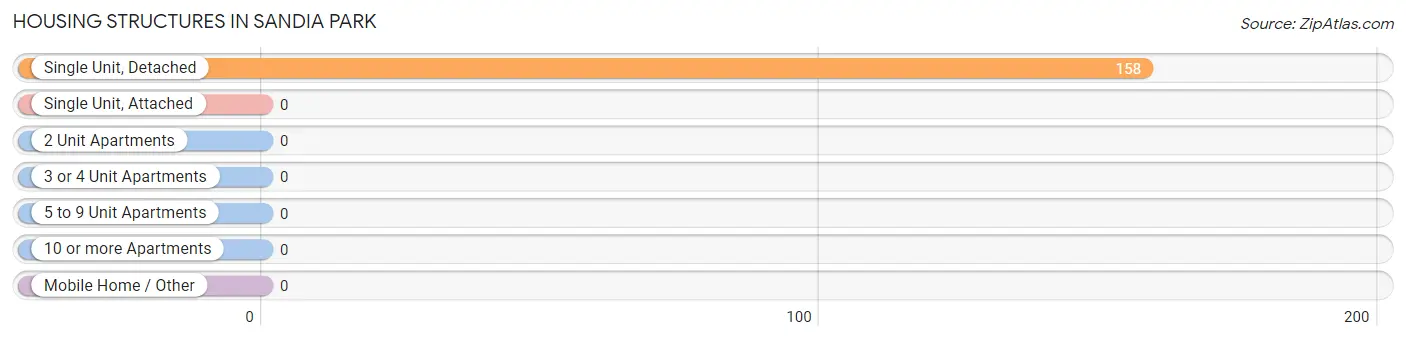
| Structure Type | # Housing Units | % Housing Units |
| Single Unit, Detached | 158 | 100.0% |
| Single Unit, Attached | 0 | 0.0% |
| 2 Unit Apartments | 0 | 0.0% |
| 3 or 4 Unit Apartments | 0 | 0.0% |
| 5 to 9 Unit Apartments | 0 | 0.0% |
| 10 or more Apartments | 0 | 0.0% |
| Mobile Home / Other | 0 | 0.0% |
| Total | 158 | 100.0% |
Housing Structures by Occupancy in Sandia Park
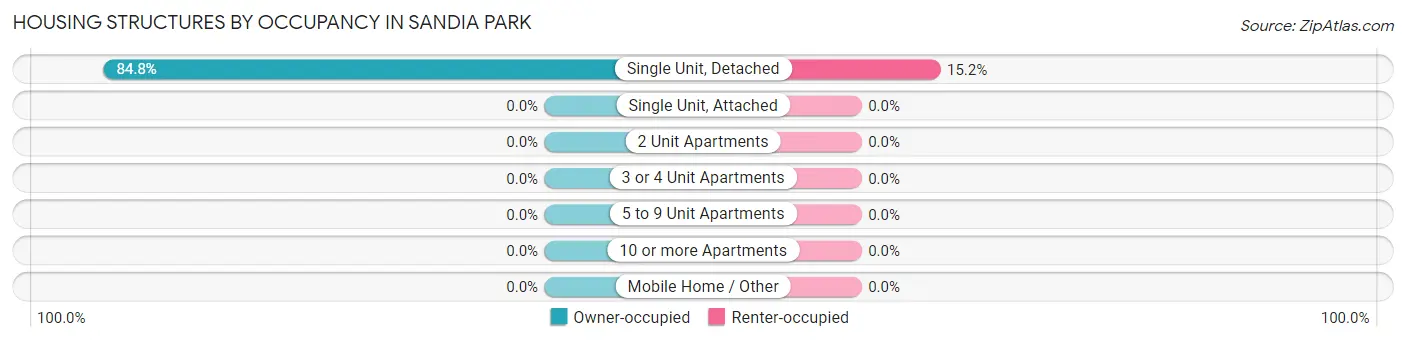
| Structure Type | Owner-occupied | Renter-occupied |
| Single Unit, Detached | 134 (84.8%) | 24 (15.2%) |
| Single Unit, Attached | 0 (0.0%) | 0 (0.0%) |
| 2 Unit Apartments | 0 (0.0%) | 0 (0.0%) |
| 3 or 4 Unit Apartments | 0 (0.0%) | 0 (0.0%) |
| 5 to 9 Unit Apartments | 0 (0.0%) | 0 (0.0%) |
| 10 or more Apartments | 0 (0.0%) | 0 (0.0%) |
| Mobile Home / Other | 0 (0.0%) | 0 (0.0%) |
| Total | 134 (84.8%) | 24 (15.2%) |
Housing Structures by Number of Rooms in Sandia Park
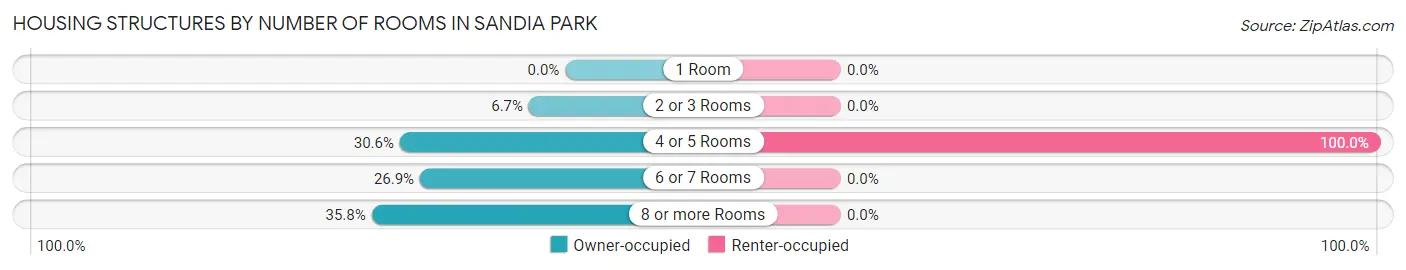
| Number of Rooms | Owner-occupied | Renter-occupied |
| 1 Room | 0 (0.0%) | 0 (0.0%) |
| 2 or 3 Rooms | 9 (6.7%) | 0 (0.0%) |
| 4 or 5 Rooms | 41 (30.6%) | 24 (100.0%) |
| 6 or 7 Rooms | 36 (26.9%) | 0 (0.0%) |
| 8 or more Rooms | 48 (35.8%) | 0 (0.0%) |
| Total | 134 (100.0%) | 24 (100.0%) |
Housing Structure by Heating Type in Sandia Park
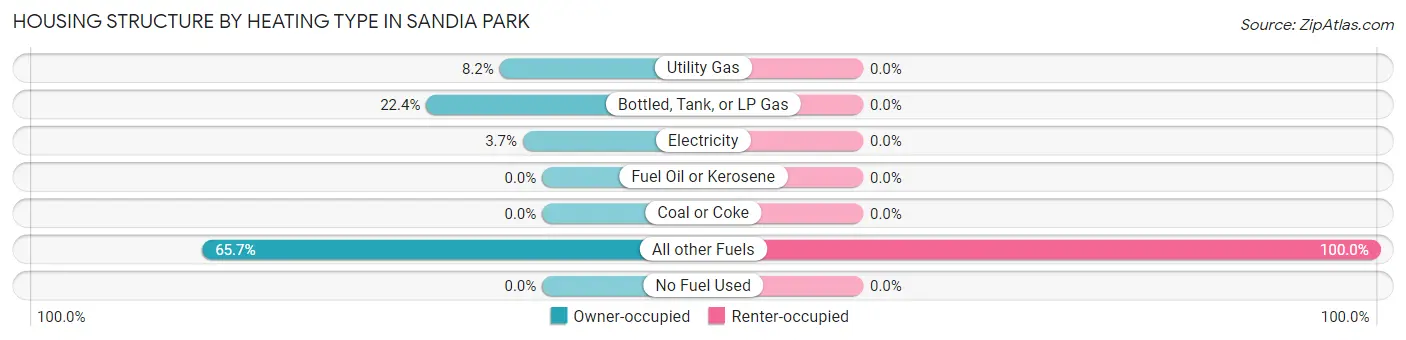
| Heating Type | Owner-occupied | Renter-occupied |
| Utility Gas | 11 (8.2%) | 0 (0.0%) |
| Bottled, Tank, or LP Gas | 30 (22.4%) | 0 (0.0%) |
| Electricity | 5 (3.7%) | 0 (0.0%) |
| Fuel Oil or Kerosene | 0 (0.0%) | 0 (0.0%) |
| Coal or Coke | 0 (0.0%) | 0 (0.0%) |
| All other Fuels | 88 (65.7%) | 24 (100.0%) |
| No Fuel Used | 0 (0.0%) | 0 (0.0%) |
| Total | 134 (100.0%) | 24 (100.0%) |
Household Vehicle Usage in Sandia Park
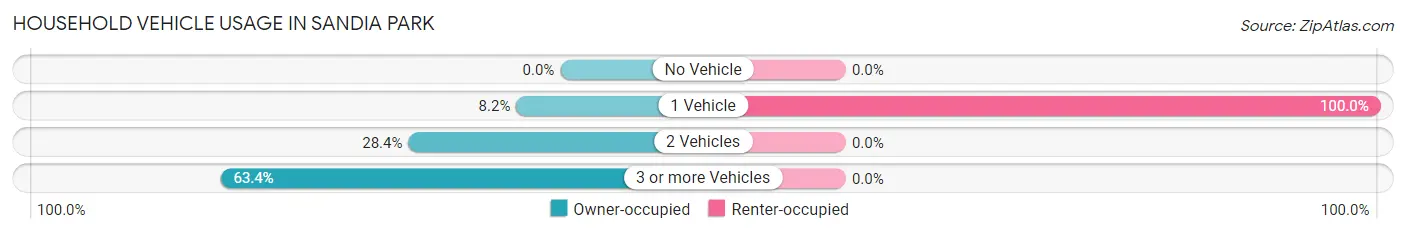
| Vehicles per Household | Owner-occupied | Renter-occupied |
| No Vehicle | 0 (0.0%) | 0 (0.0%) |
| 1 Vehicle | 11 (8.2%) | 24 (100.0%) |
| 2 Vehicles | 38 (28.4%) | 0 (0.0%) |
| 3 or more Vehicles | 85 (63.4%) | 0 (0.0%) |
| Total | 134 (100.0%) | 24 (100.0%) |
Real Estate & Mortgages in Sandia Park
Real Estate and Mortgage Overview in Sandia Park
| Characteristic | Without Mortgage | With Mortgage |
| Housing Units | 49 | 85 |
| Median Property Value | $479,500 | $394,400 |
| Median Household Income | $126,477 | $23 |
| Monthly Housing Costs | $621 | $23 |
| Real Estate Taxes | $5,524 | $0 |
Property Value by Mortgage Status in Sandia Park
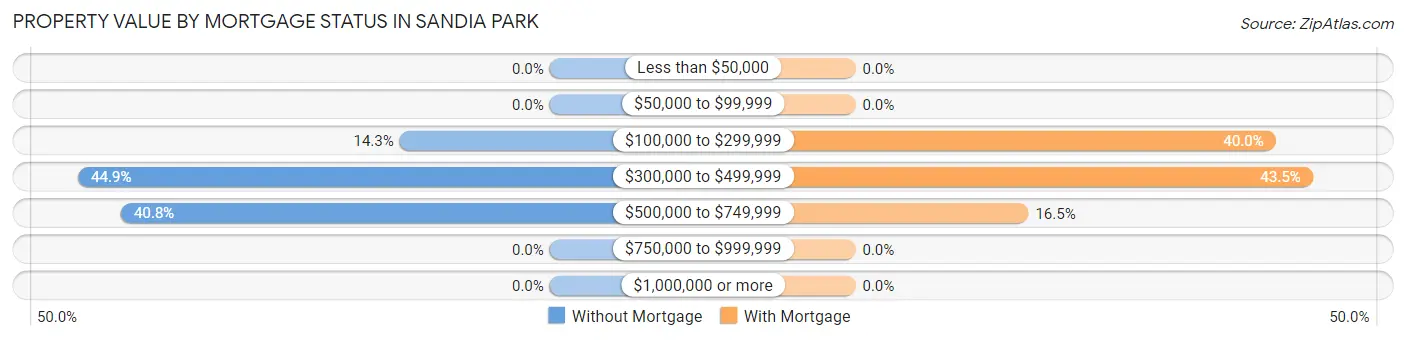
| Property Value | Without Mortgage | With Mortgage |
| Less than $50,000 | 0 (0.0%) | 0 (0.0%) |
| $50,000 to $99,999 | 0 (0.0%) | 0 (0.0%) |
| $100,000 to $299,999 | 7 (14.3%) | 34 (40.0%) |
| $300,000 to $499,999 | 22 (44.9%) | 37 (43.5%) |
| $500,000 to $749,999 | 20 (40.8%) | 14 (16.5%) |
| $750,000 to $999,999 | 0 (0.0%) | 0 (0.0%) |
| $1,000,000 or more | 0 (0.0%) | 0 (0.0%) |
| Total | 49 (100.0%) | 85 (100.0%) |
Household Income by Mortgage Status in Sandia Park
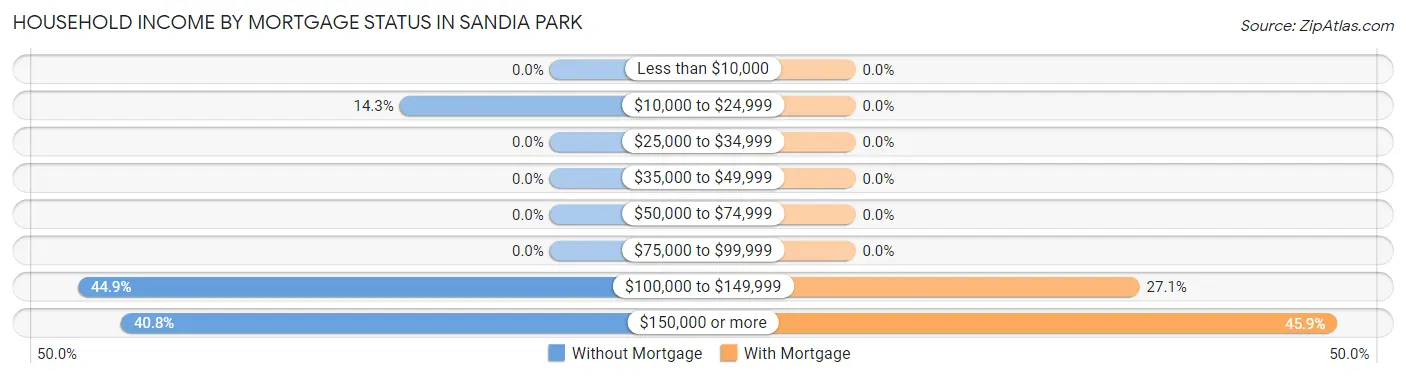
| Household Income | Without Mortgage | With Mortgage |
| Less than $10,000 | 0 (0.0%) | 0 (0.0%) |
| $10,000 to $24,999 | 7 (14.3%) | 0 (0.0%) |
| $25,000 to $34,999 | 0 (0.0%) | 0 (0.0%) |
| $35,000 to $49,999 | 0 (0.0%) | 0 (0.0%) |
| $50,000 to $74,999 | 0 (0.0%) | 0 (0.0%) |
| $75,000 to $99,999 | 0 (0.0%) | 0 (0.0%) |
| $100,000 to $149,999 | 22 (44.9%) | 23 (27.1%) |
| $150,000 or more | 20 (40.8%) | 39 (45.9%) |
| Total | 49 (100.0%) | 85 (100.0%) |
Property Value to Household Income Ratio in Sandia Park
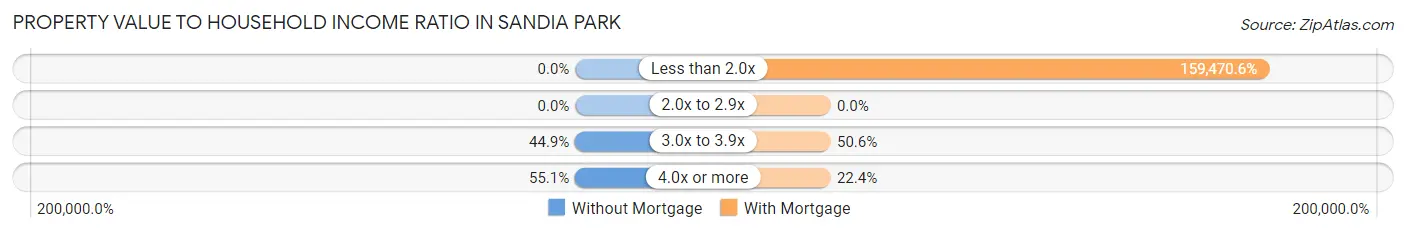
| Value-to-Income Ratio | Without Mortgage | With Mortgage |
| Less than 2.0x | 0 (0.0%) | 135,550 (159,470.6%) |
| 2.0x to 2.9x | 0 (0.0%) | 0 (0.0%) |
| 3.0x to 3.9x | 22 (44.9%) | 43 (50.6%) |
| 4.0x or more | 27 (55.1%) | 19 (22.4%) |
| Total | 49 (100.0%) | 85 (100.0%) |
Real Estate Taxes by Mortgage Status in Sandia Park
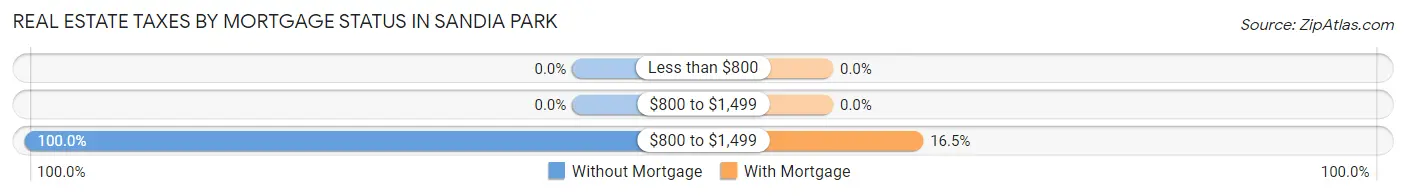
| Property Taxes | Without Mortgage | With Mortgage |
| Less than $800 | 0 (0.0%) | 0 (0.0%) |
| $800 to $1,499 | 0 (0.0%) | 0 (0.0%) |
| $800 to $1,499 | 49 (100.0%) | 14 (16.5%) |
| Total | 49 (100.0%) | 85 (100.0%) |
Health & Disability in Sandia Park
Health Insurance Coverage by Age in Sandia Park
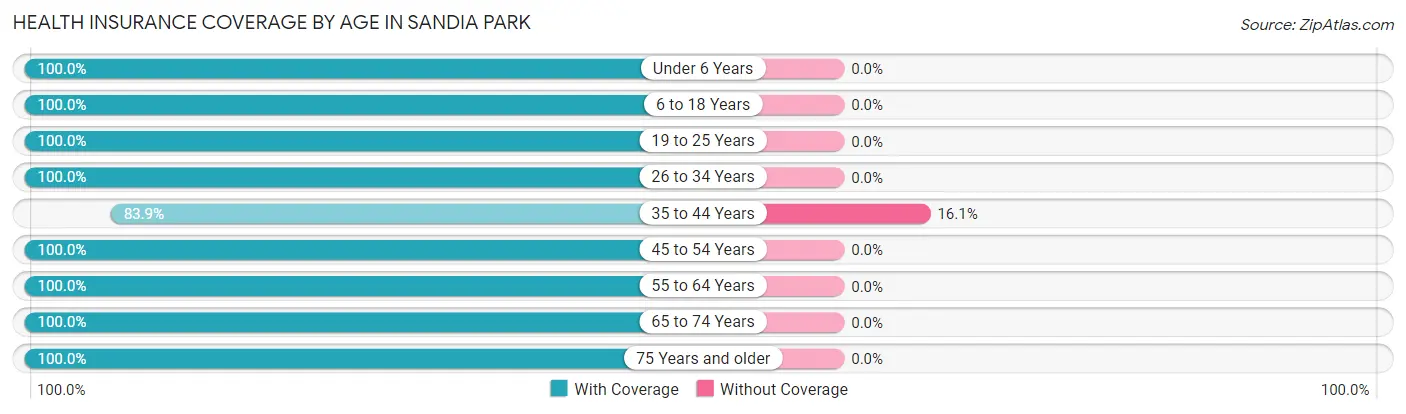
| Age Bracket | With Coverage | Without Coverage |
| Under 6 Years | 5 (100.0%) | 0 (0.0%) |
| 6 to 18 Years | 101 (100.0%) | 0 (0.0%) |
| 19 to 25 Years | 14 (100.0%) | 0 (0.0%) |
| 26 to 34 Years | 55 (100.0%) | 0 (0.0%) |
| 35 to 44 Years | 47 (83.9%) | 9 (16.1%) |
| 45 to 54 Years | 61 (100.0%) | 0 (0.0%) |
| 55 to 64 Years | 81 (100.0%) | 0 (0.0%) |
| 65 to 74 Years | 27 (100.0%) | 0 (0.0%) |
| 75 Years and older | 11 (100.0%) | 0 (0.0%) |
| Total | 402 (97.8%) | 9 (2.2%) |
Health Insurance Coverage by Citizenship Status in Sandia Park
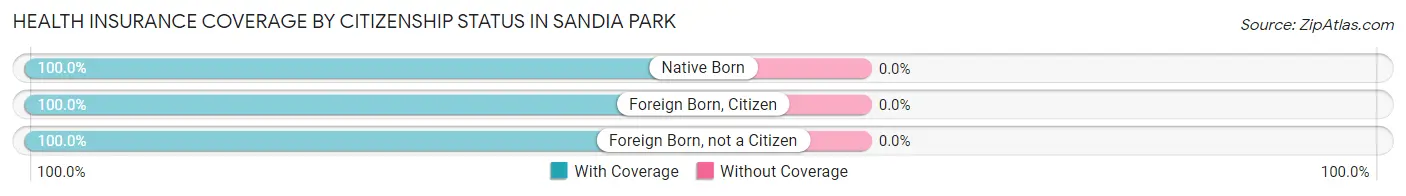
| Citizenship Status | With Coverage | Without Coverage |
| Native Born | 5 (100.0%) | 0 (0.0%) |
| Foreign Born, Citizen | 101 (100.0%) | 0 (0.0%) |
| Foreign Born, not a Citizen | 14 (100.0%) | 0 (0.0%) |
Health Insurance Coverage by Household Income in Sandia Park
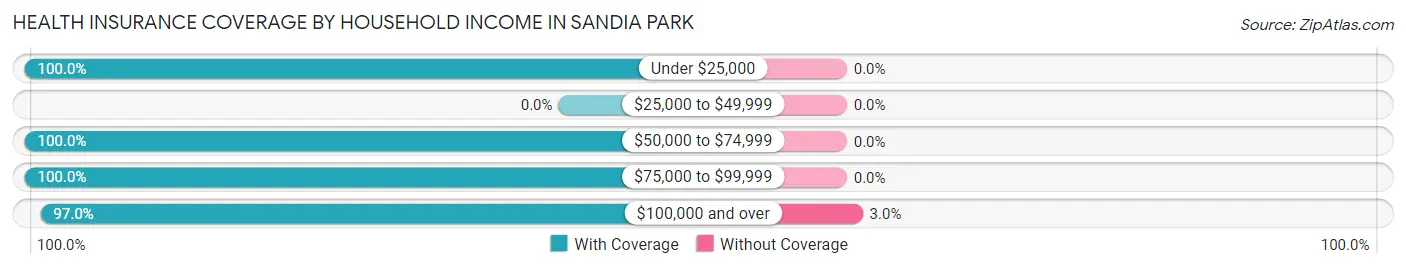
| Household Income | With Coverage | Without Coverage |
| Under $25,000 | 7 (100.0%) | 0 (0.0%) |
| $25,000 to $49,999 | 0 (0.0%) | 0 (0.0%) |
| $50,000 to $74,999 | 24 (100.0%) | 0 (0.0%) |
| $75,000 to $99,999 | 77 (100.0%) | 0 (0.0%) |
| $100,000 and over | 294 (97.0%) | 9 (3.0%) |
Public vs Private Health Insurance Coverage by Age in Sandia Park
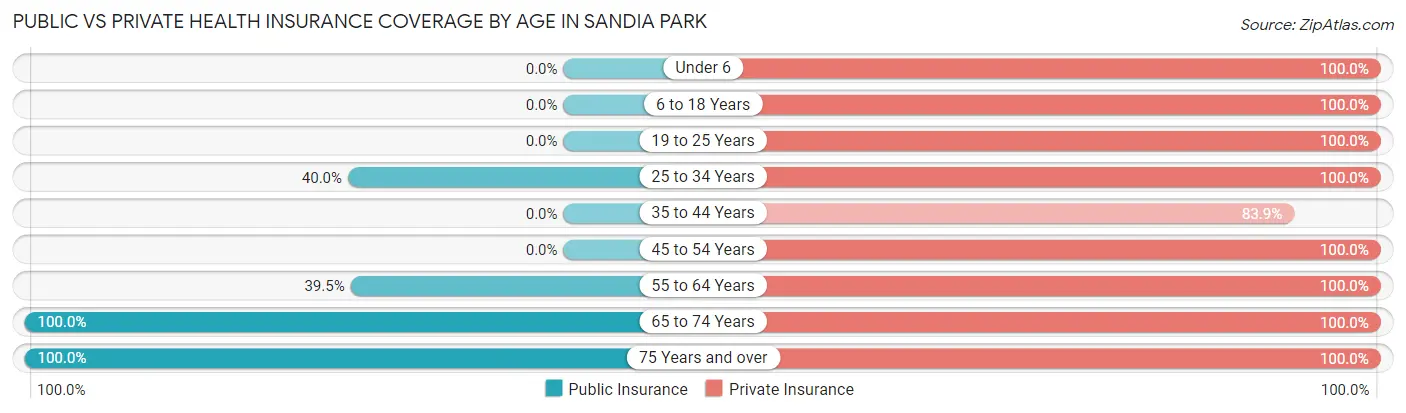
| Age Bracket | Public Insurance | Private Insurance |
| Under 6 | 0 (0.0%) | 5 (100.0%) |
| 6 to 18 Years | 0 (0.0%) | 101 (100.0%) |
| 19 to 25 Years | 0 (0.0%) | 14 (100.0%) |
| 25 to 34 Years | 22 (40.0%) | 55 (100.0%) |
| 35 to 44 Years | 0 (0.0%) | 47 (83.9%) |
| 45 to 54 Years | 0 (0.0%) | 61 (100.0%) |
| 55 to 64 Years | 32 (39.5%) | 81 (100.0%) |
| 65 to 74 Years | 27 (100.0%) | 27 (100.0%) |
| 75 Years and over | 11 (100.0%) | 11 (100.0%) |
| Total | 92 (22.4%) | 402 (97.8%) |
Disability Status by Sex by Age in Sandia Park
| Age Bracket | Male | Female |
| Under 5 Years | 0 (0.0%) | 0 (0.0%) |
| 5 to 17 Years | 0 (0.0%) | 0 (0.0%) |
| 18 to 34 Years | 0 (0.0%) | 0 (0.0%) |
| 35 to 64 Years | 0 (0.0%) | 0 (0.0%) |
| 65 to 74 Years | 0 (0.0%) | 0 (0.0%) |
| 75 Years and over | 0 (0.0%) | 0 (0.0%) |
Disability Class by Sex by Age in Sandia Park
Disability Class: Hearing Difficulty
| Age Bracket | Male | Female |
| Under 5 Years | 0 (0.0%) | 0 (0.0%) |
| 5 to 17 Years | 0 (0.0%) | 0 (0.0%) |
| 18 to 34 Years | 0 (0.0%) | 0 (0.0%) |
| 35 to 64 Years | 0 (0.0%) | 0 (0.0%) |
| 65 to 74 Years | 0 (0.0%) | 0 (0.0%) |
| 75 Years and over | 0 (0.0%) | 0 (0.0%) |
Disability Class: Vision Difficulty
| Age Bracket | Male | Female |
| Under 5 Years | 0 (0.0%) | 0 (0.0%) |
| 5 to 17 Years | 0 (0.0%) | 0 (0.0%) |
| 18 to 34 Years | 0 (0.0%) | 0 (0.0%) |
| 35 to 64 Years | 0 (0.0%) | 0 (0.0%) |
| 65 to 74 Years | 0 (0.0%) | 0 (0.0%) |
| 75 Years and over | 0 (0.0%) | 0 (0.0%) |
Disability Class: Cognitive Difficulty

| Age Bracket | Male | Female |
| 5 to 17 Years | 0 (0.0%) | 0 (0.0%) |
| 18 to 34 Years | 0 (0.0%) | 0 (0.0%) |
| 35 to 64 Years | 0 (0.0%) | 0 (0.0%) |
| 65 to 74 Years | 0 (0.0%) | 0 (0.0%) |
| 75 Years and over | 0 (0.0%) | 0 (0.0%) |
Disability Class: Ambulatory Difficulty
| Age Bracket | Male | Female |
| 5 to 17 Years | 0 (0.0%) | 0 (0.0%) |
| 18 to 34 Years | 0 (0.0%) | 0 (0.0%) |
| 35 to 64 Years | 0 (0.0%) | 0 (0.0%) |
| 65 to 74 Years | 0 (0.0%) | 0 (0.0%) |
| 75 Years and over | 0 (0.0%) | 0 (0.0%) |
Disability Class: Self-Care Difficulty
| Age Bracket | Male | Female |
| 5 to 17 Years | 0 (0.0%) | 0 (0.0%) |
| 18 to 34 Years | 0 (0.0%) | 0 (0.0%) |
| 35 to 64 Years | 0 (0.0%) | 0 (0.0%) |
| 65 to 74 Years | 0 (0.0%) | 0 (0.0%) |
| 75 Years and over | 0 (0.0%) | 0 (0.0%) |
Technology Access in Sandia Park
Computing Device Access in Sandia Park
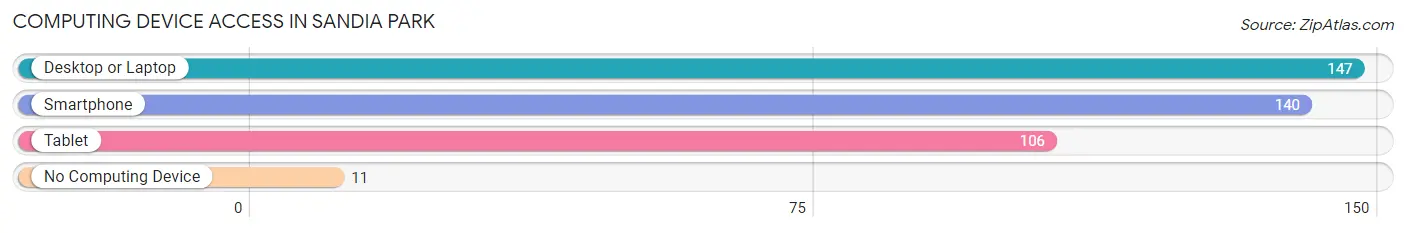
| Device Type | # Households | % Households |
| Desktop or Laptop | 147 | 93.0% |
| Smartphone | 140 | 88.6% |
| Tablet | 106 | 67.1% |
| No Computing Device | 11 | 7.0% |
| Total | 158 | 100.0% |
Internet Access in Sandia Park
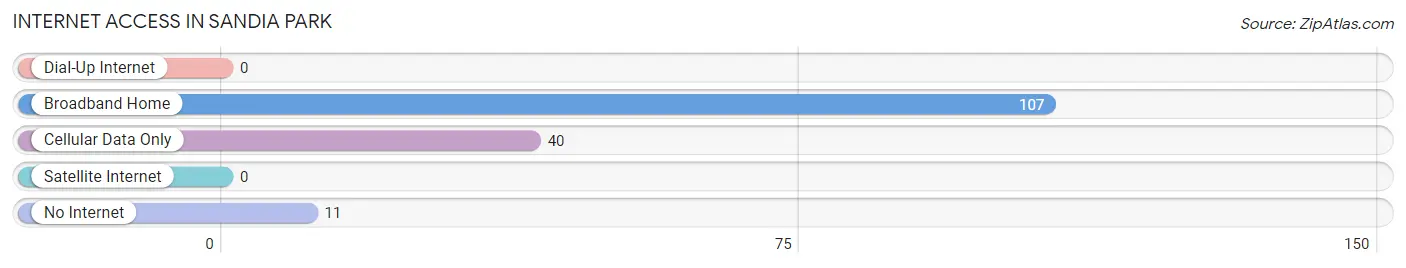
| Internet Type | # Households | % Households |
| Dial-Up Internet | 0 | 0.0% |
| Broadband Home | 107 | 67.7% |
| Cellular Data Only | 40 | 25.3% |
| Satellite Internet | 0 | 0.0% |
| No Internet | 11 | 7.0% |
| Total | 158 | 100.0% |
Sandia Park Summary
Sandia Park is a small unincorporated community located in Bernalillo County, New Mexico. It is situated in the foothills of the Sandia Mountains, approximately 20 miles northeast of Albuquerque. The community is home to a population of approximately 1,000 people and is known for its rural atmosphere and stunning views of the surrounding mountains.
History
The area that is now Sandia Park was originally inhabited by the Pueblo Indians. The first European settlers arrived in the area in the late 1800s, and the community was officially established in the early 1900s. The name “Sandia Park” was derived from the Spanish word for “watermelon”, which was a popular crop in the area.
In the early 1900s, the community was primarily a farming and ranching community. The main crops grown in the area were corn, beans, and squash. The area was also home to several small businesses, including a general store, a post office, and a blacksmith shop.
In the 1950s, the community began to experience a population boom as people moved to the area to take advantage of the scenic views and rural atmosphere. The population continued to grow throughout the 1960s and 1970s, and the community began to develop into a small bedroom community for Albuquerque.
Geography
Sandia Park is located in the foothills of the Sandia Mountains, approximately 20 miles northeast of Albuquerque. The community is situated at an elevation of 6,000 feet and is surrounded by stunning views of the surrounding mountains. The area is characterized by rolling hills, open meadows, and dense forests.
The climate in Sandia Park is semi-arid, with hot summers and cold winters. The average annual temperature is approximately 55 degrees Fahrenheit, and the average annual precipitation is approximately 12 inches.
Economy
The economy of Sandia Park is primarily based on tourism and small businesses. The area is home to several small businesses, including restaurants, shops, and galleries. The community is also home to several bed and breakfasts, which attract visitors from all over the world.
The area is also home to several outdoor recreation opportunities, including hiking, camping, fishing, and horseback riding. The nearby Sandia Mountains offer a variety of trails for hikers and mountain bikers.
Demographics
As of the 2010 census, the population of Sandia Park was 1,000. The racial makeup of the community was 94.2% White, 0.7% African American, 0.7% Native American, 0.7% Asian, 0.7% from other races, and 2.7% from two or more races. Hispanic or Latino of any race were 4.7% of the population.
The median household income in Sandia Park was $50,000, and the median family income was $54,000. The per capita income was $25,000. Approximately 8.7% of the population was below the poverty line.
Common Questions
What is Per Capita Income in Sandia Park?
Per Capita income in Sandia Park is $44,932.
What is the Median Family Income in Sandia Park?
Median Family Income in Sandia Park is $136,000.
What is the Median Household income in Sandia Park?
Median Household Income in Sandia Park is $127,045.
What is Inequality or Gini Index in Sandia Park?
Inequality or Gini Index in Sandia Park is 0.22.
What is the Total Population of Sandia Park?
Total Population of Sandia Park is 411.
What is the Total Male Population of Sandia Park?
Total Male Population of Sandia Park is 226.
What is the Total Female Population of Sandia Park?
Total Female Population of Sandia Park is 185.
What is the Ratio of Males per 100 Females in Sandia Park?
There are 122.16 Males per 100 Females in Sandia Park.
What is the Ratio of Females per 100 Males in Sandia Park?
There are 81.86 Females per 100 Males in Sandia Park.
What is the Median Population Age in Sandia Park?
Median Population Age in Sandia Park is 43.3 Years.
What is the Average Family Size in Sandia Park
Average Family Size in Sandia Park is 3.2 People.
What is the Average Household Size in Sandia Park
Average Household Size in Sandia Park is 2.6 People.
How Large is the Labor Force in Sandia Park?
There are 231 People in the Labor Forcein in Sandia Park.
What is the Percentage of People in the Labor Force in Sandia Park?
73.3% of People are in the Labor Force in Sandia Park.