Sandia Knolls, NM Map & Demographics
Sandia Knolls Map
Sandia Knolls Overview
$41,014
PER CAPITA INCOME
$108,000
AVG FAMILY INCOME
$98,298
AVG HOUSEHOLD INCOME
0.37
INEQUALITY / GINI INDEX
1,410
TOTAL POPULATION
736
MALE POPULATION
674
FEMALE POPULATION
109.20
MALES / 100 FEMALES
91.58
FEMALES / 100 MALES
45.2
MEDIAN AGE
3.1
AVG FAMILY SIZE
2.4
AVG HOUSEHOLD SIZE
789
LABOR FORCE [ PEOPLE ]
68.4%
PERCENT IN LABOR FORCE
3.2%
UNEMPLOYMENT RATE
Income in Sandia Knolls
Income Overview in Sandia Knolls
Per Capita Income in Sandia Knolls is $41,014, while median incomes of families and households are $108,000 and $98,298 respectively.
| Characteristic | Number | Measure |
| Per Capita Income | 1,410 | $41,014 |
| Median Family Income | 384 | $108,000 |
| Mean Family Income | 384 | $111,365 |
| Median Household Income | 578 | $98,298 |
| Mean Household Income | 578 | $97,584 |
| Income Deficit | 384 | $0 |
| Wage / Income Gap (%) | 1,410 | 0.00% |
| Wage / Income Gap ($) | 1,410 | 100.00¢ per $1 |
| Gini / Inequality Index | 1,410 | 0.37 |
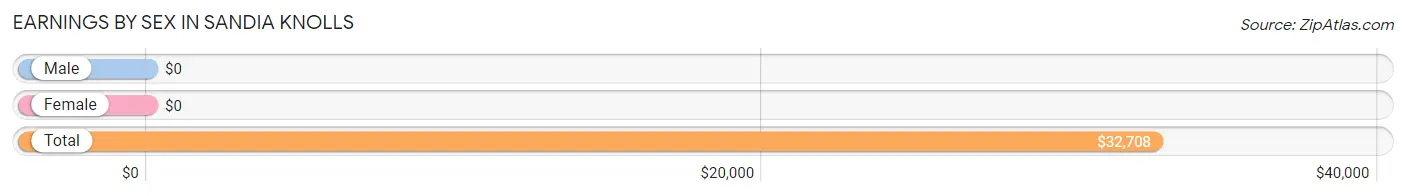
Earnings by Sex in Sandia Knolls
| Sex | Number | Average Earnings |
| Male | 487 (61.3%) | $0 |
| Female | 308 (38.7%) | $0 |
| Total | 795 (100.0%) | $32,708 |
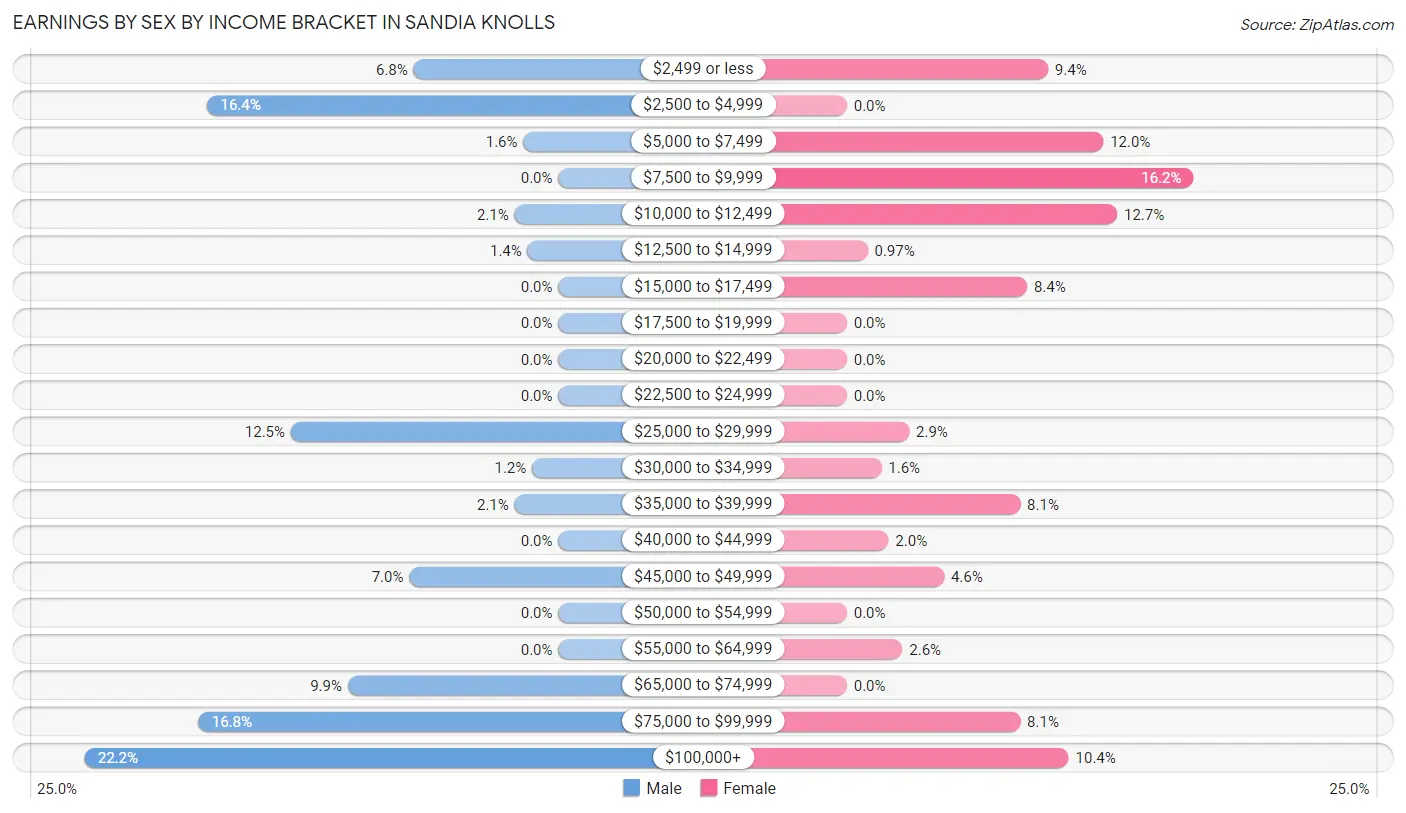
Earnings by Sex by Income Bracket in Sandia Knolls
The most common earnings brackets in Sandia Knolls are $100,000+ for men (108 | 22.2%) and $7,500 to $9,999 for women (50 | 16.2%).
| Income | Male | Female |
| $2,499 or less | 33 (6.8%) | 29 (9.4%) |
| $2,500 to $4,999 | 80 (16.4%) | 0 (0.0%) |
| $5,000 to $7,499 | 8 (1.6%) | 37 (12.0%) |
| $7,500 to $9,999 | 0 (0.0%) | 50 (16.2%) |
| $10,000 to $12,499 | 10 (2.1%) | 39 (12.7%) |
| $12,500 to $14,999 | 7 (1.4%) | 3 (1.0%) |
| $15,000 to $17,499 | 0 (0.0%) | 26 (8.4%) |
| $17,500 to $19,999 | 0 (0.0%) | 0 (0.0%) |
| $20,000 to $22,499 | 0 (0.0%) | 0 (0.0%) |
| $22,500 to $24,999 | 0 (0.0%) | 0 (0.0%) |
| $25,000 to $29,999 | 61 (12.5%) | 9 (2.9%) |
| $30,000 to $34,999 | 6 (1.2%) | 5 (1.6%) |
| $35,000 to $39,999 | 10 (2.1%) | 25 (8.1%) |
| $40,000 to $44,999 | 0 (0.0%) | 6 (1.9%) |
| $45,000 to $49,999 | 34 (7.0%) | 14 (4.5%) |
| $50,000 to $54,999 | 0 (0.0%) | 0 (0.0%) |
| $55,000 to $64,999 | 0 (0.0%) | 8 (2.6%) |
| $65,000 to $74,999 | 48 (9.9%) | 0 (0.0%) |
| $75,000 to $99,999 | 82 (16.8%) | 25 (8.1%) |
| $100,000+ | 108 (22.2%) | 32 (10.4%) |
| Total | 487 (100.0%) | 308 (100.0%) |
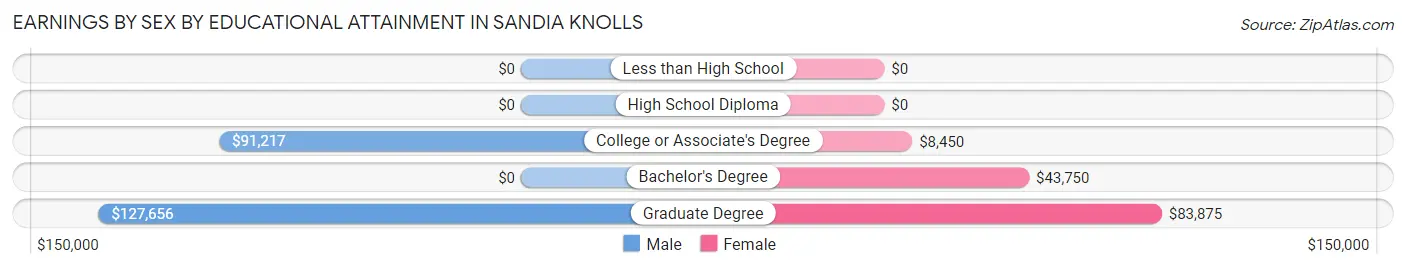
Earnings by Sex by Educational Attainment in Sandia Knolls
| Educational Attainment | Male Income | Female Income |
| Less than High School | - | - |
| High School Diploma | - | - |
| College or Associate's Degree | $91,217 | $8,450 |
| Bachelor's Degree | - | - |
| Graduate Degree | $127,656 | $83,875 |
| Total | $88,816 | $0 |
Family Income in Sandia Knolls
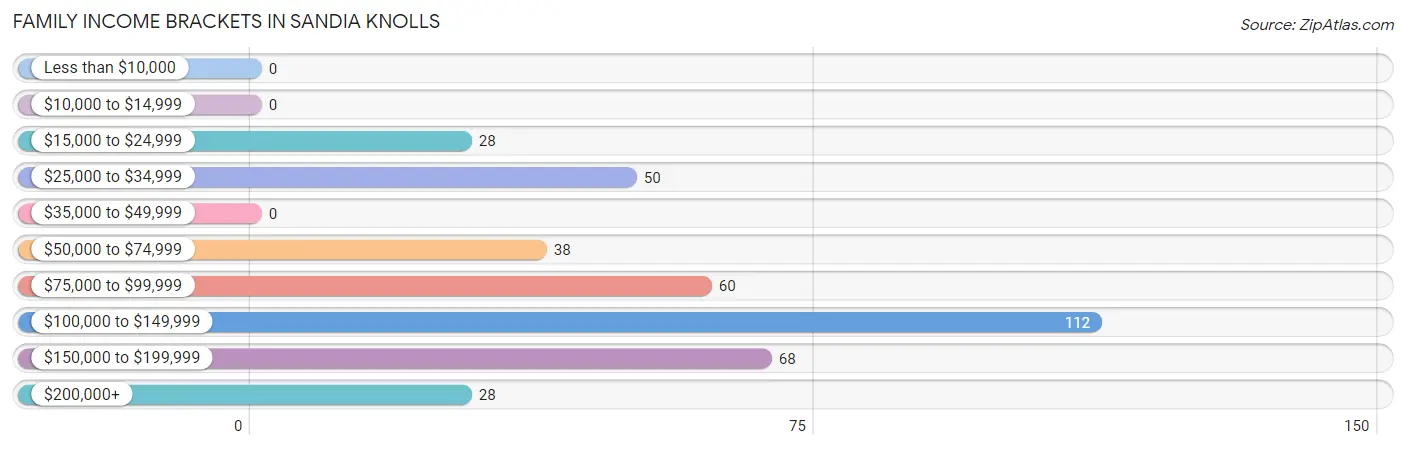
Family Income Brackets in Sandia Knolls
According to the Sandia Knolls family income data, there are 112 families falling into the $100,000 to $149,999 income range, which is the most common income bracket and makes up 29.2% of all families.
| Income Bracket | # Families | % Families |
| Less than $10,000 | 0 | 0.0% |
| $10,000 to $14,999 | 0 | 0.0% |
| $15,000 to $24,999 | 28 | 7.3% |
| $25,000 to $34,999 | 50 | 13.0% |
| $35,000 to $49,999 | 0 | 0.0% |
| $50,000 to $74,999 | 38 | 9.9% |
| $75,000 to $99,999 | 60 | 15.6% |
| $100,000 to $149,999 | 112 | 29.2% |
| $150,000 to $199,999 | 68 | 17.7% |
| $200,000+ | 28 | 7.3% |
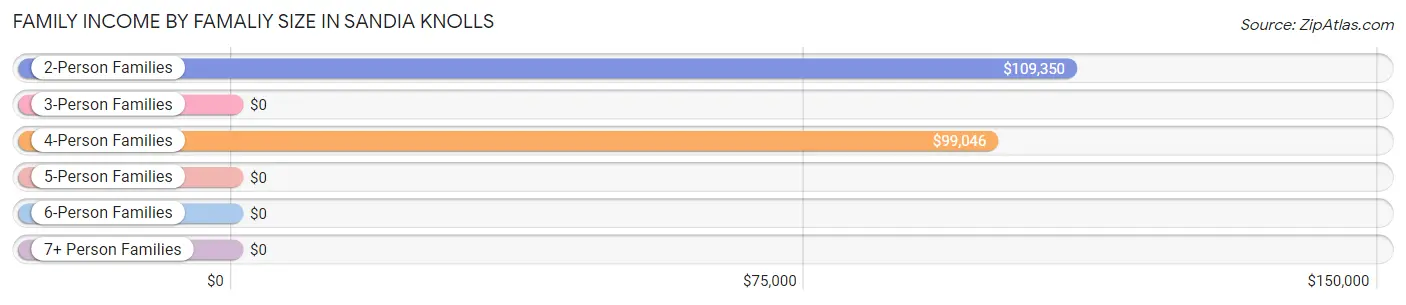
Family Income by Famaliy Size in Sandia Knolls
2-person families (235 | 61.2%) account for the highest median family income in Sandia Knolls with $109,350 per family, while 2-person families (235 | 61.2%) have the highest median income of $54,675 per family member.
| Income Bracket | # Families | Median Income |
| 2-Person Families | 235 (61.2%) | $109,350 |
| 3-Person Families | 60 (15.6%) | $0 |
| 4-Person Families | 57 (14.8%) | $99,046 |
| 5-Person Families | 19 (5.0%) | $0 |
| 6-Person Families | 8 (2.1%) | $0 |
| 7+ Person Families | 5 (1.3%) | $0 |
| Total | 384 (100.0%) | $108,000 |
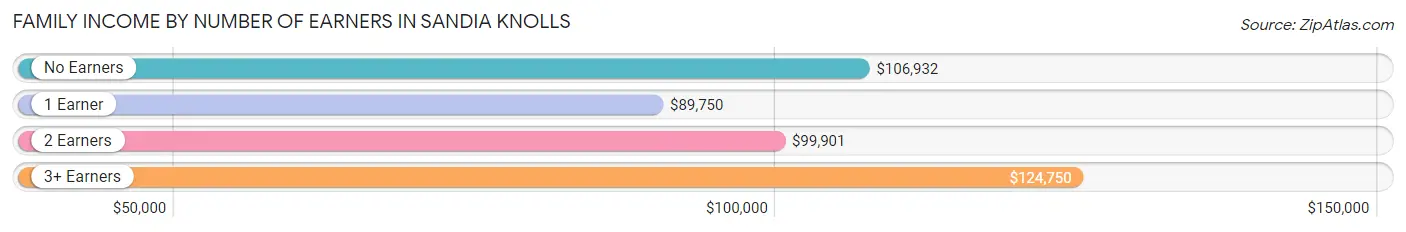
Family Income by Number of Earners in Sandia Knolls
The median family income in Sandia Knolls is $108,000, with families comprising 3+ earners (37) having the highest median family income of $124,750, while families with 1 earner (119) have the lowest median family income of $89,750, accounting for 9.6% and 31.0% of families, respectively.
| Number of Earners | # Families | Median Income |
| No Earners | 57 (14.8%) | $106,932 |
| 1 Earner | 119 (31.0%) | $89,750 |
| 2 Earners | 171 (44.5%) | $99,901 |
| 3+ Earners | 37 (9.6%) | $124,750 |
| Total | 384 (100.0%) | $108,000 |
Household Income in Sandia Knolls
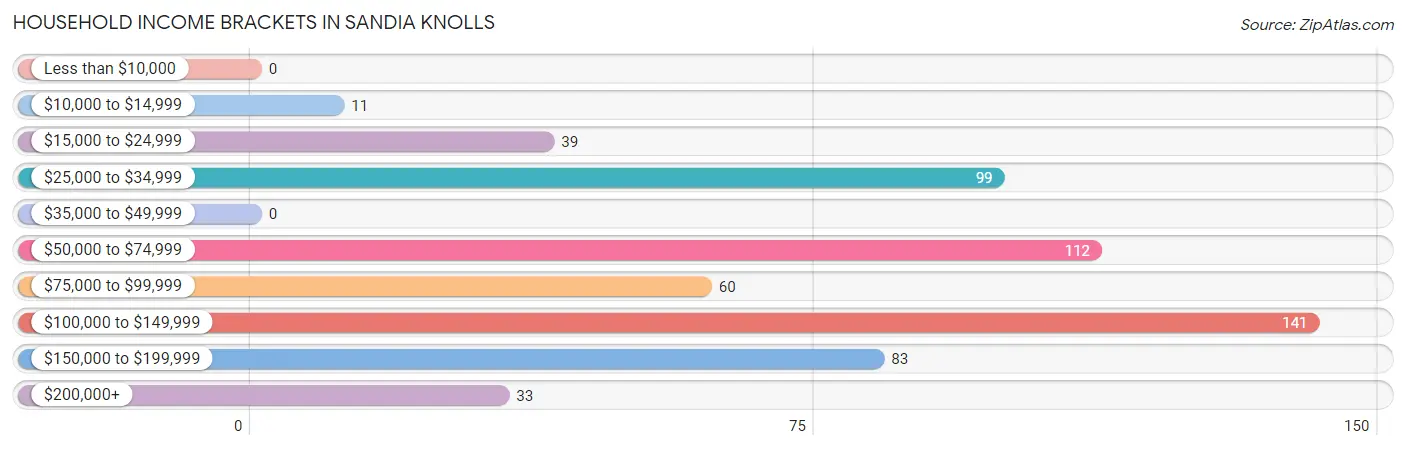
Household Income Brackets in Sandia Knolls
With 141 households falling in the category, the $100,000 to $149,999 income range is the most frequent in Sandia Knolls, accounting for 24.4% of all households.
| Income Bracket | # Households | % Households |
| Less than $10,000 | 0 | 0.0% |
| $10,000 to $14,999 | 11 | 1.9% |
| $15,000 to $24,999 | 39 | 6.7% |
| $25,000 to $34,999 | 99 | 17.1% |
| $35,000 to $49,999 | 0 | 0.0% |
| $50,000 to $74,999 | 112 | 19.4% |
| $75,000 to $99,999 | 60 | 10.4% |
| $100,000 to $149,999 | 141 | 24.4% |
| $150,000 to $199,999 | 83 | 14.4% |
| $200,000+ | 33 | 5.7% |
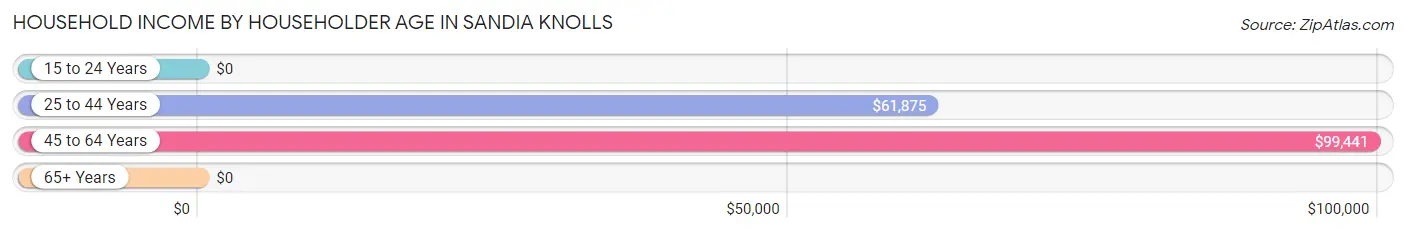
Household Income by Householder Age in Sandia Knolls
The median household income in Sandia Knolls is $98,298, with the highest median household income of $99,441 found in the 45 to 64 years age bracket for the primary householder. A total of 267 households (46.2%) fall into this category. Meanwhile, the 15 to 24 years age bracket for the primary householder has the lowest median household income of $0, with 39 households (6.8%) in this group.
| Income Bracket | # Households | Median Income |
| 15 to 24 Years | 39 (6.8%) | $0 |
| 25 to 44 Years | 88 (15.2%) | $61,875 |
| 45 to 64 Years | 267 (46.2%) | $99,441 |
| 65+ Years | 184 (31.8%) | $0 |
| Total | 578 (100.0%) | $98,298 |
Poverty in Sandia Knolls
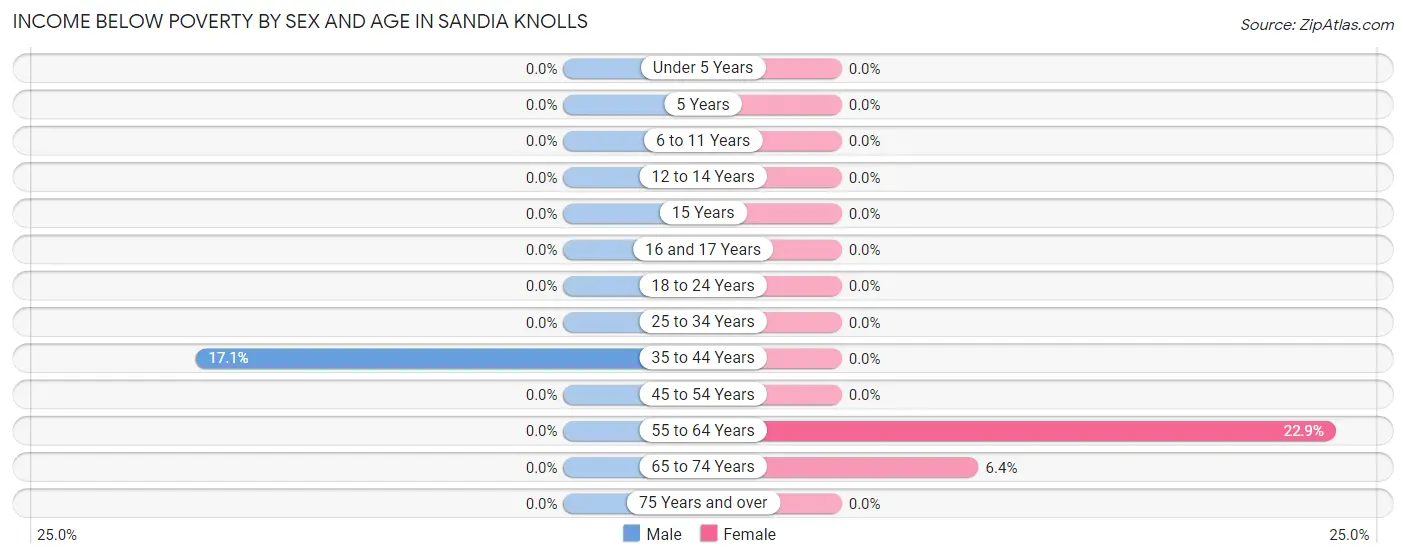
Income Below Poverty by Sex and Age in Sandia Knolls
With 1.9% poverty level for males and 2.8% for females among the residents of Sandia Knolls, 35 to 44 year old males and 55 to 64 year old females are the most vulnerable to poverty, with 14 males (17.1%) and 11 females (22.9%) in their respective age groups living below the poverty level.
| Age Bracket | Male | Female |
| Under 5 Years | 0 (0.0%) | 0 (0.0%) |
| 5 Years | 0 (0.0%) | 0 (0.0%) |
| 6 to 11 Years | 0 (0.0%) | 0 (0.0%) |
| 12 to 14 Years | 0 (0.0%) | 0 (0.0%) |
| 15 Years | 0 (0.0%) | 0 (0.0%) |
| 16 and 17 Years | 0 (0.0%) | 0 (0.0%) |
| 18 to 24 Years | 0 (0.0%) | 0 (0.0%) |
| 25 to 34 Years | 0 (0.0%) | 0 (0.0%) |
| 35 to 44 Years | 14 (17.1%) | 0 (0.0%) |
| 45 to 54 Years | 0 (0.0%) | 0 (0.0%) |
| 55 to 64 Years | 0 (0.0%) | 11 (22.9%) |
| 65 to 74 Years | 0 (0.0%) | 8 (6.4%) |
| 75 Years and over | 0 (0.0%) | 0 (0.0%) |
| Total | 14 (1.9%) | 19 (2.8%) |
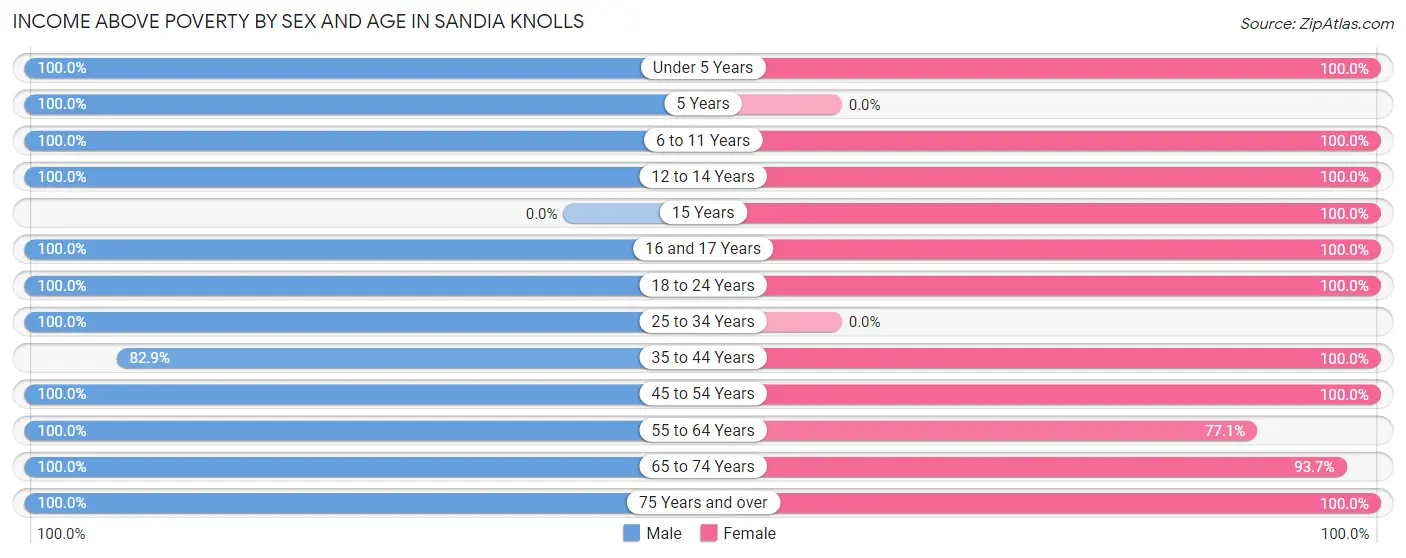
Income Above Poverty by Sex and Age in Sandia Knolls
According to the poverty statistics in Sandia Knolls, males aged under 5 years and females aged under 5 years are the age groups that are most secure financially, with 100.0% of males and 100.0% of females in these age groups living above the poverty line.
| Age Bracket | Male | Female |
| Under 5 Years | 14 (100.0%) | 5 (100.0%) |
| 5 Years | 18 (100.0%) | 0 (0.0%) |
| 6 to 11 Years | 46 (100.0%) | 36 (100.0%) |
| 12 to 14 Years | 23 (100.0%) | 77 (100.0%) |
| 15 Years | 0 (0.0%) | 37 (100.0%) |
| 16 and 17 Years | 26 (100.0%) | 34 (100.0%) |
| 18 to 24 Years | 156 (100.0%) | 49 (100.0%) |
| 25 to 34 Years | 17 (100.0%) | 0 (0.0%) |
| 35 to 44 Years | 68 (82.9%) | 78 (100.0%) |
| 45 to 54 Years | 116 (100.0%) | 133 (100.0%) |
| 55 to 64 Years | 118 (100.0%) | 37 (77.1%) |
| 65 to 74 Years | 99 (100.0%) | 118 (93.6%) |
| 75 Years and over | 21 (100.0%) | 51 (100.0%) |
| Total | 722 (98.1%) | 655 (97.2%) |
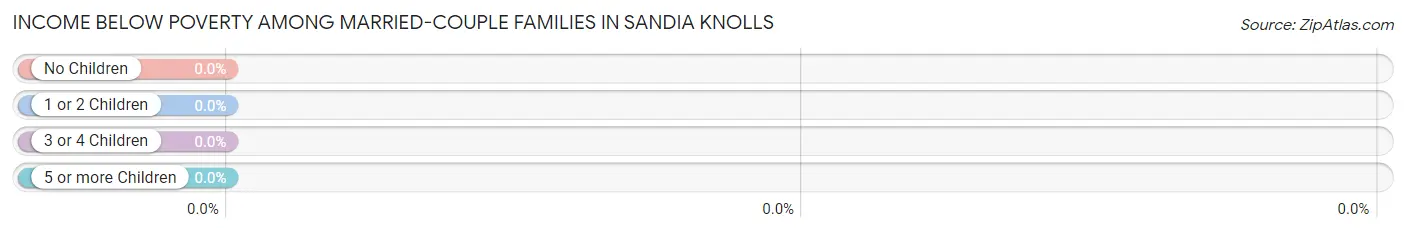
Income Below Poverty Among Married-Couple Families in Sandia Knolls
| Children | Above Poverty | Below Poverty |
| No Children | 149 (100.0%) | 0 (0.0%) |
| 1 or 2 Children | 108 (100.0%) | 0 (0.0%) |
| 3 or 4 Children | 10 (100.0%) | 0 (0.0%) |
| 5 or more Children | 5 (100.0%) | 0 (0.0%) |
| Total | 272 (100.0%) | 0 (0.0%) |
Income Below Poverty Among Single-Parent Households in Sandia Knolls
| Children | Single Father | Single Mother |
| No Children | 0 (0.0%) | 0 (0.0%) |
| 1 or 2 Children | 0 (0.0%) | 0 (0.0%) |
| 3 or 4 Children | 0 (0.0%) | 0 (0.0%) |
| 5 or more Children | 0 (0.0%) | 0 (0.0%) |
| Total | 0 (0.0%) | 0 (0.0%) |
Income Below Poverty Among Married-Couple vs Single-Parent Households in Sandia Knolls
| Children | Married-Couple Families | Single-Parent Households |
| No Children | 0 (0.0%) | 0 (0.0%) |
| 1 or 2 Children | 0 (0.0%) | 0 (0.0%) |
| 3 or 4 Children | 0 (0.0%) | 0 (0.0%) |
| 5 or more Children | 0 (0.0%) | 0 (0.0%) |
| Total | 0 (0.0%) | 0 (0.0%) |
Race in Sandia Knolls
The most populous races in Sandia Knolls are White / Caucasian (1,252 | 88.8%), Hispanic or Latino (224 | 15.9%), and Some other Race (70 | 5.0%).
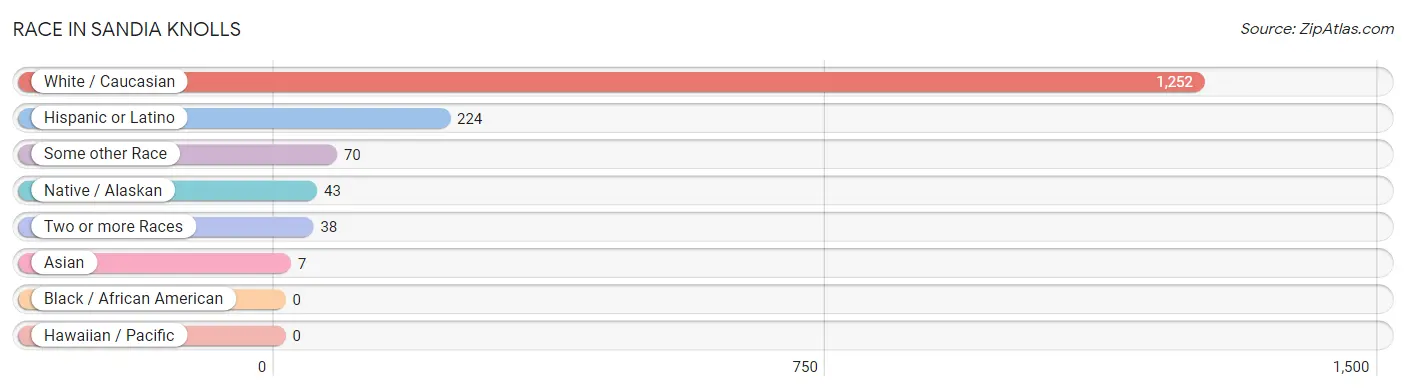
| Race | # Population | % Population |
| Asian | 7 | 0.5% |
| Black / African American | 0 | 0.0% |
| Hawaiian / Pacific | 0 | 0.0% |
| Hispanic or Latino | 224 | 15.9% |
| Native / Alaskan | 43 | 3.0% |
| White / Caucasian | 1,252 | 88.8% |
| Two or more Races | 38 | 2.7% |
| Some other Race | 70 | 5.0% |
| Total | 1,410 | 100.0% |
Ancestry in Sandia Knolls
The most populous ancestries reported in Sandia Knolls are German (186 | 13.2%), English (145 | 10.3%), American (115 | 8.2%), Irish (113 | 8.0%), and Mexican (109 | 7.7%), together accounting for 47.4% of all Sandia Knolls residents.
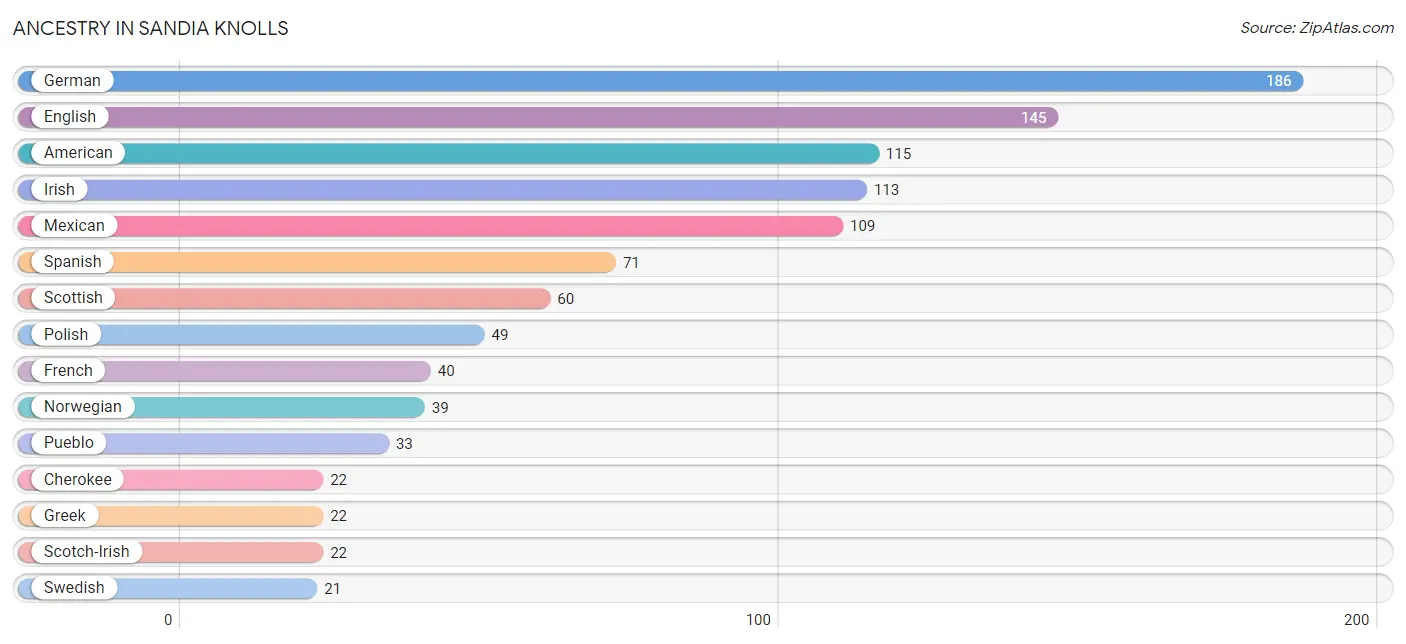
| Ancestry | # Population | % Population |
| American | 115 | 8.2% |
| Bhutanese | 17 | 1.2% |
| Cherokee | 22 | 1.6% |
| English | 145 | 10.3% |
| Finnish | 16 | 1.1% |
| French | 40 | 2.8% |
| French Canadian | 10 | 0.7% |
| German | 186 | 13.2% |
| Greek | 22 | 1.6% |
| Indian (Asian) | 8 | 0.6% |
| Irish | 113 | 8.0% |
| Italian | 20 | 1.4% |
| Mexican | 109 | 7.7% |
| Navajo | 12 | 0.9% |
| Northern European | 16 | 1.1% |
| Norwegian | 39 | 2.8% |
| Polish | 49 | 3.5% |
| Pueblo | 33 | 2.3% |
| Russian | 10 | 0.7% |
| Scotch-Irish | 22 | 1.6% |
| Scottish | 60 | 4.3% |
| Sioux | 10 | 0.7% |
| Spaniard | 5 | 0.4% |
| Spanish | 71 | 5.0% |
| Swedish | 21 | 1.5% |
| Yugoslavian | 14 | 1.0% | View All 26 Rows |
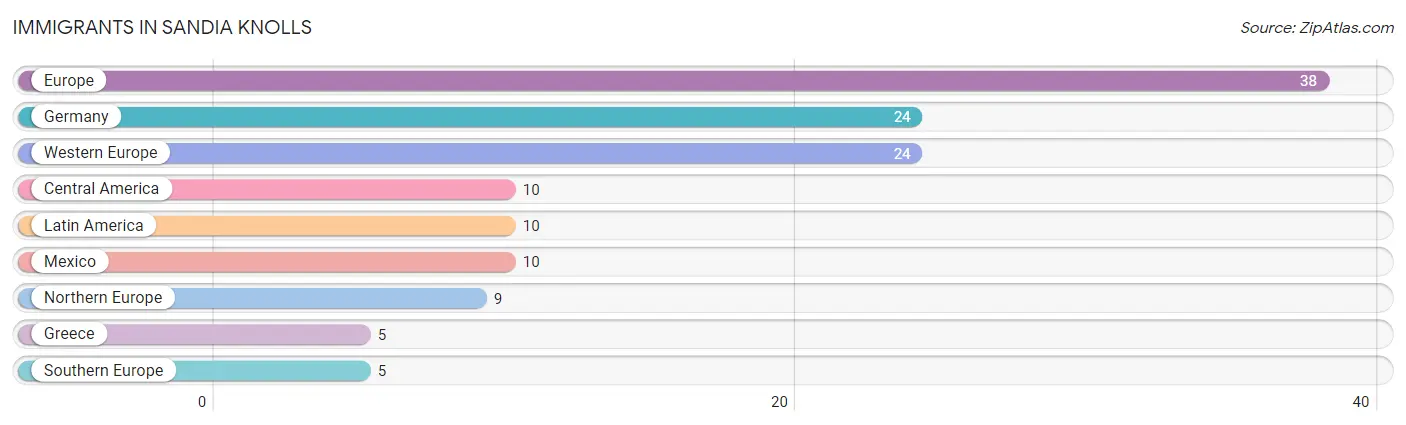
Immigrants in Sandia Knolls
The most numerous immigrant groups reported in Sandia Knolls came from Europe (38 | 2.7%), Germany (24 | 1.7%), Western Europe (24 | 1.7%), Central America (10 | 0.7%), and Latin America (10 | 0.7%), together accounting for 7.5% of all Sandia Knolls residents.
| Immigration Origin | # Population | % Population |
| Central America | 10 | 0.7% |
| Europe | 38 | 2.7% |
| Germany | 24 | 1.7% |
| Greece | 5 | 0.4% |
| Latin America | 10 | 0.7% |
| Mexico | 10 | 0.7% |
| Northern Europe | 9 | 0.6% |
| Southern Europe | 5 | 0.4% |
| Western Europe | 24 | 1.7% | View All 9 Rows |
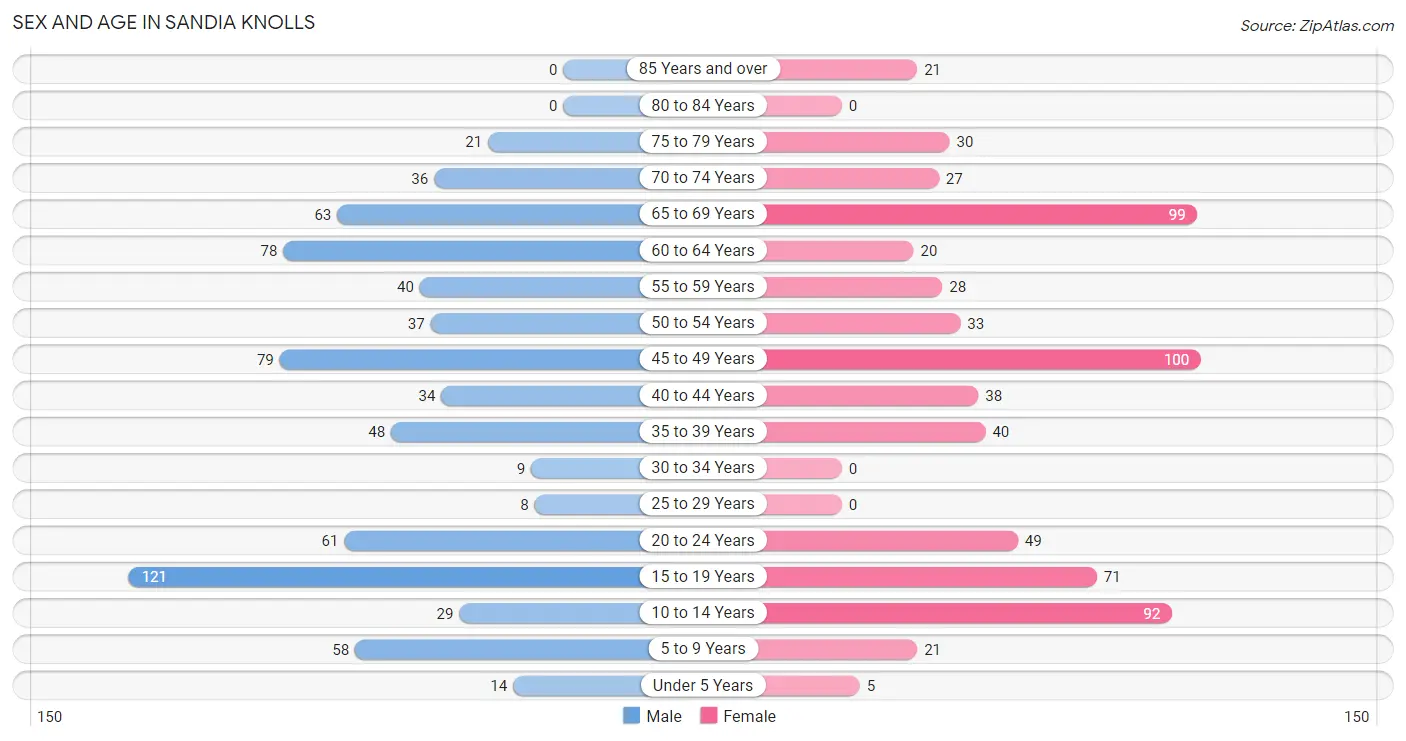
Sex and Age in Sandia Knolls
Sex and Age in Sandia Knolls
The most populous age groups in Sandia Knolls are 15 to 19 Years (121 | 16.4%) for men and 45 to 49 Years (100 | 14.8%) for women.
| Age Bracket | Male | Female |
| Under 5 Years | 14 (1.9%) | 5 (0.7%) |
| 5 to 9 Years | 58 (7.9%) | 21 (3.1%) |
| 10 to 14 Years | 29 (3.9%) | 92 (13.7%) |
| 15 to 19 Years | 121 (16.4%) | 71 (10.5%) |
| 20 to 24 Years | 61 (8.3%) | 49 (7.3%) |
| 25 to 29 Years | 8 (1.1%) | 0 (0.0%) |
| 30 to 34 Years | 9 (1.2%) | 0 (0.0%) |
| 35 to 39 Years | 48 (6.5%) | 40 (5.9%) |
| 40 to 44 Years | 34 (4.6%) | 38 (5.6%) |
| 45 to 49 Years | 79 (10.7%) | 100 (14.8%) |
| 50 to 54 Years | 37 (5.0%) | 33 (4.9%) |
| 55 to 59 Years | 40 (5.4%) | 28 (4.2%) |
| 60 to 64 Years | 78 (10.6%) | 20 (3.0%) |
| 65 to 69 Years | 63 (8.6%) | 99 (14.7%) |
| 70 to 74 Years | 36 (4.9%) | 27 (4.0%) |
| 75 to 79 Years | 21 (2.9%) | 30 (4.4%) |
| 80 to 84 Years | 0 (0.0%) | 0 (0.0%) |
| 85 Years and over | 0 (0.0%) | 21 (3.1%) |
| Total | 736 (100.0%) | 674 (100.0%) |
Families and Households in Sandia Knolls
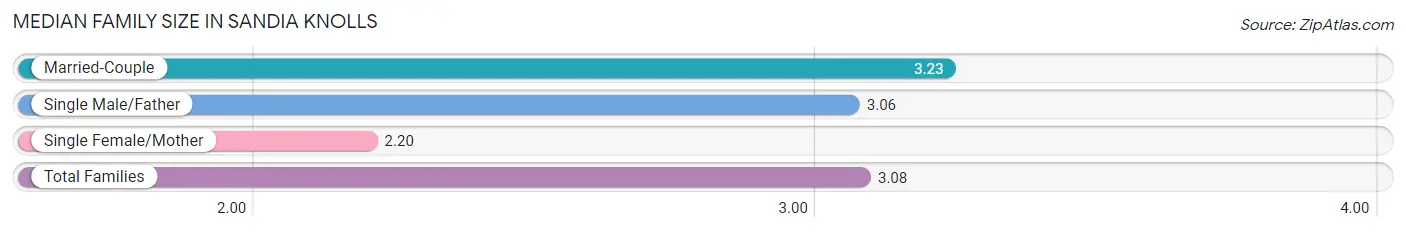
Median Family Size in Sandia Knolls
The median family size in Sandia Knolls is 3.08 persons per family, with married-couple families (272 | 70.8%) accounting for the largest median family size of 3.23 persons per family. On the other hand, single female/mother families (45 | 11.7%) represent the smallest median family size with 2.20 persons per family.
| Family Type | # Families | Family Size |
| Married-Couple | 272 (70.8%) | 3.23 |
| Single Male/Father | 67 (17.4%) | 3.06 |
| Single Female/Mother | 45 (11.7%) | 2.20 |
| Total Families | 384 (100.0%) | 3.08 |
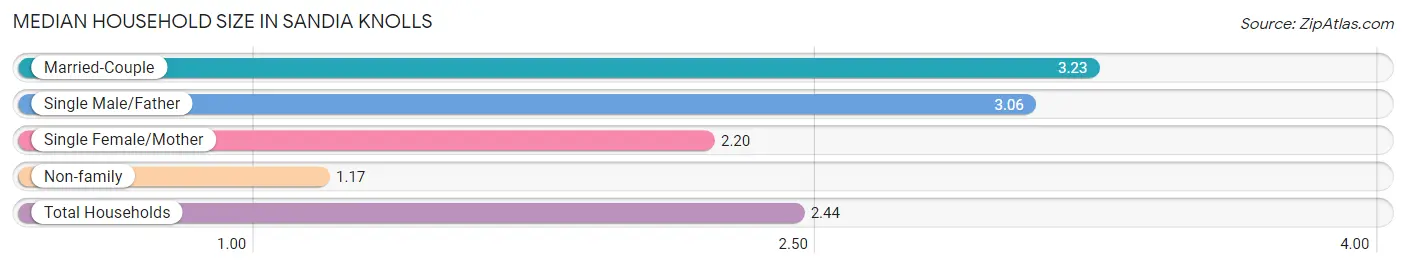
Median Household Size in Sandia Knolls
The median household size in Sandia Knolls is 2.44 persons per household, with married-couple households (272 | 47.1%) accounting for the largest median household size of 3.23 persons per household. non-family households (194 | 33.6%) represent the smallest median household size with 1.17 persons per household.
| Household Type | # Households | Household Size |
| Married-Couple | 272 (47.1%) | 3.23 |
| Single Male/Father | 67 (11.6%) | 3.06 |
| Single Female/Mother | 45 (7.8%) | 2.20 |
| Non-family | 194 (33.6%) | 1.17 |
| Total Households | 578 (100.0%) | 2.44 |
Household Size by Marriage Status in Sandia Knolls
Out of a total of 578 households in Sandia Knolls, 384 (66.4%) are family households, while 194 (33.6%) are nonfamily households. The most numerous type of family households are 2-person households, comprising 235, and the most common type of nonfamily households are 1-person households, comprising 162.
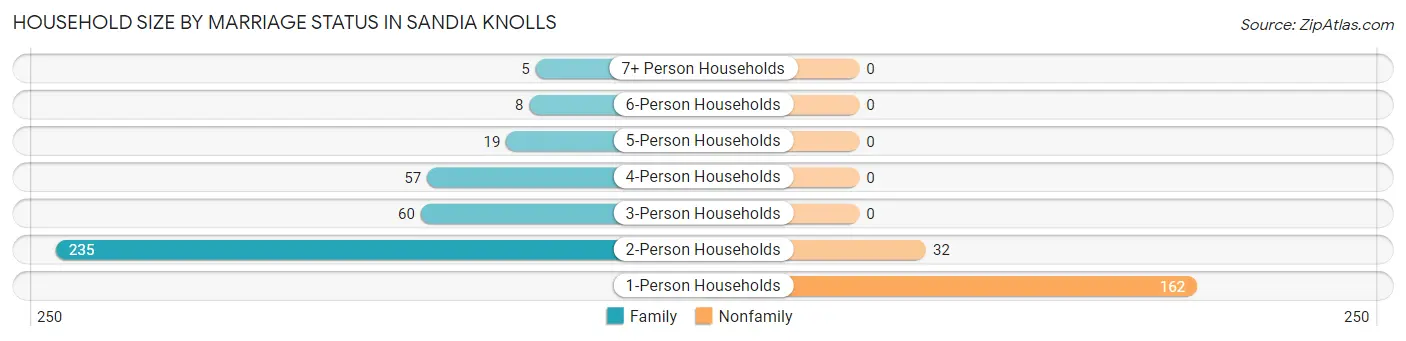
| Household Size | Family Households | Nonfamily Households |
| 1-Person Households | - | 162 (28.0%) |
| 2-Person Households | 235 (40.7%) | 32 (5.5%) |
| 3-Person Households | 60 (10.4%) | 0 (0.0%) |
| 4-Person Households | 57 (9.9%) | 0 (0.0%) |
| 5-Person Households | 19 (3.3%) | 0 (0.0%) |
| 6-Person Households | 8 (1.4%) | 0 (0.0%) |
| 7+ Person Households | 5 (0.9%) | 0 (0.0%) |
| Total | 384 (66.4%) | 194 (33.6%) |
Female Fertility in Sandia Knolls
Fertility by Age in Sandia Knolls
Average fertility rate in Sandia Knolls is 37.0 births per 1,000 women. Women in the age bracket of 20 to 34 years have the highest fertility rate with 224.0 births per 1,000 women. Women in the age bracket of 20 to 34 years acount for 100.0% of all women with births.
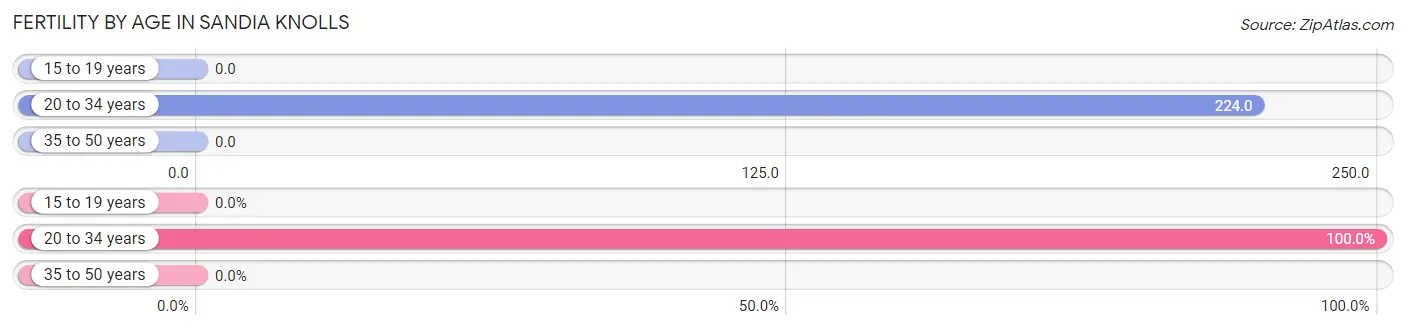
| Age Bracket | Women with Births | Births / 1,000 Women |
| 15 to 19 years | 0 (0.0%) | 0.0 |
| 20 to 34 years | 11 (100.0%) | 224.0 |
| 35 to 50 years | 0 (0.0%) | 0.0 |
| Total | 11 (100.0%) | 37.0 |
Fertility by Age by Marriage Status in Sandia Knolls
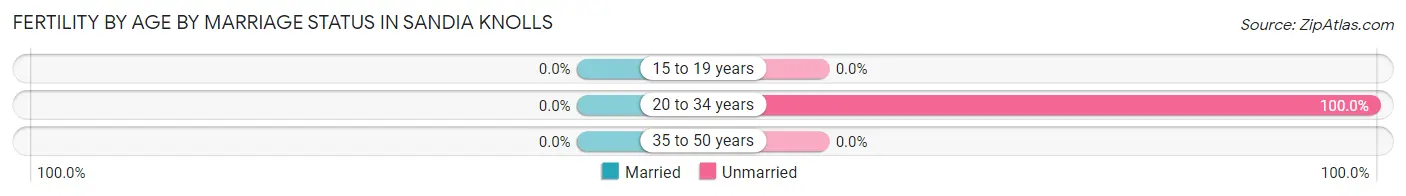
| Age Bracket | Married | Unmarried |
| 15 to 19 years | 0 (0.0%) | 0 (0.0%) |
| 20 to 34 years | 0 (0.0%) | 11 (100.0%) |
| 35 to 50 years | 0 (0.0%) | 0 (0.0%) |
| Total | 0 (0.0%) | 11 (100.0%) |
Fertility by Education in Sandia Knolls
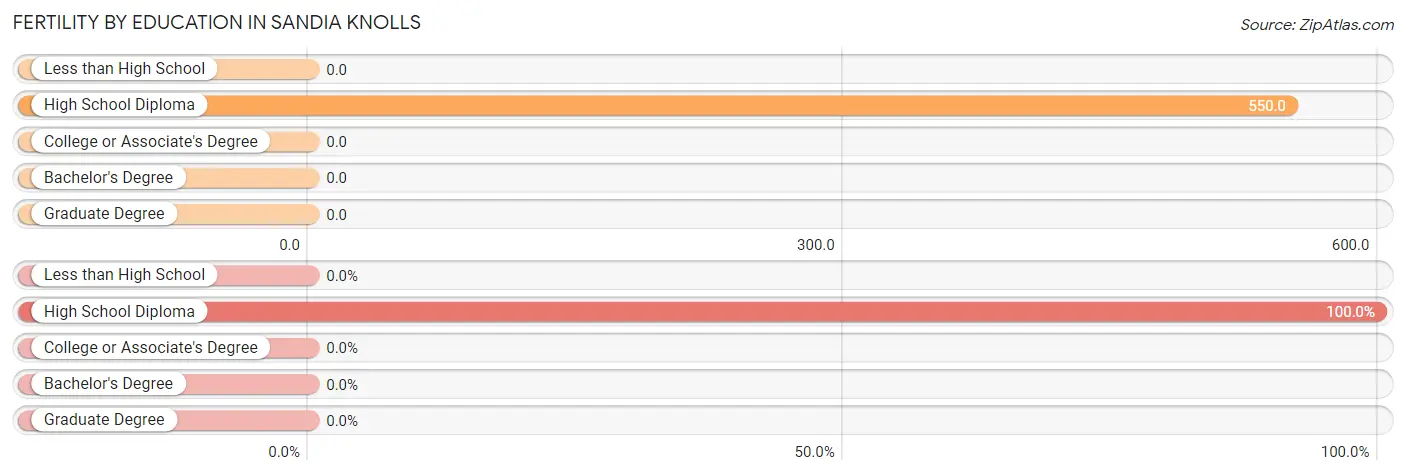
| Educational Attainment | Women with Births | Births / 1,000 Women |
| Less than High School | 0 (0.0%) | 0.0 |
| High School Diploma | 11 (100.0%) | 550.0 |
| College or Associate's Degree | 0 (0.0%) | 0.0 |
| Bachelor's Degree | 0 (0.0%) | 0.0 |
| Graduate Degree | 0 (0.0%) | 0.0 |
| Total | 11 (100.0%) | 37.0 |
Fertility by Education by Marriage Status in Sandia Knolls
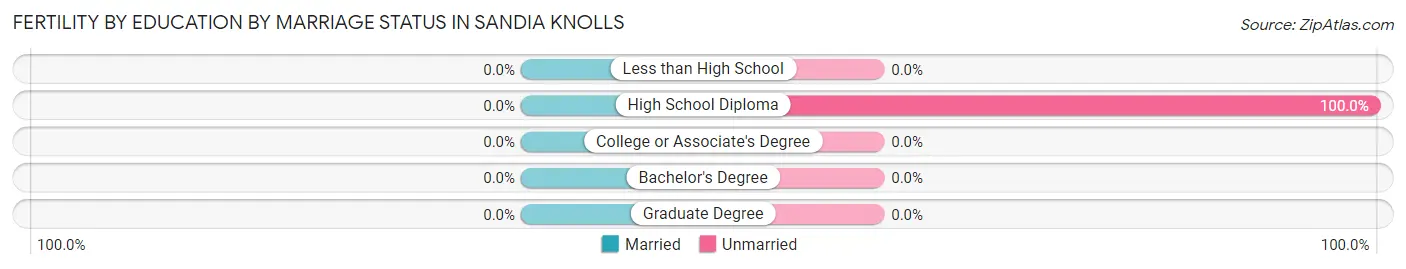
| Educational Attainment | Married | Unmarried |
| Less than High School | 0 (0.0%) | 0 (0.0%) |
| High School Diploma | 0 (0.0%) | 11 (100.0%) |
| College or Associate's Degree | 0 (0.0%) | 0 (0.0%) |
| Bachelor's Degree | 0 (0.0%) | 0 (0.0%) |
| Graduate Degree | 0 (0.0%) | 0 (0.0%) |
| Total | 0 (0.0%) | 11 (100.0%) |
Employment Characteristics in Sandia Knolls
Employment by Class of Employer in Sandia Knolls
Among the 740 employed individuals in Sandia Knolls, private company employees (406 | 54.9%), local government employees (101 | 13.7%), and self-employed (not incorporated) (81 | 11.0%) make up the most common classes of employment.
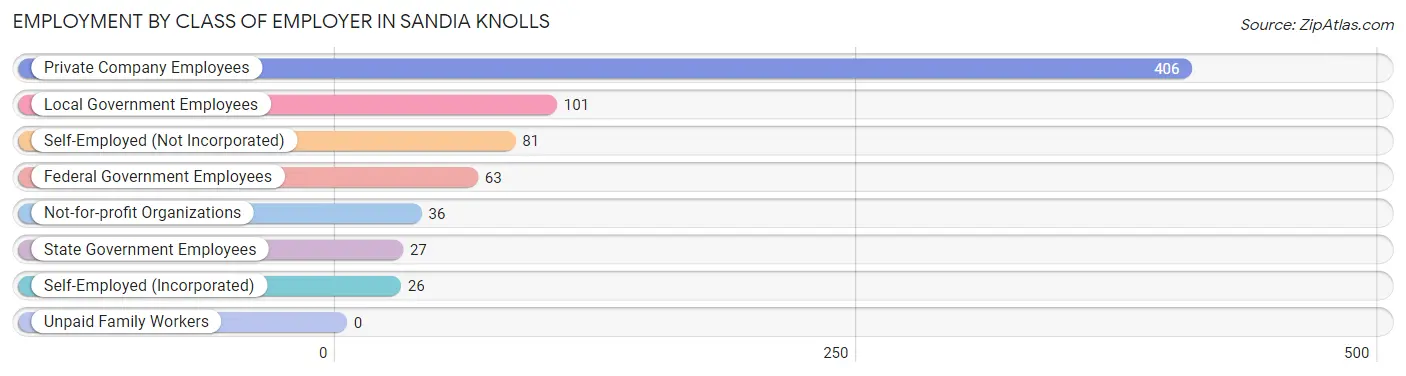
| Employer Class | # Employees | % Employees |
| Private Company Employees | 406 | 54.9% |
| Self-Employed (Incorporated) | 26 | 3.5% |
| Self-Employed (Not Incorporated) | 81 | 11.0% |
| Not-for-profit Organizations | 36 | 4.9% |
| Local Government Employees | 101 | 13.7% |
| State Government Employees | 27 | 3.6% |
| Federal Government Employees | 63 | 8.5% |
| Unpaid Family Workers | 0 | 0.0% |
| Total | 740 | 100.0% |
Employment Status by Age in Sandia Knolls
According to the labor force statistics for Sandia Knolls, out of the total population over 16 years of age (1,154), 68.4% or 789 individuals are in the labor force, with 3.2% or 25 of them unemployed. The age group with the highest labor force participation rate is 25 to 29 years, with 100.0% or 8 individuals in the labor force. Within the labor force, the 65 to 74 years age range has the highest percentage of unemployed individuals, with 14.3% or 10 of them being unemployed.
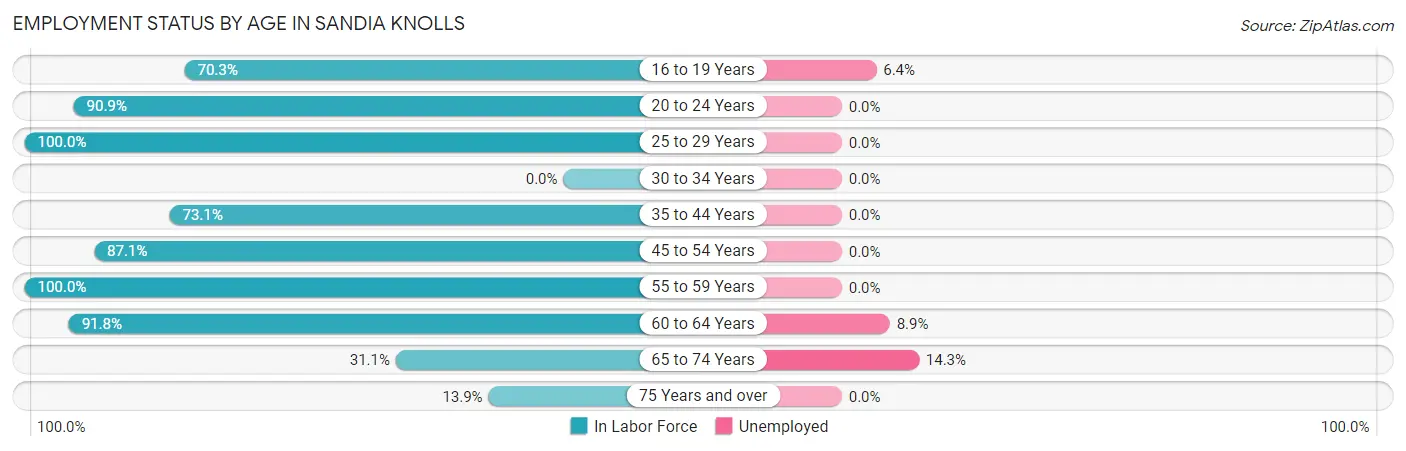
| Age Bracket | In Labor Force | Unemployed |
| 16 to 19 Years | 109 (70.3%) | 7 (6.4%) |
| 20 to 24 Years | 100 (90.9%) | 0 (0.0%) |
| 25 to 29 Years | 8 (100.0%) | 0 (0.0%) |
| 30 to 34 Years | 0 (0.0%) | 0 (0.0%) |
| 35 to 44 Years | 117 (73.1%) | 0 (0.0%) |
| 45 to 54 Years | 217 (87.1%) | 0 (0.0%) |
| 55 to 59 Years | 68 (100.0%) | 0 (0.0%) |
| 60 to 64 Years | 90 (91.8%) | 8 (8.9%) |
| 65 to 74 Years | 70 (31.1%) | 10 (14.3%) |
| 75 Years and over | 10 (13.9%) | 0 (0.0%) |
| Total | 789 (68.4%) | 25 (3.2%) |
Employment Status by Educational Attainment in Sandia Knolls
According to labor force statistics for Sandia Knolls, 84.5% of individuals (500) out of the total population between 25 and 64 years of age (592) are in the labor force, with 1.6% or 8 of them being unemployed. The group with the highest labor force participation rate are those with the educational attainment of college / associate degree, with 97.8% or 219 individuals in the labor force. Within the labor force, individuals with college / associate degree education have the highest percentage of unemployment, with 3.7% or 8 of them being unemployed.
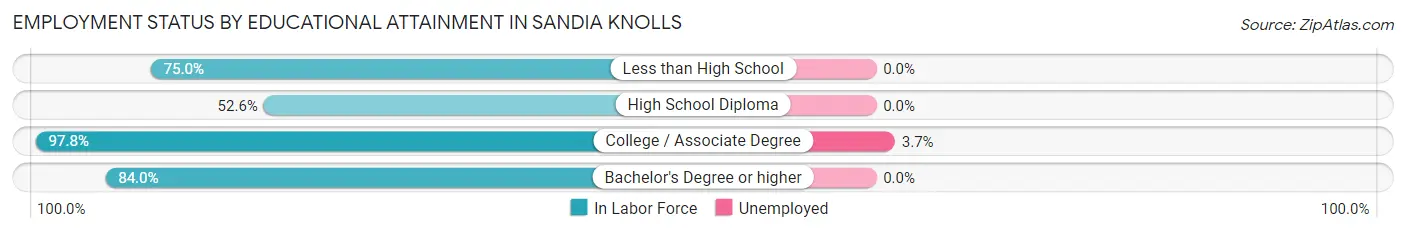
| Educational Attainment | In Labor Force | Unemployed |
| Less than High School | 36 (75.0%) | 0 (0.0%) |
| High School Diploma | 40 (52.6%) | 0 (0.0%) |
| College / Associate Degree | 219 (97.8%) | 8 (3.7%) |
| Bachelor's Degree or higher | 205 (84.0%) | 0 (0.0%) |
| Total | 500 (84.5%) | 9 (1.6%) |
Employment Occupations by Sex in Sandia Knolls
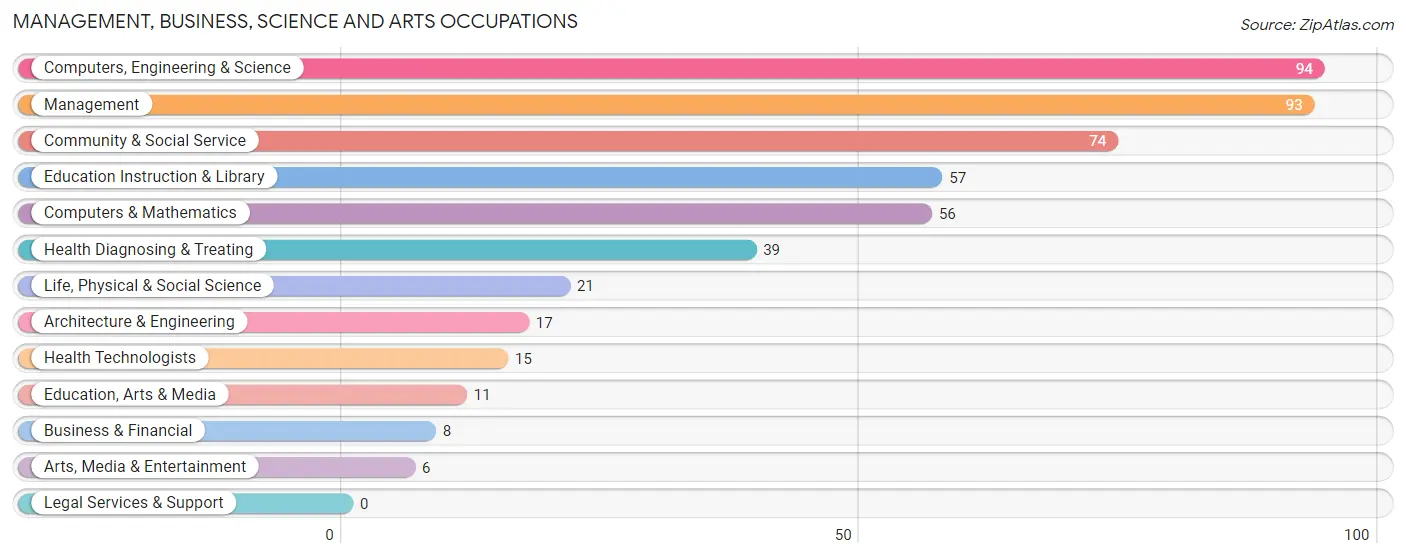
Management, Business, Science and Arts Occupations
The most common Management, Business, Science and Arts occupations in Sandia Knolls are Computers, Engineering & Science (94 | 12.3%), Management (93 | 12.2%), Community & Social Service (74 | 9.7%), Education Instruction & Library (57 | 7.5%), and Computers & Mathematics (56 | 7.3%).
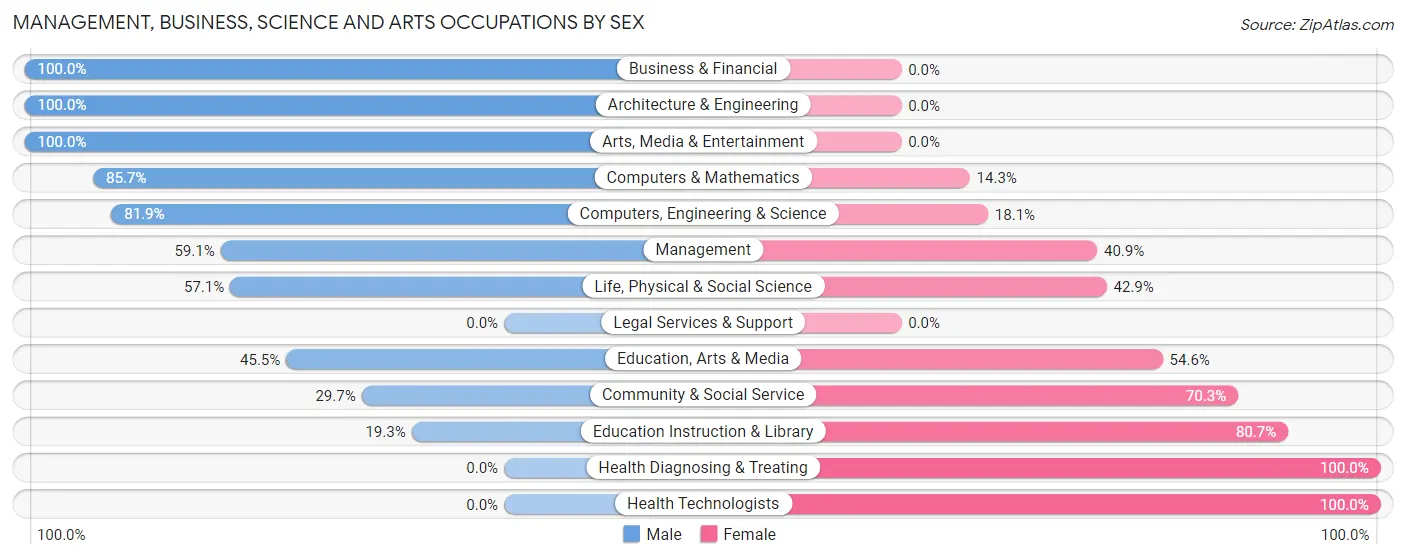
Management, Business, Science and Arts Occupations by Sex
Within the Management, Business, Science and Arts occupations in Sandia Knolls, the most male-oriented occupations are Business & Financial (100.0%), Architecture & Engineering (100.0%), and Arts, Media & Entertainment (100.0%), while the most female-oriented occupations are Health Diagnosing & Treating (100.0%), Health Technologists (100.0%), and Education Instruction & Library (80.7%).
| Occupation | Male | Female |
| Management | 55 (59.1%) | 38 (40.9%) |
| Business & Financial | 8 (100.0%) | 0 (0.0%) |
| Computers, Engineering & Science | 77 (81.9%) | 17 (18.1%) |
| Computers & Mathematics | 48 (85.7%) | 8 (14.3%) |
| Architecture & Engineering | 17 (100.0%) | 0 (0.0%) |
| Life, Physical & Social Science | 12 (57.1%) | 9 (42.9%) |
| Community & Social Service | 22 (29.7%) | 52 (70.3%) |
| Education, Arts & Media | 5 (45.5%) | 6 (54.5%) |
| Legal Services & Support | 0 (0.0%) | 0 (0.0%) |
| Education Instruction & Library | 11 (19.3%) | 46 (80.7%) |
| Arts, Media & Entertainment | 6 (100.0%) | 0 (0.0%) |
| Health Diagnosing & Treating | 0 (0.0%) | 39 (100.0%) |
| Health Technologists | 0 (0.0%) | 15 (100.0%) |
| Total (Category) | 162 (52.6%) | 146 (47.4%) |
| Total (Overall) | 456 (59.7%) | 308 (40.3%) |
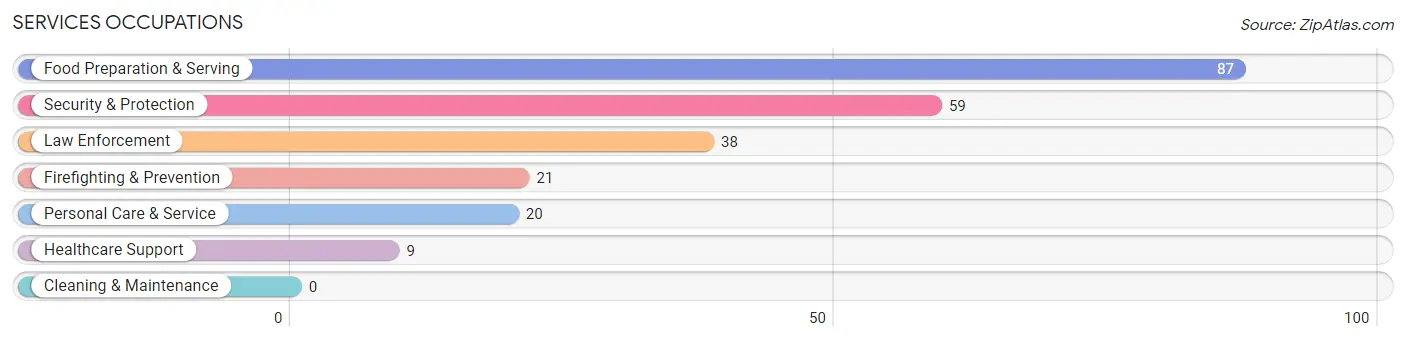
Services Occupations
The most common Services occupations in Sandia Knolls are Food Preparation & Serving (87 | 11.4%), Security & Protection (59 | 7.7%), Law Enforcement (38 | 5.0%), Firefighting & Prevention (21 | 2.8%), and Personal Care & Service (20 | 2.6%).
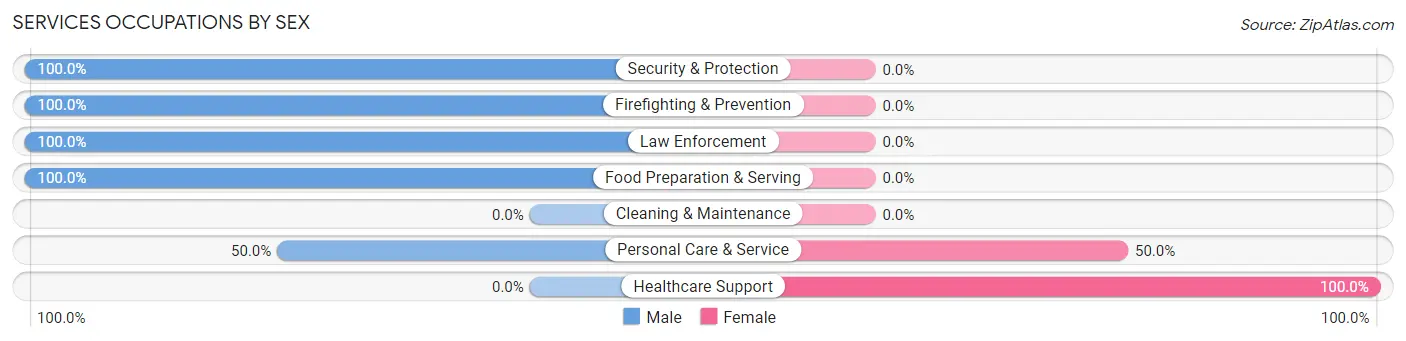
Services Occupations by Sex
Within the Services occupations in Sandia Knolls, the most male-oriented occupations are Security & Protection (100.0%), Firefighting & Prevention (100.0%), and Law Enforcement (100.0%), while the most female-oriented occupations are Healthcare Support (100.0%), and Personal Care & Service (50.0%).
| Occupation | Male | Female |
| Healthcare Support | 0 (0.0%) | 9 (100.0%) |
| Security & Protection | 59 (100.0%) | 0 (0.0%) |
| Firefighting & Prevention | 21 (100.0%) | 0 (0.0%) |
| Law Enforcement | 38 (100.0%) | 0 (0.0%) |
| Food Preparation & Serving | 87 (100.0%) | 0 (0.0%) |
| Cleaning & Maintenance | 0 (0.0%) | 0 (0.0%) |
| Personal Care & Service | 10 (50.0%) | 10 (50.0%) |
| Total (Category) | 156 (89.1%) | 19 (10.9%) |
| Total (Overall) | 456 (59.7%) | 308 (40.3%) |
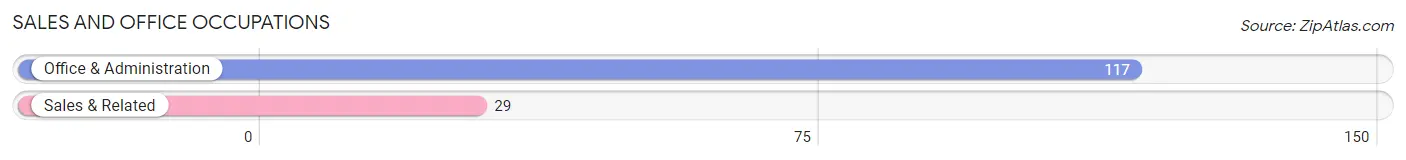
Sales and Office Occupations
The most common Sales and Office occupations in Sandia Knolls are Office & Administration (117 | 15.3%), and Sales & Related (29 | 3.8%).
Sales and Office Occupations by Sex
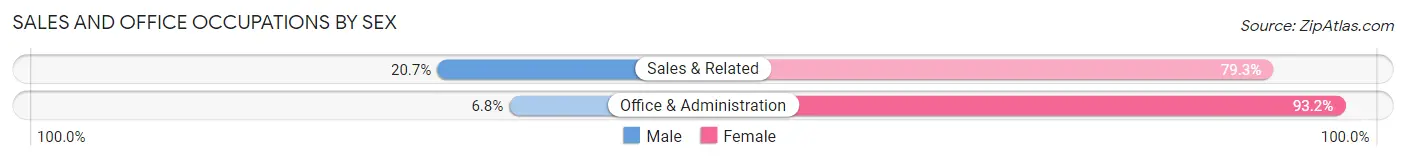
| Occupation | Male | Female |
| Sales & Related | 6 (20.7%) | 23 (79.3%) |
| Office & Administration | 8 (6.8%) | 109 (93.2%) |
| Total (Category) | 14 (9.6%) | 132 (90.4%) |
| Total (Overall) | 456 (59.7%) | 308 (40.3%) |
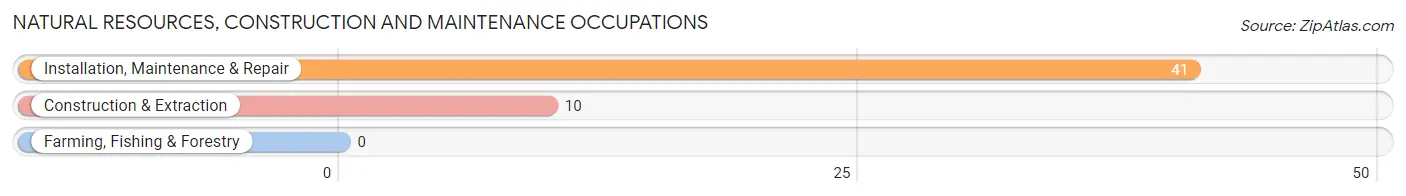
Natural Resources, Construction and Maintenance Occupations
The most common Natural Resources, Construction and Maintenance occupations in Sandia Knolls are Installation, Maintenance & Repair (41 | 5.4%), and Construction & Extraction (10 | 1.3%).
Natural Resources, Construction and Maintenance Occupations by Sex
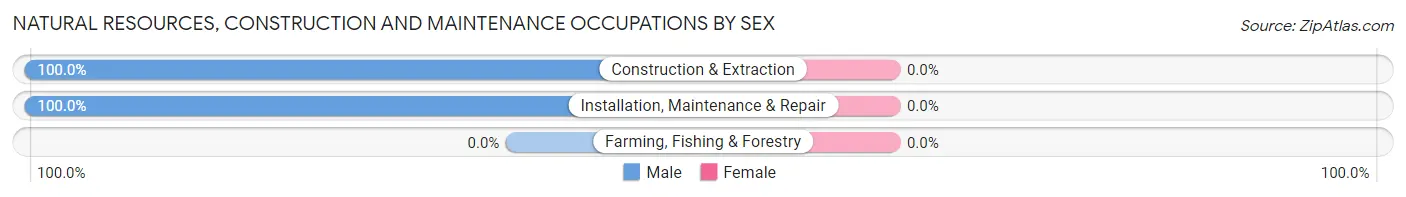
| Occupation | Male | Female |
| Farming, Fishing & Forestry | 0 (0.0%) | 0 (0.0%) |
| Construction & Extraction | 10 (100.0%) | 0 (0.0%) |
| Installation, Maintenance & Repair | 41 (100.0%) | 0 (0.0%) |
| Total (Category) | 51 (100.0%) | 0 (0.0%) |
| Total (Overall) | 456 (59.7%) | 308 (40.3%) |
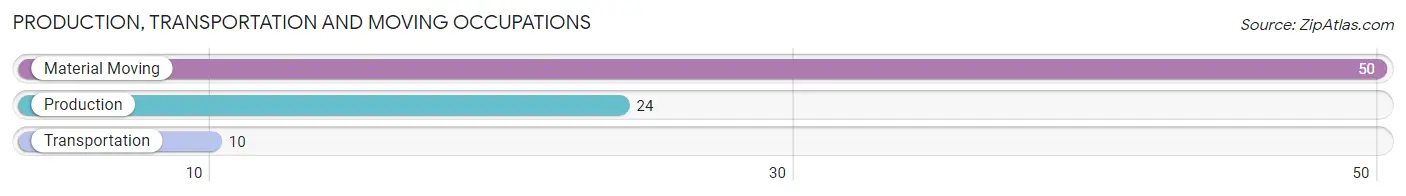
Production, Transportation and Moving Occupations
The most common Production, Transportation and Moving occupations in Sandia Knolls are Material Moving (50 | 6.5%), Production (24 | 3.1%), and Transportation (10 | 1.3%).
Production, Transportation and Moving Occupations by Sex
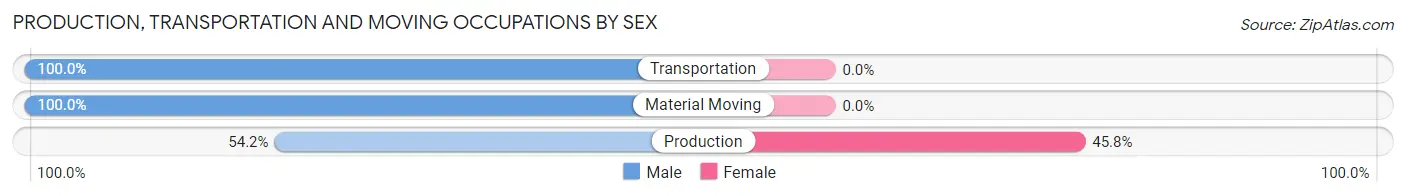
| Occupation | Male | Female |
| Production | 13 (54.2%) | 11 (45.8%) |
| Transportation | 10 (100.0%) | 0 (0.0%) |
| Material Moving | 50 (100.0%) | 0 (0.0%) |
| Total (Category) | 73 (86.9%) | 11 (13.1%) |
| Total (Overall) | 456 (59.7%) | 308 (40.3%) |
Employment Industries by Sex in Sandia Knolls
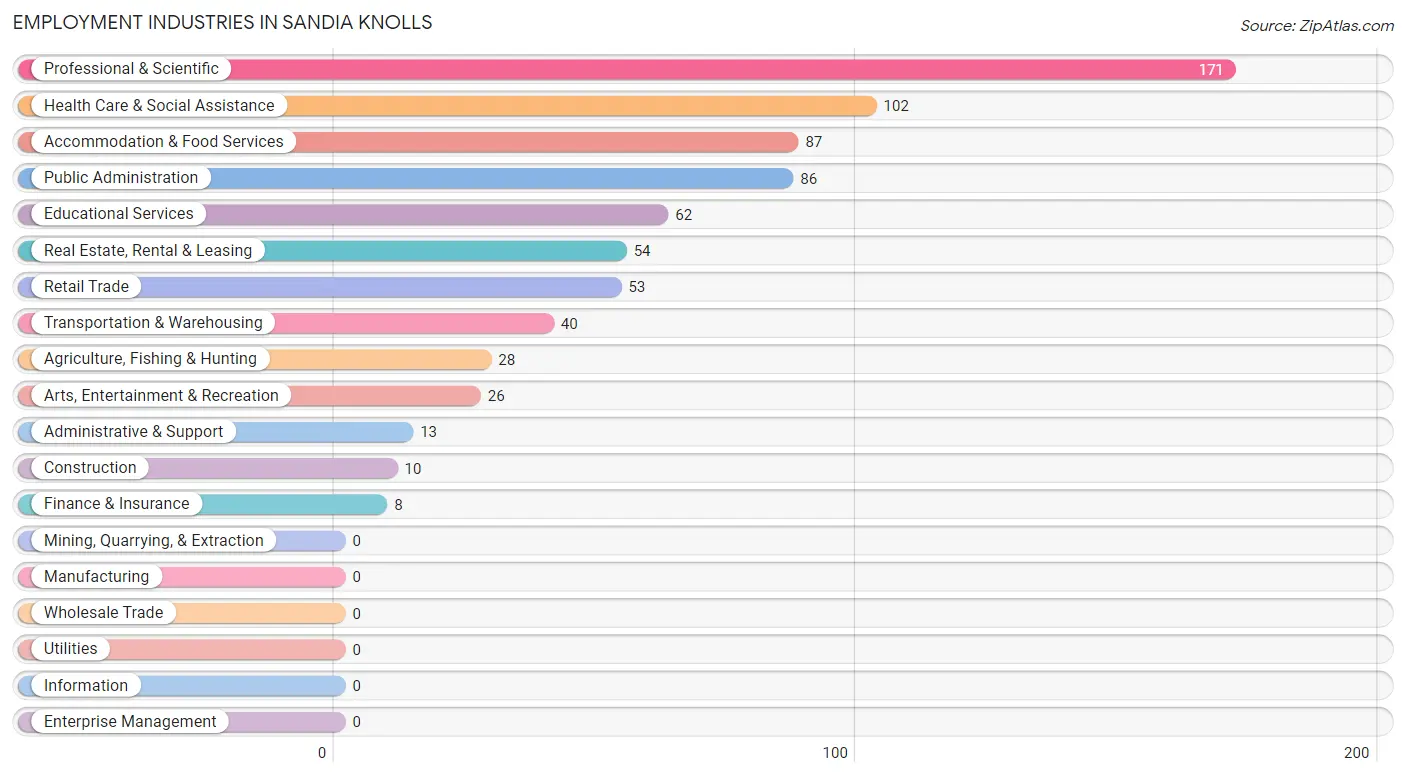
Employment Industries in Sandia Knolls
The major employment industries in Sandia Knolls include Professional & Scientific (171 | 22.4%), Health Care & Social Assistance (102 | 13.4%), Accommodation & Food Services (87 | 11.4%), Public Administration (86 | 11.3%), and Educational Services (62 | 8.1%).
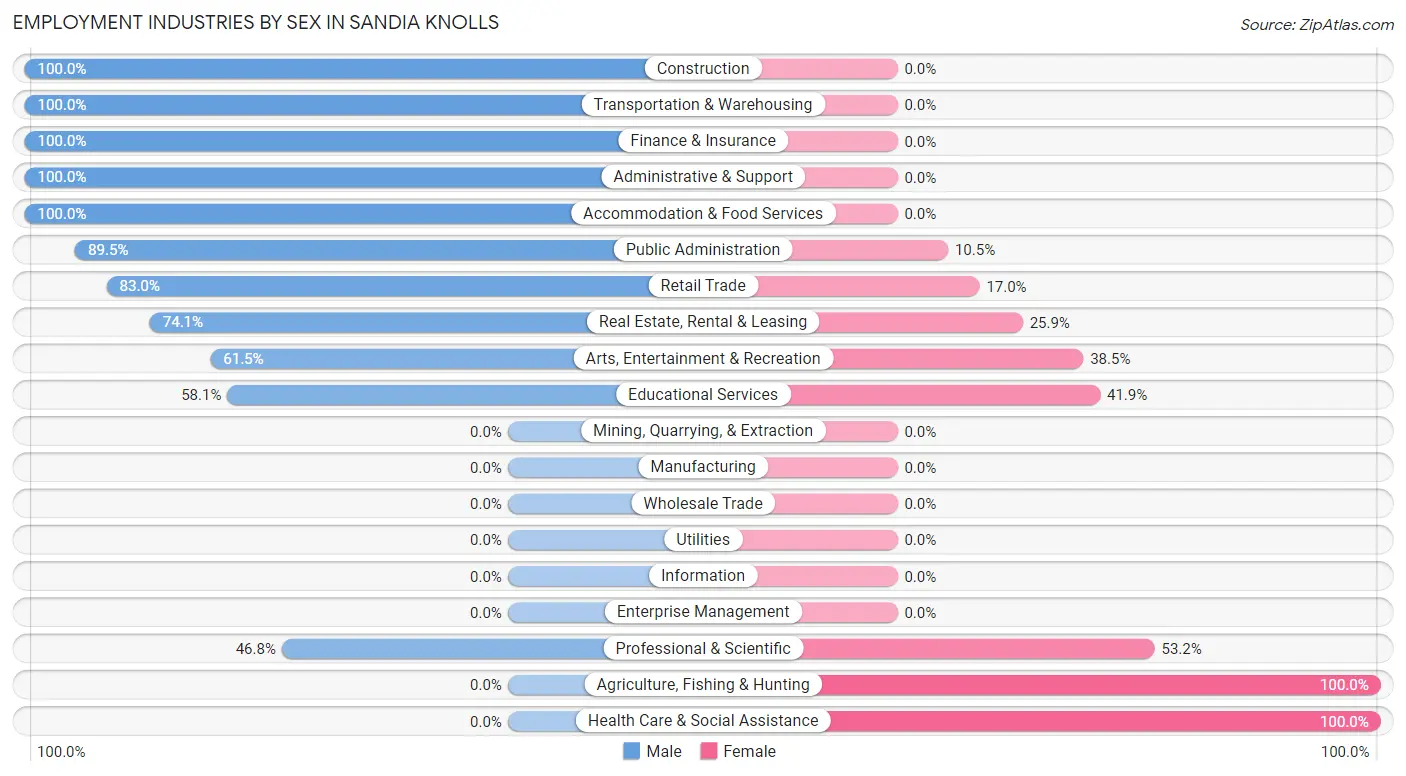
Employment Industries by Sex in Sandia Knolls
The Sandia Knolls industries that see more men than women are Construction (100.0%), Transportation & Warehousing (100.0%), and Finance & Insurance (100.0%), whereas the industries that tend to have a higher number of women are Agriculture, Fishing & Hunting (100.0%), Health Care & Social Assistance (100.0%), and Professional & Scientific (53.2%).
| Industry | Male | Female |
| Agriculture, Fishing & Hunting | 0 (0.0%) | 28 (100.0%) |
| Mining, Quarrying, & Extraction | 0 (0.0%) | 0 (0.0%) |
| Construction | 10 (100.0%) | 0 (0.0%) |
| Manufacturing | 0 (0.0%) | 0 (0.0%) |
| Wholesale Trade | 0 (0.0%) | 0 (0.0%) |
| Retail Trade | 44 (83.0%) | 9 (17.0%) |
| Transportation & Warehousing | 40 (100.0%) | 0 (0.0%) |
| Utilities | 0 (0.0%) | 0 (0.0%) |
| Information | 0 (0.0%) | 0 (0.0%) |
| Finance & Insurance | 8 (100.0%) | 0 (0.0%) |
| Real Estate, Rental & Leasing | 40 (74.1%) | 14 (25.9%) |
| Professional & Scientific | 80 (46.8%) | 91 (53.2%) |
| Enterprise Management | 0 (0.0%) | 0 (0.0%) |
| Administrative & Support | 13 (100.0%) | 0 (0.0%) |
| Educational Services | 36 (58.1%) | 26 (41.9%) |
| Health Care & Social Assistance | 0 (0.0%) | 102 (100.0%) |
| Arts, Entertainment & Recreation | 16 (61.5%) | 10 (38.5%) |
| Accommodation & Food Services | 87 (100.0%) | 0 (0.0%) |
| Public Administration | 77 (89.5%) | 9 (10.5%) |
| Total | 456 (59.7%) | 308 (40.3%) |
Education in Sandia Knolls
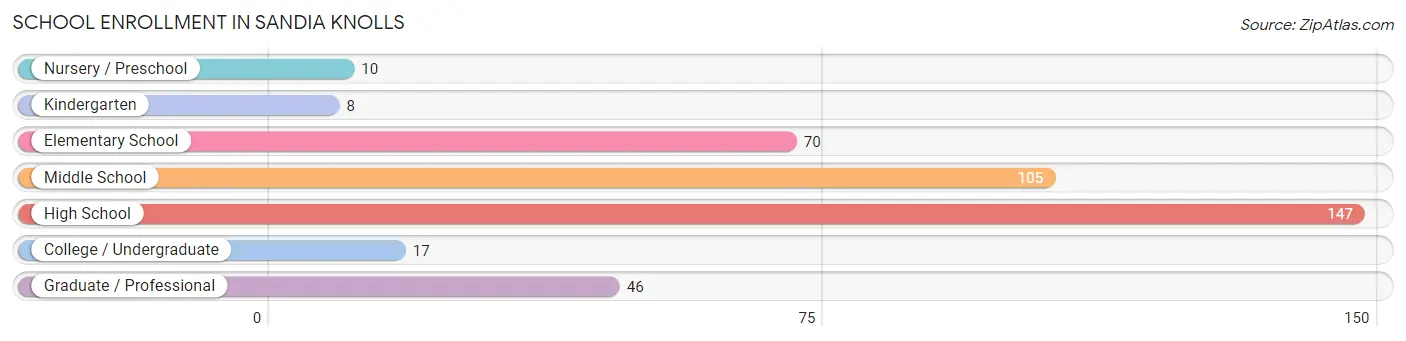
School Enrollment in Sandia Knolls
The most common levels of schooling among the 403 students in Sandia Knolls are high school (147 | 36.5%), middle school (105 | 26.1%), and elementary school (70 | 17.4%).
| School Level | # Students | % Students |
| Nursery / Preschool | 10 | 2.5% |
| Kindergarten | 8 | 2.0% |
| Elementary School | 70 | 17.4% |
| Middle School | 105 | 26.1% |
| High School | 147 | 36.5% |
| College / Undergraduate | 17 | 4.2% |
| Graduate / Professional | 46 | 11.4% |
| Total | 403 | 100.0% |
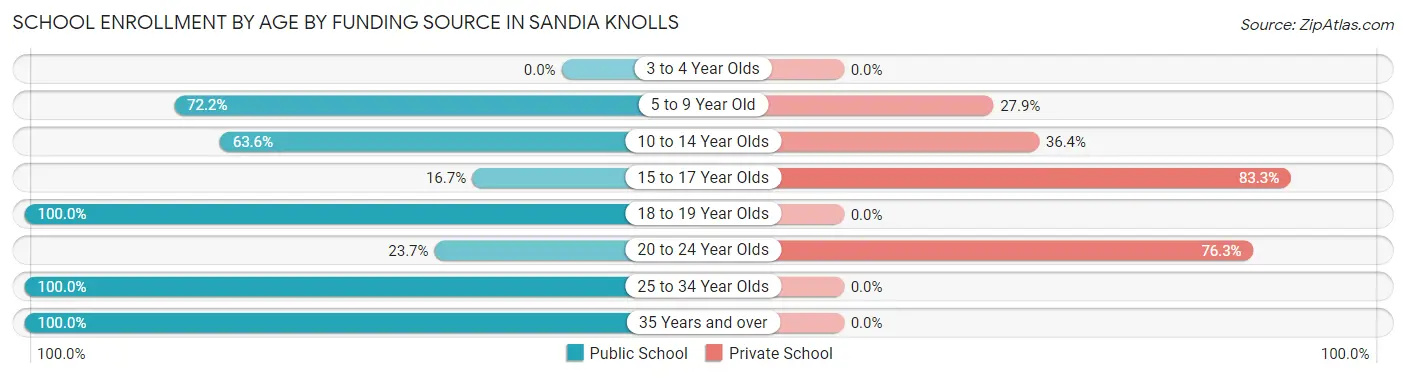
School Enrollment by Age by Funding Source in Sandia Knolls
Out of a total of 403 students who are enrolled in schools in Sandia Knolls, 145 (36.0%) attend a private institution, while the remaining 258 (64.0%) are enrolled in public schools. The age group of 15 to 17 year olds has the highest likelihood of being enrolled in private schools, with 50 (83.3% in the age bracket) enrolled. Conversely, the age group of 18 to 19 year olds has the lowest likelihood of being enrolled in a private school, with 88 (100.0% in the age bracket) attending a public institution.
| Age Bracket | Public School | Private School |
| 3 to 4 Year Olds | 0 (0.0%) | 0 (0.0%) |
| 5 to 9 Year Old | 57 (72.2%) | 22 (27.9%) |
| 10 to 14 Year Olds | 77 (63.6%) | 44 (36.4%) |
| 15 to 17 Year Olds | 10 (16.7%) | 50 (83.3%) |
| 18 to 19 Year Olds | 88 (100.0%) | 0 (0.0%) |
| 20 to 24 Year Olds | 9 (23.7%) | 29 (76.3%) |
| 25 to 34 Year Olds | 8 (100.0%) | 0 (0.0%) |
| 35 Years and over | 9 (100.0%) | 0 (0.0%) |
| Total | 258 (64.0%) | 145 (36.0%) |
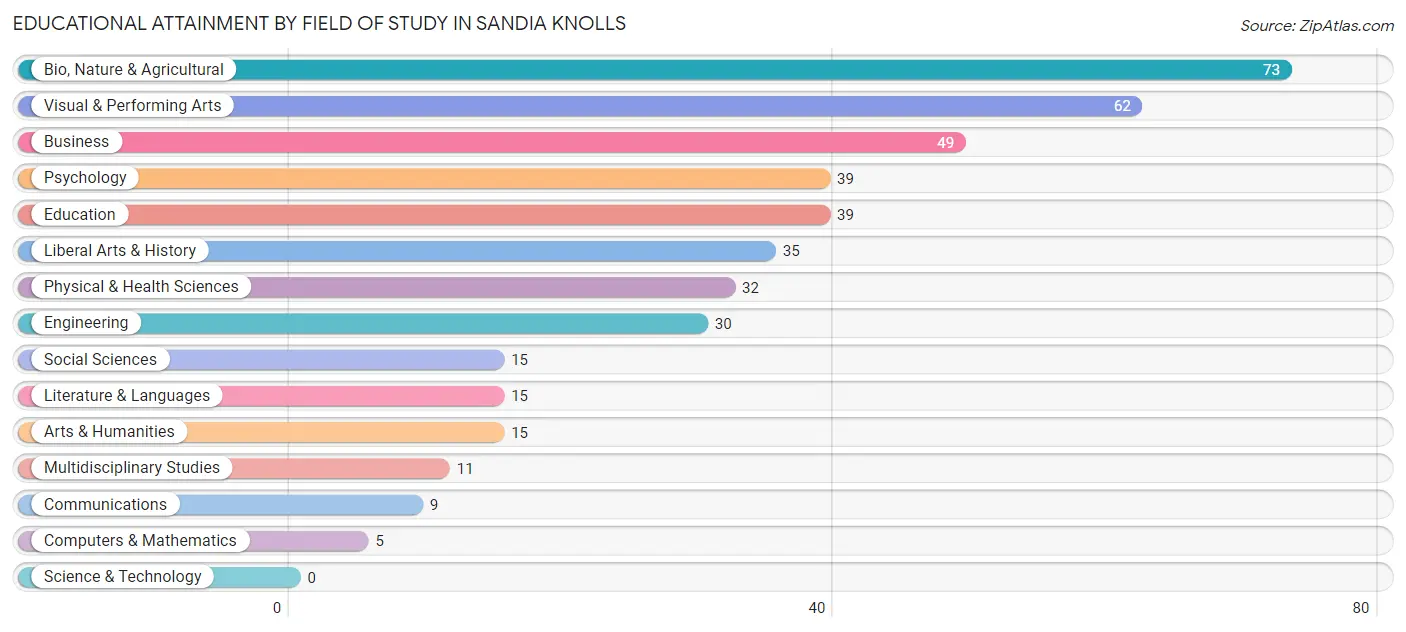
Educational Attainment by Field of Study in Sandia Knolls
Bio, nature & agricultural (73 | 17.0%), visual & performing arts (62 | 14.4%), business (49 | 11.4%), psychology (39 | 9.1%), and education (39 | 9.1%) are the most common fields of study among 429 individuals in Sandia Knolls who have obtained a bachelor's degree or higher.
| Field of Study | # Graduates | % Graduates |
| Computers & Mathematics | 5 | 1.2% |
| Bio, Nature & Agricultural | 73 | 17.0% |
| Physical & Health Sciences | 32 | 7.5% |
| Psychology | 39 | 9.1% |
| Social Sciences | 15 | 3.5% |
| Engineering | 30 | 7.0% |
| Multidisciplinary Studies | 11 | 2.6% |
| Science & Technology | 0 | 0.0% |
| Business | 49 | 11.4% |
| Education | 39 | 9.1% |
| Literature & Languages | 15 | 3.5% |
| Liberal Arts & History | 35 | 8.2% |
| Visual & Performing Arts | 62 | 14.4% |
| Communications | 9 | 2.1% |
| Arts & Humanities | 15 | 3.5% |
| Total | 429 | 100.0% |
Transportation & Commute in Sandia Knolls
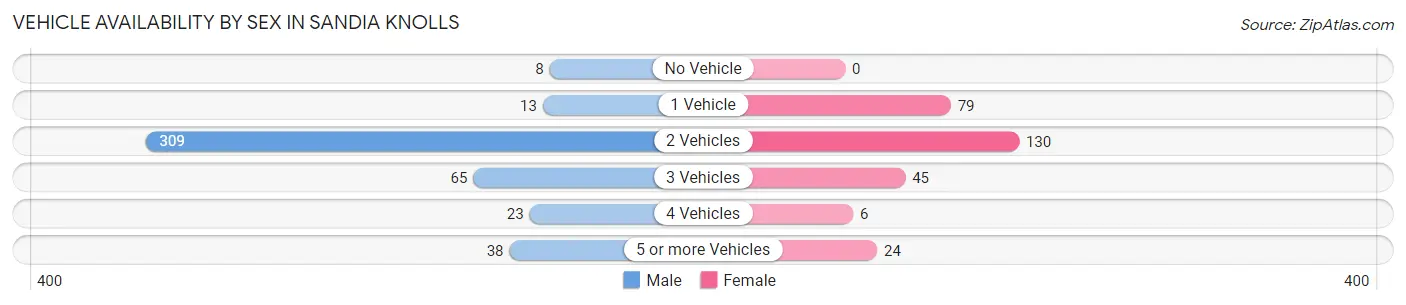
Vehicle Availability by Sex in Sandia Knolls
The most prevalent vehicle ownership categories in Sandia Knolls are males with 2 vehicles (309, accounting for 67.8%) and females with 2 vehicles (130, making up 108.8%).
| Vehicles Available | Male | Female |
| No Vehicle | 8 (1.8%) | 0 (0.0%) |
| 1 Vehicle | 13 (2.9%) | 79 (27.8%) |
| 2 Vehicles | 309 (67.8%) | 130 (45.8%) |
| 3 Vehicles | 65 (14.2%) | 45 (15.9%) |
| 4 Vehicles | 23 (5.0%) | 6 (2.1%) |
| 5 or more Vehicles | 38 (8.3%) | 24 (8.5%) |
| Total | 456 (100.0%) | 284 (100.0%) |
Commute Time in Sandia Knolls
The most frequently occuring commute durations in Sandia Knolls are 30 to 34 minutes (164 commuters, 23.7%), 15 to 19 minutes (128 commuters, 18.5%), and 35 to 39 minutes (93 commuters, 13.4%).
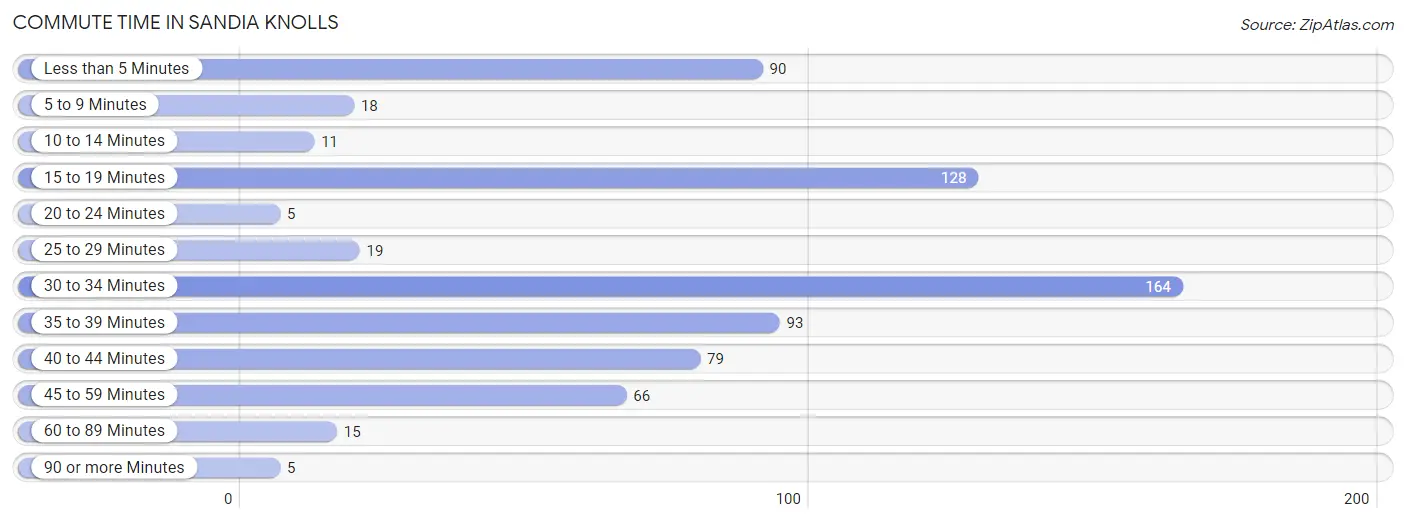
| Commute Time | # Commuters | % Commuters |
| Less than 5 Minutes | 90 | 13.0% |
| 5 to 9 Minutes | 18 | 2.6% |
| 10 to 14 Minutes | 11 | 1.6% |
| 15 to 19 Minutes | 128 | 18.5% |
| 20 to 24 Minutes | 5 | 0.7% |
| 25 to 29 Minutes | 19 | 2.7% |
| 30 to 34 Minutes | 164 | 23.7% |
| 35 to 39 Minutes | 93 | 13.4% |
| 40 to 44 Minutes | 79 | 11.4% |
| 45 to 59 Minutes | 66 | 9.5% |
| 60 to 89 Minutes | 15 | 2.2% |
| 90 or more Minutes | 5 | 0.7% |
Commute Time by Sex in Sandia Knolls
The most common commute times in Sandia Knolls are 35 to 39 minutes (93 commuters, 20.7%) for males and 30 to 34 minutes (116 commuters, 47.7%) for females.
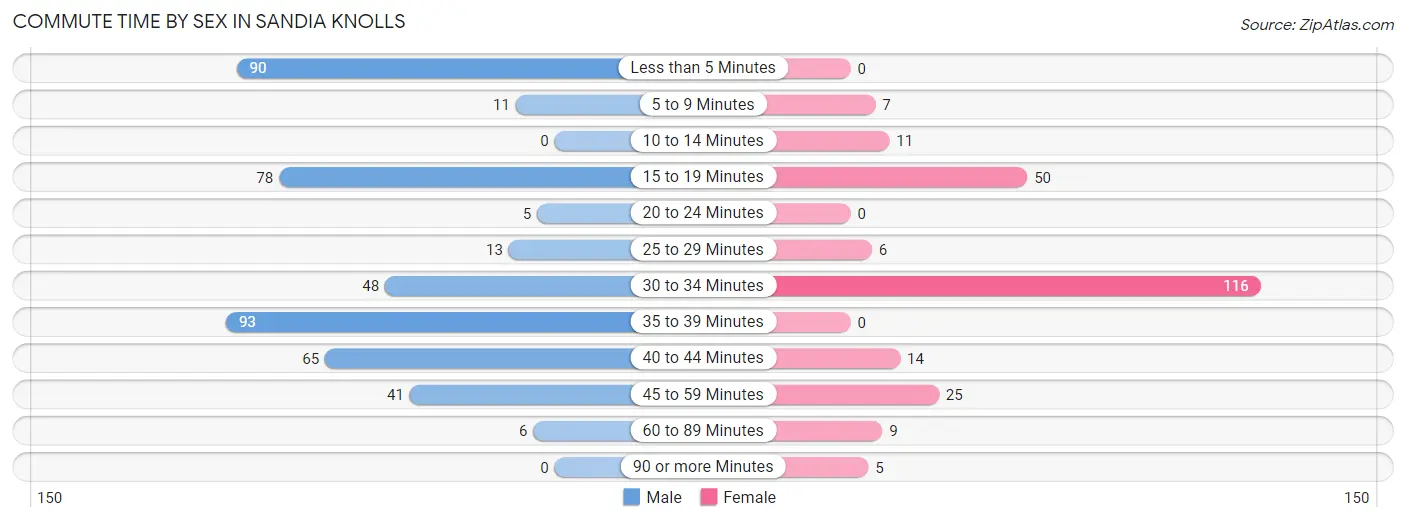
| Commute Time | Male | Female |
| Less than 5 Minutes | 90 (20.0%) | 0 (0.0%) |
| 5 to 9 Minutes | 11 (2.4%) | 7 (2.9%) |
| 10 to 14 Minutes | 0 (0.0%) | 11 (4.5%) |
| 15 to 19 Minutes | 78 (17.3%) | 50 (20.6%) |
| 20 to 24 Minutes | 5 (1.1%) | 0 (0.0%) |
| 25 to 29 Minutes | 13 (2.9%) | 6 (2.5%) |
| 30 to 34 Minutes | 48 (10.7%) | 116 (47.7%) |
| 35 to 39 Minutes | 93 (20.7%) | 0 (0.0%) |
| 40 to 44 Minutes | 65 (14.4%) | 14 (5.8%) |
| 45 to 59 Minutes | 41 (9.1%) | 25 (10.3%) |
| 60 to 89 Minutes | 6 (1.3%) | 9 (3.7%) |
| 90 or more Minutes | 0 (0.0%) | 5 (2.1%) |
Time of Departure to Work by Sex in Sandia Knolls
The most frequent times of departure to work in Sandia Knolls are 12:00 AM to 4:59 AM (114, 25.3%) for males and 9:00 AM to 9:59 AM (114, 46.9%) for females.
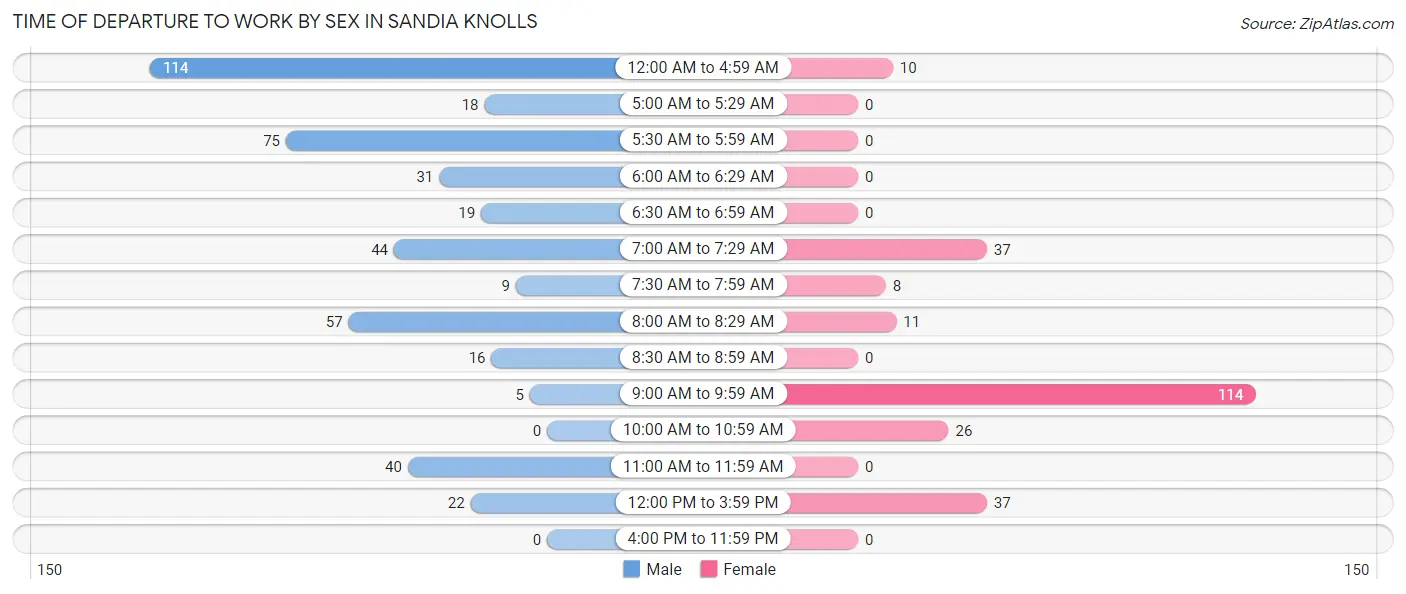
| Time of Departure | Male | Female |
| 12:00 AM to 4:59 AM | 114 (25.3%) | 10 (4.1%) |
| 5:00 AM to 5:29 AM | 18 (4.0%) | 0 (0.0%) |
| 5:30 AM to 5:59 AM | 75 (16.7%) | 0 (0.0%) |
| 6:00 AM to 6:29 AM | 31 (6.9%) | 0 (0.0%) |
| 6:30 AM to 6:59 AM | 19 (4.2%) | 0 (0.0%) |
| 7:00 AM to 7:29 AM | 44 (9.8%) | 37 (15.2%) |
| 7:30 AM to 7:59 AM | 9 (2.0%) | 8 (3.3%) |
| 8:00 AM to 8:29 AM | 57 (12.7%) | 11 (4.5%) |
| 8:30 AM to 8:59 AM | 16 (3.6%) | 0 (0.0%) |
| 9:00 AM to 9:59 AM | 5 (1.1%) | 114 (46.9%) |
| 10:00 AM to 10:59 AM | 0 (0.0%) | 26 (10.7%) |
| 11:00 AM to 11:59 AM | 40 (8.9%) | 0 (0.0%) |
| 12:00 PM to 3:59 PM | 22 (4.9%) | 37 (15.2%) |
| 4:00 PM to 11:59 PM | 0 (0.0%) | 0 (0.0%) |
| Total | 450 (100.0%) | 243 (100.0%) |
Housing Occupancy in Sandia Knolls
Occupancy by Ownership in Sandia Knolls
Of the total 578 dwellings in Sandia Knolls, owner-occupied units account for 467 (80.8%), while renter-occupied units make up 111 (19.2%).
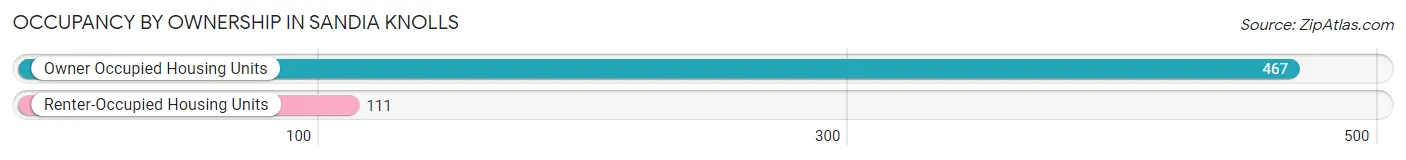
| Occupancy | # Housing Units | % Housing Units |
| Owner Occupied Housing Units | 467 | 80.8% |
| Renter-Occupied Housing Units | 111 | 19.2% |
| Total Occupied Housing Units | 578 | 100.0% |
Occupancy by Household Size in Sandia Knolls
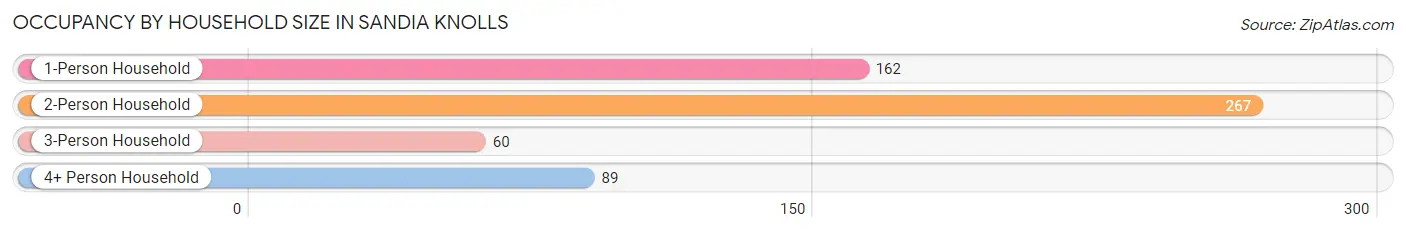
| Household Size | # Housing Units | % Housing Units |
| 1-Person Household | 162 | 28.0% |
| 2-Person Household | 267 | 46.2% |
| 3-Person Household | 60 | 10.4% |
| 4+ Person Household | 89 | 15.4% |
| Total Housing Units | 578 | 100.0% |
Occupancy by Ownership by Household Size in Sandia Knolls
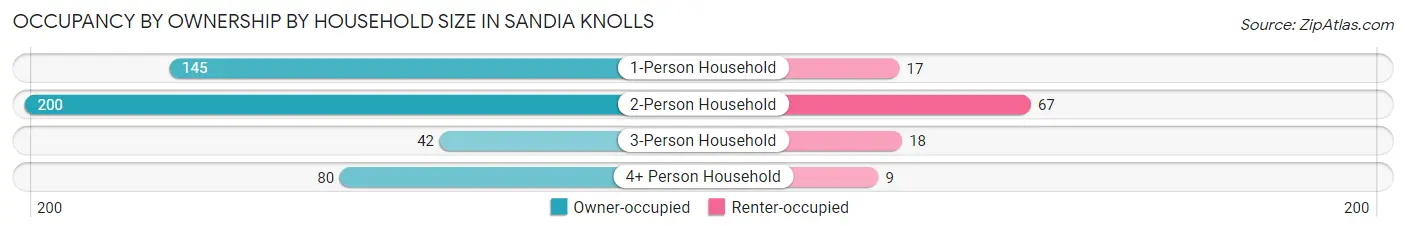
| Household Size | Owner-occupied | Renter-occupied |
| 1-Person Household | 145 (89.5%) | 17 (10.5%) |
| 2-Person Household | 200 (74.9%) | 67 (25.1%) |
| 3-Person Household | 42 (70.0%) | 18 (30.0%) |
| 4+ Person Household | 80 (89.9%) | 9 (10.1%) |
| Total Housing Units | 467 (80.8%) | 111 (19.2%) |
Occupancy by Educational Attainment in Sandia Knolls
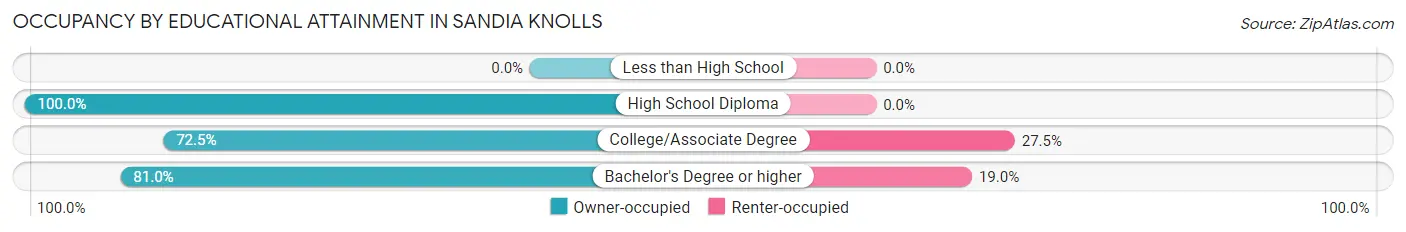
| Household Size | Owner-occupied | Renter-occupied |
| Less than High School | 0 (0.0%) | 0 (0.0%) |
| High School Diploma | 88 (100.0%) | 0 (0.0%) |
| College/Associate Degree | 153 (72.5%) | 58 (27.5%) |
| Bachelor's Degree or higher | 226 (81.0%) | 53 (19.0%) |
Occupancy by Age of Householder in Sandia Knolls
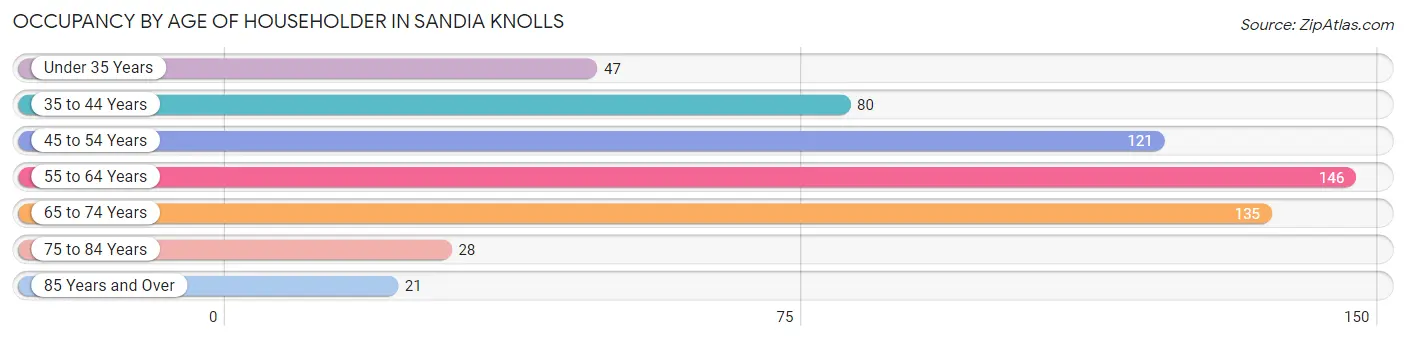
| Age Bracket | # Households | % Households |
| Under 35 Years | 47 | 8.1% |
| 35 to 44 Years | 80 | 13.8% |
| 45 to 54 Years | 121 | 20.9% |
| 55 to 64 Years | 146 | 25.3% |
| 65 to 74 Years | 135 | 23.4% |
| 75 to 84 Years | 28 | 4.8% |
| 85 Years and Over | 21 | 3.6% |
| Total | 578 | 100.0% |
Housing Finances in Sandia Knolls
Median Income by Occupancy in Sandia Knolls
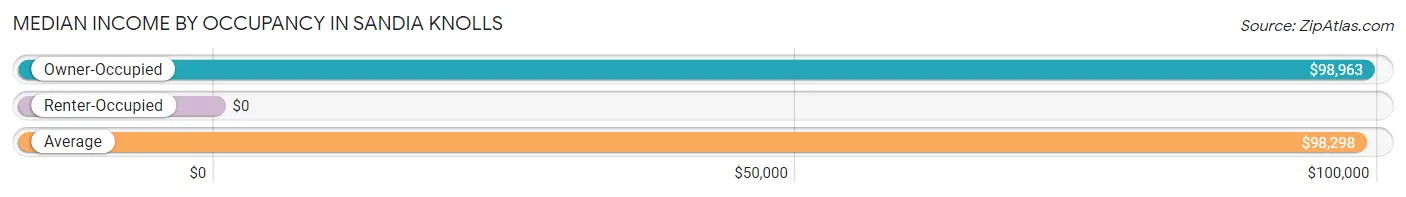
| Occupancy Type | # Households | Median Income |
| Owner-Occupied | 467 (80.8%) | $98,963 |
| Renter-Occupied | 111 (19.2%) | $0 |
| Average | 578 (100.0%) | $98,298 |
Occupancy by Householder Income Bracket in Sandia Knolls
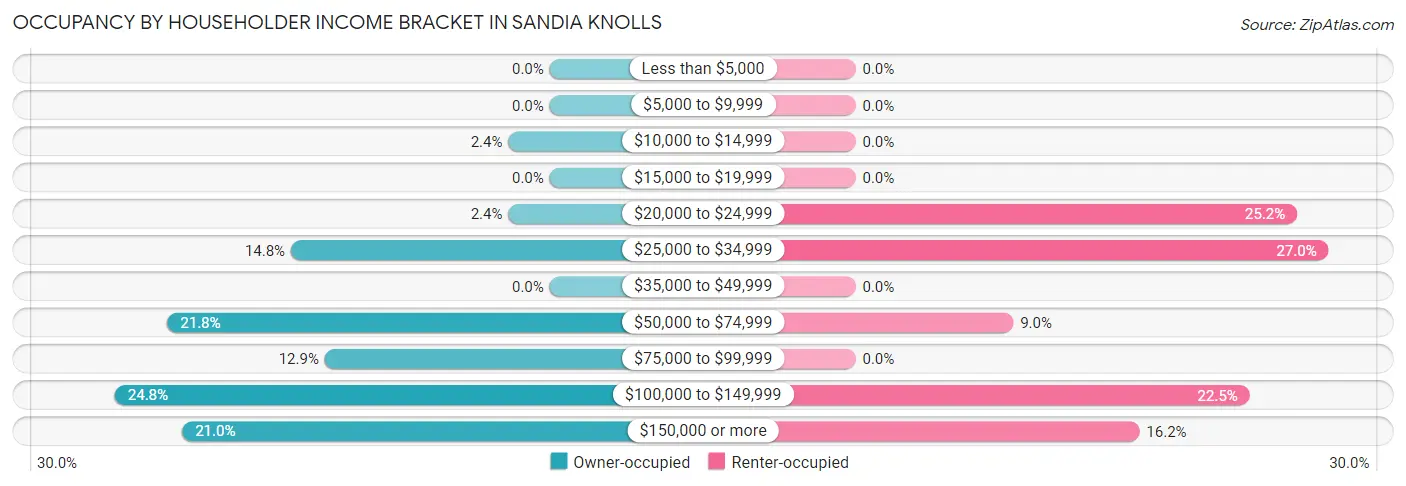
| Income Bracket | Owner-occupied | Renter-occupied |
| Less than $5,000 | 0 (0.0%) | 0 (0.0%) |
| $5,000 to $9,999 | 0 (0.0%) | 0 (0.0%) |
| $10,000 to $14,999 | 11 (2.4%) | 0 (0.0%) |
| $15,000 to $19,999 | 0 (0.0%) | 0 (0.0%) |
| $20,000 to $24,999 | 11 (2.4%) | 28 (25.2%) |
| $25,000 to $34,999 | 69 (14.8%) | 30 (27.0%) |
| $35,000 to $49,999 | 0 (0.0%) | 0 (0.0%) |
| $50,000 to $74,999 | 102 (21.8%) | 10 (9.0%) |
| $75,000 to $99,999 | 60 (12.9%) | 0 (0.0%) |
| $100,000 to $149,999 | 116 (24.8%) | 25 (22.5%) |
| $150,000 or more | 98 (21.0%) | 18 (16.2%) |
| Total | 467 (100.0%) | 111 (100.0%) |
Monthly Housing Cost Tiers in Sandia Knolls
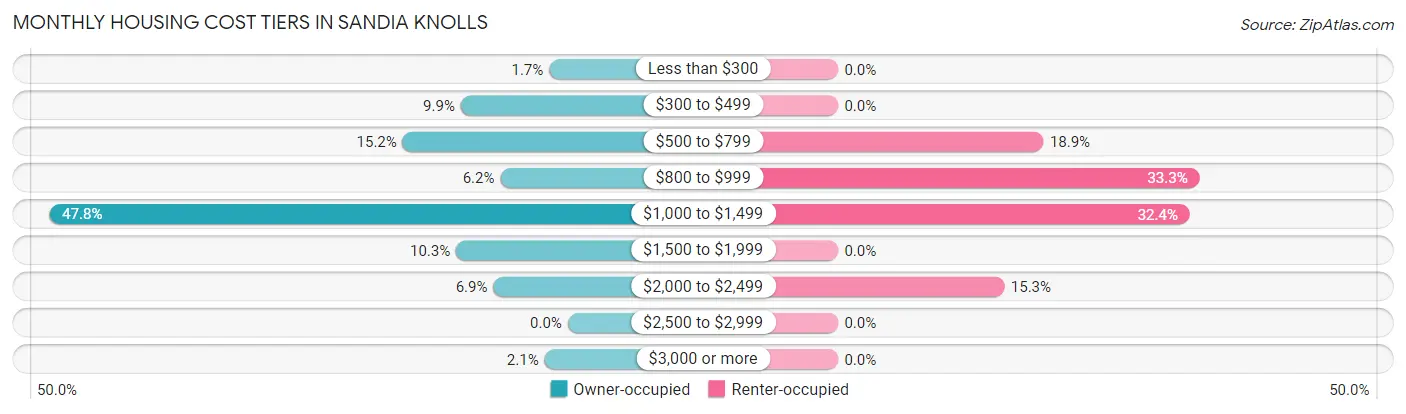
| Monthly Cost | Owner-occupied | Renter-occupied |
| Less than $300 | 8 (1.7%) | 0 (0.0%) |
| $300 to $499 | 46 (9.9%) | 0 (0.0%) |
| $500 to $799 | 71 (15.2%) | 21 (18.9%) |
| $800 to $999 | 29 (6.2%) | 37 (33.3%) |
| $1,000 to $1,499 | 223 (47.7%) | 36 (32.4%) |
| $1,500 to $1,999 | 48 (10.3%) | 0 (0.0%) |
| $2,000 to $2,499 | 32 (6.9%) | 17 (15.3%) |
| $2,500 to $2,999 | 0 (0.0%) | 0 (0.0%) |
| $3,000 or more | 10 (2.1%) | 0 (0.0%) |
| Total | 467 (100.0%) | 111 (100.0%) |
Physical Housing Characteristics in Sandia Knolls
Housing Structures in Sandia Knolls
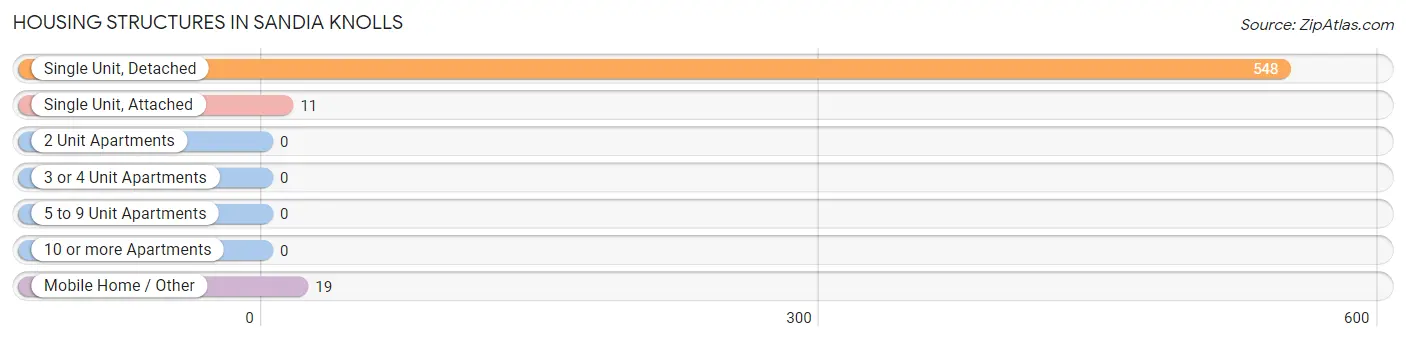
| Structure Type | # Housing Units | % Housing Units |
| Single Unit, Detached | 548 | 94.8% |
| Single Unit, Attached | 11 | 1.9% |
| 2 Unit Apartments | 0 | 0.0% |
| 3 or 4 Unit Apartments | 0 | 0.0% |
| 5 to 9 Unit Apartments | 0 | 0.0% |
| 10 or more Apartments | 0 | 0.0% |
| Mobile Home / Other | 19 | 3.3% |
| Total | 578 | 100.0% |
Housing Structures by Occupancy in Sandia Knolls
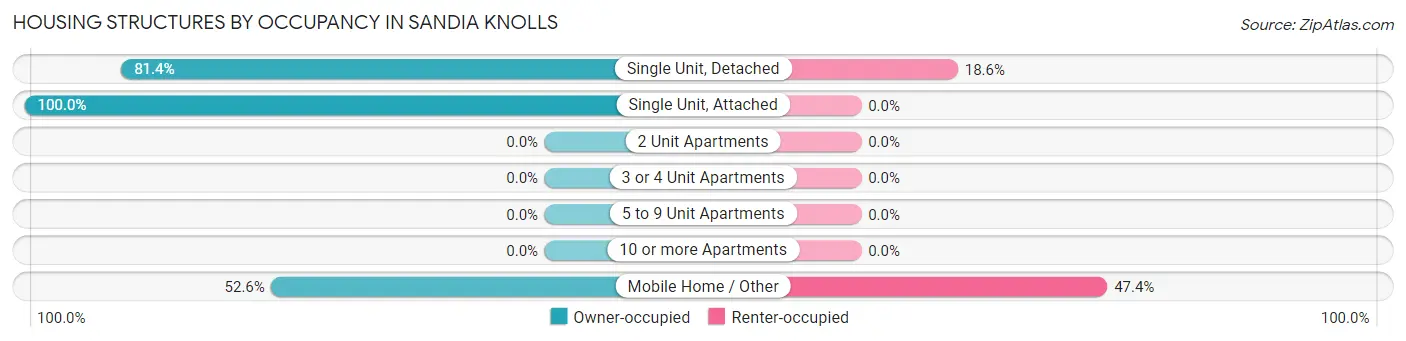
| Structure Type | Owner-occupied | Renter-occupied |
| Single Unit, Detached | 446 (81.4%) | 102 (18.6%) |
| Single Unit, Attached | 11 (100.0%) | 0 (0.0%) |
| 2 Unit Apartments | 0 (0.0%) | 0 (0.0%) |
| 3 or 4 Unit Apartments | 0 (0.0%) | 0 (0.0%) |
| 5 to 9 Unit Apartments | 0 (0.0%) | 0 (0.0%) |
| 10 or more Apartments | 0 (0.0%) | 0 (0.0%) |
| Mobile Home / Other | 10 (52.6%) | 9 (47.4%) |
| Total | 467 (80.8%) | 111 (19.2%) |
Housing Structures by Number of Rooms in Sandia Knolls
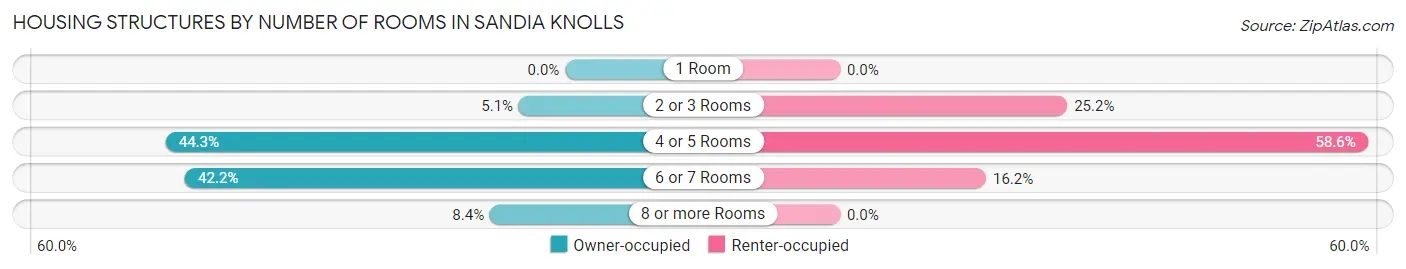
| Number of Rooms | Owner-occupied | Renter-occupied |
| 1 Room | 0 (0.0%) | 0 (0.0%) |
| 2 or 3 Rooms | 24 (5.1%) | 28 (25.2%) |
| 4 or 5 Rooms | 207 (44.3%) | 65 (58.6%) |
| 6 or 7 Rooms | 197 (42.2%) | 18 (16.2%) |
| 8 or more Rooms | 39 (8.4%) | 0 (0.0%) |
| Total | 467 (100.0%) | 111 (100.0%) |
Housing Structure by Heating Type in Sandia Knolls
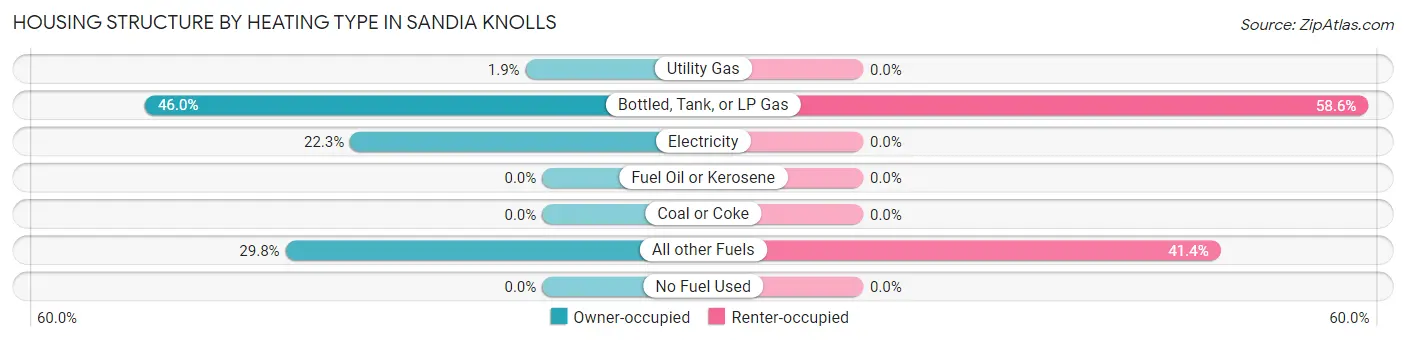
| Heating Type | Owner-occupied | Renter-occupied |
| Utility Gas | 9 (1.9%) | 0 (0.0%) |
| Bottled, Tank, or LP Gas | 215 (46.0%) | 65 (58.6%) |
| Electricity | 104 (22.3%) | 0 (0.0%) |
| Fuel Oil or Kerosene | 0 (0.0%) | 0 (0.0%) |
| Coal or Coke | 0 (0.0%) | 0 (0.0%) |
| All other Fuels | 139 (29.8%) | 46 (41.4%) |
| No Fuel Used | 0 (0.0%) | 0 (0.0%) |
| Total | 467 (100.0%) | 111 (100.0%) |
Household Vehicle Usage in Sandia Knolls
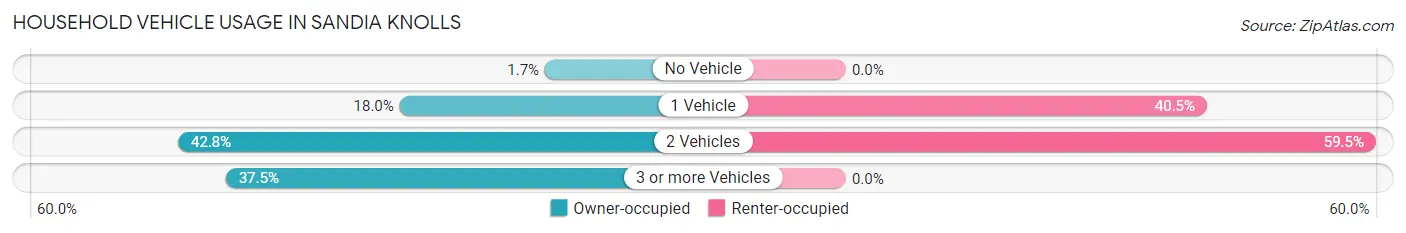
| Vehicles per Household | Owner-occupied | Renter-occupied |
| No Vehicle | 8 (1.7%) | 0 (0.0%) |
| 1 Vehicle | 84 (18.0%) | 45 (40.5%) |
| 2 Vehicles | 200 (42.8%) | 66 (59.5%) |
| 3 or more Vehicles | 175 (37.5%) | 0 (0.0%) |
| Total | 467 (100.0%) | 111 (100.0%) |
Real Estate & Mortgages in Sandia Knolls
Real Estate and Mortgage Overview in Sandia Knolls
| Characteristic | Without Mortgage | With Mortgage |
| Housing Units | 143 | 324 |
| Median Property Value | $268,200 | $289,900 |
| Median Household Income | $108,125 | $70 |
| Monthly Housing Costs | $730 | $10 |
| Real Estate Taxes | $2,198 | $0 |
Property Value by Mortgage Status in Sandia Knolls
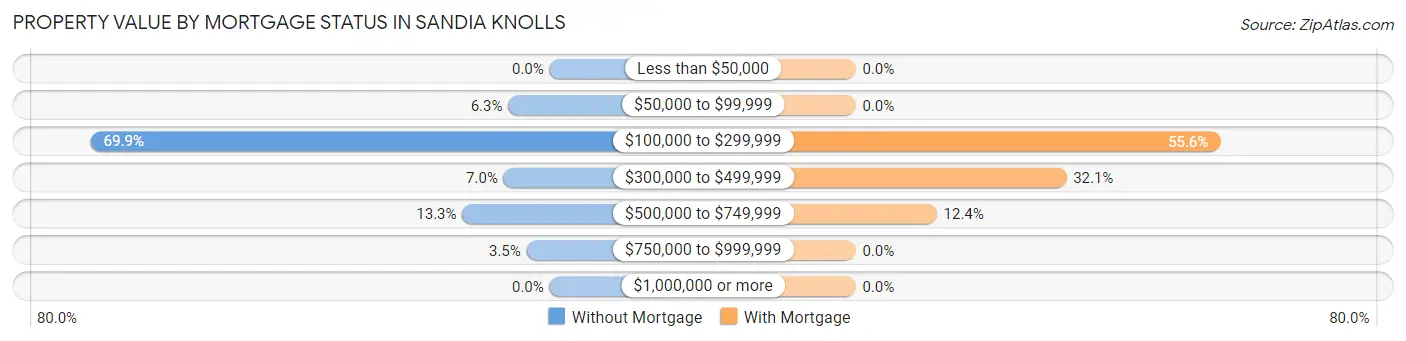
| Property Value | Without Mortgage | With Mortgage |
| Less than $50,000 | 0 (0.0%) | 0 (0.0%) |
| $50,000 to $99,999 | 9 (6.3%) | 0 (0.0%) |
| $100,000 to $299,999 | 100 (69.9%) | 180 (55.6%) |
| $300,000 to $499,999 | 10 (7.0%) | 104 (32.1%) |
| $500,000 to $749,999 | 19 (13.3%) | 40 (12.3%) |
| $750,000 to $999,999 | 5 (3.5%) | 0 (0.0%) |
| $1,000,000 or more | 0 (0.0%) | 0 (0.0%) |
| Total | 143 (100.0%) | 324 (100.0%) |
Household Income by Mortgage Status in Sandia Knolls
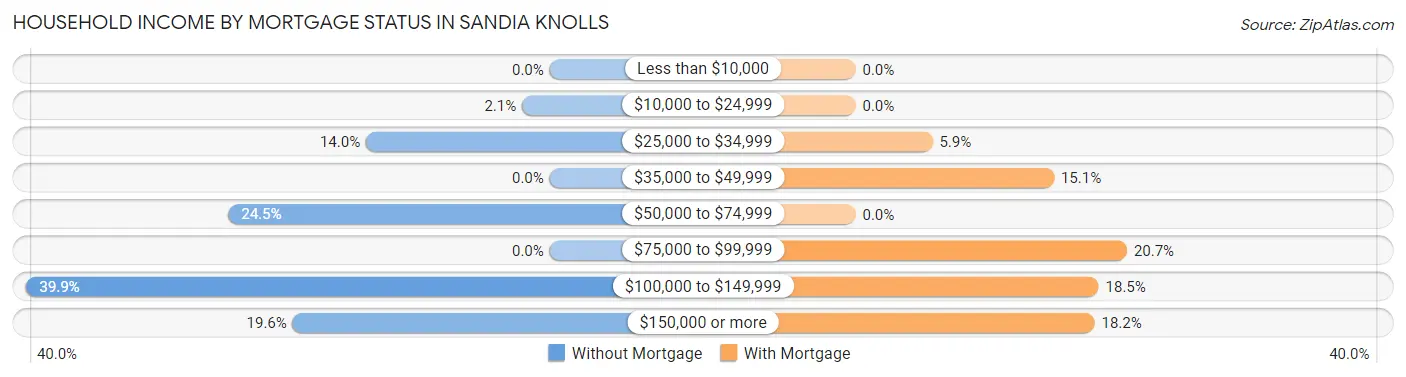
| Household Income | Without Mortgage | With Mortgage |
| Less than $10,000 | 0 (0.0%) | 0 (0.0%) |
| $10,000 to $24,999 | 3 (2.1%) | 0 (0.0%) |
| $25,000 to $34,999 | 20 (14.0%) | 19 (5.9%) |
| $35,000 to $49,999 | 0 (0.0%) | 49 (15.1%) |
| $50,000 to $74,999 | 35 (24.5%) | 0 (0.0%) |
| $75,000 to $99,999 | 0 (0.0%) | 67 (20.7%) |
| $100,000 to $149,999 | 57 (39.9%) | 60 (18.5%) |
| $150,000 or more | 28 (19.6%) | 59 (18.2%) |
| Total | 143 (100.0%) | 324 (100.0%) |
Property Value to Household Income Ratio in Sandia Knolls
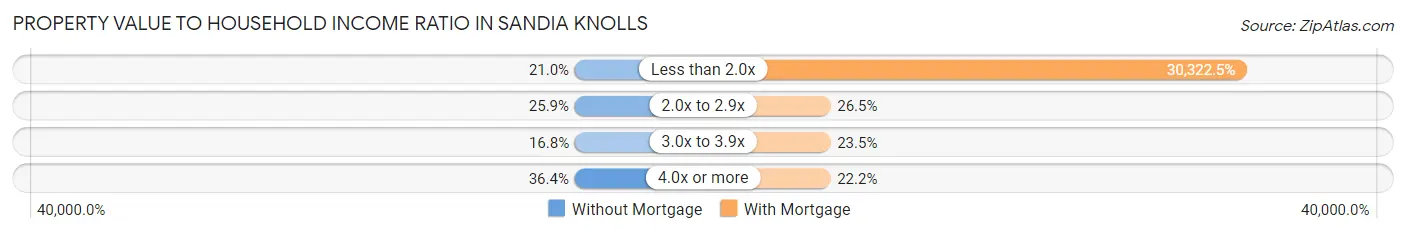
| Value-to-Income Ratio | Without Mortgage | With Mortgage |
| Less than 2.0x | 30 (21.0%) | 98,245 (30,322.5%) |
| 2.0x to 2.9x | 37 (25.9%) | 86 (26.5%) |
| 3.0x to 3.9x | 24 (16.8%) | 76 (23.5%) |
| 4.0x or more | 52 (36.4%) | 72 (22.2%) |
| Total | 143 (100.0%) | 324 (100.0%) |
Real Estate Taxes by Mortgage Status in Sandia Knolls
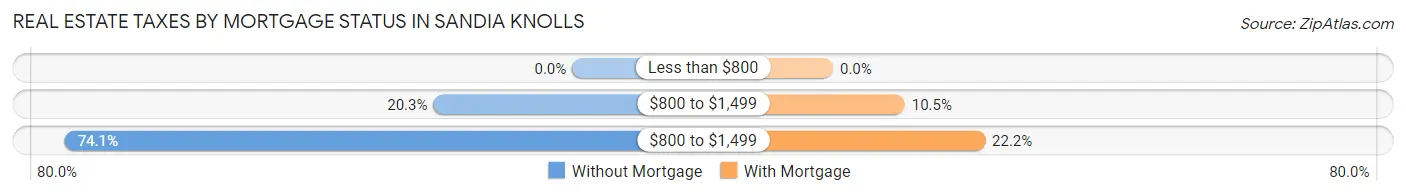
| Property Taxes | Without Mortgage | With Mortgage |
| Less than $800 | 0 (0.0%) | 0 (0.0%) |
| $800 to $1,499 | 29 (20.3%) | 34 (10.5%) |
| $800 to $1,499 | 106 (74.1%) | 72 (22.2%) |
| Total | 143 (100.0%) | 324 (100.0%) |
Health & Disability in Sandia Knolls
Health Insurance Coverage by Age in Sandia Knolls
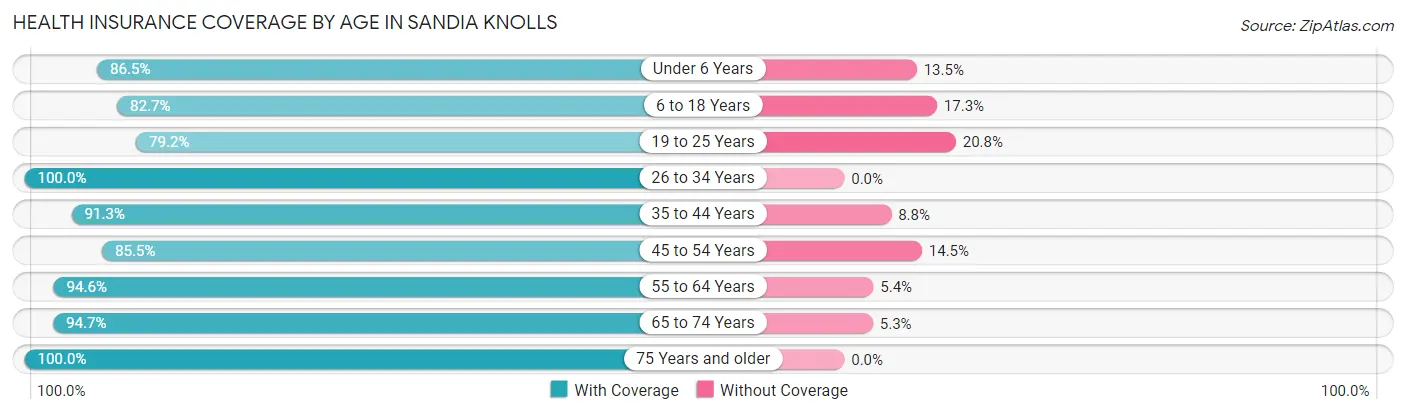
| Age Bracket | With Coverage | Without Coverage |
| Under 6 Years | 32 (86.5%) | 5 (13.5%) |
| 6 to 18 Years | 297 (82.7%) | 62 (17.3%) |
| 19 to 25 Years | 99 (79.2%) | 26 (20.8%) |
| 26 to 34 Years | 17 (100.0%) | 0 (0.0%) |
| 35 to 44 Years | 146 (91.2%) | 14 (8.7%) |
| 45 to 54 Years | 213 (85.5%) | 36 (14.5%) |
| 55 to 64 Years | 157 (94.6%) | 9 (5.4%) |
| 65 to 74 Years | 213 (94.7%) | 12 (5.3%) |
| 75 Years and older | 72 (100.0%) | 0 (0.0%) |
| Total | 1,246 (88.4%) | 164 (11.6%) |
Health Insurance Coverage by Citizenship Status in Sandia Knolls
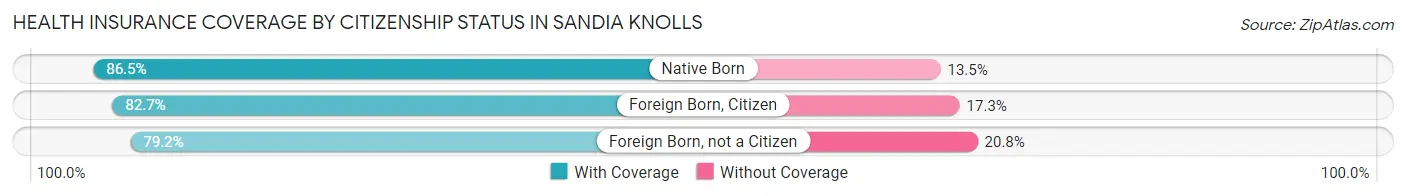
| Citizenship Status | With Coverage | Without Coverage |
| Native Born | 32 (86.5%) | 5 (13.5%) |
| Foreign Born, Citizen | 297 (82.7%) | 62 (17.3%) |
| Foreign Born, not a Citizen | 99 (79.2%) | 26 (20.8%) |
Health Insurance Coverage by Household Income in Sandia Knolls
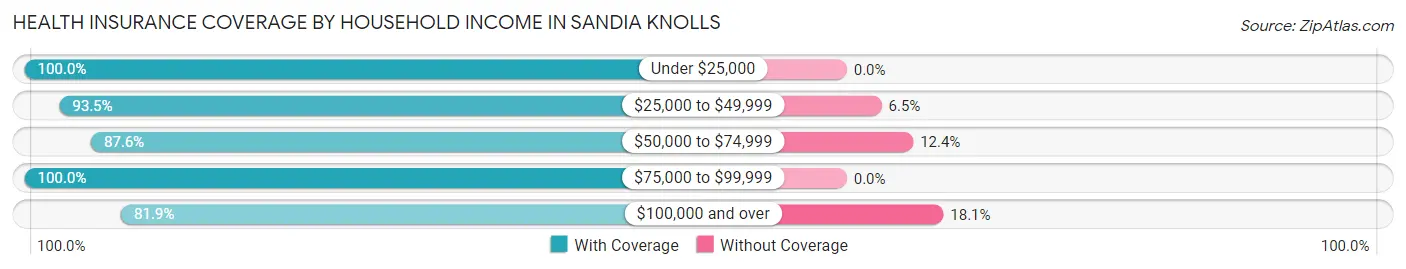
| Household Income | With Coverage | Without Coverage |
| Under $25,000 | 77 (100.0%) | 0 (0.0%) |
| $25,000 to $49,999 | 129 (93.5%) | 9 (6.5%) |
| $50,000 to $74,999 | 183 (87.6%) | 26 (12.4%) |
| $75,000 to $99,999 | 273 (100.0%) | 0 (0.0%) |
| $100,000 and over | 584 (81.9%) | 129 (18.1%) |
Public vs Private Health Insurance Coverage by Age in Sandia Knolls
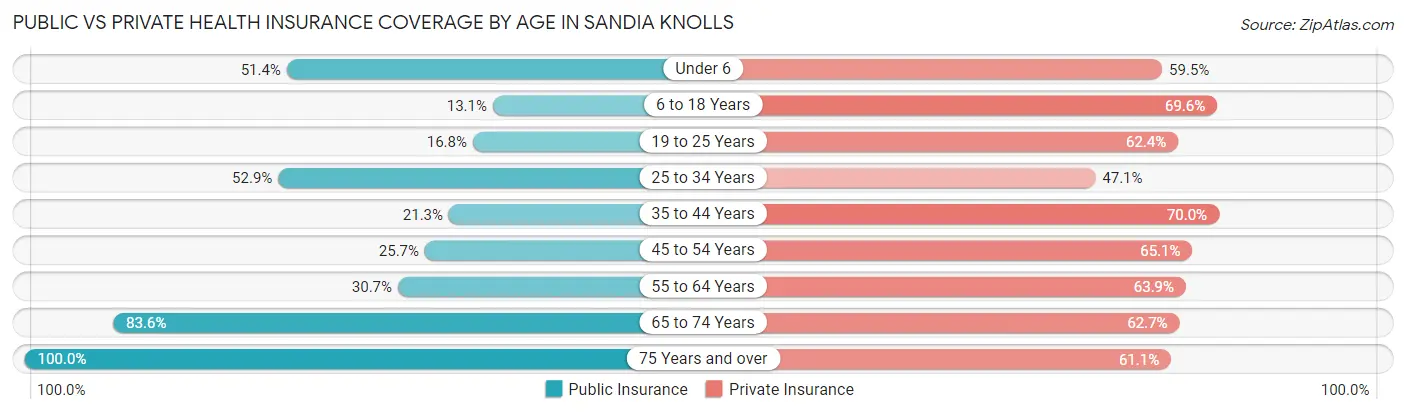
| Age Bracket | Public Insurance | Private Insurance |
| Under 6 | 19 (51.3%) | 22 (59.5%) |
| 6 to 18 Years | 47 (13.1%) | 250 (69.6%) |
| 19 to 25 Years | 21 (16.8%) | 78 (62.4%) |
| 25 to 34 Years | 9 (52.9%) | 8 (47.1%) |
| 35 to 44 Years | 34 (21.2%) | 112 (70.0%) |
| 45 to 54 Years | 64 (25.7%) | 162 (65.1%) |
| 55 to 64 Years | 51 (30.7%) | 106 (63.9%) |
| 65 to 74 Years | 188 (83.6%) | 141 (62.7%) |
| 75 Years and over | 72 (100.0%) | 44 (61.1%) |
| Total | 505 (35.8%) | 923 (65.5%) |
Disability Status by Sex by Age in Sandia Knolls
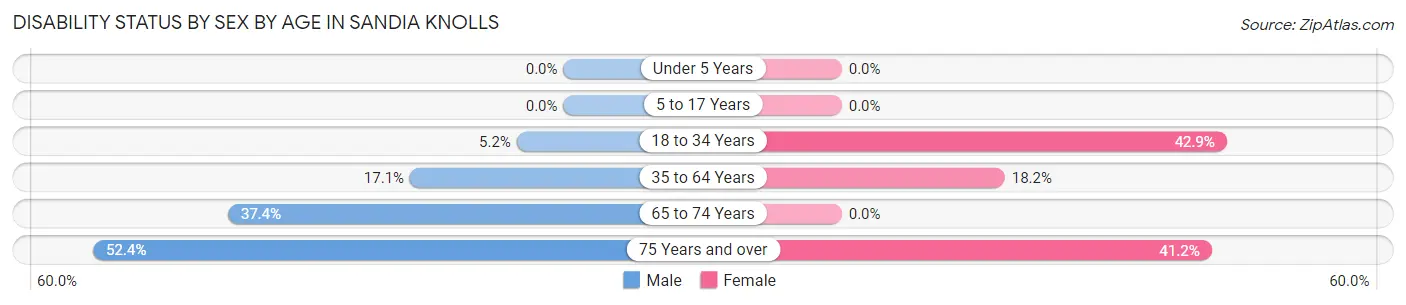
| Age Bracket | Male | Female |
| Under 5 Years | 0 (0.0%) | 0 (0.0%) |
| 5 to 17 Years | 0 (0.0%) | 0 (0.0%) |
| 18 to 34 Years | 9 (5.2%) | 21 (42.9%) |
| 35 to 64 Years | 54 (17.1%) | 47 (18.1%) |
| 65 to 74 Years | 37 (37.4%) | 0 (0.0%) |
| 75 Years and over | 11 (52.4%) | 21 (41.2%) |
Disability Class by Sex by Age in Sandia Knolls
Disability Class: Hearing Difficulty
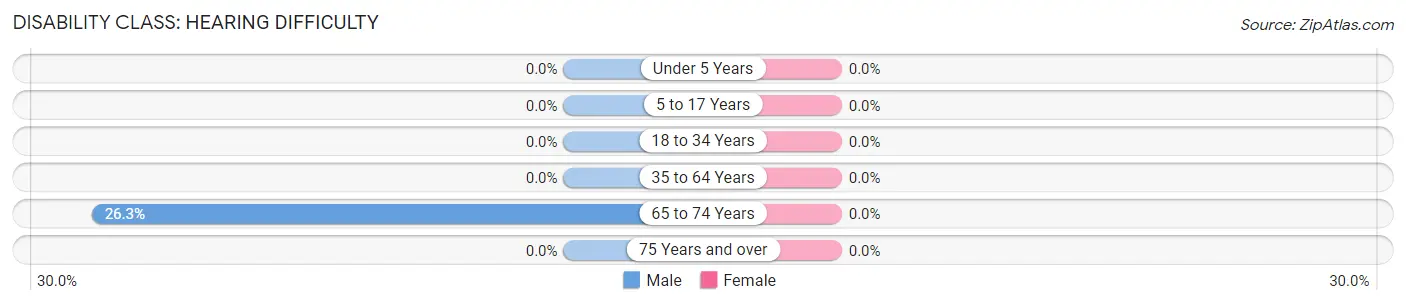
| Age Bracket | Male | Female |
| Under 5 Years | 0 (0.0%) | 0 (0.0%) |
| 5 to 17 Years | 0 (0.0%) | 0 (0.0%) |
| 18 to 34 Years | 0 (0.0%) | 0 (0.0%) |
| 35 to 64 Years | 0 (0.0%) | 0 (0.0%) |
| 65 to 74 Years | 26 (26.3%) | 0 (0.0%) |
| 75 Years and over | 0 (0.0%) | 0 (0.0%) |
Disability Class: Vision Difficulty
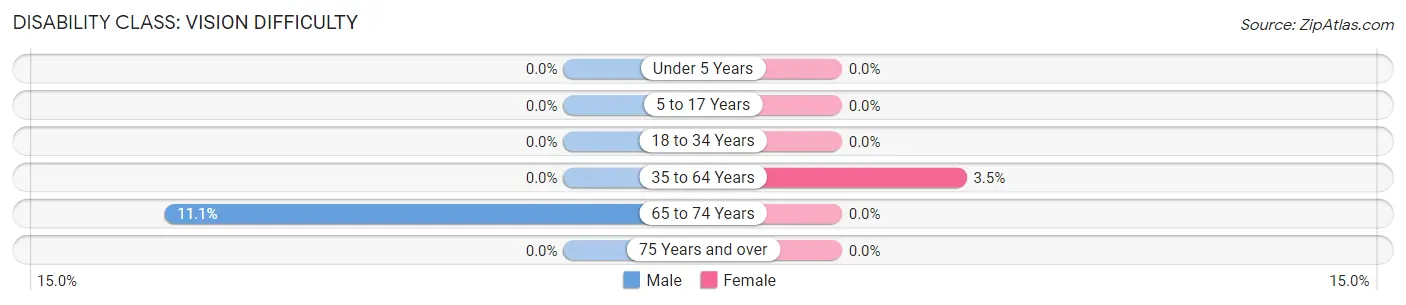
| Age Bracket | Male | Female |
| Under 5 Years | 0 (0.0%) | 0 (0.0%) |
| 5 to 17 Years | 0 (0.0%) | 0 (0.0%) |
| 18 to 34 Years | 0 (0.0%) | 0 (0.0%) |
| 35 to 64 Years | 0 (0.0%) | 9 (3.5%) |
| 65 to 74 Years | 11 (11.1%) | 0 (0.0%) |
| 75 Years and over | 0 (0.0%) | 0 (0.0%) |
Disability Class: Cognitive Difficulty
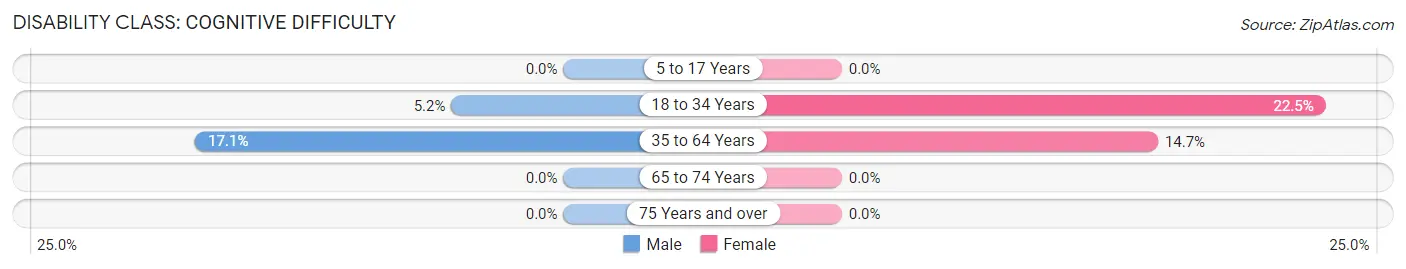
| Age Bracket | Male | Female |
| 5 to 17 Years | 0 (0.0%) | 0 (0.0%) |
| 18 to 34 Years | 9 (5.2%) | 11 (22.5%) |
| 35 to 64 Years | 54 (17.1%) | 38 (14.7%) |
| 65 to 74 Years | 0 (0.0%) | 0 (0.0%) |
| 75 Years and over | 0 (0.0%) | 0 (0.0%) |
Disability Class: Ambulatory Difficulty
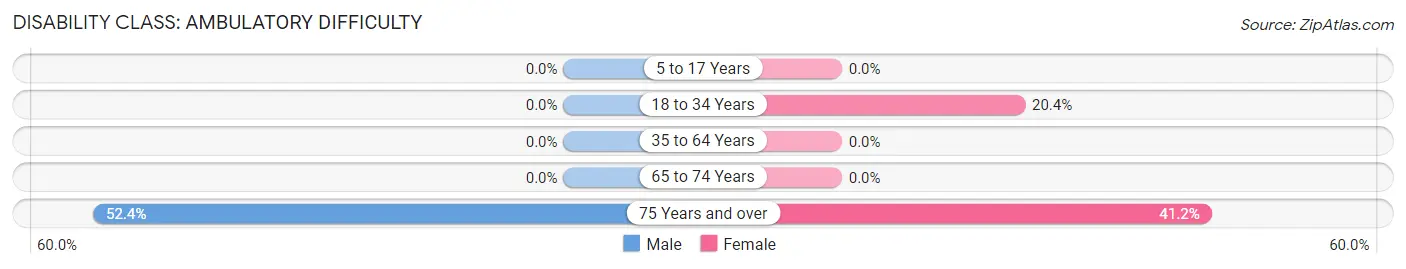
| Age Bracket | Male | Female |
| 5 to 17 Years | 0 (0.0%) | 0 (0.0%) |
| 18 to 34 Years | 0 (0.0%) | 10 (20.4%) |
| 35 to 64 Years | 0 (0.0%) | 0 (0.0%) |
| 65 to 74 Years | 0 (0.0%) | 0 (0.0%) |
| 75 Years and over | 11 (52.4%) | 21 (41.2%) |
Disability Class: Self-Care Difficulty
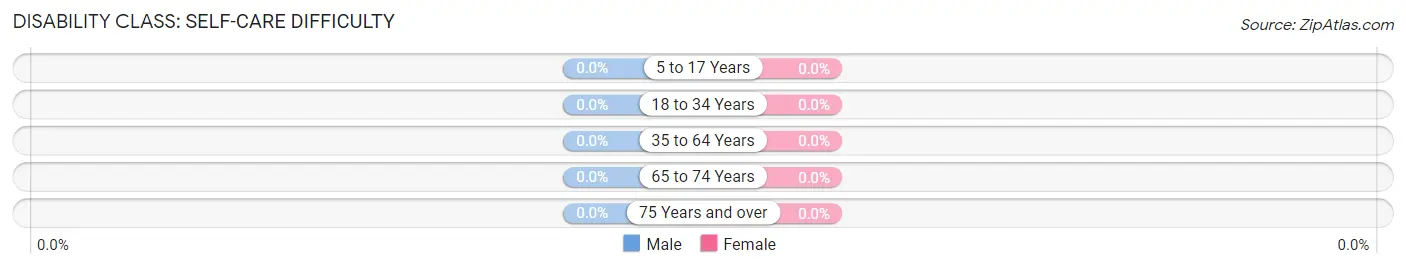
| Age Bracket | Male | Female |
| 5 to 17 Years | 0 (0.0%) | 0 (0.0%) |
| 18 to 34 Years | 0 (0.0%) | 0 (0.0%) |
| 35 to 64 Years | 0 (0.0%) | 0 (0.0%) |
| 65 to 74 Years | 0 (0.0%) | 0 (0.0%) |
| 75 Years and over | 0 (0.0%) | 0 (0.0%) |
Technology Access in Sandia Knolls
Computing Device Access in Sandia Knolls
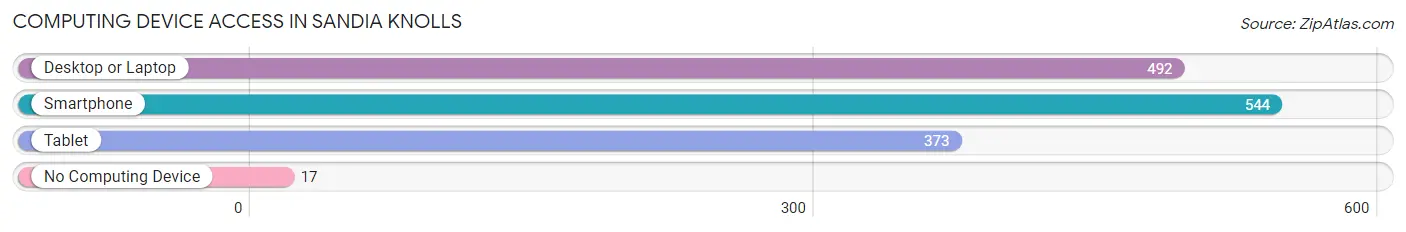
| Device Type | # Households | % Households |
| Desktop or Laptop | 492 | 85.1% |
| Smartphone | 544 | 94.1% |
| Tablet | 373 | 64.5% |
| No Computing Device | 17 | 2.9% |
| Total | 578 | 100.0% |
Internet Access in Sandia Knolls
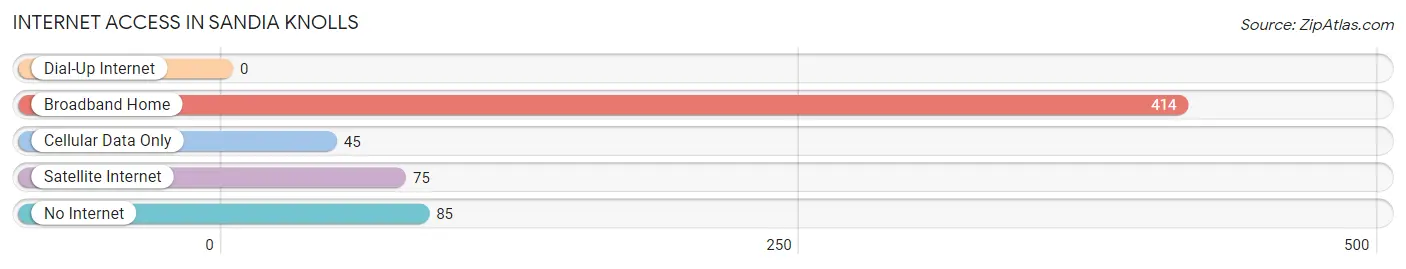
| Internet Type | # Households | % Households |
| Dial-Up Internet | 0 | 0.0% |
| Broadband Home | 414 | 71.6% |
| Cellular Data Only | 45 | 7.8% |
| Satellite Internet | 75 | 13.0% |
| No Internet | 85 | 14.7% |
| Total | 578 | 100.0% |
Sandia Knolls Summary
Sandia Knolls is a small unincorporated community located in Bernalillo County, New Mexico. It is situated in the foothills of the Sandia Mountains, just east of the city of Albuquerque. The community is home to approximately 1,000 people and is known for its rural atmosphere and scenic views.
History
The area now known as Sandia Knolls was originally inhabited by the Pueblo Indians. The first European settlers arrived in the area in the late 1700s, and the community was officially established in 1876. The name “Sandia Knolls” is derived from the Spanish word for “sandy hills”, referring to the sandy soil in the area.
In the early 1900s, the area was primarily used for ranching and farming. The community was home to several small farms and ranches, and the local economy was largely based on agriculture. In the 1950s, the area began to experience rapid growth as the city of Albuquerque expanded. This led to the development of several residential neighborhoods in the area, and the population of Sandia Knolls began to increase.
Geography
Sandia Knolls is located in the foothills of the Sandia Mountains, just east of the city of Albuquerque. The community is situated at an elevation of 5,400 feet, and the surrounding area is characterized by rolling hills and sandy soil. The climate in the area is semi-arid, with hot summers and mild winters.
The Sandia Mountains are a popular destination for outdoor recreation, and the area is home to several hiking trails and camping sites. The nearby Sandia Peak Ski Area offers skiing and snowboarding in the winter months.
Economy
The economy of Sandia Knolls is largely based on tourism and retail. The area is home to several small businesses, including restaurants, shops, and art galleries. The local economy is also supported by the nearby Sandia Peak Ski Area, which attracts visitors from all over the region.
Demographics
As of the 2010 census, the population of Sandia Knolls was 1,000. The racial makeup of the community was 79.2% White, 0.7% African American, 0.7% Native American, 0.7% Asian, 0.3% Pacific Islander, and 17.1% from other races. The median household income in the area was $45,000, and the median age was 37.
Sandia Knolls is a small, rural community with a unique atmosphere and scenic views. The area is home to a diverse population and offers a variety of recreational activities. The local economy is largely based on tourism and retail, and the community is a popular destination for outdoor enthusiasts.
Common Questions
What is Per Capita Income in Sandia Knolls?
Per Capita income in Sandia Knolls is $41,014.
What is the Median Family Income in Sandia Knolls?
Median Family Income in Sandia Knolls is $108,000.
What is the Median Household income in Sandia Knolls?
Median Household Income in Sandia Knolls is $98,298.
What is Inequality or Gini Index in Sandia Knolls?
Inequality or Gini Index in Sandia Knolls is 0.37.
What is the Total Population of Sandia Knolls?
Total Population of Sandia Knolls is 1,410.
What is the Total Male Population of Sandia Knolls?
Total Male Population of Sandia Knolls is 736.
What is the Total Female Population of Sandia Knolls?
Total Female Population of Sandia Knolls is 674.
What is the Ratio of Males per 100 Females in Sandia Knolls?
There are 109.20 Males per 100 Females in Sandia Knolls.
What is the Ratio of Females per 100 Males in Sandia Knolls?
There are 91.58 Females per 100 Males in Sandia Knolls.
What is the Median Population Age in Sandia Knolls?
Median Population Age in Sandia Knolls is 45.2 Years.
What is the Average Family Size in Sandia Knolls
Average Family Size in Sandia Knolls is 3.1 People.
What is the Average Household Size in Sandia Knolls
Average Household Size in Sandia Knolls is 2.4 People.
How Large is the Labor Force in Sandia Knolls?
There are 789 People in the Labor Forcein in Sandia Knolls.
What is the Percentage of People in the Labor Force in Sandia Knolls?
68.4% of People are in the Labor Force in Sandia Knolls.
What is the Unemployment Rate in Sandia Knolls?
Unemployment Rate in Sandia Knolls is 3.2%.