San Ysidro, NM Map & Demographics
San Ysidro Map
San Ysidro Overview
$22,220
PER CAPITA INCOME
$70,000
AVG FAMILY INCOME
43.2%
WAGE / INCOME GAP [ % ]
56.8¢/ $1
WAGE / INCOME GAP [ $ ]
0.52
INEQUALITY / GINI INDEX
219
TOTAL POPULATION
91
MALE POPULATION
128
FEMALE POPULATION
71.09
MALES / 100 FEMALES
140.66
FEMALES / 100 MALES
41.9
MEDIAN AGE
2.4
AVG FAMILY SIZE
1.9
AVG HOUSEHOLD SIZE
96
LABOR FORCE [ PEOPLE ]
49.5%
PERCENT IN LABOR FORCE
5.2%
UNEMPLOYMENT RATE
San Ysidro Zip Codes
San Ysidro Area Codes
Income in San Ysidro
Income Overview in San Ysidro
| Characteristic | Number | Measure |
| Per Capita Income | 219 | $22,220 |
| Median Family Income | 38 | $70,000 |
| Mean Family Income | 38 | $74,034 |
| Median Household Income | 113 | $0 |
| Mean Household Income | 113 | $40,503 |
| Income Deficit | 38 | $0 |
| Wage / Income Gap (%) | 219 | 43.15% |
| Wage / Income Gap ($) | 219 | 56.85¢ per $1 |
| Gini / Inequality Index | 219 | 0.52 |
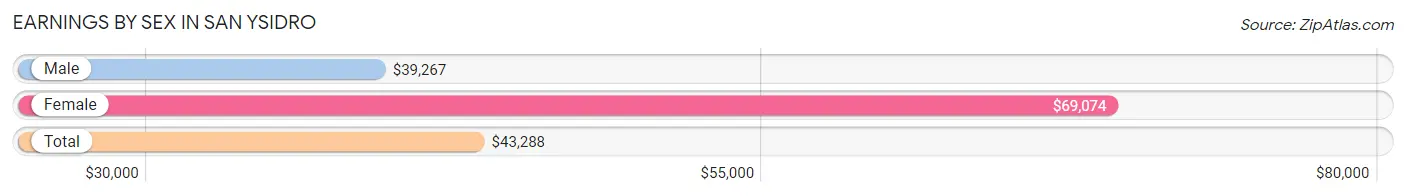
Earnings by Sex in San Ysidro
Average Earnings in San Ysidro are $43,288, $39,267 for men and $69,074 for women, a difference of 43.1%.
| Sex | Number | Average Earnings |
| Male | 63 (44.7%) | $39,267 |
| Female | 78 (55.3%) | $69,074 |
| Total | 141 (100.0%) | $43,288 |
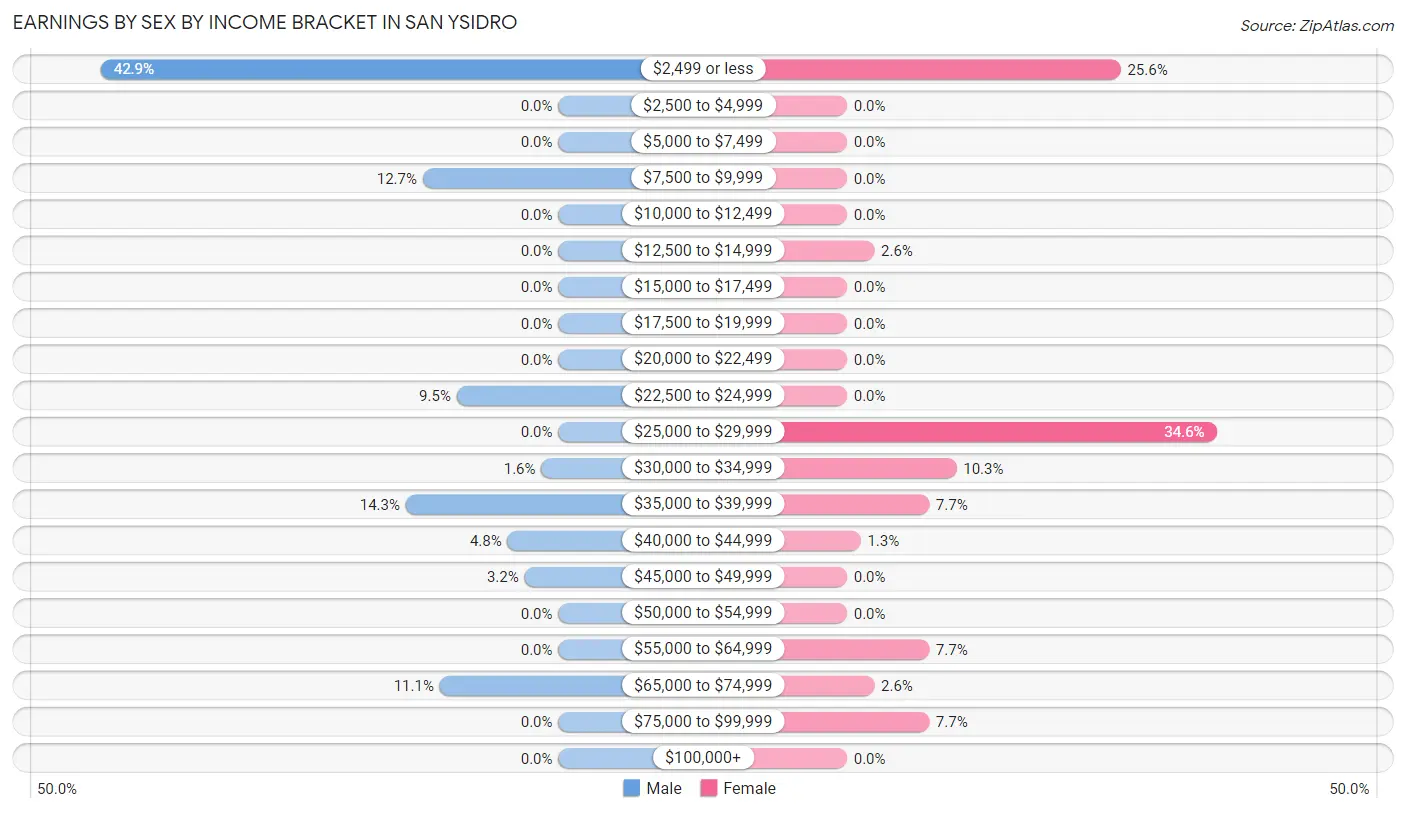
Earnings by Sex by Income Bracket in San Ysidro
The most common earnings brackets in San Ysidro are $2,499 or less for men (27 | 42.9%) and $25,000 to $29,999 for women (27 | 34.6%).
| Income | Male | Female |
| $2,499 or less | 27 (42.9%) | 20 (25.6%) |
| $2,500 to $4,999 | 0 (0.0%) | 0 (0.0%) |
| $5,000 to $7,499 | 0 (0.0%) | 0 (0.0%) |
| $7,500 to $9,999 | 8 (12.7%) | 0 (0.0%) |
| $10,000 to $12,499 | 0 (0.0%) | 0 (0.0%) |
| $12,500 to $14,999 | 0 (0.0%) | 2 (2.6%) |
| $15,000 to $17,499 | 0 (0.0%) | 0 (0.0%) |
| $17,500 to $19,999 | 0 (0.0%) | 0 (0.0%) |
| $20,000 to $22,499 | 0 (0.0%) | 0 (0.0%) |
| $22,500 to $24,999 | 6 (9.5%) | 0 (0.0%) |
| $25,000 to $29,999 | 0 (0.0%) | 27 (34.6%) |
| $30,000 to $34,999 | 1 (1.6%) | 8 (10.3%) |
| $35,000 to $39,999 | 9 (14.3%) | 6 (7.7%) |
| $40,000 to $44,999 | 3 (4.8%) | 1 (1.3%) |
| $45,000 to $49,999 | 2 (3.2%) | 0 (0.0%) |
| $50,000 to $54,999 | 0 (0.0%) | 0 (0.0%) |
| $55,000 to $64,999 | 0 (0.0%) | 6 (7.7%) |
| $65,000 to $74,999 | 7 (11.1%) | 2 (2.6%) |
| $75,000 to $99,999 | 0 (0.0%) | 6 (7.7%) |
| $100,000+ | 0 (0.0%) | 0 (0.0%) |
| Total | 63 (100.0%) | 78 (100.0%) |
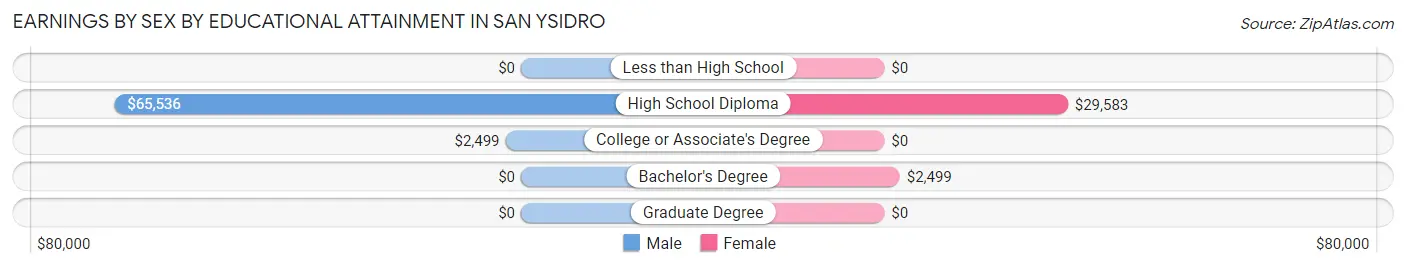
Earnings by Sex by Educational Attainment in San Ysidro
| Educational Attainment | Male Income | Female Income |
| Less than High School | - | - |
| High School Diploma | $65,536 | $29,583 |
| College or Associate's Degree | $2,499 | $0 |
| Bachelor's Degree | - | - |
| Graduate Degree | - | - |
| Total | - | - |
Family Income in San Ysidro
Family Income Brackets in San Ysidro
According to the San Ysidro family income data, there are 11 families falling into the $50,000 to $74,999 income range, which is the most common income bracket and makes up 28.9% of all families.
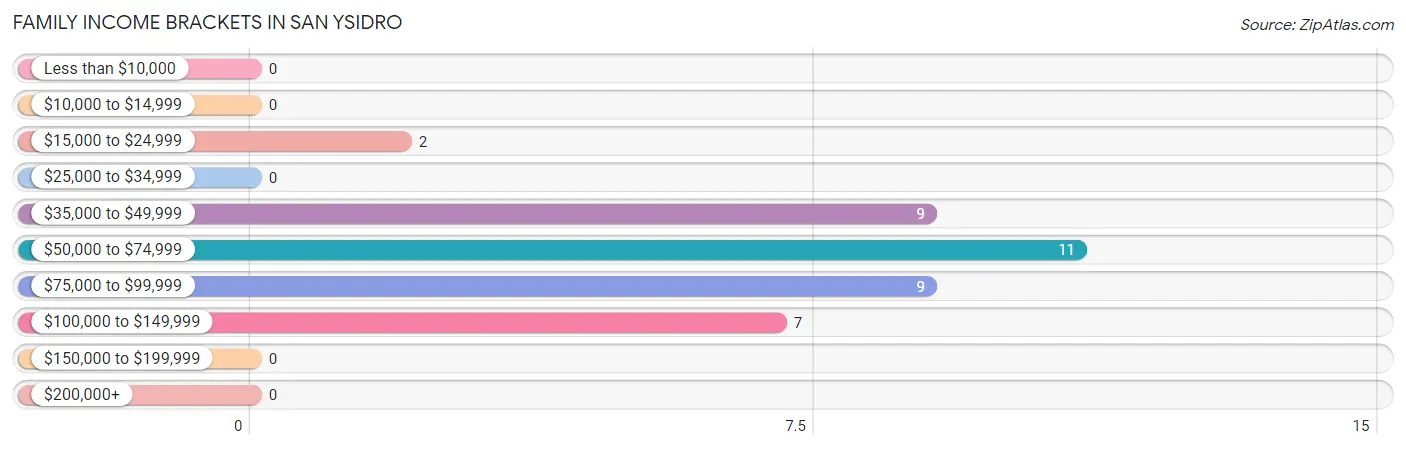
| Income Bracket | # Families | % Families |
| Less than $10,000 | 0 | 0.0% |
| $10,000 to $14,999 | 0 | 0.0% |
| $15,000 to $24,999 | 2 | 5.3% |
| $25,000 to $34,999 | 0 | 0.0% |
| $35,000 to $49,999 | 9 | 23.7% |
| $50,000 to $74,999 | 11 | 28.9% |
| $75,000 to $99,999 | 9 | 23.7% |
| $100,000 to $149,999 | 7 | 18.4% |
| $150,000 to $199,999 | 0 | 0.0% |
| $200,000+ | 0 | 0.0% |
Family Income by Famaliy Size in San Ysidro
2-person families (29 | 76.3%) account for the highest median family income in San Ysidro with $65,893 per family, while 2-person families (29 | 76.3%) have the highest median income of $32,946 per family member.
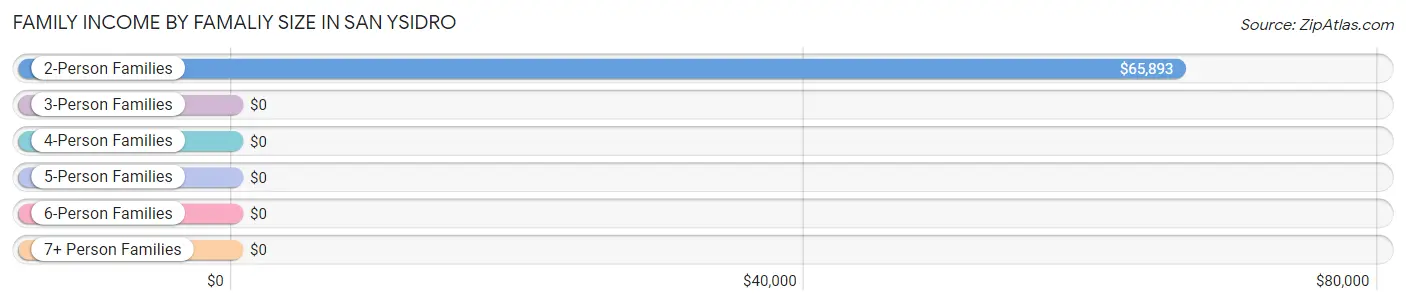
| Income Bracket | # Families | Median Income |
| 2-Person Families | 29 (76.3%) | $65,893 |
| 3-Person Families | 9 (23.7%) | $0 |
| 4-Person Families | 0 (0.0%) | $0 |
| 5-Person Families | 0 (0.0%) | $0 |
| 6-Person Families | 0 (0.0%) | $0 |
| 7+ Person Families | 0 (0.0%) | $0 |
| Total | 38 (100.0%) | $70,000 |
Family Income by Number of Earners in San Ysidro
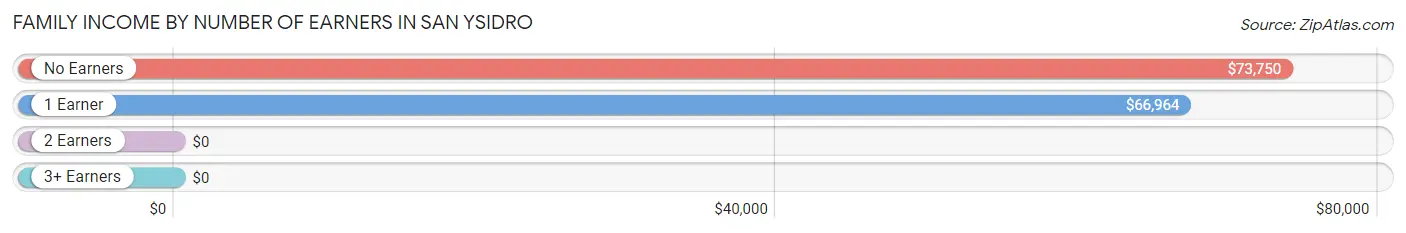
| Number of Earners | # Families | Median Income |
| No Earners | 5 (13.2%) | $73,750 |
| 1 Earner | 15 (39.5%) | $66,964 |
| 2 Earners | 18 (47.4%) | $0 |
| 3+ Earners | 0 (0.0%) | $0 |
| Total | 38 (100.0%) | $70,000 |
Household Income in San Ysidro
Household Income Brackets in San Ysidro
With 52 households falling in the category, the less than $10,000 income range is the most frequent in San Ysidro, accounting for 46.0% of all households.
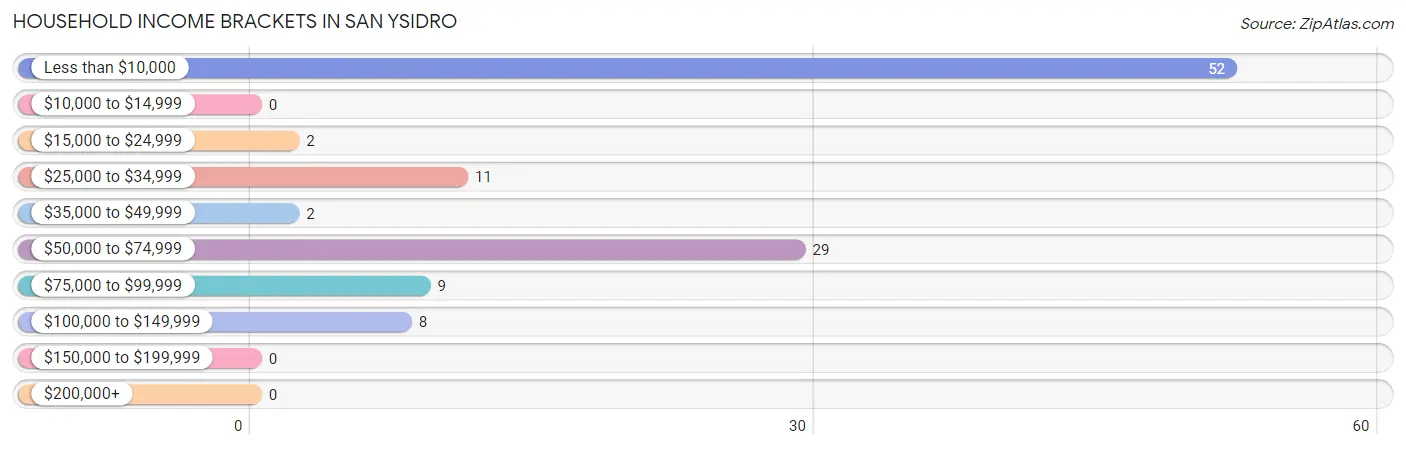
| Income Bracket | # Households | % Households |
| Less than $10,000 | 52 | 46.0% |
| $10,000 to $14,999 | 0 | 0.0% |
| $15,000 to $24,999 | 2 | 1.8% |
| $25,000 to $34,999 | 11 | 9.7% |
| $35,000 to $49,999 | 2 | 1.8% |
| $50,000 to $74,999 | 29 | 25.7% |
| $75,000 to $99,999 | 9 | 8.0% |
| $100,000 to $149,999 | 8 | 7.1% |
| $150,000 to $199,999 | 0 | 0.0% |
| $200,000+ | 0 | 0.0% |
Household Income by Householder Age in San Ysidro
| Income Bracket | # Households | Median Income |
| 15 to 24 Years | 0 (0.0%) | $0 |
| 25 to 44 Years | 39 (34.5%) | $0 |
| 45 to 64 Years | 54 (47.8%) | $0 |
| 65+ Years | 20 (17.7%) | $0 |
| Total | 113 (100.0%) | $0 |
Poverty in San Ysidro
Income Below Poverty by Sex and Age in San Ysidro
With 31.0% poverty level for males and 37.5% for females among the residents of San Ysidro, 45 to 54 year old males and 15 year old females are the most vulnerable to poverty, with 27 males (87.1%) and 5 females (100.0%) in their respective age groups living below the poverty level.
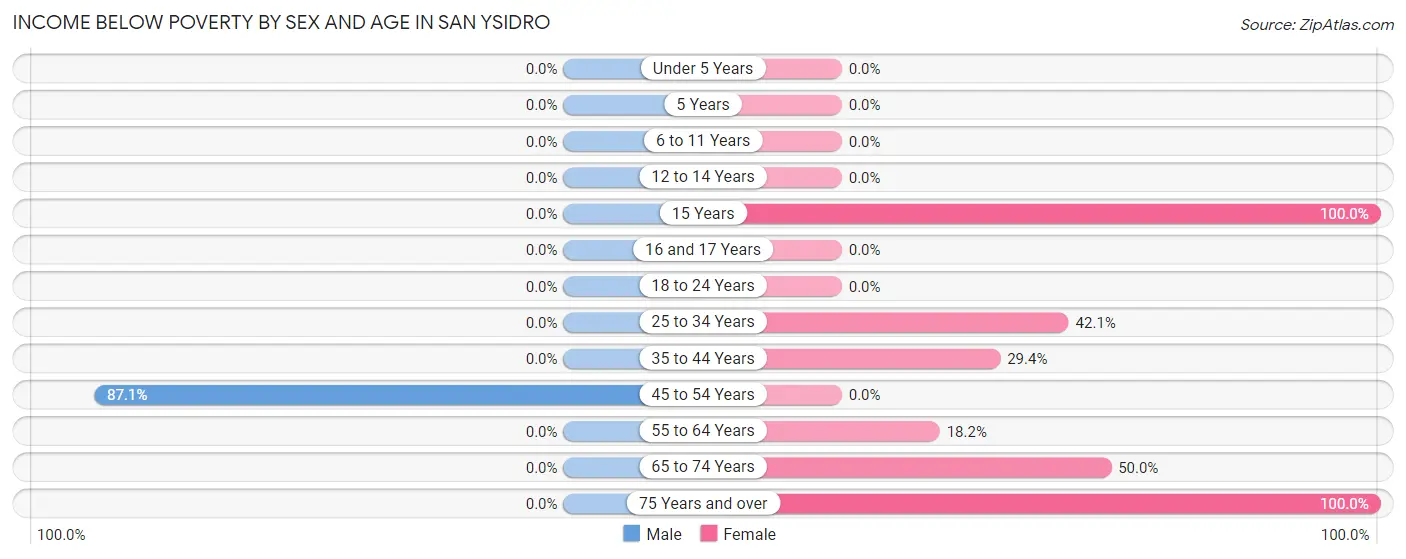
| Age Bracket | Male | Female |
| Under 5 Years | 0 (0.0%) | 0 (0.0%) |
| 5 Years | 0 (0.0%) | 0 (0.0%) |
| 6 to 11 Years | 0 (0.0%) | 0 (0.0%) |
| 12 to 14 Years | 0 (0.0%) | 0 (0.0%) |
| 15 Years | 0 (0.0%) | 5 (100.0%) |
| 16 and 17 Years | 0 (0.0%) | 0 (0.0%) |
| 18 to 24 Years | 0 (0.0%) | 0 (0.0%) |
| 25 to 34 Years | 0 (0.0%) | 24 (42.1%) |
| 35 to 44 Years | 0 (0.0%) | 5 (29.4%) |
| 45 to 54 Years | 27 (87.1%) | 0 (0.0%) |
| 55 to 64 Years | 0 (0.0%) | 4 (18.2%) |
| 65 to 74 Years | 0 (0.0%) | 9 (50.0%) |
| 75 Years and over | 0 (0.0%) | 1 (100.0%) |
| Total | 27 (31.0%) | 48 (37.5%) |
Income Above Poverty by Sex and Age in San Ysidro
According to the poverty statistics in San Ysidro, males aged under 5 years and females aged 18 to 24 years are the age groups that are most secure financially, with 100.0% of males and 100.0% of females in these age groups living above the poverty line.
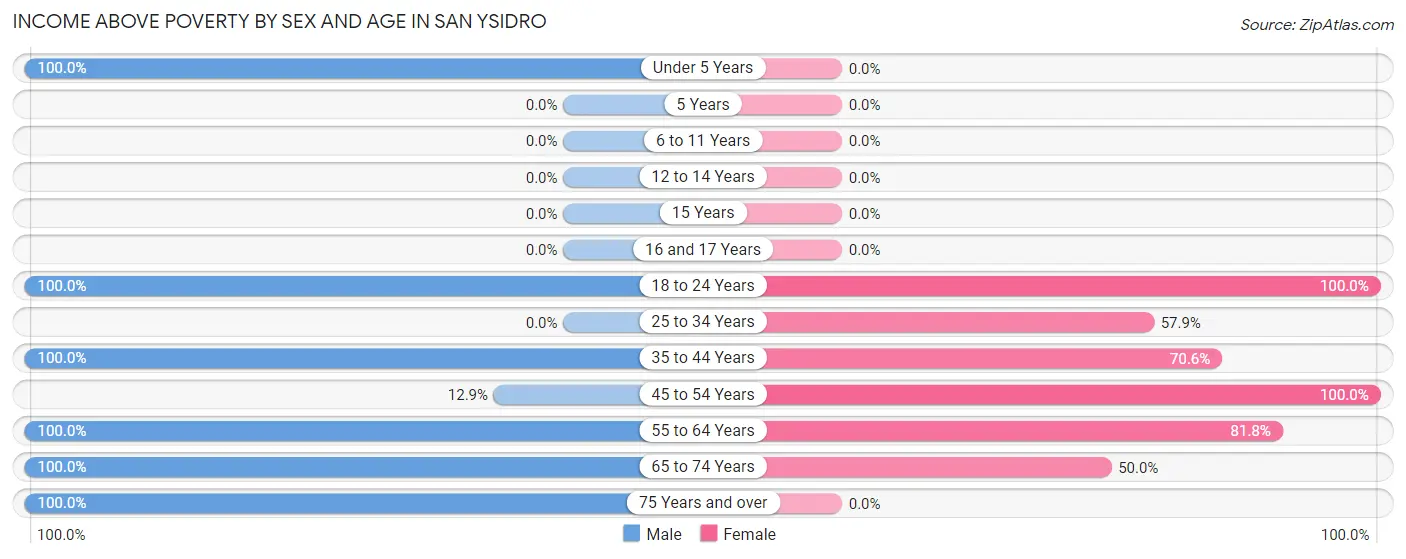
| Age Bracket | Male | Female |
| Under 5 Years | 16 (100.0%) | 0 (0.0%) |
| 5 Years | 0 (0.0%) | 0 (0.0%) |
| 6 to 11 Years | 0 (0.0%) | 0 (0.0%) |
| 12 to 14 Years | 0 (0.0%) | 0 (0.0%) |
| 15 Years | 0 (0.0%) | 0 (0.0%) |
| 16 and 17 Years | 0 (0.0%) | 0 (0.0%) |
| 18 to 24 Years | 2 (100.0%) | 2 (100.0%) |
| 25 to 34 Years | 0 (0.0%) | 33 (57.9%) |
| 35 to 44 Years | 16 (100.0%) | 12 (70.6%) |
| 45 to 54 Years | 4 (12.9%) | 6 (100.0%) |
| 55 to 64 Years | 15 (100.0%) | 18 (81.8%) |
| 65 to 74 Years | 4 (100.0%) | 9 (50.0%) |
| 75 Years and over | 3 (100.0%) | 0 (0.0%) |
| Total | 60 (69.0%) | 80 (62.5%) |
Income Below Poverty Among Married-Couple Families in San Ysidro
| Children | Above Poverty | Below Poverty |
| No Children | 23 (100.0%) | 0 (0.0%) |
| 1 or 2 Children | 0 (0.0%) | 0 (0.0%) |
| 3 or 4 Children | 0 (0.0%) | 0 (0.0%) |
| 5 or more Children | 0 (0.0%) | 0 (0.0%) |
| Total | 23 (100.0%) | 0 (0.0%) |
Income Below Poverty Among Single-Parent Households in San Ysidro
| Children | Single Father | Single Mother |
| No Children | 0 (0.0%) | 0 (0.0%) |
| 1 or 2 Children | 0 (0.0%) | 0 (0.0%) |
| 3 or 4 Children | 0 (0.0%) | 0 (0.0%) |
| 5 or more Children | 0 (0.0%) | 0 (0.0%) |
| Total | 0 (0.0%) | 0 (0.0%) |
Income Below Poverty Among Married-Couple vs Single-Parent Households in San Ysidro
| Children | Married-Couple Families | Single-Parent Households |
| No Children | 0 (0.0%) | 0 (0.0%) |
| 1 or 2 Children | 0 (0.0%) | 0 (0.0%) |
| 3 or 4 Children | 0 (0.0%) | 0 (0.0%) |
| 5 or more Children | 0 (0.0%) | 0 (0.0%) |
| Total | 0 (0.0%) | 0 (0.0%) |
Race in San Ysidro
The most populous races in San Ysidro are Hispanic or Latino (111 | 50.7%), Native / Alaskan (77 | 35.2%), and Two or more Races (69 | 31.5%).
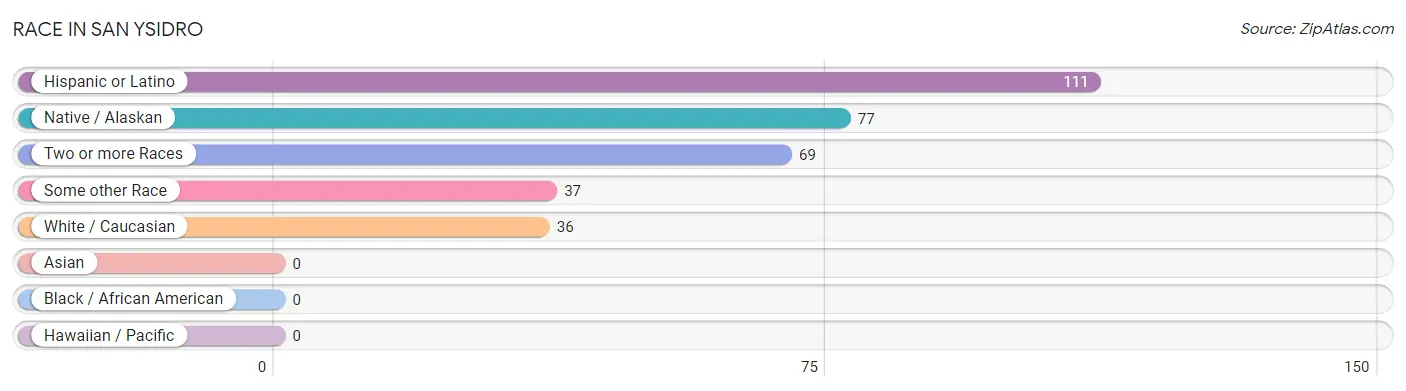
| Race | # Population | % Population |
| Asian | 0 | 0.0% |
| Black / African American | 0 | 0.0% |
| Hawaiian / Pacific | 0 | 0.0% |
| Hispanic or Latino | 111 | 50.7% |
| Native / Alaskan | 77 | 35.2% |
| White / Caucasian | 36 | 16.4% |
| Two or more Races | 69 | 31.5% |
| Some other Race | 37 | 16.9% |
| Total | 219 | 100.0% |
Ancestry in San Ysidro
The most populous ancestries reported in San Ysidro are Pueblo (77 | 35.2%), Spanish (56 | 25.6%), Mexican (44 | 20.1%), American (5 | 2.3%), and Spaniard (5 | 2.3%), together accounting for 85.4% of all San Ysidro residents.
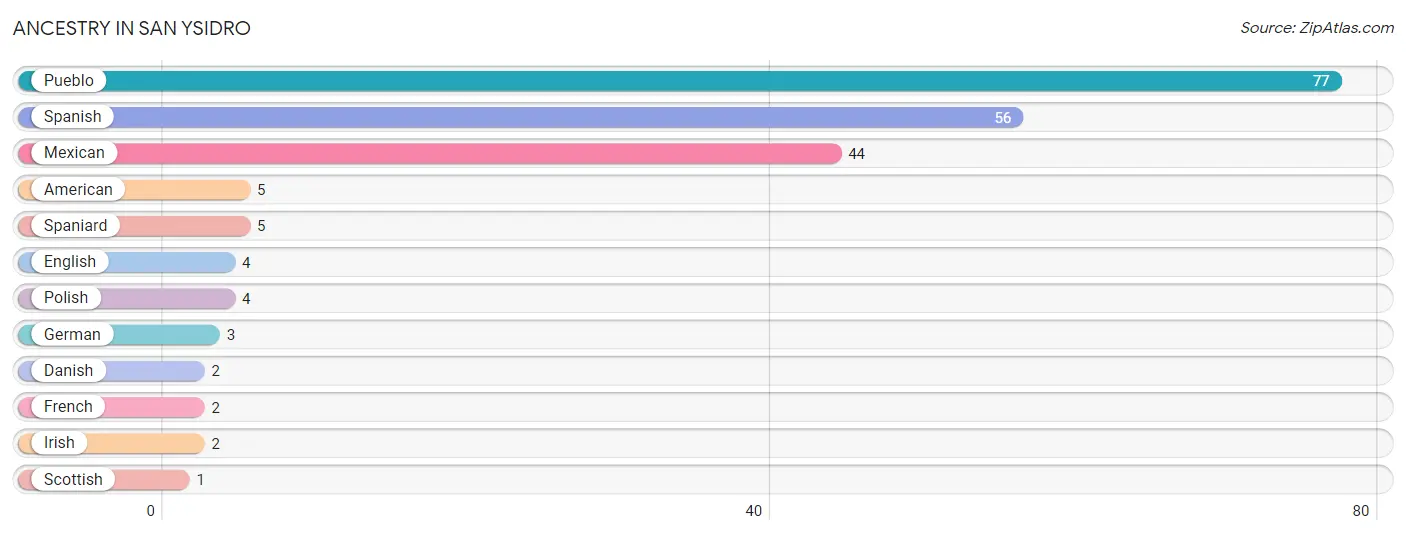
| Ancestry | # Population | % Population |
| American | 5 | 2.3% |
| Danish | 2 | 0.9% |
| English | 4 | 1.8% |
| French | 2 | 0.9% |
| German | 3 | 1.4% |
| Irish | 2 | 0.9% |
| Mexican | 44 | 20.1% |
| Polish | 4 | 1.8% |
| Pueblo | 77 | 35.2% |
| Scottish | 1 | 0.5% |
| Spaniard | 5 | 2.3% |
| Spanish | 56 | 25.6% | View All 12 Rows |
Immigrants in San Ysidro

| Immigration Origin | # Population | % Population | View All 0 Rows |
Sex and Age in San Ysidro
Sex and Age in San Ysidro
The most populous age groups in San Ysidro are 50 to 54 Years (27 | 29.7%) for men and 30 to 34 Years (34 | 26.6%) for women.
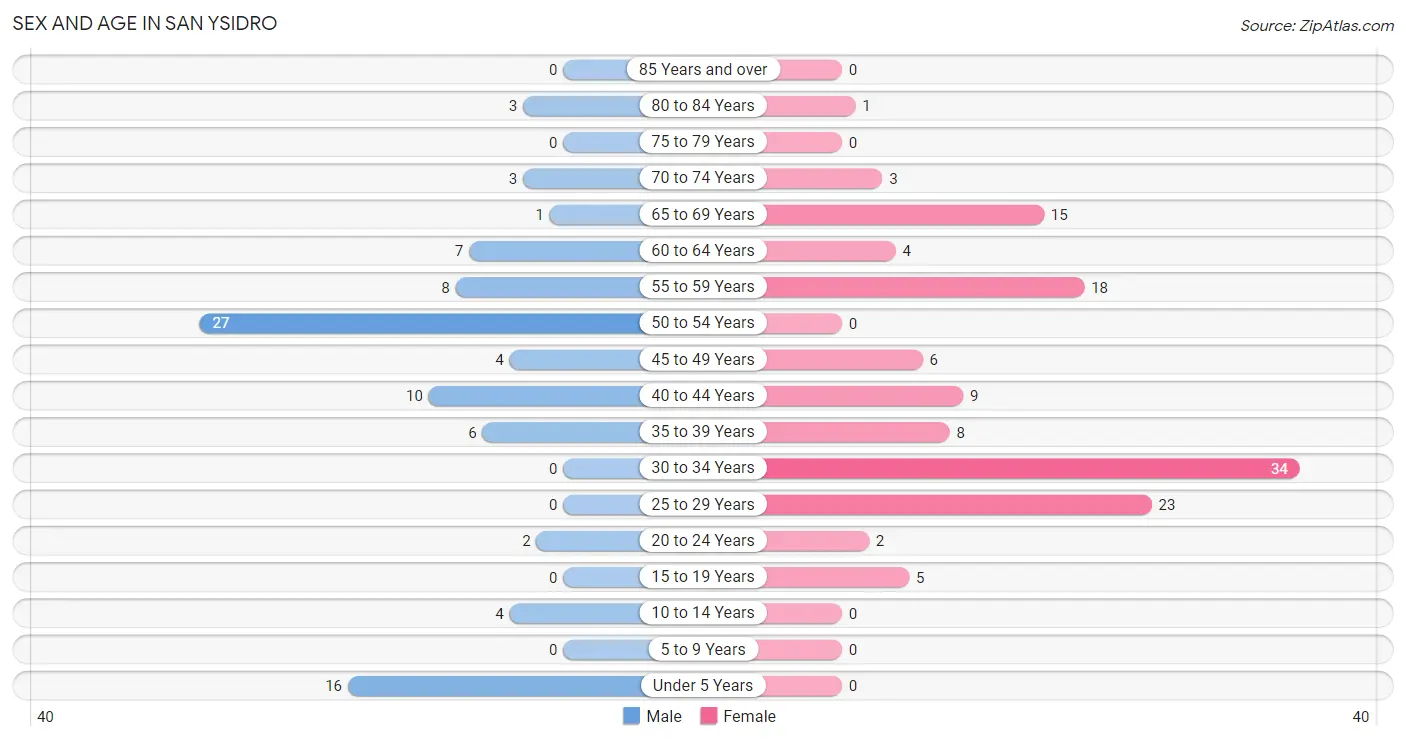
| Age Bracket | Male | Female |
| Under 5 Years | 16 (17.6%) | 0 (0.0%) |
| 5 to 9 Years | 0 (0.0%) | 0 (0.0%) |
| 10 to 14 Years | 4 (4.4%) | 0 (0.0%) |
| 15 to 19 Years | 0 (0.0%) | 5 (3.9%) |
| 20 to 24 Years | 2 (2.2%) | 2 (1.6%) |
| 25 to 29 Years | 0 (0.0%) | 23 (18.0%) |
| 30 to 34 Years | 0 (0.0%) | 34 (26.6%) |
| 35 to 39 Years | 6 (6.6%) | 8 (6.2%) |
| 40 to 44 Years | 10 (11.0%) | 9 (7.0%) |
| 45 to 49 Years | 4 (4.4%) | 6 (4.7%) |
| 50 to 54 Years | 27 (29.7%) | 0 (0.0%) |
| 55 to 59 Years | 8 (8.8%) | 18 (14.1%) |
| 60 to 64 Years | 7 (7.7%) | 4 (3.1%) |
| 65 to 69 Years | 1 (1.1%) | 15 (11.7%) |
| 70 to 74 Years | 3 (3.3%) | 3 (2.3%) |
| 75 to 79 Years | 0 (0.0%) | 0 (0.0%) |
| 80 to 84 Years | 3 (3.3%) | 1 (0.8%) |
| 85 Years and over | 0 (0.0%) | 0 (0.0%) |
| Total | 91 (100.0%) | 128 (100.0%) |
Families and Households in San Ysidro
Median Family Size in San Ysidro
The median family size in San Ysidro is 2.42 persons per family, with single female/mother families (7 | 18.4%) accounting for the largest median family size of 3.57 persons per family. On the other hand, married-couple families (23 | 60.5%) represent the smallest median family size with 2.13 persons per family.
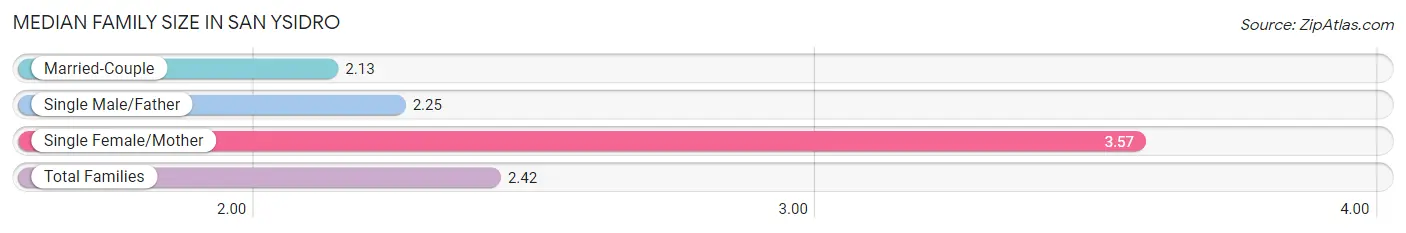
| Family Type | # Families | Family Size |
| Married-Couple | 23 (60.5%) | 2.13 |
| Single Male/Father | 8 (21.0%) | 2.25 |
| Single Female/Mother | 7 (18.4%) | 3.57 |
| Total Families | 38 (100.0%) | 2.42 |
Median Household Size in San Ysidro
The median household size in San Ysidro is 1.94 persons per household, with single female/mother households (7 | 6.2%) accounting for the largest median household size of 6 persons per household. non-family households (75 | 66.4%) represent the smallest median household size with 1.36 persons per household.
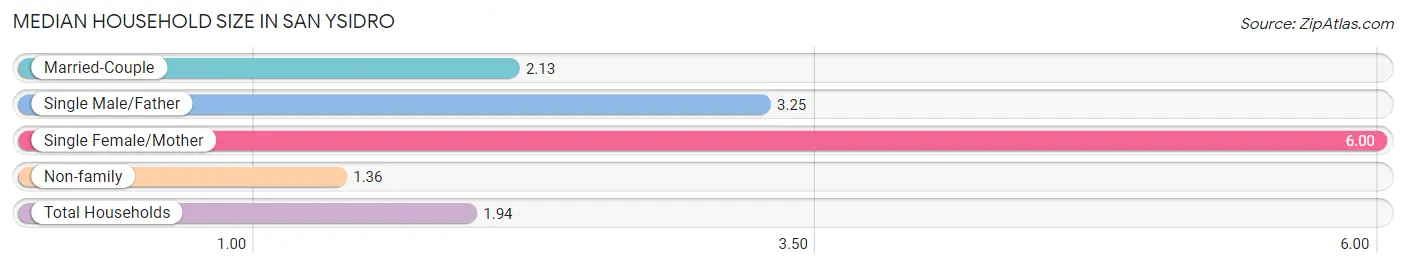
| Household Type | # Households | Household Size |
| Married-Couple | 23 (20.3%) | 2.13 |
| Single Male/Father | 8 (7.1%) | 3.25 |
| Single Female/Mother | 7 (6.2%) | 6.00 |
| Non-family | 75 (66.4%) | 1.36 |
| Total Households | 113 (100.0%) | 1.94 |
Household Size by Marriage Status in San Ysidro
Out of a total of 113 households in San Ysidro, 38 (33.6%) are family households, while 75 (66.4%) are nonfamily households. The most numerous type of family households are 2-person households, comprising 20, and the most common type of nonfamily households are 1-person households, comprising 39.
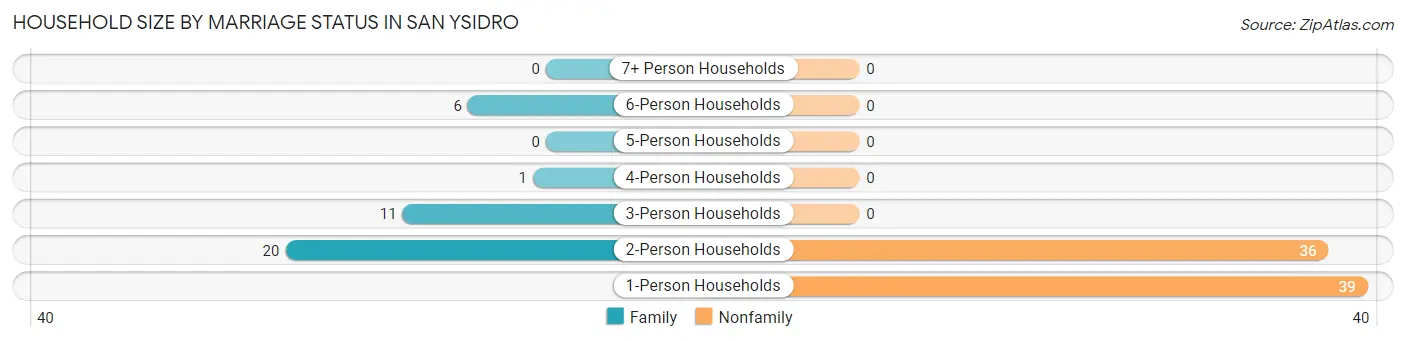
| Household Size | Family Households | Nonfamily Households |
| 1-Person Households | - | 39 (34.5%) |
| 2-Person Households | 20 (17.7%) | 36 (31.9%) |
| 3-Person Households | 11 (9.7%) | 0 (0.0%) |
| 4-Person Households | 1 (0.9%) | 0 (0.0%) |
| 5-Person Households | 0 (0.0%) | 0 (0.0%) |
| 6-Person Households | 6 (5.3%) | 0 (0.0%) |
| 7+ Person Households | 0 (0.0%) | 0 (0.0%) |
| Total | 38 (33.6%) | 75 (66.4%) |
Female Fertility in San Ysidro
Fertility by Age in San Ysidro
Average fertility rate in San Ysidro is 69.0 births per 1,000 women. Women in the age bracket of 20 to 34 years have the highest fertility rate with 102.0 births per 1,000 women. Women in the age bracket of 20 to 34 years acount for 100.0% of all women with births.
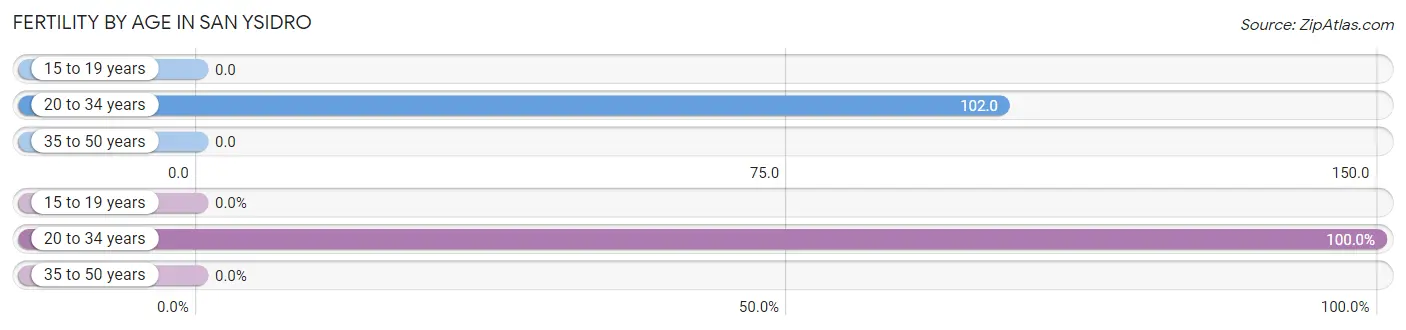
| Age Bracket | Women with Births | Births / 1,000 Women |
| 15 to 19 years | 0 (0.0%) | 0.0 |
| 20 to 34 years | 6 (100.0%) | 102.0 |
| 35 to 50 years | 0 (0.0%) | 0.0 |
| Total | 6 (100.0%) | 69.0 |
Fertility by Age by Marriage Status in San Ysidro
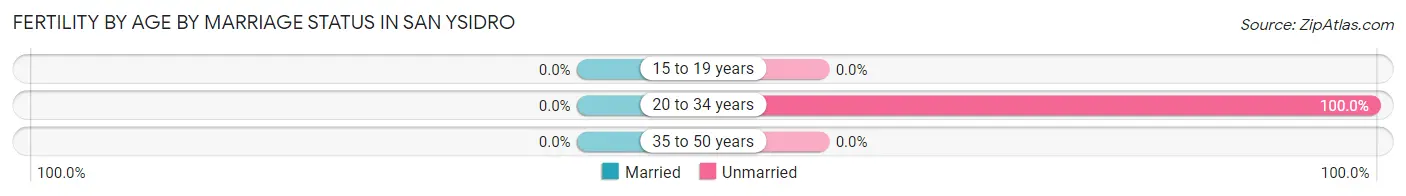
| Age Bracket | Married | Unmarried |
| 15 to 19 years | 0 (0.0%) | 0 (0.0%) |
| 20 to 34 years | 0 (0.0%) | 6 (100.0%) |
| 35 to 50 years | 0 (0.0%) | 0 (0.0%) |
| Total | 0 (0.0%) | 6 (100.0%) |
Fertility by Education in San Ysidro
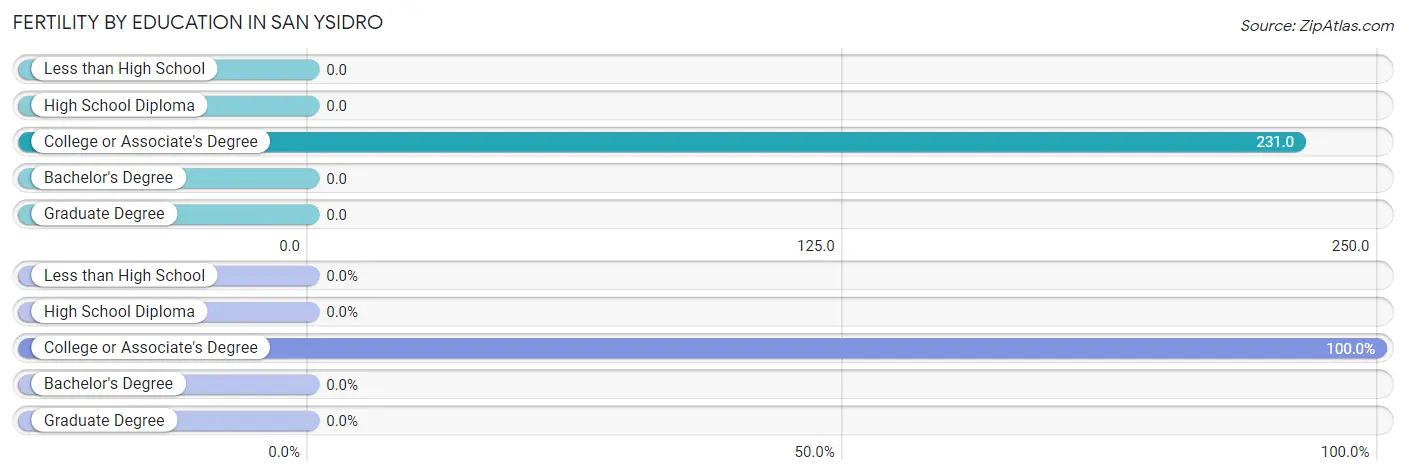
| Educational Attainment | Women with Births | Births / 1,000 Women |
| Less than High School | 0 (0.0%) | 0.0 |
| High School Diploma | 0 (0.0%) | 0.0 |
| College or Associate's Degree | 6 (100.0%) | 231.0 |
| Bachelor's Degree | 0 (0.0%) | 0.0 |
| Graduate Degree | 0 (0.0%) | 0.0 |
| Total | 6 (100.0%) | 69.0 |
Fertility by Education by Marriage Status in San Ysidro
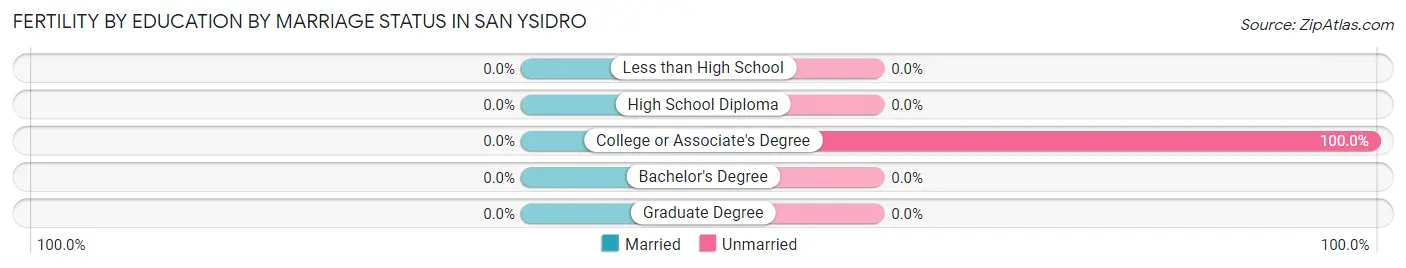
| Educational Attainment | Married | Unmarried |
| Less than High School | 0 (0.0%) | 0 (0.0%) |
| High School Diploma | 0 (0.0%) | 0 (0.0%) |
| College or Associate's Degree | 0 (0.0%) | 6 (100.0%) |
| Bachelor's Degree | 0 (0.0%) | 0 (0.0%) |
| Graduate Degree | 0 (0.0%) | 0 (0.0%) |
| Total | 0 (0.0%) | 6 (100.0%) |
Employment Characteristics in San Ysidro
Employment by Class of Employer in San Ysidro
Among the 90 employed individuals in San Ysidro, private company employees (75 | 83.3%), self-employed (incorporated) (12 | 13.3%), and federal government employees (2 | 2.2%) make up the most common classes of employment.
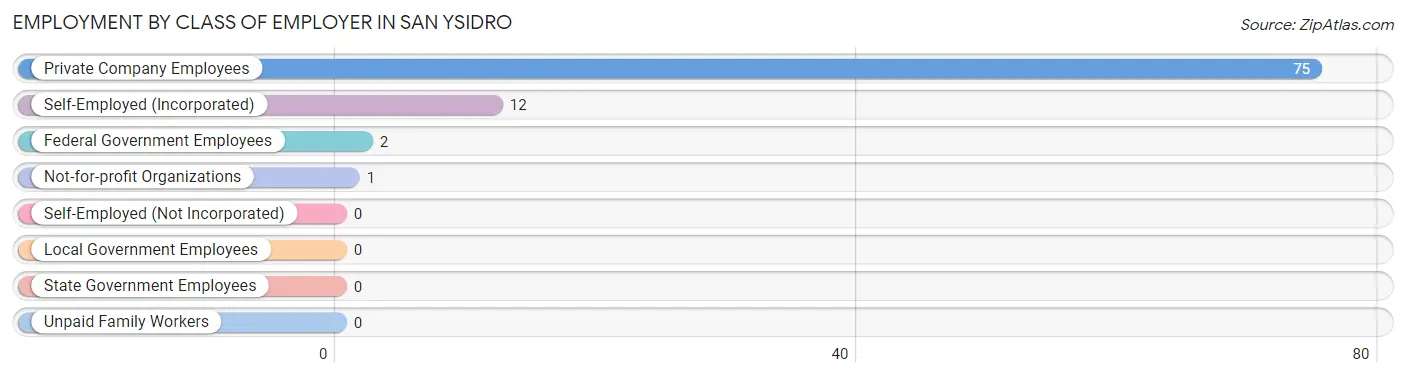
| Employer Class | # Employees | % Employees |
| Private Company Employees | 75 | 83.3% |
| Self-Employed (Incorporated) | 12 | 13.3% |
| Self-Employed (Not Incorporated) | 0 | 0.0% |
| Not-for-profit Organizations | 1 | 1.1% |
| Local Government Employees | 0 | 0.0% |
| State Government Employees | 0 | 0.0% |
| Federal Government Employees | 2 | 2.2% |
| Unpaid Family Workers | 0 | 0.0% |
| Total | 90 | 100.0% |
Employment Status by Age in San Ysidro
According to the labor force statistics for San Ysidro, out of the total population over 16 years of age (194), 49.5% or 96 individuals are in the labor force, with 5.2% or 5 of them unemployed. The age group with the highest labor force participation rate is 20 to 24 years, with 100.0% or 4 individuals in the labor force. Within the labor force, the 65 to 74 years age range has the highest percentage of unemployed individuals, with 100.0% or 5 of them being unemployed.
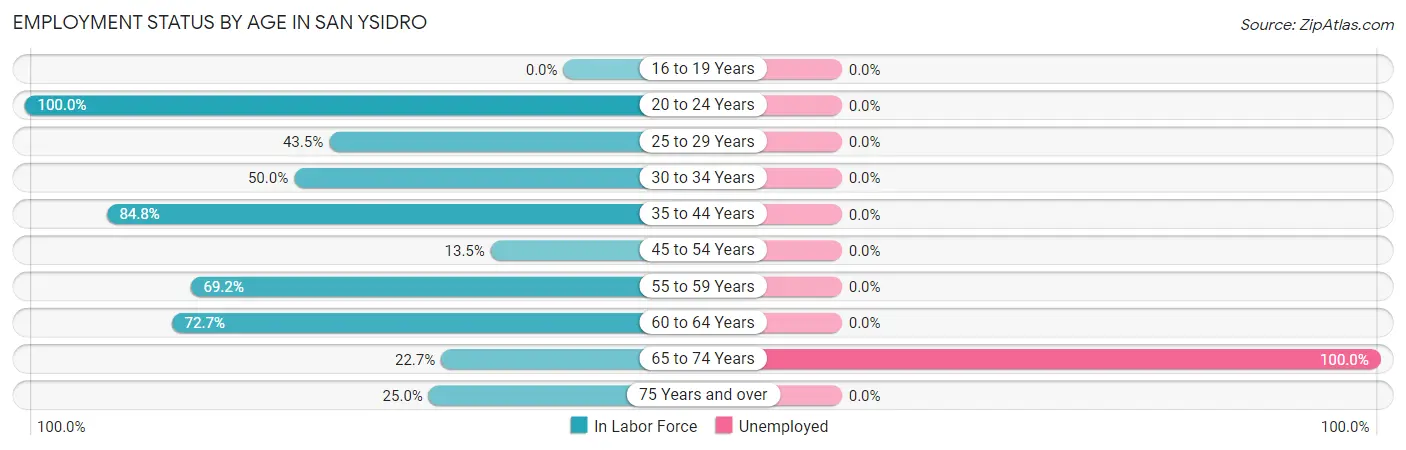
| Age Bracket | In Labor Force | Unemployed |
| 16 to 19 Years | 0 (0.0%) | 0 (0.0%) |
| 20 to 24 Years | 4 (100.0%) | 0 (0.0%) |
| 25 to 29 Years | 10 (43.5%) | 0 (0.0%) |
| 30 to 34 Years | 17 (50.0%) | 0 (0.0%) |
| 35 to 44 Years | 28 (84.8%) | 0 (0.0%) |
| 45 to 54 Years | 5 (13.5%) | 0 (0.0%) |
| 55 to 59 Years | 18 (69.2%) | 0 (0.0%) |
| 60 to 64 Years | 8 (72.7%) | 0 (0.0%) |
| 65 to 74 Years | 5 (22.7%) | 5 (100.0%) |
| 75 Years and over | 1 (25.0%) | 0 (0.0%) |
| Total | 96 (49.5%) | 5 (5.2%) |
Employment Status by Educational Attainment in San Ysidro
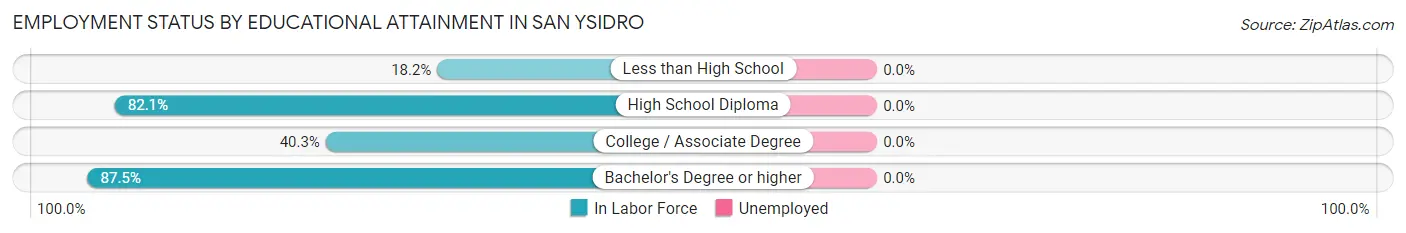
| Educational Attainment | In Labor Force | Unemployed |
| Less than High School | 6 (18.2%) | 0 (0.0%) |
| High School Diploma | 46 (82.1%) | 0 (0.0%) |
| College / Associate Degree | 27 (40.3%) | 0 (0.0%) |
| Bachelor's Degree or higher | 7 (87.5%) | 0 (0.0%) |
| Total | 86 (52.4%) | 0 (0.0%) |
Employment Occupations by Sex in San Ysidro
Management, Business, Science and Arts Occupations
The most common Management, Business, Science and Arts occupations in San Ysidro are Management (9 | 9.9%), Health Diagnosing & Treating (7 | 7.7%), Health Technologists (7 | 7.7%), Computers, Engineering & Science (4 | 4.4%), and Architecture & Engineering (4 | 4.4%).
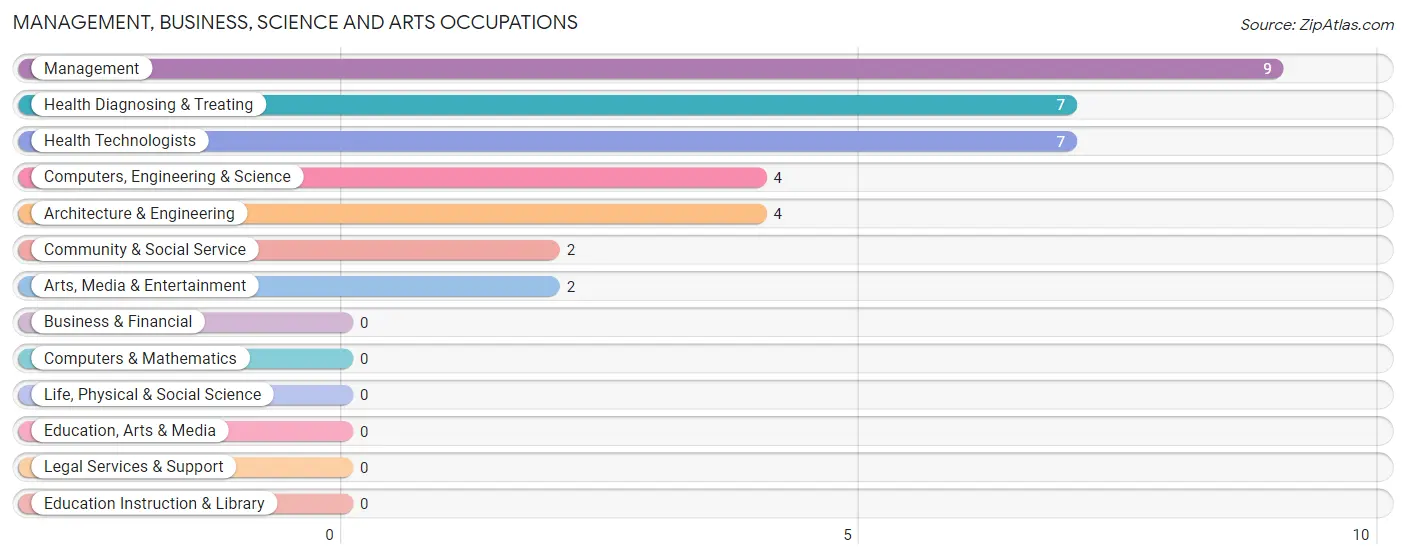
Management, Business, Science and Arts Occupations by Sex
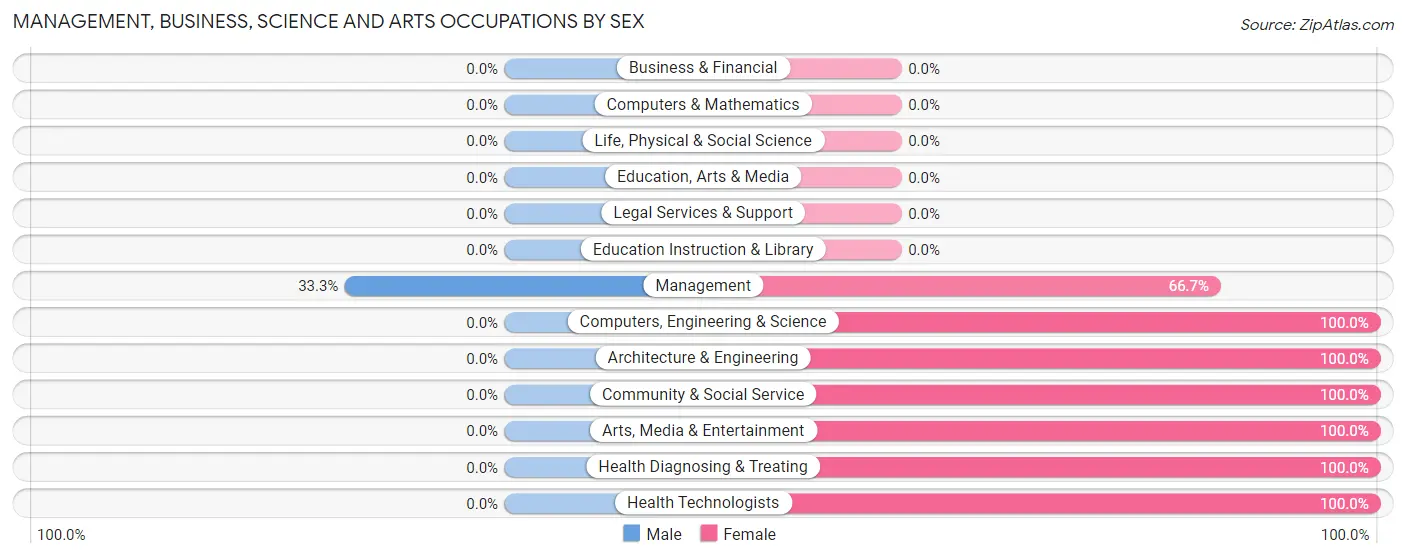
| Occupation | Male | Female |
| Management | 3 (33.3%) | 6 (66.7%) |
| Business & Financial | 0 (0.0%) | 0 (0.0%) |
| Computers, Engineering & Science | 0 (0.0%) | 4 (100.0%) |
| Computers & Mathematics | 0 (0.0%) | 0 (0.0%) |
| Architecture & Engineering | 0 (0.0%) | 4 (100.0%) |
| Life, Physical & Social Science | 0 (0.0%) | 0 (0.0%) |
| Community & Social Service | 0 (0.0%) | 2 (100.0%) |
| Education, Arts & Media | 0 (0.0%) | 0 (0.0%) |
| Legal Services & Support | 0 (0.0%) | 0 (0.0%) |
| Education Instruction & Library | 0 (0.0%) | 0 (0.0%) |
| Arts, Media & Entertainment | 0 (0.0%) | 2 (100.0%) |
| Health Diagnosing & Treating | 0 (0.0%) | 7 (100.0%) |
| Health Technologists | 0 (0.0%) | 7 (100.0%) |
| Total (Category) | 3 (13.6%) | 19 (86.4%) |
| Total (Overall) | 28 (30.8%) | 63 (69.2%) |
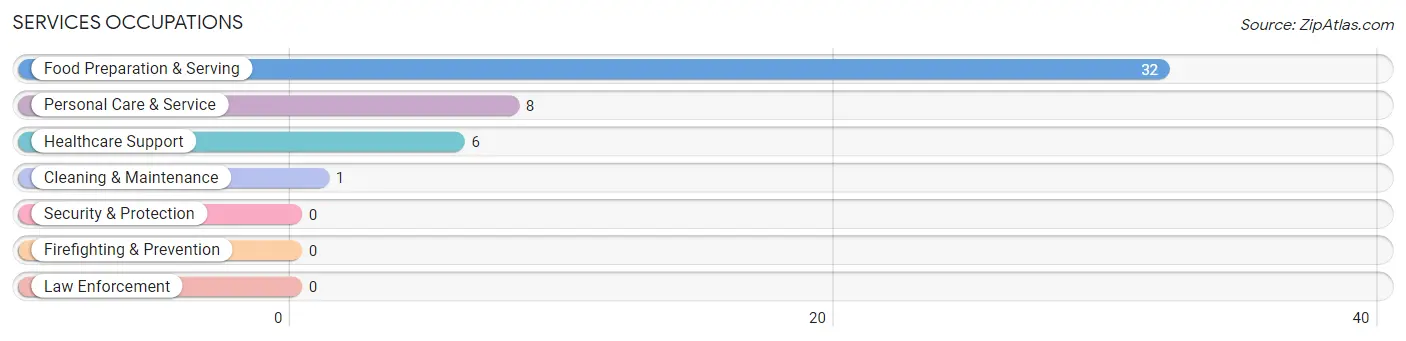
Services Occupations
The most common Services occupations in San Ysidro are Food Preparation & Serving (32 | 35.2%), Personal Care & Service (8 | 8.8%), Healthcare Support (6 | 6.6%), and Cleaning & Maintenance (1 | 1.1%).
Services Occupations by Sex
Within the Services occupations in San Ysidro, the most male-oriented occupations are Cleaning & Maintenance (100.0%), and Personal Care & Service (37.5%), while the most female-oriented occupations are Healthcare Support (100.0%), Food Preparation & Serving (100.0%), and Personal Care & Service (62.5%).
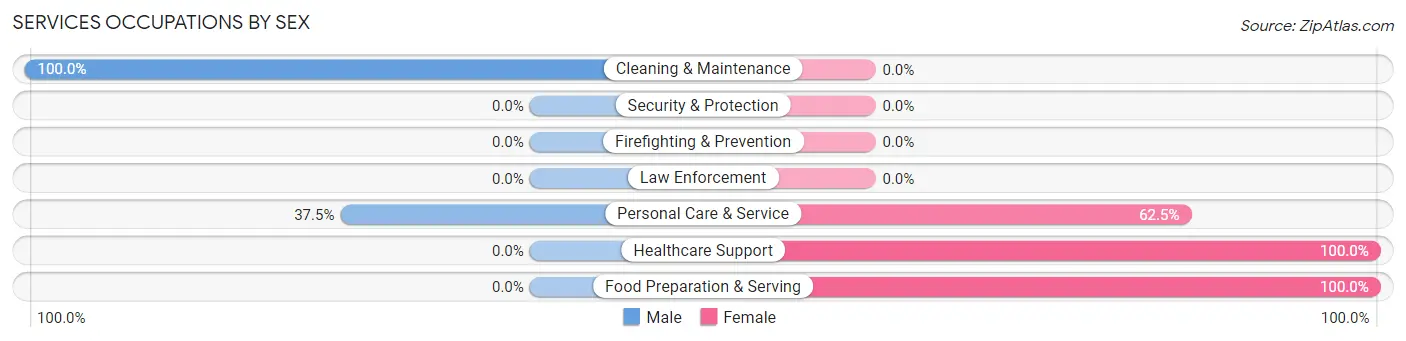
| Occupation | Male | Female |
| Healthcare Support | 0 (0.0%) | 6 (100.0%) |
| Security & Protection | 0 (0.0%) | 0 (0.0%) |
| Firefighting & Prevention | 0 (0.0%) | 0 (0.0%) |
| Law Enforcement | 0 (0.0%) | 0 (0.0%) |
| Food Preparation & Serving | 0 (0.0%) | 32 (100.0%) |
| Cleaning & Maintenance | 1 (100.0%) | 0 (0.0%) |
| Personal Care & Service | 3 (37.5%) | 5 (62.5%) |
| Total (Category) | 4 (8.5%) | 43 (91.5%) |
| Total (Overall) | 28 (30.8%) | 63 (69.2%) |
Sales and Office Occupations
The most common Sales and Office occupations in San Ysidro are , and Sales & Related (6 | 6.6%).
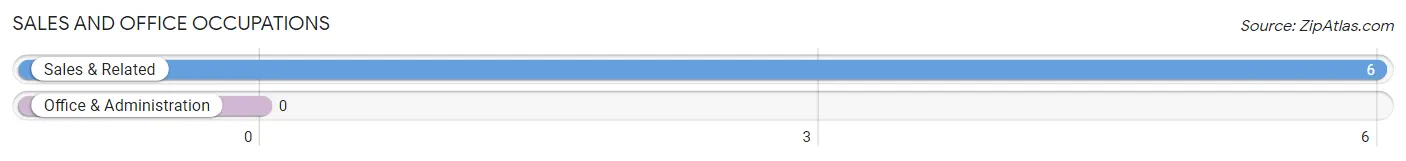
Sales and Office Occupations by Sex

| Occupation | Male | Female |
| Sales & Related | 6 (100.0%) | 0 (0.0%) |
| Office & Administration | 0 (0.0%) | 0 (0.0%) |
| Total (Category) | 6 (100.0%) | 0 (0.0%) |
| Total (Overall) | 28 (30.8%) | 63 (69.2%) |
Natural Resources, Construction and Maintenance Occupations
The most common Natural Resources, Construction and Maintenance occupations in San Ysidro are Construction & Extraction (8 | 8.8%), and Farming, Fishing & Forestry (7 | 7.7%).
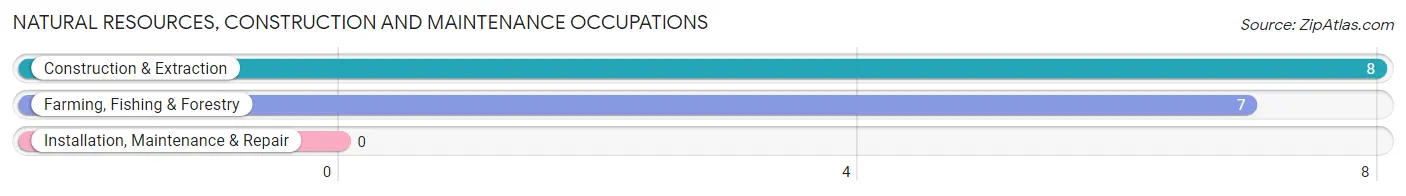
Natural Resources, Construction and Maintenance Occupations by Sex
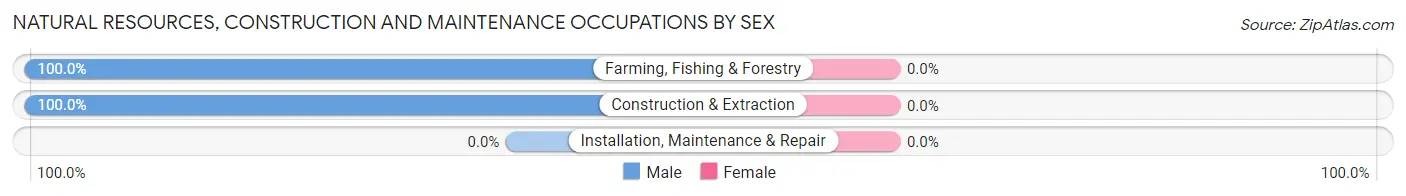
| Occupation | Male | Female |
| Farming, Fishing & Forestry | 7 (100.0%) | 0 (0.0%) |
| Construction & Extraction | 8 (100.0%) | 0 (0.0%) |
| Installation, Maintenance & Repair | 0 (0.0%) | 0 (0.0%) |
| Total (Category) | 15 (100.0%) | 0 (0.0%) |
| Total (Overall) | 28 (30.8%) | 63 (69.2%) |
Production, Transportation and Moving Occupations
The most common Production, Transportation and Moving occupations in San Ysidro are , and Production (1 | 1.1%).
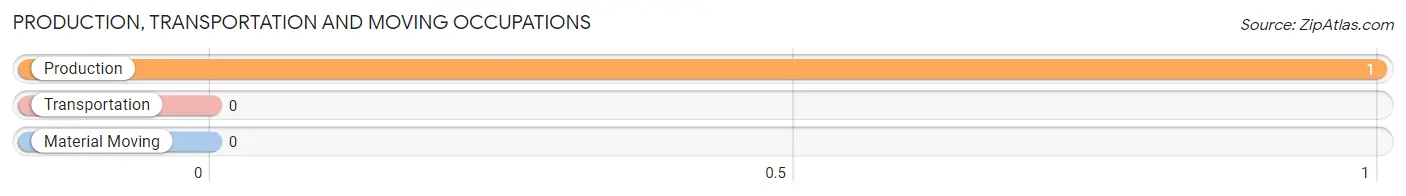
Production, Transportation and Moving Occupations by Sex
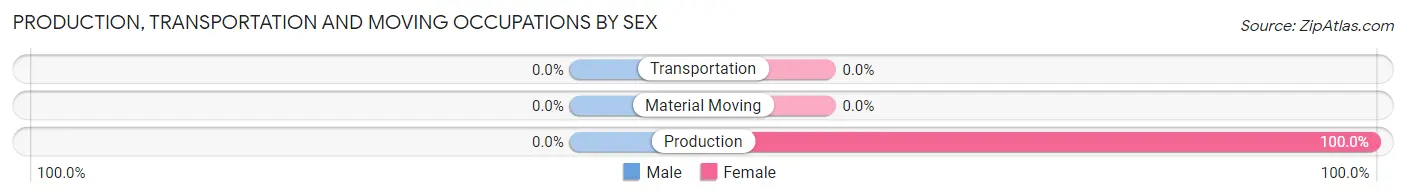
| Occupation | Male | Female |
| Production | 0 (0.0%) | 1 (100.0%) |
| Transportation | 0 (0.0%) | 0 (0.0%) |
| Material Moving | 0 (0.0%) | 0 (0.0%) |
| Total (Category) | 0 (0.0%) | 1 (100.0%) |
| Total (Overall) | 28 (30.8%) | 63 (69.2%) |
Employment Industries by Sex in San Ysidro
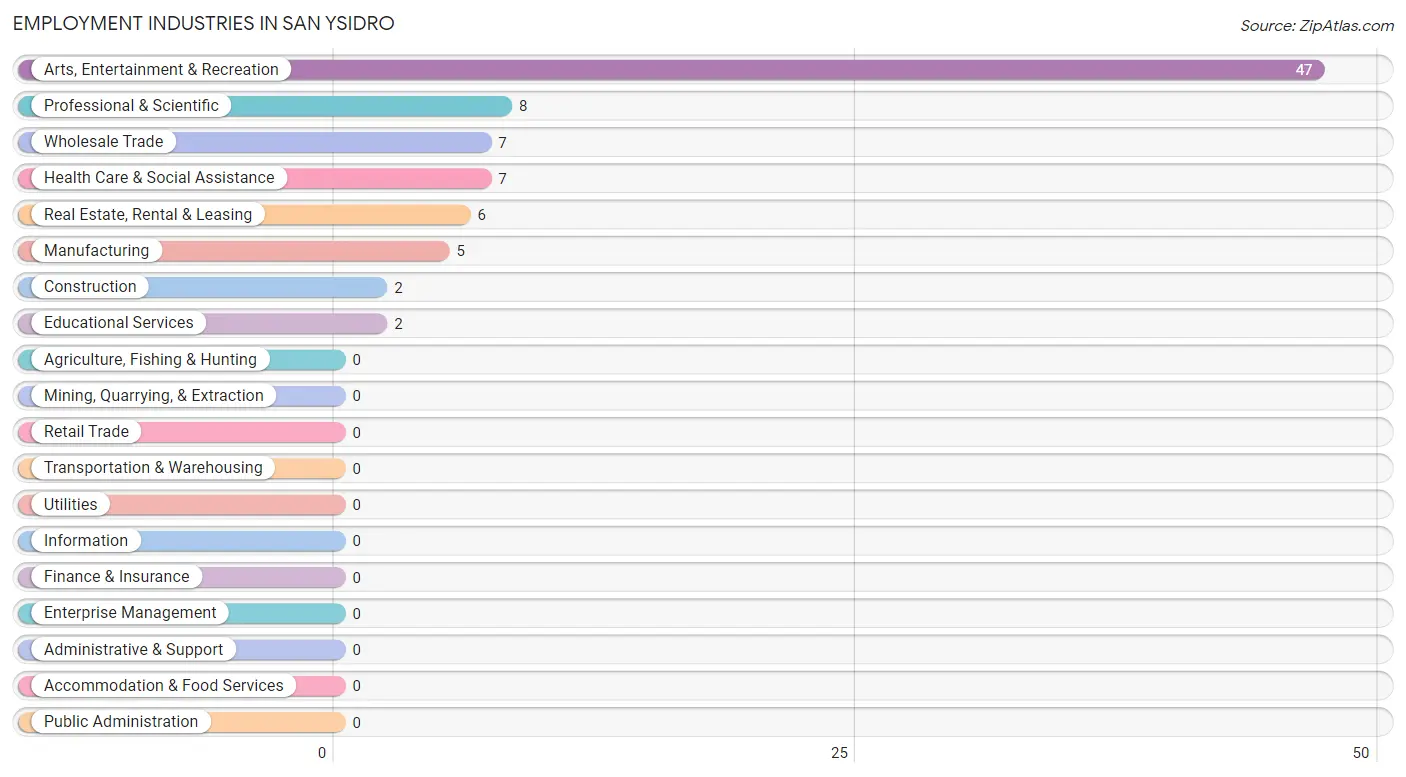
Employment Industries in San Ysidro
The major employment industries in San Ysidro include Arts, Entertainment & Recreation (47 | 51.6%), Professional & Scientific (8 | 8.8%), Wholesale Trade (7 | 7.7%), Health Care & Social Assistance (7 | 7.7%), and Real Estate, Rental & Leasing (6 | 6.6%).
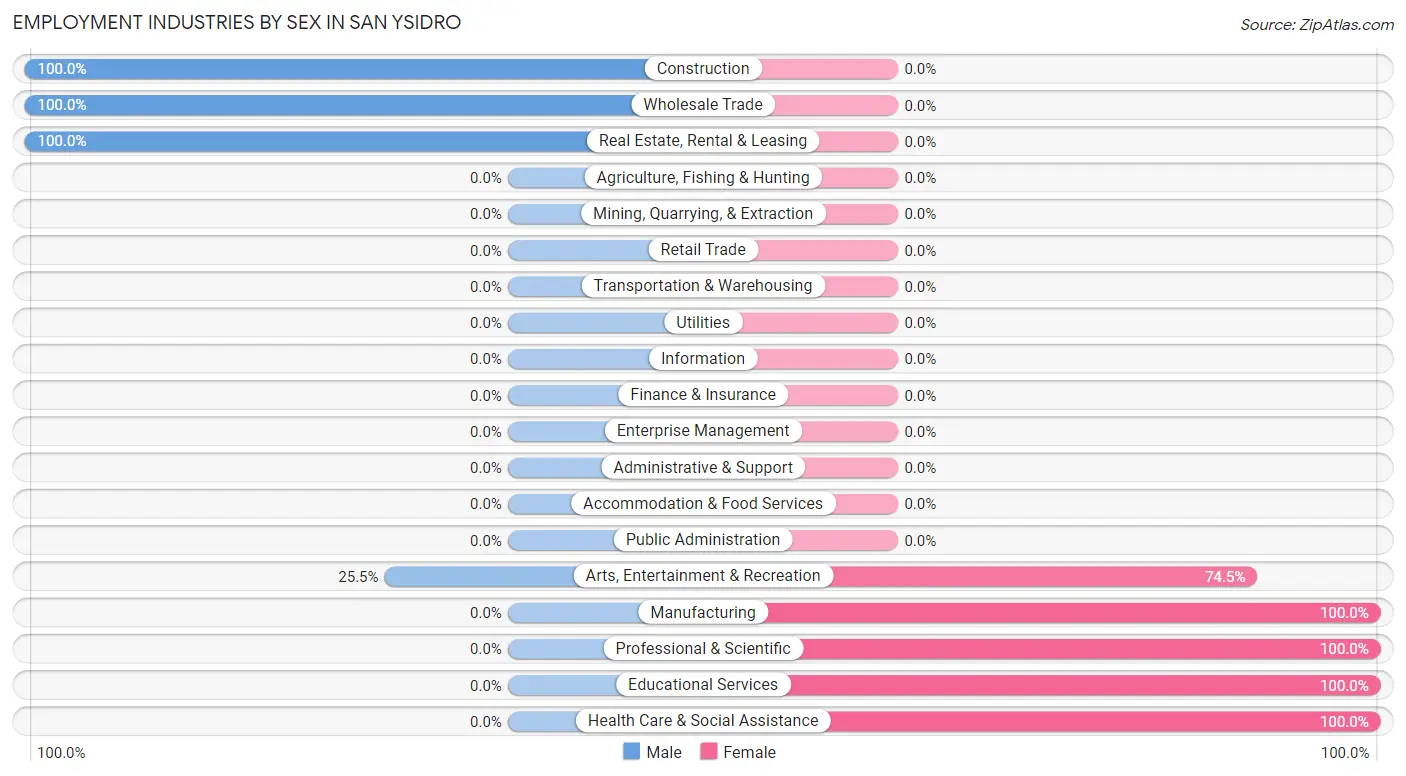
Employment Industries by Sex in San Ysidro
The San Ysidro industries that see more men than women are Construction (100.0%), Wholesale Trade (100.0%), and Real Estate, Rental & Leasing (100.0%), whereas the industries that tend to have a higher number of women are Manufacturing (100.0%), Professional & Scientific (100.0%), and Educational Services (100.0%).
| Industry | Male | Female |
| Agriculture, Fishing & Hunting | 0 (0.0%) | 0 (0.0%) |
| Mining, Quarrying, & Extraction | 0 (0.0%) | 0 (0.0%) |
| Construction | 2 (100.0%) | 0 (0.0%) |
| Manufacturing | 0 (0.0%) | 5 (100.0%) |
| Wholesale Trade | 7 (100.0%) | 0 (0.0%) |
| Retail Trade | 0 (0.0%) | 0 (0.0%) |
| Transportation & Warehousing | 0 (0.0%) | 0 (0.0%) |
| Utilities | 0 (0.0%) | 0 (0.0%) |
| Information | 0 (0.0%) | 0 (0.0%) |
| Finance & Insurance | 0 (0.0%) | 0 (0.0%) |
| Real Estate, Rental & Leasing | 6 (100.0%) | 0 (0.0%) |
| Professional & Scientific | 0 (0.0%) | 8 (100.0%) |
| Enterprise Management | 0 (0.0%) | 0 (0.0%) |
| Administrative & Support | 0 (0.0%) | 0 (0.0%) |
| Educational Services | 0 (0.0%) | 2 (100.0%) |
| Health Care & Social Assistance | 0 (0.0%) | 7 (100.0%) |
| Arts, Entertainment & Recreation | 12 (25.5%) | 35 (74.5%) |
| Accommodation & Food Services | 0 (0.0%) | 0 (0.0%) |
| Public Administration | 0 (0.0%) | 0 (0.0%) |
| Total | 28 (30.8%) | 63 (69.2%) |
Education in San Ysidro
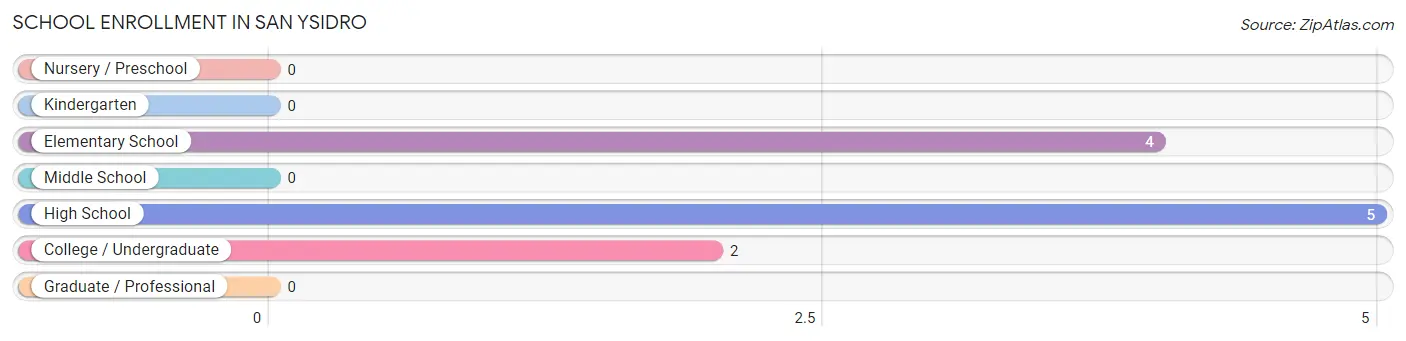
School Enrollment in San Ysidro
The most common levels of schooling among the 11 students in San Ysidro are high school (5 | 45.5%), elementary school (4 | 36.4%), and college / undergraduate (2 | 18.2%).
| School Level | # Students | % Students |
| Nursery / Preschool | 0 | 0.0% |
| Kindergarten | 0 | 0.0% |
| Elementary School | 4 | 36.4% |
| Middle School | 0 | 0.0% |
| High School | 5 | 45.5% |
| College / Undergraduate | 2 | 18.2% |
| Graduate / Professional | 0 | 0.0% |
| Total | 11 | 100.0% |
School Enrollment by Age by Funding Source in San Ysidro
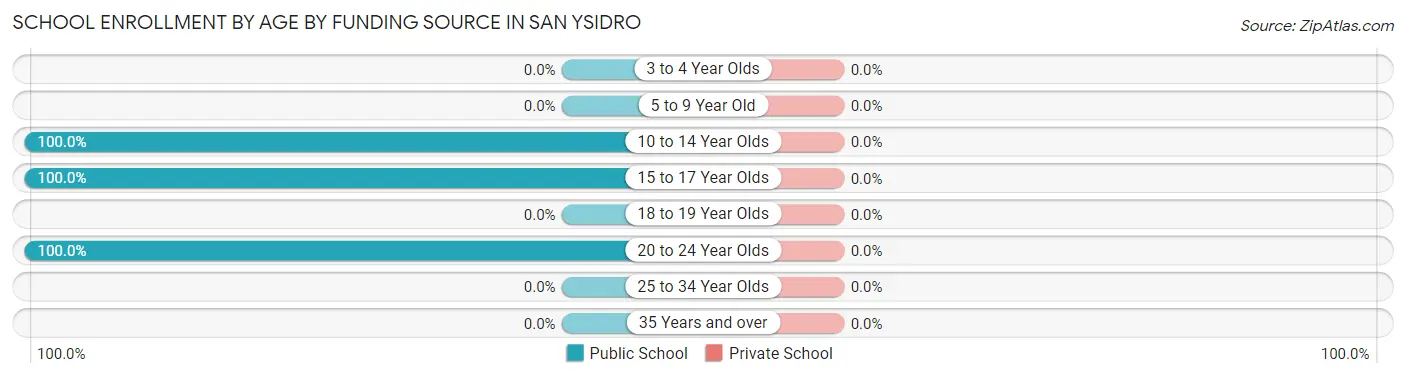
| Age Bracket | Public School | Private School |
| 3 to 4 Year Olds | 0 (0.0%) | 0 (0.0%) |
| 5 to 9 Year Old | 0 (0.0%) | 0 (0.0%) |
| 10 to 14 Year Olds | 4 (100.0%) | 0 (0.0%) |
| 15 to 17 Year Olds | 5 (100.0%) | 0 (0.0%) |
| 18 to 19 Year Olds | 0 (0.0%) | 0 (0.0%) |
| 20 to 24 Year Olds | 2 (100.0%) | 0 (0.0%) |
| 25 to 34 Year Olds | 0 (0.0%) | 0 (0.0%) |
| 35 Years and over | 0 (0.0%) | 0 (0.0%) |
| Total | 11 (100.0%) | 0 (0.0%) |
Educational Attainment by Field of Study in San Ysidro
Business (10 | 62.5%), visual & performing arts (3 | 18.8%), science & technology (2 | 12.5%), and education (1 | 6.2%) are the most common fields of study among 16 individuals in San Ysidro who have obtained a bachelor's degree or higher.
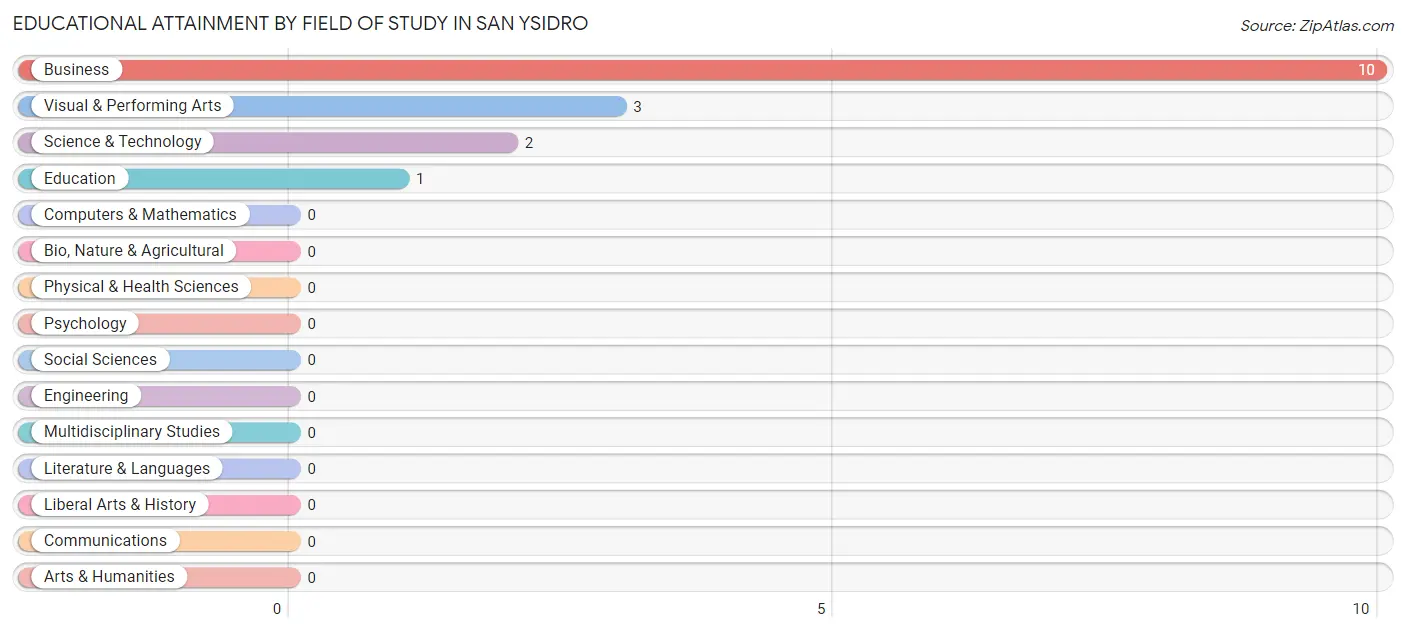
| Field of Study | # Graduates | % Graduates |
| Computers & Mathematics | 0 | 0.0% |
| Bio, Nature & Agricultural | 0 | 0.0% |
| Physical & Health Sciences | 0 | 0.0% |
| Psychology | 0 | 0.0% |
| Social Sciences | 0 | 0.0% |
| Engineering | 0 | 0.0% |
| Multidisciplinary Studies | 0 | 0.0% |
| Science & Technology | 2 | 12.5% |
| Business | 10 | 62.5% |
| Education | 1 | 6.2% |
| Literature & Languages | 0 | 0.0% |
| Liberal Arts & History | 0 | 0.0% |
| Visual & Performing Arts | 3 | 18.8% |
| Communications | 0 | 0.0% |
| Arts & Humanities | 0 | 0.0% |
| Total | 16 | 100.0% |
Transportation & Commute in San Ysidro
Vehicle Availability by Sex in San Ysidro
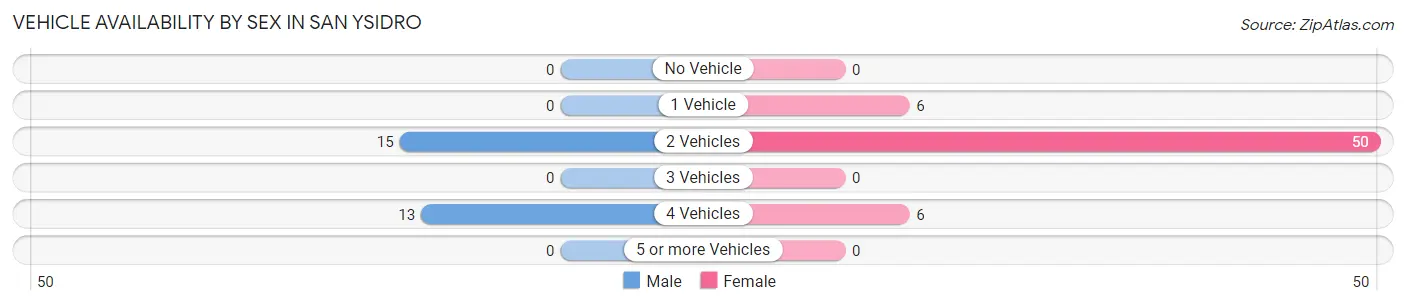
The most prevalent vehicle ownership categories in San Ysidro are males with 2 vehicles (15, accounting for 53.6%) and females with 2 vehicles (50, making up 24.2%).
| Vehicles Available | Male | Female |
| No Vehicle | 0 (0.0%) | 0 (0.0%) |
| 1 Vehicle | 0 (0.0%) | 6 (9.7%) |
| 2 Vehicles | 15 (53.6%) | 50 (80.6%) |
| 3 Vehicles | 0 (0.0%) | 0 (0.0%) |
| 4 Vehicles | 13 (46.4%) | 6 (9.7%) |
| 5 or more Vehicles | 0 (0.0%) | 0 (0.0%) |
| Total | 28 (100.0%) | 62 (100.0%) |
Commute Time in San Ysidro
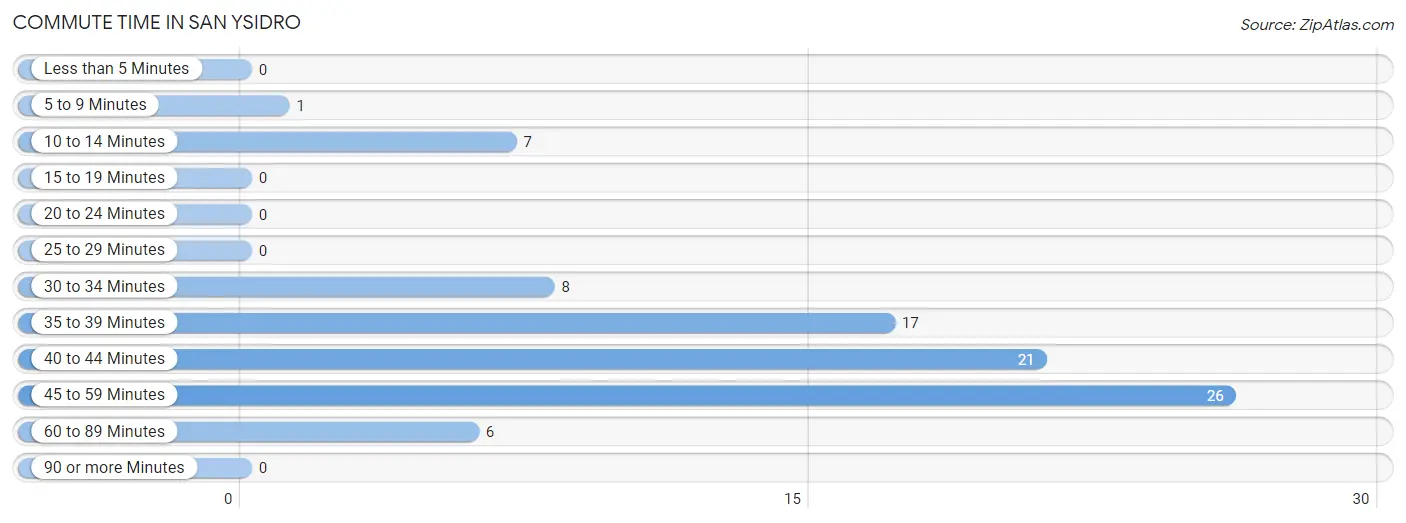
The most frequently occuring commute durations in San Ysidro are 45 to 59 minutes (26 commuters, 30.2%), 40 to 44 minutes (21 commuters, 24.4%), and 35 to 39 minutes (17 commuters, 19.8%).
| Commute Time | # Commuters | % Commuters |
| Less than 5 Minutes | 0 | 0.0% |
| 5 to 9 Minutes | 1 | 1.2% |
| 10 to 14 Minutes | 7 | 8.1% |
| 15 to 19 Minutes | 0 | 0.0% |
| 20 to 24 Minutes | 0 | 0.0% |
| 25 to 29 Minutes | 0 | 0.0% |
| 30 to 34 Minutes | 8 | 9.3% |
| 35 to 39 Minutes | 17 | 19.8% |
| 40 to 44 Minutes | 21 | 24.4% |
| 45 to 59 Minutes | 26 | 30.2% |
| 60 to 89 Minutes | 6 | 7.0% |
| 90 or more Minutes | 0 | 0.0% |
Commute Time by Sex in San Ysidro
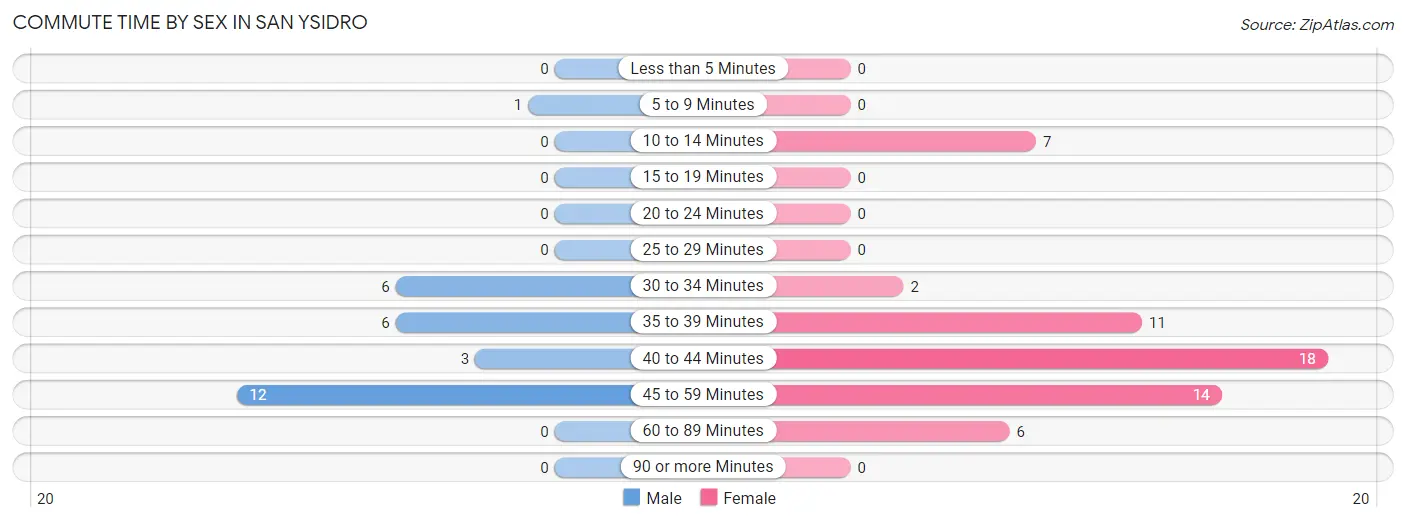
The most common commute times in San Ysidro are 45 to 59 minutes (12 commuters, 42.9%) for males and 40 to 44 minutes (18 commuters, 31.0%) for females.
| Commute Time | Male | Female |
| Less than 5 Minutes | 0 (0.0%) | 0 (0.0%) |
| 5 to 9 Minutes | 1 (3.6%) | 0 (0.0%) |
| 10 to 14 Minutes | 0 (0.0%) | 7 (12.1%) |
| 15 to 19 Minutes | 0 (0.0%) | 0 (0.0%) |
| 20 to 24 Minutes | 0 (0.0%) | 0 (0.0%) |
| 25 to 29 Minutes | 0 (0.0%) | 0 (0.0%) |
| 30 to 34 Minutes | 6 (21.4%) | 2 (3.5%) |
| 35 to 39 Minutes | 6 (21.4%) | 11 (19.0%) |
| 40 to 44 Minutes | 3 (10.7%) | 18 (31.0%) |
| 45 to 59 Minutes | 12 (42.9%) | 14 (24.1%) |
| 60 to 89 Minutes | 0 (0.0%) | 6 (10.3%) |
| 90 or more Minutes | 0 (0.0%) | 0 (0.0%) |
Time of Departure to Work by Sex in San Ysidro
The most frequent times of departure to work in San Ysidro are 7:00 AM to 7:29 AM (19, 67.9%) for males and 12:00 PM to 3:59 PM (24, 41.4%) for females.
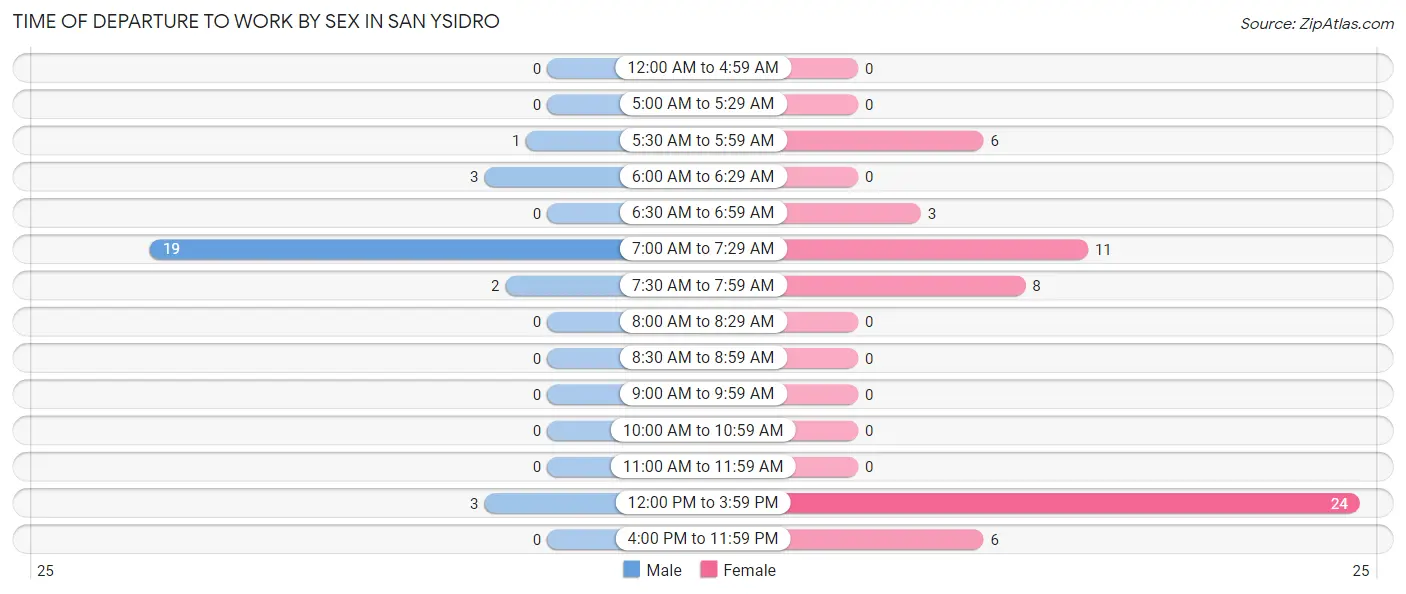
| Time of Departure | Male | Female |
| 12:00 AM to 4:59 AM | 0 (0.0%) | 0 (0.0%) |
| 5:00 AM to 5:29 AM | 0 (0.0%) | 0 (0.0%) |
| 5:30 AM to 5:59 AM | 1 (3.6%) | 6 (10.3%) |
| 6:00 AM to 6:29 AM | 3 (10.7%) | 0 (0.0%) |
| 6:30 AM to 6:59 AM | 0 (0.0%) | 3 (5.2%) |
| 7:00 AM to 7:29 AM | 19 (67.9%) | 11 (19.0%) |
| 7:30 AM to 7:59 AM | 2 (7.1%) | 8 (13.8%) |
| 8:00 AM to 8:29 AM | 0 (0.0%) | 0 (0.0%) |
| 8:30 AM to 8:59 AM | 0 (0.0%) | 0 (0.0%) |
| 9:00 AM to 9:59 AM | 0 (0.0%) | 0 (0.0%) |
| 10:00 AM to 10:59 AM | 0 (0.0%) | 0 (0.0%) |
| 11:00 AM to 11:59 AM | 0 (0.0%) | 0 (0.0%) |
| 12:00 PM to 3:59 PM | 3 (10.7%) | 24 (41.4%) |
| 4:00 PM to 11:59 PM | 0 (0.0%) | 6 (10.3%) |
| Total | 28 (100.0%) | 58 (100.0%) |
Housing Occupancy in San Ysidro
Occupancy by Ownership in San Ysidro
Of the total 113 dwellings in San Ysidro, owner-occupied units account for 72 (63.7%), while renter-occupied units make up 41 (36.3%).
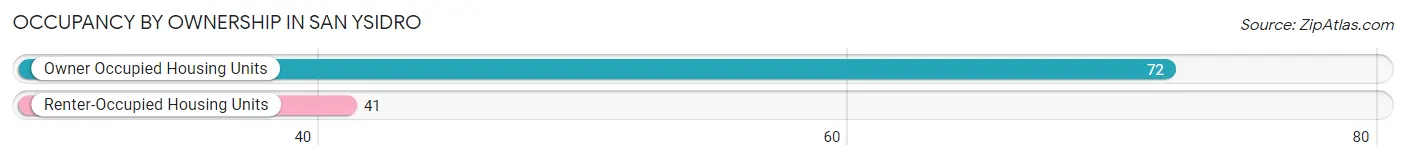
| Occupancy | # Housing Units | % Housing Units |
| Owner Occupied Housing Units | 72 | 63.7% |
| Renter-Occupied Housing Units | 41 | 36.3% |
| Total Occupied Housing Units | 113 | 100.0% |
Occupancy by Household Size in San Ysidro
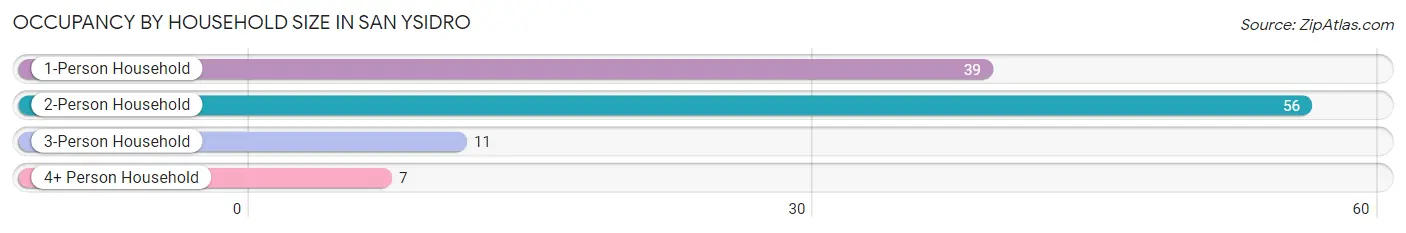
| Household Size | # Housing Units | % Housing Units |
| 1-Person Household | 39 | 34.5% |
| 2-Person Household | 56 | 49.6% |
| 3-Person Household | 11 | 9.7% |
| 4+ Person Household | 7 | 6.2% |
| Total Housing Units | 113 | 100.0% |
Occupancy by Ownership by Household Size in San Ysidro
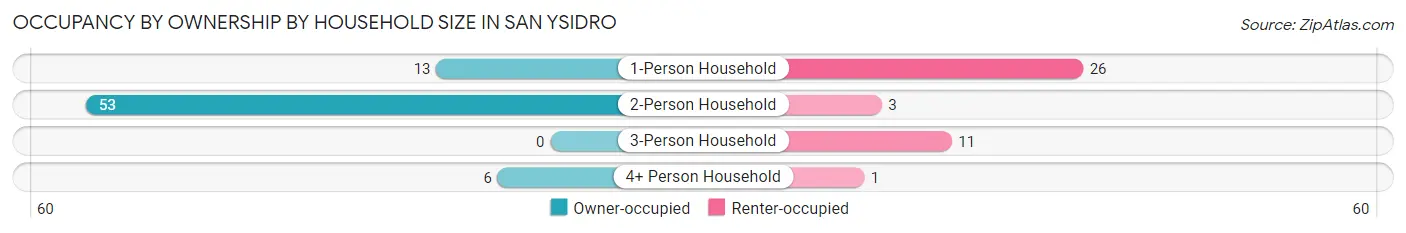
| Household Size | Owner-occupied | Renter-occupied |
| 1-Person Household | 13 (33.3%) | 26 (66.7%) |
| 2-Person Household | 53 (94.6%) | 3 (5.4%) |
| 3-Person Household | 0 (0.0%) | 11 (100.0%) |
| 4+ Person Household | 6 (85.7%) | 1 (14.3%) |
| Total Housing Units | 72 (63.7%) | 41 (36.3%) |
Occupancy by Educational Attainment in San Ysidro
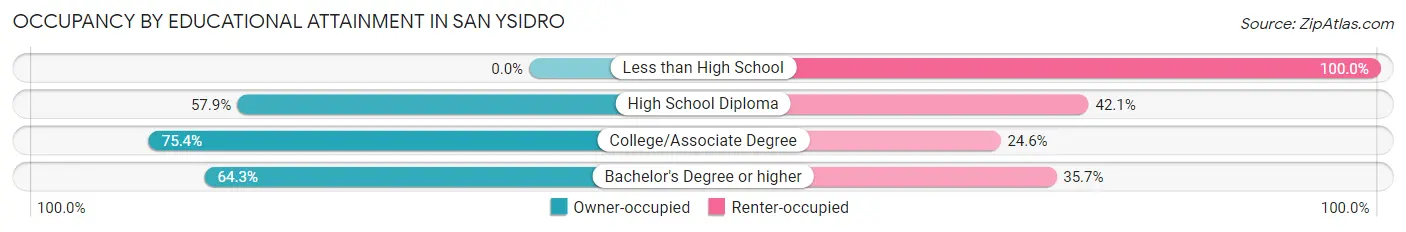
| Household Size | Owner-occupied | Renter-occupied |
| Less than High School | 0 (0.0%) | 11 (100.0%) |
| High School Diploma | 11 (57.9%) | 8 (42.1%) |
| College/Associate Degree | 52 (75.4%) | 17 (24.6%) |
| Bachelor's Degree or higher | 9 (64.3%) | 5 (35.7%) |
Occupancy by Age of Householder in San Ysidro
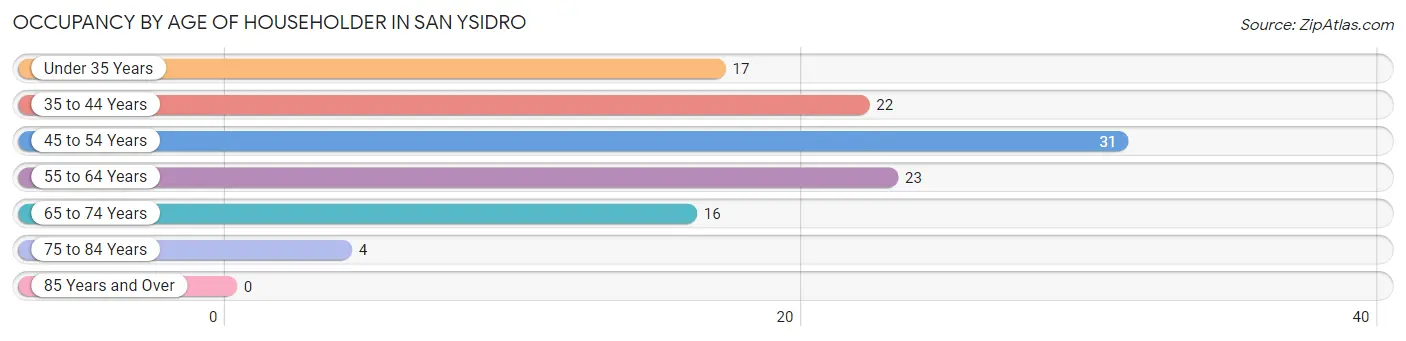
| Age Bracket | # Households | % Households |
| Under 35 Years | 17 | 15.0% |
| 35 to 44 Years | 22 | 19.5% |
| 45 to 54 Years | 31 | 27.4% |
| 55 to 64 Years | 23 | 20.3% |
| 65 to 74 Years | 16 | 14.2% |
| 75 to 84 Years | 4 | 3.5% |
| 85 Years and Over | 0 | 0.0% |
| Total | 113 | 100.0% |
Housing Finances in San Ysidro
Median Income by Occupancy in San Ysidro
| Occupancy Type | # Households | Median Income |
| Owner-Occupied | 72 (63.7%) | $0 |
| Renter-Occupied | 41 (36.3%) | $0 |
| Average | 113 (100.0%) | $0 |
Occupancy by Householder Income Bracket in San Ysidro
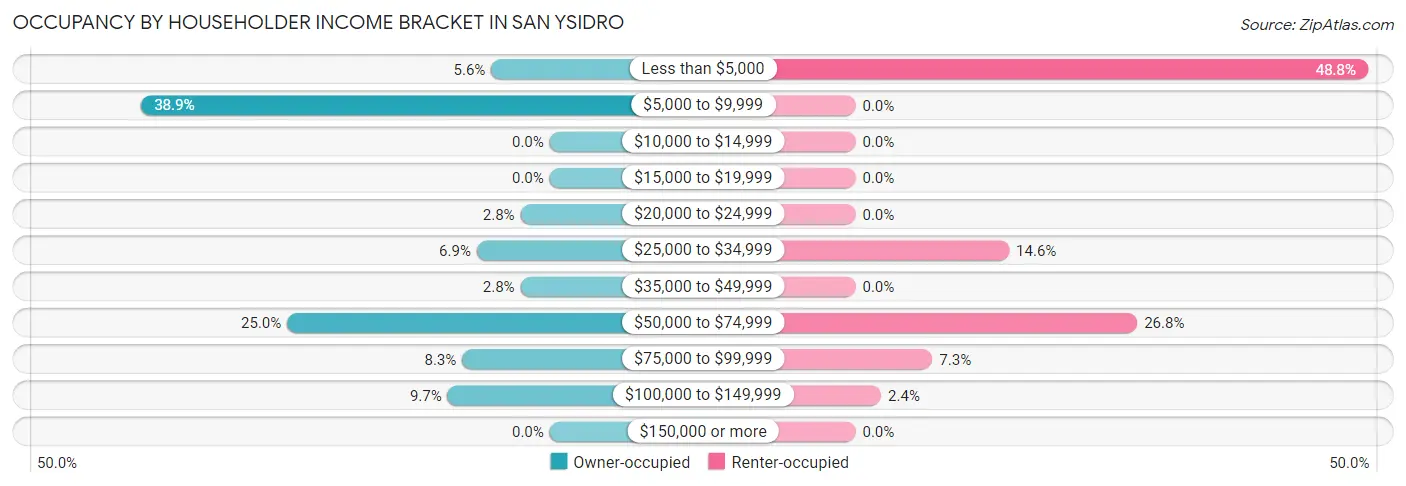
| Income Bracket | Owner-occupied | Renter-occupied |
| Less than $5,000 | 4 (5.6%) | 20 (48.8%) |
| $5,000 to $9,999 | 28 (38.9%) | 0 (0.0%) |
| $10,000 to $14,999 | 0 (0.0%) | 0 (0.0%) |
| $15,000 to $19,999 | 0 (0.0%) | 0 (0.0%) |
| $20,000 to $24,999 | 2 (2.8%) | 0 (0.0%) |
| $25,000 to $34,999 | 5 (6.9%) | 6 (14.6%) |
| $35,000 to $49,999 | 2 (2.8%) | 0 (0.0%) |
| $50,000 to $74,999 | 18 (25.0%) | 11 (26.8%) |
| $75,000 to $99,999 | 6 (8.3%) | 3 (7.3%) |
| $100,000 to $149,999 | 7 (9.7%) | 1 (2.4%) |
| $150,000 or more | 0 (0.0%) | 0 (0.0%) |
| Total | 72 (100.0%) | 41 (100.0%) |
Monthly Housing Cost Tiers in San Ysidro
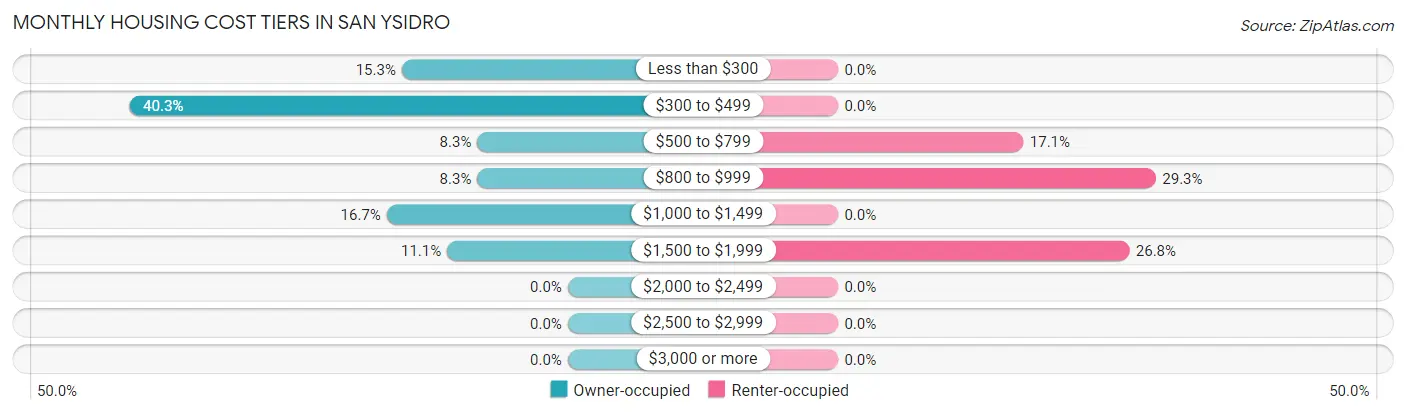
| Monthly Cost | Owner-occupied | Renter-occupied |
| Less than $300 | 11 (15.3%) | 0 (0.0%) |
| $300 to $499 | 29 (40.3%) | 0 (0.0%) |
| $500 to $799 | 6 (8.3%) | 7 (17.1%) |
| $800 to $999 | 6 (8.3%) | 12 (29.3%) |
| $1,000 to $1,499 | 12 (16.7%) | 0 (0.0%) |
| $1,500 to $1,999 | 8 (11.1%) | 11 (26.8%) |
| $2,000 to $2,499 | 0 (0.0%) | 0 (0.0%) |
| $2,500 to $2,999 | 0 (0.0%) | 0 (0.0%) |
| $3,000 or more | 0 (0.0%) | 0 (0.0%) |
| Total | 72 (100.0%) | 41 (100.0%) |
Physical Housing Characteristics in San Ysidro
Housing Structures in San Ysidro
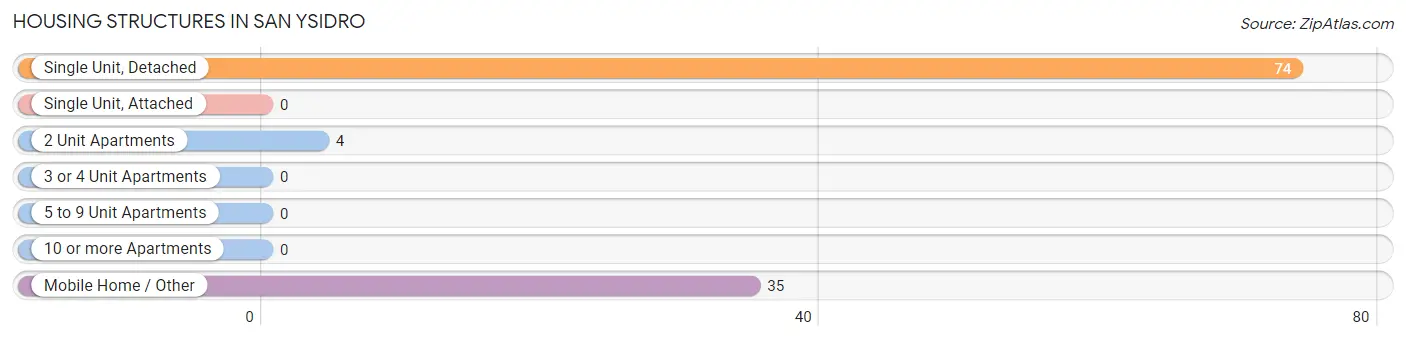
| Structure Type | # Housing Units | % Housing Units |
| Single Unit, Detached | 74 | 65.5% |
| Single Unit, Attached | 0 | 0.0% |
| 2 Unit Apartments | 4 | 3.5% |
| 3 or 4 Unit Apartments | 0 | 0.0% |
| 5 to 9 Unit Apartments | 0 | 0.0% |
| 10 or more Apartments | 0 | 0.0% |
| Mobile Home / Other | 35 | 31.0% |
| Total | 113 | 100.0% |
Housing Structures by Occupancy in San Ysidro
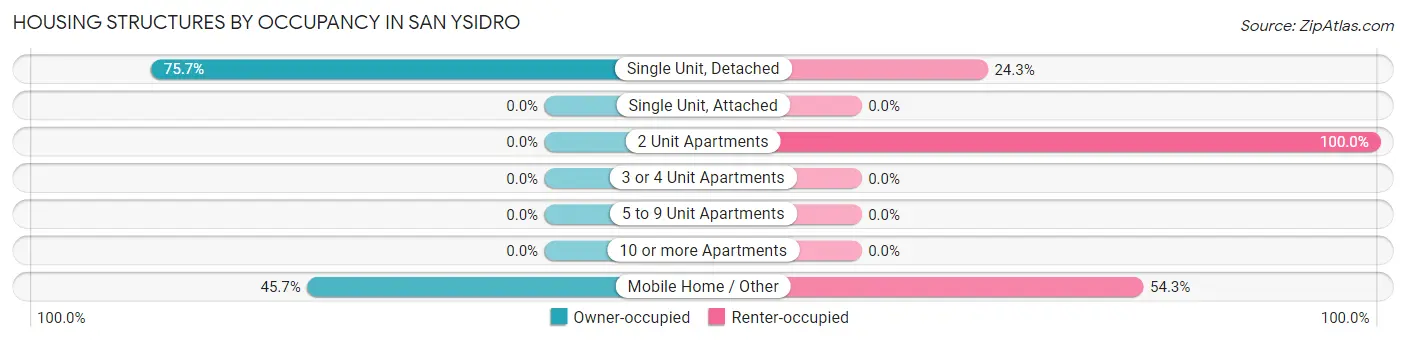
| Structure Type | Owner-occupied | Renter-occupied |
| Single Unit, Detached | 56 (75.7%) | 18 (24.3%) |
| Single Unit, Attached | 0 (0.0%) | 0 (0.0%) |
| 2 Unit Apartments | 0 (0.0%) | 4 (100.0%) |
| 3 or 4 Unit Apartments | 0 (0.0%) | 0 (0.0%) |
| 5 to 9 Unit Apartments | 0 (0.0%) | 0 (0.0%) |
| 10 or more Apartments | 0 (0.0%) | 0 (0.0%) |
| Mobile Home / Other | 16 (45.7%) | 19 (54.3%) |
| Total | 72 (63.7%) | 41 (36.3%) |
Housing Structures by Number of Rooms in San Ysidro
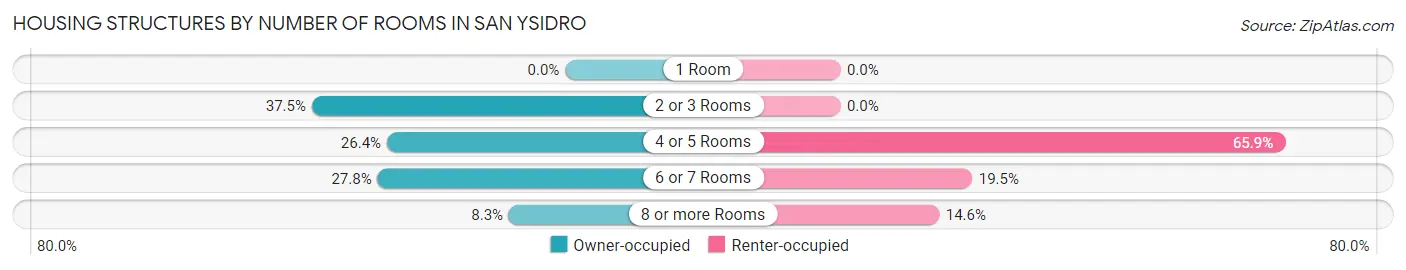
| Number of Rooms | Owner-occupied | Renter-occupied |
| 1 Room | 0 (0.0%) | 0 (0.0%) |
| 2 or 3 Rooms | 27 (37.5%) | 0 (0.0%) |
| 4 or 5 Rooms | 19 (26.4%) | 27 (65.8%) |
| 6 or 7 Rooms | 20 (27.8%) | 8 (19.5%) |
| 8 or more Rooms | 6 (8.3%) | 6 (14.6%) |
| Total | 72 (100.0%) | 41 (100.0%) |
Housing Structure by Heating Type in San Ysidro
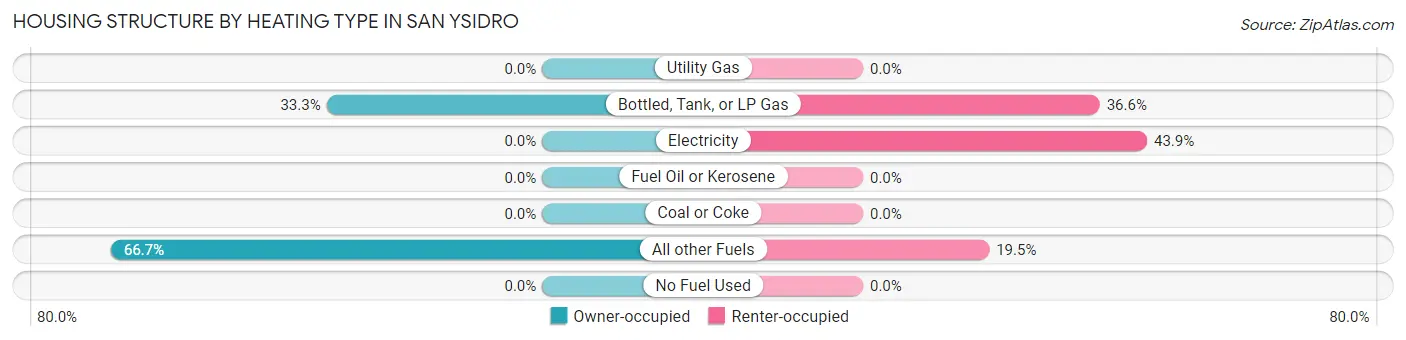
| Heating Type | Owner-occupied | Renter-occupied |
| Utility Gas | 0 (0.0%) | 0 (0.0%) |
| Bottled, Tank, or LP Gas | 24 (33.3%) | 15 (36.6%) |
| Electricity | 0 (0.0%) | 18 (43.9%) |
| Fuel Oil or Kerosene | 0 (0.0%) | 0 (0.0%) |
| Coal or Coke | 0 (0.0%) | 0 (0.0%) |
| All other Fuels | 48 (66.7%) | 8 (19.5%) |
| No Fuel Used | 0 (0.0%) | 0 (0.0%) |
| Total | 72 (100.0%) | 41 (100.0%) |
Household Vehicle Usage in San Ysidro
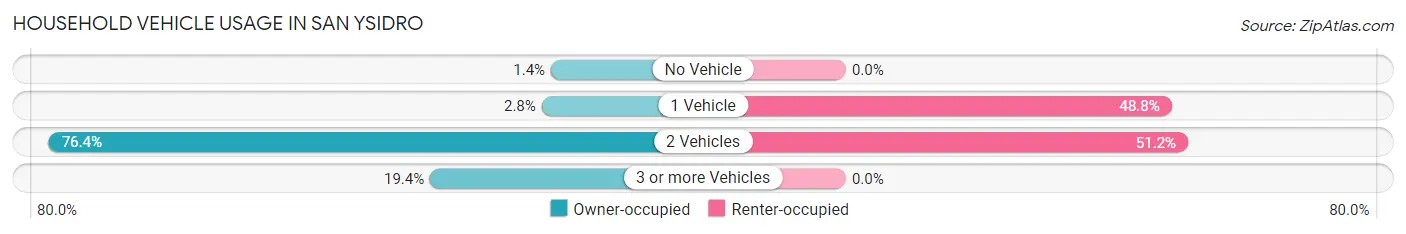
| Vehicles per Household | Owner-occupied | Renter-occupied |
| No Vehicle | 1 (1.4%) | 0 (0.0%) |
| 1 Vehicle | 2 (2.8%) | 20 (48.8%) |
| 2 Vehicles | 55 (76.4%) | 21 (51.2%) |
| 3 or more Vehicles | 14 (19.4%) | 0 (0.0%) |
| Total | 72 (100.0%) | 41 (100.0%) |
Real Estate & Mortgages in San Ysidro
Real Estate and Mortgage Overview in San Ysidro
| Characteristic | Without Mortgage | With Mortgage |
| Housing Units | 540 | 26 |
| Median Property Value | $414,300 | $229,200 |
| Median Household Income | $130,644 | $0 |
| Monthly Housing Costs | $525 | $0 |
| Real Estate Taxes | $2,234 | $0 |
Property Value by Mortgage Status in San Ysidro
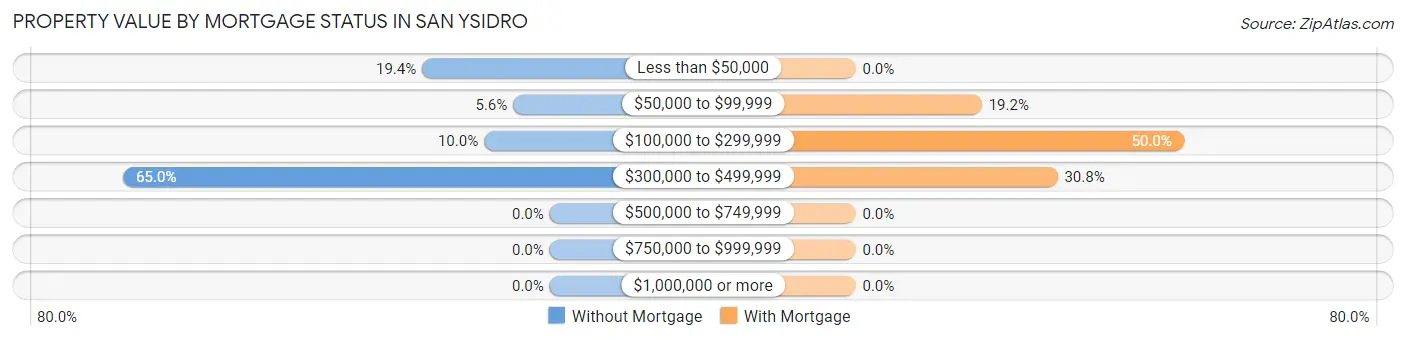
| Property Value | Without Mortgage | With Mortgage |
| Less than $50,000 | 105 (19.4%) | 0 (0.0%) |
| $50,000 to $99,999 | 30 (5.6%) | 5 (19.2%) |
| $100,000 to $299,999 | 54 (10.0%) | 13 (50.0%) |
| $300,000 to $499,999 | 351 (65.0%) | 8 (30.8%) |
| $500,000 to $749,999 | 0 (0.0%) | 0 (0.0%) |
| $750,000 to $999,999 | 0 (0.0%) | 0 (0.0%) |
| $1,000,000 or more | 0 (0.0%) | 0 (0.0%) |
| Total | 540 (100.0%) | 26 (100.0%) |
Household Income by Mortgage Status in San Ysidro
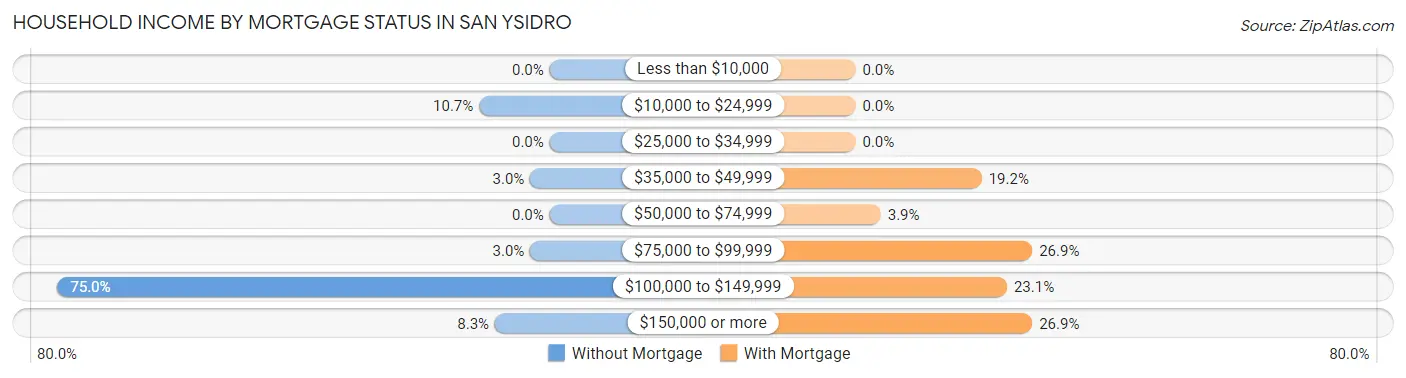
| Household Income | Without Mortgage | With Mortgage |
| Less than $10,000 | 0 (0.0%) | 0 (0.0%) |
| $10,000 to $24,999 | 58 (10.7%) | 0 (0.0%) |
| $25,000 to $34,999 | 0 (0.0%) | 0 (0.0%) |
| $35,000 to $49,999 | 16 (3.0%) | 5 (19.2%) |
| $50,000 to $74,999 | 0 (0.0%) | 1 (3.8%) |
| $75,000 to $99,999 | 16 (3.0%) | 7 (26.9%) |
| $100,000 to $149,999 | 405 (75.0%) | 6 (23.1%) |
| $150,000 or more | 45 (8.3%) | 7 (26.9%) |
| Total | 540 (100.0%) | 26 (100.0%) |
Property Value to Household Income Ratio in San Ysidro
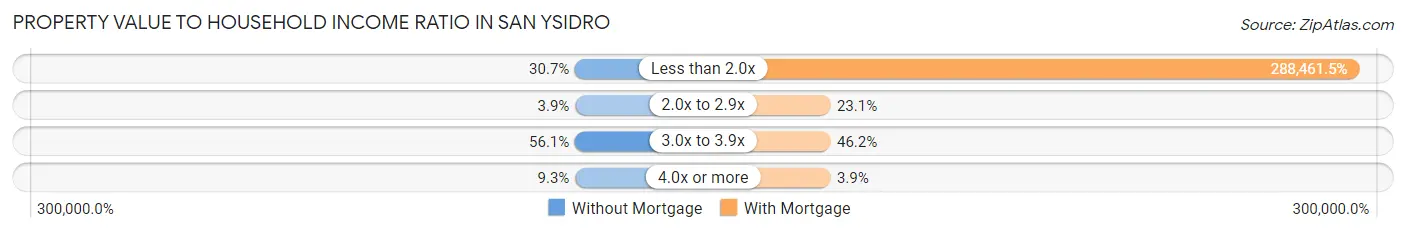
| Value-to-Income Ratio | Without Mortgage | With Mortgage |
| Less than 2.0x | 166 (30.7%) | 75,000 (288,461.5%) |
| 2.0x to 2.9x | 21 (3.9%) | 6 (23.1%) |
| 3.0x to 3.9x | 303 (56.1%) | 12 (46.2%) |
| 4.0x or more | 50 (9.3%) | 1 (3.8%) |
| Total | 540 (100.0%) | 26 (100.0%) |
Real Estate Taxes by Mortgage Status in San Ysidro
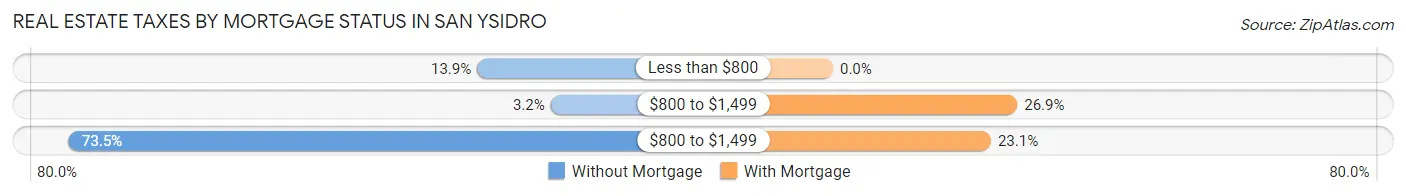
| Property Taxes | Without Mortgage | With Mortgage |
| Less than $800 | 75 (13.9%) | 0 (0.0%) |
| $800 to $1,499 | 17 (3.2%) | 7 (26.9%) |
| $800 to $1,499 | 397 (73.5%) | 6 (23.1%) |
| Total | 540 (100.0%) | 26 (100.0%) |
Health & Disability in San Ysidro
Health Insurance Coverage by Age in San Ysidro
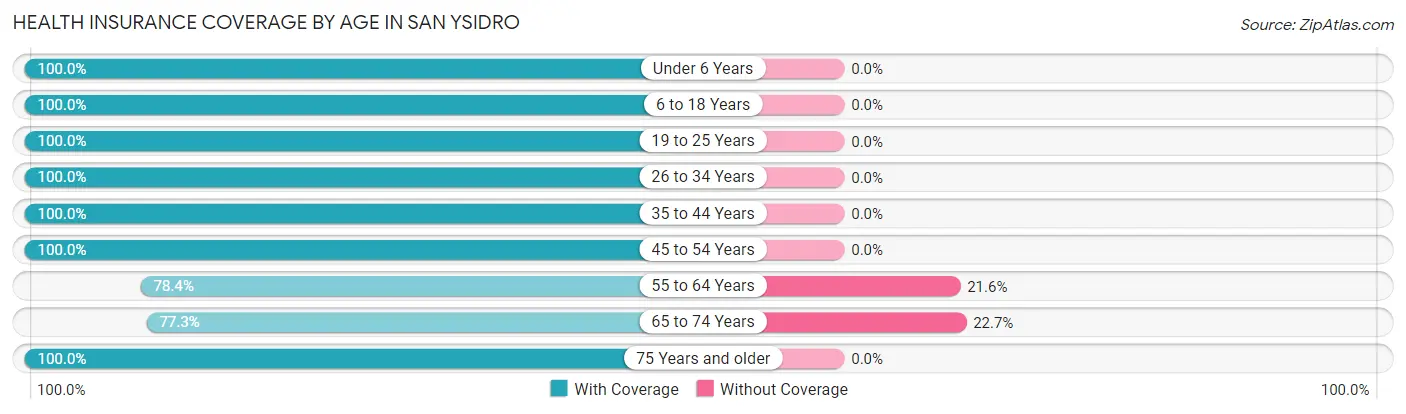
| Age Bracket | With Coverage | Without Coverage |
| Under 6 Years | 16 (100.0%) | 0 (0.0%) |
| 6 to 18 Years | 9 (100.0%) | 0 (0.0%) |
| 19 to 25 Years | 4 (100.0%) | 0 (0.0%) |
| 26 to 34 Years | 57 (100.0%) | 0 (0.0%) |
| 35 to 44 Years | 33 (100.0%) | 0 (0.0%) |
| 45 to 54 Years | 37 (100.0%) | 0 (0.0%) |
| 55 to 64 Years | 29 (78.4%) | 8 (21.6%) |
| 65 to 74 Years | 17 (77.3%) | 5 (22.7%) |
| 75 Years and older | 4 (100.0%) | 0 (0.0%) |
| Total | 206 (94.1%) | 13 (5.9%) |
Health Insurance Coverage by Citizenship Status in San Ysidro
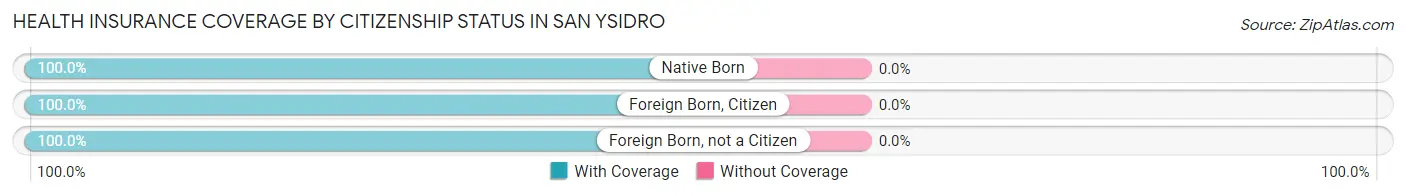
| Citizenship Status | With Coverage | Without Coverage |
| Native Born | 16 (100.0%) | 0 (0.0%) |
| Foreign Born, Citizen | 9 (100.0%) | 0 (0.0%) |
| Foreign Born, not a Citizen | 4 (100.0%) | 0 (0.0%) |
Health Insurance Coverage by Household Income in San Ysidro
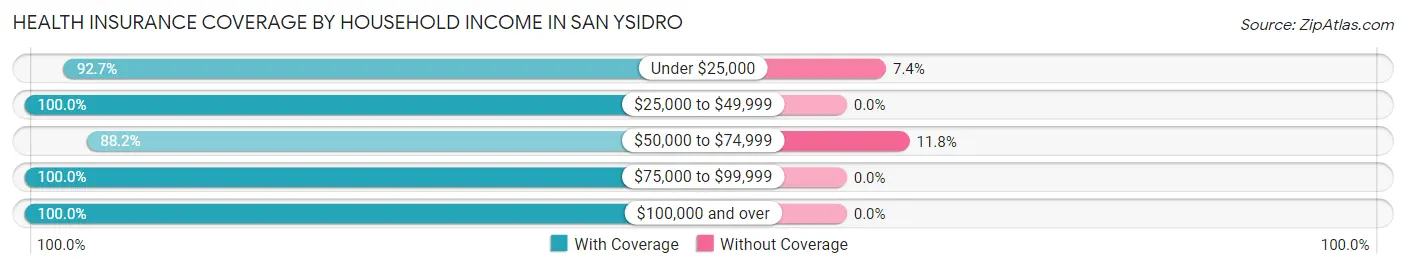
| Household Income | With Coverage | Without Coverage |
| Under $25,000 | 63 (92.6%) | 5 (7.3%) |
| $25,000 to $49,999 | 14 (100.0%) | 0 (0.0%) |
| $50,000 to $74,999 | 60 (88.2%) | 8 (11.8%) |
| $75,000 to $99,999 | 48 (100.0%) | 0 (0.0%) |
| $100,000 and over | 21 (100.0%) | 0 (0.0%) |
Public vs Private Health Insurance Coverage by Age in San Ysidro
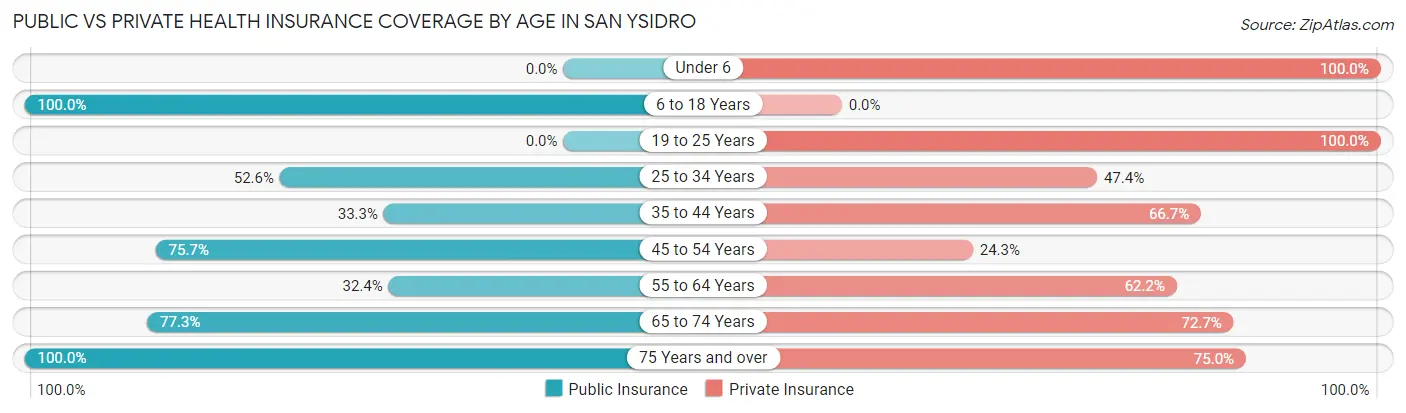
| Age Bracket | Public Insurance | Private Insurance |
| Under 6 | 0 (0.0%) | 16 (100.0%) |
| 6 to 18 Years | 9 (100.0%) | 0 (0.0%) |
| 19 to 25 Years | 0 (0.0%) | 4 (100.0%) |
| 25 to 34 Years | 30 (52.6%) | 27 (47.4%) |
| 35 to 44 Years | 11 (33.3%) | 22 (66.7%) |
| 45 to 54 Years | 28 (75.7%) | 9 (24.3%) |
| 55 to 64 Years | 12 (32.4%) | 23 (62.2%) |
| 65 to 74 Years | 17 (77.3%) | 16 (72.7%) |
| 75 Years and over | 4 (100.0%) | 3 (75.0%) |
| Total | 111 (50.7%) | 120 (54.8%) |
Disability Status by Sex by Age in San Ysidro
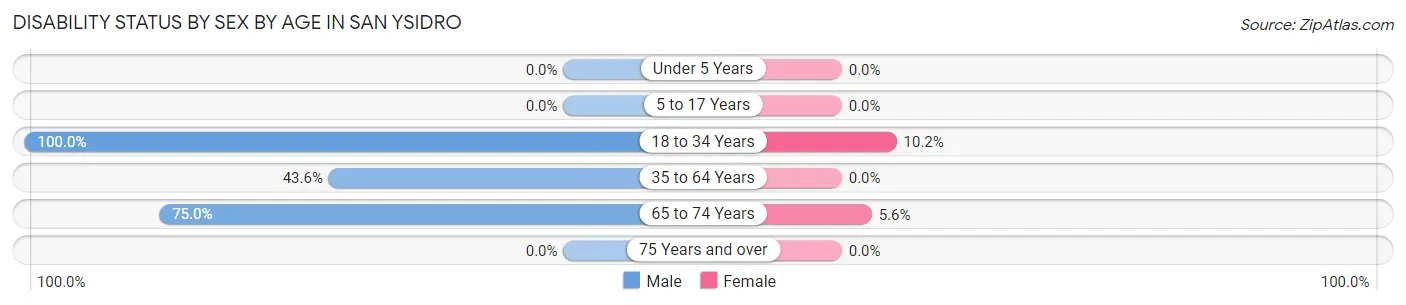
| Age Bracket | Male | Female |
| Under 5 Years | 0 (0.0%) | 0 (0.0%) |
| 5 to 17 Years | 0 (0.0%) | 0 (0.0%) |
| 18 to 34 Years | 2 (100.0%) | 6 (10.2%) |
| 35 to 64 Years | 27 (43.5%) | 0 (0.0%) |
| 65 to 74 Years | 3 (75.0%) | 1 (5.6%) |
| 75 Years and over | 0 (0.0%) | 0 (0.0%) |
Disability Class by Sex by Age in San Ysidro
Disability Class: Hearing Difficulty
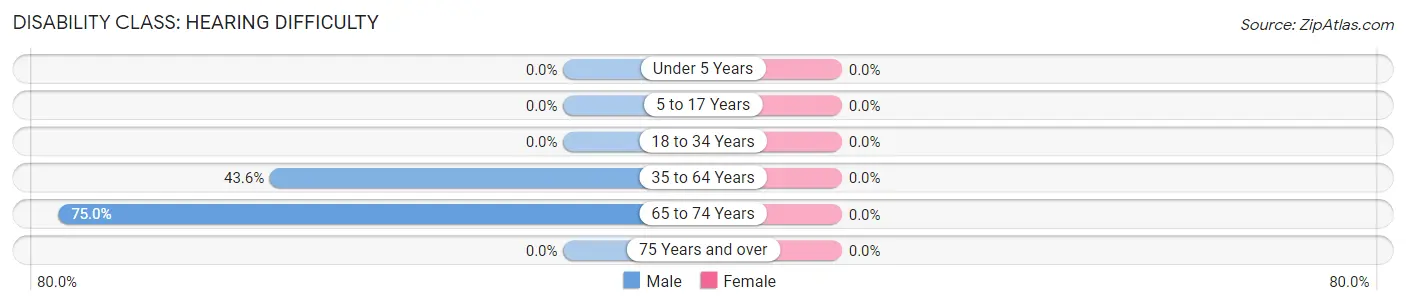
| Age Bracket | Male | Female |
| Under 5 Years | 0 (0.0%) | 0 (0.0%) |
| 5 to 17 Years | 0 (0.0%) | 0 (0.0%) |
| 18 to 34 Years | 0 (0.0%) | 0 (0.0%) |
| 35 to 64 Years | 27 (43.5%) | 0 (0.0%) |
| 65 to 74 Years | 3 (75.0%) | 0 (0.0%) |
| 75 Years and over | 0 (0.0%) | 0 (0.0%) |
Disability Class: Vision Difficulty
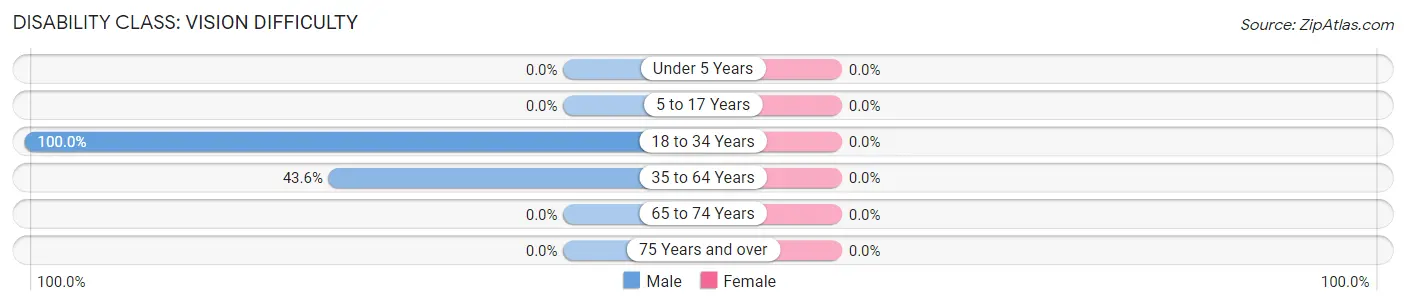
| Age Bracket | Male | Female |
| Under 5 Years | 0 (0.0%) | 0 (0.0%) |
| 5 to 17 Years | 0 (0.0%) | 0 (0.0%) |
| 18 to 34 Years | 2 (100.0%) | 0 (0.0%) |
| 35 to 64 Years | 27 (43.5%) | 0 (0.0%) |
| 65 to 74 Years | 0 (0.0%) | 0 (0.0%) |
| 75 Years and over | 0 (0.0%) | 0 (0.0%) |
Disability Class: Cognitive Difficulty
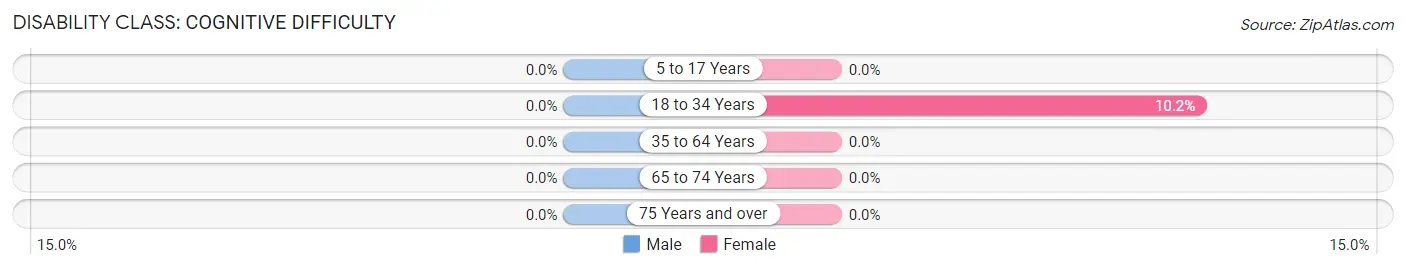
| Age Bracket | Male | Female |
| 5 to 17 Years | 0 (0.0%) | 0 (0.0%) |
| 18 to 34 Years | 0 (0.0%) | 6 (10.2%) |
| 35 to 64 Years | 0 (0.0%) | 0 (0.0%) |
| 65 to 74 Years | 0 (0.0%) | 0 (0.0%) |
| 75 Years and over | 0 (0.0%) | 0 (0.0%) |
Disability Class: Ambulatory Difficulty
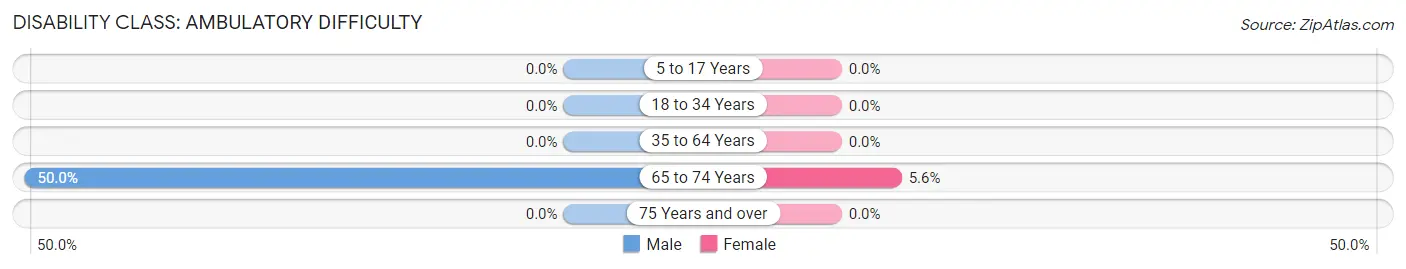
| Age Bracket | Male | Female |
| 5 to 17 Years | 0 (0.0%) | 0 (0.0%) |
| 18 to 34 Years | 0 (0.0%) | 0 (0.0%) |
| 35 to 64 Years | 0 (0.0%) | 0 (0.0%) |
| 65 to 74 Years | 2 (50.0%) | 1 (5.6%) |
| 75 Years and over | 0 (0.0%) | 0 (0.0%) |
Disability Class: Self-Care Difficulty
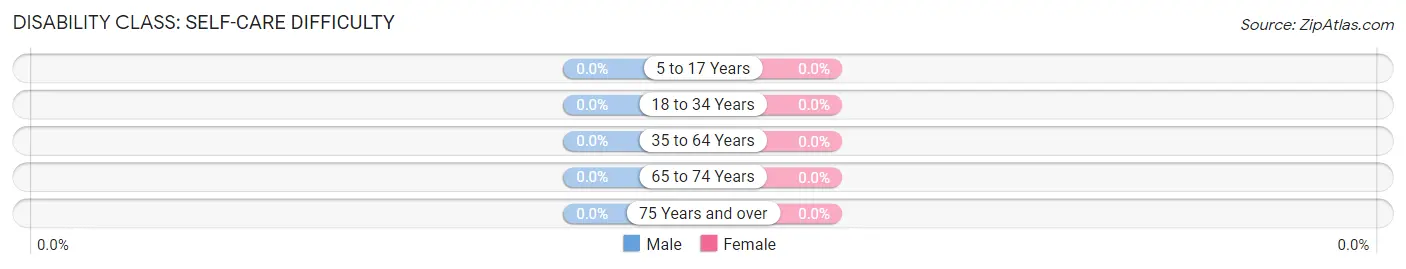
| Age Bracket | Male | Female |
| 5 to 17 Years | 0 (0.0%) | 0 (0.0%) |
| 18 to 34 Years | 0 (0.0%) | 0 (0.0%) |
| 35 to 64 Years | 0 (0.0%) | 0 (0.0%) |
| 65 to 74 Years | 0 (0.0%) | 0 (0.0%) |
| 75 Years and over | 0 (0.0%) | 0 (0.0%) |
Technology Access in San Ysidro
Computing Device Access in San Ysidro
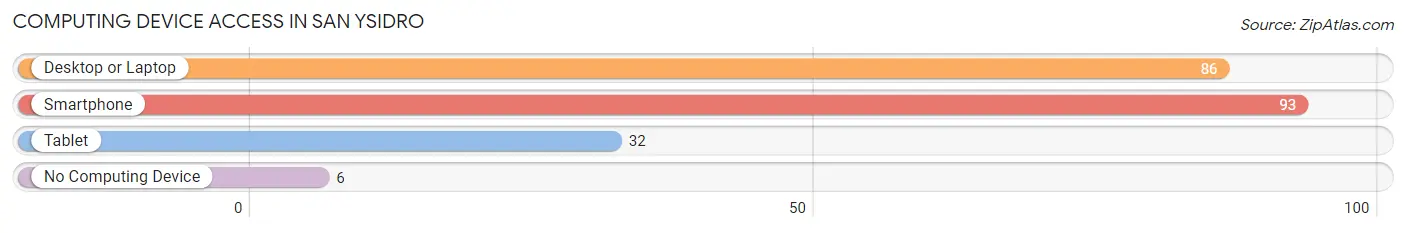
| Device Type | # Households | % Households |
| Desktop or Laptop | 86 | 76.1% |
| Smartphone | 93 | 82.3% |
| Tablet | 32 | 28.3% |
| No Computing Device | 6 | 5.3% |
| Total | 113 | 100.0% |
Internet Access in San Ysidro
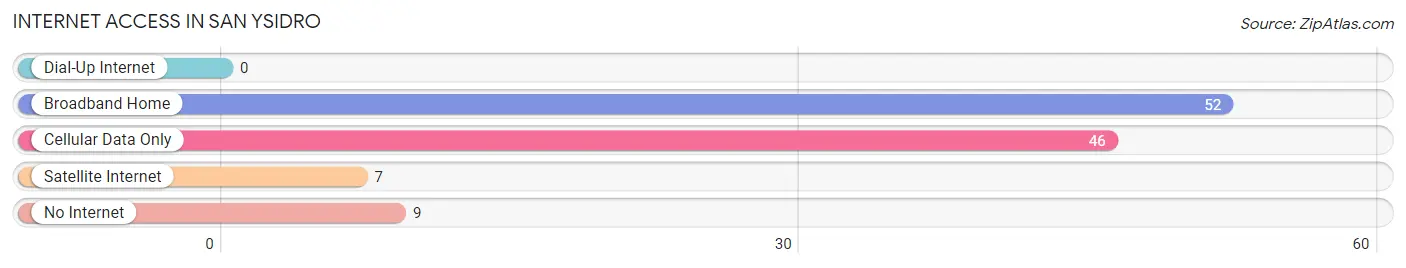
| Internet Type | # Households | % Households |
| Dial-Up Internet | 0 | 0.0% |
| Broadband Home | 52 | 46.0% |
| Cellular Data Only | 46 | 40.7% |
| Satellite Internet | 7 | 6.2% |
| No Internet | 9 | 8.0% |
| Total | 113 | 100.0% |
San Ysidro Summary
San Ysidro is a small unincorporated community located in the northern part of Sandoval County, New Mexico. It is situated in the foothills of the Jemez Mountains, approximately 25 miles northwest of Albuquerque. The community is named after San Ysidro, the patron saint of farmers.
History
San Ysidro was founded in the late 1800s by Spanish settlers who were attracted to the area by its fertile soil and abundant water sources. The settlers built adobe homes and planted crops such as corn, beans, squash, and wheat. The community was also home to a number of sheep and cattle ranches.
In the early 1900s, the Santa Fe Railroad built a line through San Ysidro, connecting it to Albuquerque and other nearby towns. This allowed the community to become a trading center for the surrounding area.
In the 1950s, the community began to experience a population decline as many of its residents moved away in search of better economic opportunities. However, in recent years, the population has begun to increase again as people have returned to the area to take advantage of its rural lifestyle and scenic beauty.
Geography
San Ysidro is located in the northern part of Sandoval County, New Mexico. It is situated in the foothills of the Jemez Mountains, approximately 25 miles northwest of Albuquerque. The community is surrounded by rolling hills and mesas, and is home to a variety of wildlife, including deer, elk, and antelope.
The climate in San Ysidro is semi-arid, with hot summers and mild winters. The average annual temperature is around 60°F, and the average annual precipitation is around 12 inches.
Economy
The economy of San Ysidro is largely based on agriculture. The community is home to several farms and ranches, which produce a variety of crops, including corn, beans, squash, and wheat. The area is also home to a number of sheep and cattle ranches.
In addition to agriculture, San Ysidro is home to a number of small businesses, including restaurants, stores, and a gas station. The community is also home to a number of artists and craftspeople, who sell their wares at local markets and festivals.
Demographics
As of the 2010 census, the population of San Ysidro was 1,845. The racial makeup of the community was 79.3% White, 0.7% African American, 0.3% Native American, 0.2% Asian, 0.1% Pacific Islander, 16.7% from other races, and 2.9% from two or more races. Hispanic or Latino of any race were 33.2% of the population.
The median household income in San Ysidro was $37,917, and the median family income was $41,250. The per capita income was $17,845. About 16.2% of families and 19.2% of the population were below the poverty line, including 25.2% of those under age 18 and 10.2% of those age 65 or over.
Common Questions
What is Per Capita Income in San Ysidro?
Per Capita income in San Ysidro is $22,220.
What is the Median Family Income in San Ysidro?
Median Family Income in San Ysidro is $70,000.
What is Income or Wage Gap in San Ysidro?
Income or Wage Gap in San Ysidro is 43.2%.
Women in San Ysidro earn 56.8 cents for every dollar earned by a man.
What is Inequality or Gini Index in San Ysidro?
Inequality or Gini Index in San Ysidro is 0.52.
What is the Total Population of San Ysidro?
Total Population of San Ysidro is 219.
What is the Total Male Population of San Ysidro?
Total Male Population of San Ysidro is 91.
What is the Total Female Population of San Ysidro?
Total Female Population of San Ysidro is 128.
What is the Ratio of Males per 100 Females in San Ysidro?
There are 71.09 Males per 100 Females in San Ysidro.
What is the Ratio of Females per 100 Males in San Ysidro?
There are 140.66 Females per 100 Males in San Ysidro.
What is the Median Population Age in San Ysidro?
Median Population Age in San Ysidro is 41.9 Years.
What is the Average Family Size in San Ysidro
Average Family Size in San Ysidro is 2.4 People.
What is the Average Household Size in San Ysidro
Average Household Size in San Ysidro is 1.9 People.
How Large is the Labor Force in San Ysidro?
There are 96 People in the Labor Forcein in San Ysidro.
What is the Percentage of People in the Labor Force in San Ysidro?
49.5% of People are in the Labor Force in San Ysidro.
What is the Unemployment Rate in San Ysidro?
Unemployment Rate in San Ysidro is 5.2%.