Ruidoso, NM Map & Demographics
Ruidoso Map
Ruidoso Overview
$28,049
PER CAPITA INCOME
$56,916
AVG FAMILY INCOME
$36,033
AVG HOUSEHOLD INCOME
12.8%
WAGE / INCOME GAP [ % ]
87.2¢/ $1
WAGE / INCOME GAP [ $ ]
0.45
INEQUALITY / GINI INDEX
7,696
TOTAL POPULATION
3,757
MALE POPULATION
3,939
FEMALE POPULATION
95.38
MALES / 100 FEMALES
104.84
FEMALES / 100 MALES
44.3
MEDIAN AGE
2.9
AVG FAMILY SIZE
2.1
AVG HOUSEHOLD SIZE
3,738
LABOR FORCE [ PEOPLE ]
58.1%
PERCENT IN LABOR FORCE
5.4%
UNEMPLOYMENT RATE
Income in Ruidoso
Income Overview in Ruidoso
Per Capita Income in Ruidoso is $28,049, while median incomes of families and households are $56,916 and $36,033 respectively.
| Characteristic | Number | Measure |
| Per Capita Income | 7,696 | $28,049 |
| Median Family Income | 1,989 | $56,916 |
| Mean Family Income | 1,989 | $66,350 |
| Median Household Income | 3,593 | $36,033 |
| Mean Household Income | 3,593 | $56,582 |
| Income Deficit | 1,989 | $0 |
| Wage / Income Gap (%) | 7,696 | 12.76% |
| Wage / Income Gap ($) | 7,696 | 87.24¢ per $1 |
| Gini / Inequality Index | 7,696 | 0.45 |
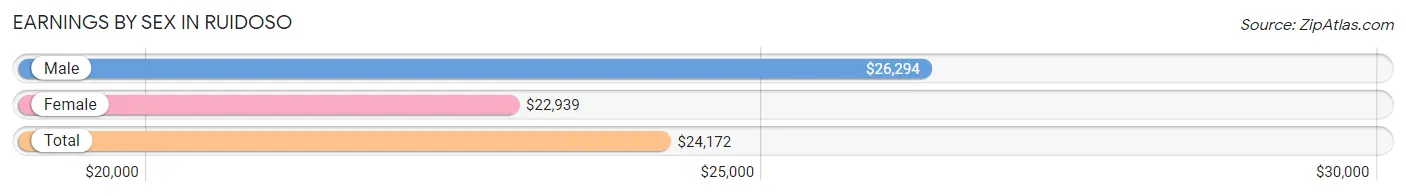
Earnings by Sex in Ruidoso
Average Earnings in Ruidoso are $24,172, $26,294 for men and $22,939 for women, a difference of 12.8%.
| Sex | Number | Average Earnings |
| Male | 2,020 (50.2%) | $26,294 |
| Female | 2,002 (49.8%) | $22,939 |
| Total | 4,022 (100.0%) | $24,172 |
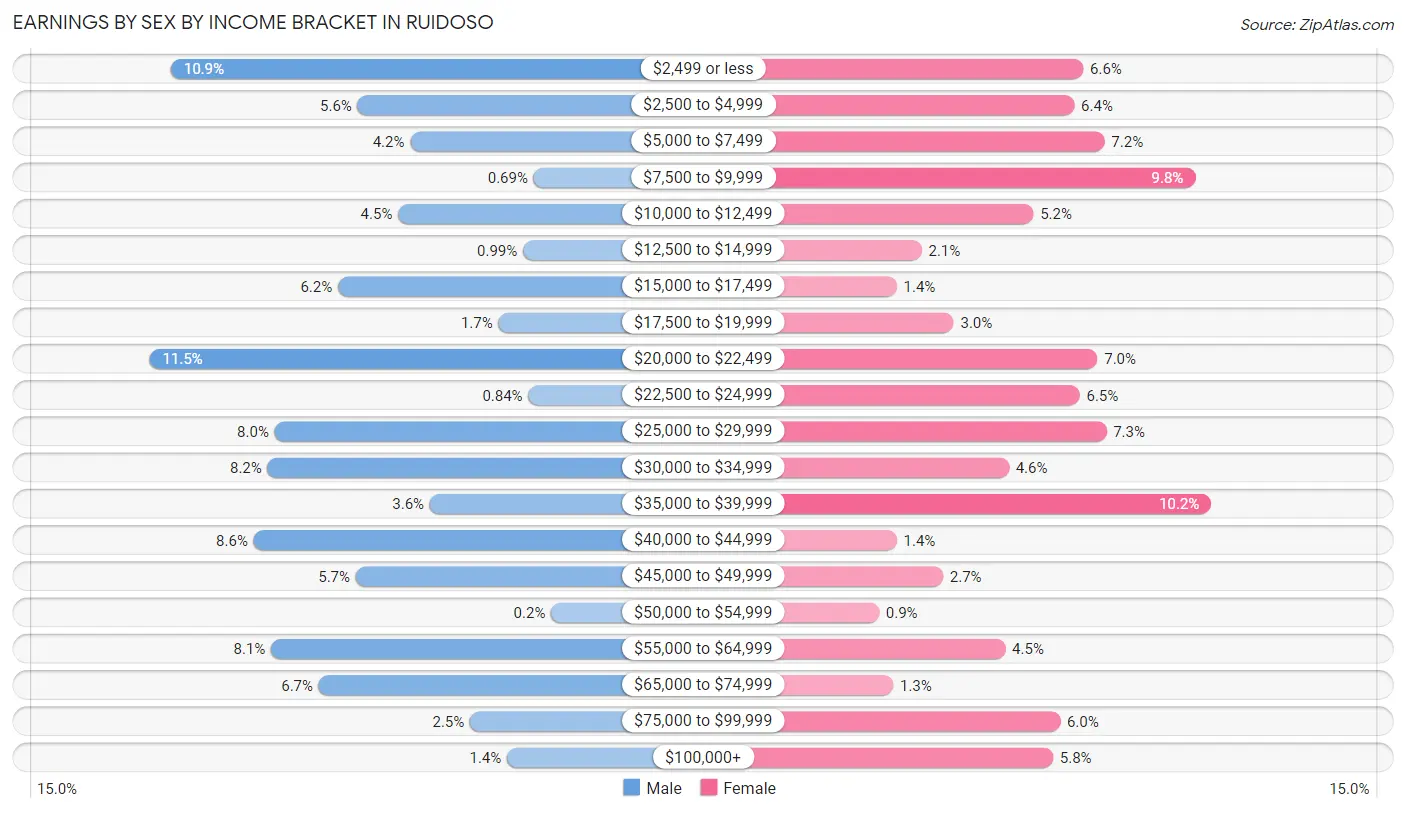
Earnings by Sex by Income Bracket in Ruidoso
The most common earnings brackets in Ruidoso are $20,000 to $22,499 for men (232 | 11.5%) and $35,000 to $39,999 for women (205 | 10.2%).
| Income | Male | Female |
| $2,499 or less | 220 (10.9%) | 133 (6.6%) |
| $2,500 to $4,999 | 114 (5.6%) | 128 (6.4%) |
| $5,000 to $7,499 | 84 (4.2%) | 145 (7.2%) |
| $7,500 to $9,999 | 14 (0.7%) | 196 (9.8%) |
| $10,000 to $12,499 | 91 (4.5%) | 105 (5.2%) |
| $12,500 to $14,999 | 20 (1.0%) | 42 (2.1%) |
| $15,000 to $17,499 | 125 (6.2%) | 28 (1.4%) |
| $17,500 to $19,999 | 34 (1.7%) | 60 (3.0%) |
| $20,000 to $22,499 | 232 (11.5%) | 141 (7.0%) |
| $22,500 to $24,999 | 17 (0.8%) | 131 (6.5%) |
| $25,000 to $29,999 | 161 (8.0%) | 146 (7.3%) |
| $30,000 to $34,999 | 165 (8.2%) | 91 (4.5%) |
| $35,000 to $39,999 | 73 (3.6%) | 205 (10.2%) |
| $40,000 to $44,999 | 173 (8.6%) | 28 (1.4%) |
| $45,000 to $49,999 | 115 (5.7%) | 54 (2.7%) |
| $50,000 to $54,999 | 4 (0.2%) | 18 (0.9%) |
| $55,000 to $64,999 | 163 (8.1%) | 89 (4.4%) |
| $65,000 to $74,999 | 136 (6.7%) | 26 (1.3%) |
| $75,000 to $99,999 | 50 (2.5%) | 120 (6.0%) |
| $100,000+ | 29 (1.4%) | 116 (5.8%) |
| Total | 2,020 (100.0%) | 2,002 (100.0%) |
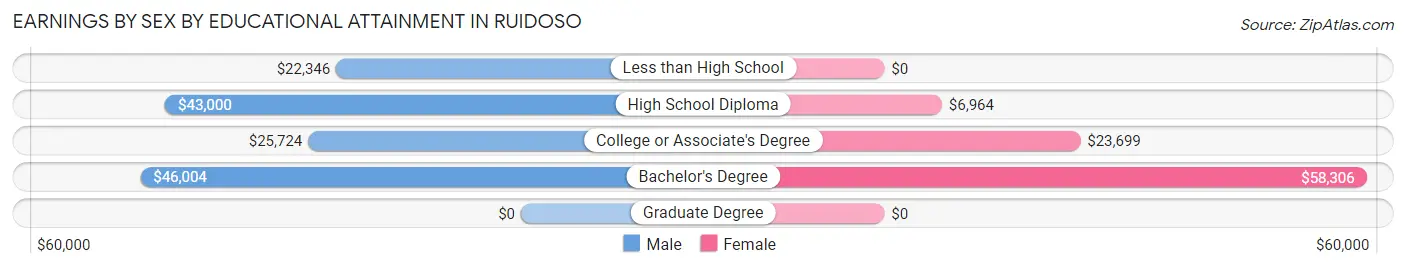
Earnings by Sex by Educational Attainment in Ruidoso
Average earnings in Ruidoso are $32,924 for men and $26,250 for women, a difference of 20.3%. Men with an educational attainment of bachelor's degree enjoy the highest average annual earnings of $46,004, while those with less than high school education earn the least with $22,346. Women with an educational attainment of bachelor's degree earn the most with the average annual earnings of $58,306, while those with high school diploma education have the smallest earnings of $6,964.
| Educational Attainment | Male Income | Female Income |
| Less than High School | $22,346 | $0 |
| High School Diploma | $43,000 | $6,964 |
| College or Associate's Degree | $25,724 | $23,699 |
| Bachelor's Degree | $46,004 | $58,306 |
| Graduate Degree | - | - |
| Total | $32,924 | $26,250 |
Family Income in Ruidoso
Family Income Brackets in Ruidoso
According to the Ruidoso family income data, there are 505 families falling into the $50,000 to $74,999 income range, which is the most common income bracket and makes up 25.4% of all families. Conversely, the $10,000 to $14,999 income bracket is the least frequent group with only 12 families (0.6%) belonging to this category.
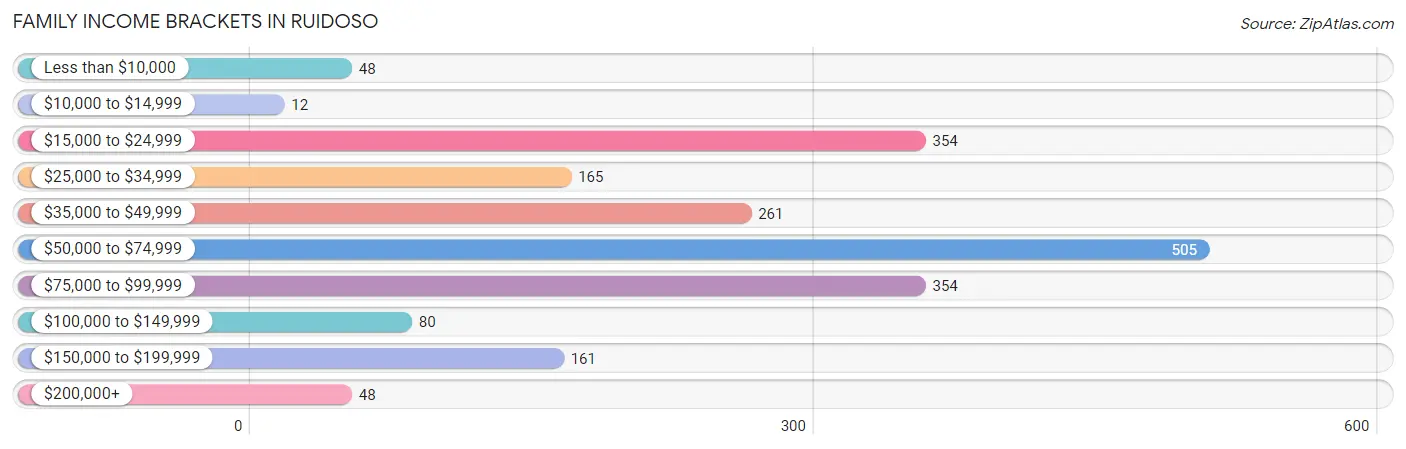
| Income Bracket | # Families | % Families |
| Less than $10,000 | 48 | 2.4% |
| $10,000 to $14,999 | 12 | 0.6% |
| $15,000 to $24,999 | 354 | 17.8% |
| $25,000 to $34,999 | 165 | 8.3% |
| $35,000 to $49,999 | 261 | 13.1% |
| $50,000 to $74,999 | 505 | 25.4% |
| $75,000 to $99,999 | 354 | 17.8% |
| $100,000 to $149,999 | 80 | 4.0% |
| $150,000 to $199,999 | 161 | 8.1% |
| $200,000+ | 48 | 2.4% |
Family Income by Famaliy Size in Ruidoso
4-person families (141 | 7.1%) account for the highest median family income in Ruidoso with $81,250 per family, while 2-person families (1,221 | 61.4%) have the highest median income of $29,234 per family member.
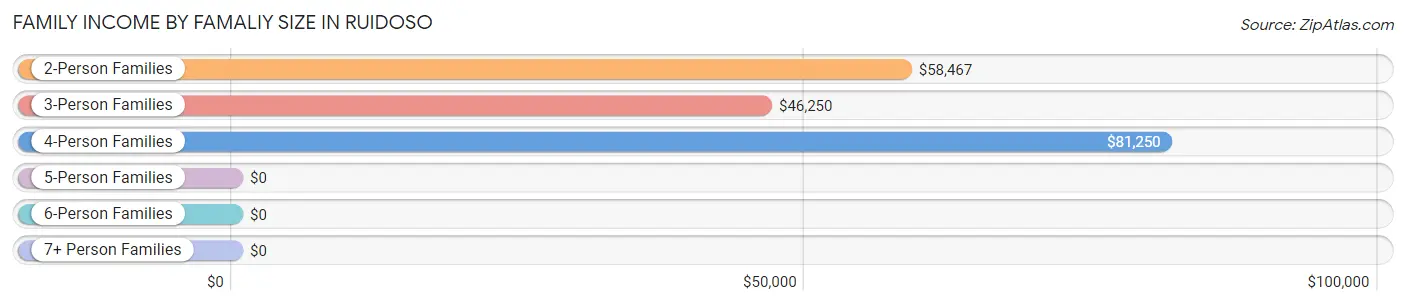
| Income Bracket | # Families | Median Income |
| 2-Person Families | 1,221 (61.4%) | $58,467 |
| 3-Person Families | 458 (23.0%) | $46,250 |
| 4-Person Families | 141 (7.1%) | $81,250 |
| 5-Person Families | 117 (5.9%) | $0 |
| 6-Person Families | 52 (2.6%) | $0 |
| 7+ Person Families | 0 (0.0%) | $0 |
| Total | 1,989 (100.0%) | $56,916 |
Family Income by Number of Earners in Ruidoso
The median family income in Ruidoso is $56,916, with families comprising 2 earners (594) having the highest median family income of $73,111, while families with no earners (497) have the lowest median family income of $37,487, accounting for 29.9% and 25.0% of families, respectively.
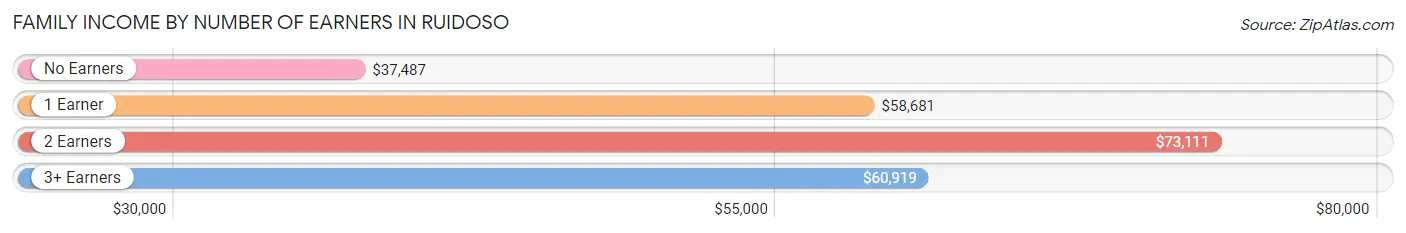
| Number of Earners | # Families | Median Income |
| No Earners | 497 (25.0%) | $37,487 |
| 1 Earner | 723 (36.3%) | $58,681 |
| 2 Earners | 594 (29.9%) | $73,111 |
| 3+ Earners | 175 (8.8%) | $60,919 |
| Total | 1,989 (100.0%) | $56,916 |
Household Income in Ruidoso
Household Income Brackets in Ruidoso
With 798 households falling in the category, the $15,000 to $24,999 income range is the most frequent in Ruidoso, accounting for 22.2% of all households. In contrast, only 75 households (2.1%) fall into the $10,000 to $14,999 income bracket, making it the least populous group.
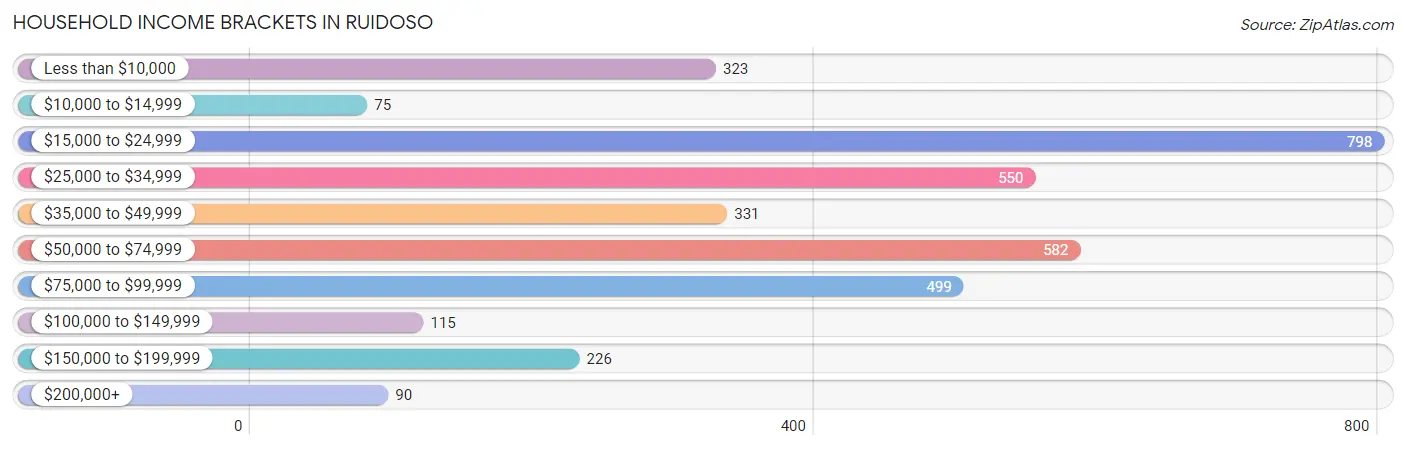
| Income Bracket | # Households | % Households |
| Less than $10,000 | 323 | 9.0% |
| $10,000 to $14,999 | 75 | 2.1% |
| $15,000 to $24,999 | 798 | 22.2% |
| $25,000 to $34,999 | 550 | 15.3% |
| $35,000 to $49,999 | 331 | 9.2% |
| $50,000 to $74,999 | 582 | 16.2% |
| $75,000 to $99,999 | 499 | 13.9% |
| $100,000 to $149,999 | 115 | 3.2% |
| $150,000 to $199,999 | 226 | 6.3% |
| $200,000+ | 90 | 2.5% |
Household Income by Householder Age in Ruidoso
The median household income in Ruidoso is $36,033, with the highest median household income of $61,109 found in the 45 to 64 years age bracket for the primary householder. A total of 991 households (27.6%) fall into this category. Meanwhile, the 15 to 24 years age bracket for the primary householder has the lowest median household income of $21,950, with 256 households (7.1%) in this group.
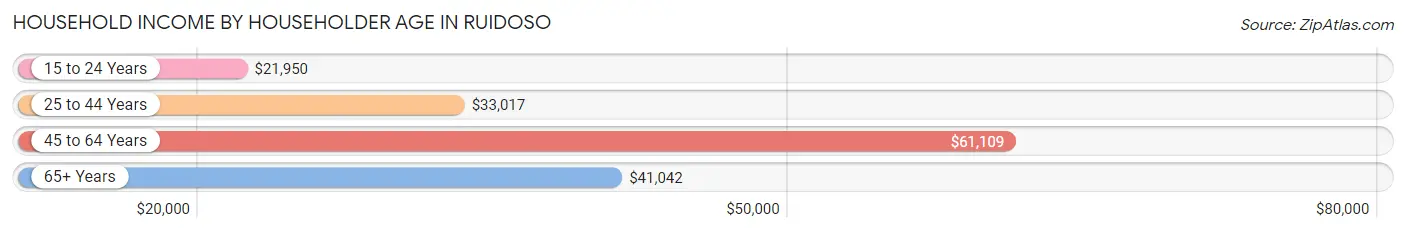
| Income Bracket | # Households | Median Income |
| 15 to 24 Years | 256 (7.1%) | $21,950 |
| 25 to 44 Years | 1,075 (29.9%) | $33,017 |
| 45 to 64 Years | 991 (27.6%) | $61,109 |
| 65+ Years | 1,271 (35.4%) | $41,042 |
| Total | 3,593 (100.0%) | $36,033 |
Poverty in Ruidoso
Income Below Poverty by Sex and Age in Ruidoso
With 15.8% poverty level for males and 14.3% for females among the residents of Ruidoso, under 5 year old males and 5 year old females are the most vulnerable to poverty, with 127 males (69.0%) and 10 females (100.0%) in their respective age groups living below the poverty level.
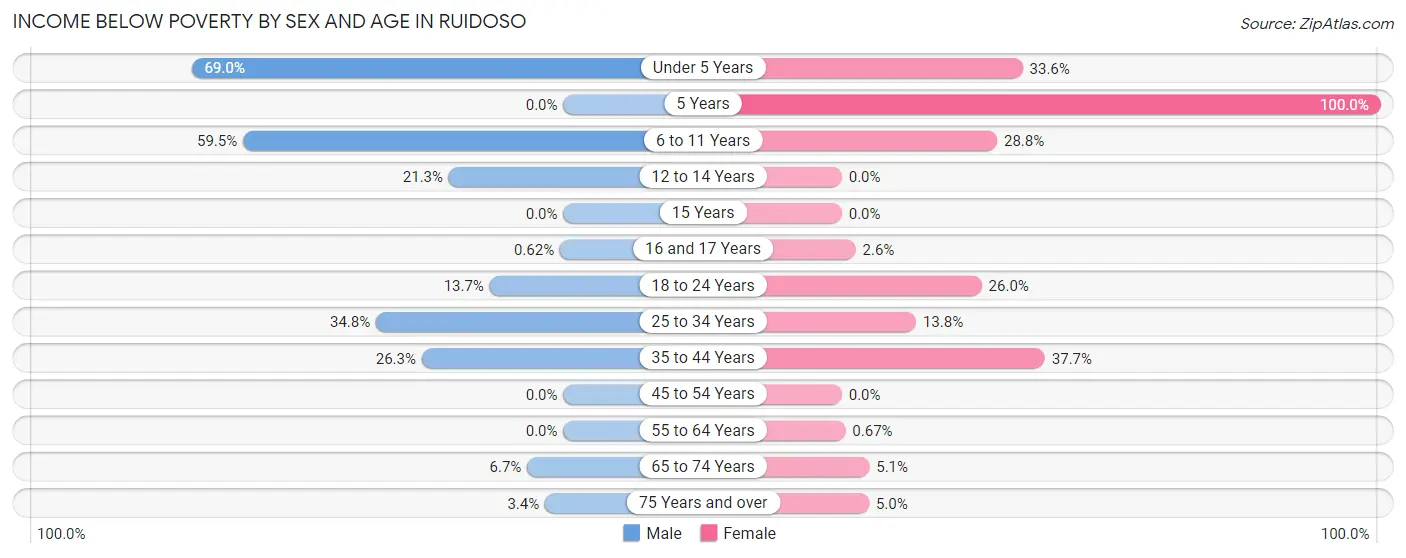
| Age Bracket | Male | Female |
| Under 5 Years | 127 (69.0%) | 98 (33.6%) |
| 5 Years | 0 (0.0%) | 10 (100.0%) |
| 6 to 11 Years | 66 (59.5%) | 49 (28.8%) |
| 12 to 14 Years | 34 (21.2%) | 0 (0.0%) |
| 15 Years | 0 (0.0%) | 0 (0.0%) |
| 16 and 17 Years | 1 (0.6%) | 3 (2.6%) |
| 18 to 24 Years | 41 (13.7%) | 95 (26.0%) |
| 25 to 34 Years | 162 (34.8%) | 50 (13.8%) |
| 35 to 44 Years | 108 (26.3%) | 199 (37.7%) |
| 45 to 54 Years | 0 (0.0%) | 0 (0.0%) |
| 55 to 64 Years | 0 (0.0%) | 4 (0.7%) |
| 65 to 74 Years | 33 (6.7%) | 32 (5.1%) |
| 75 Years and over | 15 (3.4%) | 24 (5.0%) |
| Total | 587 (15.8%) | 564 (14.3%) |
Income Above Poverty by Sex and Age in Ruidoso
According to the poverty statistics in Ruidoso, males aged 5 years and females aged 12 to 14 years are the age groups that are most secure financially, with 100.0% of males and 100.0% of females in these age groups living above the poverty line.
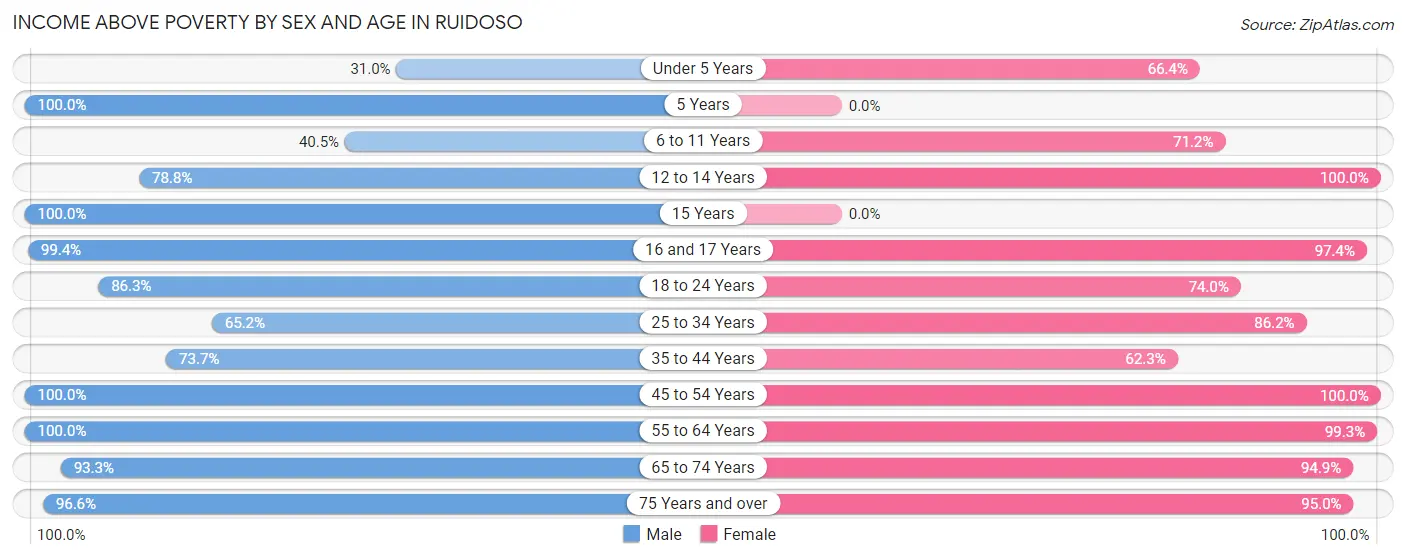
| Age Bracket | Male | Female |
| Under 5 Years | 57 (31.0%) | 194 (66.4%) |
| 5 Years | 123 (100.0%) | 0 (0.0%) |
| 6 to 11 Years | 45 (40.5%) | 121 (71.2%) |
| 12 to 14 Years | 126 (78.7%) | 103 (100.0%) |
| 15 Years | 64 (100.0%) | 0 (0.0%) |
| 16 and 17 Years | 160 (99.4%) | 114 (97.4%) |
| 18 to 24 Years | 259 (86.3%) | 271 (74.0%) |
| 25 to 34 Years | 304 (65.2%) | 313 (86.2%) |
| 35 to 44 Years | 303 (73.7%) | 329 (62.3%) |
| 45 to 54 Years | 335 (100.0%) | 289 (100.0%) |
| 55 to 64 Years | 463 (100.0%) | 593 (99.3%) |
| 65 to 74 Years | 459 (93.3%) | 596 (94.9%) |
| 75 Years and over | 427 (96.6%) | 452 (95.0%) |
| Total | 3,125 (84.2%) | 3,375 (85.7%) |
Income Below Poverty Among Married-Couple Families in Ruidoso
The poverty statistics for married-couple families in Ruidoso show that 4.5% or 63 of the total 1,412 families live below the poverty line. Families with 3 or 4 children have the highest poverty rate of 44.6%, comprising of 49 families. On the other hand, families with no children have the lowest poverty rate of 0.0%, which includes 0 families.
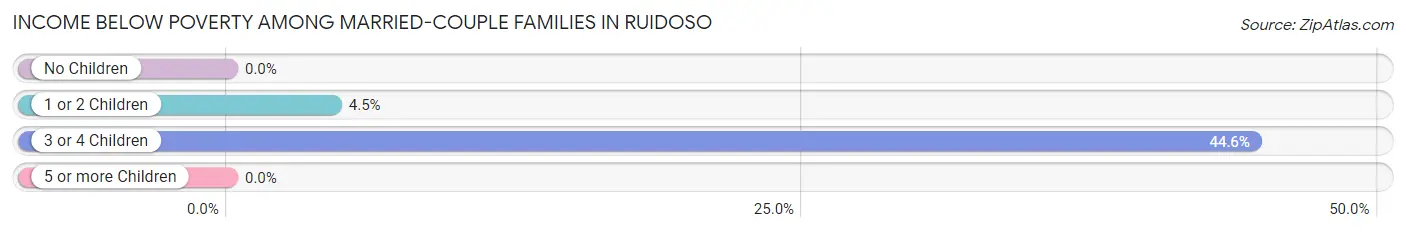
| Children | Above Poverty | Below Poverty |
| No Children | 992 (100.0%) | 0 (0.0%) |
| 1 or 2 Children | 296 (95.5%) | 14 (4.5%) |
| 3 or 4 Children | 61 (55.4%) | 49 (44.6%) |
| 5 or more Children | 0 (0.0%) | 0 (0.0%) |
| Total | 1,349 (95.5%) | 63 (4.5%) |
Income Below Poverty Among Single-Parent Households in Ruidoso
According to the poverty data in Ruidoso, 24.0% or 92 single-father households and 12.9% or 25 single-mother households are living below the poverty line. Among single-father households, those with 3 or 4 children have the highest poverty rate, with 51 households (100.0%) experiencing poverty. Likewise, among single-mother households, those with 1 or 2 children have the highest poverty rate, with 25 households (16.7%) falling below the poverty line.
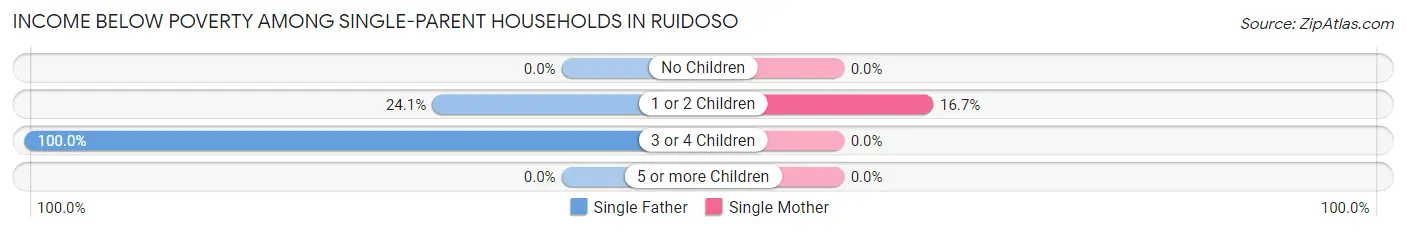
| Children | Single Father | Single Mother |
| No Children | 0 (0.0%) | 0 (0.0%) |
| 1 or 2 Children | 41 (24.1%) | 25 (16.7%) |
| 3 or 4 Children | 51 (100.0%) | 0 (0.0%) |
| 5 or more Children | 0 (0.0%) | 0 (0.0%) |
| Total | 92 (24.0%) | 25 (12.9%) |
Income Below Poverty Among Married-Couple vs Single-Parent Households in Ruidoso
The poverty data for Ruidoso shows that 63 of the married-couple family households (4.5%) and 117 of the single-parent households (20.3%) are living below the poverty level. Within the married-couple family households, those with 3 or 4 children have the highest poverty rate, with 49 households (44.6%) falling below the poverty line. Among the single-parent households, those with 3 or 4 children have the highest poverty rate, with 51 household (86.4%) living below poverty.
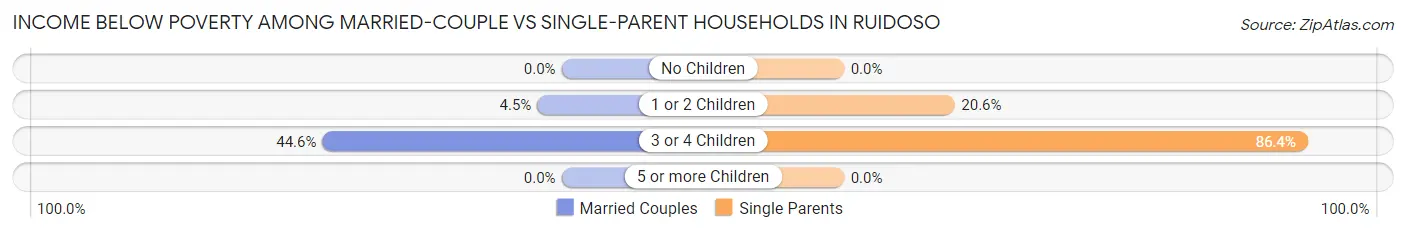
| Children | Married-Couple Families | Single-Parent Households |
| No Children | 0 (0.0%) | 0 (0.0%) |
| 1 or 2 Children | 14 (4.5%) | 66 (20.6%) |
| 3 or 4 Children | 49 (44.6%) | 51 (86.4%) |
| 5 or more Children | 0 (0.0%) | 0 (0.0%) |
| Total | 63 (4.5%) | 117 (20.3%) |
Race in Ruidoso
The most populous races in Ruidoso are White / Caucasian (6,097 | 79.2%), Hispanic or Latino (2,386 | 31.0%), and Two or more Races (848 | 11.0%).
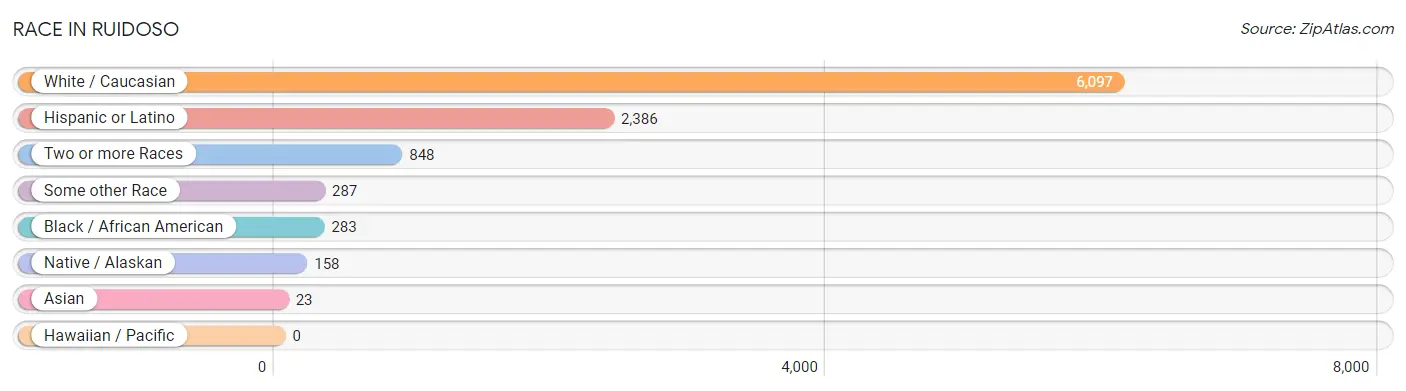
| Race | # Population | % Population |
| Asian | 23 | 0.3% |
| Black / African American | 283 | 3.7% |
| Hawaiian / Pacific | 0 | 0.0% |
| Hispanic or Latino | 2,386 | 31.0% |
| Native / Alaskan | 158 | 2.1% |
| White / Caucasian | 6,097 | 79.2% |
| Two or more Races | 848 | 11.0% |
| Some other Race | 287 | 3.7% |
| Total | 7,696 | 100.0% |
Ancestry in Ruidoso
The most populous ancestries reported in Ruidoso are Mexican (1,956 | 25.4%), Irish (1,092 | 14.2%), German (1,050 | 13.6%), English (663 | 8.6%), and American (404 | 5.2%), together accounting for 67.1% of all Ruidoso residents.
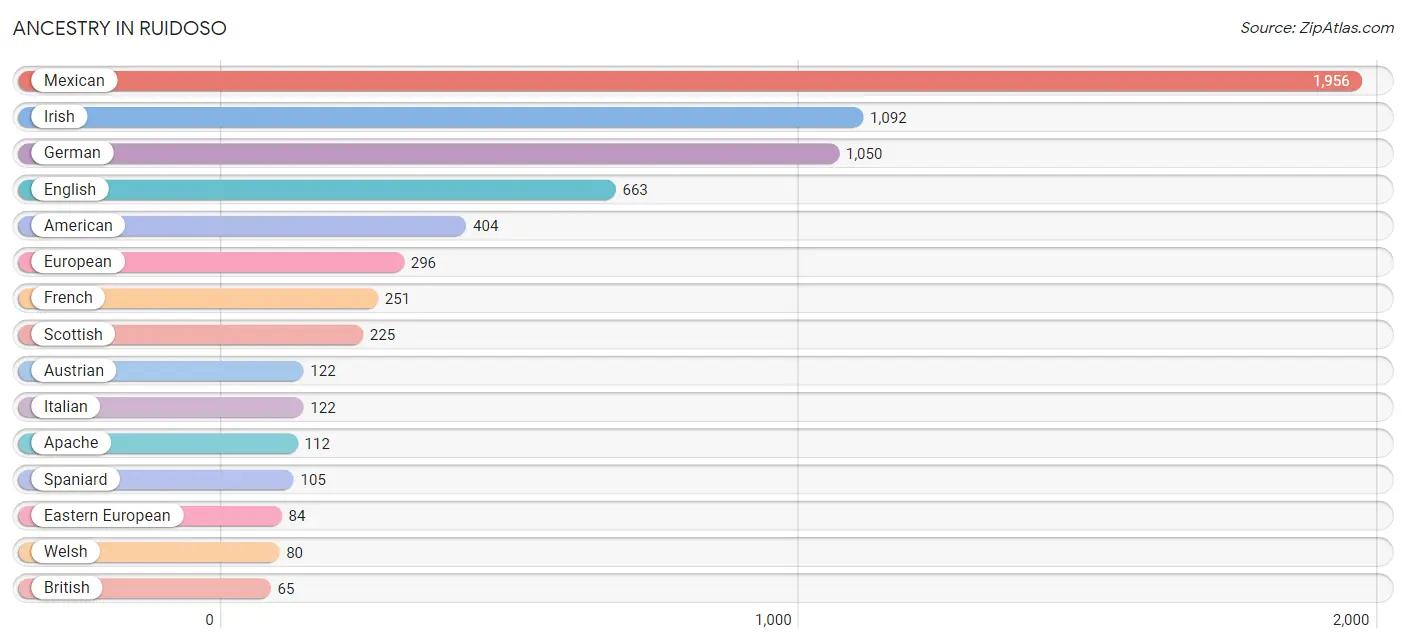
| Ancestry | # Population | % Population |
| American | 404 | 5.2% |
| Apache | 112 | 1.5% |
| Arab | 15 | 0.2% |
| Austrian | 122 | 1.6% |
| Bhutanese | 2 | 0.0% |
| British | 65 | 0.8% |
| Creek | 8 | 0.1% |
| Eastern European | 84 | 1.1% |
| English | 663 | 8.6% |
| European | 296 | 3.8% |
| Finnish | 11 | 0.1% |
| French | 251 | 3.3% |
| German | 1,050 | 13.6% |
| Hungarian | 5 | 0.1% |
| Indian (Asian) | 4 | 0.1% |
| Irish | 1,092 | 14.2% |
| Israeli | 10 | 0.1% |
| Italian | 122 | 1.6% |
| Jordanian | 9 | 0.1% |
| Korean | 4 | 0.1% |
| Mexican | 1,956 | 25.4% |
| Native Hawaiian | 4 | 0.1% |
| Norwegian | 4 | 0.1% |
| Pakistani | 23 | 0.3% |
| Palestinian | 6 | 0.1% |
| Polish | 53 | 0.7% |
| Portuguese | 4 | 0.1% |
| Pueblo | 46 | 0.6% |
| Puerto Rican | 40 | 0.5% |
| Russian | 29 | 0.4% |
| Scandinavian | 22 | 0.3% |
| Scotch-Irish | 54 | 0.7% |
| Scottish | 225 | 2.9% |
| Slovene | 14 | 0.2% |
| Spaniard | 105 | 1.4% |
| Spanish | 33 | 0.4% |
| Swedish | 61 | 0.8% |
| Ukrainian | 21 | 0.3% |
| Welsh | 80 | 1.0% |
| West Indian | 37 | 0.5% | View All 40 Rows |
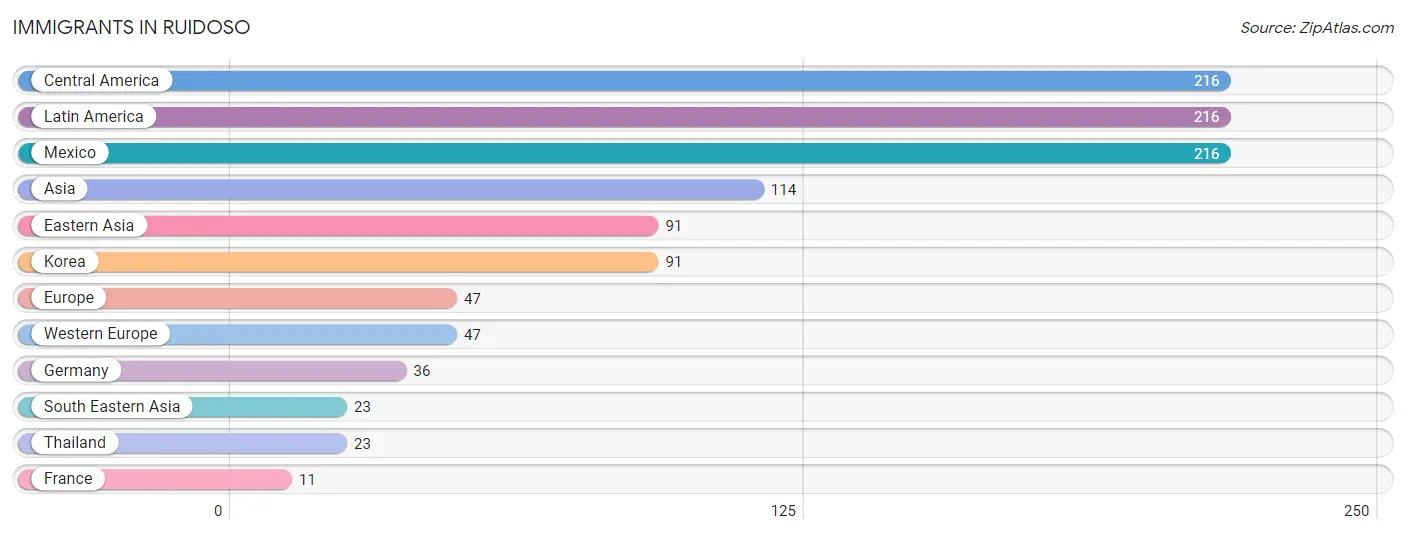
Immigrants in Ruidoso
The most numerous immigrant groups reported in Ruidoso came from Central America (216 | 2.8%), Latin America (216 | 2.8%), Mexico (216 | 2.8%), Asia (114 | 1.5%), and Eastern Asia (91 | 1.2%), together accounting for 11.1% of all Ruidoso residents.
| Immigration Origin | # Population | % Population |
| Asia | 114 | 1.5% |
| Central America | 216 | 2.8% |
| Eastern Asia | 91 | 1.2% |
| Europe | 47 | 0.6% |
| France | 11 | 0.1% |
| Germany | 36 | 0.5% |
| Korea | 91 | 1.2% |
| Latin America | 216 | 2.8% |
| Mexico | 216 | 2.8% |
| South Eastern Asia | 23 | 0.3% |
| Thailand | 23 | 0.3% |
| Western Europe | 47 | 0.6% | View All 12 Rows |
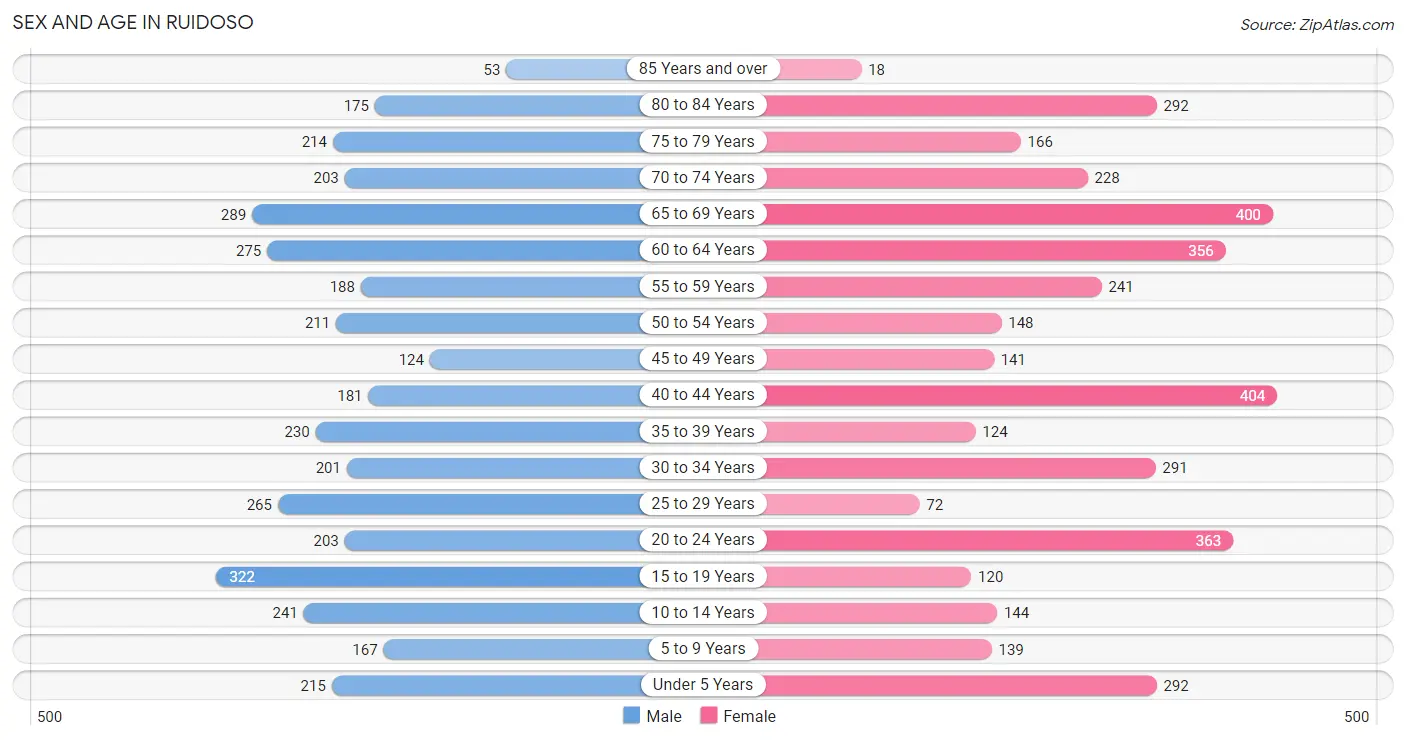
Sex and Age in Ruidoso
Sex and Age in Ruidoso
The most populous age groups in Ruidoso are 15 to 19 Years (322 | 8.6%) for men and 40 to 44 Years (404 | 10.3%) for women.
| Age Bracket | Male | Female |
| Under 5 Years | 215 (5.7%) | 292 (7.4%) |
| 5 to 9 Years | 167 (4.4%) | 139 (3.5%) |
| 10 to 14 Years | 241 (6.4%) | 144 (3.7%) |
| 15 to 19 Years | 322 (8.6%) | 120 (3.0%) |
| 20 to 24 Years | 203 (5.4%) | 363 (9.2%) |
| 25 to 29 Years | 265 (7.0%) | 72 (1.8%) |
| 30 to 34 Years | 201 (5.3%) | 291 (7.4%) |
| 35 to 39 Years | 230 (6.1%) | 124 (3.2%) |
| 40 to 44 Years | 181 (4.8%) | 404 (10.3%) |
| 45 to 49 Years | 124 (3.3%) | 141 (3.6%) |
| 50 to 54 Years | 211 (5.6%) | 148 (3.8%) |
| 55 to 59 Years | 188 (5.0%) | 241 (6.1%) |
| 60 to 64 Years | 275 (7.3%) | 356 (9.0%) |
| 65 to 69 Years | 289 (7.7%) | 400 (10.2%) |
| 70 to 74 Years | 203 (5.4%) | 228 (5.8%) |
| 75 to 79 Years | 214 (5.7%) | 166 (4.2%) |
| 80 to 84 Years | 175 (4.7%) | 292 (7.4%) |
| 85 Years and over | 53 (1.4%) | 18 (0.5%) |
| Total | 3,757 (100.0%) | 3,939 (100.0%) |
Families and Households in Ruidoso
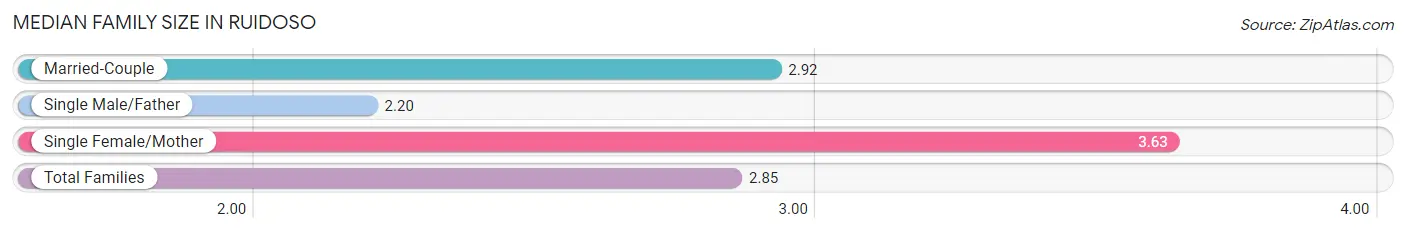
Median Family Size in Ruidoso
The median family size in Ruidoso is 2.85 persons per family, with single female/mother families (194 | 9.8%) accounting for the largest median family size of 3.63 persons per family. On the other hand, single male/father families (383 | 19.3%) represent the smallest median family size with 2.20 persons per family.
| Family Type | # Families | Family Size |
| Married-Couple | 1,412 (71.0%) | 2.92 |
| Single Male/Father | 383 (19.3%) | 2.20 |
| Single Female/Mother | 194 (9.8%) | 3.63 |
| Total Families | 1,989 (100.0%) | 2.85 |
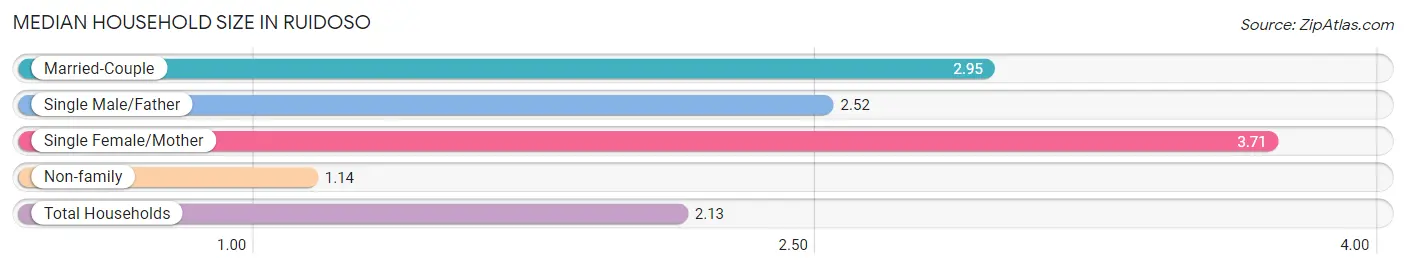
Median Household Size in Ruidoso
The median household size in Ruidoso is 2.13 persons per household, with single female/mother households (194 | 5.4%) accounting for the largest median household size of 3.71 persons per household. non-family households (1,604 | 44.6%) represent the smallest median household size with 1.14 persons per household.
| Household Type | # Households | Household Size |
| Married-Couple | 1,412 (39.3%) | 2.95 |
| Single Male/Father | 383 (10.7%) | 2.52 |
| Single Female/Mother | 194 (5.4%) | 3.71 |
| Non-family | 1,604 (44.6%) | 1.14 |
| Total Households | 3,593 (100.0%) | 2.13 |
Household Size by Marriage Status in Ruidoso
Out of a total of 3,593 households in Ruidoso, 1,989 (55.4%) are family households, while 1,604 (44.6%) are nonfamily households. The most numerous type of family households are 2-person households, comprising 1,136, and the most common type of nonfamily households are 1-person households, comprising 1,347.
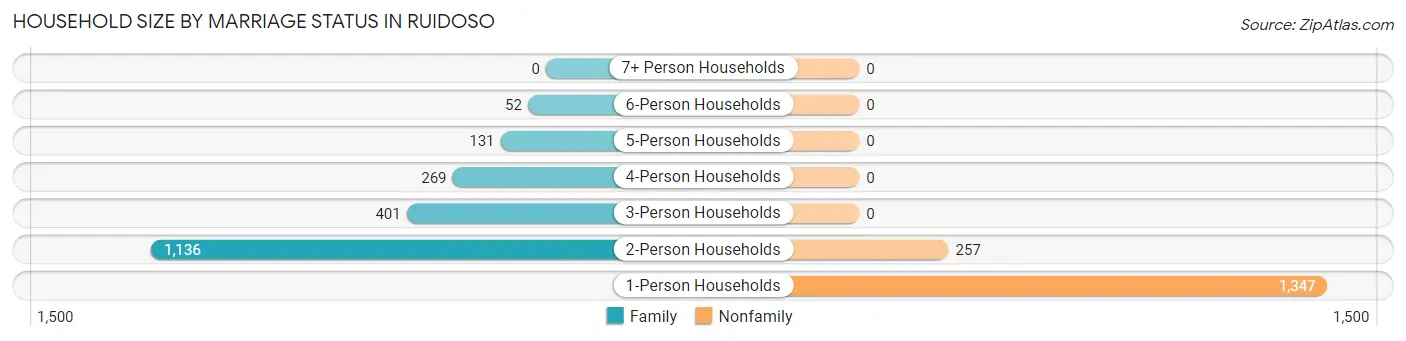
| Household Size | Family Households | Nonfamily Households |
| 1-Person Households | - | 1,347 (37.5%) |
| 2-Person Households | 1,136 (31.6%) | 257 (7.1%) |
| 3-Person Households | 401 (11.2%) | 0 (0.0%) |
| 4-Person Households | 269 (7.5%) | 0 (0.0%) |
| 5-Person Households | 131 (3.6%) | 0 (0.0%) |
| 6-Person Households | 52 (1.5%) | 0 (0.0%) |
| 7+ Person Households | 0 (0.0%) | 0 (0.0%) |
| Total | 1,989 (55.4%) | 1,604 (44.6%) |
Female Fertility in Ruidoso
Fertility by Age in Ruidoso
Average fertility rate in Ruidoso is 80.0 births per 1,000 women. Women in the age bracket of 20 to 34 years have the highest fertility rate with 147.0 births per 1,000 women. Women in the age bracket of 20 to 34 years acount for 88.4% of all women with births.
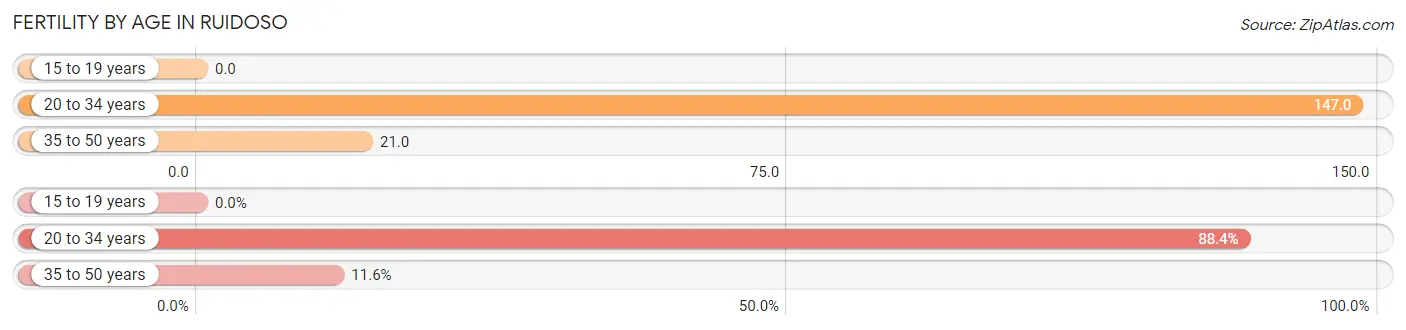
| Age Bracket | Women with Births | Births / 1,000 Women |
| 15 to 19 years | 0 (0.0%) | 0.0 |
| 20 to 34 years | 107 (88.4%) | 147.0 |
| 35 to 50 years | 14 (11.6%) | 21.0 |
| Total | 121 (100.0%) | 80.0 |
Fertility by Age by Marriage Status in Ruidoso
11.6% of women with births (121) in Ruidoso are married. The highest percentage of unmarried women with births falls into 20 to 34 years age bracket with 100.0% of them unmarried at the time of birth, while the lowest percentage of unmarried women with births belong to 35 to 50 years age bracket with 0.0% of them unmarried.
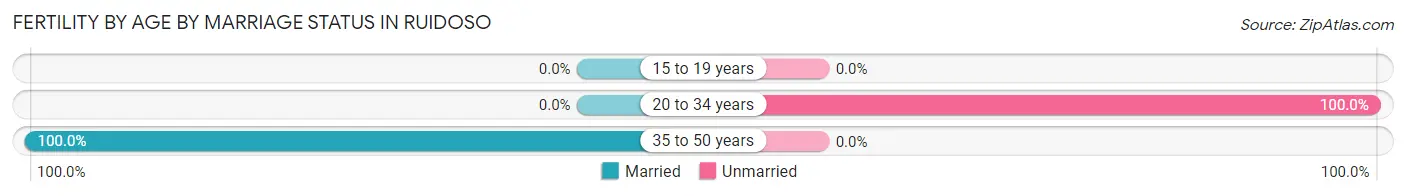
| Age Bracket | Married | Unmarried |
| 15 to 19 years | 0 (0.0%) | 0 (0.0%) |
| 20 to 34 years | 0 (0.0%) | 107 (100.0%) |
| 35 to 50 years | 14 (100.0%) | 0 (0.0%) |
| Total | 14 (11.6%) | 107 (88.4%) |
Fertility by Education in Ruidoso
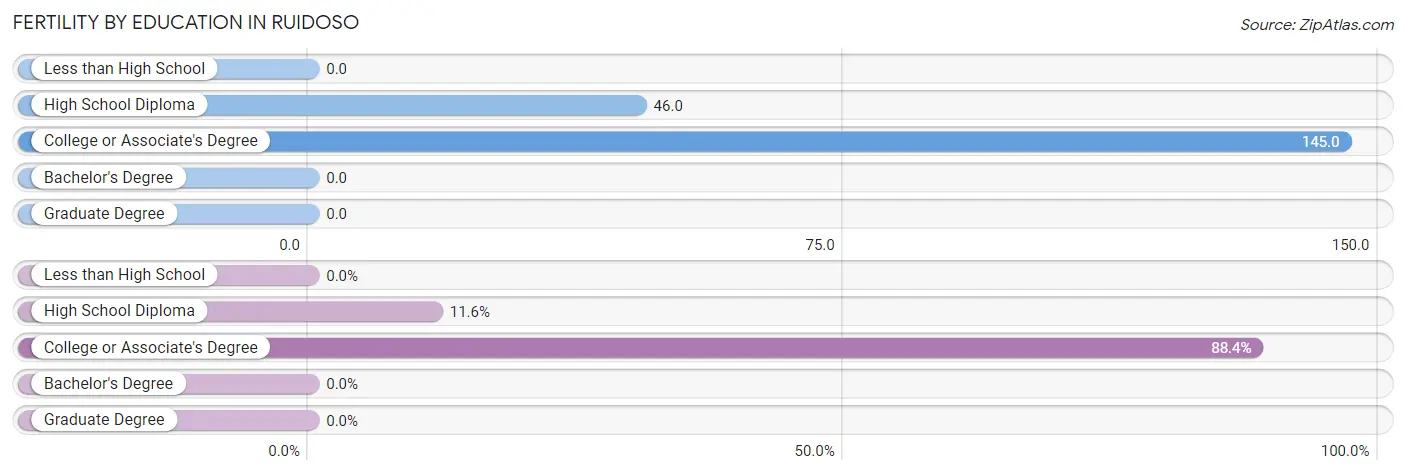
| Educational Attainment | Women with Births | Births / 1,000 Women |
| Less than High School | 0 (0.0%) | 0.0 |
| High School Diploma | 14 (11.6%) | 46.0 |
| College or Associate's Degree | 107 (88.4%) | 145.0 |
| Bachelor's Degree | 0 (0.0%) | 0.0 |
| Graduate Degree | 0 (0.0%) | 0.0 |
| Total | 121 (100.0%) | 80.0 |
Fertility by Education by Marriage Status in Ruidoso
88.4% of women with births in Ruidoso are unmarried. Women with the educational attainment of college or associate's degree are most likely to be married with 13.1% of them married at childbirth, while women with the educational attainment of high school diploma are least likely to be married with 100.0% of them unmarried at childbirth.
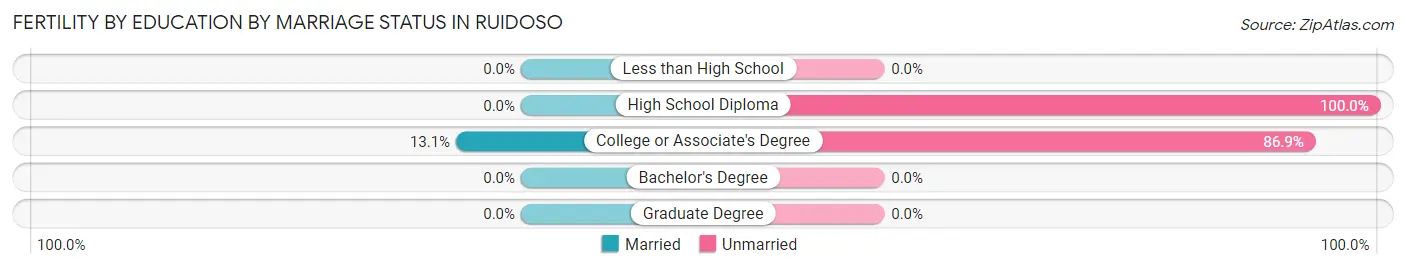
| Educational Attainment | Married | Unmarried |
| Less than High School | 0 (0.0%) | 0 (0.0%) |
| High School Diploma | 0 (0.0%) | 14 (100.0%) |
| College or Associate's Degree | 14 (13.1%) | 93 (86.9%) |
| Bachelor's Degree | 0 (0.0%) | 0 (0.0%) |
| Graduate Degree | 0 (0.0%) | 0 (0.0%) |
| Total | 14 (11.6%) | 107 (88.4%) |
Employment Characteristics in Ruidoso
Employment by Class of Employer in Ruidoso
Among the 3,466 employed individuals in Ruidoso, private company employees (1,993 | 57.5%), self-employed (not incorporated) (653 | 18.8%), and local government employees (342 | 9.9%) make up the most common classes of employment.
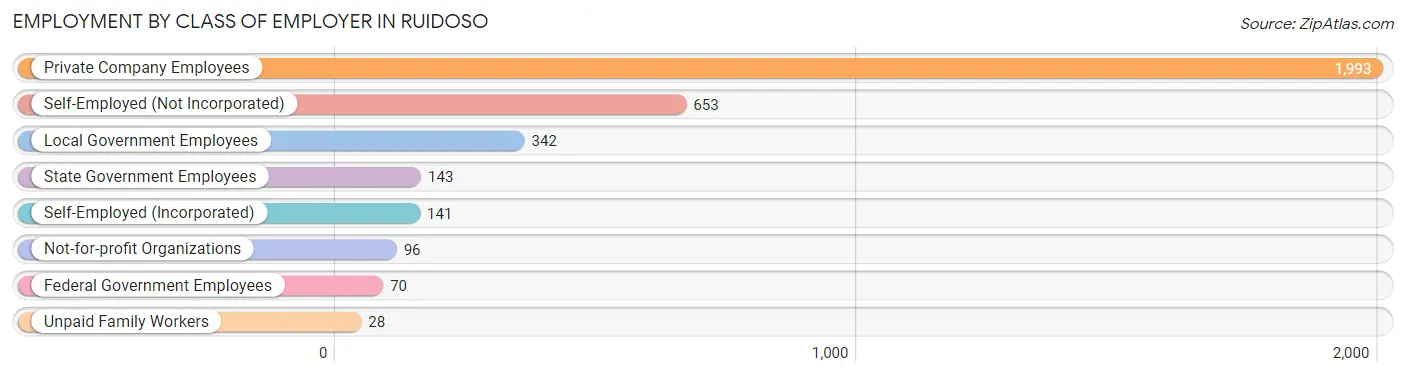
| Employer Class | # Employees | % Employees |
| Private Company Employees | 1,993 | 57.5% |
| Self-Employed (Incorporated) | 141 | 4.1% |
| Self-Employed (Not Incorporated) | 653 | 18.8% |
| Not-for-profit Organizations | 96 | 2.8% |
| Local Government Employees | 342 | 9.9% |
| State Government Employees | 143 | 4.1% |
| Federal Government Employees | 70 | 2.0% |
| Unpaid Family Workers | 28 | 0.8% |
| Total | 3,466 | 100.0% |
Employment Status by Age in Ruidoso
According to the labor force statistics for Ruidoso, out of the total population over 16 years of age (6,434), 58.1% or 3,738 individuals are in the labor force, with 5.4% or 202 of them unemployed. The age group with the highest labor force participation rate is 45 to 54 years, with 92.6% or 578 individuals in the labor force. Within the labor force, the 55 to 59 years age range has the highest percentage of unemployed individuals, with 16.6% or 57 of them being unemployed.
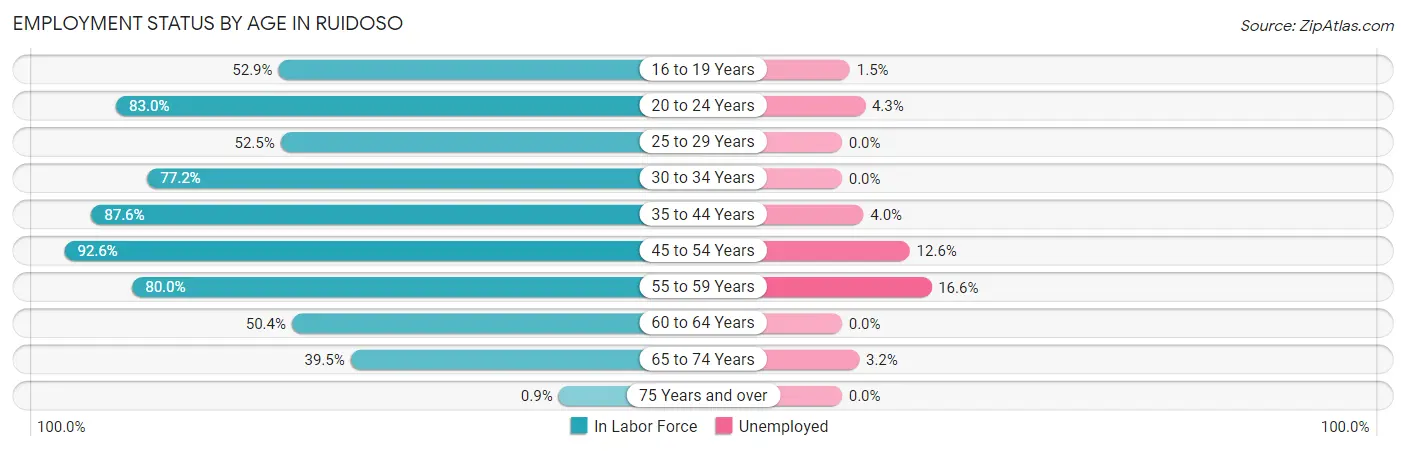
| Age Bracket | In Labor Force | Unemployed |
| 16 to 19 Years | 200 (52.9%) | 3 (1.5%) |
| 20 to 24 Years | 470 (83.0%) | 20 (4.3%) |
| 25 to 29 Years | 177 (52.5%) | 0 (0.0%) |
| 30 to 34 Years | 380 (77.2%) | 0 (0.0%) |
| 35 to 44 Years | 823 (87.6%) | 33 (4.0%) |
| 45 to 54 Years | 578 (92.6%) | 73 (12.6%) |
| 55 to 59 Years | 343 (80.0%) | 57 (16.6%) |
| 60 to 64 Years | 318 (50.4%) | 0 (0.0%) |
| 65 to 74 Years | 442 (39.5%) | 14 (3.2%) |
| 75 Years and over | 8 (0.9%) | 0 (0.0%) |
| Total | 3,738 (58.1%) | 202 (5.4%) |
Employment Status by Educational Attainment in Ruidoso
According to labor force statistics for Ruidoso, 75.9% of individuals (2,620) out of the total population between 25 and 64 years of age (3,452) are in the labor force, with 6.3% or 165 of them being unemployed. The group with the highest labor force participation rate are those with the educational attainment of high school diploma, with 80.1% or 507 individuals in the labor force. Within the labor force, individuals with less than high school education have the highest percentage of unemployment, with 23.3% or 73 of them being unemployed.
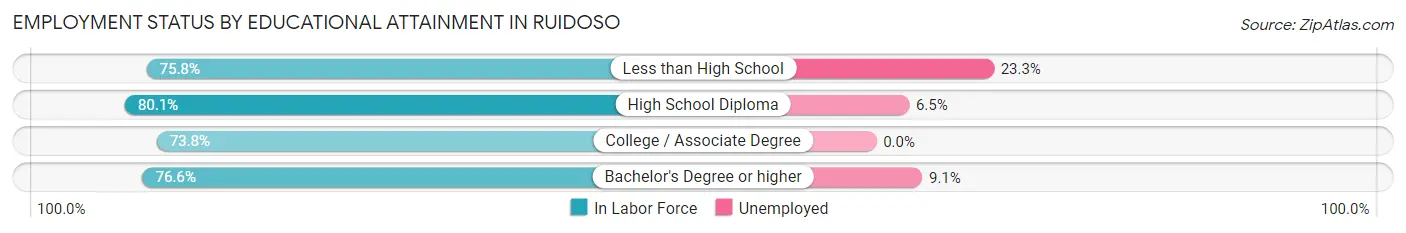
| Educational Attainment | In Labor Force | Unemployed |
| Less than High School | 313 (75.8%) | 96 (23.3%) |
| High School Diploma | 507 (80.1%) | 41 (6.5%) |
| College / Associate Degree | 1,176 (73.8%) | 0 (0.0%) |
| Bachelor's Degree or higher | 623 (76.6%) | 74 (9.1%) |
| Total | 2,620 (75.9%) | 217 (6.3%) |
Employment Occupations by Sex in Ruidoso
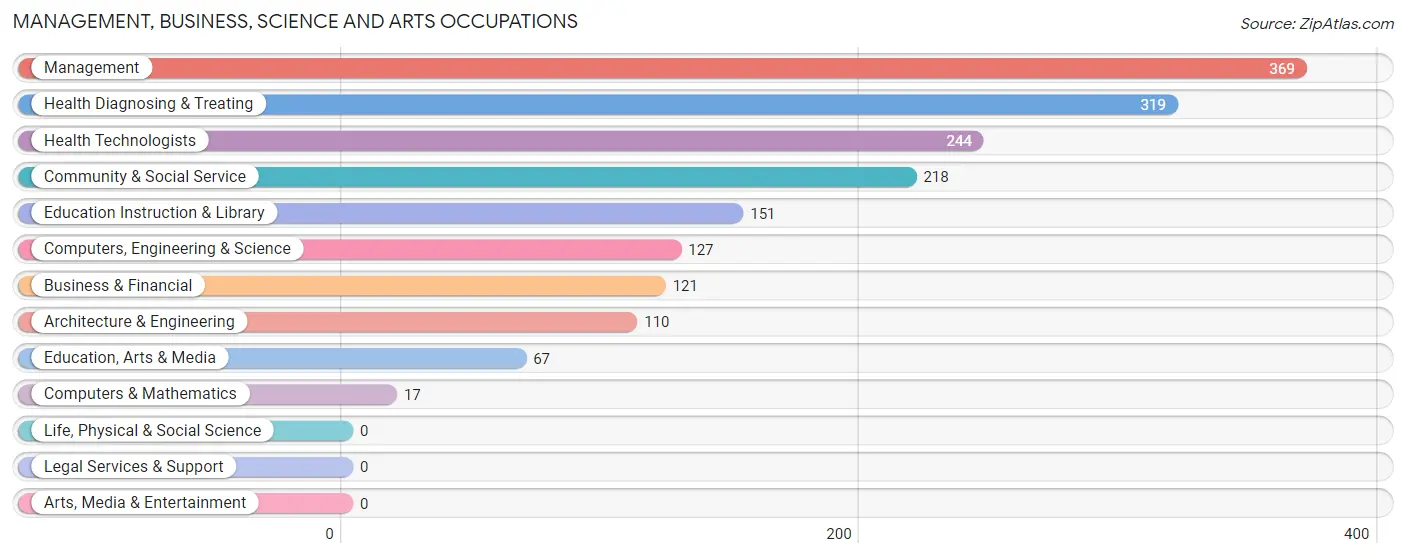
Management, Business, Science and Arts Occupations
The most common Management, Business, Science and Arts occupations in Ruidoso are Management (369 | 10.5%), Health Diagnosing & Treating (319 | 9.0%), Health Technologists (244 | 6.9%), Community & Social Service (218 | 6.2%), and Education Instruction & Library (151 | 4.3%).
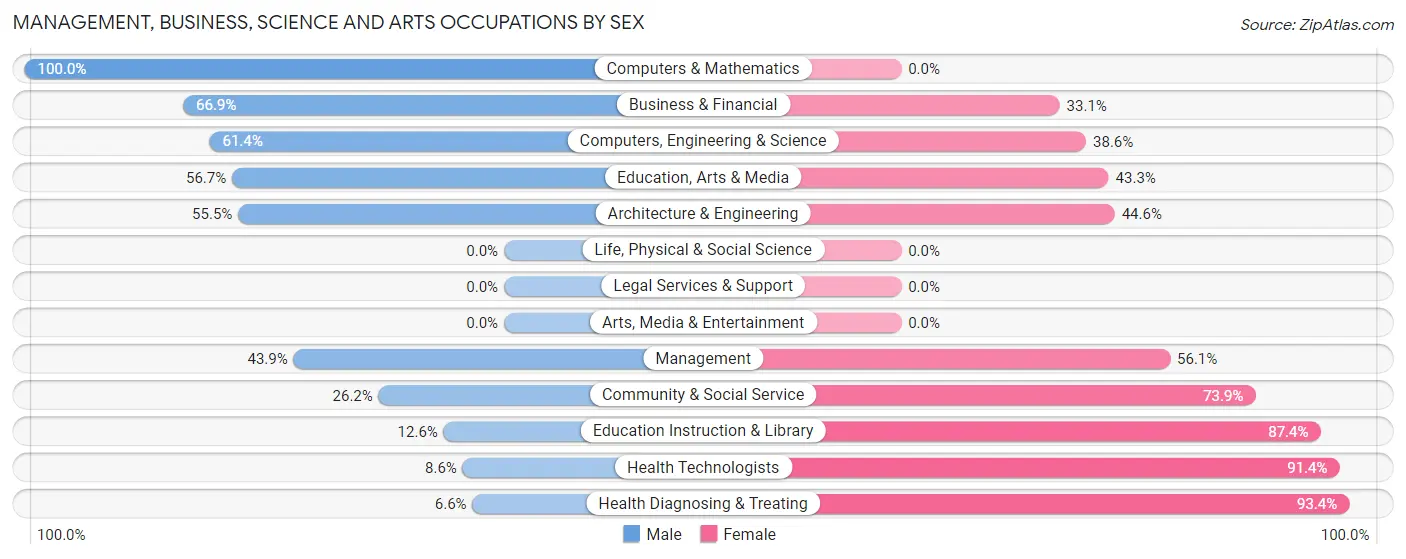
Management, Business, Science and Arts Occupations by Sex
Within the Management, Business, Science and Arts occupations in Ruidoso, the most male-oriented occupations are Computers & Mathematics (100.0%), Business & Financial (66.9%), and Computers, Engineering & Science (61.4%), while the most female-oriented occupations are Health Diagnosing & Treating (93.4%), Health Technologists (91.4%), and Education Instruction & Library (87.4%).
| Occupation | Male | Female |
| Management | 162 (43.9%) | 207 (56.1%) |
| Business & Financial | 81 (66.9%) | 40 (33.1%) |
| Computers, Engineering & Science | 78 (61.4%) | 49 (38.6%) |
| Computers & Mathematics | 17 (100.0%) | 0 (0.0%) |
| Architecture & Engineering | 61 (55.4%) | 49 (44.6%) |
| Life, Physical & Social Science | 0 (0.0%) | 0 (0.0%) |
| Community & Social Service | 57 (26.2%) | 161 (73.9%) |
| Education, Arts & Media | 38 (56.7%) | 29 (43.3%) |
| Legal Services & Support | 0 (0.0%) | 0 (0.0%) |
| Education Instruction & Library | 19 (12.6%) | 132 (87.4%) |
| Arts, Media & Entertainment | 0 (0.0%) | 0 (0.0%) |
| Health Diagnosing & Treating | 21 (6.6%) | 298 (93.4%) |
| Health Technologists | 21 (8.6%) | 223 (91.4%) |
| Total (Category) | 399 (34.6%) | 755 (65.4%) |
| Total (Overall) | 1,673 (47.4%) | 1,855 (52.6%) |
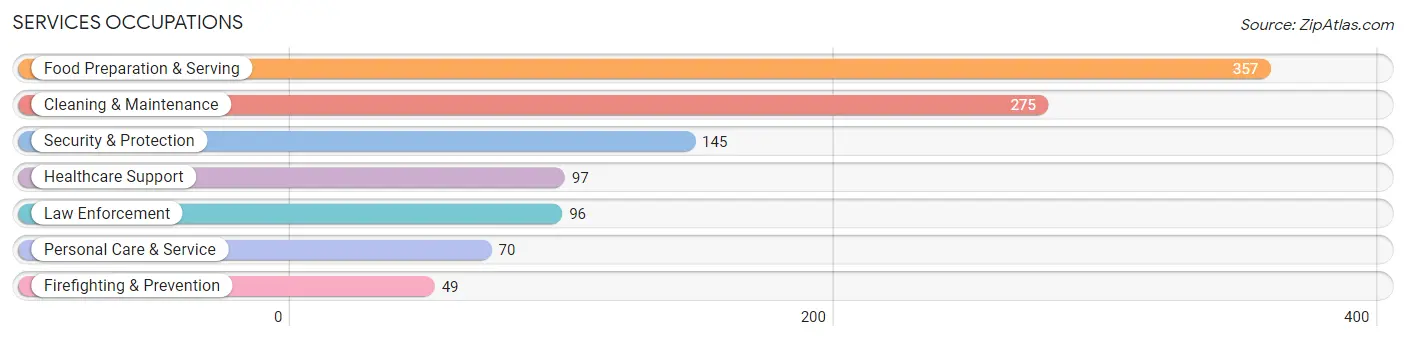
Services Occupations
The most common Services occupations in Ruidoso are Food Preparation & Serving (357 | 10.1%), Cleaning & Maintenance (275 | 7.8%), Security & Protection (145 | 4.1%), Healthcare Support (97 | 2.8%), and Law Enforcement (96 | 2.7%).
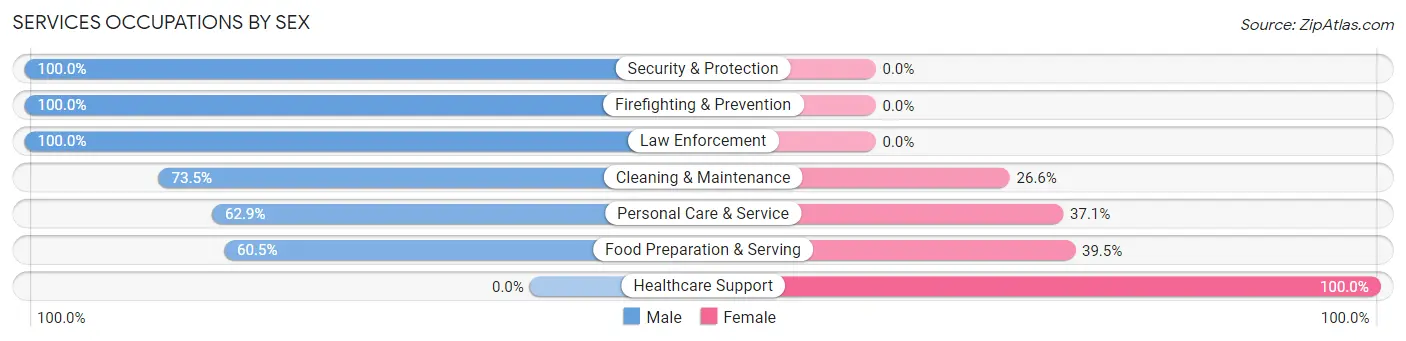
Services Occupations by Sex
Within the Services occupations in Ruidoso, the most male-oriented occupations are Security & Protection (100.0%), Firefighting & Prevention (100.0%), and Law Enforcement (100.0%), while the most female-oriented occupations are Healthcare Support (100.0%), Food Preparation & Serving (39.5%), and Personal Care & Service (37.1%).
| Occupation | Male | Female |
| Healthcare Support | 0 (0.0%) | 97 (100.0%) |
| Security & Protection | 145 (100.0%) | 0 (0.0%) |
| Firefighting & Prevention | 49 (100.0%) | 0 (0.0%) |
| Law Enforcement | 96 (100.0%) | 0 (0.0%) |
| Food Preparation & Serving | 216 (60.5%) | 141 (39.5%) |
| Cleaning & Maintenance | 202 (73.5%) | 73 (26.6%) |
| Personal Care & Service | 44 (62.9%) | 26 (37.1%) |
| Total (Category) | 607 (64.3%) | 337 (35.7%) |
| Total (Overall) | 1,673 (47.4%) | 1,855 (52.6%) |
Sales and Office Occupations
The most common Sales and Office occupations in Ruidoso are Sales & Related (450 | 12.8%), and Office & Administration (267 | 7.6%).
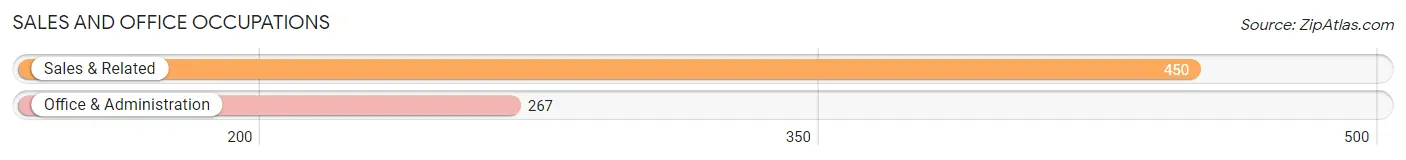
Sales and Office Occupations by Sex
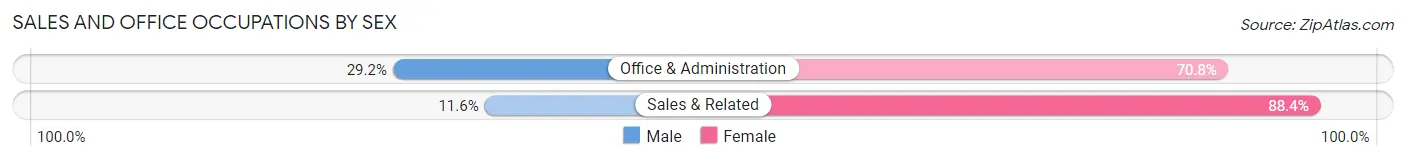
| Occupation | Male | Female |
| Sales & Related | 52 (11.6%) | 398 (88.4%) |
| Office & Administration | 78 (29.2%) | 189 (70.8%) |
| Total (Category) | 130 (18.1%) | 587 (81.9%) |
| Total (Overall) | 1,673 (47.4%) | 1,855 (52.6%) |
Natural Resources, Construction and Maintenance Occupations
The most common Natural Resources, Construction and Maintenance occupations in Ruidoso are , and Construction & Extraction (323 | 9.2%).
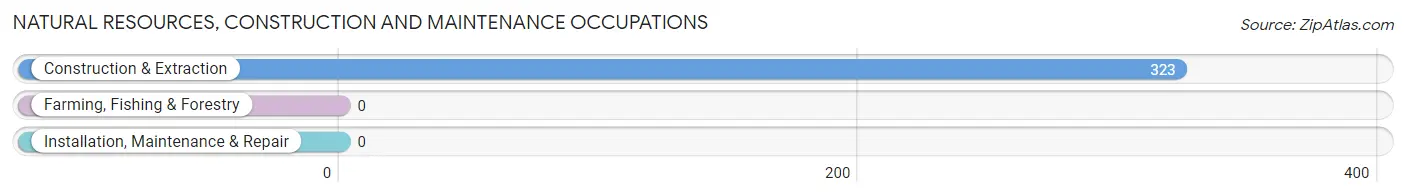
Natural Resources, Construction and Maintenance Occupations by Sex
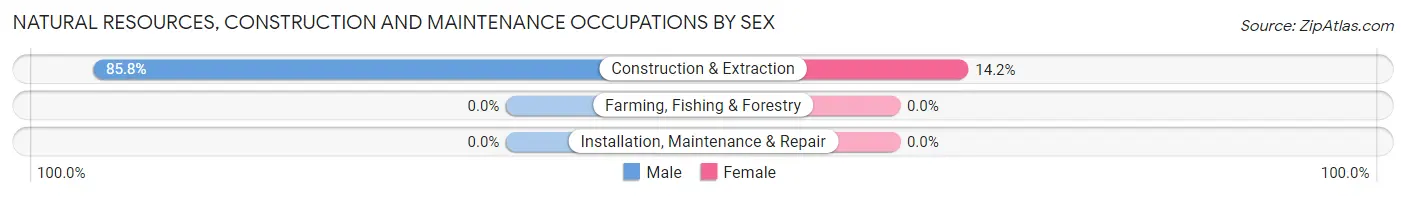
| Occupation | Male | Female |
| Farming, Fishing & Forestry | 0 (0.0%) | 0 (0.0%) |
| Construction & Extraction | 277 (85.8%) | 46 (14.2%) |
| Installation, Maintenance & Repair | 0 (0.0%) | 0 (0.0%) |
| Total (Category) | 277 (85.8%) | 46 (14.2%) |
| Total (Overall) | 1,673 (47.4%) | 1,855 (52.6%) |
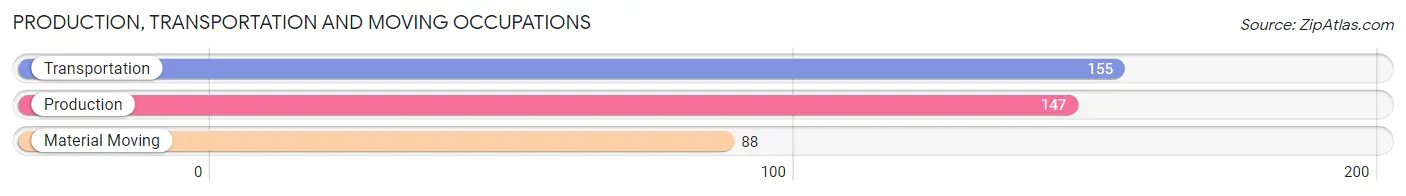
Production, Transportation and Moving Occupations
The most common Production, Transportation and Moving occupations in Ruidoso are Transportation (155 | 4.4%), Production (147 | 4.2%), and Material Moving (88 | 2.5%).
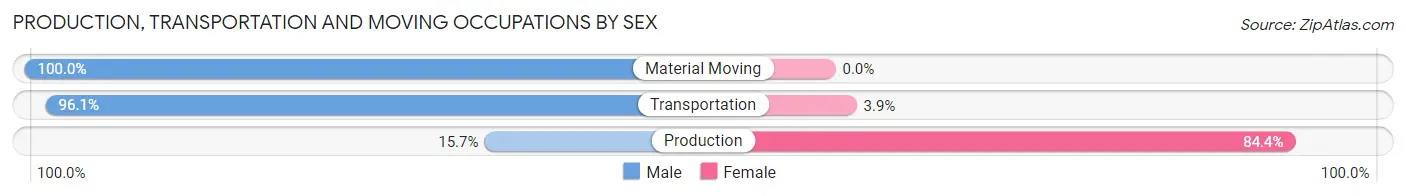
Production, Transportation and Moving Occupations by Sex
| Occupation | Male | Female |
| Production | 23 (15.7%) | 124 (84.4%) |
| Transportation | 149 (96.1%) | 6 (3.9%) |
| Material Moving | 88 (100.0%) | 0 (0.0%) |
| Total (Category) | 260 (66.7%) | 130 (33.3%) |
| Total (Overall) | 1,673 (47.4%) | 1,855 (52.6%) |
Employment Industries by Sex in Ruidoso
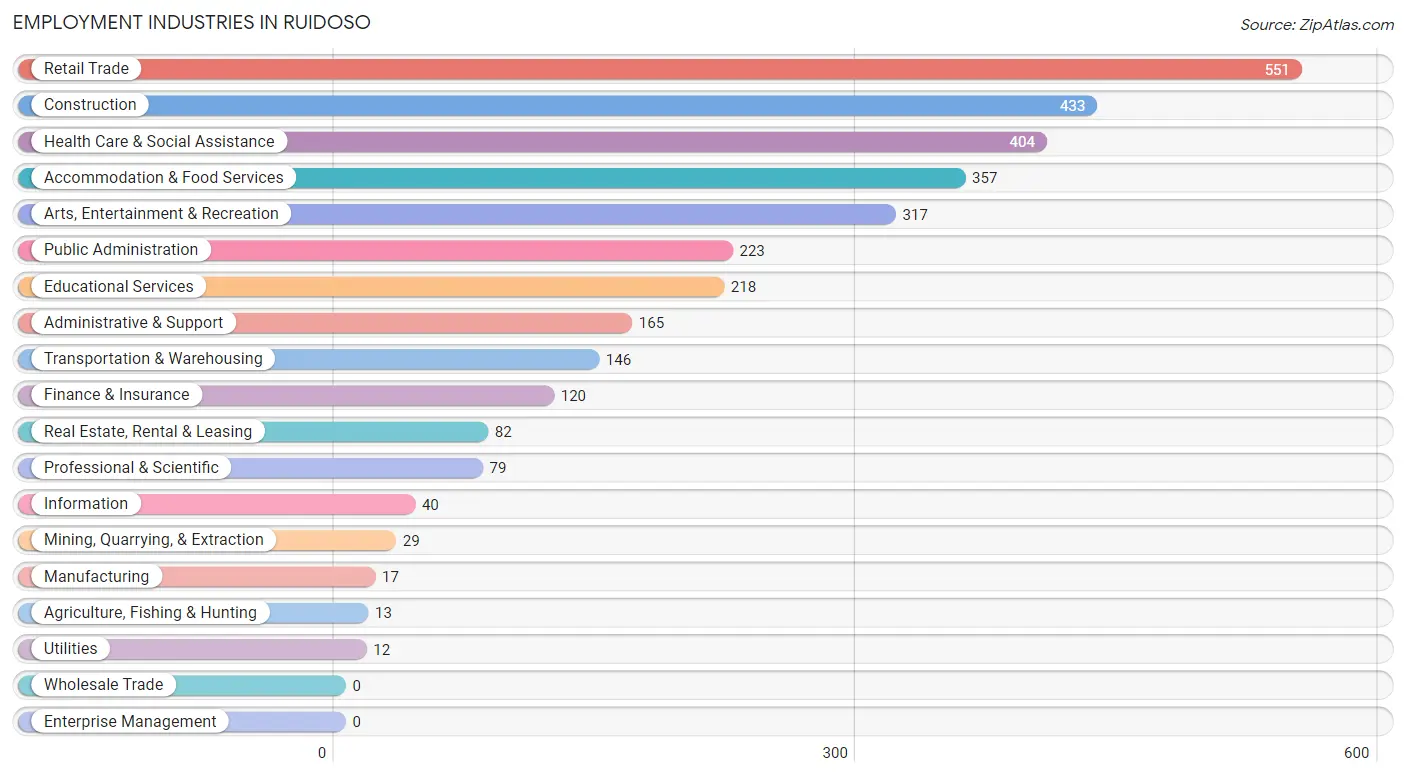
Employment Industries in Ruidoso
The major employment industries in Ruidoso include Retail Trade (551 | 15.6%), Construction (433 | 12.3%), Health Care & Social Assistance (404 | 11.5%), Accommodation & Food Services (357 | 10.1%), and Arts, Entertainment & Recreation (317 | 9.0%).
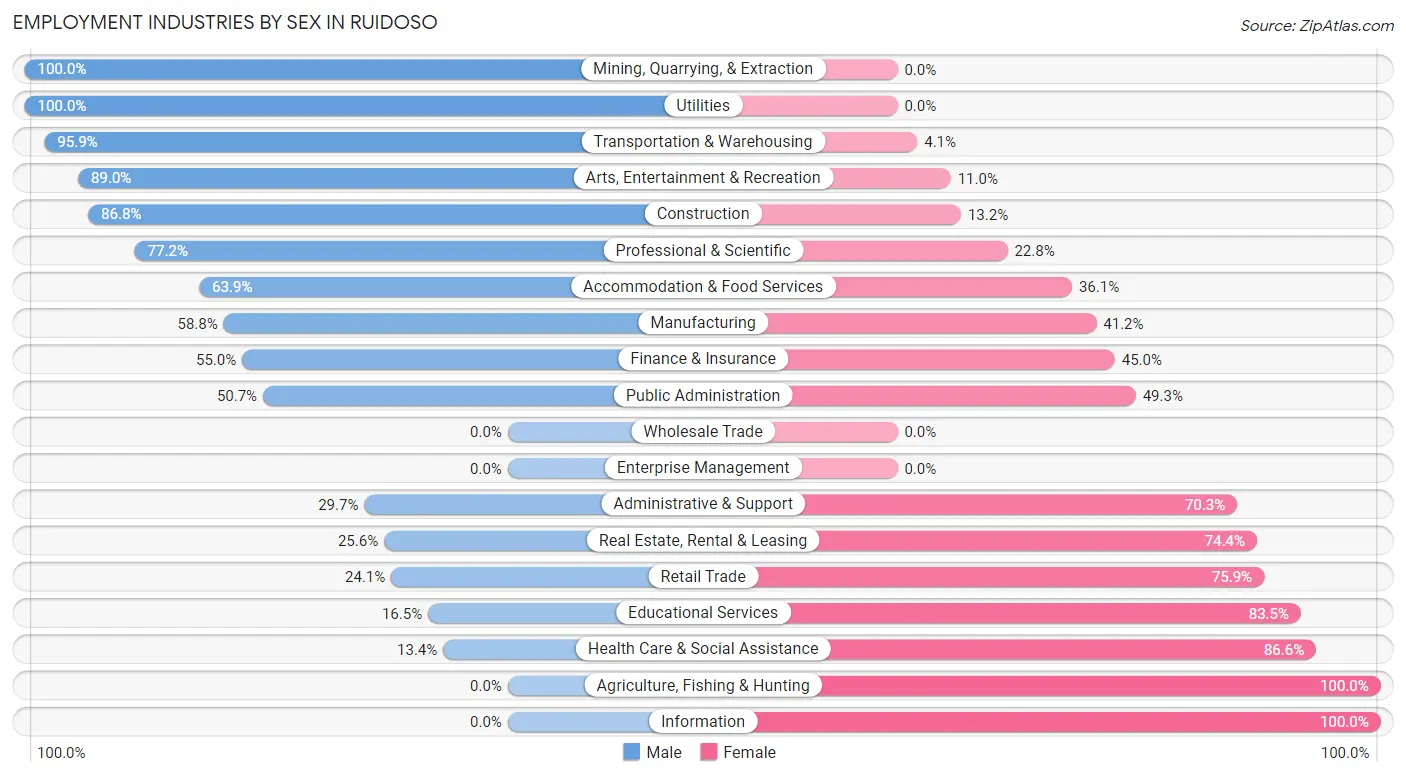
Employment Industries by Sex in Ruidoso
The Ruidoso industries that see more men than women are Mining, Quarrying, & Extraction (100.0%), Utilities (100.0%), and Transportation & Warehousing (95.9%), whereas the industries that tend to have a higher number of women are Agriculture, Fishing & Hunting (100.0%), Information (100.0%), and Health Care & Social Assistance (86.6%).
| Industry | Male | Female |
| Agriculture, Fishing & Hunting | 0 (0.0%) | 13 (100.0%) |
| Mining, Quarrying, & Extraction | 29 (100.0%) | 0 (0.0%) |
| Construction | 376 (86.8%) | 57 (13.2%) |
| Manufacturing | 10 (58.8%) | 7 (41.2%) |
| Wholesale Trade | 0 (0.0%) | 0 (0.0%) |
| Retail Trade | 133 (24.1%) | 418 (75.9%) |
| Transportation & Warehousing | 140 (95.9%) | 6 (4.1%) |
| Utilities | 12 (100.0%) | 0 (0.0%) |
| Information | 0 (0.0%) | 40 (100.0%) |
| Finance & Insurance | 66 (55.0%) | 54 (45.0%) |
| Real Estate, Rental & Leasing | 21 (25.6%) | 61 (74.4%) |
| Professional & Scientific | 61 (77.2%) | 18 (22.8%) |
| Enterprise Management | 0 (0.0%) | 0 (0.0%) |
| Administrative & Support | 49 (29.7%) | 116 (70.3%) |
| Educational Services | 36 (16.5%) | 182 (83.5%) |
| Health Care & Social Assistance | 54 (13.4%) | 350 (86.6%) |
| Arts, Entertainment & Recreation | 282 (89.0%) | 35 (11.0%) |
| Accommodation & Food Services | 228 (63.9%) | 129 (36.1%) |
| Public Administration | 113 (50.7%) | 110 (49.3%) |
| Total | 1,673 (47.4%) | 1,855 (52.6%) |
Education in Ruidoso
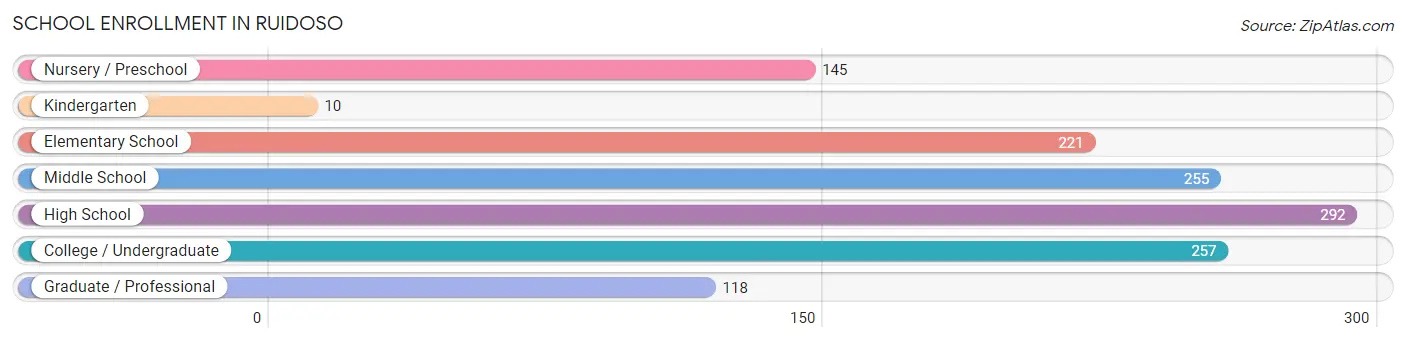
School Enrollment in Ruidoso
The most common levels of schooling among the 1,298 students in Ruidoso are high school (292 | 22.5%), college / undergraduate (257 | 19.8%), and middle school (255 | 19.7%).
| School Level | # Students | % Students |
| Nursery / Preschool | 145 | 11.2% |
| Kindergarten | 10 | 0.8% |
| Elementary School | 221 | 17.0% |
| Middle School | 255 | 19.7% |
| High School | 292 | 22.5% |
| College / Undergraduate | 257 | 19.8% |
| Graduate / Professional | 118 | 9.1% |
| Total | 1,298 | 100.0% |
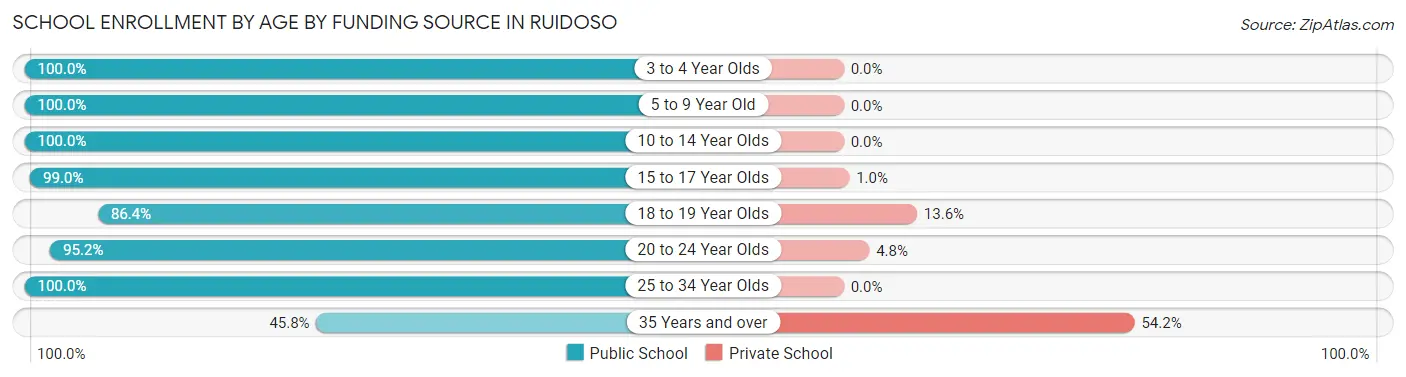
School Enrollment by Age by Funding Source in Ruidoso
Out of a total of 1,298 students who are enrolled in schools in Ruidoso, 87 (6.7%) attend a private institution, while the remaining 1,211 (93.3%) are enrolled in public schools. The age group of 35 years and over has the highest likelihood of being enrolled in private schools, with 78 (54.2% in the age bracket) enrolled. Conversely, the age group of 3 to 4 year olds has the lowest likelihood of being enrolled in a private school, with 103 (100.0% in the age bracket) attending a public institution.
| Age Bracket | Public School | Private School |
| 3 to 4 Year Olds | 103 (100.0%) | 0 (0.0%) |
| 5 to 9 Year Old | 208 (100.0%) | 0 (0.0%) |
| 10 to 14 Year Olds | 320 (100.0%) | 0 (0.0%) |
| 15 to 17 Year Olds | 289 (99.0%) | 3 (1.0%) |
| 18 to 19 Year Olds | 19 (86.4%) | 3 (13.6%) |
| 20 to 24 Year Olds | 60 (95.2%) | 3 (4.8%) |
| 25 to 34 Year Olds | 146 (100.0%) | 0 (0.0%) |
| 35 Years and over | 66 (45.8%) | 78 (54.2%) |
| Total | 1,211 (93.3%) | 87 (6.7%) |
Educational Attainment by Field of Study in Ruidoso
Business (456 | 33.1%), education (161 | 11.7%), science & technology (138 | 10.0%), arts & humanities (132 | 9.6%), and bio, nature & agricultural (100 | 7.3%) are the most common fields of study among 1,377 individuals in Ruidoso who have obtained a bachelor's degree or higher.
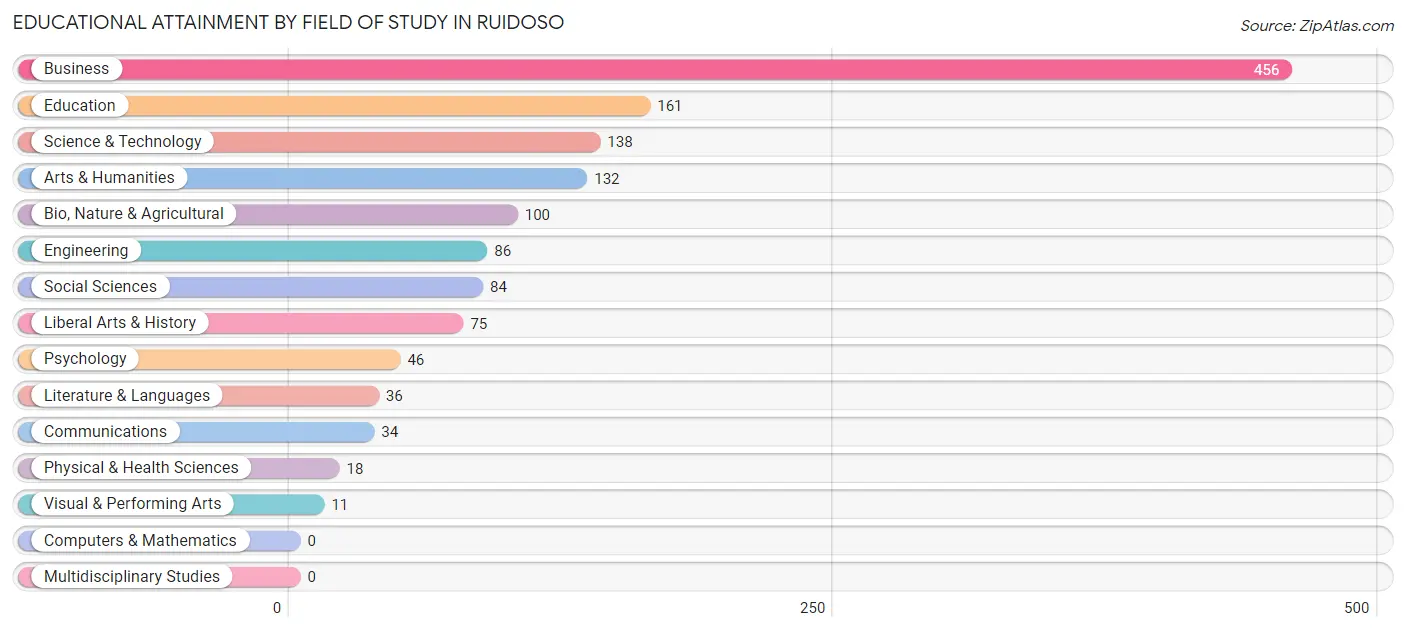
| Field of Study | # Graduates | % Graduates |
| Computers & Mathematics | 0 | 0.0% |
| Bio, Nature & Agricultural | 100 | 7.3% |
| Physical & Health Sciences | 18 | 1.3% |
| Psychology | 46 | 3.3% |
| Social Sciences | 84 | 6.1% |
| Engineering | 86 | 6.2% |
| Multidisciplinary Studies | 0 | 0.0% |
| Science & Technology | 138 | 10.0% |
| Business | 456 | 33.1% |
| Education | 161 | 11.7% |
| Literature & Languages | 36 | 2.6% |
| Liberal Arts & History | 75 | 5.4% |
| Visual & Performing Arts | 11 | 0.8% |
| Communications | 34 | 2.5% |
| Arts & Humanities | 132 | 9.6% |
| Total | 1,377 | 100.0% |
Transportation & Commute in Ruidoso
Vehicle Availability by Sex in Ruidoso
The most prevalent vehicle ownership categories in Ruidoso are males with 2 vehicles (529, accounting for 32.8%) and females with 2 vehicles (558, making up 28.9%).
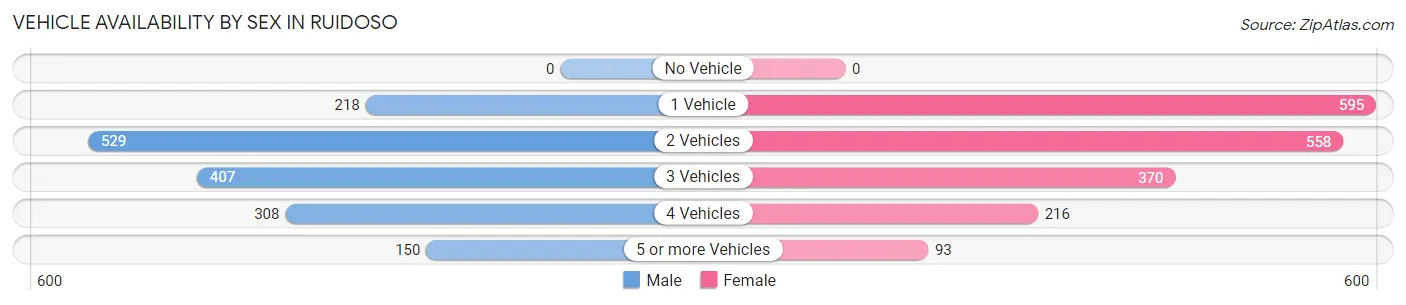
| Vehicles Available | Male | Female |
| No Vehicle | 0 (0.0%) | 0 (0.0%) |
| 1 Vehicle | 218 (13.5%) | 595 (32.5%) |
| 2 Vehicles | 529 (32.8%) | 558 (30.5%) |
| 3 Vehicles | 407 (25.3%) | 370 (20.2%) |
| 4 Vehicles | 308 (19.1%) | 216 (11.8%) |
| 5 or more Vehicles | 150 (9.3%) | 93 (5.1%) |
| Total | 1,612 (100.0%) | 1,832 (100.0%) |
Commute Time in Ruidoso
The most frequently occuring commute durations in Ruidoso are 5 to 9 minutes (1,069 commuters, 34.7%), 15 to 19 minutes (682 commuters, 22.1%), and 10 to 14 minutes (537 commuters, 17.4%).
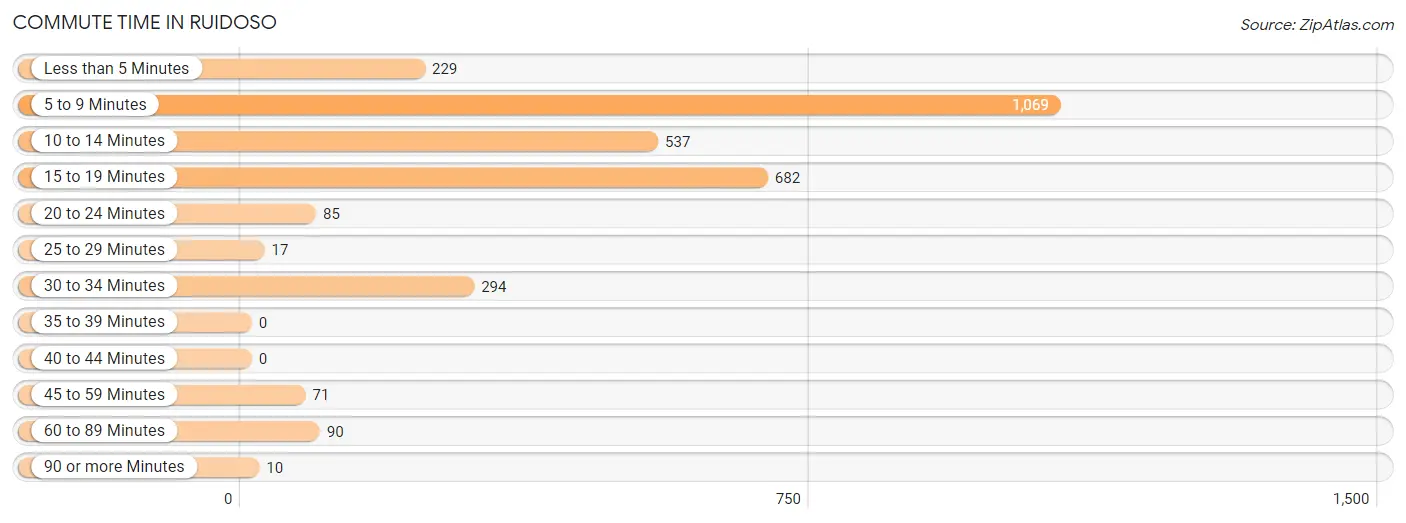
| Commute Time | # Commuters | % Commuters |
| Less than 5 Minutes | 229 | 7.4% |
| 5 to 9 Minutes | 1,069 | 34.7% |
| 10 to 14 Minutes | 537 | 17.4% |
| 15 to 19 Minutes | 682 | 22.1% |
| 20 to 24 Minutes | 85 | 2.8% |
| 25 to 29 Minutes | 17 | 0.5% |
| 30 to 34 Minutes | 294 | 9.5% |
| 35 to 39 Minutes | 0 | 0.0% |
| 40 to 44 Minutes | 0 | 0.0% |
| 45 to 59 Minutes | 71 | 2.3% |
| 60 to 89 Minutes | 90 | 2.9% |
| 90 or more Minutes | 10 | 0.3% |
Commute Time by Sex in Ruidoso
The most common commute times in Ruidoso are 5 to 9 minutes (376 commuters, 24.7%) for males and 5 to 9 minutes (693 commuters, 44.3%) for females.
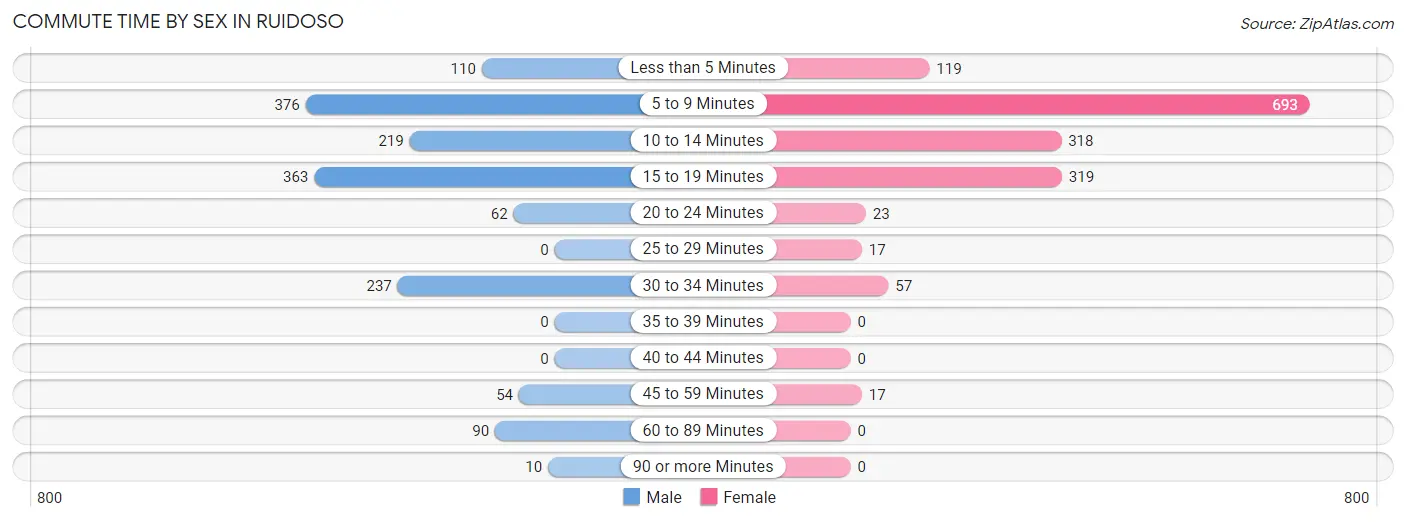
| Commute Time | Male | Female |
| Less than 5 Minutes | 110 (7.2%) | 119 (7.6%) |
| 5 to 9 Minutes | 376 (24.7%) | 693 (44.3%) |
| 10 to 14 Minutes | 219 (14.4%) | 318 (20.3%) |
| 15 to 19 Minutes | 363 (23.9%) | 319 (20.4%) |
| 20 to 24 Minutes | 62 (4.1%) | 23 (1.5%) |
| 25 to 29 Minutes | 0 (0.0%) | 17 (1.1%) |
| 30 to 34 Minutes | 237 (15.6%) | 57 (3.6%) |
| 35 to 39 Minutes | 0 (0.0%) | 0 (0.0%) |
| 40 to 44 Minutes | 0 (0.0%) | 0 (0.0%) |
| 45 to 59 Minutes | 54 (3.5%) | 17 (1.1%) |
| 60 to 89 Minutes | 90 (5.9%) | 0 (0.0%) |
| 90 or more Minutes | 10 (0.7%) | 0 (0.0%) |
Time of Departure to Work by Sex in Ruidoso
The most frequent times of departure to work in Ruidoso are 4:00 PM to 11:59 PM (226, 14.9%) for males and 8:00 AM to 8:29 AM (289, 18.5%) for females.
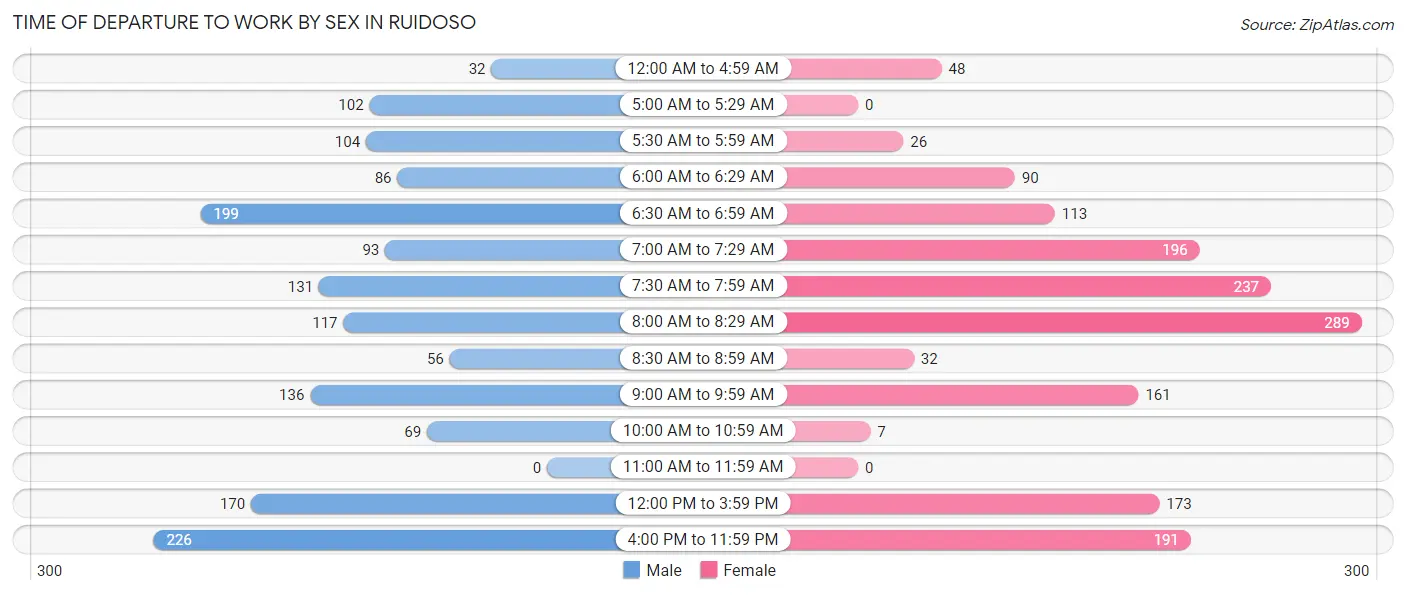
| Time of Departure | Male | Female |
| 12:00 AM to 4:59 AM | 32 (2.1%) | 48 (3.1%) |
| 5:00 AM to 5:29 AM | 102 (6.7%) | 0 (0.0%) |
| 5:30 AM to 5:59 AM | 104 (6.8%) | 26 (1.7%) |
| 6:00 AM to 6:29 AM | 86 (5.7%) | 90 (5.8%) |
| 6:30 AM to 6:59 AM | 199 (13.1%) | 113 (7.2%) |
| 7:00 AM to 7:29 AM | 93 (6.1%) | 196 (12.5%) |
| 7:30 AM to 7:59 AM | 131 (8.6%) | 237 (15.2%) |
| 8:00 AM to 8:29 AM | 117 (7.7%) | 289 (18.5%) |
| 8:30 AM to 8:59 AM | 56 (3.7%) | 32 (2.1%) |
| 9:00 AM to 9:59 AM | 136 (8.9%) | 161 (10.3%) |
| 10:00 AM to 10:59 AM | 69 (4.5%) | 7 (0.4%) |
| 11:00 AM to 11:59 AM | 0 (0.0%) | 0 (0.0%) |
| 12:00 PM to 3:59 PM | 170 (11.2%) | 173 (11.1%) |
| 4:00 PM to 11:59 PM | 226 (14.9%) | 191 (12.2%) |
| Total | 1,521 (100.0%) | 1,563 (100.0%) |
Housing Occupancy in Ruidoso
Occupancy by Ownership in Ruidoso
Of the total 3,593 dwellings in Ruidoso, owner-occupied units account for 2,305 (64.1%), while renter-occupied units make up 1,288 (35.8%).
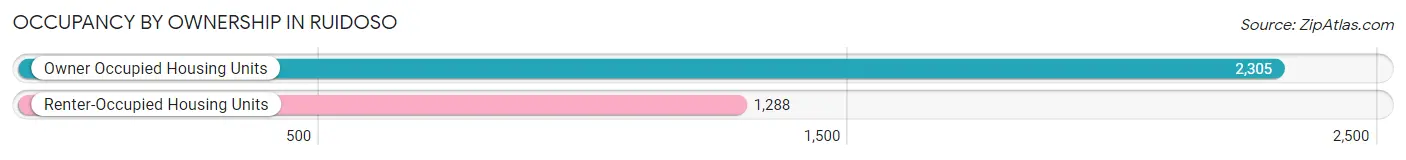
| Occupancy | # Housing Units | % Housing Units |
| Owner Occupied Housing Units | 2,305 | 64.1% |
| Renter-Occupied Housing Units | 1,288 | 35.8% |
| Total Occupied Housing Units | 3,593 | 100.0% |
Occupancy by Household Size in Ruidoso
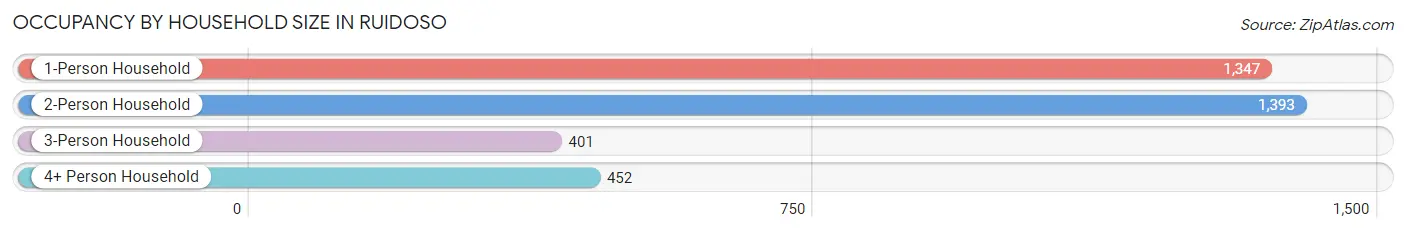
| Household Size | # Housing Units | % Housing Units |
| 1-Person Household | 1,347 | 37.5% |
| 2-Person Household | 1,393 | 38.8% |
| 3-Person Household | 401 | 11.2% |
| 4+ Person Household | 452 | 12.6% |
| Total Housing Units | 3,593 | 100.0% |
Occupancy by Ownership by Household Size in Ruidoso
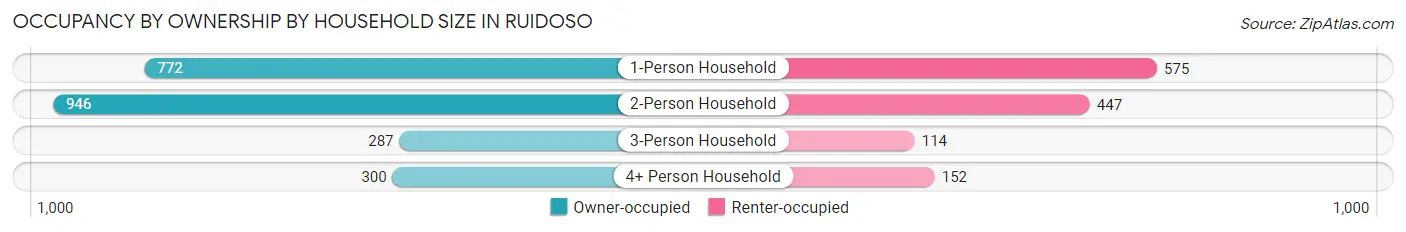
| Household Size | Owner-occupied | Renter-occupied |
| 1-Person Household | 772 (57.3%) | 575 (42.7%) |
| 2-Person Household | 946 (67.9%) | 447 (32.1%) |
| 3-Person Household | 287 (71.6%) | 114 (28.4%) |
| 4+ Person Household | 300 (66.4%) | 152 (33.6%) |
| Total Housing Units | 2,305 (64.1%) | 1,288 (35.8%) |
Occupancy by Educational Attainment in Ruidoso
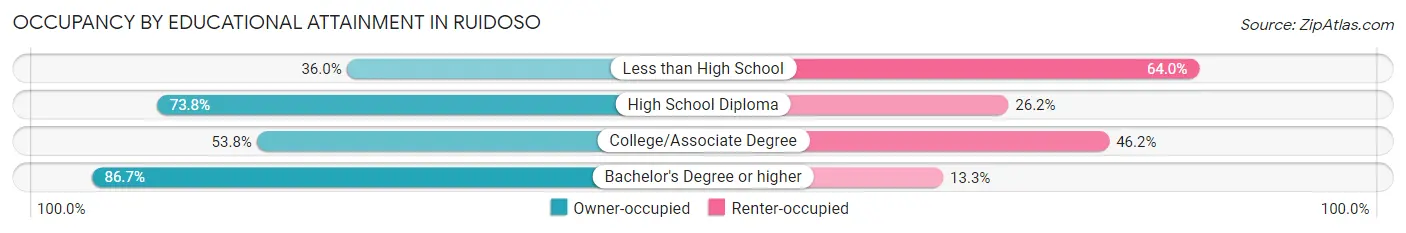
| Household Size | Owner-occupied | Renter-occupied |
| Less than High School | 127 (36.0%) | 226 (64.0%) |
| High School Diploma | 608 (73.8%) | 216 (26.2%) |
| College/Associate Degree | 858 (53.8%) | 737 (46.2%) |
| Bachelor's Degree or higher | 712 (86.7%) | 109 (13.3%) |
Occupancy by Age of Householder in Ruidoso
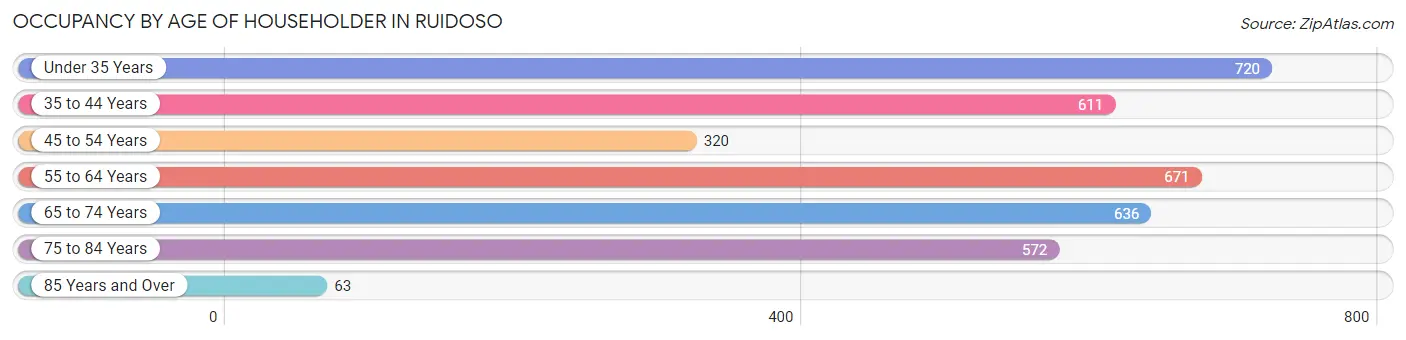
| Age Bracket | # Households | % Households |
| Under 35 Years | 720 | 20.0% |
| 35 to 44 Years | 611 | 17.0% |
| 45 to 54 Years | 320 | 8.9% |
| 55 to 64 Years | 671 | 18.7% |
| 65 to 74 Years | 636 | 17.7% |
| 75 to 84 Years | 572 | 15.9% |
| 85 Years and Over | 63 | 1.8% |
| Total | 3,593 | 100.0% |
Housing Finances in Ruidoso
Median Income by Occupancy in Ruidoso
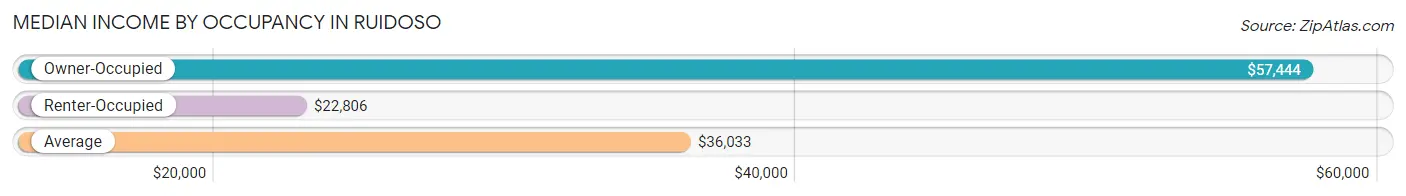
| Occupancy Type | # Households | Median Income |
| Owner-Occupied | 2,305 (64.1%) | $57,444 |
| Renter-Occupied | 1,288 (35.8%) | $22,806 |
| Average | 3,593 (100.0%) | $36,033 |
Occupancy by Householder Income Bracket in Ruidoso
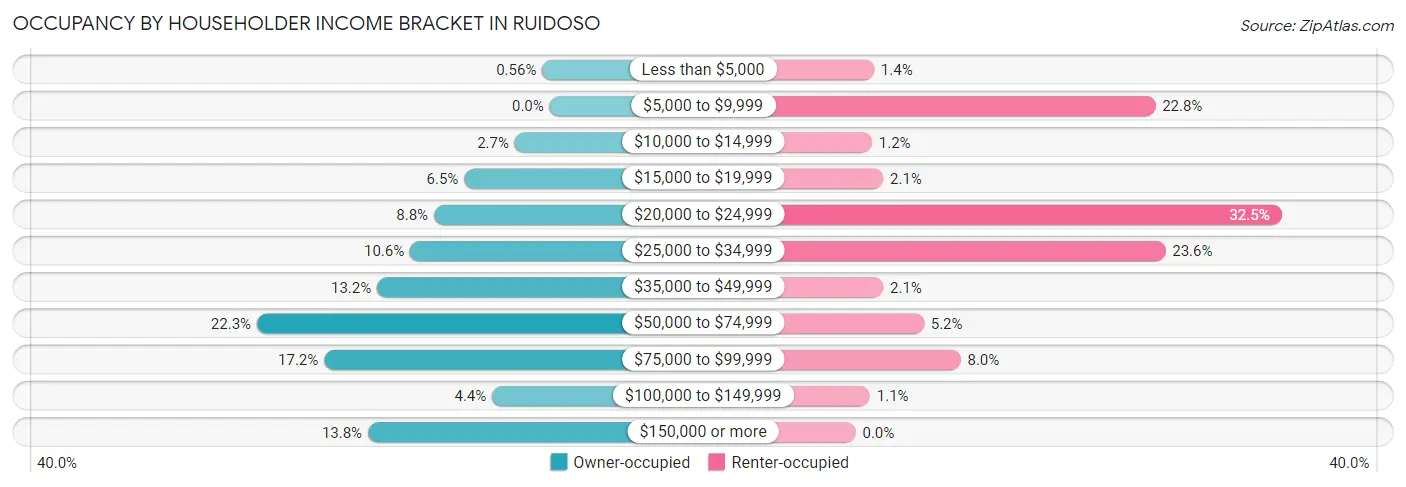
| Income Bracket | Owner-occupied | Renter-occupied |
| Less than $5,000 | 13 (0.6%) | 18 (1.4%) |
| $5,000 to $9,999 | 0 (0.0%) | 294 (22.8%) |
| $10,000 to $14,999 | 61 (2.6%) | 16 (1.2%) |
| $15,000 to $19,999 | 150 (6.5%) | 27 (2.1%) |
| $20,000 to $24,999 | 203 (8.8%) | 418 (32.5%) |
| $25,000 to $34,999 | 245 (10.6%) | 304 (23.6%) |
| $35,000 to $49,999 | 303 (13.2%) | 27 (2.1%) |
| $50,000 to $74,999 | 514 (22.3%) | 67 (5.2%) |
| $75,000 to $99,999 | 396 (17.2%) | 103 (8.0%) |
| $100,000 to $149,999 | 101 (4.4%) | 14 (1.1%) |
| $150,000 or more | 319 (13.8%) | 0 (0.0%) |
| Total | 2,305 (100.0%) | 1,288 (100.0%) |
Monthly Housing Cost Tiers in Ruidoso
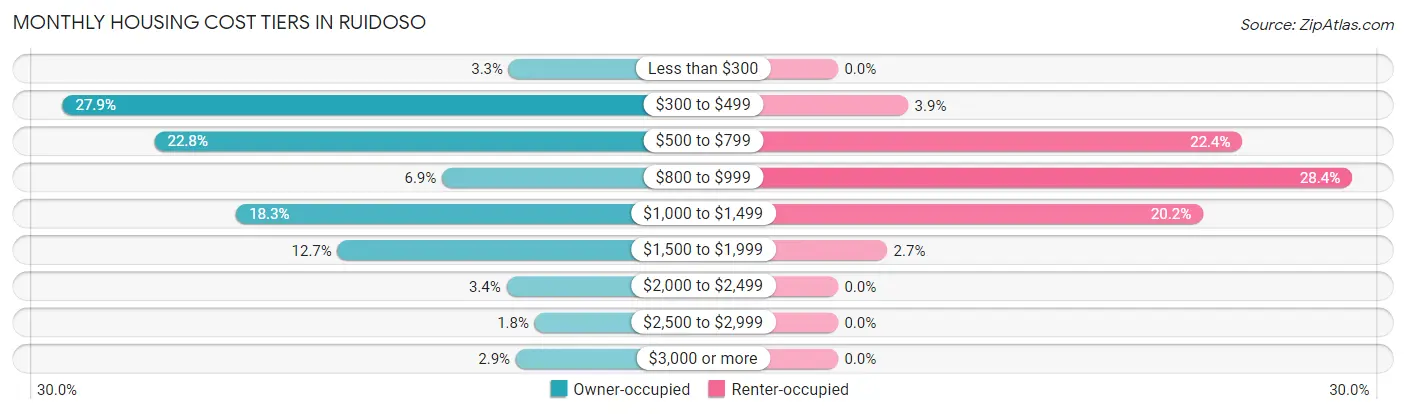
| Monthly Cost | Owner-occupied | Renter-occupied |
| Less than $300 | 75 (3.3%) | 0 (0.0%) |
| $300 to $499 | 643 (27.9%) | 50 (3.9%) |
| $500 to $799 | 526 (22.8%) | 288 (22.4%) |
| $800 to $999 | 160 (6.9%) | 366 (28.4%) |
| $1,000 to $1,499 | 422 (18.3%) | 260 (20.2%) |
| $1,500 to $1,999 | 293 (12.7%) | 35 (2.7%) |
| $2,000 to $2,499 | 78 (3.4%) | 0 (0.0%) |
| $2,500 to $2,999 | 42 (1.8%) | 0 (0.0%) |
| $3,000 or more | 66 (2.9%) | 0 (0.0%) |
| Total | 2,305 (100.0%) | 1,288 (100.0%) |
Physical Housing Characteristics in Ruidoso
Housing Structures in Ruidoso
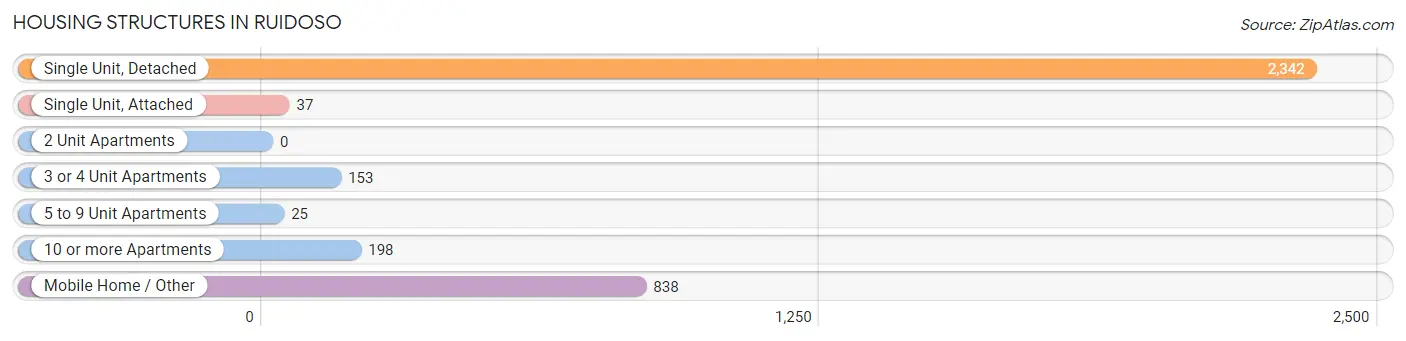
| Structure Type | # Housing Units | % Housing Units |
| Single Unit, Detached | 2,342 | 65.2% |
| Single Unit, Attached | 37 | 1.0% |
| 2 Unit Apartments | 0 | 0.0% |
| 3 or 4 Unit Apartments | 153 | 4.3% |
| 5 to 9 Unit Apartments | 25 | 0.7% |
| 10 or more Apartments | 198 | 5.5% |
| Mobile Home / Other | 838 | 23.3% |
| Total | 3,593 | 100.0% |
Housing Structures by Occupancy in Ruidoso
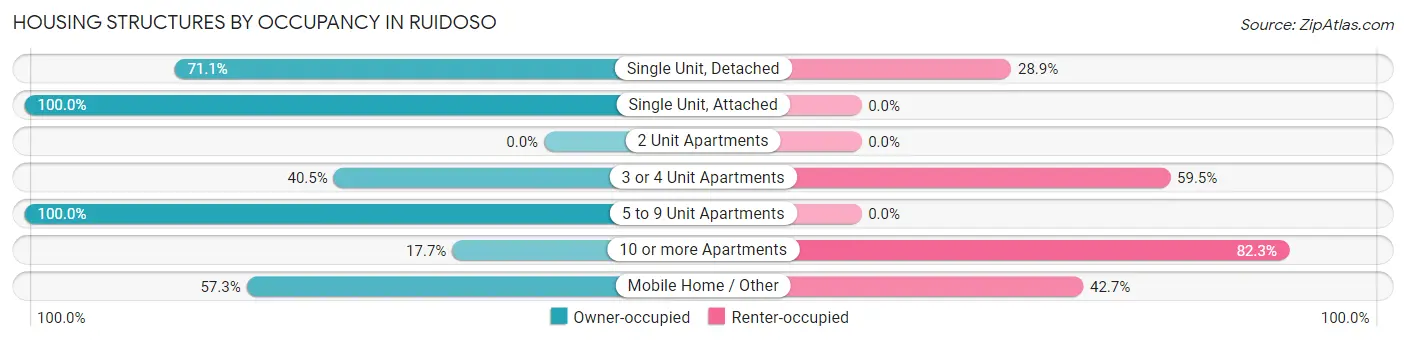
| Structure Type | Owner-occupied | Renter-occupied |
| Single Unit, Detached | 1,666 (71.1%) | 676 (28.9%) |
| Single Unit, Attached | 37 (100.0%) | 0 (0.0%) |
| 2 Unit Apartments | 0 (0.0%) | 0 (0.0%) |
| 3 or 4 Unit Apartments | 62 (40.5%) | 91 (59.5%) |
| 5 to 9 Unit Apartments | 25 (100.0%) | 0 (0.0%) |
| 10 or more Apartments | 35 (17.7%) | 163 (82.3%) |
| Mobile Home / Other | 480 (57.3%) | 358 (42.7%) |
| Total | 2,305 (64.1%) | 1,288 (35.8%) |
Housing Structures by Number of Rooms in Ruidoso
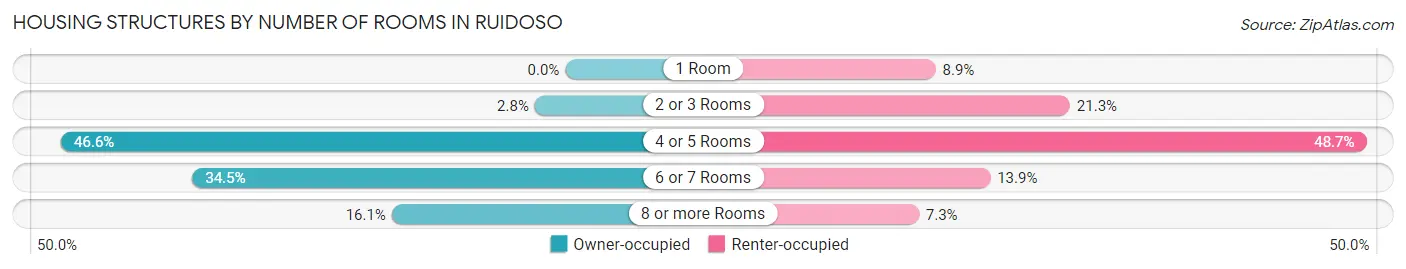
| Number of Rooms | Owner-occupied | Renter-occupied |
| 1 Room | 0 (0.0%) | 114 (8.8%) |
| 2 or 3 Rooms | 65 (2.8%) | 274 (21.3%) |
| 4 or 5 Rooms | 1,075 (46.6%) | 627 (48.7%) |
| 6 or 7 Rooms | 795 (34.5%) | 179 (13.9%) |
| 8 or more Rooms | 370 (16.1%) | 94 (7.3%) |
| Total | 2,305 (100.0%) | 1,288 (100.0%) |
Housing Structure by Heating Type in Ruidoso
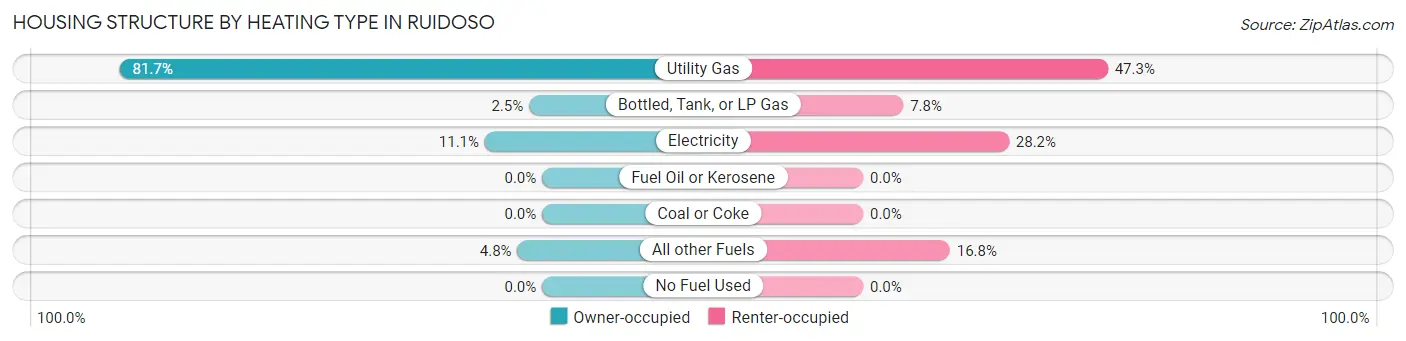
| Heating Type | Owner-occupied | Renter-occupied |
| Utility Gas | 1,882 (81.7%) | 609 (47.3%) |
| Bottled, Tank, or LP Gas | 58 (2.5%) | 100 (7.8%) |
| Electricity | 255 (11.1%) | 363 (28.2%) |
| Fuel Oil or Kerosene | 0 (0.0%) | 0 (0.0%) |
| Coal or Coke | 0 (0.0%) | 0 (0.0%) |
| All other Fuels | 110 (4.8%) | 216 (16.8%) |
| No Fuel Used | 0 (0.0%) | 0 (0.0%) |
| Total | 2,305 (100.0%) | 1,288 (100.0%) |
Household Vehicle Usage in Ruidoso
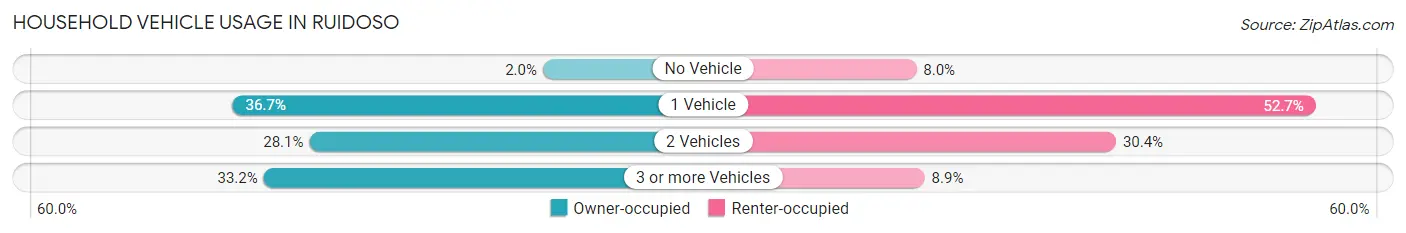
| Vehicles per Household | Owner-occupied | Renter-occupied |
| No Vehicle | 45 (1.9%) | 103 (8.0%) |
| 1 Vehicle | 846 (36.7%) | 679 (52.7%) |
| 2 Vehicles | 648 (28.1%) | 391 (30.4%) |
| 3 or more Vehicles | 766 (33.2%) | 115 (8.9%) |
| Total | 2,305 (100.0%) | 1,288 (100.0%) |
Real Estate & Mortgages in Ruidoso
Real Estate and Mortgage Overview in Ruidoso
| Characteristic | Without Mortgage | With Mortgage |
| Housing Units | 1,384 | 921 |
| Median Property Value | $231,800 | $217,900 |
| Median Household Income | $50,783 | $122 |
| Monthly Housing Costs | $487 | $0 |
| Real Estate Taxes | $1,298 | $0 |
Property Value by Mortgage Status in Ruidoso
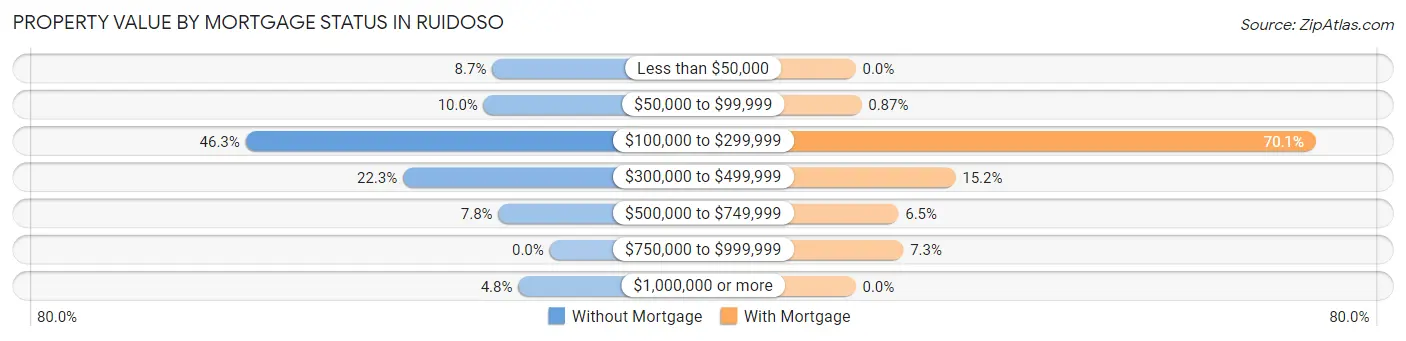
| Property Value | Without Mortgage | With Mortgage |
| Less than $50,000 | 121 (8.7%) | 0 (0.0%) |
| $50,000 to $99,999 | 139 (10.0%) | 8 (0.9%) |
| $100,000 to $299,999 | 641 (46.3%) | 646 (70.1%) |
| $300,000 to $499,999 | 309 (22.3%) | 140 (15.2%) |
| $500,000 to $749,999 | 108 (7.8%) | 60 (6.5%) |
| $750,000 to $999,999 | 0 (0.0%) | 67 (7.3%) |
| $1,000,000 or more | 66 (4.8%) | 0 (0.0%) |
| Total | 1,384 (100.0%) | 921 (100.0%) |
Household Income by Mortgage Status in Ruidoso
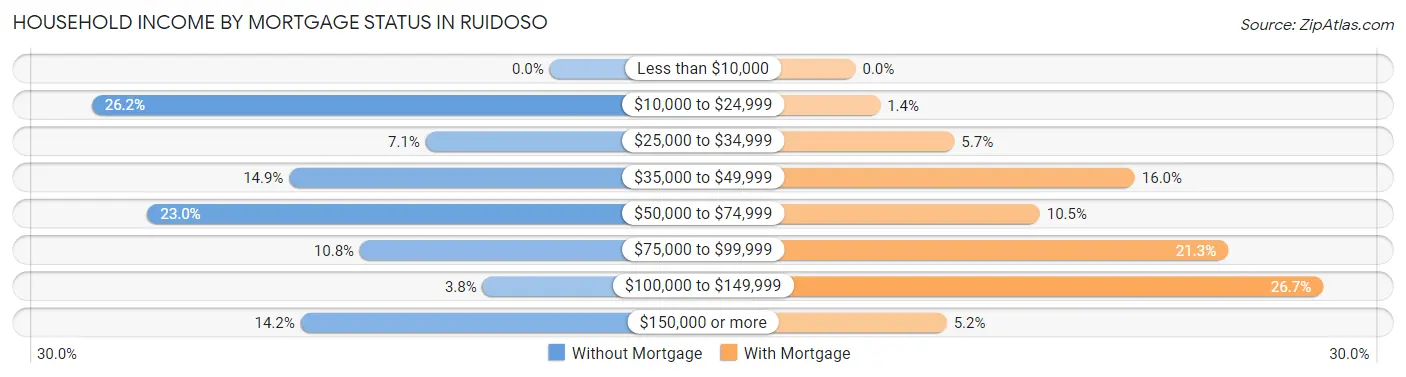
| Household Income | Without Mortgage | With Mortgage |
| Less than $10,000 | 0 (0.0%) | 0 (0.0%) |
| $10,000 to $24,999 | 362 (26.2%) | 13 (1.4%) |
| $25,000 to $34,999 | 98 (7.1%) | 52 (5.7%) |
| $35,000 to $49,999 | 206 (14.9%) | 147 (16.0%) |
| $50,000 to $74,999 | 318 (23.0%) | 97 (10.5%) |
| $75,000 to $99,999 | 150 (10.8%) | 196 (21.3%) |
| $100,000 to $149,999 | 53 (3.8%) | 246 (26.7%) |
| $150,000 or more | 197 (14.2%) | 48 (5.2%) |
| Total | 1,384 (100.0%) | 921 (100.0%) |
Property Value to Household Income Ratio in Ruidoso
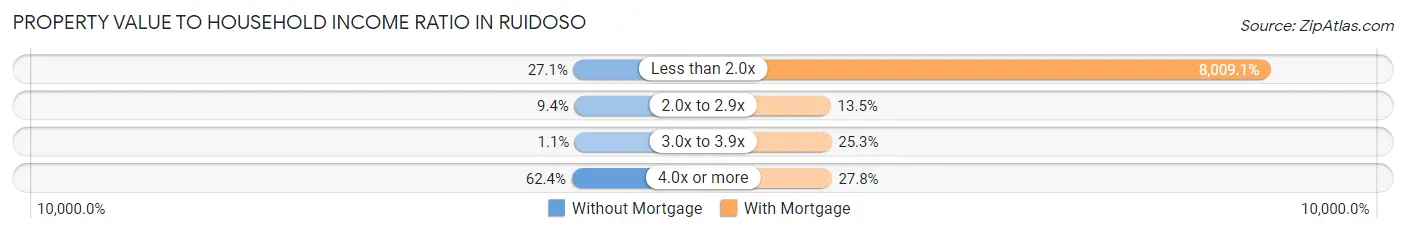
| Value-to-Income Ratio | Without Mortgage | With Mortgage |
| Less than 2.0x | 375 (27.1%) | 73,764 (8,009.1%) |
| 2.0x to 2.9x | 130 (9.4%) | 124 (13.5%) |
| 3.0x to 3.9x | 15 (1.1%) | 233 (25.3%) |
| 4.0x or more | 864 (62.4%) | 256 (27.8%) |
| Total | 1,384 (100.0%) | 921 (100.0%) |
Real Estate Taxes by Mortgage Status in Ruidoso
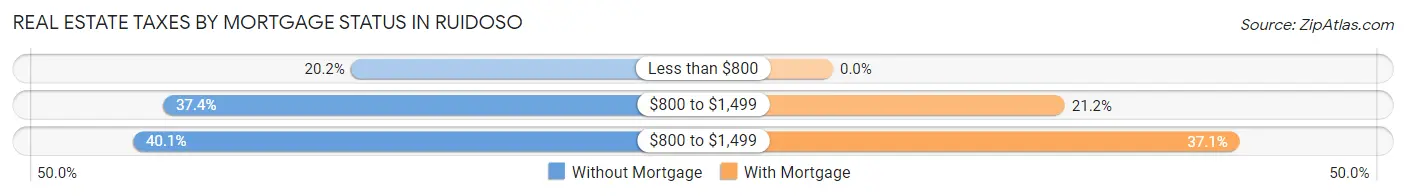
| Property Taxes | Without Mortgage | With Mortgage |
| Less than $800 | 280 (20.2%) | 0 (0.0%) |
| $800 to $1,499 | 517 (37.4%) | 195 (21.2%) |
| $800 to $1,499 | 555 (40.1%) | 342 (37.1%) |
| Total | 1,384 (100.0%) | 921 (100.0%) |
Health & Disability in Ruidoso
Health Insurance Coverage by Age in Ruidoso
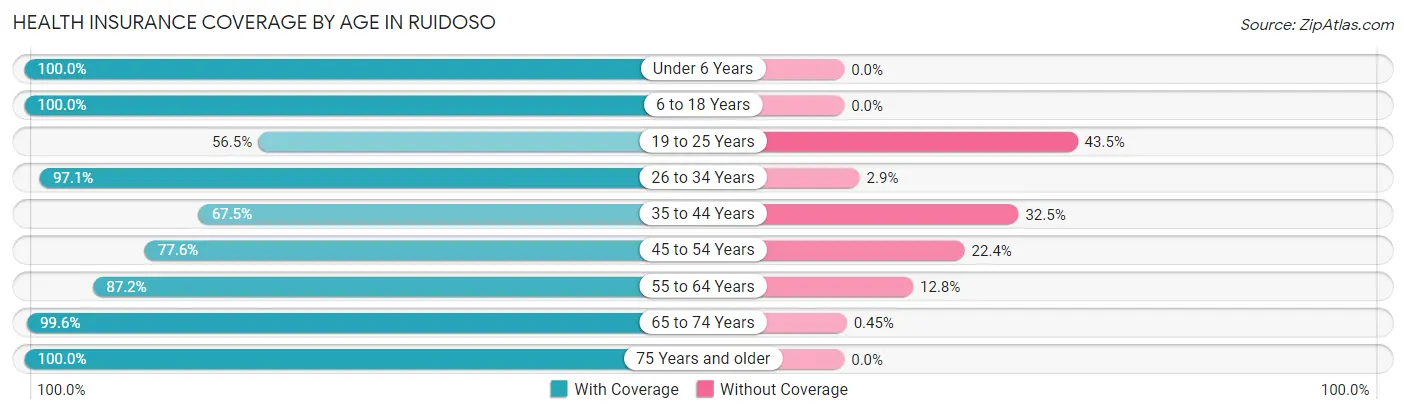
| Age Bracket | With Coverage | Without Coverage |
| Under 6 Years | 640 (100.0%) | 0 (0.0%) |
| 6 to 18 Years | 978 (100.0%) | 0 (0.0%) |
| 19 to 25 Years | 401 (56.5%) | 309 (43.5%) |
| 26 to 34 Years | 676 (97.1%) | 20 (2.9%) |
| 35 to 44 Years | 634 (67.5%) | 305 (32.5%) |
| 45 to 54 Years | 484 (77.6%) | 140 (22.4%) |
| 55 to 64 Years | 924 (87.2%) | 136 (12.8%) |
| 65 to 74 Years | 1,115 (99.6%) | 5 (0.4%) |
| 75 Years and older | 918 (100.0%) | 0 (0.0%) |
| Total | 6,770 (88.1%) | 915 (11.9%) |
Health Insurance Coverage by Citizenship Status in Ruidoso
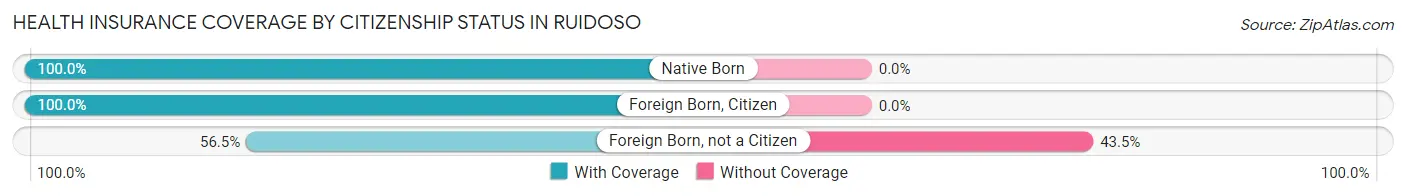
| Citizenship Status | With Coverage | Without Coverage |
| Native Born | 640 (100.0%) | 0 (0.0%) |
| Foreign Born, Citizen | 978 (100.0%) | 0 (0.0%) |
| Foreign Born, not a Citizen | 401 (56.5%) | 309 (43.5%) |
Health Insurance Coverage by Household Income in Ruidoso
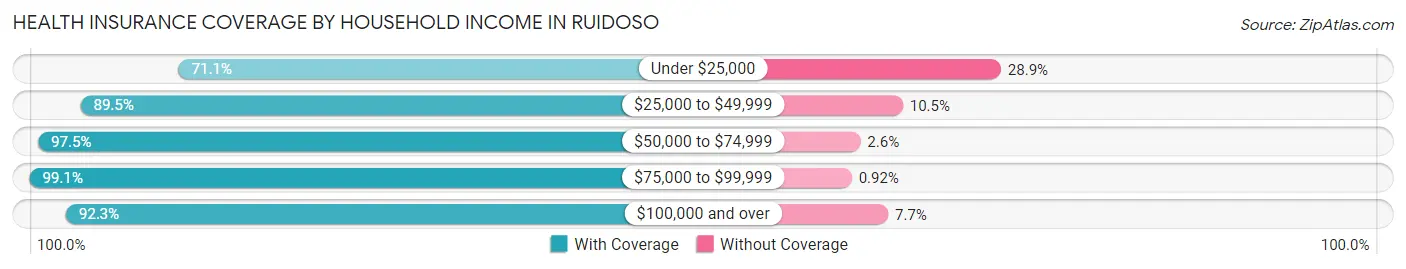
| Household Income | With Coverage | Without Coverage |
| Under $25,000 | 1,473 (71.1%) | 598 (28.9%) |
| $25,000 to $49,999 | 1,374 (89.5%) | 161 (10.5%) |
| $50,000 to $74,999 | 1,530 (97.5%) | 40 (2.5%) |
| $75,000 to $99,999 | 1,293 (99.1%) | 12 (0.9%) |
| $100,000 and over | 1,085 (92.3%) | 91 (7.7%) |
Public vs Private Health Insurance Coverage by Age in Ruidoso
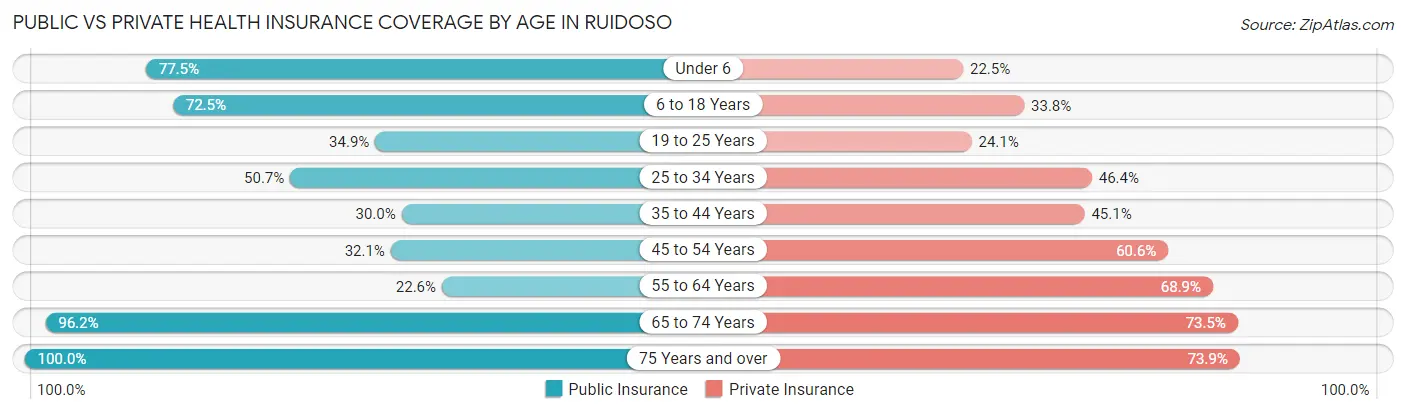
| Age Bracket | Public Insurance | Private Insurance |
| Under 6 | 496 (77.5%) | 144 (22.5%) |
| 6 to 18 Years | 709 (72.5%) | 331 (33.8%) |
| 19 to 25 Years | 248 (34.9%) | 171 (24.1%) |
| 25 to 34 Years | 353 (50.7%) | 323 (46.4%) |
| 35 to 44 Years | 282 (30.0%) | 423 (45.1%) |
| 45 to 54 Years | 200 (32.1%) | 378 (60.6%) |
| 55 to 64 Years | 239 (22.6%) | 730 (68.9%) |
| 65 to 74 Years | 1,077 (96.2%) | 823 (73.5%) |
| 75 Years and over | 918 (100.0%) | 678 (73.9%) |
| Total | 4,522 (58.8%) | 4,001 (52.1%) |
Disability Status by Sex by Age in Ruidoso
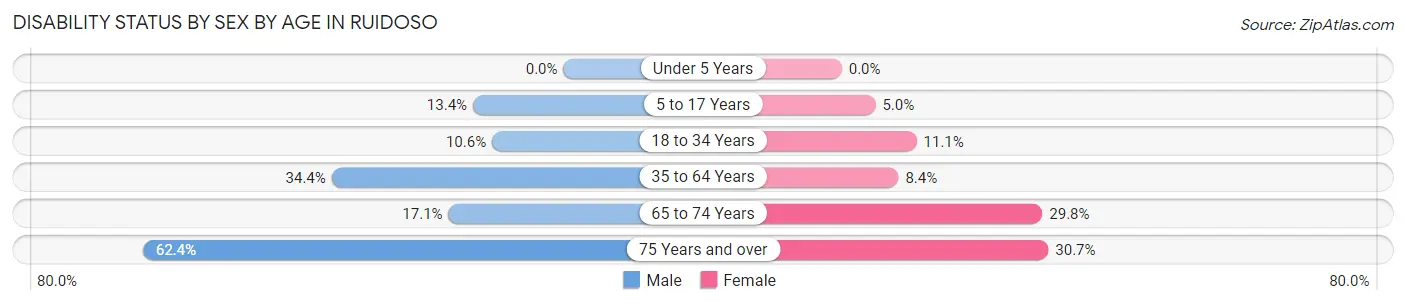
| Age Bracket | Male | Female |
| Under 5 Years | 0 (0.0%) | 0 (0.0%) |
| 5 to 17 Years | 85 (13.4%) | 20 (5.0%) |
| 18 to 34 Years | 80 (10.6%) | 81 (11.1%) |
| 35 to 64 Years | 416 (34.4%) | 119 (8.4%) |
| 65 to 74 Years | 84 (17.1%) | 187 (29.8%) |
| 75 Years and over | 276 (62.4%) | 146 (30.7%) |
Disability Class by Sex by Age in Ruidoso
Disability Class: Hearing Difficulty
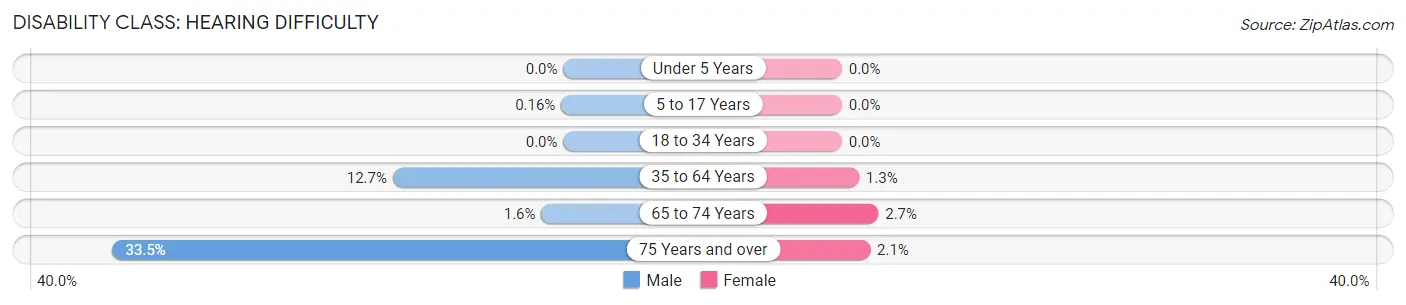
| Age Bracket | Male | Female |
| Under 5 Years | 0 (0.0%) | 0 (0.0%) |
| 5 to 17 Years | 1 (0.2%) | 0 (0.0%) |
| 18 to 34 Years | 0 (0.0%) | 0 (0.0%) |
| 35 to 64 Years | 153 (12.7%) | 18 (1.3%) |
| 65 to 74 Years | 8 (1.6%) | 17 (2.7%) |
| 75 Years and over | 148 (33.5%) | 10 (2.1%) |
Disability Class: Vision Difficulty
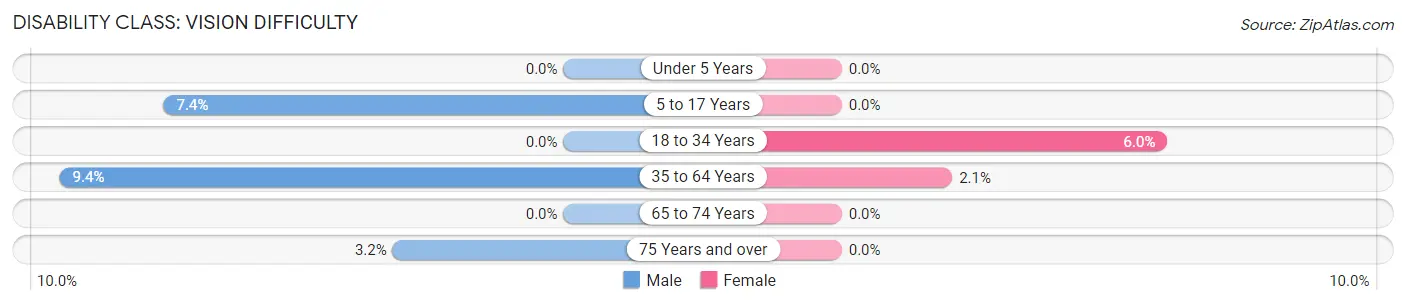
| Age Bracket | Male | Female |
| Under 5 Years | 0 (0.0%) | 0 (0.0%) |
| 5 to 17 Years | 47 (7.4%) | 0 (0.0%) |
| 18 to 34 Years | 0 (0.0%) | 44 (6.0%) |
| 35 to 64 Years | 113 (9.3%) | 29 (2.1%) |
| 65 to 74 Years | 0 (0.0%) | 0 (0.0%) |
| 75 Years and over | 14 (3.2%) | 0 (0.0%) |
Disability Class: Cognitive Difficulty
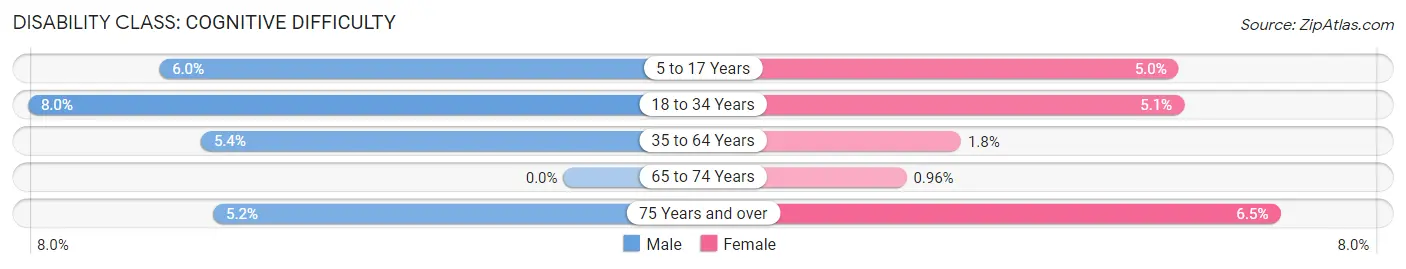
| Age Bracket | Male | Female |
| 5 to 17 Years | 38 (6.0%) | 20 (5.0%) |
| 18 to 34 Years | 60 (8.0%) | 37 (5.1%) |
| 35 to 64 Years | 65 (5.4%) | 25 (1.8%) |
| 65 to 74 Years | 0 (0.0%) | 6 (1.0%) |
| 75 Years and over | 23 (5.2%) | 31 (6.5%) |
Disability Class: Ambulatory Difficulty
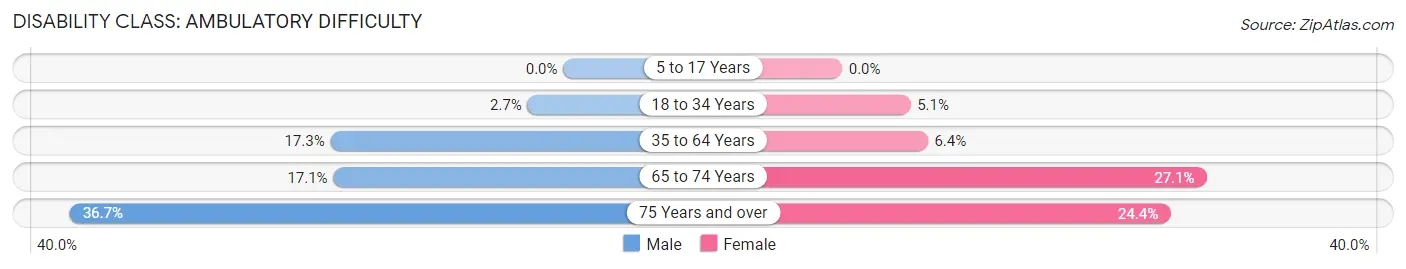
| Age Bracket | Male | Female |
| 5 to 17 Years | 0 (0.0%) | 0 (0.0%) |
| 18 to 34 Years | 20 (2.6%) | 37 (5.1%) |
| 35 to 64 Years | 209 (17.3%) | 90 (6.4%) |
| 65 to 74 Years | 84 (17.1%) | 170 (27.1%) |
| 75 Years and over | 162 (36.6%) | 116 (24.4%) |
Disability Class: Self-Care Difficulty
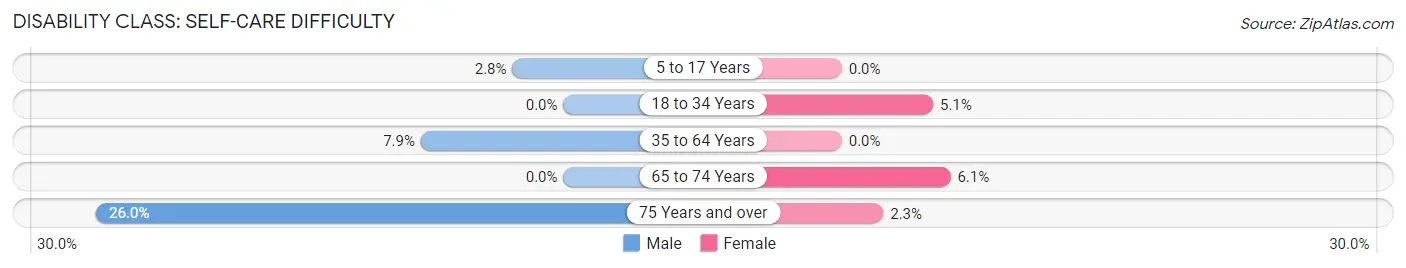
| Age Bracket | Male | Female |
| 5 to 17 Years | 18 (2.8%) | 0 (0.0%) |
| 18 to 34 Years | 0 (0.0%) | 37 (5.1%) |
| 35 to 64 Years | 96 (7.9%) | 0 (0.0%) |
| 65 to 74 Years | 0 (0.0%) | 38 (6.0%) |
| 75 Years and over | 115 (26.0%) | 11 (2.3%) |
Technology Access in Ruidoso
Computing Device Access in Ruidoso
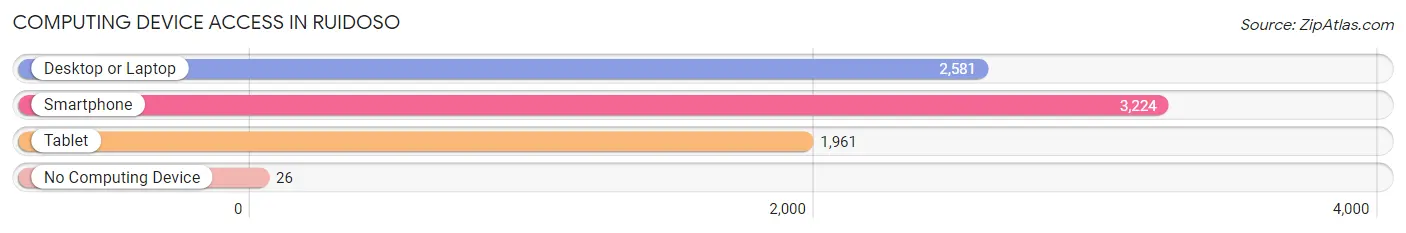
| Device Type | # Households | % Households |
| Desktop or Laptop | 2,581 | 71.8% |
| Smartphone | 3,224 | 89.7% |
| Tablet | 1,961 | 54.6% |
| No Computing Device | 26 | 0.7% |
| Total | 3,593 | 100.0% |
Internet Access in Ruidoso
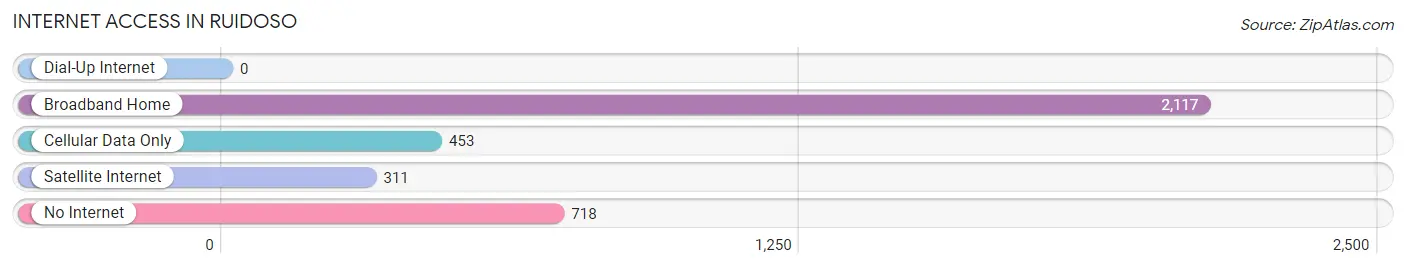
| Internet Type | # Households | % Households |
| Dial-Up Internet | 0 | 0.0% |
| Broadband Home | 2,117 | 58.9% |
| Cellular Data Only | 453 | 12.6% |
| Satellite Internet | 311 | 8.7% |
| No Internet | 718 | 20.0% |
| Total | 3,593 | 100.0% |
Ruidoso Summary
Ruidoso, New Mexico is a small mountain village located in the Sierra Blanca mountain range of the Rocky Mountains. It is situated in Lincoln County, in the south-central part of the state. The village is located at an elevation of 6,920 feet, and is surrounded by the Lincoln National Forest. The population of Ruidoso was 8,029 at the 2010 census, making it the third-largest community in Lincoln County.
Ruidoso is a popular tourist destination, known for its skiing, golfing, and other outdoor activities. The village is also home to the Ruidoso Downs Race Track and Casino, which hosts the All American Futurity, the world's richest quarter horse race.
History
The area that is now Ruidoso was originally inhabited by the Mescalero Apache. The first non-Native American settlers arrived in the area in the late 1800s, and the village was officially founded in 1891. The village was named after the nearby Rio Ruidoso, which means "noisy river" in Spanish.
In the early 1900s, the village began to grow as a tourist destination. The first ski resort in the area opened in 1933, and the Ruidoso Downs Race Track and Casino opened in 1955.
Geography
Ruidoso is located in the Sierra Blanca mountain range of the Rocky Mountains. The village is situated at an elevation of 6,920 feet, and is surrounded by the Lincoln National Forest. The village is located approximately 70 miles north of El Paso, Texas, and approximately 130 miles south of Albuquerque, New Mexico.
The climate in Ruidoso is semi-arid, with hot summers and cold winters. The average annual temperature is 54°F, and the average annual precipitation is 16.5 inches.
Economy
The economy of Ruidoso is largely based on tourism. The village is a popular destination for skiing, golfing, and other outdoor activities. The Ruidoso Downs Race Track and Casino is also a major source of revenue for the village.
In addition to tourism, the village is also home to several manufacturing and retail businesses. The village is also home to the Ruidoso Municipal Airport, which serves the area with commercial and private flights.
Demographics
As of the 2010 census, the population of Ruidoso was 8,029. The racial makeup of the village was 79.3% White, 0.7% African American, 1.2% Native American, 0.3% Asian, 0.1% Pacific Islander, 16.2% from other races, and 2.4% from two or more races. Hispanic or Latino of any race were 44.2% of the population.
The median household income in Ruidoso was $37,917, and the median family income was $45,938. The per capita income for the village was $20,945. About 16.2% of families and 20.2% of the population were below the poverty line, including 28.2% of those under age 18 and 8.2% of those age 65 or over.
Common Questions
What is Per Capita Income in Ruidoso?
Per Capita income in Ruidoso is $28,049.
What is the Median Family Income in Ruidoso?
Median Family Income in Ruidoso is $56,916.
What is the Median Household income in Ruidoso?
Median Household Income in Ruidoso is $36,033.
What is Income or Wage Gap in Ruidoso?
Income or Wage Gap in Ruidoso is 12.8%.
Women in Ruidoso earn 87.2 cents for every dollar earned by a man.
What is Inequality or Gini Index in Ruidoso?
Inequality or Gini Index in Ruidoso is 0.45.
What is the Total Population of Ruidoso?
Total Population of Ruidoso is 7,696.
What is the Total Male Population of Ruidoso?
Total Male Population of Ruidoso is 3,757.
What is the Total Female Population of Ruidoso?
Total Female Population of Ruidoso is 3,939.
What is the Ratio of Males per 100 Females in Ruidoso?
There are 95.38 Males per 100 Females in Ruidoso.
What is the Ratio of Females per 100 Males in Ruidoso?
There are 104.84 Females per 100 Males in Ruidoso.
What is the Median Population Age in Ruidoso?
Median Population Age in Ruidoso is 44.3 Years.
What is the Average Family Size in Ruidoso
Average Family Size in Ruidoso is 2.9 People.
What is the Average Household Size in Ruidoso
Average Household Size in Ruidoso is 2.1 People.
How Large is the Labor Force in Ruidoso?
There are 3,738 People in the Labor Forcein in Ruidoso.
What is the Percentage of People in the Labor Force in Ruidoso?
58.1% of People are in the Labor Force in Ruidoso.
What is the Unemployment Rate in Ruidoso?
Unemployment Rate in Ruidoso is 5.4%.