Ruidoso Downs, NM Map & Demographics
Ruidoso Downs Map
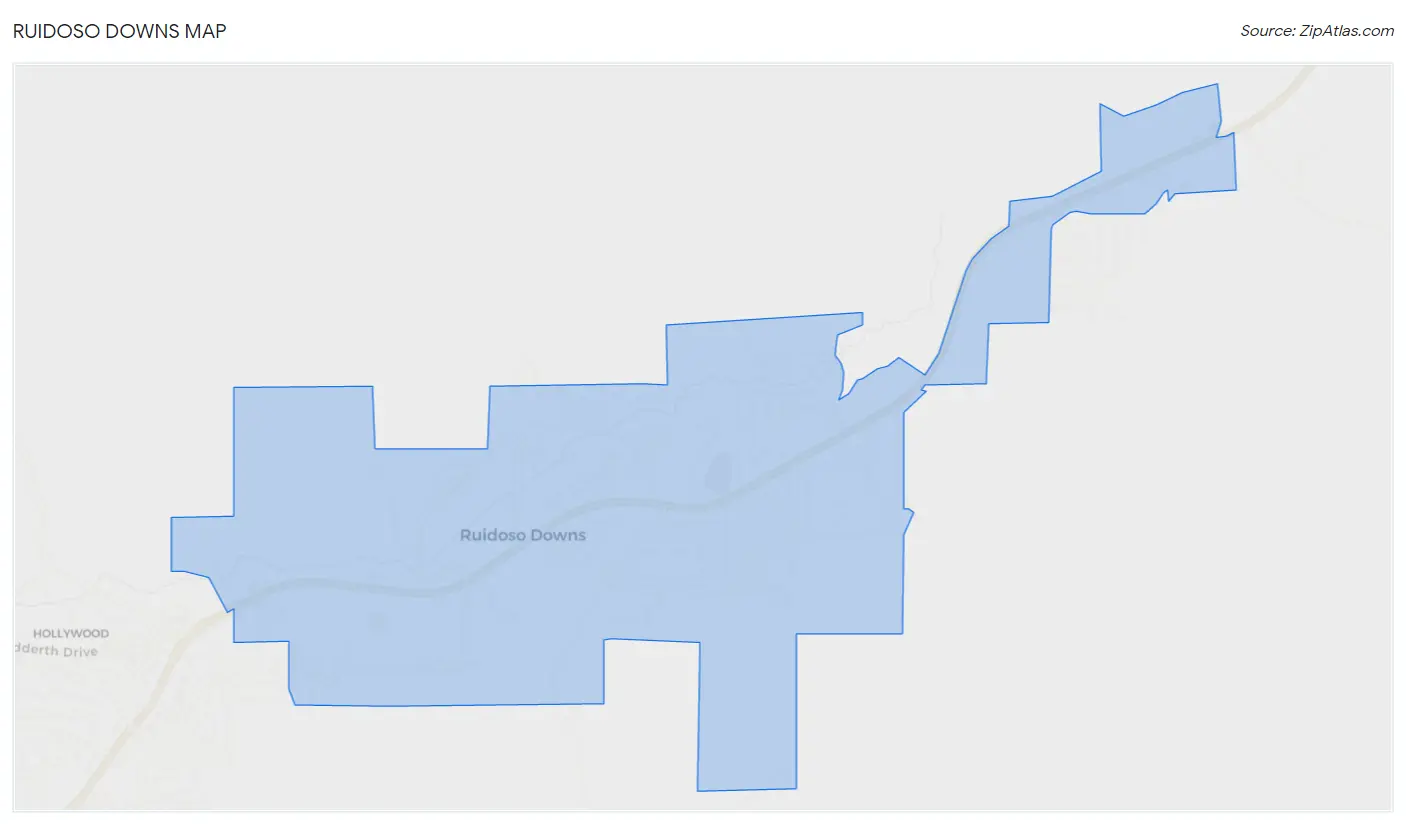
Ruidoso Downs Overview
$14,061
PER CAPITA INCOME
$33,442
AVG FAMILY INCOME
$28,939
AVG HOUSEHOLD INCOME
40.4%
WAGE / INCOME GAP [ % ]
59.6¢/ $1
WAGE / INCOME GAP [ $ ]
$15,045
FAMILY INCOME DEFICIT
0.45
INEQUALITY / GINI INDEX
2,635
TOTAL POPULATION
1,035
MALE POPULATION
1,600
FEMALE POPULATION
64.69
MALES / 100 FEMALES
154.59
FEMALES / 100 MALES
35.9
MEDIAN AGE
3.1
AVG FAMILY SIZE
2.7
AVG HOUSEHOLD SIZE
1,048
LABOR FORCE [ PEOPLE ]
48.7%
PERCENT IN LABOR FORCE
2.0%
UNEMPLOYMENT RATE
Ruidoso Downs Zip Codes
Ruidoso Downs Area Codes
Income in Ruidoso Downs
Income Overview in Ruidoso Downs
Per Capita Income in Ruidoso Downs is $14,061, while median incomes of families and households are $33,442 and $28,939 respectively.
| Characteristic | Number | Measure |
| Per Capita Income | 2,635 | $14,061 |
| Median Family Income | 622 | $33,442 |
| Mean Family Income | 622 | $33,251 |
| Median Household Income | 978 | $28,939 |
| Mean Household Income | 978 | $34,154 |
| Income Deficit | 622 | $15,045 |
| Wage / Income Gap (%) | 2,635 | 40.37% |
| Wage / Income Gap ($) | 2,635 | 59.63¢ per $1 |
| Gini / Inequality Index | 2,635 | 0.45 |
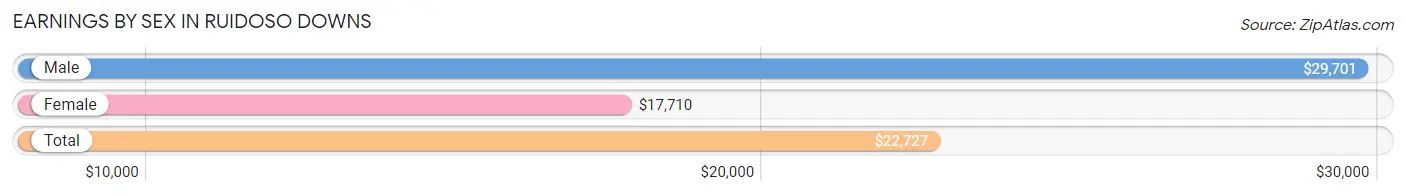
Earnings by Sex in Ruidoso Downs
Average Earnings in Ruidoso Downs are $22,727, $29,701 for men and $17,710 for women, a difference of 40.4%.
| Sex | Number | Average Earnings |
| Male | 344 (32.8%) | $29,701 |
| Female | 704 (67.2%) | $17,710 |
| Total | 1,048 (100.0%) | $22,727 |
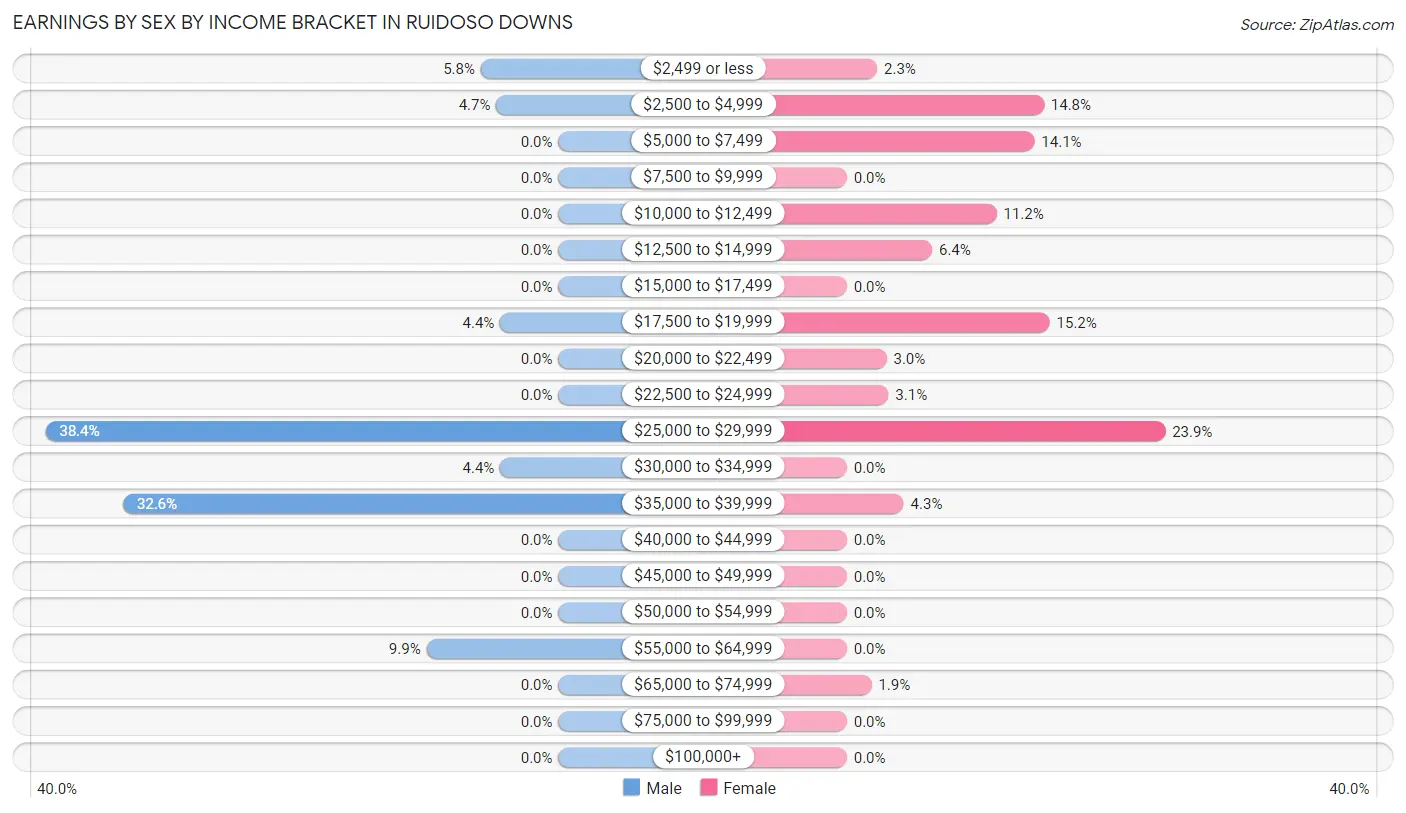
Earnings by Sex by Income Bracket in Ruidoso Downs
The most common earnings brackets in Ruidoso Downs are $25,000 to $29,999 for men (132 | 38.4%) and $25,000 to $29,999 for women (168 | 23.9%).
| Income | Male | Female |
| $2,499 or less | 20 (5.8%) | 16 (2.3%) |
| $2,500 to $4,999 | 16 (4.6%) | 104 (14.8%) |
| $5,000 to $7,499 | 0 (0.0%) | 99 (14.1%) |
| $7,500 to $9,999 | 0 (0.0%) | 0 (0.0%) |
| $10,000 to $12,499 | 0 (0.0%) | 79 (11.2%) |
| $12,500 to $14,999 | 0 (0.0%) | 45 (6.4%) |
| $15,000 to $17,499 | 0 (0.0%) | 0 (0.0%) |
| $17,500 to $19,999 | 15 (4.4%) | 107 (15.2%) |
| $20,000 to $22,499 | 0 (0.0%) | 21 (3.0%) |
| $22,500 to $24,999 | 0 (0.0%) | 22 (3.1%) |
| $25,000 to $29,999 | 132 (38.4%) | 168 (23.9%) |
| $30,000 to $34,999 | 15 (4.4%) | 0 (0.0%) |
| $35,000 to $39,999 | 112 (32.6%) | 30 (4.3%) |
| $40,000 to $44,999 | 0 (0.0%) | 0 (0.0%) |
| $45,000 to $49,999 | 0 (0.0%) | 0 (0.0%) |
| $50,000 to $54,999 | 0 (0.0%) | 0 (0.0%) |
| $55,000 to $64,999 | 34 (9.9%) | 0 (0.0%) |
| $65,000 to $74,999 | 0 (0.0%) | 13 (1.8%) |
| $75,000 to $99,999 | 0 (0.0%) | 0 (0.0%) |
| $100,000+ | 0 (0.0%) | 0 (0.0%) |
| Total | 344 (100.0%) | 704 (100.0%) |
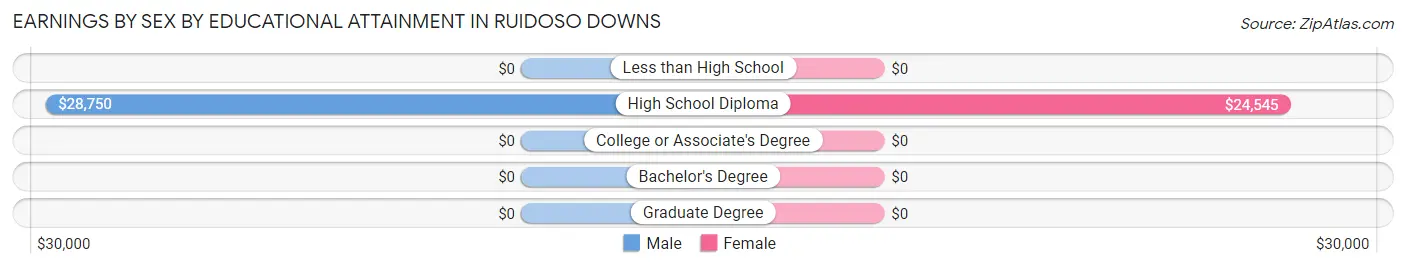
Earnings by Sex by Educational Attainment in Ruidoso Downs
Average earnings in Ruidoso Downs are $29,701 for men and $18,703 for women, a difference of 37.0%. Men with an educational attainment of high school diploma enjoy the highest average annual earnings of $28,750, while those with high school diploma education earn the least with $28,750. Women with an educational attainment of high school diploma earn the most with the average annual earnings of $24,545, while those with high school diploma education have the smallest earnings of $24,545.
| Educational Attainment | Male Income | Female Income |
| Less than High School | - | - |
| High School Diploma | $28,750 | $24,545 |
| College or Associate's Degree | - | - |
| Bachelor's Degree | - | - |
| Graduate Degree | - | - |
| Total | $29,701 | $18,703 |
Family Income in Ruidoso Downs
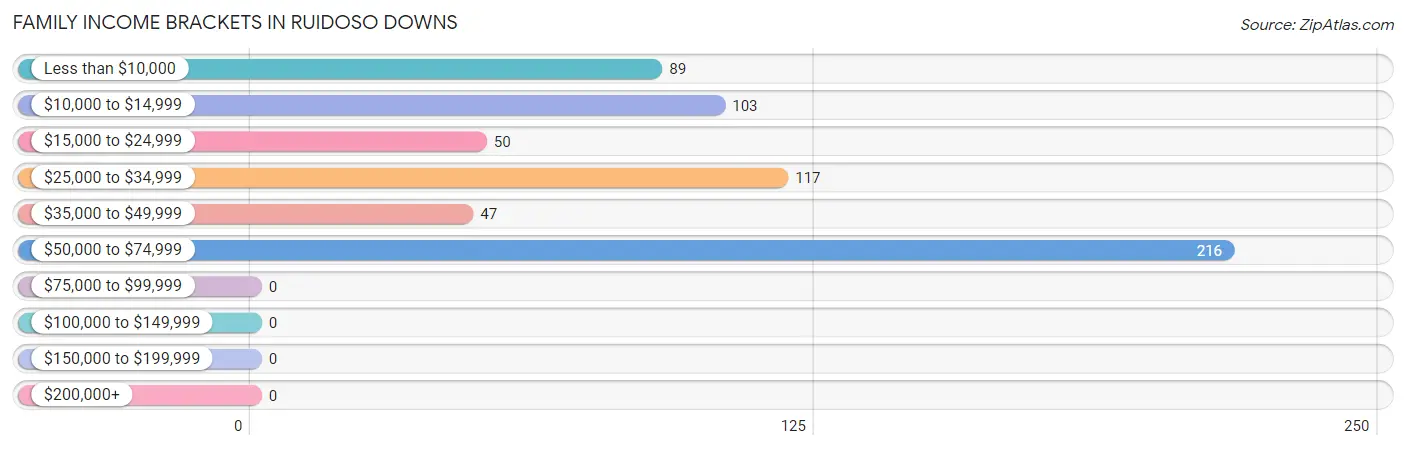
Family Income Brackets in Ruidoso Downs
According to the Ruidoso Downs family income data, there are 216 families falling into the $50,000 to $74,999 income range, which is the most common income bracket and makes up 34.7% of all families.
| Income Bracket | # Families | % Families |
| Less than $10,000 | 89 | 14.3% |
| $10,000 to $14,999 | 103 | 16.6% |
| $15,000 to $24,999 | 50 | 8.0% |
| $25,000 to $34,999 | 117 | 18.8% |
| $35,000 to $49,999 | 47 | 7.6% |
| $50,000 to $74,999 | 216 | 34.7% |
| $75,000 to $99,999 | 0 | 0.0% |
| $100,000 to $149,999 | 0 | 0.0% |
| $150,000 to $199,999 | 0 | 0.0% |
| $200,000+ | 0 | 0.0% |
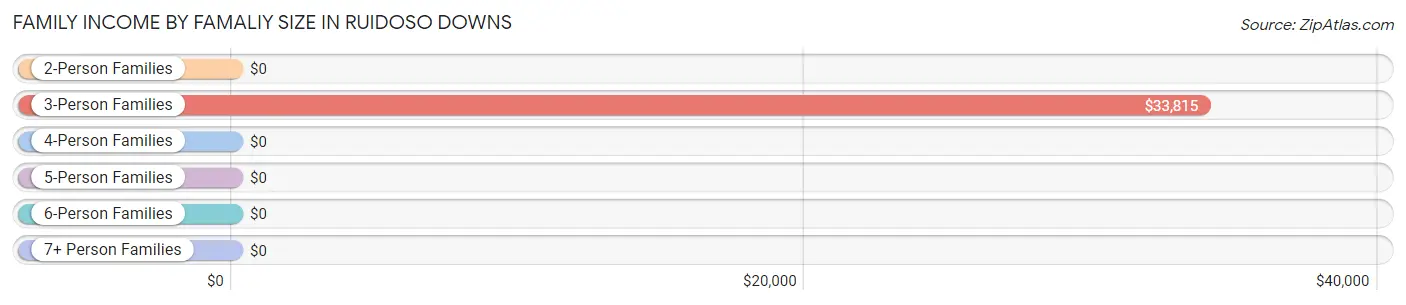
Family Income by Famaliy Size in Ruidoso Downs
3-person families (307 | 49.4%) account for the highest median family income in Ruidoso Downs with $33,815 per family, while 3-person families (307 | 49.4%) have the highest median income of $11,272 per family member.
| Income Bracket | # Families | Median Income |
| 2-Person Families | 181 (29.1%) | $0 |
| 3-Person Families | 307 (49.4%) | $33,815 |
| 4-Person Families | 134 (21.5%) | $0 |
| 5-Person Families | 0 (0.0%) | $0 |
| 6-Person Families | 0 (0.0%) | $0 |
| 7+ Person Families | 0 (0.0%) | $0 |
| Total | 622 (100.0%) | $33,442 |
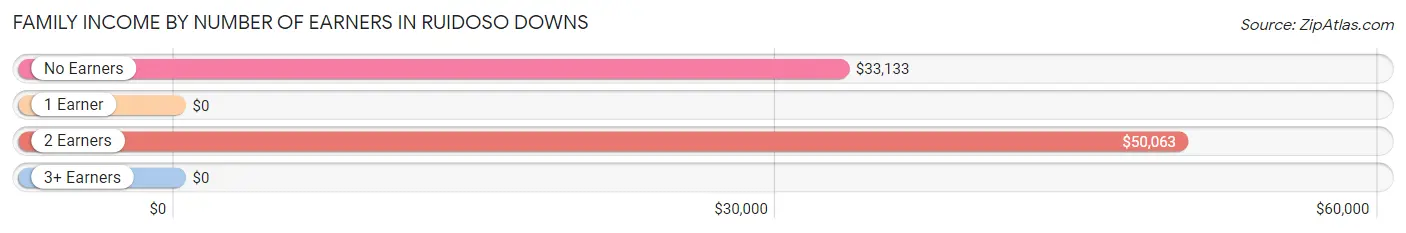
Family Income by Number of Earners in Ruidoso Downs
| Number of Earners | # Families | Median Income |
| No Earners | 139 (22.4%) | $33,133 |
| 1 Earner | 351 (56.4%) | $0 |
| 2 Earners | 132 (21.2%) | $50,063 |
| 3+ Earners | 0 (0.0%) | $0 |
| Total | 622 (100.0%) | $33,442 |
Household Income in Ruidoso Downs
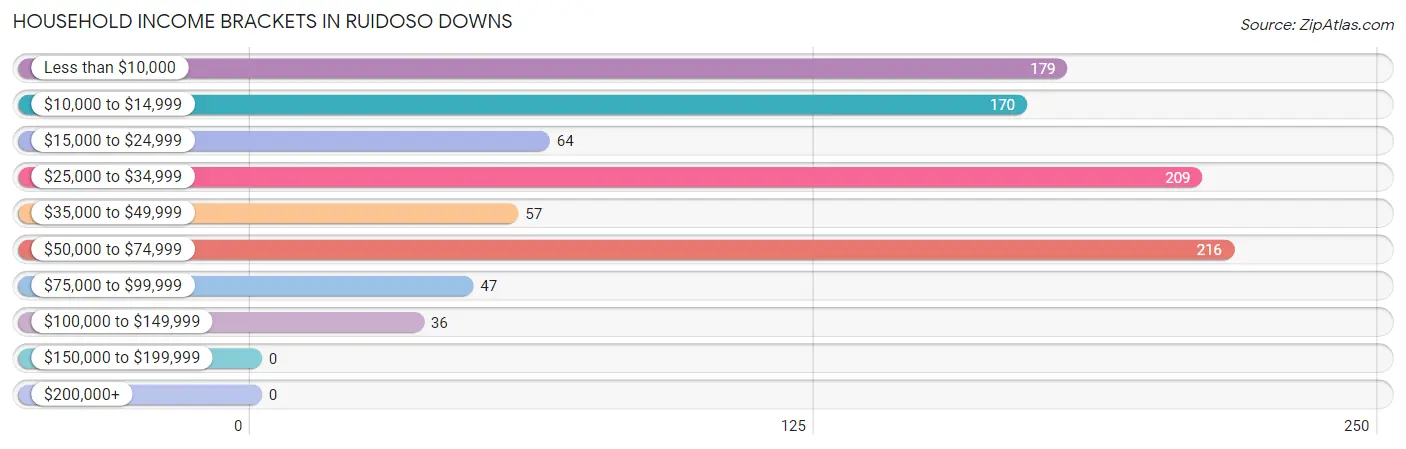
Household Income Brackets in Ruidoso Downs
With 216 households falling in the category, the $50,000 to $74,999 income range is the most frequent in Ruidoso Downs, accounting for 22.1% of all households.
| Income Bracket | # Households | % Households |
| Less than $10,000 | 179 | 18.3% |
| $10,000 to $14,999 | 170 | 17.4% |
| $15,000 to $24,999 | 64 | 6.5% |
| $25,000 to $34,999 | 209 | 21.4% |
| $35,000 to $49,999 | 57 | 5.8% |
| $50,000 to $74,999 | 216 | 22.1% |
| $75,000 to $99,999 | 47 | 4.8% |
| $100,000 to $149,999 | 36 | 3.7% |
| $150,000 to $199,999 | 0 | 0.0% |
| $200,000+ | 0 | 0.0% |
Household Income by Householder Age in Ruidoso Downs
The median household income in Ruidoso Downs is $28,939, with the highest median household income of $60,461 found in the 45 to 64 years age bracket for the primary householder. A total of 131 households (13.4%) fall into this category. Meanwhile, the 15 to 24 years age bracket for the primary householder has the lowest median household income of $0, with 59 households (6.0%) in this group.
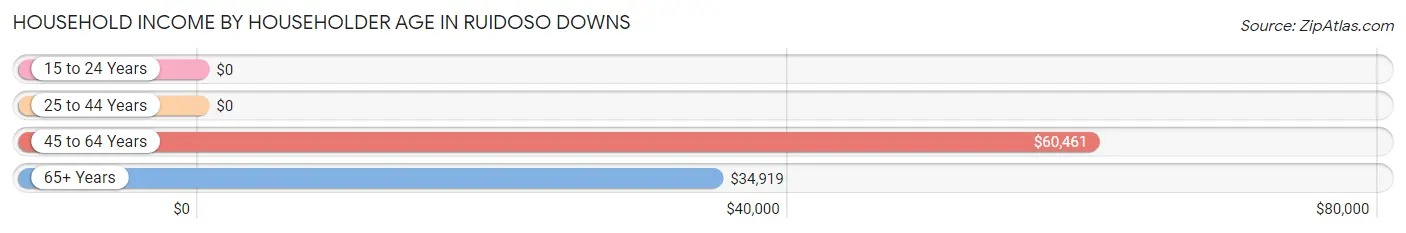
| Income Bracket | # Households | Median Income |
| 15 to 24 Years | 59 (6.0%) | $0 |
| 25 to 44 Years | 341 (34.9%) | $0 |
| 45 to 64 Years | 131 (13.4%) | $60,461 |
| 65+ Years | 447 (45.7%) | $34,919 |
| Total | 978 (100.0%) | $28,939 |
Poverty in Ruidoso Downs
Income Below Poverty by Sex and Age in Ruidoso Downs
With 28.1% poverty level for males and 41.5% for females among the residents of Ruidoso Downs, under 5 year old males and under 5 year old females are the most vulnerable to poverty, with 123 males (100.0%) and 25 females (100.0%) in their respective age groups living below the poverty level.
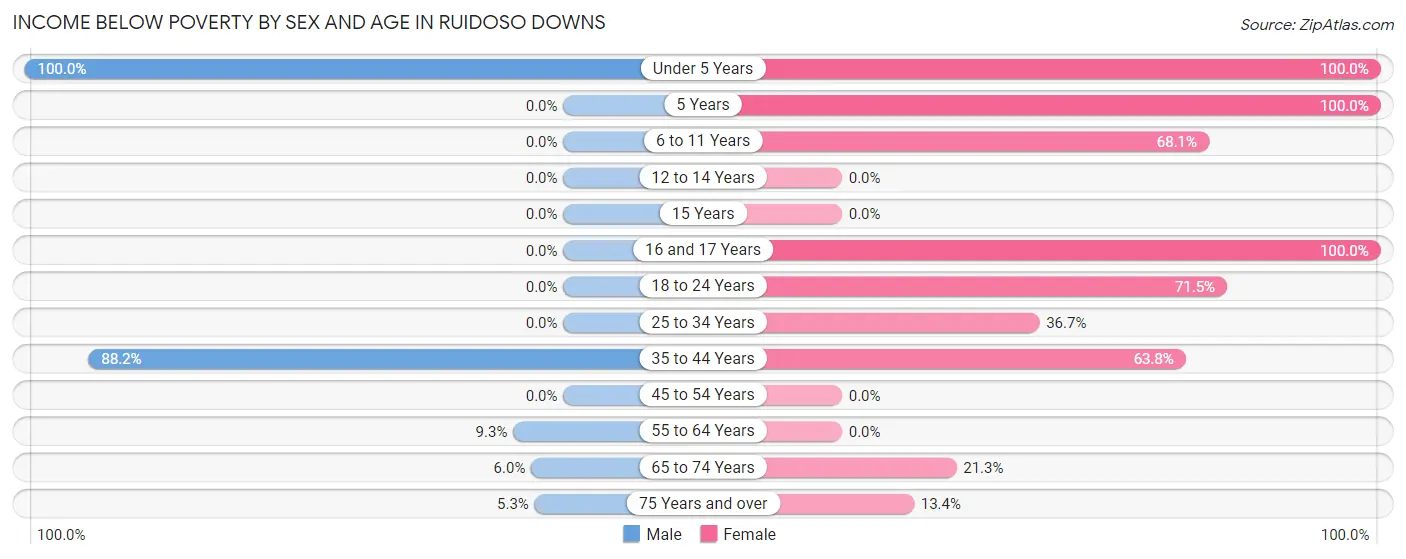
| Age Bracket | Male | Female |
| Under 5 Years | 123 (100.0%) | 25 (100.0%) |
| 5 Years | 0 (0.0%) | 28 (100.0%) |
| 6 to 11 Years | 0 (0.0%) | 171 (68.1%) |
| 12 to 14 Years | 0 (0.0%) | 0 (0.0%) |
| 15 Years | 0 (0.0%) | 0 (0.0%) |
| 16 and 17 Years | 0 (0.0%) | 30 (100.0%) |
| 18 to 24 Years | 0 (0.0%) | 203 (71.5%) |
| 25 to 34 Years | 0 (0.0%) | 103 (36.6%) |
| 35 to 44 Years | 134 (88.2%) | 30 (63.8%) |
| 45 to 54 Years | 0 (0.0%) | 0 (0.0%) |
| 55 to 64 Years | 16 (9.3%) | 0 (0.0%) |
| 65 to 74 Years | 13 (6.0%) | 51 (21.2%) |
| 75 Years and over | 5 (5.3%) | 23 (13.4%) |
| Total | 291 (28.1%) | 664 (41.5%) |
Income Above Poverty by Sex and Age in Ruidoso Downs
According to the poverty statistics in Ruidoso Downs, males aged 6 to 11 years and females aged 15 years are the age groups that are most secure financially, with 100.0% of males and 100.0% of females in these age groups living above the poverty line.
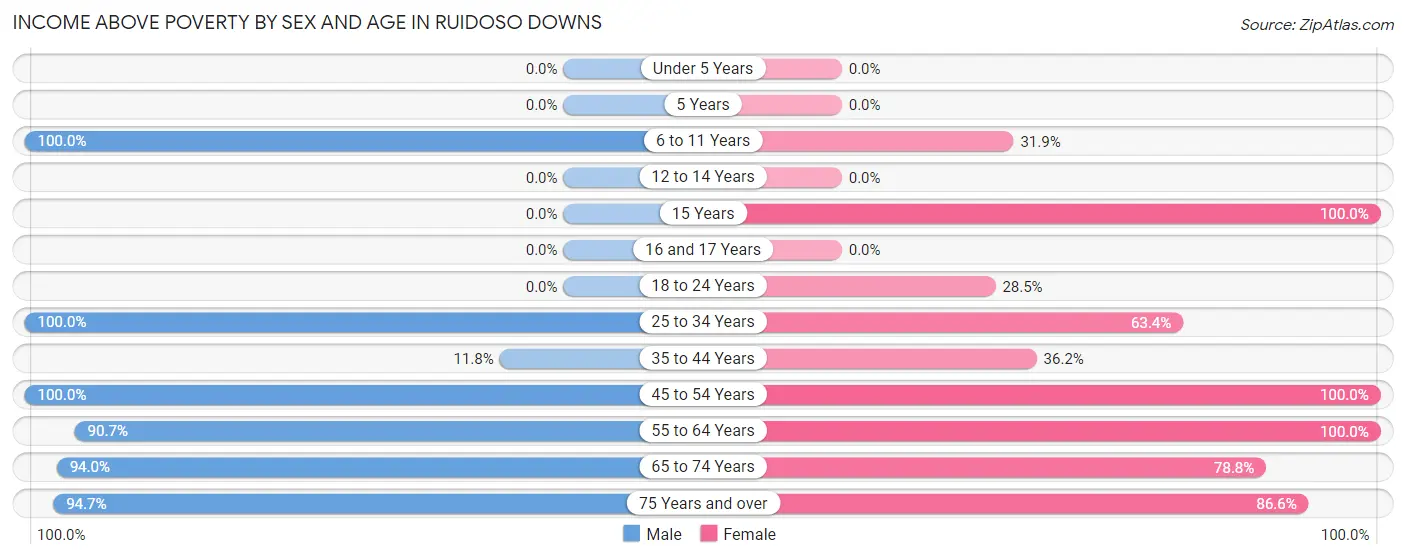
| Age Bracket | Male | Female |
| Under 5 Years | 0 (0.0%) | 0 (0.0%) |
| 5 Years | 0 (0.0%) | 0 (0.0%) |
| 6 to 11 Years | 19 (100.0%) | 80 (31.9%) |
| 12 to 14 Years | 0 (0.0%) | 0 (0.0%) |
| 15 Years | 0 (0.0%) | 38 (100.0%) |
| 16 and 17 Years | 0 (0.0%) | 0 (0.0%) |
| 18 to 24 Years | 0 (0.0%) | 81 (28.5%) |
| 25 to 34 Years | 183 (100.0%) | 178 (63.3%) |
| 35 to 44 Years | 18 (11.8%) | 17 (36.2%) |
| 45 to 54 Years | 74 (100.0%) | 148 (100.0%) |
| 55 to 64 Years | 156 (90.7%) | 56 (100.0%) |
| 65 to 74 Years | 205 (94.0%) | 189 (78.7%) |
| 75 Years and over | 89 (94.7%) | 149 (86.6%) |
| Total | 744 (71.9%) | 936 (58.5%) |
Income Below Poverty Among Married-Couple Families in Ruidoso Downs
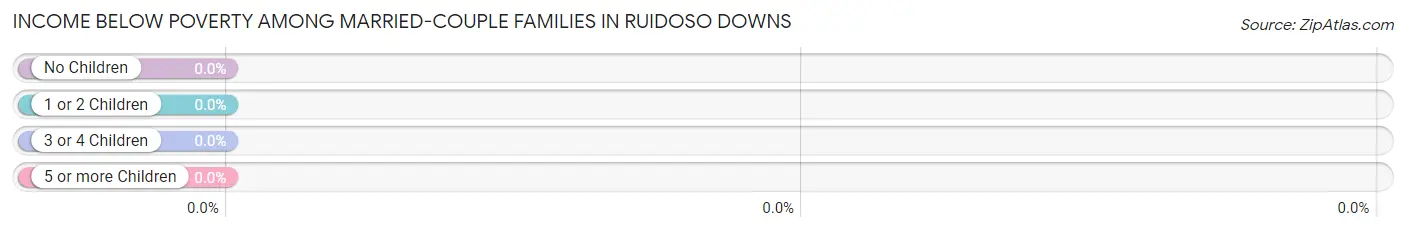
| Children | Above Poverty | Below Poverty |
| No Children | 248 (100.0%) | 0 (0.0%) |
| 1 or 2 Children | 24 (100.0%) | 0 (0.0%) |
| 3 or 4 Children | 0 (0.0%) | 0 (0.0%) |
| 5 or more Children | 0 (0.0%) | 0 (0.0%) |
| Total | 272 (100.0%) | 0 (0.0%) |
Income Below Poverty Among Single-Parent Households in Ruidoso Downs
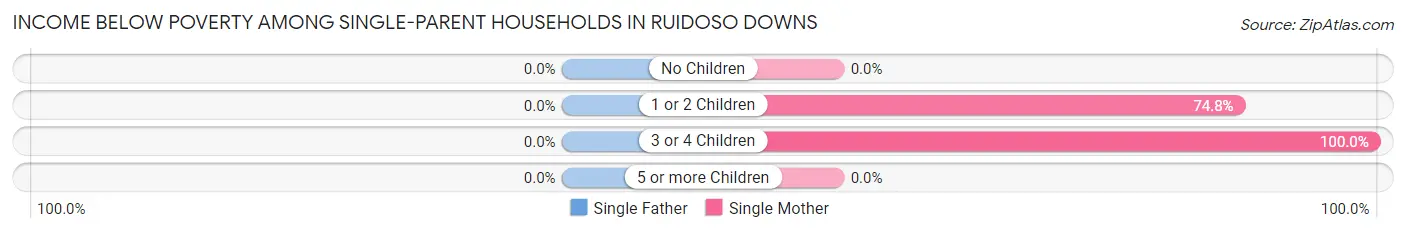
| Children | Single Father | Single Mother |
| No Children | 0 (0.0%) | 0 (0.0%) |
| 1 or 2 Children | 0 (0.0%) | 113 (74.8%) |
| 3 or 4 Children | 0 (0.0%) | 79 (100.0%) |
| 5 or more Children | 0 (0.0%) | 0 (0.0%) |
| Total | 0 (0.0%) | 192 (55.3%) |
Income Below Poverty Among Married-Couple vs Single-Parent Households in Ruidoso Downs
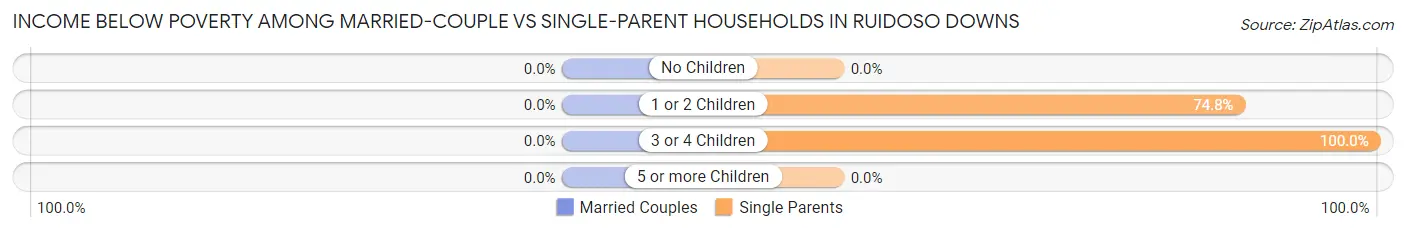
| Children | Married-Couple Families | Single-Parent Households |
| No Children | 0 (0.0%) | 0 (0.0%) |
| 1 or 2 Children | 0 (0.0%) | 113 (74.8%) |
| 3 or 4 Children | 0 (0.0%) | 79 (100.0%) |
| 5 or more Children | 0 (0.0%) | 0 (0.0%) |
| Total | 0 (0.0%) | 192 (54.9%) |
Race in Ruidoso Downs
The most populous races in Ruidoso Downs are White / Caucasian (1,480 | 56.2%), Hispanic or Latino (1,315 | 49.9%), and Two or more Races (604 | 22.9%).
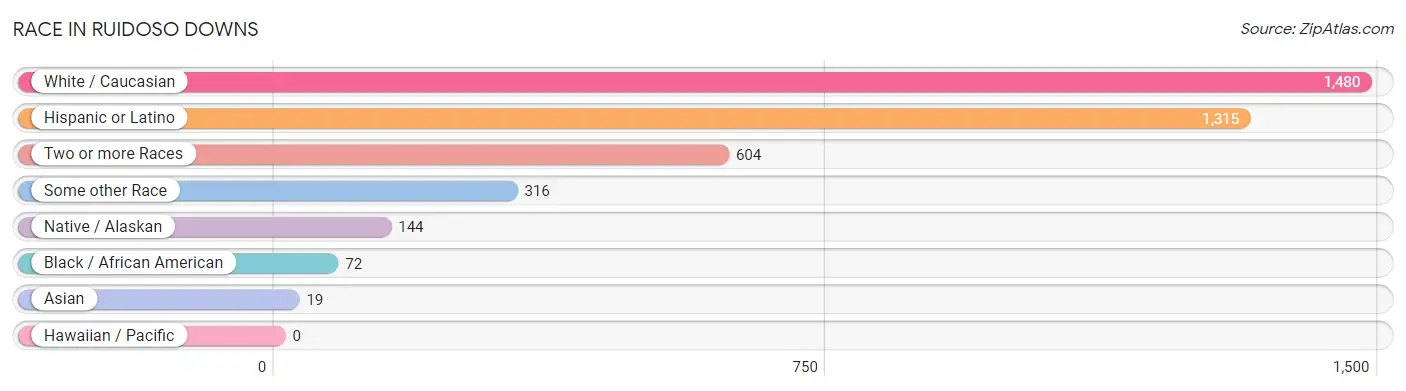
| Race | # Population | % Population |
| Asian | 19 | 0.7% |
| Black / African American | 72 | 2.7% |
| Hawaiian / Pacific | 0 | 0.0% |
| Hispanic or Latino | 1,315 | 49.9% |
| Native / Alaskan | 144 | 5.5% |
| White / Caucasian | 1,480 | 56.2% |
| Two or more Races | 604 | 22.9% |
| Some other Race | 316 | 12.0% |
| Total | 2,635 | 100.0% |
Ancestry in Ruidoso Downs
The most populous ancestries reported in Ruidoso Downs are Mexican (1,305 | 49.5%), Irish (234 | 8.9%), American (170 | 6.5%), Navajo (144 | 5.5%), and German (84 | 3.2%), together accounting for 73.5% of all Ruidoso Downs residents.
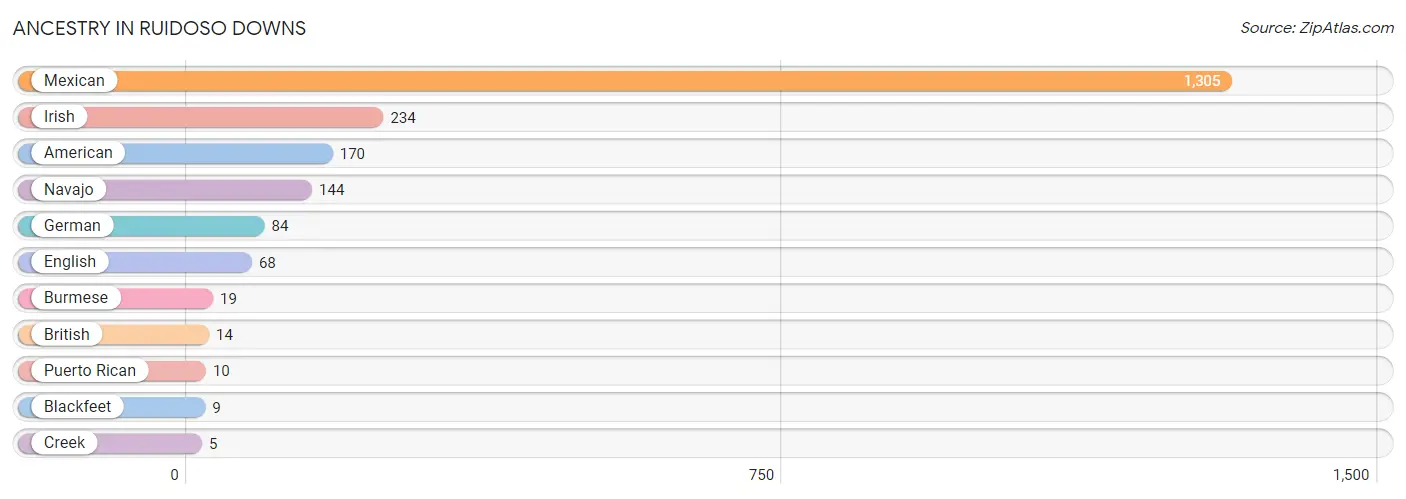
| Ancestry | # Population | % Population |
| American | 170 | 6.5% |
| Blackfeet | 9 | 0.3% |
| British | 14 | 0.5% |
| Burmese | 19 | 0.7% |
| Creek | 5 | 0.2% |
| English | 68 | 2.6% |
| German | 84 | 3.2% |
| Irish | 234 | 8.9% |
| Mexican | 1,305 | 49.5% |
| Navajo | 144 | 5.5% |
| Puerto Rican | 10 | 0.4% | View All 11 Rows |
Immigrants in Ruidoso Downs
The most numerous immigrant groups reported in Ruidoso Downs came from Central America (298 | 11.3%), Latin America (298 | 11.3%), and Mexico (298 | 11.3%), together accounting for 33.9% of all Ruidoso Downs residents.
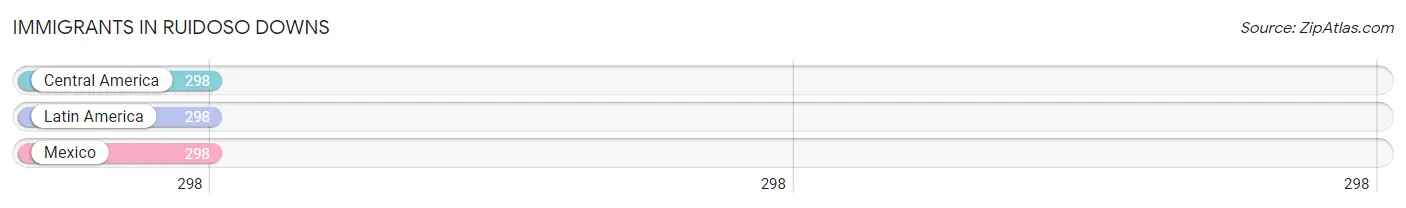
| Immigration Origin | # Population | % Population |
| Central America | 298 | 11.3% |
| Latin America | 298 | 11.3% |
| Mexico | 298 | 11.3% | View All 3 Rows |
Sex and Age in Ruidoso Downs
Sex and Age in Ruidoso Downs
The most populous age groups in Ruidoso Downs are Under 5 Years (123 | 11.9%) for men and 20 to 24 Years (229 | 14.3%) for women.
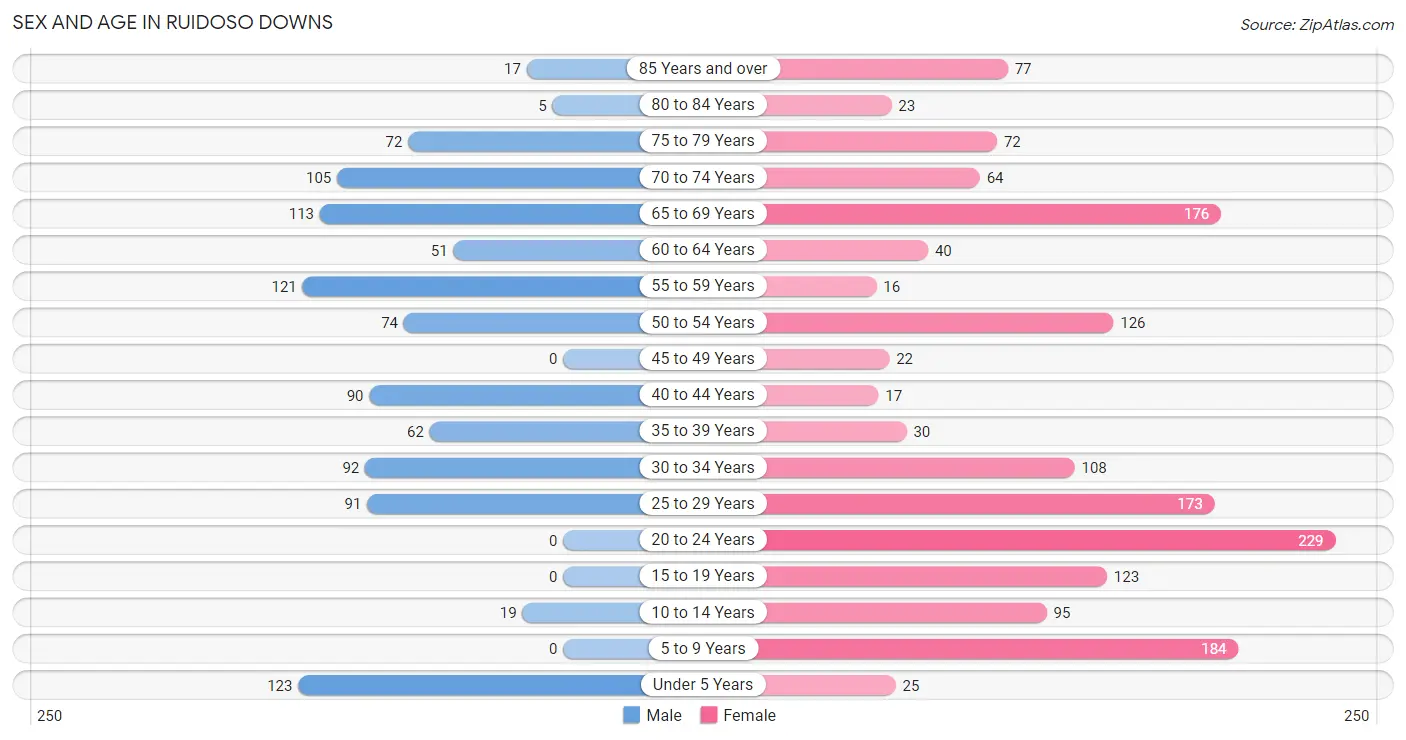
| Age Bracket | Male | Female |
| Under 5 Years | 123 (11.9%) | 25 (1.6%) |
| 5 to 9 Years | 0 (0.0%) | 184 (11.5%) |
| 10 to 14 Years | 19 (1.8%) | 95 (5.9%) |
| 15 to 19 Years | 0 (0.0%) | 123 (7.7%) |
| 20 to 24 Years | 0 (0.0%) | 229 (14.3%) |
| 25 to 29 Years | 91 (8.8%) | 173 (10.8%) |
| 30 to 34 Years | 92 (8.9%) | 108 (6.8%) |
| 35 to 39 Years | 62 (6.0%) | 30 (1.9%) |
| 40 to 44 Years | 90 (8.7%) | 17 (1.1%) |
| 45 to 49 Years | 0 (0.0%) | 22 (1.4%) |
| 50 to 54 Years | 74 (7.1%) | 126 (7.9%) |
| 55 to 59 Years | 121 (11.7%) | 16 (1.0%) |
| 60 to 64 Years | 51 (4.9%) | 40 (2.5%) |
| 65 to 69 Years | 113 (10.9%) | 176 (11.0%) |
| 70 to 74 Years | 105 (10.1%) | 64 (4.0%) |
| 75 to 79 Years | 72 (7.0%) | 72 (4.5%) |
| 80 to 84 Years | 5 (0.5%) | 23 (1.4%) |
| 85 Years and over | 17 (1.6%) | 77 (4.8%) |
| Total | 1,035 (100.0%) | 1,600 (100.0%) |
Families and Households in Ruidoso Downs
Median Family Size in Ruidoso Downs
The median family size in Ruidoso Downs is 3.06 persons per family, with single male/father families (3 | 0.5%) accounting for the largest median family size of 7.67 persons per family. On the other hand, married-couple families (272 | 43.7%) represent the smallest median family size with 2.67 persons per family.
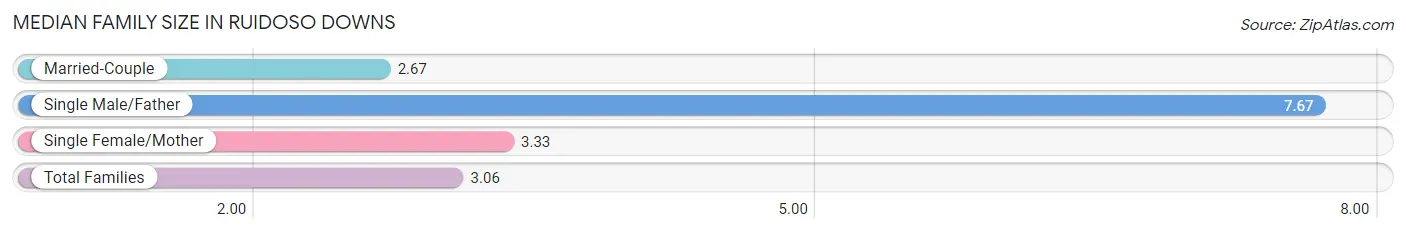
| Family Type | # Families | Family Size |
| Married-Couple | 272 (43.7%) | 2.67 |
| Single Male/Father | 3 (0.5%) | 7.67 |
| Single Female/Mother | 347 (55.8%) | 3.33 |
| Total Families | 622 (100.0%) | 3.06 |
Median Household Size in Ruidoso Downs
The median household size in Ruidoso Downs is 2.69 persons per household, with single male/father households (3 | 0.3%) accounting for the largest median household size of 7.67 persons per household. non-family households (356 | 36.4%) represent the smallest median household size with 1.83 persons per household.
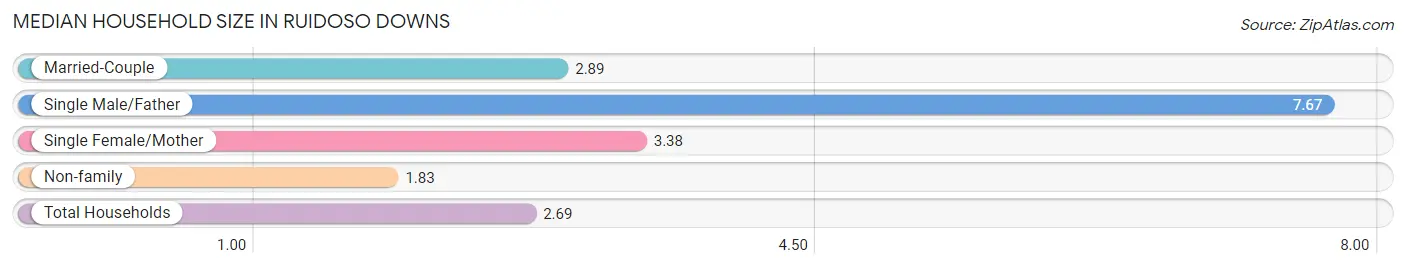
| Household Type | # Households | Household Size |
| Married-Couple | 272 (27.8%) | 2.89 |
| Single Male/Father | 3 (0.3%) | 7.67 |
| Single Female/Mother | 347 (35.5%) | 3.38 |
| Non-family | 356 (36.4%) | 1.83 |
| Total Households | 978 (100.0%) | 2.69 |
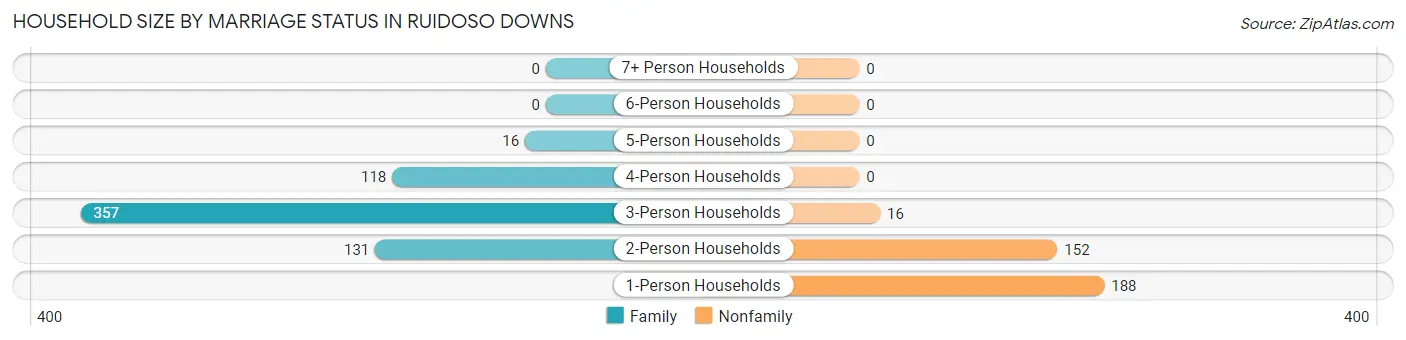
Household Size by Marriage Status in Ruidoso Downs
Out of a total of 978 households in Ruidoso Downs, 622 (63.6%) are family households, while 356 (36.4%) are nonfamily households. The most numerous type of family households are 3-person households, comprising 357, and the most common type of nonfamily households are 1-person households, comprising 188.
| Household Size | Family Households | Nonfamily Households |
| 1-Person Households | - | 188 (19.2%) |
| 2-Person Households | 131 (13.4%) | 152 (15.5%) |
| 3-Person Households | 357 (36.5%) | 16 (1.6%) |
| 4-Person Households | 118 (12.1%) | 0 (0.0%) |
| 5-Person Households | 16 (1.6%) | 0 (0.0%) |
| 6-Person Households | 0 (0.0%) | 0 (0.0%) |
| 7+ Person Households | 0 (0.0%) | 0 (0.0%) |
| Total | 622 (63.6%) | 356 (36.4%) |
Female Fertility in Ruidoso Downs
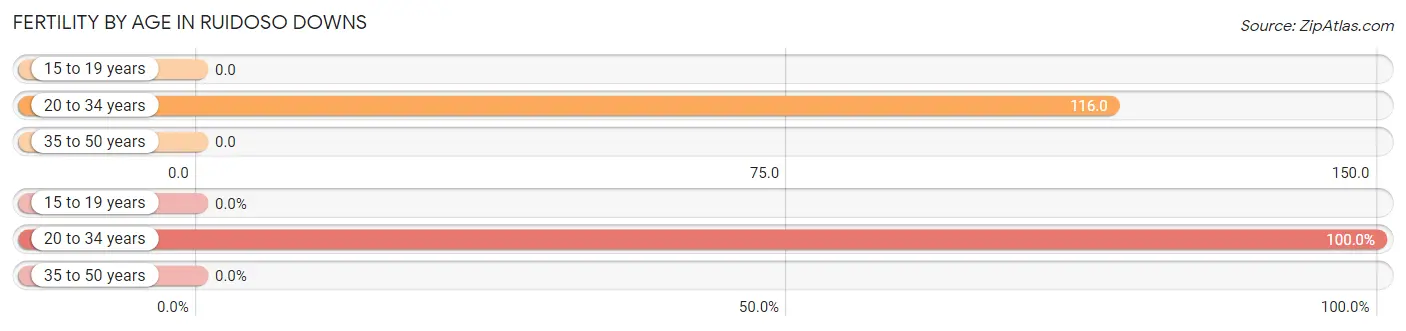
Fertility by Age in Ruidoso Downs
Average fertility rate in Ruidoso Downs is 84.0 births per 1,000 women. Women in the age bracket of 20 to 34 years have the highest fertility rate with 116.0 births per 1,000 women. Women in the age bracket of 20 to 34 years acount for 100.0% of all women with births.
| Age Bracket | Women with Births | Births / 1,000 Women |
| 15 to 19 years | 0 (0.0%) | 0.0 |
| 20 to 34 years | 59 (100.0%) | 116.0 |
| 35 to 50 years | 0 (0.0%) | 0.0 |
| Total | 59 (100.0%) | 84.0 |
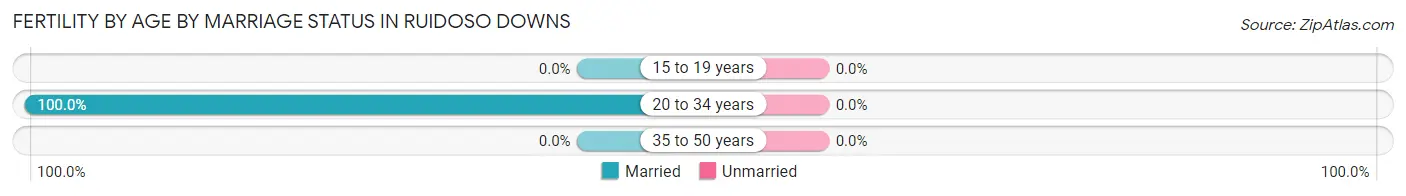
Fertility by Age by Marriage Status in Ruidoso Downs
| Age Bracket | Married | Unmarried |
| 15 to 19 years | 0 (0.0%) | 0 (0.0%) |
| 20 to 34 years | 59 (100.0%) | 0 (0.0%) |
| 35 to 50 years | 0 (0.0%) | 0 (0.0%) |
| Total | 59 (100.0%) | 0 (0.0%) |
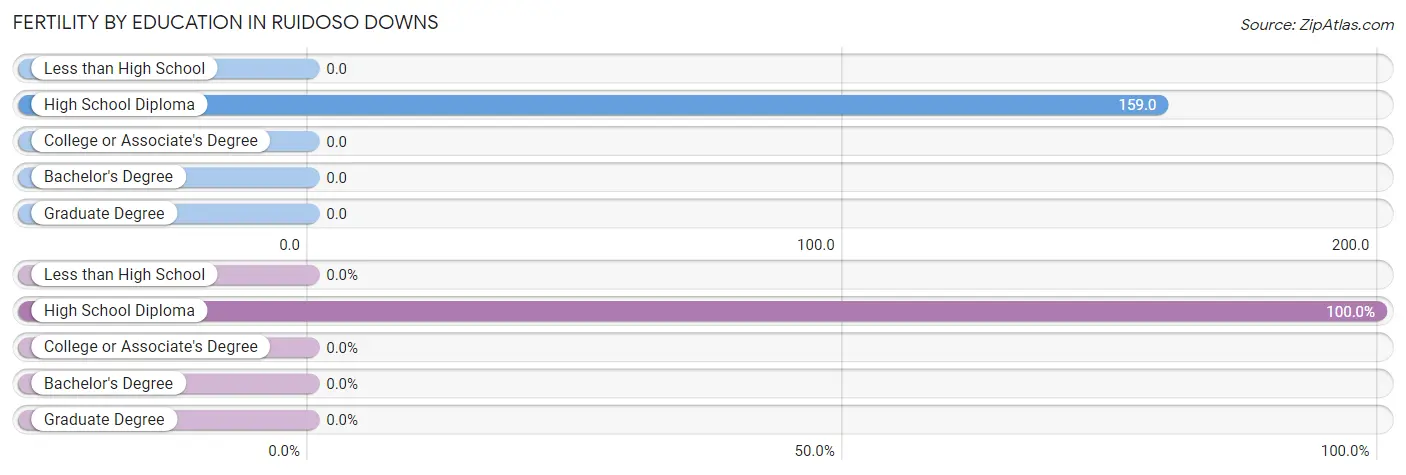
Fertility by Education in Ruidoso Downs
| Educational Attainment | Women with Births | Births / 1,000 Women |
| Less than High School | 0 (0.0%) | 0.0 |
| High School Diploma | 59 (100.0%) | 159.0 |
| College or Associate's Degree | 0 (0.0%) | 0.0 |
| Bachelor's Degree | 0 (0.0%) | 0.0 |
| Graduate Degree | 0 (0.0%) | 0.0 |
| Total | 59 (100.0%) | 84.0 |
Fertility by Education by Marriage Status in Ruidoso Downs
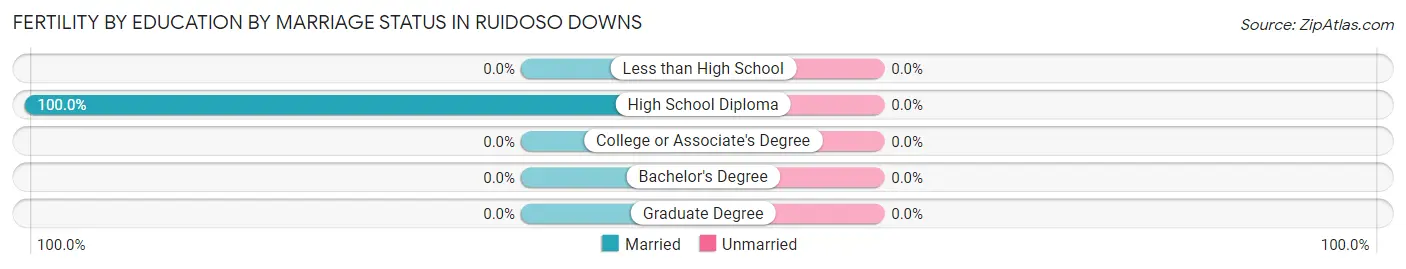
| Educational Attainment | Married | Unmarried |
| Less than High School | 0 (0.0%) | 0 (0.0%) |
| High School Diploma | 59 (100.0%) | 0 (0.0%) |
| College or Associate's Degree | 0 (0.0%) | 0 (0.0%) |
| Bachelor's Degree | 0 (0.0%) | 0 (0.0%) |
| Graduate Degree | 0 (0.0%) | 0 (0.0%) |
| Total | 59 (100.0%) | 0 (0.0%) |
Employment Characteristics in Ruidoso Downs
Employment by Class of Employer in Ruidoso Downs
Among the 978 employed individuals in Ruidoso Downs, private company employees (535 | 54.7%), self-employed (not incorporated) (371 | 37.9%), and state government employees (40 | 4.1%) make up the most common classes of employment.
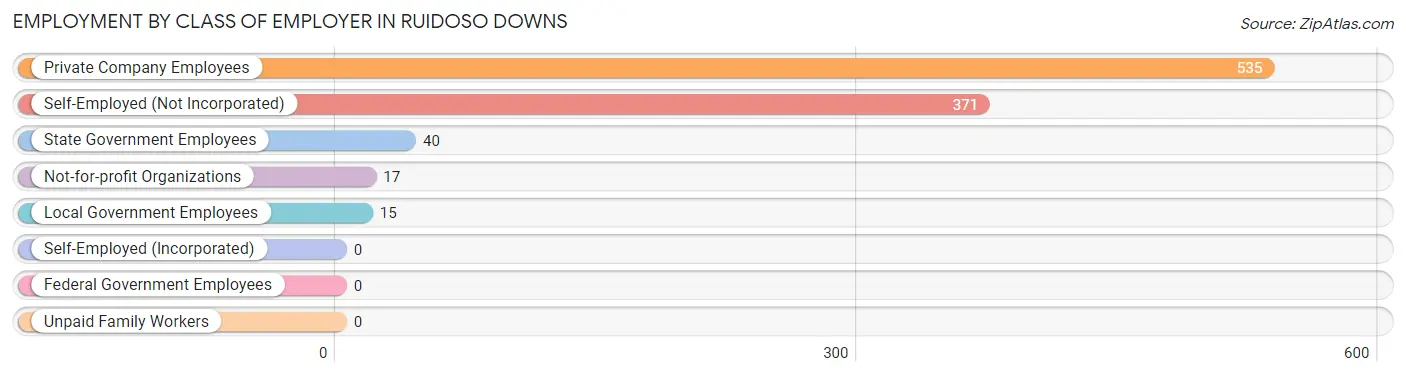
| Employer Class | # Employees | % Employees |
| Private Company Employees | 535 | 54.7% |
| Self-Employed (Incorporated) | 0 | 0.0% |
| Self-Employed (Not Incorporated) | 371 | 37.9% |
| Not-for-profit Organizations | 17 | 1.7% |
| Local Government Employees | 15 | 1.5% |
| State Government Employees | 40 | 4.1% |
| Federal Government Employees | 0 | 0.0% |
| Unpaid Family Workers | 0 | 0.0% |
| Total | 978 | 100.0% |
Employment Status by Age in Ruidoso Downs
According to the labor force statistics for Ruidoso Downs, out of the total population over 16 years of age (2,151), 48.7% or 1,048 individuals are in the labor force, with 2.0% or 21 of them unemployed. The age group with the highest labor force participation rate is 30 to 34 years, with 100.0% or 200 individuals in the labor force. Within the labor force, the 20 to 24 years age range has the highest percentage of unemployed individuals, with 24.7% or 21 of them being unemployed.
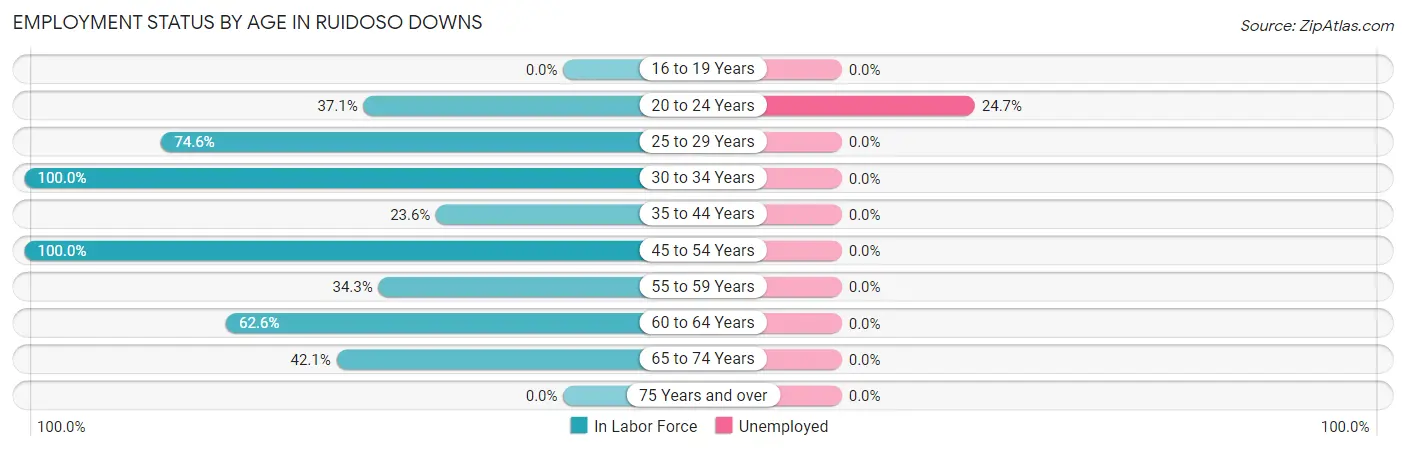
| Age Bracket | In Labor Force | Unemployed |
| 16 to 19 Years | 0 (0.0%) | 0 (0.0%) |
| 20 to 24 Years | 85 (37.1%) | 21 (24.7%) |
| 25 to 29 Years | 197 (74.6%) | 0 (0.0%) |
| 30 to 34 Years | 200 (100.0%) | 0 (0.0%) |
| 35 to 44 Years | 47 (23.6%) | 0 (0.0%) |
| 45 to 54 Years | 222 (100.0%) | 0 (0.0%) |
| 55 to 59 Years | 47 (34.3%) | 0 (0.0%) |
| 60 to 64 Years | 57 (62.6%) | 0 (0.0%) |
| 65 to 74 Years | 193 (42.1%) | 0 (0.0%) |
| 75 Years and over | 0 (0.0%) | 0 (0.0%) |
| Total | 1,048 (48.7%) | 21 (2.0%) |
Employment Status by Educational Attainment in Ruidoso Downs
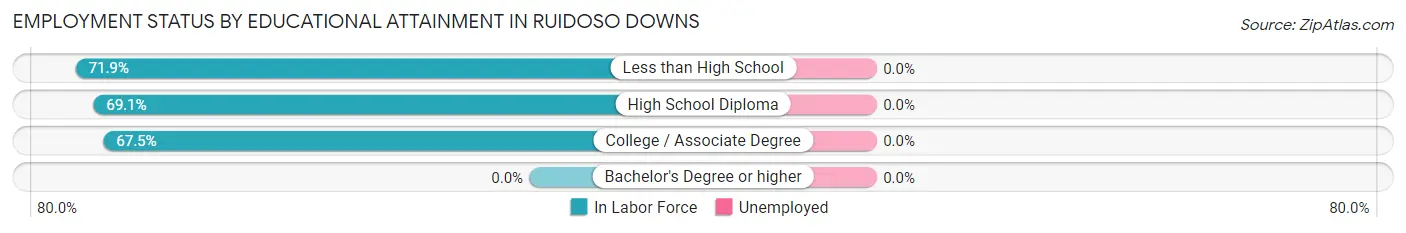
| Educational Attainment | In Labor Force | Unemployed |
| Less than High School | 159 (71.9%) | 0 (0.0%) |
| High School Diploma | 385 (69.1%) | 0 (0.0%) |
| College / Associate Degree | 226 (67.5%) | 0 (0.0%) |
| Bachelor's Degree or higher | 0 (0.0%) | 0 (0.0%) |
| Total | 770 (69.2%) | 0 (0.0%) |
Employment Occupations by Sex in Ruidoso Downs
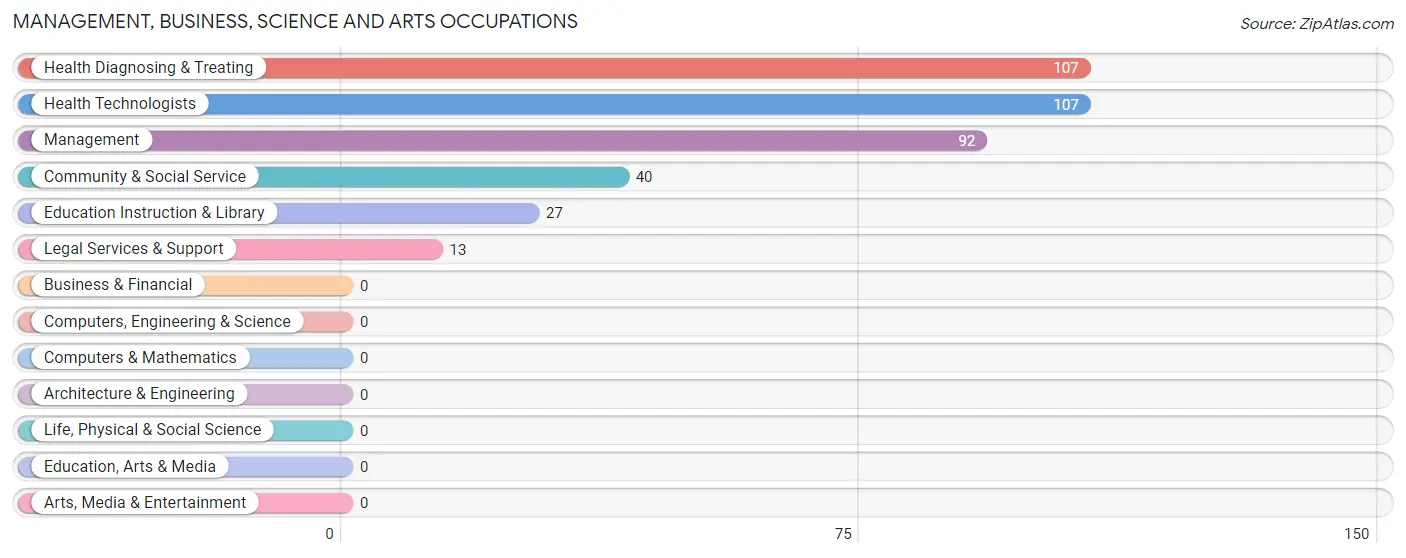
Management, Business, Science and Arts Occupations
The most common Management, Business, Science and Arts occupations in Ruidoso Downs are Health Diagnosing & Treating (107 | 10.4%), Health Technologists (107 | 10.4%), Management (92 | 9.0%), Community & Social Service (40 | 3.9%), and Education Instruction & Library (27 | 2.6%).
Management, Business, Science and Arts Occupations by Sex
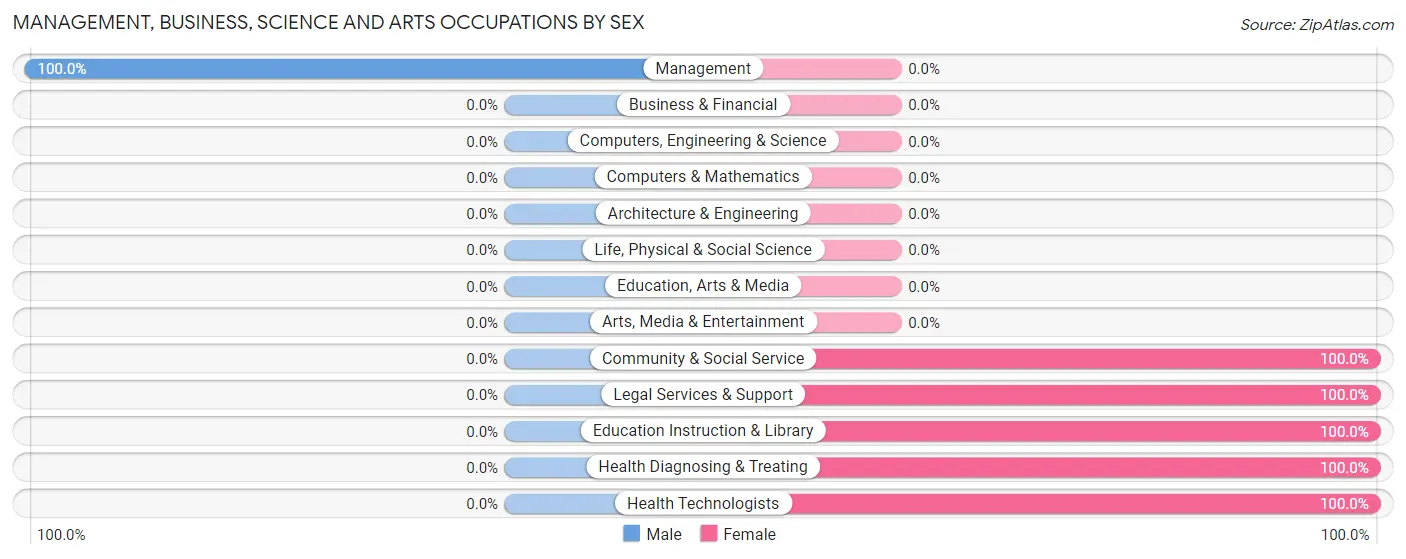
| Occupation | Male | Female |
| Management | 92 (100.0%) | 0 (0.0%) |
| Business & Financial | 0 (0.0%) | 0 (0.0%) |
| Computers, Engineering & Science | 0 (0.0%) | 0 (0.0%) |
| Computers & Mathematics | 0 (0.0%) | 0 (0.0%) |
| Architecture & Engineering | 0 (0.0%) | 0 (0.0%) |
| Life, Physical & Social Science | 0 (0.0%) | 0 (0.0%) |
| Community & Social Service | 0 (0.0%) | 40 (100.0%) |
| Education, Arts & Media | 0 (0.0%) | 0 (0.0%) |
| Legal Services & Support | 0 (0.0%) | 13 (100.0%) |
| Education Instruction & Library | 0 (0.0%) | 27 (100.0%) |
| Arts, Media & Entertainment | 0 (0.0%) | 0 (0.0%) |
| Health Diagnosing & Treating | 0 (0.0%) | 107 (100.0%) |
| Health Technologists | 0 (0.0%) | 107 (100.0%) |
| Total (Category) | 92 (38.5%) | 147 (61.5%) |
| Total (Overall) | 344 (33.5%) | 683 (66.5%) |
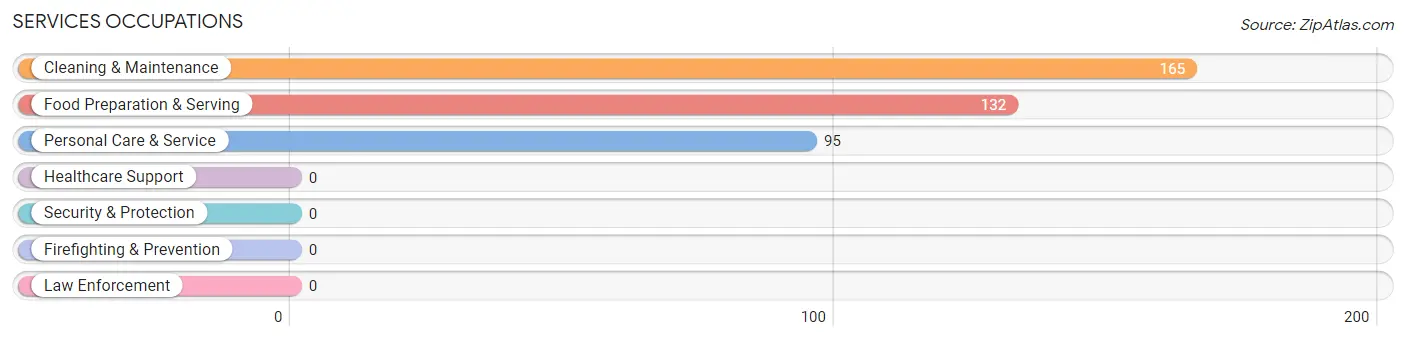
Services Occupations
The most common Services occupations in Ruidoso Downs are Cleaning & Maintenance (165 | 16.1%), Food Preparation & Serving (132 | 12.9%), and Personal Care & Service (95 | 9.2%).
Services Occupations by Sex
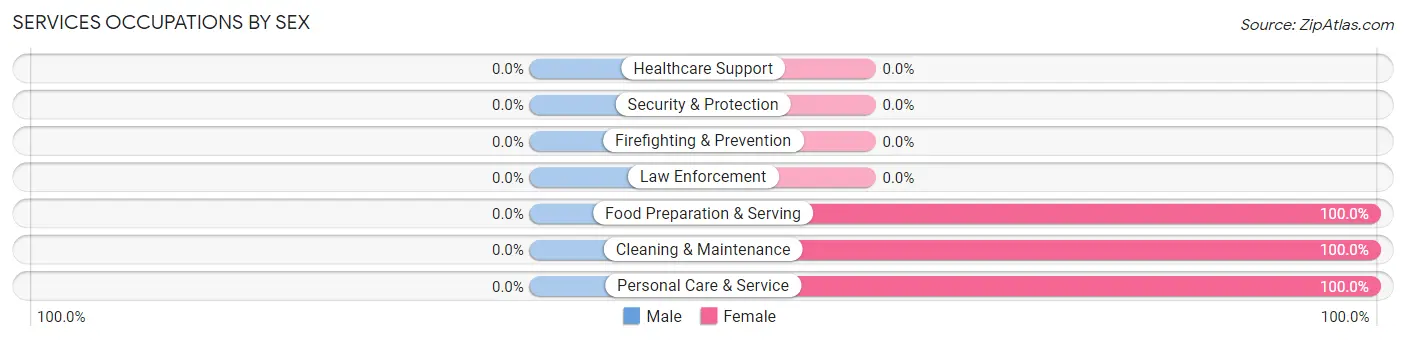
| Occupation | Male | Female |
| Healthcare Support | 0 (0.0%) | 0 (0.0%) |
| Security & Protection | 0 (0.0%) | 0 (0.0%) |
| Firefighting & Prevention | 0 (0.0%) | 0 (0.0%) |
| Law Enforcement | 0 (0.0%) | 0 (0.0%) |
| Food Preparation & Serving | 0 (0.0%) | 132 (100.0%) |
| Cleaning & Maintenance | 0 (0.0%) | 165 (100.0%) |
| Personal Care & Service | 0 (0.0%) | 95 (100.0%) |
| Total (Category) | 0 (0.0%) | 392 (100.0%) |
| Total (Overall) | 344 (33.5%) | 683 (66.5%) |
Sales and Office Occupations
The most common Sales and Office occupations in Ruidoso Downs are Sales & Related (122 | 11.9%), and Office & Administration (38 | 3.7%).
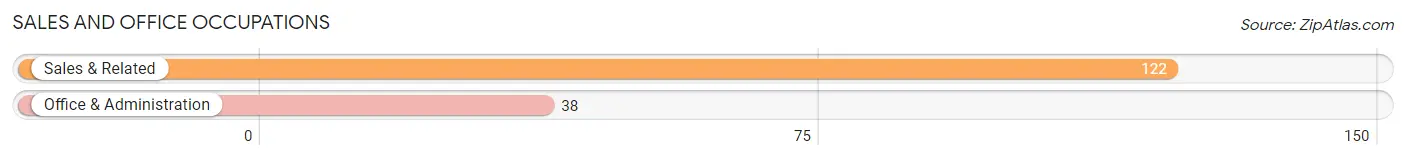
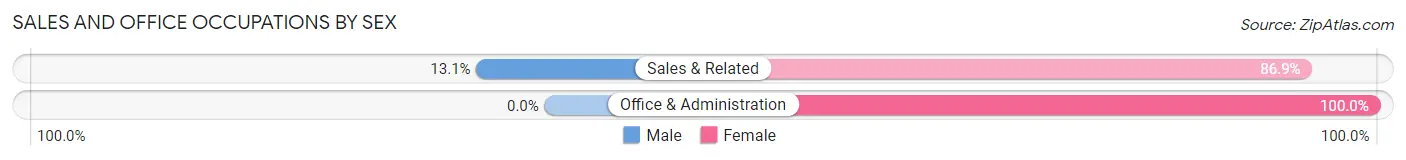
Sales and Office Occupations by Sex
| Occupation | Male | Female |
| Sales & Related | 16 (13.1%) | 106 (86.9%) |
| Office & Administration | 0 (0.0%) | 38 (100.0%) |
| Total (Category) | 16 (10.0%) | 144 (90.0%) |
| Total (Overall) | 344 (33.5%) | 683 (66.5%) |
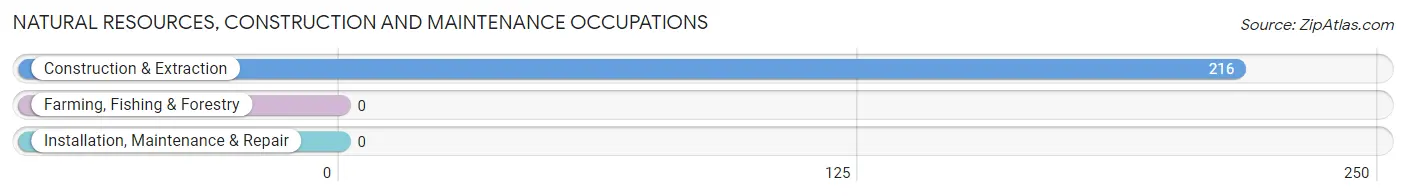
Natural Resources, Construction and Maintenance Occupations
The most common Natural Resources, Construction and Maintenance occupations in Ruidoso Downs are , and Construction & Extraction (216 | 21.0%).
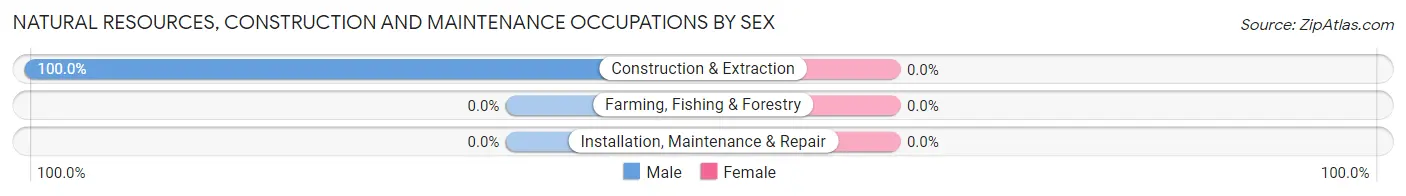
Natural Resources, Construction and Maintenance Occupations by Sex
| Occupation | Male | Female |
| Farming, Fishing & Forestry | 0 (0.0%) | 0 (0.0%) |
| Construction & Extraction | 216 (100.0%) | 0 (0.0%) |
| Installation, Maintenance & Repair | 0 (0.0%) | 0 (0.0%) |
| Total (Category) | 216 (100.0%) | 0 (0.0%) |
| Total (Overall) | 344 (33.5%) | 683 (66.5%) |
Production, Transportation and Moving Occupations
The most common Production, Transportation and Moving occupations in Ruidoso Downs are , and Material Moving (20 | 1.9%).
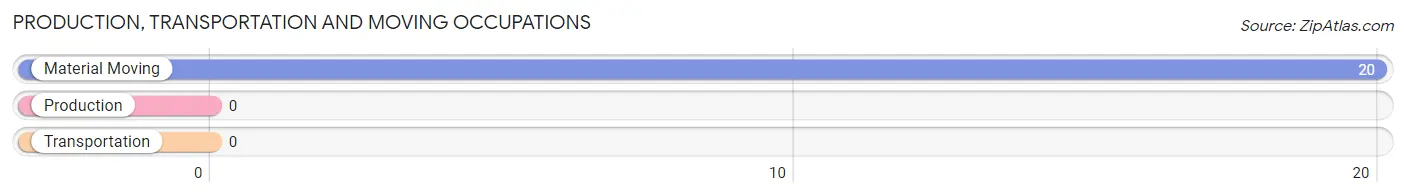
Production, Transportation and Moving Occupations by Sex
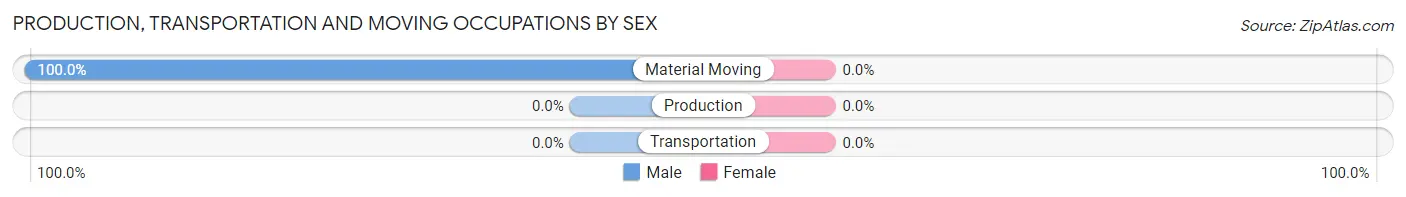
| Occupation | Male | Female |
| Production | 0 (0.0%) | 0 (0.0%) |
| Transportation | 0 (0.0%) | 0 (0.0%) |
| Material Moving | 20 (100.0%) | 0 (0.0%) |
| Total (Category) | 20 (100.0%) | 0 (0.0%) |
| Total (Overall) | 344 (33.5%) | 683 (66.5%) |
Employment Industries by Sex in Ruidoso Downs
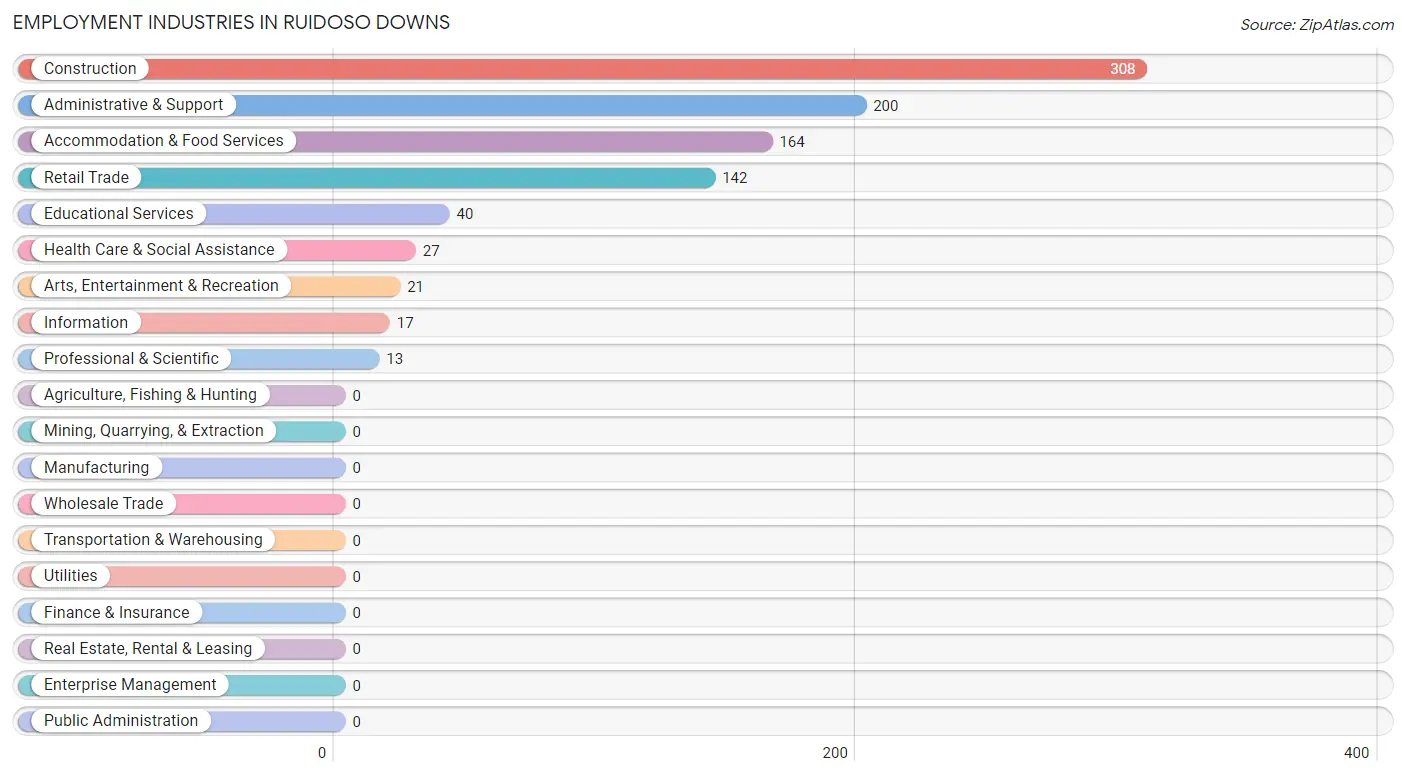
Employment Industries in Ruidoso Downs
The major employment industries in Ruidoso Downs include Construction (308 | 30.0%), Administrative & Support (200 | 19.5%), Accommodation & Food Services (164 | 16.0%), Retail Trade (142 | 13.8%), and Educational Services (40 | 3.9%).
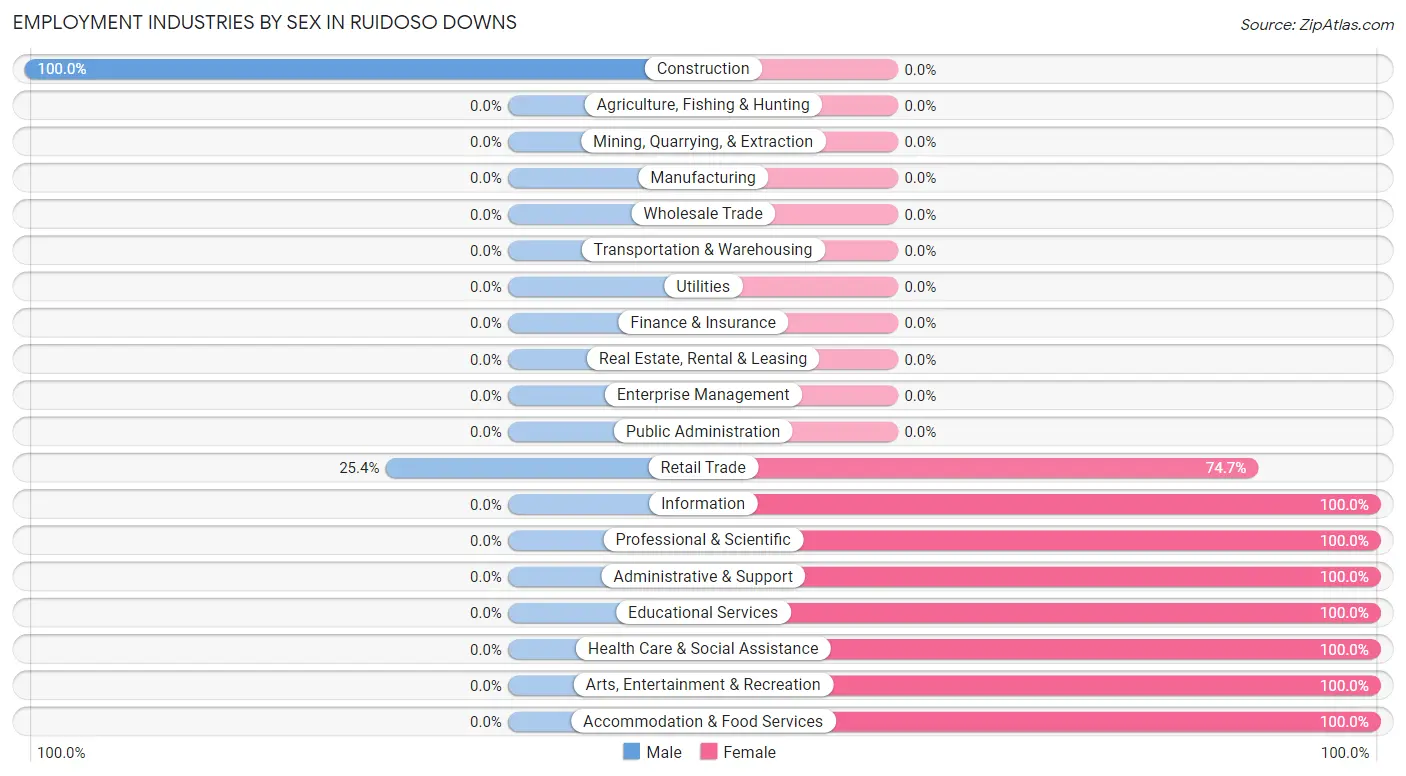
Employment Industries by Sex in Ruidoso Downs
The Ruidoso Downs industries that see more men than women are Construction (100.0%), and Retail Trade (25.4%), whereas the industries that tend to have a higher number of women are Information (100.0%), Professional & Scientific (100.0%), and Administrative & Support (100.0%).
| Industry | Male | Female |
| Agriculture, Fishing & Hunting | 0 (0.0%) | 0 (0.0%) |
| Mining, Quarrying, & Extraction | 0 (0.0%) | 0 (0.0%) |
| Construction | 308 (100.0%) | 0 (0.0%) |
| Manufacturing | 0 (0.0%) | 0 (0.0%) |
| Wholesale Trade | 0 (0.0%) | 0 (0.0%) |
| Retail Trade | 36 (25.4%) | 106 (74.7%) |
| Transportation & Warehousing | 0 (0.0%) | 0 (0.0%) |
| Utilities | 0 (0.0%) | 0 (0.0%) |
| Information | 0 (0.0%) | 17 (100.0%) |
| Finance & Insurance | 0 (0.0%) | 0 (0.0%) |
| Real Estate, Rental & Leasing | 0 (0.0%) | 0 (0.0%) |
| Professional & Scientific | 0 (0.0%) | 13 (100.0%) |
| Enterprise Management | 0 (0.0%) | 0 (0.0%) |
| Administrative & Support | 0 (0.0%) | 200 (100.0%) |
| Educational Services | 0 (0.0%) | 40 (100.0%) |
| Health Care & Social Assistance | 0 (0.0%) | 27 (100.0%) |
| Arts, Entertainment & Recreation | 0 (0.0%) | 21 (100.0%) |
| Accommodation & Food Services | 0 (0.0%) | 164 (100.0%) |
| Public Administration | 0 (0.0%) | 0 (0.0%) |
| Total | 344 (33.5%) | 683 (66.5%) |
Education in Ruidoso Downs
School Enrollment in Ruidoso Downs
The most common levels of schooling among the 504 students in Ruidoso Downs are elementary school (182 | 36.1%), college / undergraduate (113 | 22.4%), and middle school (88 | 17.5%).
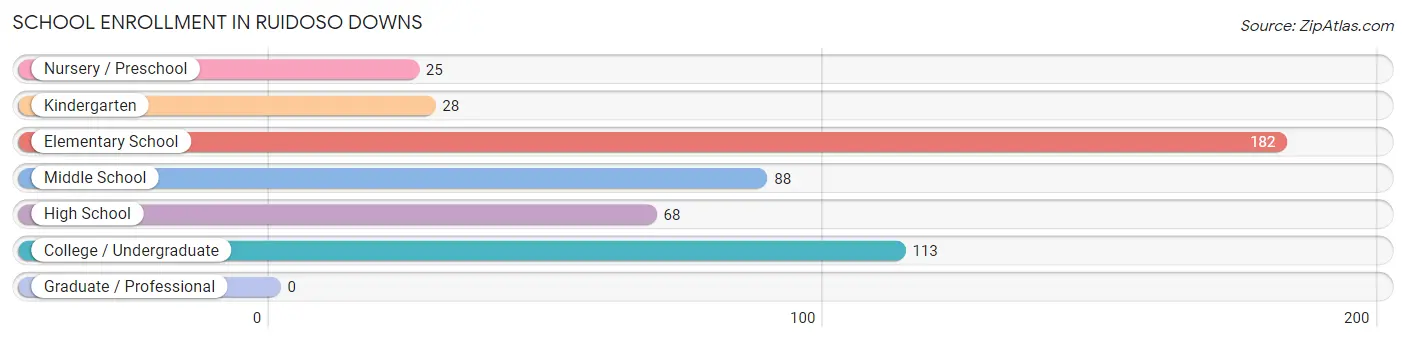
| School Level | # Students | % Students |
| Nursery / Preschool | 25 | 5.0% |
| Kindergarten | 28 | 5.6% |
| Elementary School | 182 | 36.1% |
| Middle School | 88 | 17.5% |
| High School | 68 | 13.5% |
| College / Undergraduate | 113 | 22.4% |
| Graduate / Professional | 0 | 0.0% |
| Total | 504 | 100.0% |
School Enrollment by Age by Funding Source in Ruidoso Downs
Out of a total of 504 students who are enrolled in schools in Ruidoso Downs, 231 (45.8%) attend a private institution, while the remaining 273 (54.2%) are enrolled in public schools. The age group of 3 to 4 year olds has the highest likelihood of being enrolled in private schools, with 25 (100.0% in the age bracket) enrolled. Conversely, the age group of 15 to 17 year olds has the lowest likelihood of being enrolled in a private school, with 68 (100.0% in the age bracket) attending a public institution.
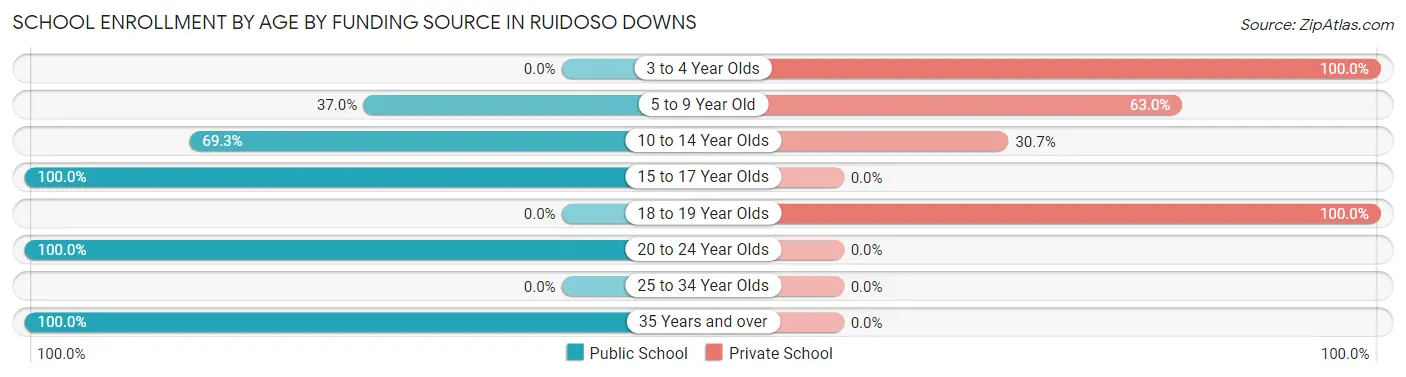
| Age Bracket | Public School | Private School |
| 3 to 4 Year Olds | 0 (0.0%) | 25 (100.0%) |
| 5 to 9 Year Old | 68 (37.0%) | 116 (63.0%) |
| 10 to 14 Year Olds | 79 (69.3%) | 35 (30.7%) |
| 15 to 17 Year Olds | 68 (100.0%) | 0 (0.0%) |
| 18 to 19 Year Olds | 0 (0.0%) | 55 (100.0%) |
| 20 to 24 Year Olds | 21 (100.0%) | 0 (0.0%) |
| 25 to 34 Year Olds | 0 (0.0%) | 0 (0.0%) |
| 35 Years and over | 37 (100.0%) | 0 (0.0%) |
| Total | 273 (54.2%) | 231 (45.8%) |
Educational Attainment by Field of Study in Ruidoso Downs
Bio, nature & agricultural (107 | 54.6%), psychology (44 | 22.5%), business (14 | 7.1%), science & technology (13 | 6.6%), and literature & languages (9 | 4.6%) are the most common fields of study among 196 individuals in Ruidoso Downs who have obtained a bachelor's degree or higher.
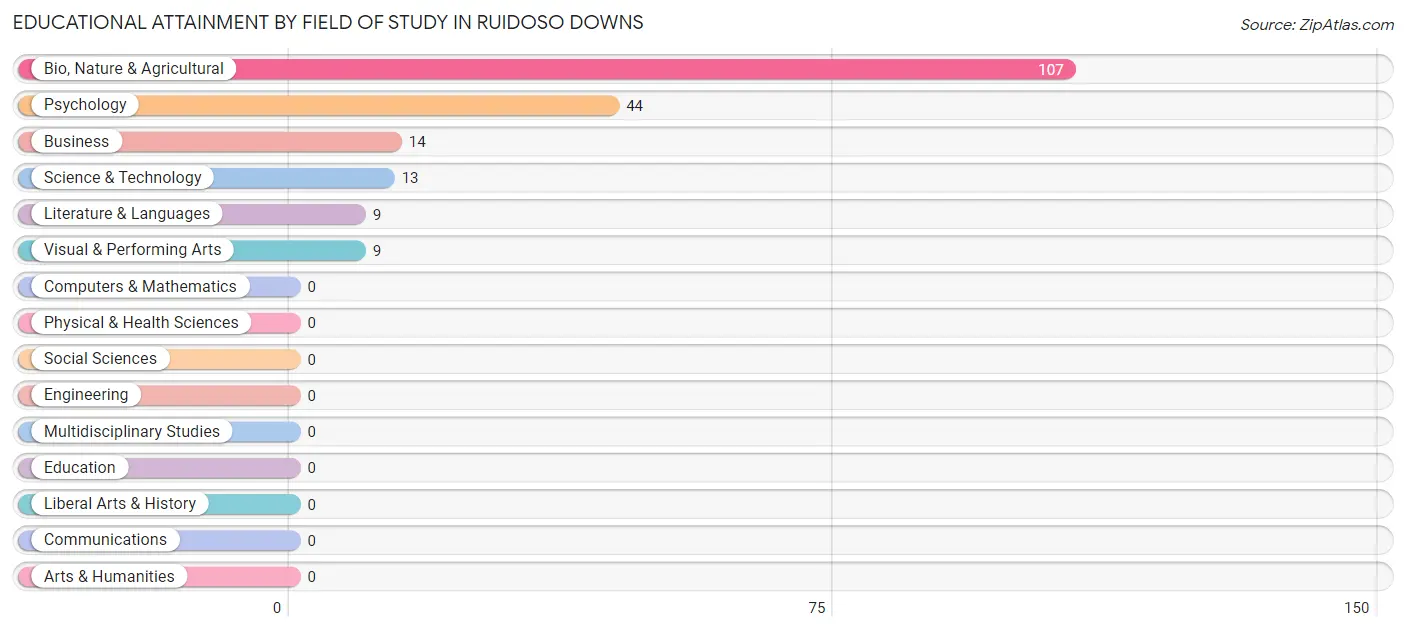
| Field of Study | # Graduates | % Graduates |
| Computers & Mathematics | 0 | 0.0% |
| Bio, Nature & Agricultural | 107 | 54.6% |
| Physical & Health Sciences | 0 | 0.0% |
| Psychology | 44 | 22.5% |
| Social Sciences | 0 | 0.0% |
| Engineering | 0 | 0.0% |
| Multidisciplinary Studies | 0 | 0.0% |
| Science & Technology | 13 | 6.6% |
| Business | 14 | 7.1% |
| Education | 0 | 0.0% |
| Literature & Languages | 9 | 4.6% |
| Liberal Arts & History | 0 | 0.0% |
| Visual & Performing Arts | 9 | 4.6% |
| Communications | 0 | 0.0% |
| Arts & Humanities | 0 | 0.0% |
| Total | 196 | 100.0% |
Transportation & Commute in Ruidoso Downs
Vehicle Availability by Sex in Ruidoso Downs
The most prevalent vehicle ownership categories in Ruidoso Downs are males with 1 vehicle (126, accounting for 40.9%) and females with 1 vehicle (218, making up 18.8%).
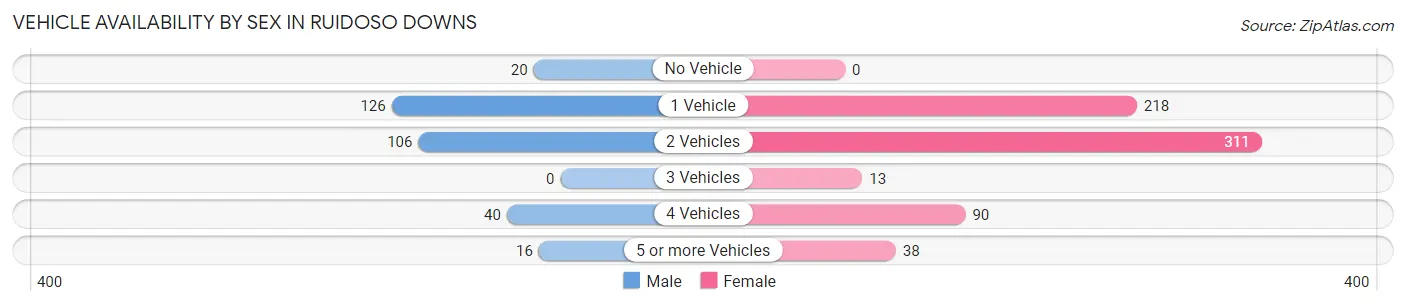
| Vehicles Available | Male | Female |
| No Vehicle | 20 (6.5%) | 0 (0.0%) |
| 1 Vehicle | 126 (40.9%) | 218 (32.5%) |
| 2 Vehicles | 106 (34.4%) | 311 (46.4%) |
| 3 Vehicles | 0 (0.0%) | 13 (1.9%) |
| 4 Vehicles | 40 (13.0%) | 90 (13.4%) |
| 5 or more Vehicles | 16 (5.2%) | 38 (5.7%) |
| Total | 308 (100.0%) | 670 (100.0%) |
Commute Time in Ruidoso Downs
The most frequently occuring commute durations in Ruidoso Downs are 10 to 14 minutes (439 commuters, 47.7%), less than 5 minutes (95 commuters, 10.3%), and 60 to 89 minutes (92 commuters, 10.0%).
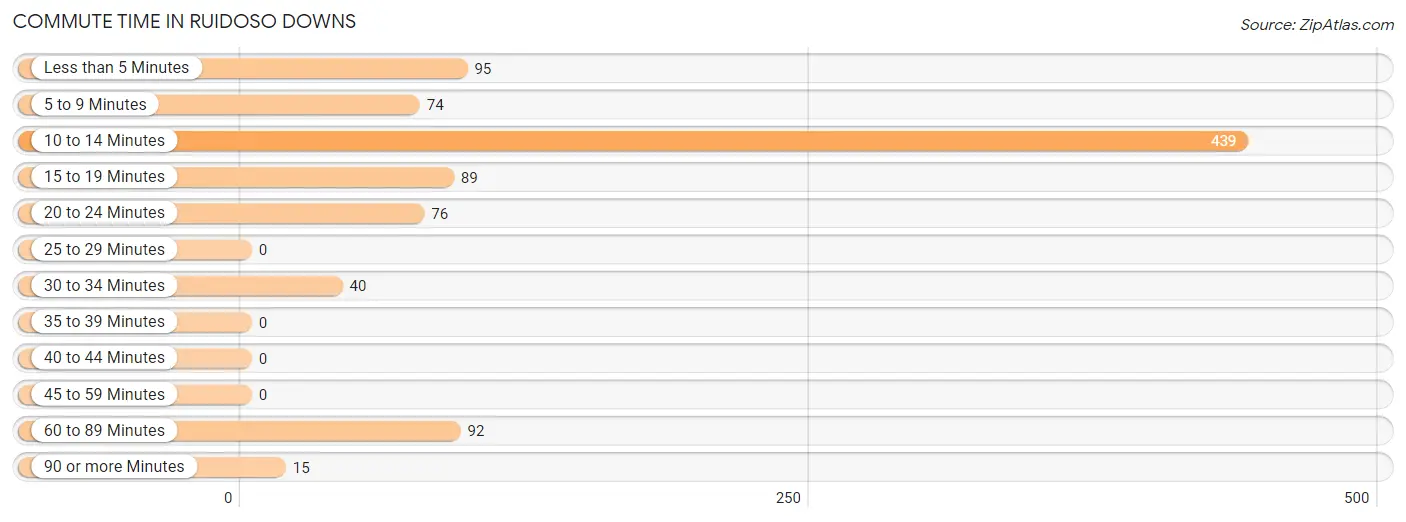
| Commute Time | # Commuters | % Commuters |
| Less than 5 Minutes | 95 | 10.3% |
| 5 to 9 Minutes | 74 | 8.0% |
| 10 to 14 Minutes | 439 | 47.7% |
| 15 to 19 Minutes | 89 | 9.7% |
| 20 to 24 Minutes | 76 | 8.3% |
| 25 to 29 Minutes | 0 | 0.0% |
| 30 to 34 Minutes | 40 | 4.3% |
| 35 to 39 Minutes | 0 | 0.0% |
| 40 to 44 Minutes | 0 | 0.0% |
| 45 to 59 Minutes | 0 | 0.0% |
| 60 to 89 Minutes | 92 | 10.0% |
| 90 or more Minutes | 15 | 1.6% |
Commute Time by Sex in Ruidoso Downs
The most common commute times in Ruidoso Downs are 60 to 89 minutes (92 commuters, 33.6%) for males and 10 to 14 minutes (399 commuters, 61.8%) for females.
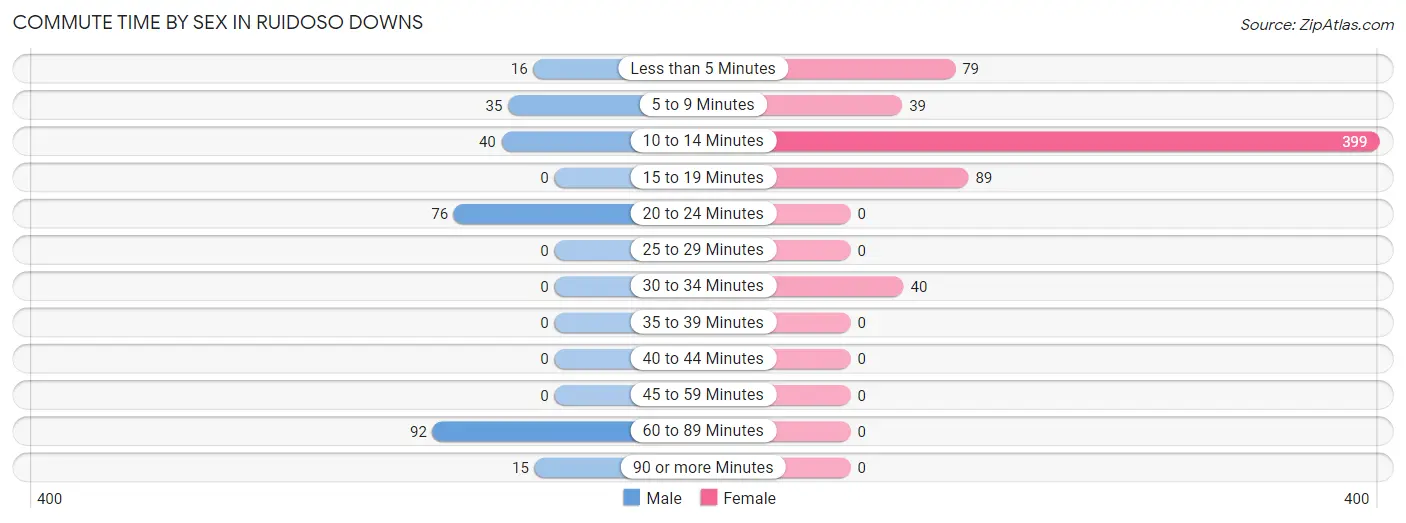
| Commute Time | Male | Female |
| Less than 5 Minutes | 16 (5.8%) | 79 (12.2%) |
| 5 to 9 Minutes | 35 (12.8%) | 39 (6.0%) |
| 10 to 14 Minutes | 40 (14.6%) | 399 (61.8%) |
| 15 to 19 Minutes | 0 (0.0%) | 89 (13.8%) |
| 20 to 24 Minutes | 76 (27.7%) | 0 (0.0%) |
| 25 to 29 Minutes | 0 (0.0%) | 0 (0.0%) |
| 30 to 34 Minutes | 0 (0.0%) | 40 (6.2%) |
| 35 to 39 Minutes | 0 (0.0%) | 0 (0.0%) |
| 40 to 44 Minutes | 0 (0.0%) | 0 (0.0%) |
| 45 to 59 Minutes | 0 (0.0%) | 0 (0.0%) |
| 60 to 89 Minutes | 92 (33.6%) | 0 (0.0%) |
| 90 or more Minutes | 15 (5.5%) | 0 (0.0%) |
Time of Departure to Work by Sex in Ruidoso Downs
The most frequent times of departure to work in Ruidoso Downs are 7:00 AM to 7:29 AM (116, 42.3%) for males and 9:00 AM to 9:59 AM (257, 39.8%) for females.
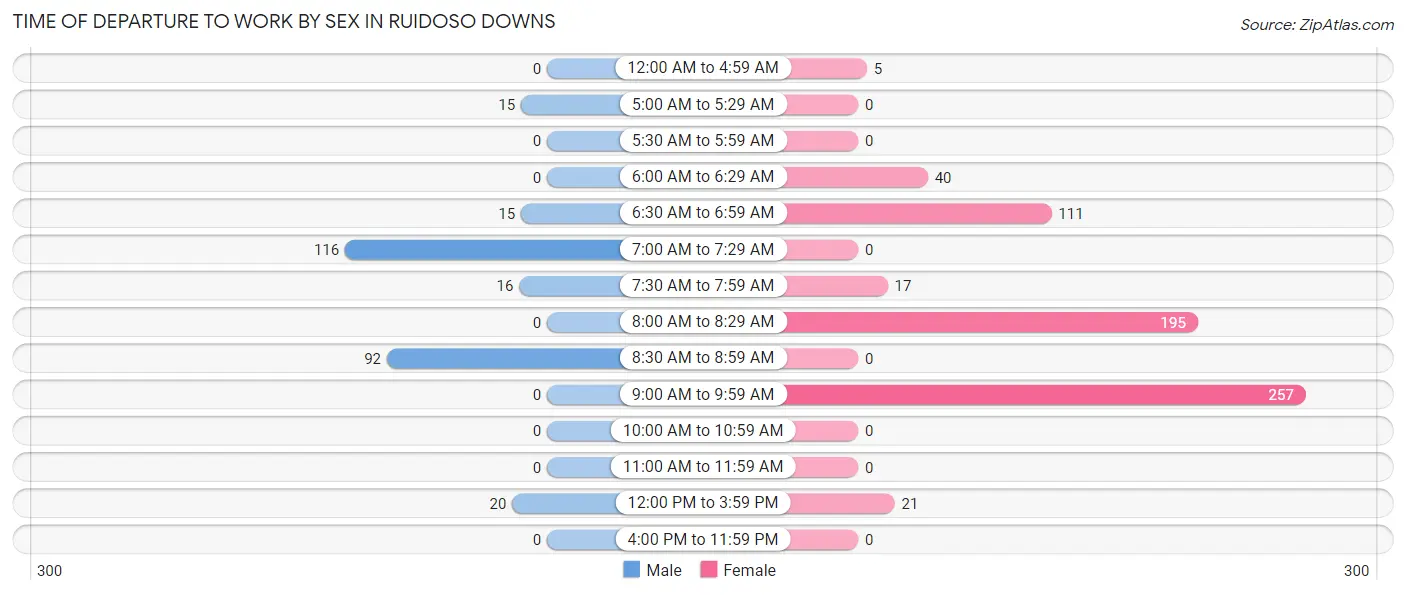
| Time of Departure | Male | Female |
| 12:00 AM to 4:59 AM | 0 (0.0%) | 5 (0.8%) |
| 5:00 AM to 5:29 AM | 15 (5.5%) | 0 (0.0%) |
| 5:30 AM to 5:59 AM | 0 (0.0%) | 0 (0.0%) |
| 6:00 AM to 6:29 AM | 0 (0.0%) | 40 (6.2%) |
| 6:30 AM to 6:59 AM | 15 (5.5%) | 111 (17.2%) |
| 7:00 AM to 7:29 AM | 116 (42.3%) | 0 (0.0%) |
| 7:30 AM to 7:59 AM | 16 (5.8%) | 17 (2.6%) |
| 8:00 AM to 8:29 AM | 0 (0.0%) | 195 (30.2%) |
| 8:30 AM to 8:59 AM | 92 (33.6%) | 0 (0.0%) |
| 9:00 AM to 9:59 AM | 0 (0.0%) | 257 (39.8%) |
| 10:00 AM to 10:59 AM | 0 (0.0%) | 0 (0.0%) |
| 11:00 AM to 11:59 AM | 0 (0.0%) | 0 (0.0%) |
| 12:00 PM to 3:59 PM | 20 (7.3%) | 21 (3.3%) |
| 4:00 PM to 11:59 PM | 0 (0.0%) | 0 (0.0%) |
| Total | 274 (100.0%) | 646 (100.0%) |
Housing Occupancy in Ruidoso Downs
Occupancy by Ownership in Ruidoso Downs
Of the total 978 dwellings in Ruidoso Downs, owner-occupied units account for 620 (63.4%), while renter-occupied units make up 358 (36.6%).
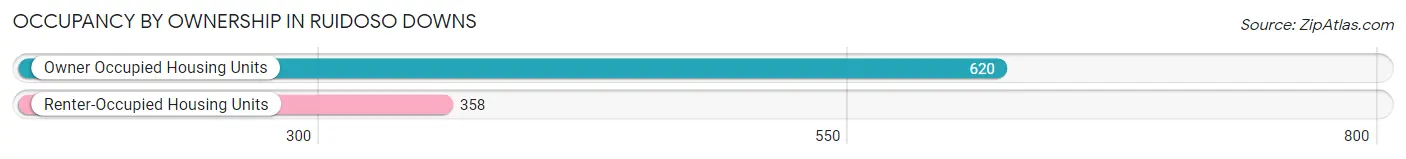
| Occupancy | # Housing Units | % Housing Units |
| Owner Occupied Housing Units | 620 | 63.4% |
| Renter-Occupied Housing Units | 358 | 36.6% |
| Total Occupied Housing Units | 978 | 100.0% |
Occupancy by Household Size in Ruidoso Downs
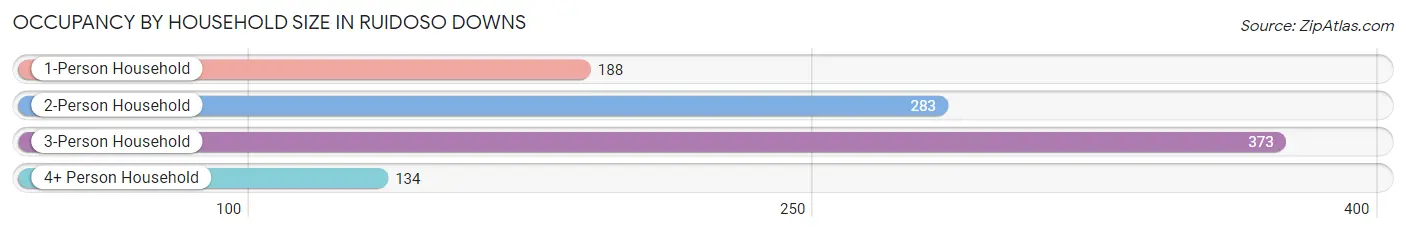
| Household Size | # Housing Units | % Housing Units |
| 1-Person Household | 188 | 19.2% |
| 2-Person Household | 283 | 28.9% |
| 3-Person Household | 373 | 38.1% |
| 4+ Person Household | 134 | 13.7% |
| Total Housing Units | 978 | 100.0% |
Occupancy by Ownership by Household Size in Ruidoso Downs
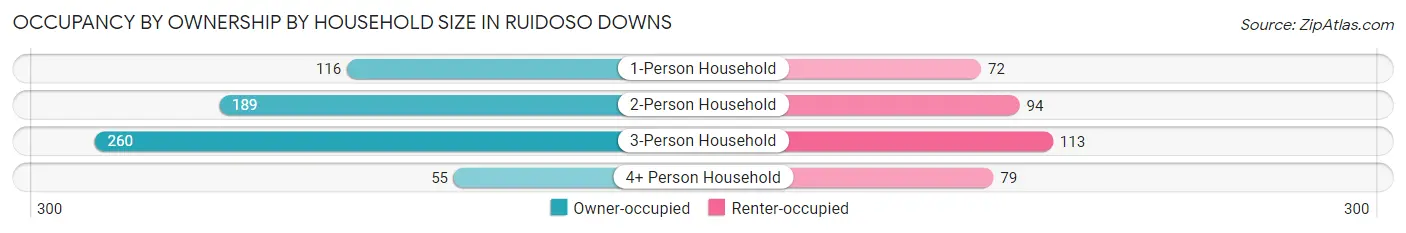
| Household Size | Owner-occupied | Renter-occupied |
| 1-Person Household | 116 (61.7%) | 72 (38.3%) |
| 2-Person Household | 189 (66.8%) | 94 (33.2%) |
| 3-Person Household | 260 (69.7%) | 113 (30.3%) |
| 4+ Person Household | 55 (41.0%) | 79 (59.0%) |
| Total Housing Units | 620 (63.4%) | 358 (36.6%) |
Occupancy by Educational Attainment in Ruidoso Downs
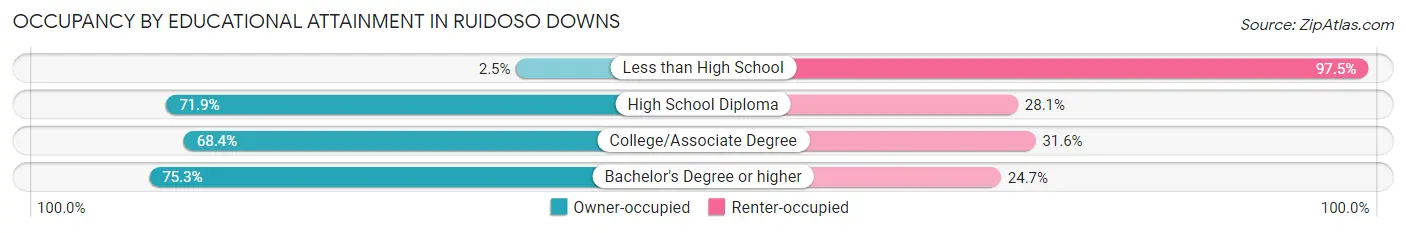
| Household Size | Owner-occupied | Renter-occupied |
| Less than High School | 3 (2.5%) | 117 (97.5%) |
| High School Diploma | 366 (71.9%) | 143 (28.1%) |
| College/Associate Degree | 117 (68.4%) | 54 (31.6%) |
| Bachelor's Degree or higher | 134 (75.3%) | 44 (24.7%) |
Occupancy by Age of Householder in Ruidoso Downs
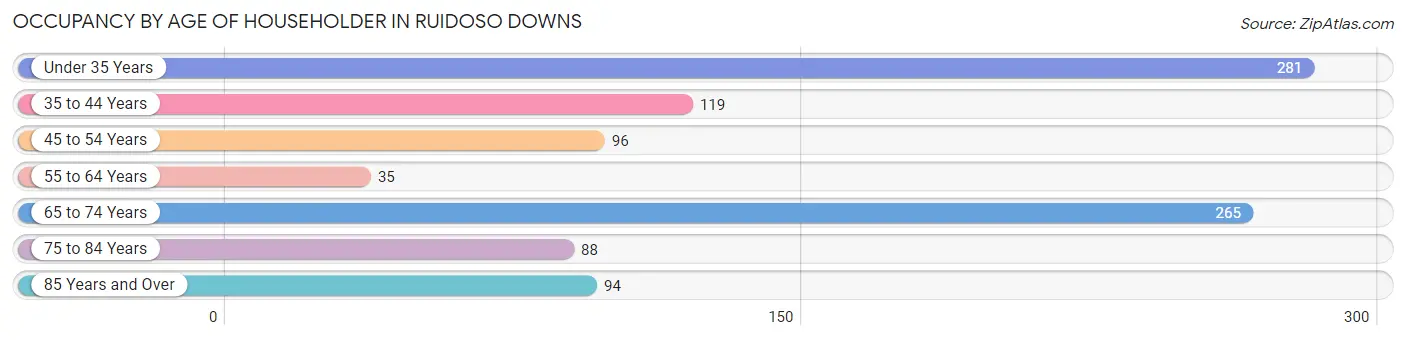
| Age Bracket | # Households | % Households |
| Under 35 Years | 281 | 28.7% |
| 35 to 44 Years | 119 | 12.2% |
| 45 to 54 Years | 96 | 9.8% |
| 55 to 64 Years | 35 | 3.6% |
| 65 to 74 Years | 265 | 27.1% |
| 75 to 84 Years | 88 | 9.0% |
| 85 Years and Over | 94 | 9.6% |
| Total | 978 | 100.0% |
Housing Finances in Ruidoso Downs
Median Income by Occupancy in Ruidoso Downs
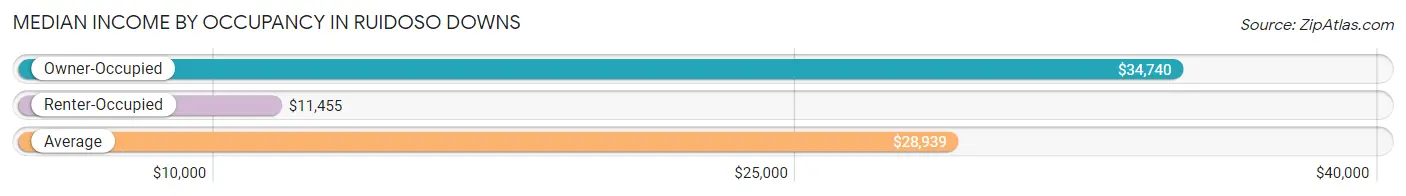
| Occupancy Type | # Households | Median Income |
| Owner-Occupied | 620 (63.4%) | $34,740 |
| Renter-Occupied | 358 (36.6%) | $11,455 |
| Average | 978 (100.0%) | $28,939 |
Occupancy by Householder Income Bracket in Ruidoso Downs
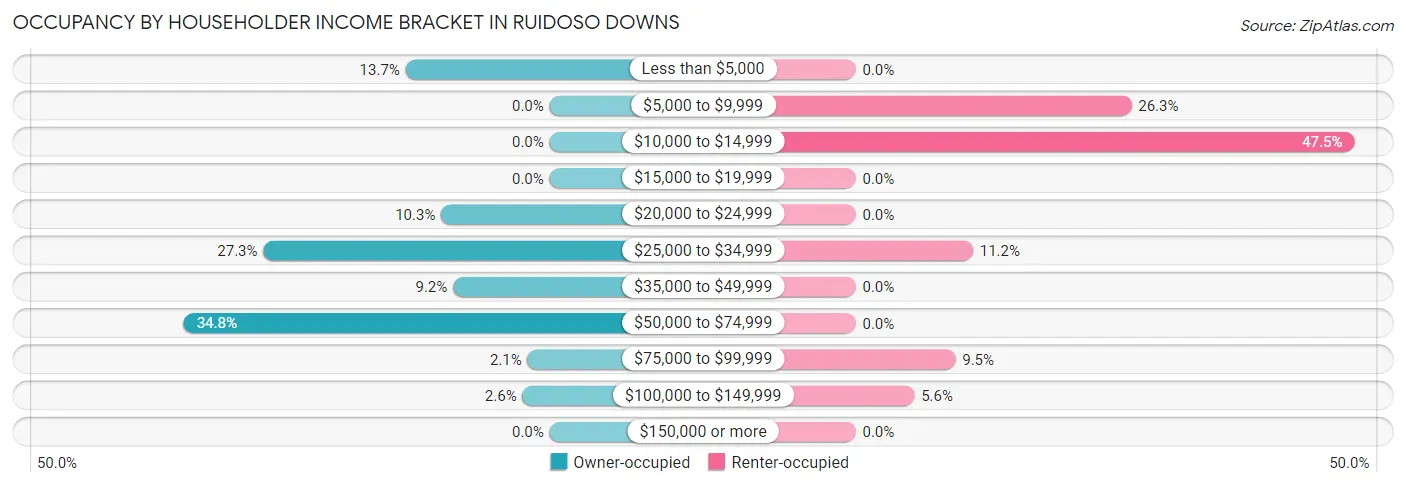
| Income Bracket | Owner-occupied | Renter-occupied |
| Less than $5,000 | 85 (13.7%) | 0 (0.0%) |
| $5,000 to $9,999 | 0 (0.0%) | 94 (26.3%) |
| $10,000 to $14,999 | 0 (0.0%) | 170 (47.5%) |
| $15,000 to $19,999 | 0 (0.0%) | 0 (0.0%) |
| $20,000 to $24,999 | 64 (10.3%) | 0 (0.0%) |
| $25,000 to $34,999 | 169 (27.3%) | 40 (11.2%) |
| $35,000 to $49,999 | 57 (9.2%) | 0 (0.0%) |
| $50,000 to $74,999 | 216 (34.8%) | 0 (0.0%) |
| $75,000 to $99,999 | 13 (2.1%) | 34 (9.5%) |
| $100,000 to $149,999 | 16 (2.6%) | 20 (5.6%) |
| $150,000 or more | 0 (0.0%) | 0 (0.0%) |
| Total | 620 (100.0%) | 358 (100.0%) |
Monthly Housing Cost Tiers in Ruidoso Downs
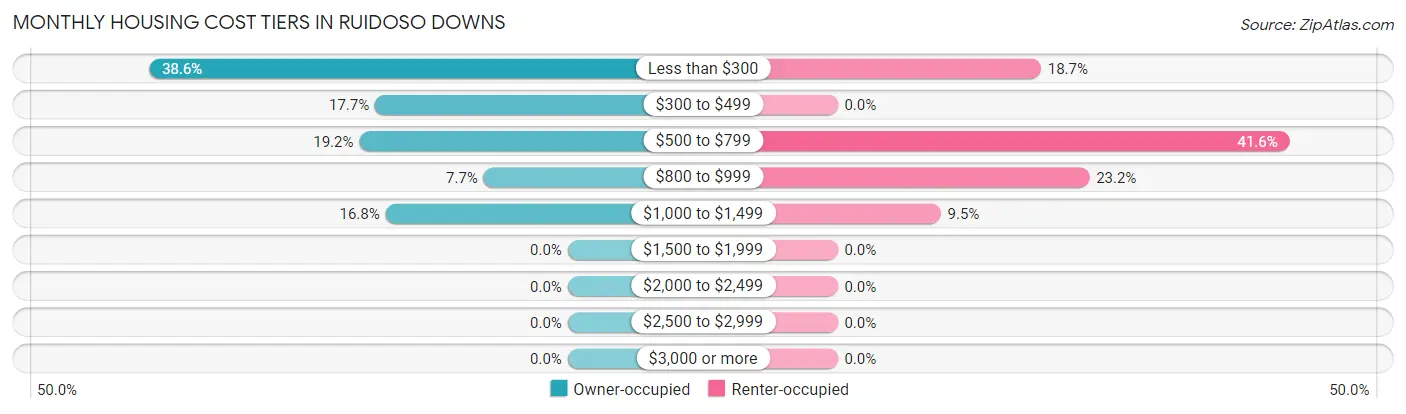
| Monthly Cost | Owner-occupied | Renter-occupied |
| Less than $300 | 239 (38.6%) | 67 (18.7%) |
| $300 to $499 | 110 (17.7%) | 0 (0.0%) |
| $500 to $799 | 119 (19.2%) | 149 (41.6%) |
| $800 to $999 | 48 (7.7%) | 83 (23.2%) |
| $1,000 to $1,499 | 104 (16.8%) | 34 (9.5%) |
| $1,500 to $1,999 | 0 (0.0%) | 0 (0.0%) |
| $2,000 to $2,499 | 0 (0.0%) | 0 (0.0%) |
| $2,500 to $2,999 | 0 (0.0%) | 0 (0.0%) |
| $3,000 or more | 0 (0.0%) | 0 (0.0%) |
| Total | 620 (100.0%) | 358 (100.0%) |
Physical Housing Characteristics in Ruidoso Downs
Housing Structures in Ruidoso Downs
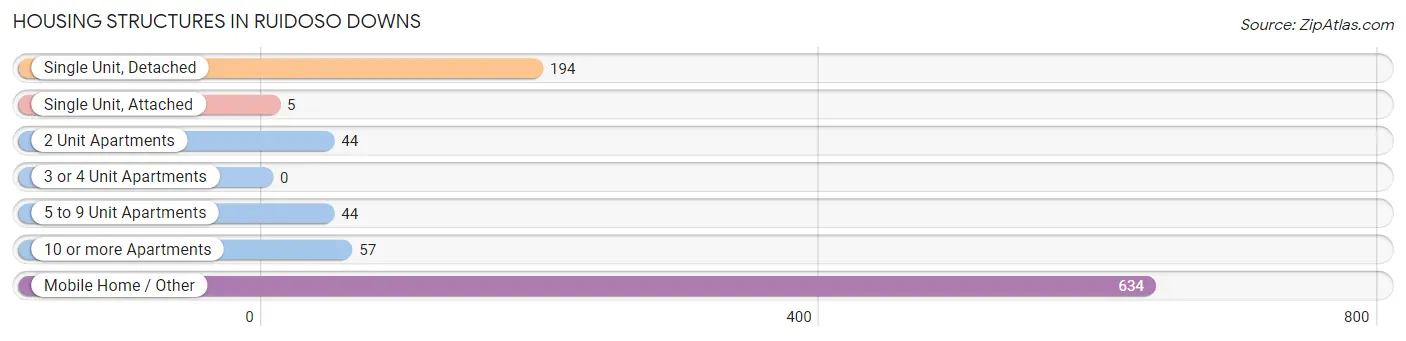
| Structure Type | # Housing Units | % Housing Units |
| Single Unit, Detached | 194 | 19.8% |
| Single Unit, Attached | 5 | 0.5% |
| 2 Unit Apartments | 44 | 4.5% |
| 3 or 4 Unit Apartments | 0 | 0.0% |
| 5 to 9 Unit Apartments | 44 | 4.5% |
| 10 or more Apartments | 57 | 5.8% |
| Mobile Home / Other | 634 | 64.8% |
| Total | 978 | 100.0% |
Housing Structures by Occupancy in Ruidoso Downs
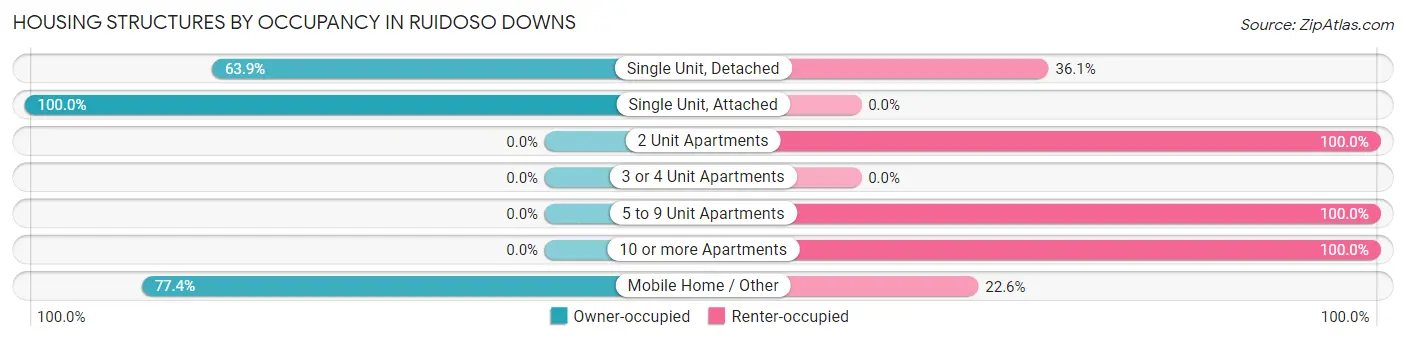
| Structure Type | Owner-occupied | Renter-occupied |
| Single Unit, Detached | 124 (63.9%) | 70 (36.1%) |
| Single Unit, Attached | 5 (100.0%) | 0 (0.0%) |
| 2 Unit Apartments | 0 (0.0%) | 44 (100.0%) |
| 3 or 4 Unit Apartments | 0 (0.0%) | 0 (0.0%) |
| 5 to 9 Unit Apartments | 0 (0.0%) | 44 (100.0%) |
| 10 or more Apartments | 0 (0.0%) | 57 (100.0%) |
| Mobile Home / Other | 491 (77.4%) | 143 (22.6%) |
| Total | 620 (63.4%) | 358 (36.6%) |
Housing Structures by Number of Rooms in Ruidoso Downs
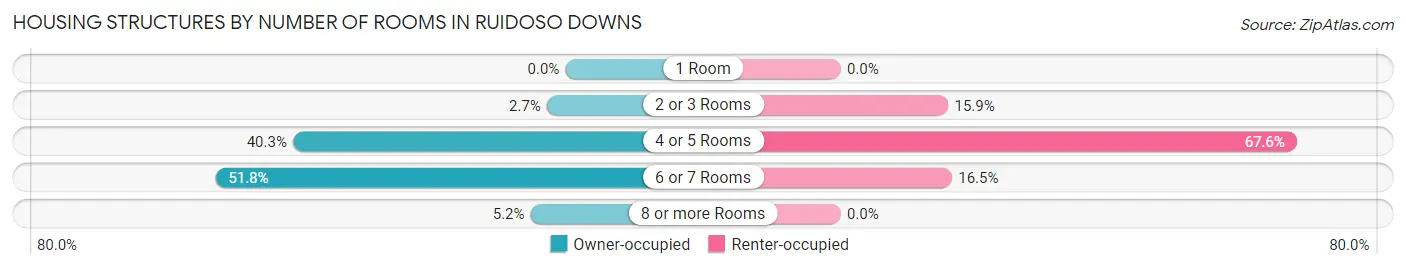
| Number of Rooms | Owner-occupied | Renter-occupied |
| 1 Room | 0 (0.0%) | 0 (0.0%) |
| 2 or 3 Rooms | 17 (2.7%) | 57 (15.9%) |
| 4 or 5 Rooms | 250 (40.3%) | 242 (67.6%) |
| 6 or 7 Rooms | 321 (51.8%) | 59 (16.5%) |
| 8 or more Rooms | 32 (5.2%) | 0 (0.0%) |
| Total | 620 (100.0%) | 358 (100.0%) |
Housing Structure by Heating Type in Ruidoso Downs
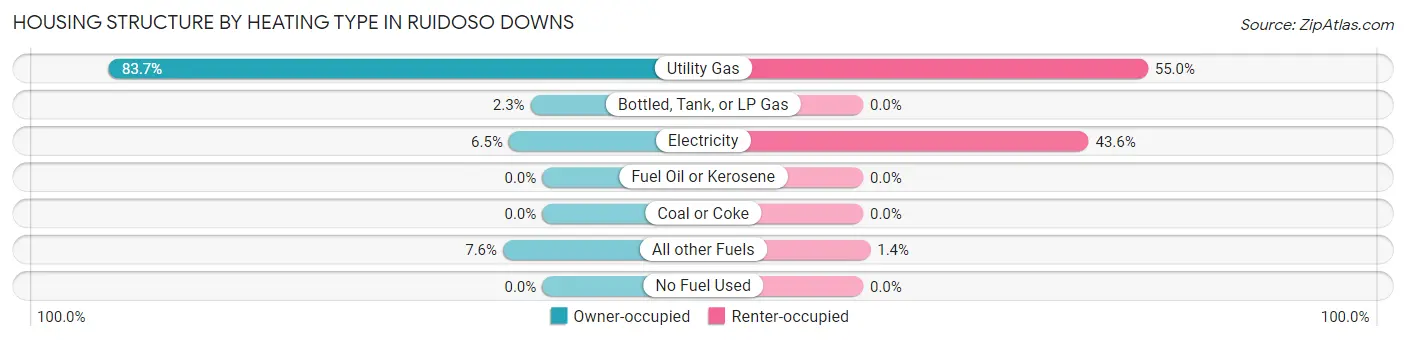
| Heating Type | Owner-occupied | Renter-occupied |
| Utility Gas | 519 (83.7%) | 197 (55.0%) |
| Bottled, Tank, or LP Gas | 14 (2.3%) | 0 (0.0%) |
| Electricity | 40 (6.5%) | 156 (43.6%) |
| Fuel Oil or Kerosene | 0 (0.0%) | 0 (0.0%) |
| Coal or Coke | 0 (0.0%) | 0 (0.0%) |
| All other Fuels | 47 (7.6%) | 5 (1.4%) |
| No Fuel Used | 0 (0.0%) | 0 (0.0%) |
| Total | 620 (100.0%) | 358 (100.0%) |
Household Vehicle Usage in Ruidoso Downs
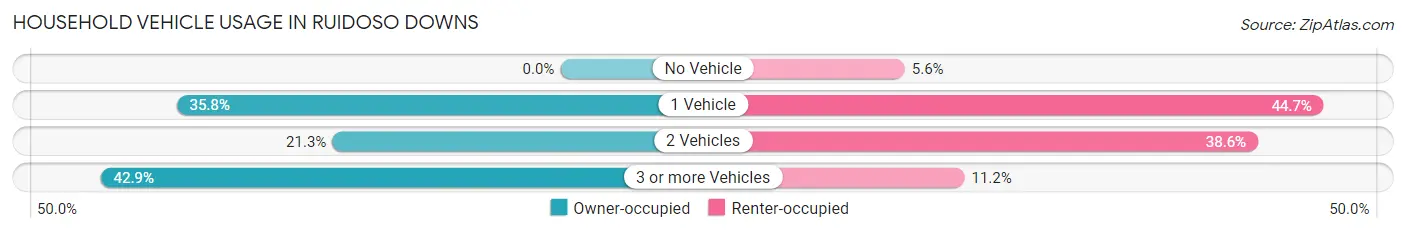
| Vehicles per Household | Owner-occupied | Renter-occupied |
| No Vehicle | 0 (0.0%) | 20 (5.6%) |
| 1 Vehicle | 222 (35.8%) | 160 (44.7%) |
| 2 Vehicles | 132 (21.3%) | 138 (38.6%) |
| 3 or more Vehicles | 266 (42.9%) | 40 (11.2%) |
| Total | 620 (100.0%) | 358 (100.0%) |
Real Estate & Mortgages in Ruidoso Downs
Real Estate and Mortgage Overview in Ruidoso Downs
| Characteristic | Without Mortgage | With Mortgage |
| Housing Units | 407 | 213 |
| Median Property Value | - | - |
| Median Household Income | $50,594 | $0 |
| Monthly Housing Costs | $238 | $0 |
| Real Estate Taxes | $319 | $72 |
Property Value by Mortgage Status in Ruidoso Downs
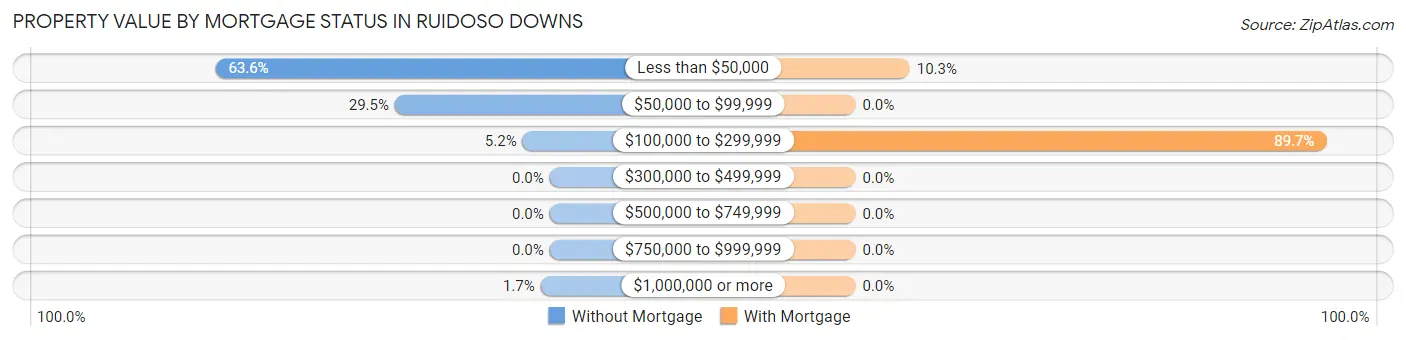
| Property Value | Without Mortgage | With Mortgage |
| Less than $50,000 | 259 (63.6%) | 22 (10.3%) |
| $50,000 to $99,999 | 120 (29.5%) | 0 (0.0%) |
| $100,000 to $299,999 | 21 (5.2%) | 191 (89.7%) |
| $300,000 to $499,999 | 0 (0.0%) | 0 (0.0%) |
| $500,000 to $749,999 | 0 (0.0%) | 0 (0.0%) |
| $750,000 to $999,999 | 0 (0.0%) | 0 (0.0%) |
| $1,000,000 or more | 7 (1.7%) | 0 (0.0%) |
| Total | 407 (100.0%) | 213 (100.0%) |
Household Income by Mortgage Status in Ruidoso Downs
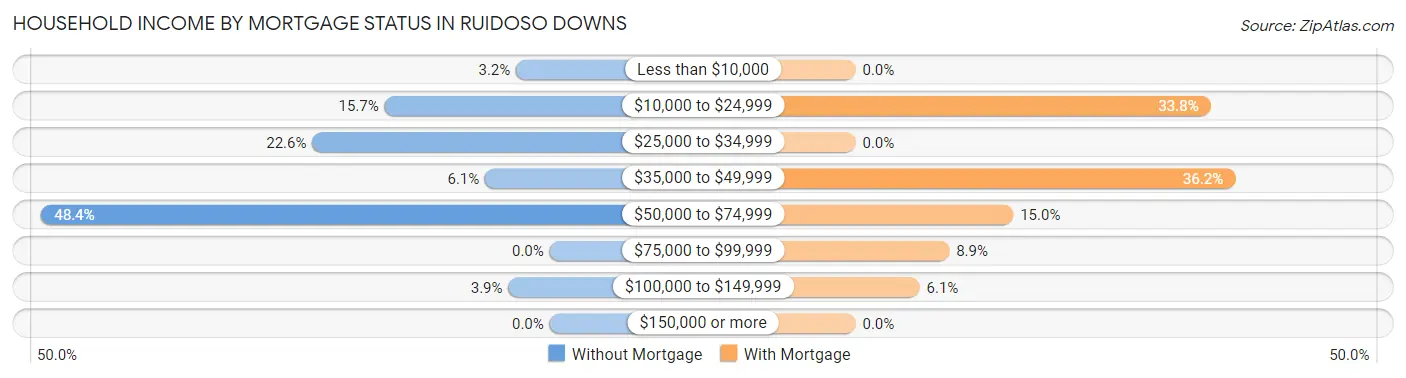
| Household Income | Without Mortgage | With Mortgage |
| Less than $10,000 | 13 (3.2%) | 0 (0.0%) |
| $10,000 to $24,999 | 64 (15.7%) | 72 (33.8%) |
| $25,000 to $34,999 | 92 (22.6%) | 0 (0.0%) |
| $35,000 to $49,999 | 25 (6.1%) | 77 (36.1%) |
| $50,000 to $74,999 | 197 (48.4%) | 32 (15.0%) |
| $75,000 to $99,999 | 0 (0.0%) | 19 (8.9%) |
| $100,000 to $149,999 | 16 (3.9%) | 13 (6.1%) |
| $150,000 or more | 0 (0.0%) | 0 (0.0%) |
| Total | 407 (100.0%) | 213 (100.0%) |
Property Value to Household Income Ratio in Ruidoso Downs
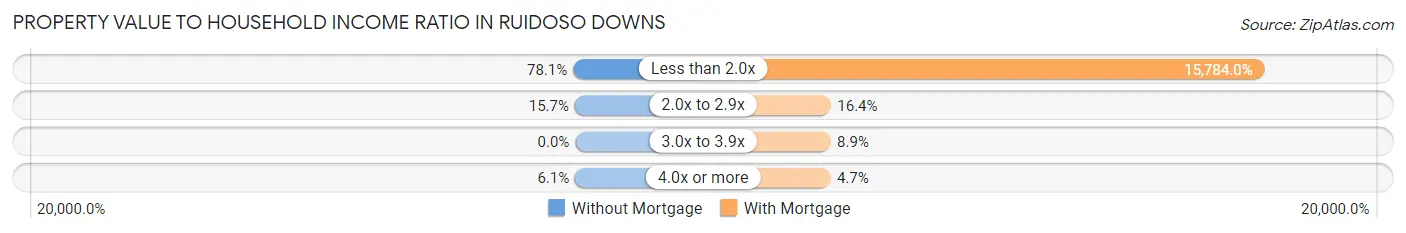
| Value-to-Income Ratio | Without Mortgage | With Mortgage |
| Less than 2.0x | 318 (78.1%) | 33,620 (15,784.0%) |
| 2.0x to 2.9x | 64 (15.7%) | 35 (16.4%) |
| 3.0x to 3.9x | 0 (0.0%) | 19 (8.9%) |
| 4.0x or more | 25 (6.1%) | 10 (4.7%) |
| Total | 407 (100.0%) | 213 (100.0%) |
Real Estate Taxes by Mortgage Status in Ruidoso Downs
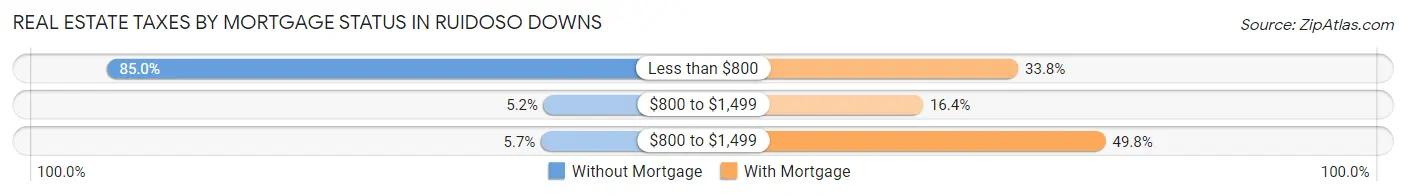
| Property Taxes | Without Mortgage | With Mortgage |
| Less than $800 | 346 (85.0%) | 72 (33.8%) |
| $800 to $1,499 | 21 (5.2%) | 35 (16.4%) |
| $800 to $1,499 | 23 (5.7%) | 106 (49.8%) |
| Total | 407 (100.0%) | 213 (100.0%) |
Health & Disability in Ruidoso Downs
Health Insurance Coverage by Age in Ruidoso Downs
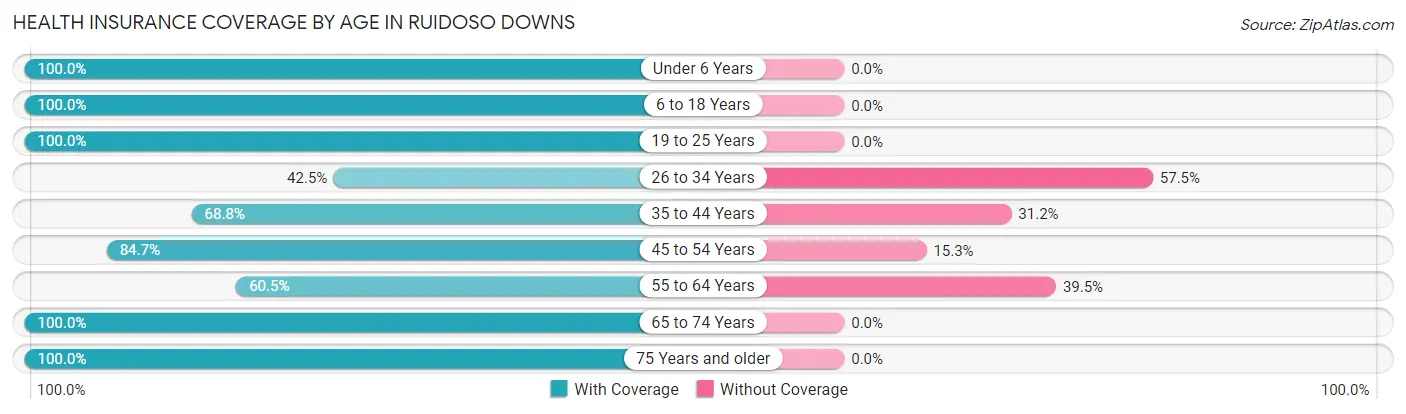
| Age Bracket | With Coverage | Without Coverage |
| Under 6 Years | 176 (100.0%) | 0 (0.0%) |
| 6 to 18 Years | 338 (100.0%) | 0 (0.0%) |
| 19 to 25 Years | 284 (100.0%) | 0 (0.0%) |
| 26 to 34 Years | 197 (42.5%) | 267 (57.5%) |
| 35 to 44 Years | 137 (68.8%) | 62 (31.2%) |
| 45 to 54 Years | 188 (84.7%) | 34 (15.3%) |
| 55 to 64 Years | 138 (60.5%) | 90 (39.5%) |
| 65 to 74 Years | 458 (100.0%) | 0 (0.0%) |
| 75 Years and older | 266 (100.0%) | 0 (0.0%) |
| Total | 2,182 (82.8%) | 453 (17.2%) |
Health Insurance Coverage by Citizenship Status in Ruidoso Downs
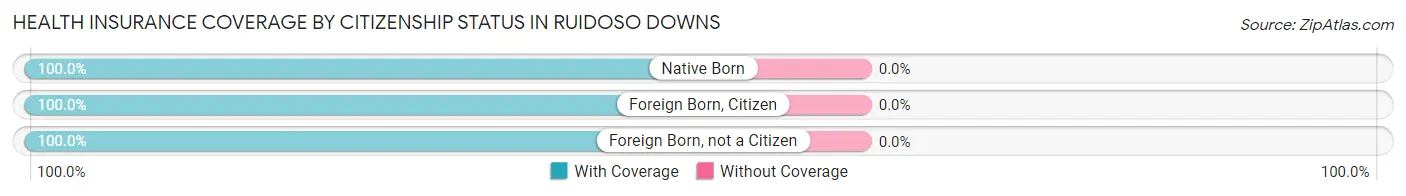
| Citizenship Status | With Coverage | Without Coverage |
| Native Born | 176 (100.0%) | 0 (0.0%) |
| Foreign Born, Citizen | 338 (100.0%) | 0 (0.0%) |
| Foreign Born, not a Citizen | 284 (100.0%) | 0 (0.0%) |
Health Insurance Coverage by Household Income in Ruidoso Downs
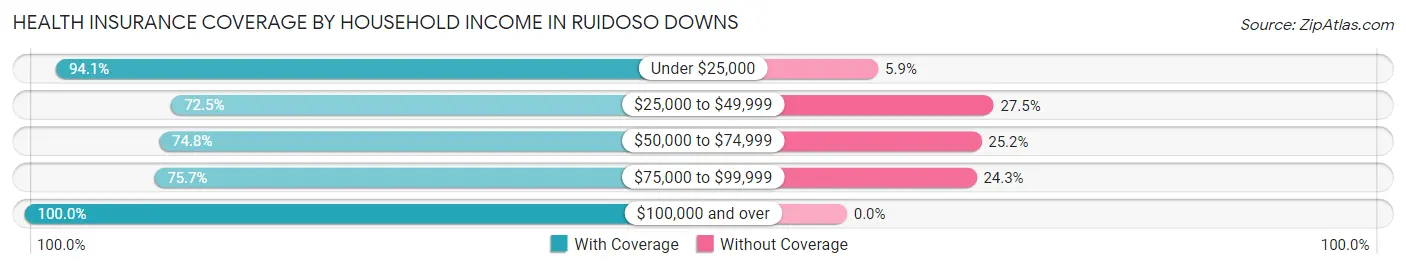
| Household Income | With Coverage | Without Coverage |
| Under $25,000 | 993 (94.1%) | 62 (5.9%) |
| $25,000 to $49,999 | 520 (72.5%) | 197 (27.5%) |
| $50,000 to $74,999 | 475 (74.8%) | 160 (25.2%) |
| $75,000 to $99,999 | 106 (75.7%) | 34 (24.3%) |
| $100,000 and over | 88 (100.0%) | 0 (0.0%) |
Public vs Private Health Insurance Coverage by Age in Ruidoso Downs
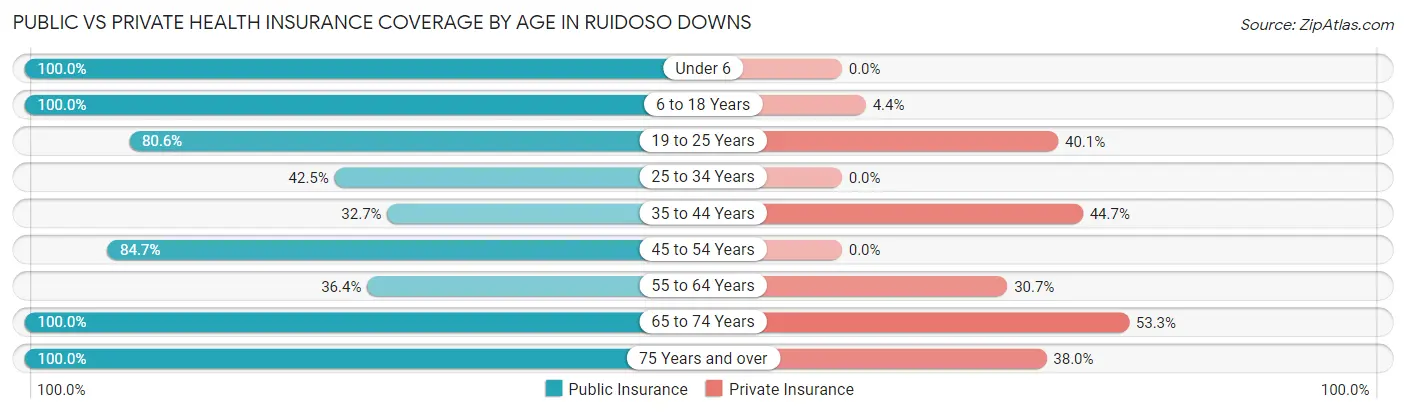
| Age Bracket | Public Insurance | Private Insurance |
| Under 6 | 176 (100.0%) | 0 (0.0%) |
| 6 to 18 Years | 338 (100.0%) | 15 (4.4%) |
| 19 to 25 Years | 229 (80.6%) | 114 (40.1%) |
| 25 to 34 Years | 197 (42.5%) | 0 (0.0%) |
| 35 to 44 Years | 65 (32.7%) | 89 (44.7%) |
| 45 to 54 Years | 188 (84.7%) | 0 (0.0%) |
| 55 to 64 Years | 83 (36.4%) | 70 (30.7%) |
| 65 to 74 Years | 458 (100.0%) | 244 (53.3%) |
| 75 Years and over | 266 (100.0%) | 101 (38.0%) |
| Total | 2,000 (75.9%) | 633 (24.0%) |
Disability Status by Sex by Age in Ruidoso Downs
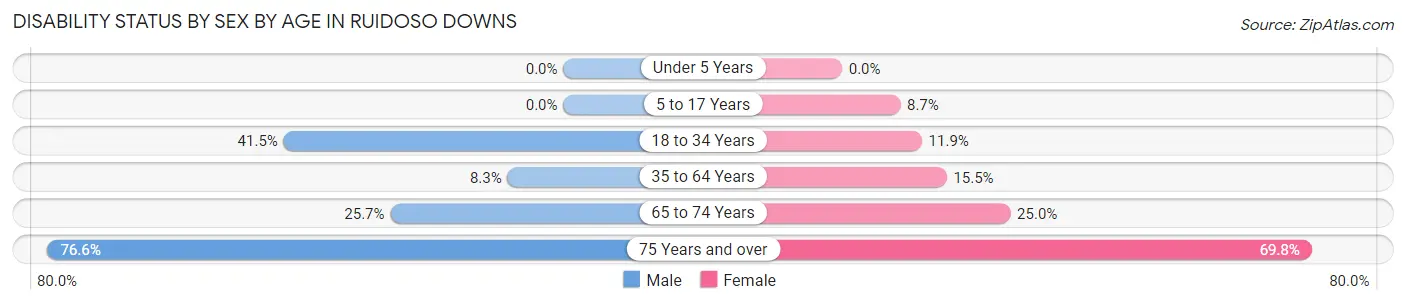
| Age Bracket | Male | Female |
| Under 5 Years | 0 (0.0%) | 0 (0.0%) |
| 5 to 17 Years | 0 (0.0%) | 30 (8.6%) |
| 18 to 34 Years | 76 (41.5%) | 67 (11.9%) |
| 35 to 64 Years | 33 (8.3%) | 39 (15.5%) |
| 65 to 74 Years | 56 (25.7%) | 60 (25.0%) |
| 75 Years and over | 72 (76.6%) | 120 (69.8%) |
Disability Class by Sex by Age in Ruidoso Downs
Disability Class: Hearing Difficulty
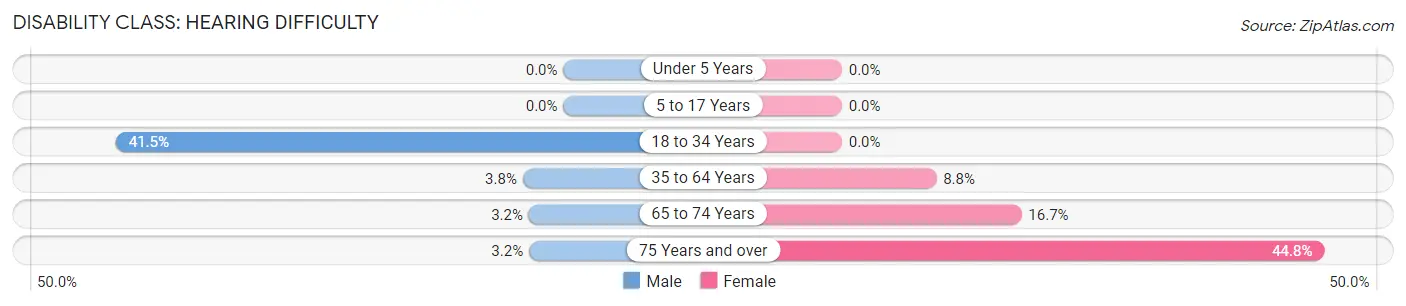
| Age Bracket | Male | Female |
| Under 5 Years | 0 (0.0%) | 0 (0.0%) |
| 5 to 17 Years | 0 (0.0%) | 0 (0.0%) |
| 18 to 34 Years | 76 (41.5%) | 0 (0.0%) |
| 35 to 64 Years | 15 (3.8%) | 22 (8.8%) |
| 65 to 74 Years | 7 (3.2%) | 40 (16.7%) |
| 75 Years and over | 3 (3.2%) | 77 (44.8%) |
Disability Class: Vision Difficulty
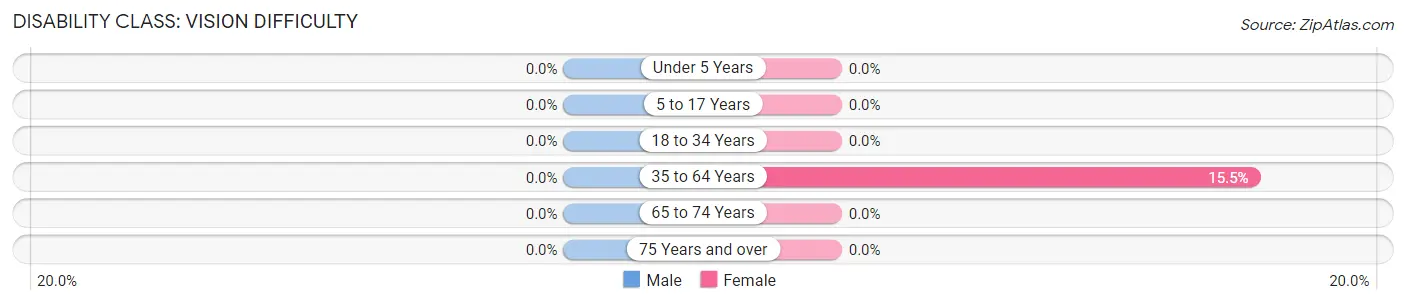
| Age Bracket | Male | Female |
| Under 5 Years | 0 (0.0%) | 0 (0.0%) |
| 5 to 17 Years | 0 (0.0%) | 0 (0.0%) |
| 18 to 34 Years | 0 (0.0%) | 0 (0.0%) |
| 35 to 64 Years | 0 (0.0%) | 39 (15.5%) |
| 65 to 74 Years | 0 (0.0%) | 0 (0.0%) |
| 75 Years and over | 0 (0.0%) | 0 (0.0%) |
Disability Class: Cognitive Difficulty
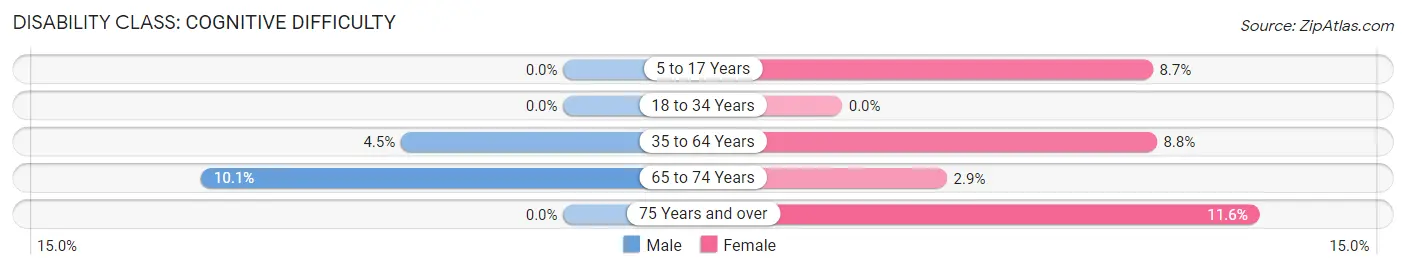
| Age Bracket | Male | Female |
| 5 to 17 Years | 0 (0.0%) | 30 (8.6%) |
| 18 to 34 Years | 0 (0.0%) | 0 (0.0%) |
| 35 to 64 Years | 18 (4.5%) | 22 (8.8%) |
| 65 to 74 Years | 22 (10.1%) | 7 (2.9%) |
| 75 Years and over | 0 (0.0%) | 20 (11.6%) |
Disability Class: Ambulatory Difficulty
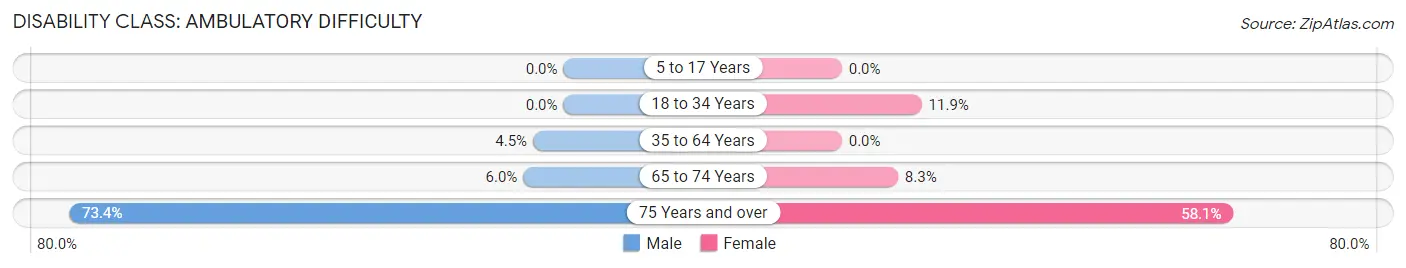
| Age Bracket | Male | Female |
| 5 to 17 Years | 0 (0.0%) | 0 (0.0%) |
| 18 to 34 Years | 0 (0.0%) | 67 (11.9%) |
| 35 to 64 Years | 18 (4.5%) | 0 (0.0%) |
| 65 to 74 Years | 13 (6.0%) | 20 (8.3%) |
| 75 Years and over | 69 (73.4%) | 100 (58.1%) |
Disability Class: Self-Care Difficulty
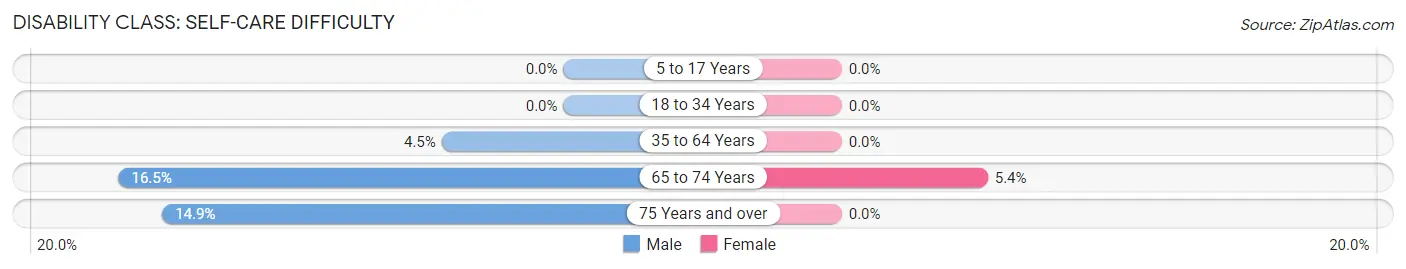
| Age Bracket | Male | Female |
| 5 to 17 Years | 0 (0.0%) | 0 (0.0%) |
| 18 to 34 Years | 0 (0.0%) | 0 (0.0%) |
| 35 to 64 Years | 18 (4.5%) | 0 (0.0%) |
| 65 to 74 Years | 36 (16.5%) | 13 (5.4%) |
| 75 Years and over | 14 (14.9%) | 0 (0.0%) |
Technology Access in Ruidoso Downs
Computing Device Access in Ruidoso Downs
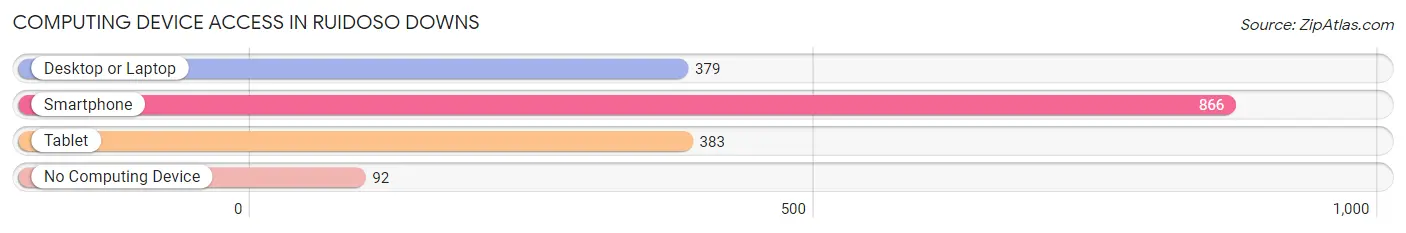
| Device Type | # Households | % Households |
| Desktop or Laptop | 379 | 38.8% |
| Smartphone | 866 | 88.5% |
| Tablet | 383 | 39.2% |
| No Computing Device | 92 | 9.4% |
| Total | 978 | 100.0% |
Internet Access in Ruidoso Downs
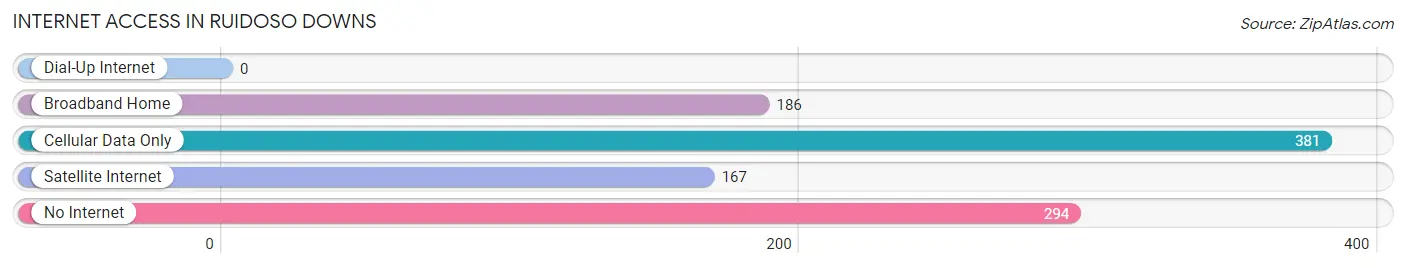
| Internet Type | # Households | % Households |
| Dial-Up Internet | 0 | 0.0% |
| Broadband Home | 186 | 19.0% |
| Cellular Data Only | 381 | 39.0% |
| Satellite Internet | 167 | 17.1% |
| No Internet | 294 | 30.1% |
| Total | 978 | 100.0% |
Ruidoso Downs Summary
Ruidoso Downs is a small city located in Lincoln County, New Mexico. It is situated in the Sacramento Mountains, approximately 30 miles from the city of Alamogordo. The city is known for its horse racing, and is home to the Ruidoso Downs Race Track, which hosts the All American Futurity, the world’s richest quarter horse race. The city has a population of 1,811 as of the 2010 census.
Geography
Ruidoso Downs is located in the Sacramento Mountains, at an elevation of 6,890 feet. The city is situated in the Chihuahuan Desert, and is surrounded by the Lincoln National Forest. The city is located approximately 30 miles from the city of Alamogordo, and is approximately a two-hour drive from El Paso, Texas.
The climate in Ruidoso Downs is semi-arid, with hot summers and cold winters. The average high temperature in the summer is 85°F, and the average low temperature in the winter is 25°F. The city receives an average of 16 inches of precipitation per year.
Economy
The economy of Ruidoso Downs is largely based on tourism. The city is home to the Ruidoso Downs Race Track, which hosts the All American Futurity, the world’s richest quarter horse race. The race track also hosts other horse racing events throughout the year. The city is also home to the Ruidoso Downs Casino, which offers gaming, dining, and entertainment.
In addition to tourism, the city is also home to several small businesses, including restaurants, retail stores, and service providers. The city is also home to several manufacturing companies, including a furniture manufacturer and a plastics manufacturer.
Demographics
As of the 2010 census, the population of Ruidoso Downs was 1,811. The racial makeup of the city was 81.3% White, 0.7% African American, 1.2% Native American, 0.2% Asian, 0.1% Pacific Islander, 14.2% from other races, and 2.5% from two or more races. Hispanic or Latino of any race were 33.2% of the population.
The median household income in Ruidoso Downs was $37,917, and the median family income was $45,000. The per capita income for the city was $20,845. About 16.2% of families and 19.2% of the population were below the poverty line, including 25.2% of those under age 18 and 10.2% of those age 65 or over.
History
Ruidoso Downs was founded in the late 19th century by ranchers and farmers. The city was named after the nearby Ruidoso River, which was named by the Spanish for its “noisy” rapids. The city was incorporated in 1948.
In the 1950s, the city began to develop as a tourist destination. The Ruidoso Downs Race Track was built in 1955, and the All American Futurity, the world’s richest quarter horse race, was first held in 1959. The Ruidoso Downs Casino was opened in 1996.
Today, Ruidoso Downs is a popular tourist destination, known for its horse racing and casino. The city is also home to several small businesses, and is a popular destination for outdoor recreation.
Common Questions
What is Per Capita Income in Ruidoso Downs?
Per Capita income in Ruidoso Downs is $14,061.
What is the Median Family Income in Ruidoso Downs?
Median Family Income in Ruidoso Downs is $33,442.
What is the Median Household income in Ruidoso Downs?
Median Household Income in Ruidoso Downs is $28,939.
What is Income or Wage Gap in Ruidoso Downs?
Income or Wage Gap in Ruidoso Downs is 40.4%.
Women in Ruidoso Downs earn 59.6 cents for every dollar earned by a man.
What is Family Income Deficit in Ruidoso Downs?
Family Income Deficit in Ruidoso Downs is $15,045.
Families that are below poverty line in Ruidoso Downs earn $15,045 less on average than the poverty threshold level.
What is Inequality or Gini Index in Ruidoso Downs?
Inequality or Gini Index in Ruidoso Downs is 0.45.
What is the Total Population of Ruidoso Downs?
Total Population of Ruidoso Downs is 2,635.
What is the Total Male Population of Ruidoso Downs?
Total Male Population of Ruidoso Downs is 1,035.
What is the Total Female Population of Ruidoso Downs?
Total Female Population of Ruidoso Downs is 1,600.
What is the Ratio of Males per 100 Females in Ruidoso Downs?
There are 64.69 Males per 100 Females in Ruidoso Downs.
What is the Ratio of Females per 100 Males in Ruidoso Downs?
There are 154.59 Females per 100 Males in Ruidoso Downs.
What is the Median Population Age in Ruidoso Downs?
Median Population Age in Ruidoso Downs is 35.9 Years.
What is the Average Family Size in Ruidoso Downs
Average Family Size in Ruidoso Downs is 3.1 People.
What is the Average Household Size in Ruidoso Downs
Average Household Size in Ruidoso Downs is 2.7 People.
How Large is the Labor Force in Ruidoso Downs?
There are 1,048 People in the Labor Forcein in Ruidoso Downs.
What is the Percentage of People in the Labor Force in Ruidoso Downs?
48.7% of People are in the Labor Force in Ruidoso Downs.
What is the Unemployment Rate in Ruidoso Downs?
Unemployment Rate in Ruidoso Downs is 2.0%.