Rowe, NM Map & Demographics
Rowe Map
Rowe Overview
$21,203
PER CAPITA INCOME
$91,333
AVG FAMILY INCOME
$90,708
AVG HOUSEHOLD INCOME
0.28
INEQUALITY / GINI INDEX
582
TOTAL POPULATION
428
MALE POPULATION
154
FEMALE POPULATION
277.92
MALES / 100 FEMALES
35.98
FEMALES / 100 MALES
36.2
MEDIAN AGE
5.2
AVG FAMILY SIZE
4.7
AVG HOUSEHOLD SIZE
274
LABOR FORCE [ PEOPLE ]
57.4%
PERCENT IN LABOR FORCE
Rowe Zip Codes
Rowe Area Codes
Income in Rowe
Income Overview in Rowe
Per Capita Income in Rowe is $21,203, while median incomes of families and households are $91,333 and $90,708 respectively.
| Characteristic | Number | Measure |
| Per Capita Income | 582 | $21,203 |
| Median Family Income | 110 | $91,333 |
| Mean Family Income | 110 | $83,548 |
| Median Household Income | 125 | $90,708 |
| Mean Household Income | 125 | $79,394 |
| Income Deficit | 110 | $0 |
| Wage / Income Gap (%) | 582 | 0.00% |
| Wage / Income Gap ($) | 582 | 100.00¢ per $1 |
| Gini / Inequality Index | 582 | 0.28 |
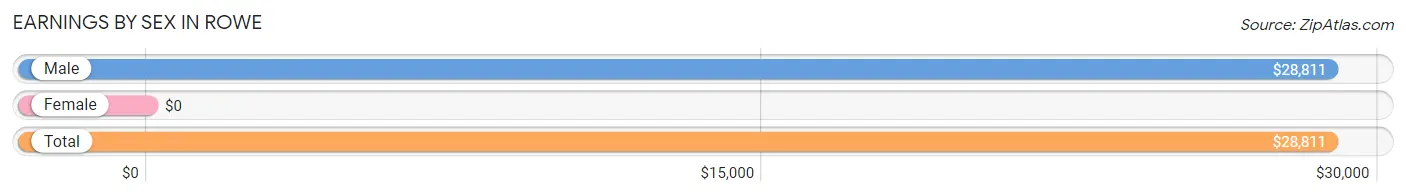
Earnings by Sex in Rowe
| Sex | Number | Average Earnings |
| Male | 274 (100.0%) | $28,811 |
| Female | 0 (0.0%) | $0 |
| Total | 274 (100.0%) | $28,811 |
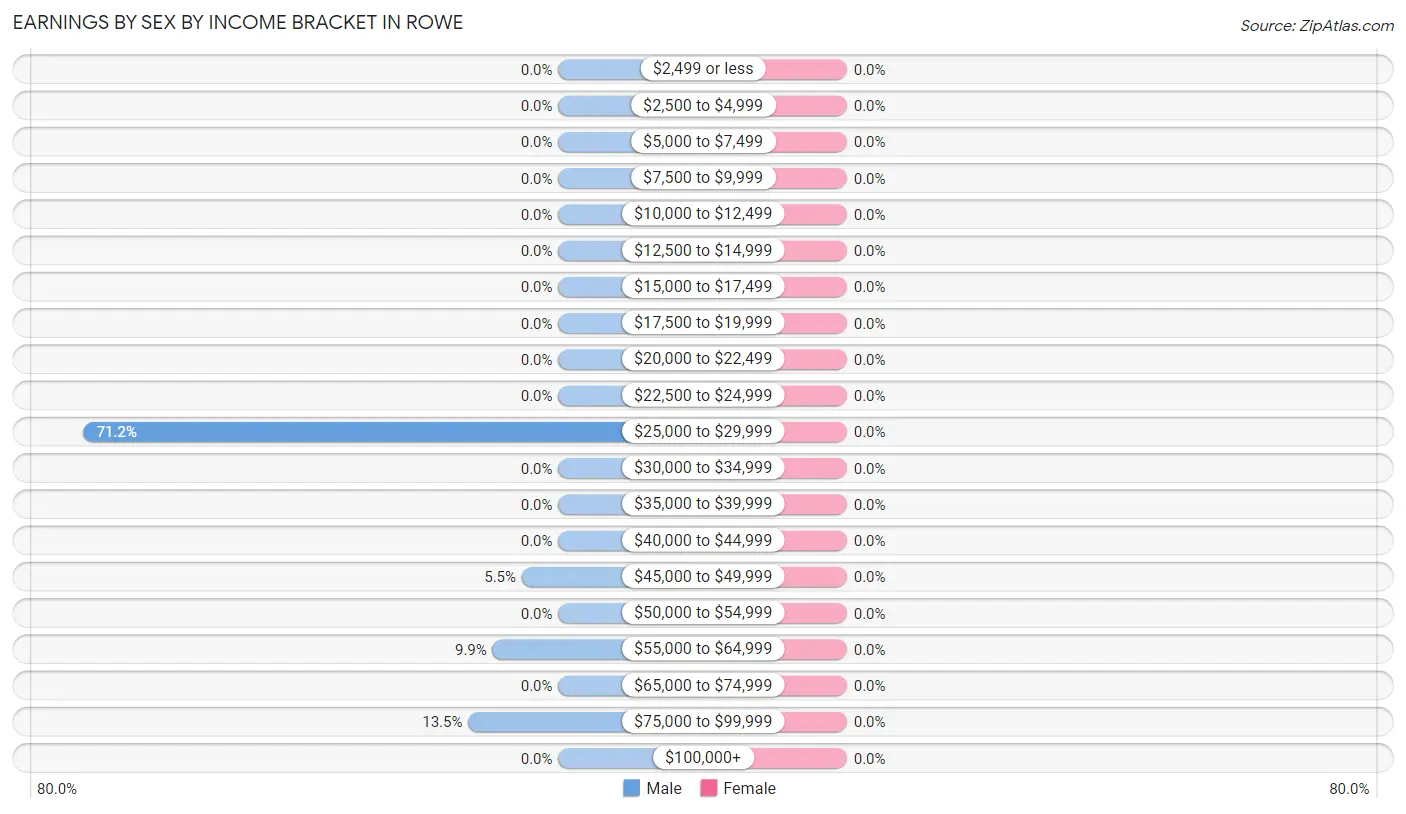
Earnings by Sex by Income Bracket in Rowe
| Income | Male | Female |
| $2,499 or less | 0 (0.0%) | 0 (0.0%) |
| $2,500 to $4,999 | 0 (0.0%) | 0 (0.0%) |
| $5,000 to $7,499 | 0 (0.0%) | 0 (0.0%) |
| $7,500 to $9,999 | 0 (0.0%) | 0 (0.0%) |
| $10,000 to $12,499 | 0 (0.0%) | 0 (0.0%) |
| $12,500 to $14,999 | 0 (0.0%) | 0 (0.0%) |
| $15,000 to $17,499 | 0 (0.0%) | 0 (0.0%) |
| $17,500 to $19,999 | 0 (0.0%) | 0 (0.0%) |
| $20,000 to $22,499 | 0 (0.0%) | 0 (0.0%) |
| $22,500 to $24,999 | 0 (0.0%) | 0 (0.0%) |
| $25,000 to $29,999 | 195 (71.2%) | 0 (0.0%) |
| $30,000 to $34,999 | 0 (0.0%) | 0 (0.0%) |
| $35,000 to $39,999 | 0 (0.0%) | 0 (0.0%) |
| $40,000 to $44,999 | 0 (0.0%) | 0 (0.0%) |
| $45,000 to $49,999 | 15 (5.5%) | 0 (0.0%) |
| $50,000 to $54,999 | 0 (0.0%) | 0 (0.0%) |
| $55,000 to $64,999 | 27 (9.9%) | 0 (0.0%) |
| $65,000 to $74,999 | 0 (0.0%) | 0 (0.0%) |
| $75,000 to $99,999 | 37 (13.5%) | 0 (0.0%) |
| $100,000+ | 0 (0.0%) | 0 (0.0%) |
| Total | 274 (100.0%) | 0 (0.0%) |
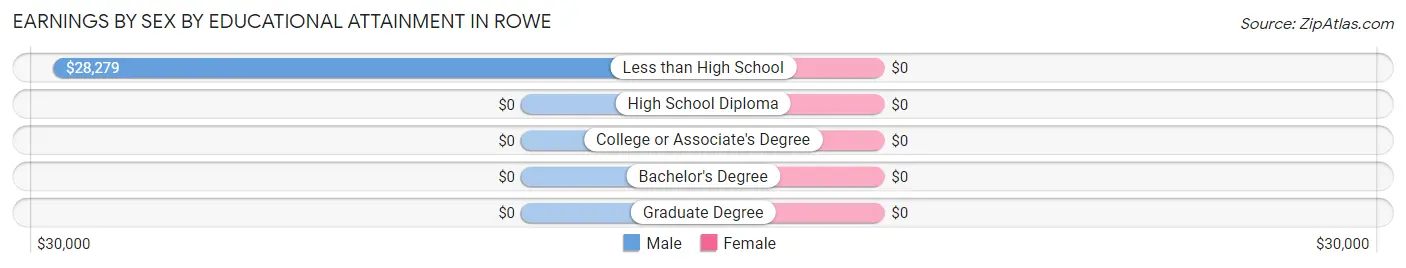
Earnings by Sex by Educational Attainment in Rowe
| Educational Attainment | Male Income | Female Income |
| Less than High School | $28,279 | $0 |
| High School Diploma | - | - |
| College or Associate's Degree | - | - |
| Bachelor's Degree | - | - |
| Graduate Degree | - | - |
| Total | $28,811 | $0 |
Family Income in Rowe
Family Income Brackets in Rowe
According to the Rowe family income data, there are 41 families falling into the $100,000 to $149,999 income range, which is the most common income bracket and makes up 37.3% of all families.
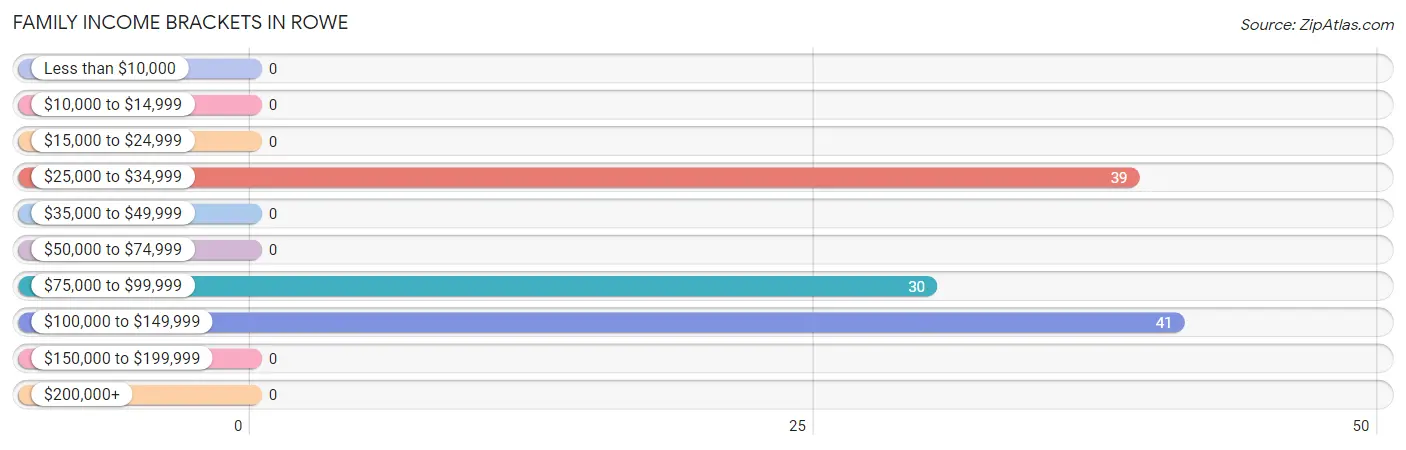
| Income Bracket | # Families | % Families |
| Less than $10,000 | 0 | 0.0% |
| $10,000 to $14,999 | 0 | 0.0% |
| $15,000 to $24,999 | 0 | 0.0% |
| $25,000 to $34,999 | 39 | 35.5% |
| $35,000 to $49,999 | 0 | 0.0% |
| $50,000 to $74,999 | 0 | 0.0% |
| $75,000 to $99,999 | 30 | 27.3% |
| $100,000 to $149,999 | 41 | 37.3% |
| $150,000 to $199,999 | 0 | 0.0% |
| $200,000+ | 0 | 0.0% |
Family Income by Famaliy Size in Rowe
| Income Bracket | # Families | Median Income |
| 2-Person Families | 19 (17.3%) | $0 |
| 3-Person Families | 50 (45.5%) | $0 |
| 4-Person Families | 0 (0.0%) | $0 |
| 5-Person Families | 0 (0.0%) | $0 |
| 6-Person Families | 41 (37.3%) | $0 |
| 7+ Person Families | 0 (0.0%) | $0 |
| Total | 110 (100.0%) | $91,333 |
Family Income by Number of Earners in Rowe
| Number of Earners | # Families | Median Income |
| No Earners | 20 (18.2%) | $0 |
| 1 Earner | 49 (44.6%) | $0 |
| 2 Earners | 0 (0.0%) | $0 |
| 3+ Earners | 41 (37.3%) | $0 |
| Total | 110 (100.0%) | $91,333 |
Household Income in Rowe
Household Income Brackets in Rowe
With 41 households falling in the category, the $100,000 to $149,999 income range is the most frequent in Rowe, accounting for 32.8% of all households.
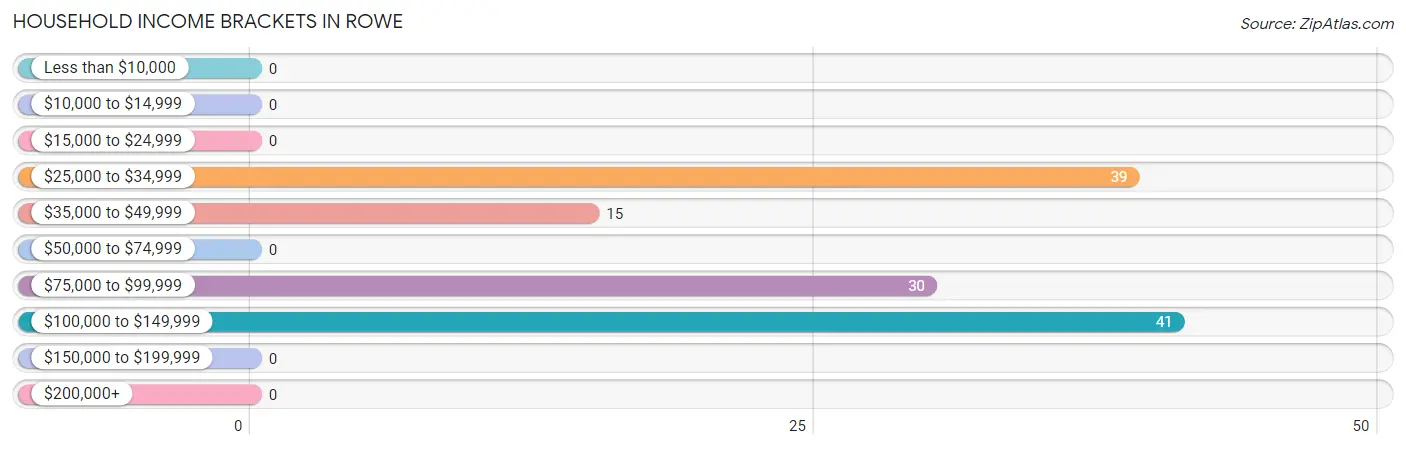
| Income Bracket | # Households | % Households |
| Less than $10,000 | 0 | 0.0% |
| $10,000 to $14,999 | 0 | 0.0% |
| $15,000 to $24,999 | 0 | 0.0% |
| $25,000 to $34,999 | 39 | 31.2% |
| $35,000 to $49,999 | 15 | 12.0% |
| $50,000 to $74,999 | 0 | 0.0% |
| $75,000 to $99,999 | 30 | 24.0% |
| $100,000 to $149,999 | 41 | 32.8% |
| $150,000 to $199,999 | 0 | 0.0% |
| $200,000+ | 0 | 0.0% |
Household Income by Householder Age in Rowe
| Income Bracket | # Households | Median Income |
| 15 to 24 Years | 0 (0.0%) | $0 |
| 25 to 44 Years | 0 (0.0%) | $0 |
| 45 to 64 Years | 95 (76.0%) | $0 |
| 65+ Years | 30 (24.0%) | $0 |
| Total | 125 (100.0%) | $90,708 |
Poverty in Rowe
Income Below Poverty by Sex and Age in Rowe
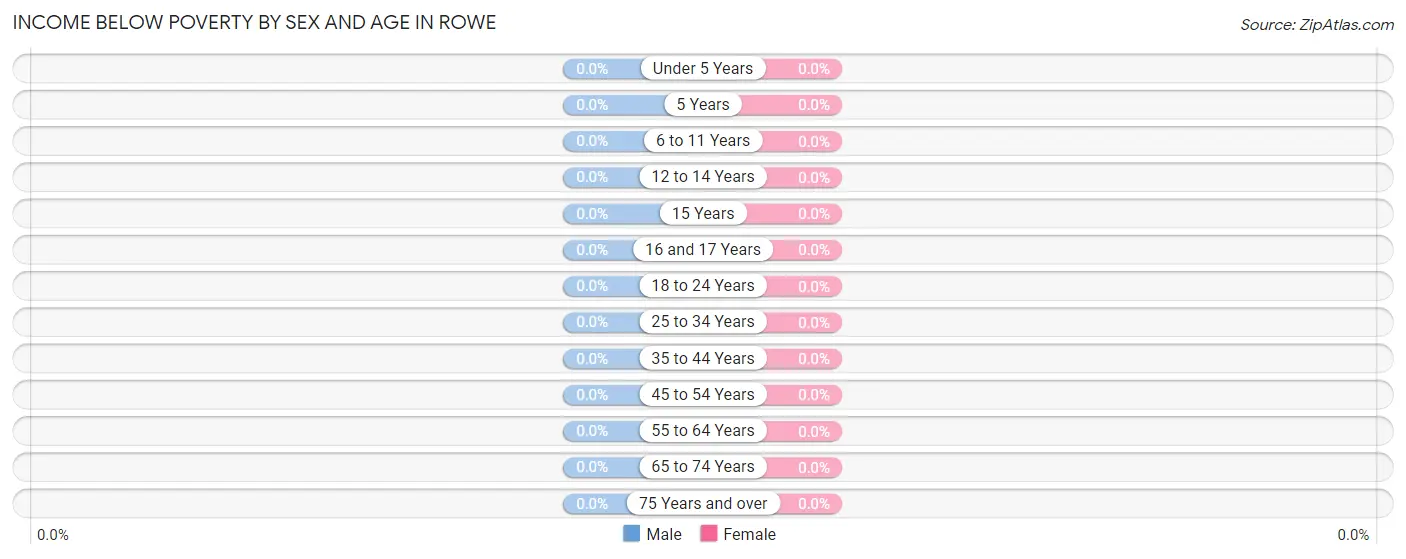
| Age Bracket | Male | Female |
| Under 5 Years | 0 (0.0%) | 0 (0.0%) |
| 5 Years | 0 (0.0%) | 0 (0.0%) |
| 6 to 11 Years | 0 (0.0%) | 0 (0.0%) |
| 12 to 14 Years | 0 (0.0%) | 0 (0.0%) |
| 15 Years | 0 (0.0%) | 0 (0.0%) |
| 16 and 17 Years | 0 (0.0%) | 0 (0.0%) |
| 18 to 24 Years | 0 (0.0%) | 0 (0.0%) |
| 25 to 34 Years | 0 (0.0%) | 0 (0.0%) |
| 35 to 44 Years | 0 (0.0%) | 0 (0.0%) |
| 45 to 54 Years | 0 (0.0%) | 0 (0.0%) |
| 55 to 64 Years | 0 (0.0%) | 0 (0.0%) |
| 65 to 74 Years | 0 (0.0%) | 0 (0.0%) |
| 75 Years and over | 0 (0.0%) | 0 (0.0%) |
| Total | 0 (0.0%) | 0 (0.0%) |
Income Above Poverty by Sex and Age in Rowe
According to the poverty statistics in Rowe, males aged 6 to 11 years and females aged 12 to 14 years are the age groups that are most secure financially, with 100.0% of males and 100.0% of females in these age groups living above the poverty line.
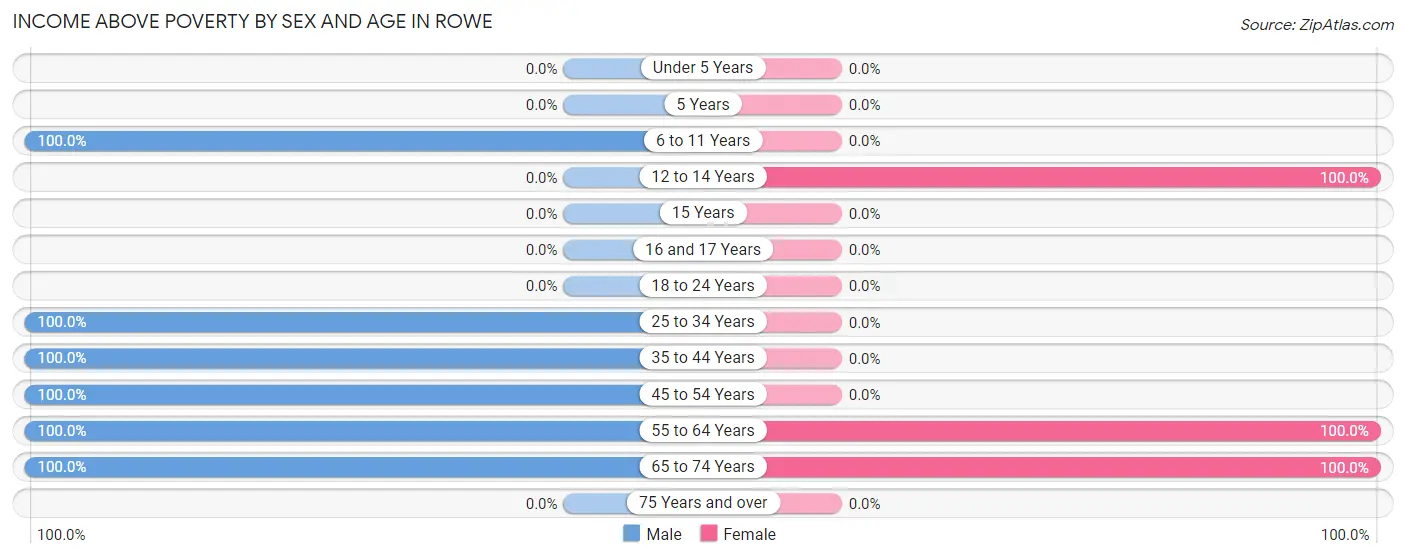
| Age Bracket | Male | Female |
| Under 5 Years | 0 (0.0%) | 0 (0.0%) |
| 5 Years | 0 (0.0%) | 0 (0.0%) |
| 6 to 11 Years | 61 (100.0%) | 0 (0.0%) |
| 12 to 14 Years | 0 (0.0%) | 44 (100.0%) |
| 15 Years | 0 (0.0%) | 0 (0.0%) |
| 16 and 17 Years | 0 (0.0%) | 0 (0.0%) |
| 18 to 24 Years | 0 (0.0%) | 0 (0.0%) |
| 25 to 34 Years | 175 (100.0%) | 0 (0.0%) |
| 35 to 44 Years | 48 (100.0%) | 0 (0.0%) |
| 45 to 54 Years | 52 (100.0%) | 0 (0.0%) |
| 55 to 64 Years | 73 (100.0%) | 80 (100.0%) |
| 65 to 74 Years | 19 (100.0%) | 30 (100.0%) |
| 75 Years and over | 0 (0.0%) | 0 (0.0%) |
| Total | 428 (100.0%) | 154 (100.0%) |
Income Below Poverty Among Married-Couple Families in Rowe
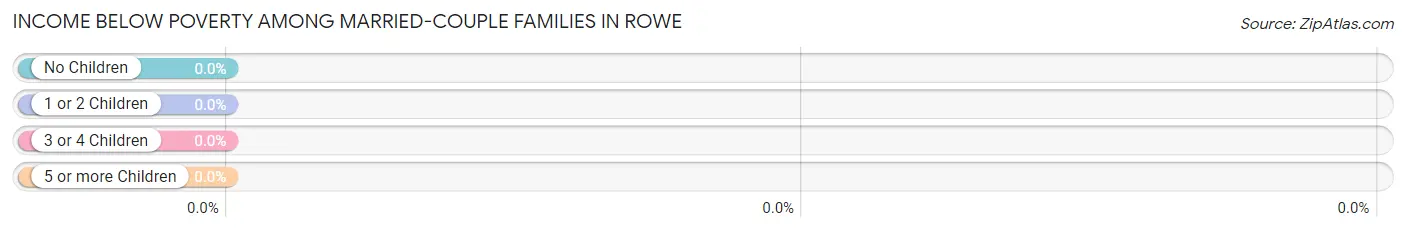
| Children | Above Poverty | Below Poverty |
| No Children | 39 (100.0%) | 0 (0.0%) |
| 1 or 2 Children | 41 (100.0%) | 0 (0.0%) |
| 3 or 4 Children | 0 (0.0%) | 0 (0.0%) |
| 5 or more Children | 0 (0.0%) | 0 (0.0%) |
| Total | 80 (100.0%) | 0 (0.0%) |
Income Below Poverty Among Single-Parent Households in Rowe
| Children | Single Father | Single Mother |
| No Children | 0 (0.0%) | 0 (0.0%) |
| 1 or 2 Children | 0 (0.0%) | 0 (0.0%) |
| 3 or 4 Children | 0 (0.0%) | 0 (0.0%) |
| 5 or more Children | 0 (0.0%) | 0 (0.0%) |
| Total | 0 (0.0%) | 0 (0.0%) |
Income Below Poverty Among Married-Couple vs Single-Parent Households in Rowe
| Children | Married-Couple Families | Single-Parent Households |
| No Children | 0 (0.0%) | 0 (0.0%) |
| 1 or 2 Children | 0 (0.0%) | 0 (0.0%) |
| 3 or 4 Children | 0 (0.0%) | 0 (0.0%) |
| 5 or more Children | 0 (0.0%) | 0 (0.0%) |
| Total | 0 (0.0%) | 0 (0.0%) |
Race in Rowe
The most populous races in Rowe are Hispanic or Latino (582 | 100.0%), White / Caucasian (543 | 93.3%), and Some other Race (39 | 6.7%).
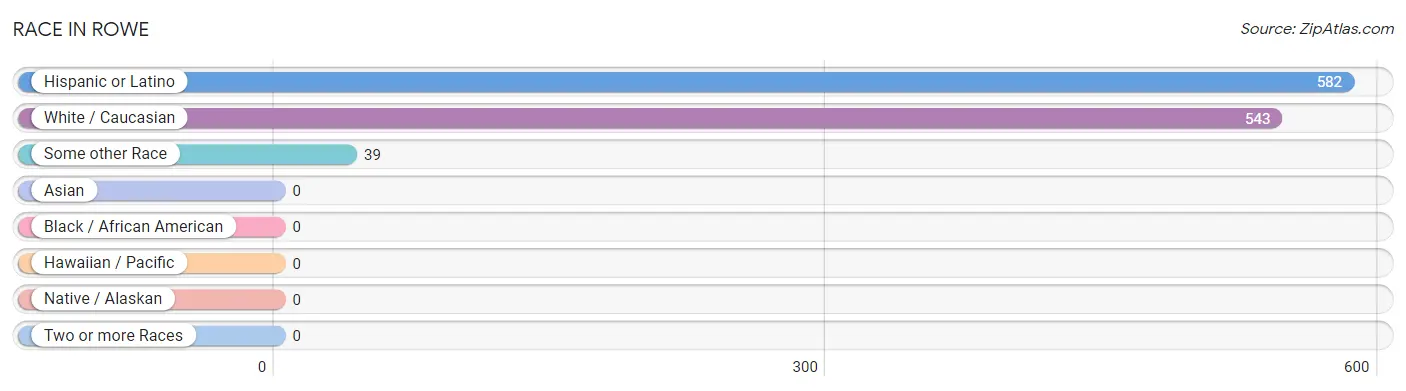
| Race | # Population | % Population |
| Asian | 0 | 0.0% |
| Black / African American | 0 | 0.0% |
| Hawaiian / Pacific | 0 | 0.0% |
| Hispanic or Latino | 582 | 100.0% |
| Native / Alaskan | 0 | 0.0% |
| White / Caucasian | 543 | 93.3% |
| Two or more Races | 0 | 0.0% |
| Some other Race | 39 | 6.7% |
| Total | 582 | 100.0% |
Ancestry in Rowe
The most populous ancestries reported in Rowe are Mexican (53 | 9.1%), and Cuban (39 | 6.7%), together accounting for 15.8% of all Rowe residents.
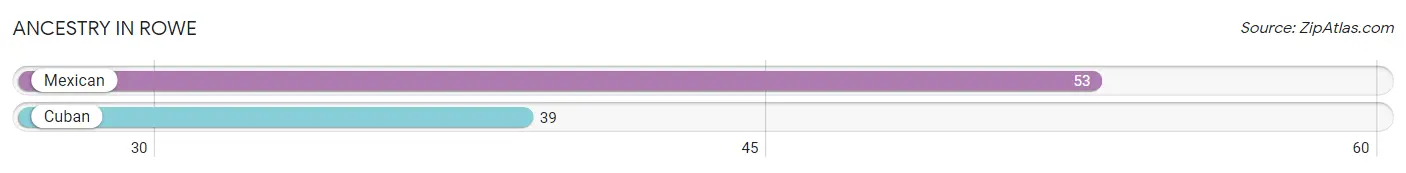
| Ancestry | # Population | % Population |
| Cuban | 39 | 6.7% |
| Mexican | 53 | 9.1% | View All 2 Rows |
Immigrants in Rowe
The most numerous immigrant groups reported in Rowe came from Central America (53 | 9.1%), Latin America (53 | 9.1%), and Mexico (53 | 9.1%), together accounting for 27.3% of all Rowe residents.
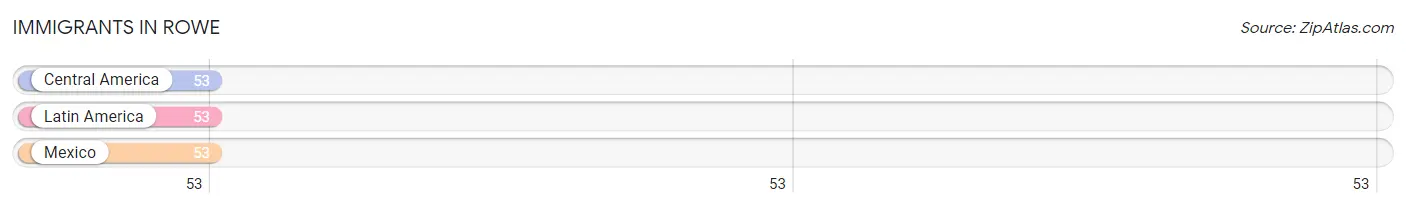
| Immigration Origin | # Population | % Population |
| Central America | 53 | 9.1% |
| Latin America | 53 | 9.1% |
| Mexico | 53 | 9.1% | View All 3 Rows |
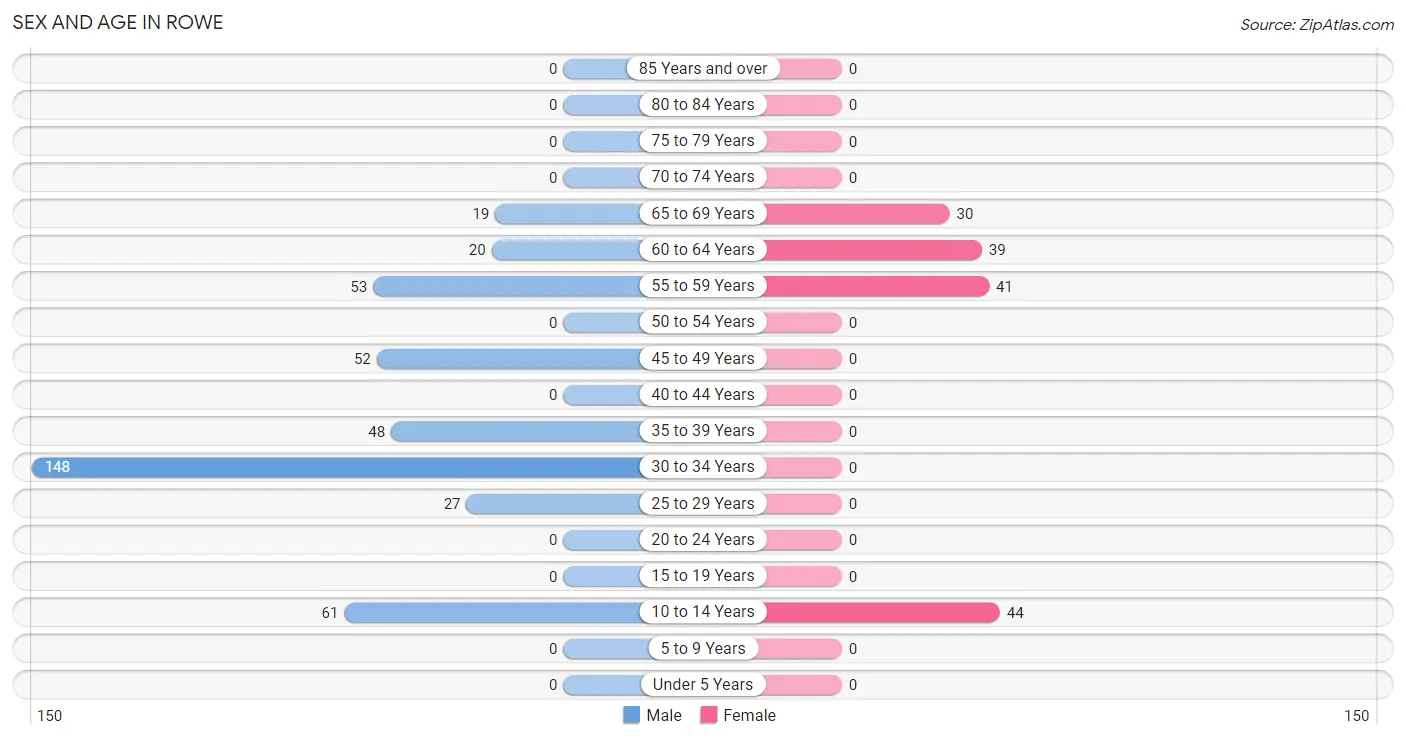
Sex and Age in Rowe
Sex and Age in Rowe
The most populous age groups in Rowe are 30 to 34 Years (148 | 34.6%) for men and 10 to 14 Years (44 | 28.6%) for women.
| Age Bracket | Male | Female |
| Under 5 Years | 0 (0.0%) | 0 (0.0%) |
| 5 to 9 Years | 0 (0.0%) | 0 (0.0%) |
| 10 to 14 Years | 61 (14.2%) | 44 (28.6%) |
| 15 to 19 Years | 0 (0.0%) | 0 (0.0%) |
| 20 to 24 Years | 0 (0.0%) | 0 (0.0%) |
| 25 to 29 Years | 27 (6.3%) | 0 (0.0%) |
| 30 to 34 Years | 148 (34.6%) | 0 (0.0%) |
| 35 to 39 Years | 48 (11.2%) | 0 (0.0%) |
| 40 to 44 Years | 0 (0.0%) | 0 (0.0%) |
| 45 to 49 Years | 52 (12.1%) | 0 (0.0%) |
| 50 to 54 Years | 0 (0.0%) | 0 (0.0%) |
| 55 to 59 Years | 53 (12.4%) | 41 (26.6%) |
| 60 to 64 Years | 20 (4.7%) | 39 (25.3%) |
| 65 to 69 Years | 19 (4.4%) | 30 (19.5%) |
| 70 to 74 Years | 0 (0.0%) | 0 (0.0%) |
| 75 to 79 Years | 0 (0.0%) | 0 (0.0%) |
| 80 to 84 Years | 0 (0.0%) | 0 (0.0%) |
| 85 Years and over | 0 (0.0%) | 0 (0.0%) |
| Total | 428 (100.0%) | 154 (100.0%) |
Families and Households in Rowe
Median Family Size in Rowe
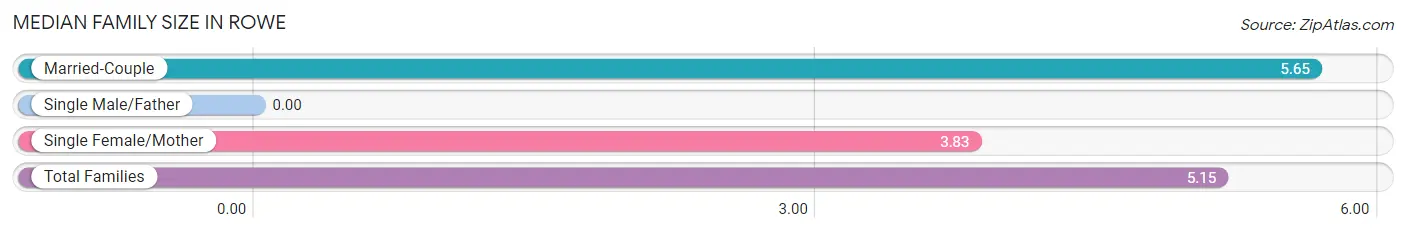
| Family Type | # Families | Family Size |
| Married-Couple | 80 (72.7%) | 5.65 |
| Single Male/Father | 0 (0.0%) | - |
| Single Female/Mother | 30 (27.3%) | 3.83 |
| Total Families | 110 (100.0%) | 5.15 |
Median Household Size in Rowe
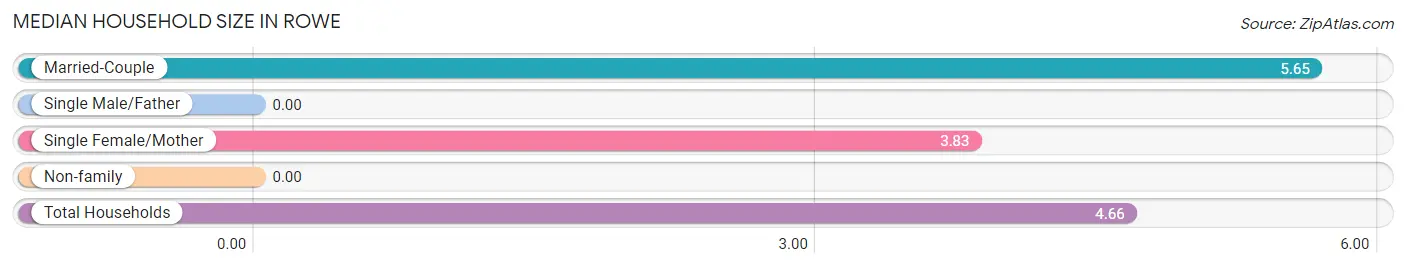
| Household Type | # Households | Household Size |
| Married-Couple | 80 (64.0%) | 5.65 |
| Single Male/Father | 0 (0.0%) | - |
| Single Female/Mother | 30 (24.0%) | 3.83 |
| Non-family | 15 (12.0%) | - |
| Total Households | 125 (100.0%) | 4.66 |
Household Size by Marriage Status in Rowe
Out of a total of 125 households in Rowe, 110 (88.0%) are family households, while 15 (12.0%) are nonfamily households. The most numerous type of family households are 3-person households, comprising 50, and the most common type of nonfamily households are 1-person households, comprising 15.
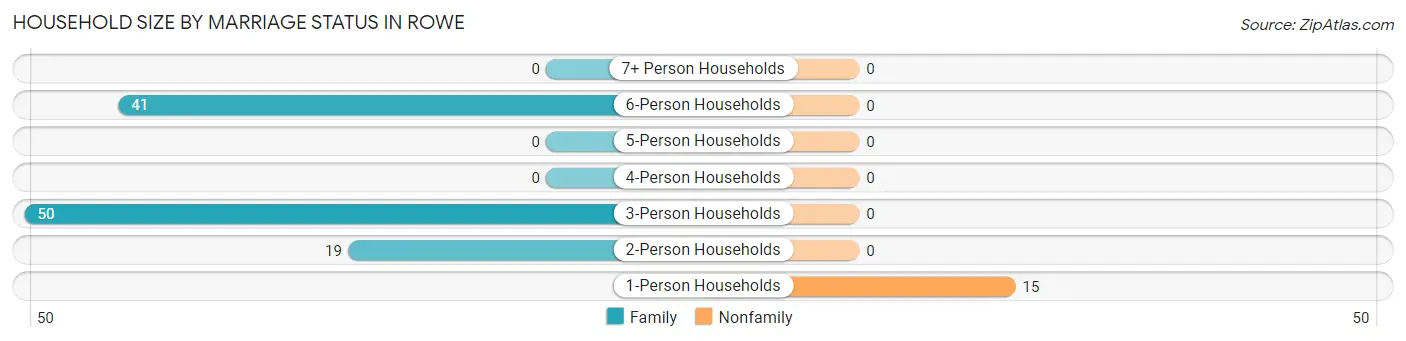
| Household Size | Family Households | Nonfamily Households |
| 1-Person Households | - | 15 (12.0%) |
| 2-Person Households | 19 (15.2%) | 0 (0.0%) |
| 3-Person Households | 50 (40.0%) | 0 (0.0%) |
| 4-Person Households | 0 (0.0%) | 0 (0.0%) |
| 5-Person Households | 0 (0.0%) | 0 (0.0%) |
| 6-Person Households | 41 (32.8%) | 0 (0.0%) |
| 7+ Person Households | 0 (0.0%) | 0 (0.0%) |
| Total | 110 (88.0%) | 15 (12.0%) |
Female Fertility in Rowe
Fertility by Age in Rowe
| Age Bracket | Women with Births | Births / 1,000 Women |
| 15 to 19 years | 0 (0.0%) | 0.0 |
| 20 to 34 years | 0 (0.0%) | 0.0 |
| 35 to 50 years | 0 (0.0%) | 0.0 |
| Total | 0 (0.0%) | 0.0 |
Fertility by Age by Marriage Status in Rowe
| Age Bracket | Married | Unmarried |
| 15 to 19 years | 0 (0.0%) | 0 (0.0%) |
| 20 to 34 years | 0 (0.0%) | 0 (0.0%) |
| 35 to 50 years | 0 (0.0%) | 0 (0.0%) |
| Total | 0 (0.0%) | 0 (0.0%) |
Fertility by Education in Rowe
| Educational Attainment | Women with Births | Births / 1,000 Women |
| Less than High School | 0 (0.0%) | 0.0 |
| High School Diploma | 0 (0.0%) | 0.0 |
| College or Associate's Degree | 0 (0.0%) | 0.0 |
| Bachelor's Degree | 0 (0.0%) | 0.0 |
| Graduate Degree | 0 (0.0%) | 0.0 |
| Total | 0 (0.0%) | 0.0 |
Fertility by Education by Marriage Status in Rowe
| Educational Attainment | Married | Unmarried |
| Less than High School | 0 (0.0%) | 0 (0.0%) |
| High School Diploma | 0 (0.0%) | 0 (0.0%) |
| College or Associate's Degree | 0 (0.0%) | 0 (0.0%) |
| Bachelor's Degree | 0 (0.0%) | 0 (0.0%) |
| Graduate Degree | 0 (0.0%) | 0 (0.0%) |
| Total | 0 (0.0%) | 0 (0.0%) |
Employment Characteristics in Rowe
Employment by Class of Employer in Rowe
Among the 274 employed individuals in Rowe, private company employees (164 | 59.9%), self-employed (not incorporated) (53 | 19.3%), and federal government employees (37 | 13.5%) make up the most common classes of employment.
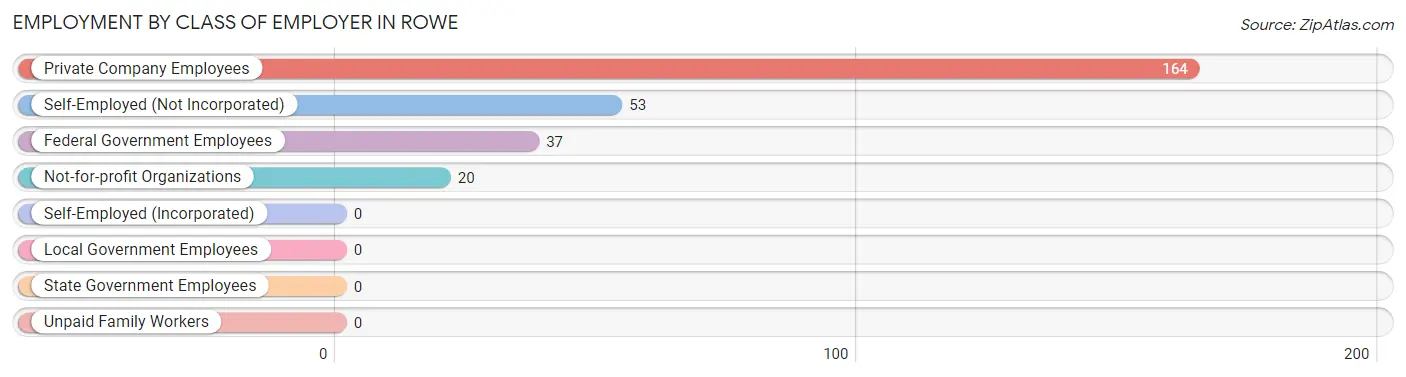
| Employer Class | # Employees | % Employees |
| Private Company Employees | 164 | 59.9% |
| Self-Employed (Incorporated) | 0 | 0.0% |
| Self-Employed (Not Incorporated) | 53 | 19.3% |
| Not-for-profit Organizations | 20 | 7.3% |
| Local Government Employees | 0 | 0.0% |
| State Government Employees | 0 | 0.0% |
| Federal Government Employees | 37 | 13.5% |
| Unpaid Family Workers | 0 | 0.0% |
| Total | 274 | 100.0% |
Employment Status by Age in Rowe
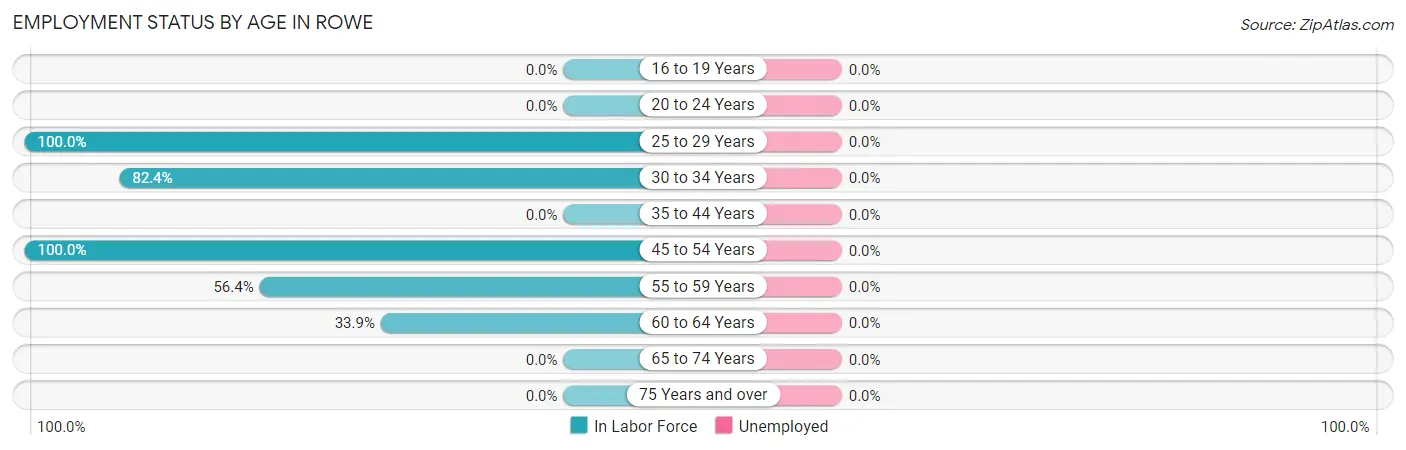
| Age Bracket | In Labor Force | Unemployed |
| 16 to 19 Years | 0 (0.0%) | 0 (0.0%) |
| 20 to 24 Years | 0 (0.0%) | 0 (0.0%) |
| 25 to 29 Years | 27 (100.0%) | 0 (0.0%) |
| 30 to 34 Years | 122 (82.4%) | 0 (0.0%) |
| 35 to 44 Years | 0 (0.0%) | 0 (0.0%) |
| 45 to 54 Years | 52 (100.0%) | 0 (0.0%) |
| 55 to 59 Years | 53 (56.4%) | 0 (0.0%) |
| 60 to 64 Years | 20 (33.9%) | 0 (0.0%) |
| 65 to 74 Years | 0 (0.0%) | 0 (0.0%) |
| 75 Years and over | 0 (0.0%) | 0 (0.0%) |
| Total | 274 (57.4%) | 0 (0.0%) |
Employment Status by Educational Attainment in Rowe
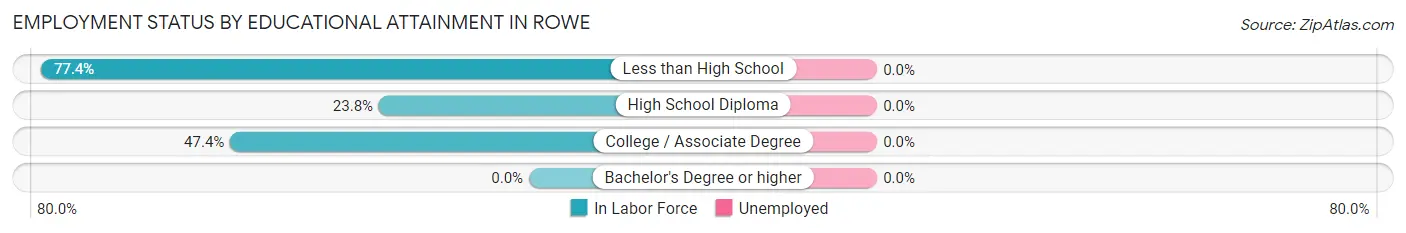
| Educational Attainment | In Labor Force | Unemployed |
| Less than High School | 222 (77.4%) | 0 (0.0%) |
| High School Diploma | 15 (23.8%) | 0 (0.0%) |
| College / Associate Degree | 37 (47.4%) | 0 (0.0%) |
| Bachelor's Degree or higher | 0 (0.0%) | 0 (0.0%) |
| Total | 274 (64.0%) | 0 (0.0%) |
Employment Occupations by Sex in Rowe
Management, Business, Science and Arts Occupations
The most common Management, Business, Science and Arts occupations in Rowe are , and Business & Financial (37 | 13.5%).
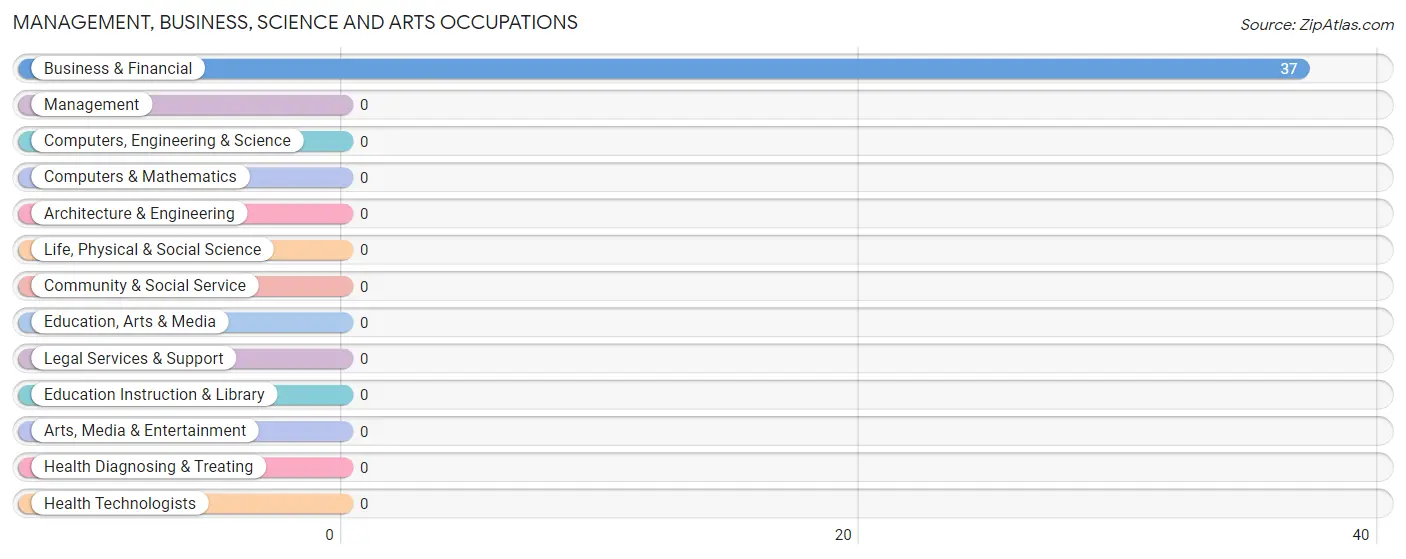
Management, Business, Science and Arts Occupations by Sex
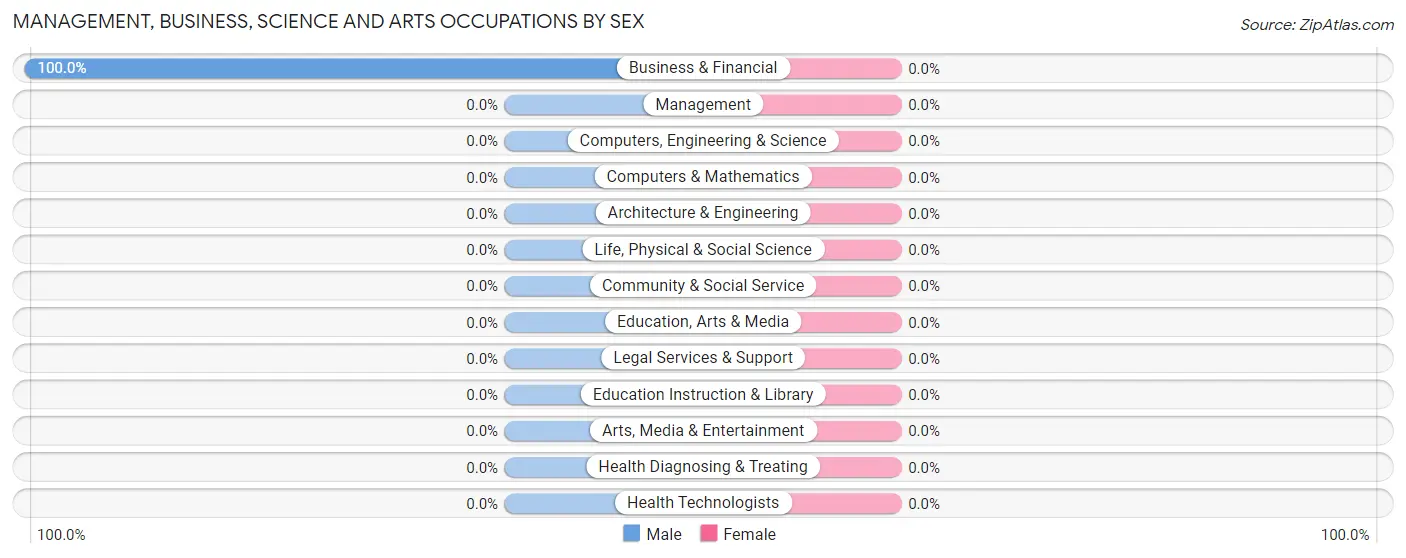
| Occupation | Male | Female |
| Management | 0 (0.0%) | 0 (0.0%) |
| Business & Financial | 37 (100.0%) | 0 (0.0%) |
| Computers, Engineering & Science | 0 (0.0%) | 0 (0.0%) |
| Computers & Mathematics | 0 (0.0%) | 0 (0.0%) |
| Architecture & Engineering | 0 (0.0%) | 0 (0.0%) |
| Life, Physical & Social Science | 0 (0.0%) | 0 (0.0%) |
| Community & Social Service | 0 (0.0%) | 0 (0.0%) |
| Education, Arts & Media | 0 (0.0%) | 0 (0.0%) |
| Legal Services & Support | 0 (0.0%) | 0 (0.0%) |
| Education Instruction & Library | 0 (0.0%) | 0 (0.0%) |
| Arts, Media & Entertainment | 0 (0.0%) | 0 (0.0%) |
| Health Diagnosing & Treating | 0 (0.0%) | 0 (0.0%) |
| Health Technologists | 0 (0.0%) | 0 (0.0%) |
| Total (Category) | 37 (100.0%) | 0 (0.0%) |
| Total (Overall) | 274 (100.0%) | 0 (0.0%) |
Services Occupations
The most common Services occupations in Rowe are Cleaning & Maintenance (88 | 32.1%), and Food Preparation & Serving (27 | 9.9%).
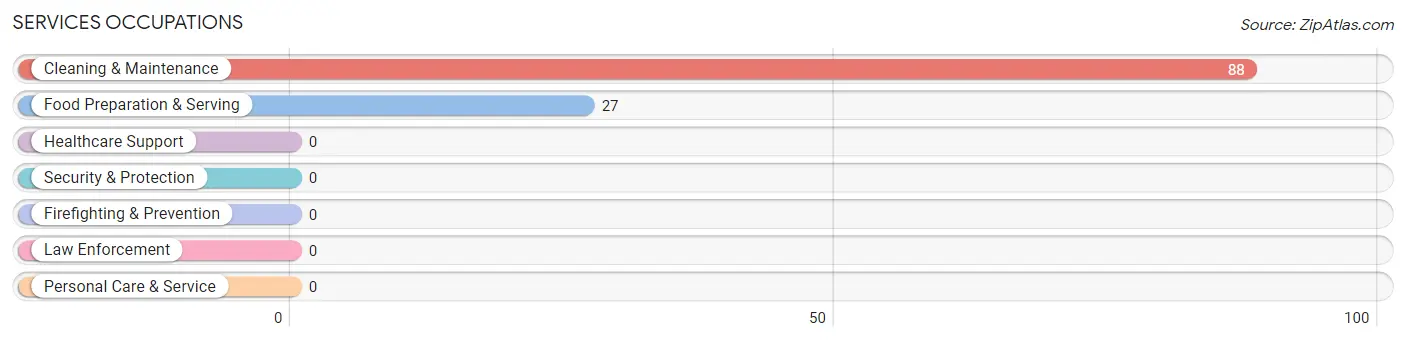
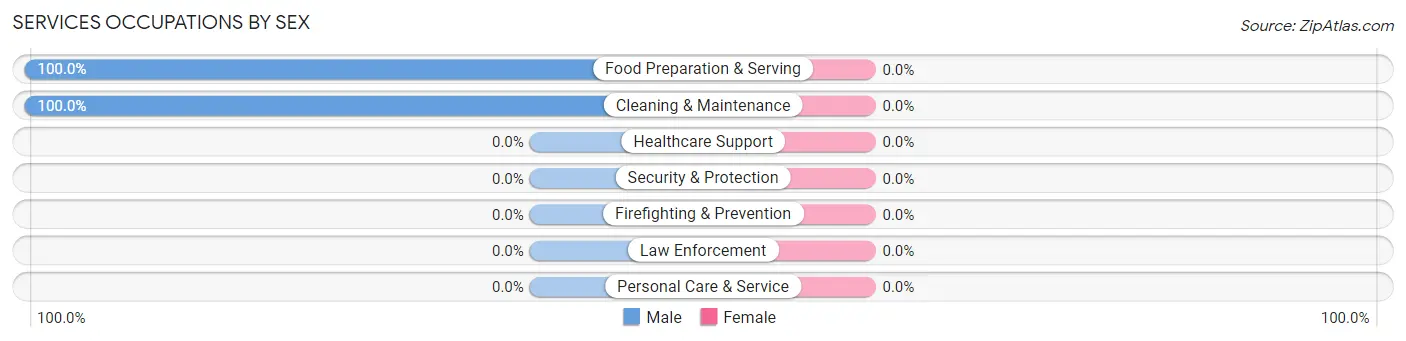
Services Occupations by Sex
| Occupation | Male | Female |
| Healthcare Support | 0 (0.0%) | 0 (0.0%) |
| Security & Protection | 0 (0.0%) | 0 (0.0%) |
| Firefighting & Prevention | 0 (0.0%) | 0 (0.0%) |
| Law Enforcement | 0 (0.0%) | 0 (0.0%) |
| Food Preparation & Serving | 27 (100.0%) | 0 (0.0%) |
| Cleaning & Maintenance | 88 (100.0%) | 0 (0.0%) |
| Personal Care & Service | 0 (0.0%) | 0 (0.0%) |
| Total (Category) | 115 (100.0%) | 0 (0.0%) |
| Total (Overall) | 274 (100.0%) | 0 (0.0%) |
Sales and Office Occupations
Sales and Office Occupations by Sex
| Occupation | Male | Female |
| Sales & Related | 0 (0.0%) | 0 (0.0%) |
| Office & Administration | 0 (0.0%) | 0 (0.0%) |
| Total (Category) | 0 (0.0%) | 0 (0.0%) |
| Total (Overall) | 274 (100.0%) | 0 (0.0%) |
Natural Resources, Construction and Maintenance Occupations
Natural Resources, Construction and Maintenance Occupations by Sex
| Occupation | Male | Female |
| Farming, Fishing & Forestry | 0 (0.0%) | 0 (0.0%) |
| Construction & Extraction | 0 (0.0%) | 0 (0.0%) |
| Installation, Maintenance & Repair | 0 (0.0%) | 0 (0.0%) |
| Total (Category) | 0 (0.0%) | 0 (0.0%) |
| Total (Overall) | 274 (100.0%) | 0 (0.0%) |
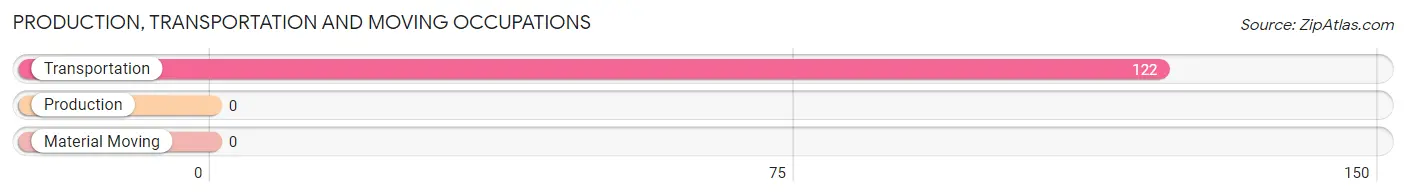
Production, Transportation and Moving Occupations
The most common Production, Transportation and Moving occupations in Rowe are , and Transportation (122 | 44.5%).
Production, Transportation and Moving Occupations by Sex
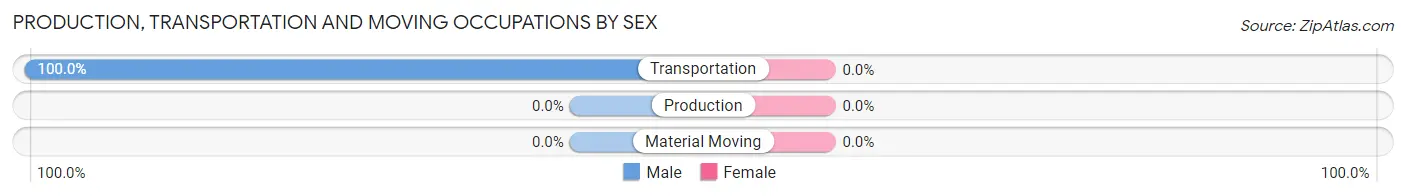
| Occupation | Male | Female |
| Production | 0 (0.0%) | 0 (0.0%) |
| Transportation | 122 (100.0%) | 0 (0.0%) |
| Material Moving | 0 (0.0%) | 0 (0.0%) |
| Total (Category) | 122 (100.0%) | 0 (0.0%) |
| Total (Overall) | 274 (100.0%) | 0 (0.0%) |
Employment Industries by Sex in Rowe
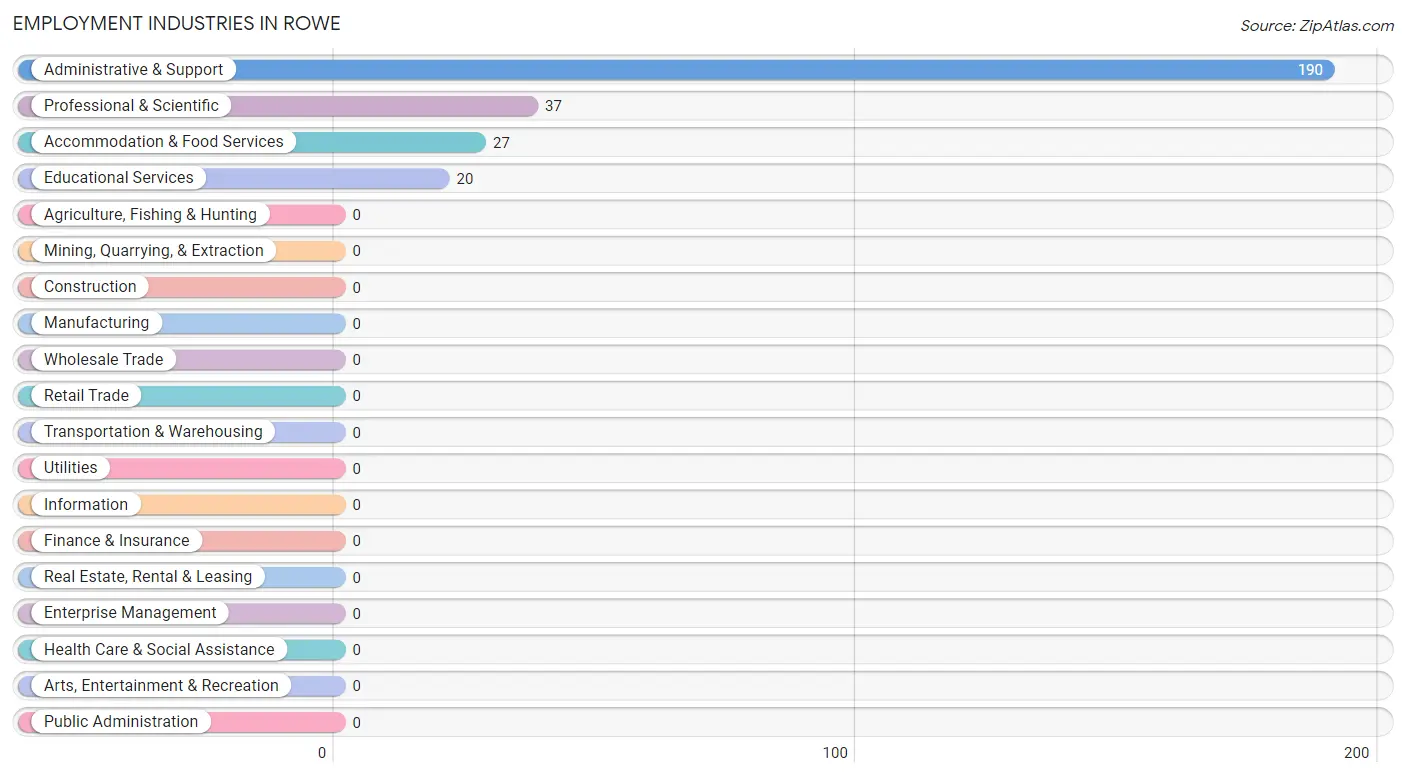
Employment Industries in Rowe
The major employment industries in Rowe include Administrative & Support (190 | 69.3%), Professional & Scientific (37 | 13.5%), Accommodation & Food Services (27 | 9.9%), and Educational Services (20 | 7.3%).
Employment Industries by Sex in Rowe
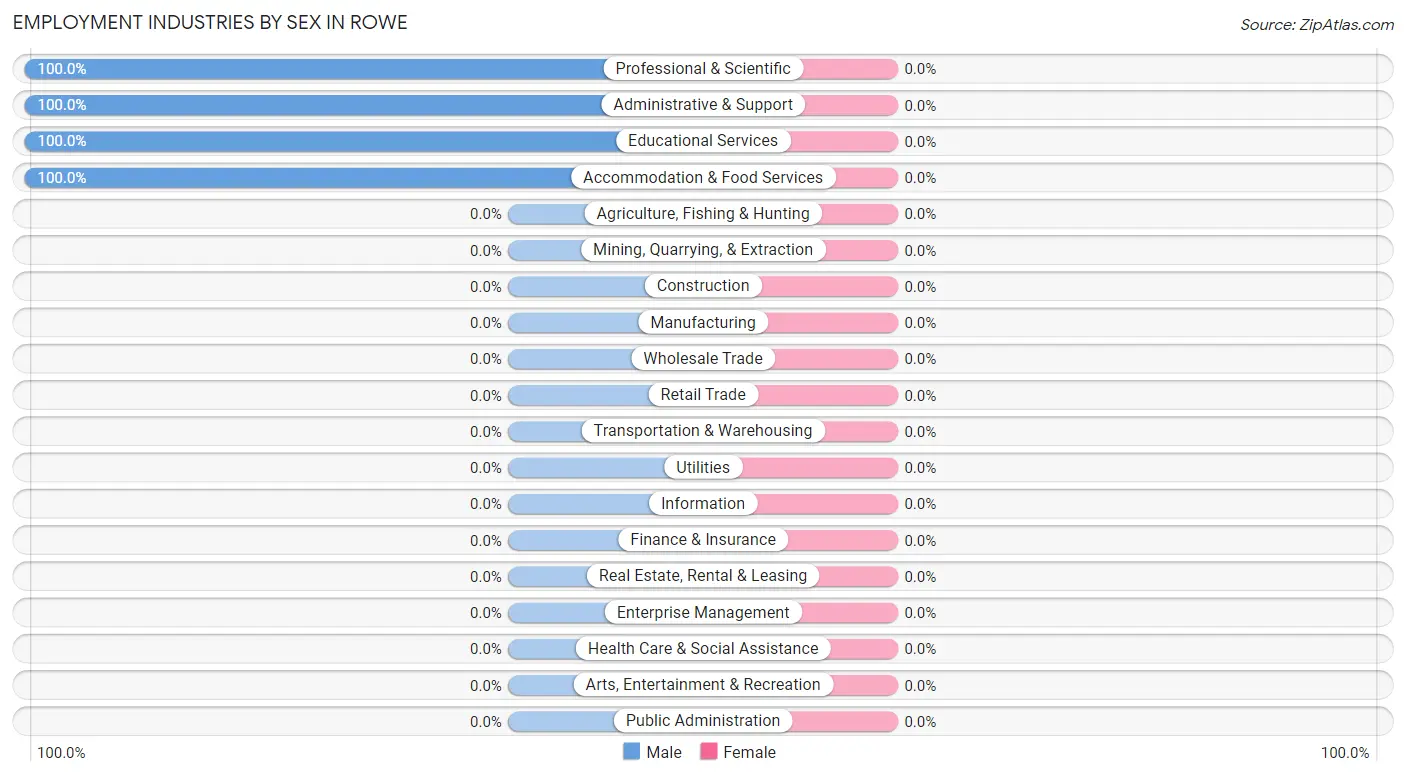
| Industry | Male | Female |
| Agriculture, Fishing & Hunting | 0 (0.0%) | 0 (0.0%) |
| Mining, Quarrying, & Extraction | 0 (0.0%) | 0 (0.0%) |
| Construction | 0 (0.0%) | 0 (0.0%) |
| Manufacturing | 0 (0.0%) | 0 (0.0%) |
| Wholesale Trade | 0 (0.0%) | 0 (0.0%) |
| Retail Trade | 0 (0.0%) | 0 (0.0%) |
| Transportation & Warehousing | 0 (0.0%) | 0 (0.0%) |
| Utilities | 0 (0.0%) | 0 (0.0%) |
| Information | 0 (0.0%) | 0 (0.0%) |
| Finance & Insurance | 0 (0.0%) | 0 (0.0%) |
| Real Estate, Rental & Leasing | 0 (0.0%) | 0 (0.0%) |
| Professional & Scientific | 37 (100.0%) | 0 (0.0%) |
| Enterprise Management | 0 (0.0%) | 0 (0.0%) |
| Administrative & Support | 190 (100.0%) | 0 (0.0%) |
| Educational Services | 20 (100.0%) | 0 (0.0%) |
| Health Care & Social Assistance | 0 (0.0%) | 0 (0.0%) |
| Arts, Entertainment & Recreation | 0 (0.0%) | 0 (0.0%) |
| Accommodation & Food Services | 27 (100.0%) | 0 (0.0%) |
| Public Administration | 0 (0.0%) | 0 (0.0%) |
| Total | 274 (100.0%) | 0 (0.0%) |
Education in Rowe
School Enrollment in Rowe
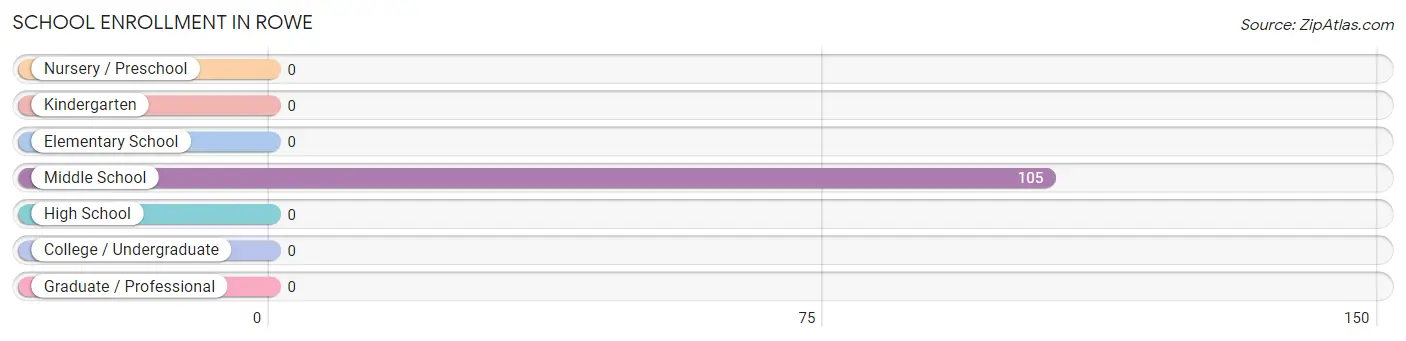
| School Level | # Students | % Students |
| Nursery / Preschool | 0 | 0.0% |
| Kindergarten | 0 | 0.0% |
| Elementary School | 0 | 0.0% |
| Middle School | 105 | 100.0% |
| High School | 0 | 0.0% |
| College / Undergraduate | 0 | 0.0% |
| Graduate / Professional | 0 | 0.0% |
| Total | 105 | 100.0% |
School Enrollment by Age by Funding Source in Rowe
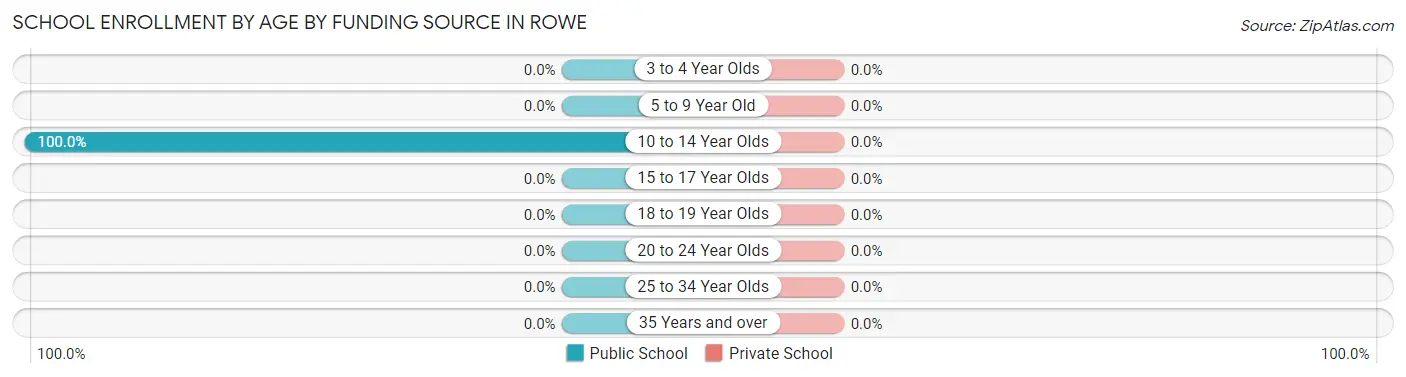
| Age Bracket | Public School | Private School |
| 3 to 4 Year Olds | 0 (0.0%) | 0 (0.0%) |
| 5 to 9 Year Old | 0 (0.0%) | 0 (0.0%) |
| 10 to 14 Year Olds | 105 (100.0%) | 0 (0.0%) |
| 15 to 17 Year Olds | 0 (0.0%) | 0 (0.0%) |
| 18 to 19 Year Olds | 0 (0.0%) | 0 (0.0%) |
| 20 to 24 Year Olds | 0 (0.0%) | 0 (0.0%) |
| 25 to 34 Year Olds | 0 (0.0%) | 0 (0.0%) |
| 35 Years and over | 0 (0.0%) | 0 (0.0%) |
| Total | 105 (100.0%) | 0 (0.0%) |
Educational Attainment by Field of Study in Rowe
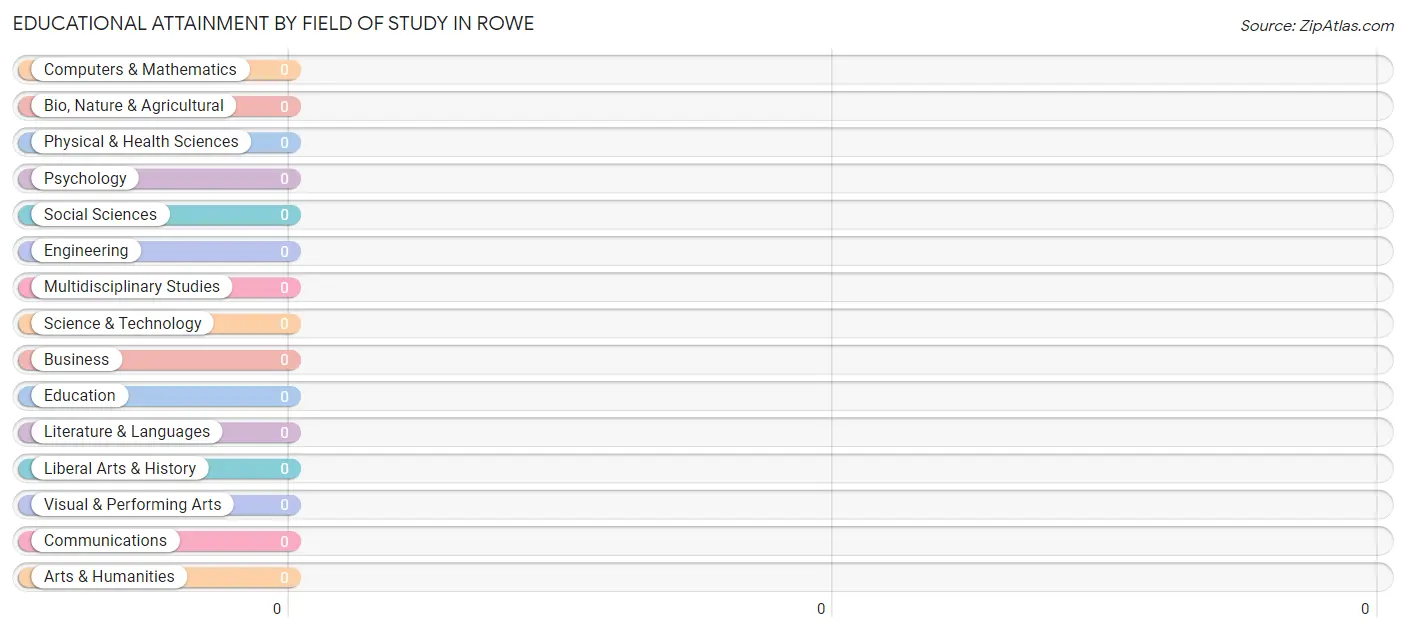
| Field of Study | # Graduates | % Graduates |
| Computers & Mathematics | 0 | 0.0% |
| Bio, Nature & Agricultural | 0 | 0.0% |
| Physical & Health Sciences | 0 | 0.0% |
| Psychology | 0 | 0.0% |
| Social Sciences | 0 | 0.0% |
| Engineering | 0 | 0.0% |
| Multidisciplinary Studies | 0 | 0.0% |
| Science & Technology | 0 | 0.0% |
| Business | 0 | 0.0% |
| Education | 0 | 0.0% |
| Literature & Languages | 0 | 0.0% |
| Liberal Arts & History | 0 | 0.0% |
| Visual & Performing Arts | 0 | 0.0% |
| Communications | 0 | 0.0% |
| Arts & Humanities | 0 | 0.0% |
| Total | 0 | 0.0% |
Transportation & Commute in Rowe
Vehicle Availability by Sex in Rowe
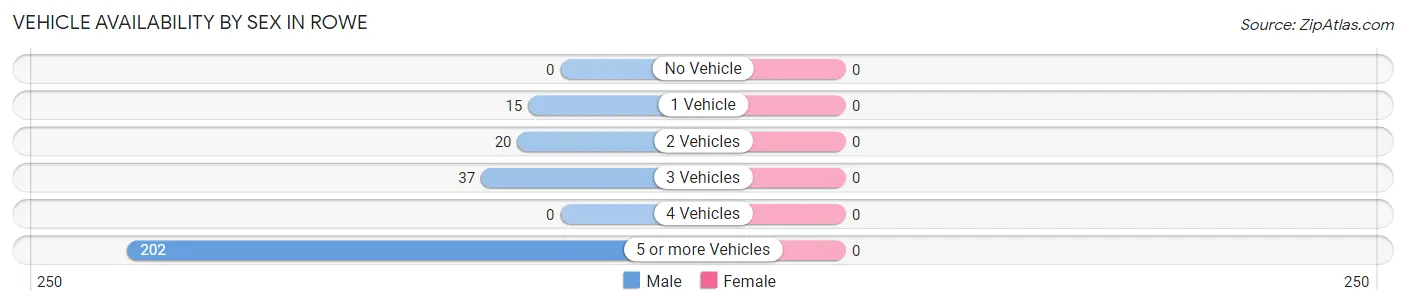
| Vehicles Available | Male | Female |
| No Vehicle | 0 (0.0%) | 0 (0.0%) |
| 1 Vehicle | 15 (5.5%) | 0 (0.0%) |
| 2 Vehicles | 20 (7.3%) | 0 (0.0%) |
| 3 Vehicles | 37 (13.5%) | 0 (0.0%) |
| 4 Vehicles | 0 (0.0%) | 0 (0.0%) |
| 5 or more Vehicles | 202 (73.7%) | 0 (0.0%) |
| Total | 274 (100.0%) | 0 (0.0%) |
Commute Time in Rowe
The most frequently occuring commute durations in Rowe are 5 to 9 minutes (122 commuters, 66.3%), 40 to 44 minutes (27 commuters, 14.7%), and 30 to 34 minutes (20 commuters, 10.9%).
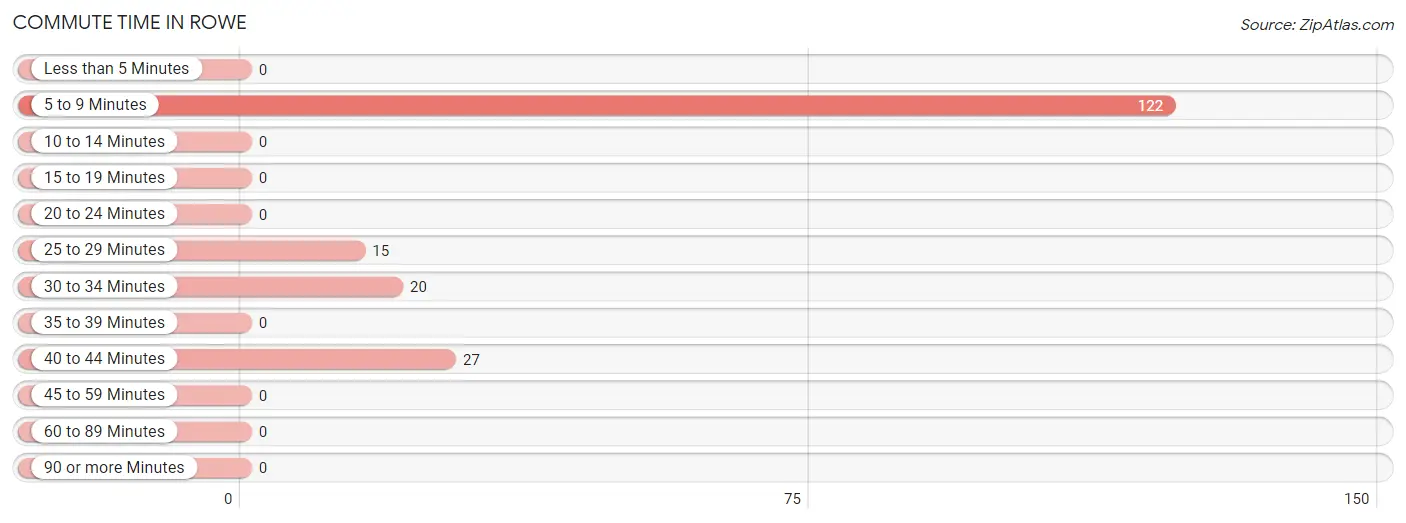
| Commute Time | # Commuters | % Commuters |
| Less than 5 Minutes | 0 | 0.0% |
| 5 to 9 Minutes | 122 | 66.3% |
| 10 to 14 Minutes | 0 | 0.0% |
| 15 to 19 Minutes | 0 | 0.0% |
| 20 to 24 Minutes | 0 | 0.0% |
| 25 to 29 Minutes | 15 | 8.2% |
| 30 to 34 Minutes | 20 | 10.9% |
| 35 to 39 Minutes | 0 | 0.0% |
| 40 to 44 Minutes | 27 | 14.7% |
| 45 to 59 Minutes | 0 | 0.0% |
| 60 to 89 Minutes | 0 | 0.0% |
| 90 or more Minutes | 0 | 0.0% |
Commute Time by Sex in Rowe
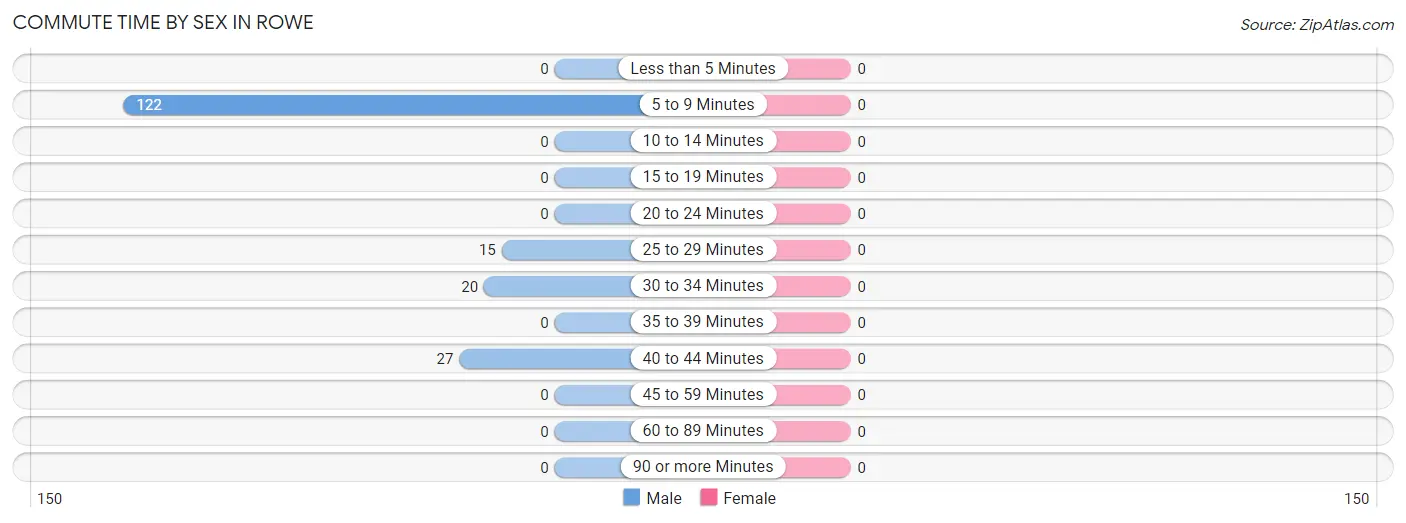
| Commute Time | Male | Female |
| Less than 5 Minutes | 0 (0.0%) | 0 (0.0%) |
| 5 to 9 Minutes | 122 (66.3%) | 0 (0.0%) |
| 10 to 14 Minutes | 0 (0.0%) | 0 (0.0%) |
| 15 to 19 Minutes | 0 (0.0%) | 0 (0.0%) |
| 20 to 24 Minutes | 0 (0.0%) | 0 (0.0%) |
| 25 to 29 Minutes | 15 (8.2%) | 0 (0.0%) |
| 30 to 34 Minutes | 20 (10.9%) | 0 (0.0%) |
| 35 to 39 Minutes | 0 (0.0%) | 0 (0.0%) |
| 40 to 44 Minutes | 27 (14.7%) | 0 (0.0%) |
| 45 to 59 Minutes | 0 (0.0%) | 0 (0.0%) |
| 60 to 89 Minutes | 0 (0.0%) | 0 (0.0%) |
| 90 or more Minutes | 0 (0.0%) | 0 (0.0%) |
Time of Departure to Work by Sex in Rowe
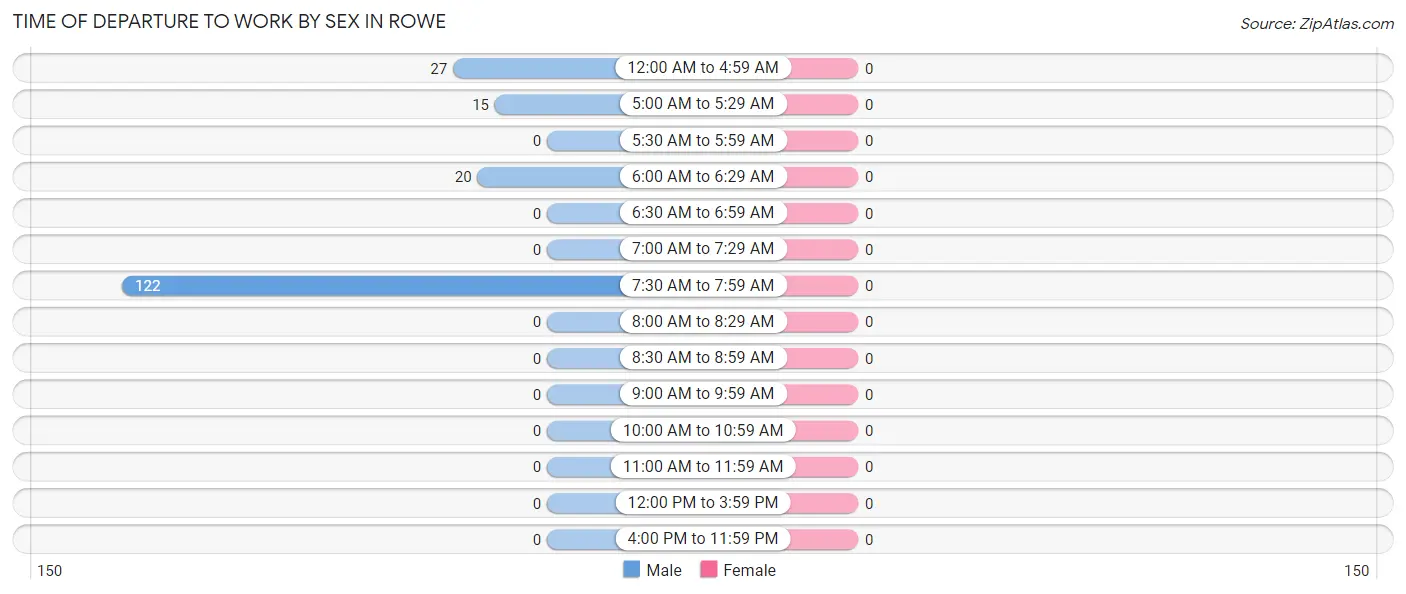
| Time of Departure | Male | Female |
| 12:00 AM to 4:59 AM | 27 (14.7%) | 0 (0.0%) |
| 5:00 AM to 5:29 AM | 15 (8.2%) | 0 (0.0%) |
| 5:30 AM to 5:59 AM | 0 (0.0%) | 0 (0.0%) |
| 6:00 AM to 6:29 AM | 20 (10.9%) | 0 (0.0%) |
| 6:30 AM to 6:59 AM | 0 (0.0%) | 0 (0.0%) |
| 7:00 AM to 7:29 AM | 0 (0.0%) | 0 (0.0%) |
| 7:30 AM to 7:59 AM | 122 (66.3%) | 0 (0.0%) |
| 8:00 AM to 8:29 AM | 0 (0.0%) | 0 (0.0%) |
| 8:30 AM to 8:59 AM | 0 (0.0%) | 0 (0.0%) |
| 9:00 AM to 9:59 AM | 0 (0.0%) | 0 (0.0%) |
| 10:00 AM to 10:59 AM | 0 (0.0%) | 0 (0.0%) |
| 11:00 AM to 11:59 AM | 0 (0.0%) | 0 (0.0%) |
| 12:00 PM to 3:59 PM | 0 (0.0%) | 0 (0.0%) |
| 4:00 PM to 11:59 PM | 0 (0.0%) | 0 (0.0%) |
| Total | 184 (100.0%) | 0 (0.0%) |
Housing Occupancy in Rowe
Occupancy by Ownership in Rowe
Of the total 125 dwellings in Rowe, owner-occupied units account for 110 (88.0%), while renter-occupied units make up 15 (12.0%).
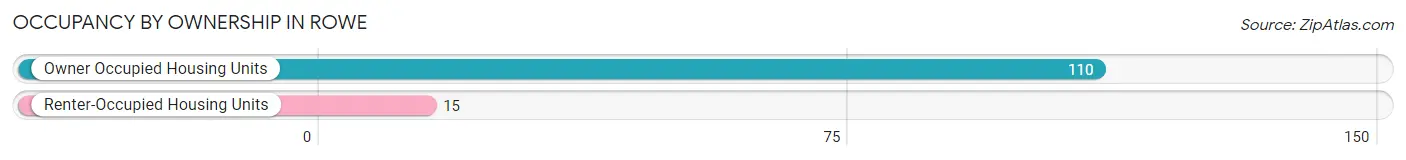
| Occupancy | # Housing Units | % Housing Units |
| Owner Occupied Housing Units | 110 | 88.0% |
| Renter-Occupied Housing Units | 15 | 12.0% |
| Total Occupied Housing Units | 125 | 100.0% |
Occupancy by Household Size in Rowe
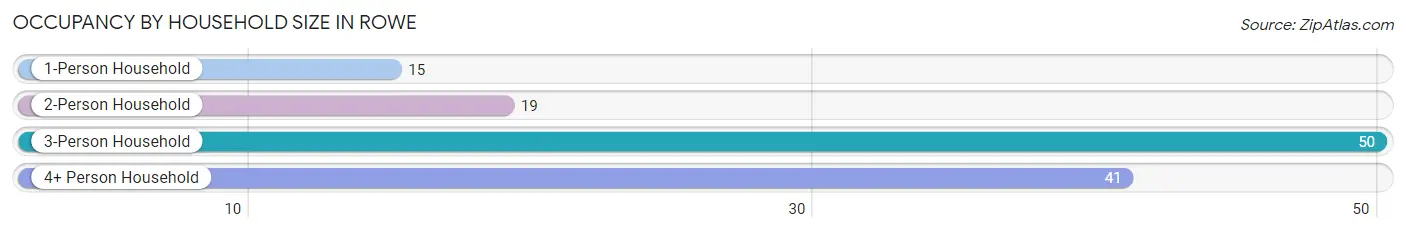
| Household Size | # Housing Units | % Housing Units |
| 1-Person Household | 15 | 12.0% |
| 2-Person Household | 19 | 15.2% |
| 3-Person Household | 50 | 40.0% |
| 4+ Person Household | 41 | 32.8% |
| Total Housing Units | 125 | 100.0% |
Occupancy by Ownership by Household Size in Rowe
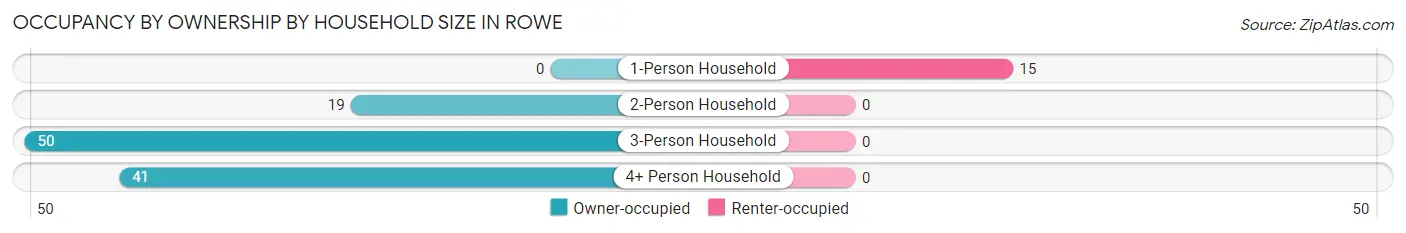
| Household Size | Owner-occupied | Renter-occupied |
| 1-Person Household | 0 (0.0%) | 15 (100.0%) |
| 2-Person Household | 19 (100.0%) | 0 (0.0%) |
| 3-Person Household | 50 (100.0%) | 0 (0.0%) |
| 4+ Person Household | 41 (100.0%) | 0 (0.0%) |
| Total Housing Units | 110 (88.0%) | 15 (12.0%) |
Occupancy by Educational Attainment in Rowe
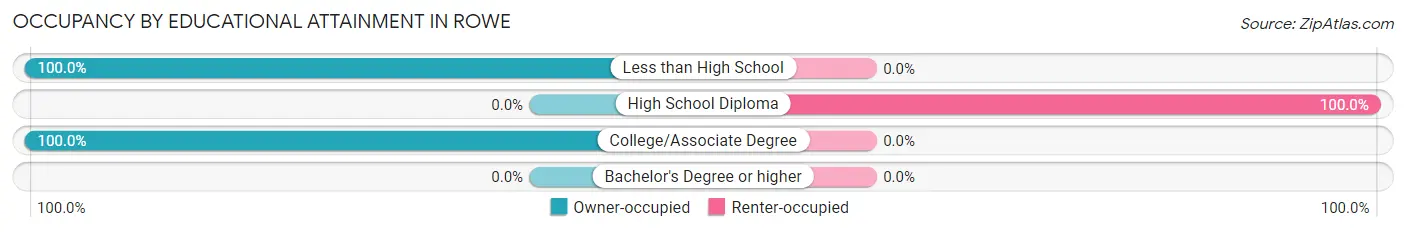
| Household Size | Owner-occupied | Renter-occupied |
| Less than High School | 69 (100.0%) | 0 (0.0%) |
| High School Diploma | 0 (0.0%) | 15 (100.0%) |
| College/Associate Degree | 41 (100.0%) | 0 (0.0%) |
| Bachelor's Degree or higher | 0 (0.0%) | 0 (0.0%) |
Occupancy by Age of Householder in Rowe
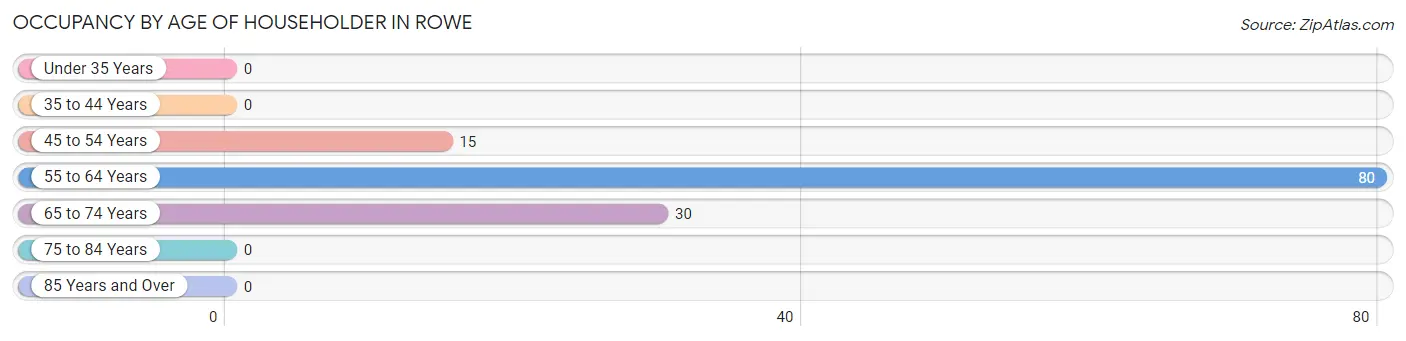
| Age Bracket | # Households | % Households |
| Under 35 Years | 0 | 0.0% |
| 35 to 44 Years | 0 | 0.0% |
| 45 to 54 Years | 15 | 12.0% |
| 55 to 64 Years | 80 | 64.0% |
| 65 to 74 Years | 30 | 24.0% |
| 75 to 84 Years | 0 | 0.0% |
| 85 Years and Over | 0 | 0.0% |
| Total | 125 | 100.0% |
Housing Finances in Rowe
Median Income by Occupancy in Rowe
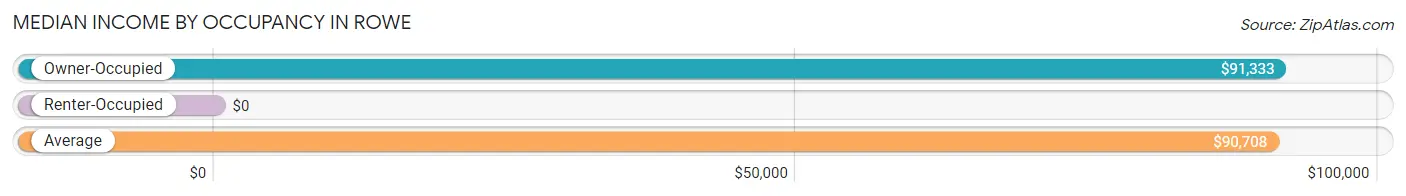
| Occupancy Type | # Households | Median Income |
| Owner-Occupied | 110 (88.0%) | $91,333 |
| Renter-Occupied | 15 (12.0%) | $0 |
| Average | 125 (100.0%) | $90,708 |
Occupancy by Householder Income Bracket in Rowe
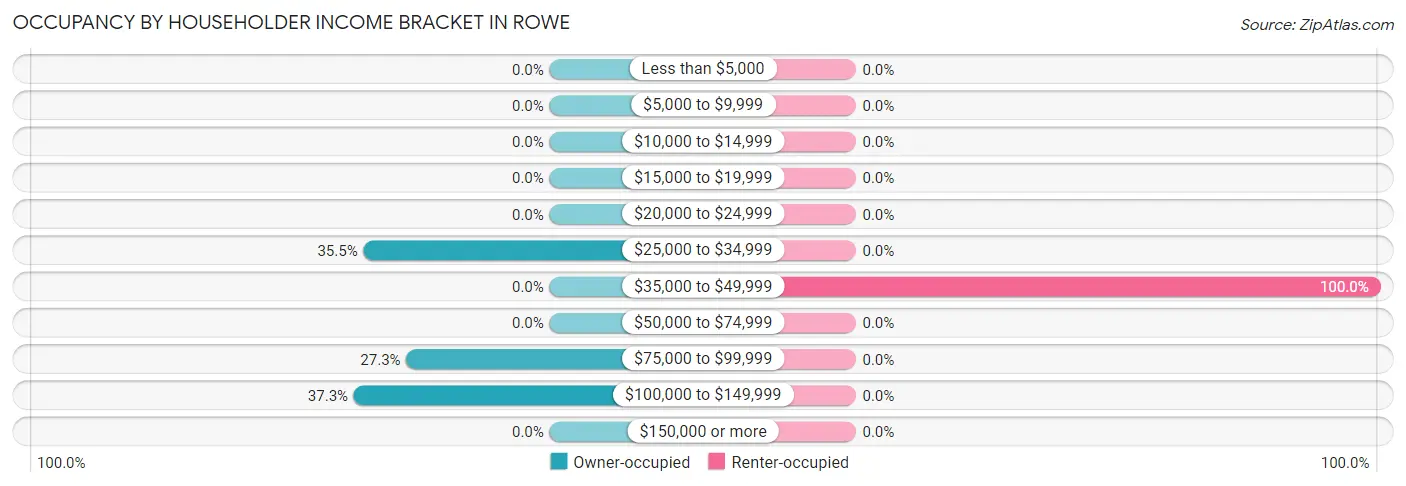
| Income Bracket | Owner-occupied | Renter-occupied |
| Less than $5,000 | 0 (0.0%) | 0 (0.0%) |
| $5,000 to $9,999 | 0 (0.0%) | 0 (0.0%) |
| $10,000 to $14,999 | 0 (0.0%) | 0 (0.0%) |
| $15,000 to $19,999 | 0 (0.0%) | 0 (0.0%) |
| $20,000 to $24,999 | 0 (0.0%) | 0 (0.0%) |
| $25,000 to $34,999 | 39 (35.4%) | 0 (0.0%) |
| $35,000 to $49,999 | 0 (0.0%) | 15 (100.0%) |
| $50,000 to $74,999 | 0 (0.0%) | 0 (0.0%) |
| $75,000 to $99,999 | 30 (27.3%) | 0 (0.0%) |
| $100,000 to $149,999 | 41 (37.3%) | 0 (0.0%) |
| $150,000 or more | 0 (0.0%) | 0 (0.0%) |
| Total | 110 (100.0%) | 15 (100.0%) |
Monthly Housing Cost Tiers in Rowe
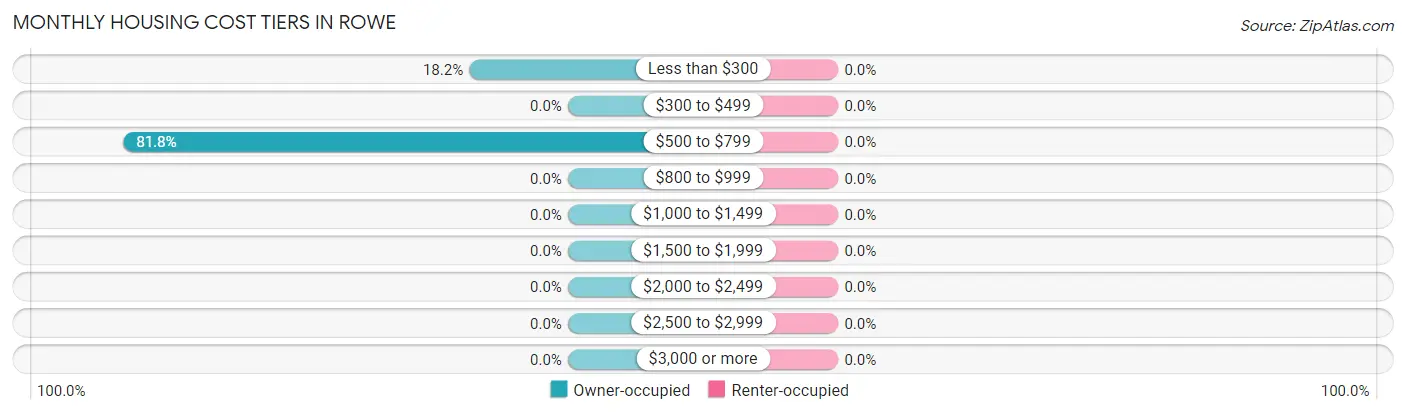
| Monthly Cost | Owner-occupied | Renter-occupied |
| Less than $300 | 20 (18.2%) | 0 (0.0%) |
| $300 to $499 | 0 (0.0%) | 0 (0.0%) |
| $500 to $799 | 90 (81.8%) | 0 (0.0%) |
| $800 to $999 | 0 (0.0%) | 0 (0.0%) |
| $1,000 to $1,499 | 0 (0.0%) | 0 (0.0%) |
| $1,500 to $1,999 | 0 (0.0%) | 0 (0.0%) |
| $2,000 to $2,499 | 0 (0.0%) | 0 (0.0%) |
| $2,500 to $2,999 | 0 (0.0%) | 0 (0.0%) |
| $3,000 or more | 0 (0.0%) | 0 (0.0%) |
| Total | 110 (100.0%) | 15 (100.0%) |
Physical Housing Characteristics in Rowe
Housing Structures in Rowe
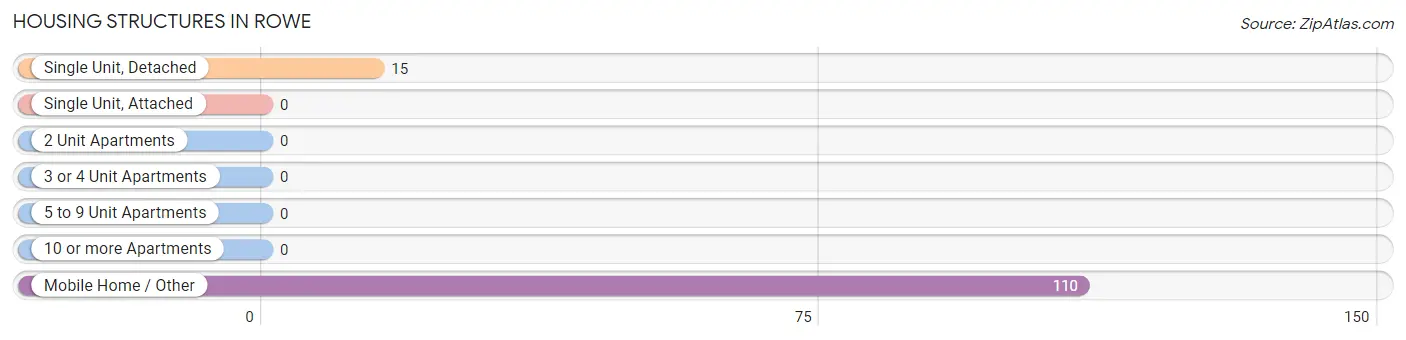
| Structure Type | # Housing Units | % Housing Units |
| Single Unit, Detached | 15 | 12.0% |
| Single Unit, Attached | 0 | 0.0% |
| 2 Unit Apartments | 0 | 0.0% |
| 3 or 4 Unit Apartments | 0 | 0.0% |
| 5 to 9 Unit Apartments | 0 | 0.0% |
| 10 or more Apartments | 0 | 0.0% |
| Mobile Home / Other | 110 | 88.0% |
| Total | 125 | 100.0% |
Housing Structures by Occupancy in Rowe
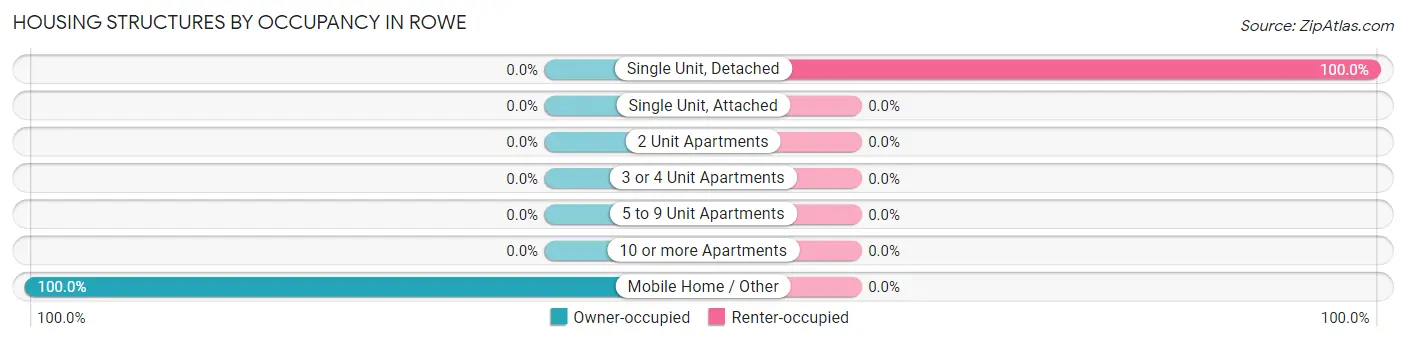
| Structure Type | Owner-occupied | Renter-occupied |
| Single Unit, Detached | 0 (0.0%) | 15 (100.0%) |
| Single Unit, Attached | 0 (0.0%) | 0 (0.0%) |
| 2 Unit Apartments | 0 (0.0%) | 0 (0.0%) |
| 3 or 4 Unit Apartments | 0 (0.0%) | 0 (0.0%) |
| 5 to 9 Unit Apartments | 0 (0.0%) | 0 (0.0%) |
| 10 or more Apartments | 0 (0.0%) | 0 (0.0%) |
| Mobile Home / Other | 110 (100.0%) | 0 (0.0%) |
| Total | 110 (88.0%) | 15 (12.0%) |
Housing Structures by Number of Rooms in Rowe
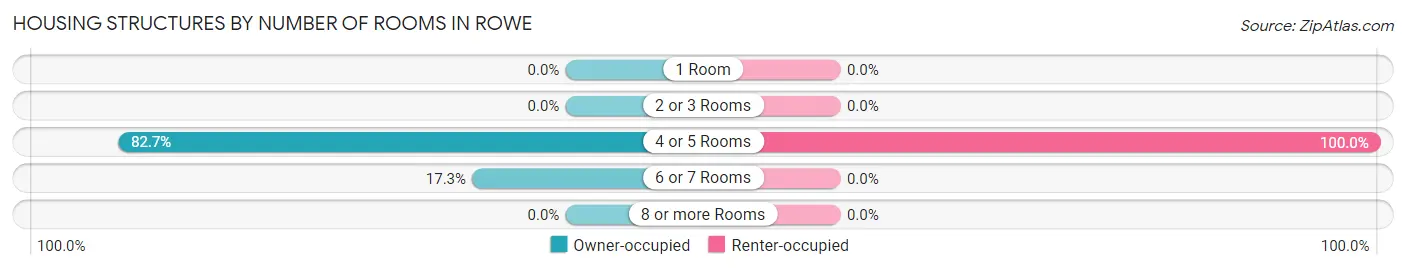
| Number of Rooms | Owner-occupied | Renter-occupied |
| 1 Room | 0 (0.0%) | 0 (0.0%) |
| 2 or 3 Rooms | 0 (0.0%) | 0 (0.0%) |
| 4 or 5 Rooms | 91 (82.7%) | 15 (100.0%) |
| 6 or 7 Rooms | 19 (17.3%) | 0 (0.0%) |
| 8 or more Rooms | 0 (0.0%) | 0 (0.0%) |
| Total | 110 (100.0%) | 15 (100.0%) |
Housing Structure by Heating Type in Rowe
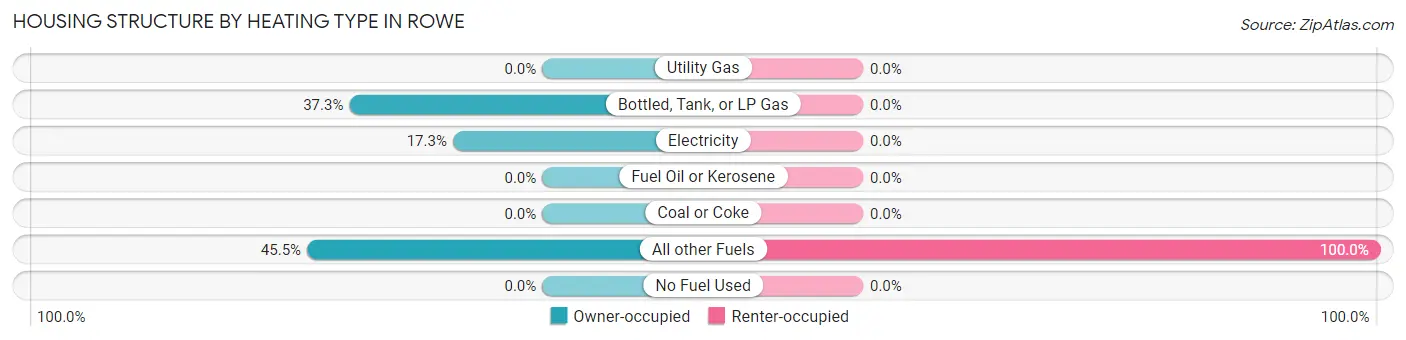
| Heating Type | Owner-occupied | Renter-occupied |
| Utility Gas | 0 (0.0%) | 0 (0.0%) |
| Bottled, Tank, or LP Gas | 41 (37.3%) | 0 (0.0%) |
| Electricity | 19 (17.3%) | 0 (0.0%) |
| Fuel Oil or Kerosene | 0 (0.0%) | 0 (0.0%) |
| Coal or Coke | 0 (0.0%) | 0 (0.0%) |
| All other Fuels | 50 (45.5%) | 15 (100.0%) |
| No Fuel Used | 0 (0.0%) | 0 (0.0%) |
| Total | 110 (100.0%) | 15 (100.0%) |
Household Vehicle Usage in Rowe
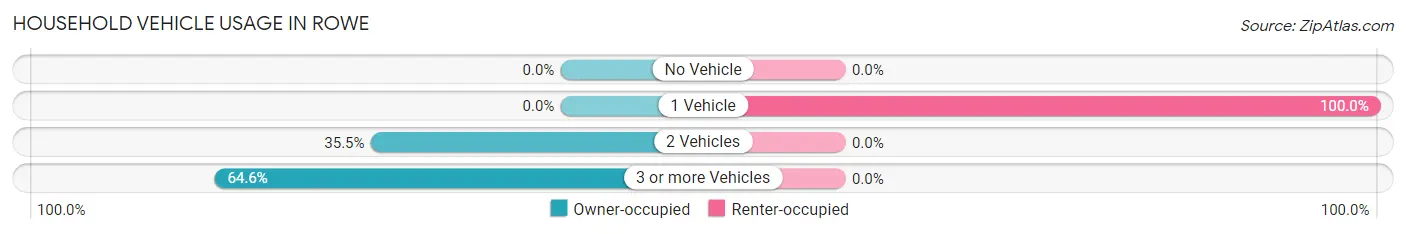
| Vehicles per Household | Owner-occupied | Renter-occupied |
| No Vehicle | 0 (0.0%) | 0 (0.0%) |
| 1 Vehicle | 0 (0.0%) | 15 (100.0%) |
| 2 Vehicles | 39 (35.4%) | 0 (0.0%) |
| 3 or more Vehicles | 71 (64.5%) | 0 (0.0%) |
| Total | 110 (100.0%) | 15 (100.0%) |
Real Estate & Mortgages in Rowe
Real Estate and Mortgage Overview in Rowe
| Characteristic | Without Mortgage | With Mortgage |
| Housing Units | 110 | 0 |
| Median Property Value | - | - |
| Median Household Income | $91,333 | $0 |
| Monthly Housing Costs | $608 | $0 |
| Real Estate Taxes | - | - |
Property Value by Mortgage Status in Rowe
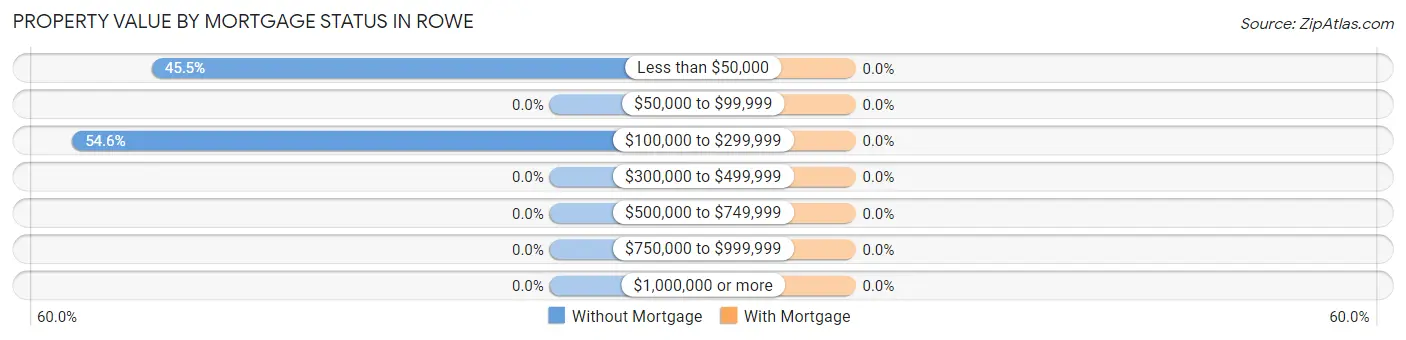
| Property Value | Without Mortgage | With Mortgage |
| Less than $50,000 | 50 (45.5%) | 0 (0.0%) |
| $50,000 to $99,999 | 0 (0.0%) | 0 (0.0%) |
| $100,000 to $299,999 | 60 (54.5%) | 0 (0.0%) |
| $300,000 to $499,999 | 0 (0.0%) | 0 (0.0%) |
| $500,000 to $749,999 | 0 (0.0%) | 0 (0.0%) |
| $750,000 to $999,999 | 0 (0.0%) | 0 (0.0%) |
| $1,000,000 or more | 0 (0.0%) | 0 (0.0%) |
| Total | 110 (100.0%) | 0 (0.0%) |
Household Income by Mortgage Status in Rowe
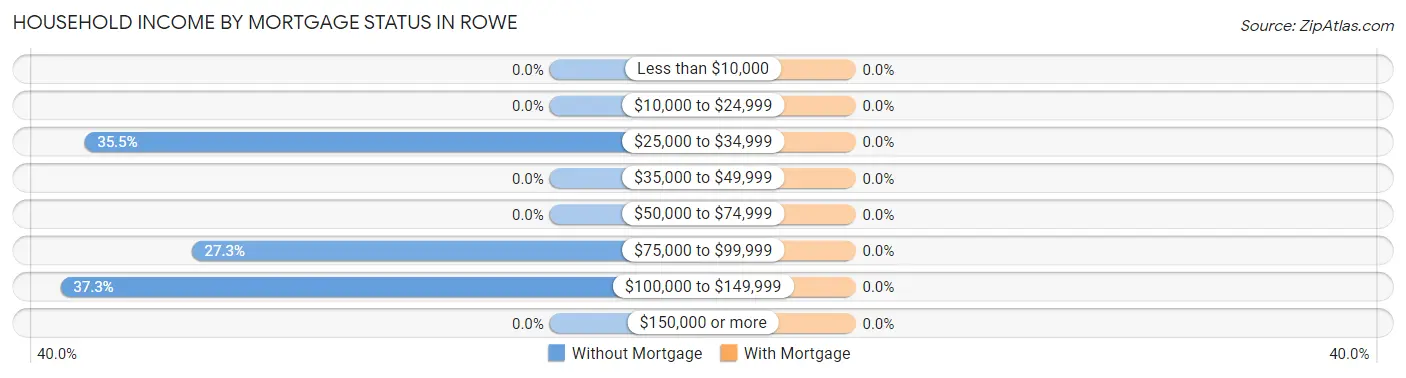
| Household Income | Without Mortgage | With Mortgage |
| Less than $10,000 | 0 (0.0%) | 0 (0.0%) |
| $10,000 to $24,999 | 0 (0.0%) | 0 (0.0%) |
| $25,000 to $34,999 | 39 (35.4%) | 0 (0.0%) |
| $35,000 to $49,999 | 0 (0.0%) | 0 (0.0%) |
| $50,000 to $74,999 | 0 (0.0%) | 0 (0.0%) |
| $75,000 to $99,999 | 30 (27.3%) | 0 (0.0%) |
| $100,000 to $149,999 | 41 (37.3%) | 0 (0.0%) |
| $150,000 or more | 0 (0.0%) | 0 (0.0%) |
| Total | 110 (100.0%) | 0 (0.0%) |
Property Value to Household Income Ratio in Rowe
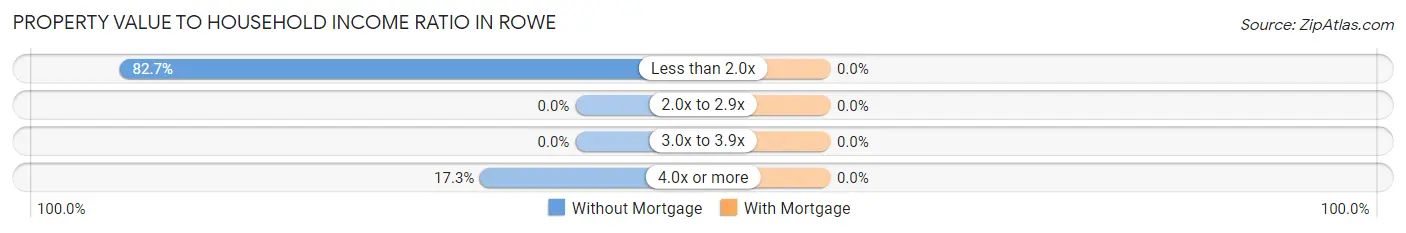
| Value-to-Income Ratio | Without Mortgage | With Mortgage |
| Less than 2.0x | 91 (82.7%) | 0 (0.0%) |
| 2.0x to 2.9x | 0 (0.0%) | 0 (0.0%) |
| 3.0x to 3.9x | 0 (0.0%) | 0 (0.0%) |
| 4.0x or more | 19 (17.3%) | 0 (0.0%) |
| Total | 110 (100.0%) | 0 (0.0%) |
Real Estate Taxes by Mortgage Status in Rowe
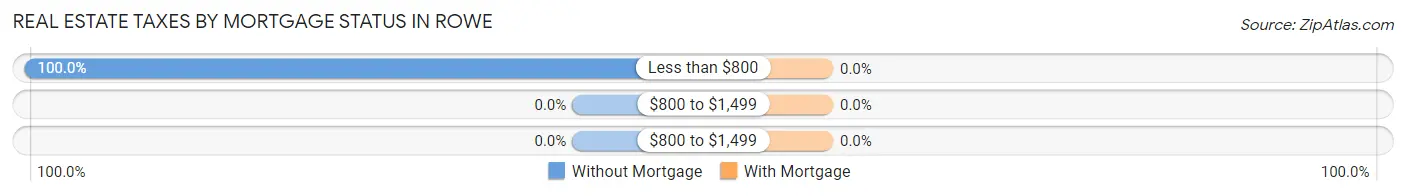
| Property Taxes | Without Mortgage | With Mortgage |
| Less than $800 | 110 (100.0%) | 0 (0.0%) |
| $800 to $1,499 | 0 (0.0%) | 0 (0.0%) |
| $800 to $1,499 | 0 (0.0%) | 0 (0.0%) |
| Total | 110 (100.0%) | 0 (0.0%) |
Health & Disability in Rowe
Health Insurance Coverage by Age in Rowe
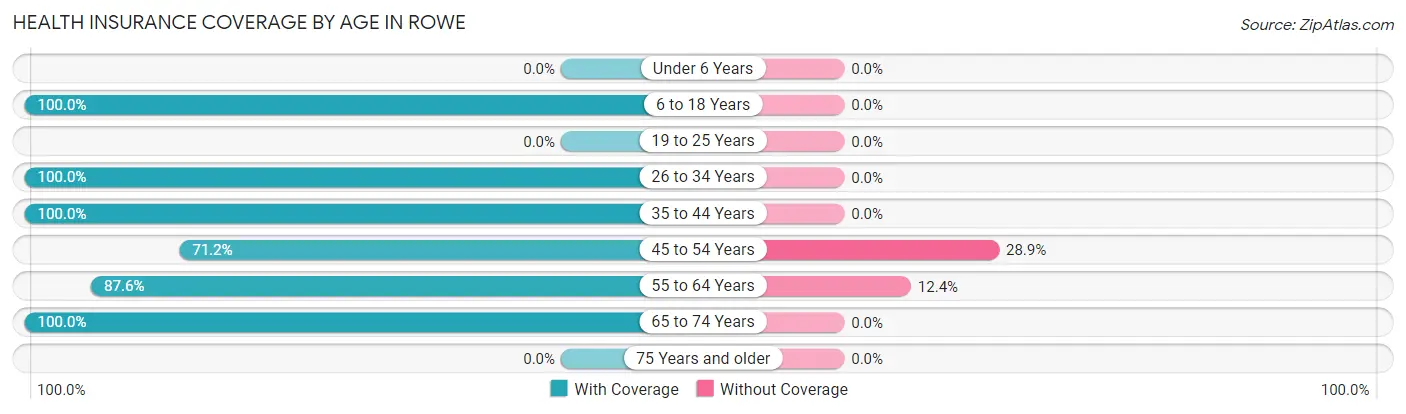
| Age Bracket | With Coverage | Without Coverage |
| Under 6 Years | 0 (0.0%) | 0 (0.0%) |
| 6 to 18 Years | 105 (100.0%) | 0 (0.0%) |
| 19 to 25 Years | 0 (0.0%) | 0 (0.0%) |
| 26 to 34 Years | 175 (100.0%) | 0 (0.0%) |
| 35 to 44 Years | 48 (100.0%) | 0 (0.0%) |
| 45 to 54 Years | 37 (71.2%) | 15 (28.8%) |
| 55 to 64 Years | 134 (87.6%) | 19 (12.4%) |
| 65 to 74 Years | 49 (100.0%) | 0 (0.0%) |
| 75 Years and older | 0 (0.0%) | 0 (0.0%) |
| Total | 548 (94.2%) | 34 (5.8%) |
Health Insurance Coverage by Citizenship Status in Rowe
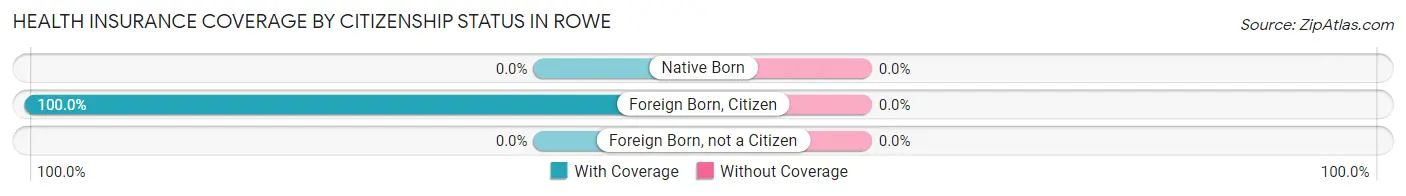
| Citizenship Status | With Coverage | Without Coverage |
| Native Born | 0 (0.0%) | 0 (0.0%) |
| Foreign Born, Citizen | 105 (100.0%) | 0 (0.0%) |
| Foreign Born, not a Citizen | 0 (0.0%) | 0 (0.0%) |
Health Insurance Coverage by Household Income in Rowe
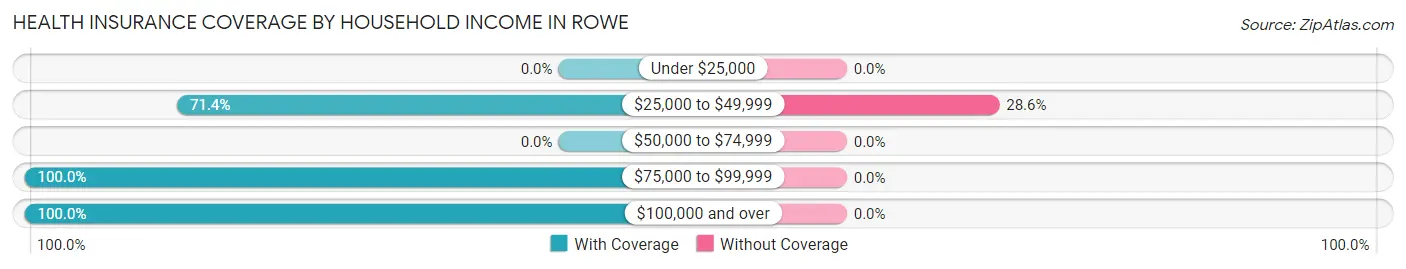
| Household Income | With Coverage | Without Coverage |
| Under $25,000 | 0 (0.0%) | 0 (0.0%) |
| $25,000 to $49,999 | 85 (71.4%) | 34 (28.6%) |
| $50,000 to $74,999 | 0 (0.0%) | 0 (0.0%) |
| $75,000 to $99,999 | 115 (100.0%) | 0 (0.0%) |
| $100,000 and over | 348 (100.0%) | 0 (0.0%) |
Public vs Private Health Insurance Coverage by Age in Rowe
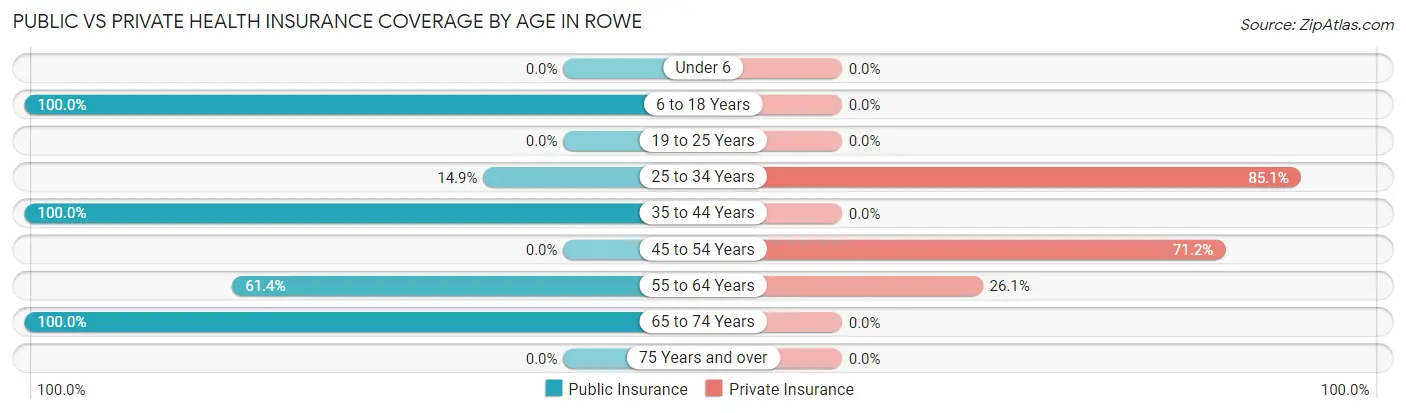
| Age Bracket | Public Insurance | Private Insurance |
| Under 6 | 0 (0.0%) | 0 (0.0%) |
| 6 to 18 Years | 105 (100.0%) | 0 (0.0%) |
| 19 to 25 Years | 0 (0.0%) | 0 (0.0%) |
| 25 to 34 Years | 26 (14.9%) | 149 (85.1%) |
| 35 to 44 Years | 48 (100.0%) | 0 (0.0%) |
| 45 to 54 Years | 0 (0.0%) | 37 (71.2%) |
| 55 to 64 Years | 94 (61.4%) | 40 (26.1%) |
| 65 to 74 Years | 49 (100.0%) | 0 (0.0%) |
| 75 Years and over | 0 (0.0%) | 0 (0.0%) |
| Total | 322 (55.3%) | 226 (38.8%) |
Disability Status by Sex by Age in Rowe
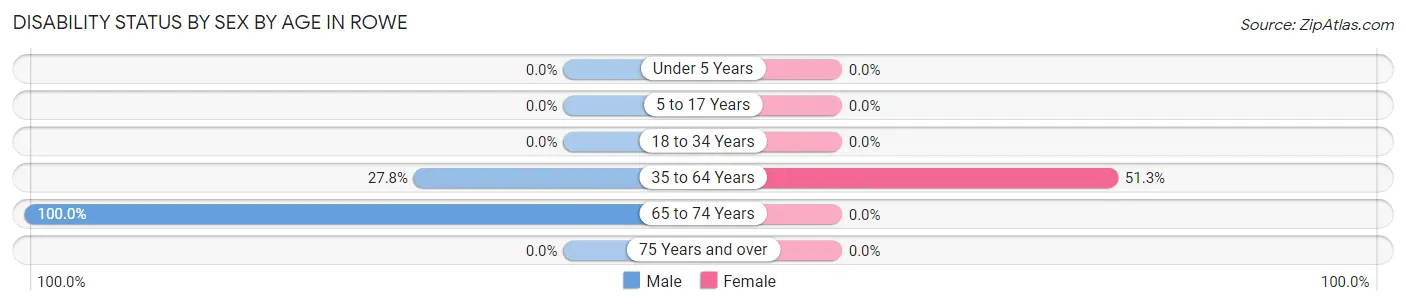
| Age Bracket | Male | Female |
| Under 5 Years | 0 (0.0%) | 0 (0.0%) |
| 5 to 17 Years | 0 (0.0%) | 0 (0.0%) |
| 18 to 34 Years | 0 (0.0%) | 0 (0.0%) |
| 35 to 64 Years | 48 (27.8%) | 41 (51.2%) |
| 65 to 74 Years | 19 (100.0%) | 0 (0.0%) |
| 75 Years and over | 0 (0.0%) | 0 (0.0%) |
Disability Class by Sex by Age in Rowe
Disability Class: Hearing Difficulty
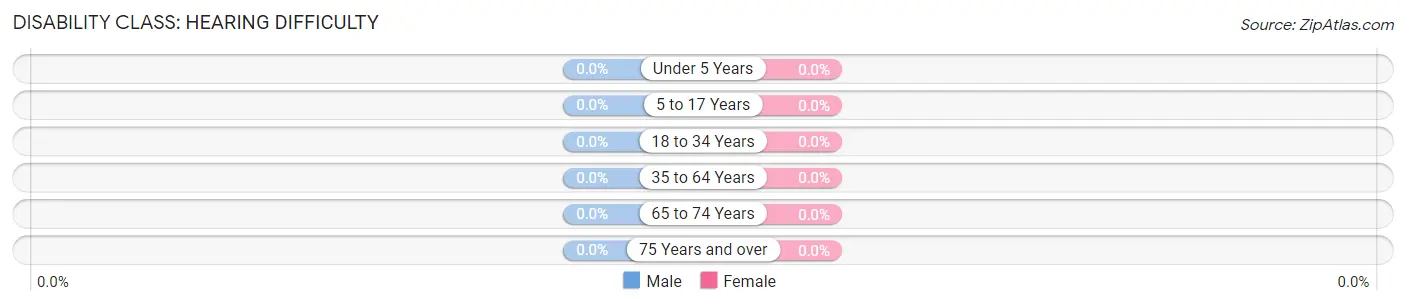
| Age Bracket | Male | Female |
| Under 5 Years | 0 (0.0%) | 0 (0.0%) |
| 5 to 17 Years | 0 (0.0%) | 0 (0.0%) |
| 18 to 34 Years | 0 (0.0%) | 0 (0.0%) |
| 35 to 64 Years | 0 (0.0%) | 0 (0.0%) |
| 65 to 74 Years | 0 (0.0%) | 0 (0.0%) |
| 75 Years and over | 0 (0.0%) | 0 (0.0%) |
Disability Class: Vision Difficulty
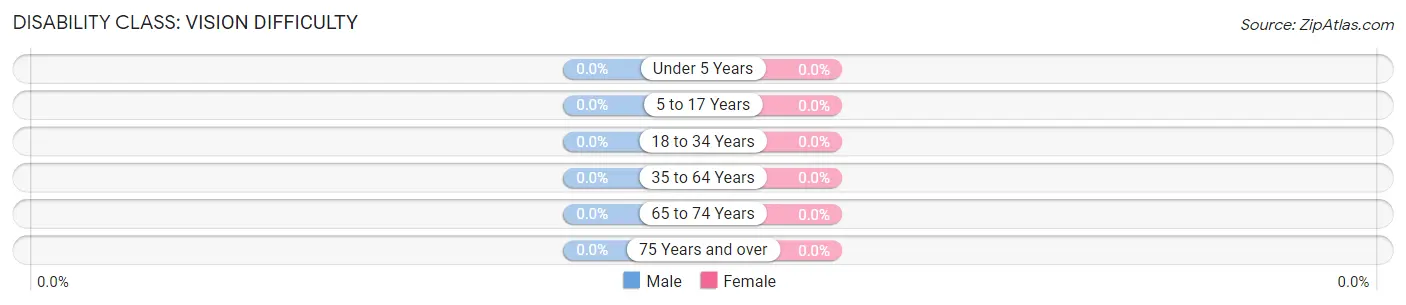
| Age Bracket | Male | Female |
| Under 5 Years | 0 (0.0%) | 0 (0.0%) |
| 5 to 17 Years | 0 (0.0%) | 0 (0.0%) |
| 18 to 34 Years | 0 (0.0%) | 0 (0.0%) |
| 35 to 64 Years | 0 (0.0%) | 0 (0.0%) |
| 65 to 74 Years | 0 (0.0%) | 0 (0.0%) |
| 75 Years and over | 0 (0.0%) | 0 (0.0%) |
Disability Class: Cognitive Difficulty
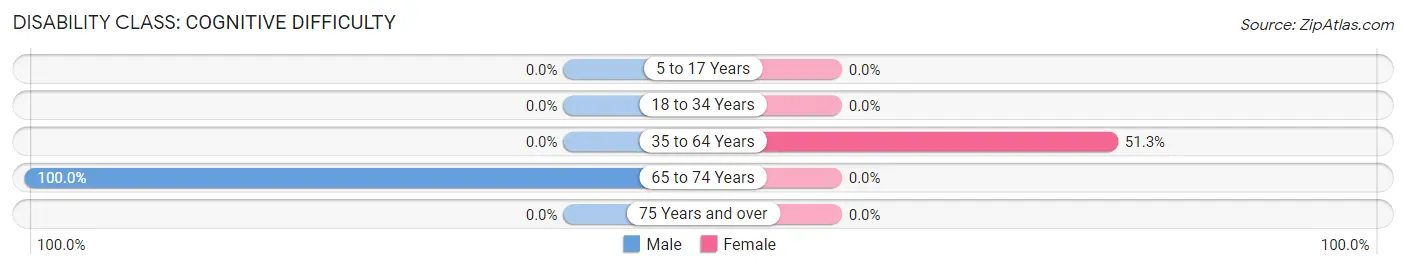
| Age Bracket | Male | Female |
| 5 to 17 Years | 0 (0.0%) | 0 (0.0%) |
| 18 to 34 Years | 0 (0.0%) | 0 (0.0%) |
| 35 to 64 Years | 0 (0.0%) | 41 (51.2%) |
| 65 to 74 Years | 19 (100.0%) | 0 (0.0%) |
| 75 Years and over | 0 (0.0%) | 0 (0.0%) |
Disability Class: Ambulatory Difficulty
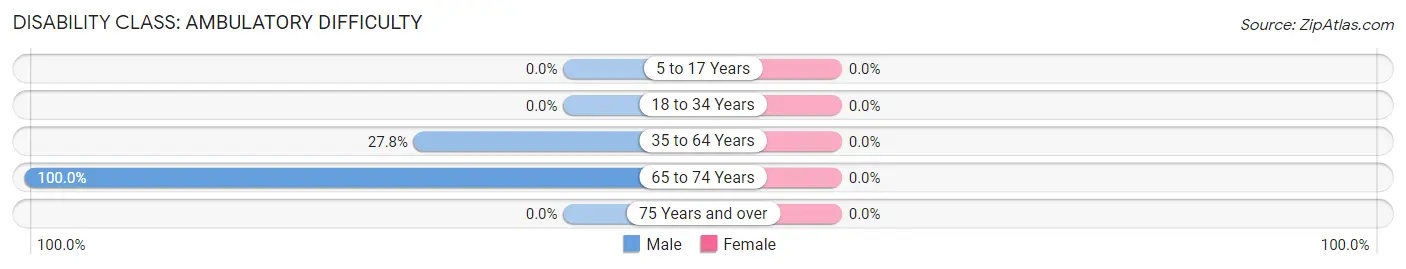
| Age Bracket | Male | Female |
| 5 to 17 Years | 0 (0.0%) | 0 (0.0%) |
| 18 to 34 Years | 0 (0.0%) | 0 (0.0%) |
| 35 to 64 Years | 48 (27.8%) | 0 (0.0%) |
| 65 to 74 Years | 19 (100.0%) | 0 (0.0%) |
| 75 Years and over | 0 (0.0%) | 0 (0.0%) |
Disability Class: Self-Care Difficulty
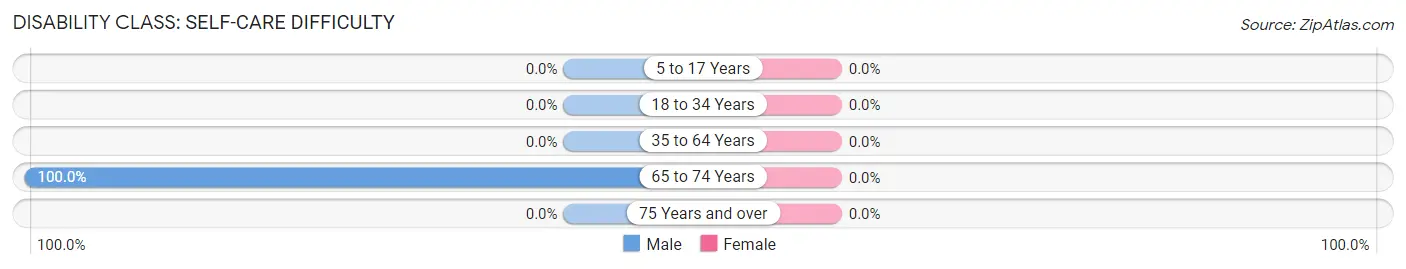
| Age Bracket | Male | Female |
| 5 to 17 Years | 0 (0.0%) | 0 (0.0%) |
| 18 to 34 Years | 0 (0.0%) | 0 (0.0%) |
| 35 to 64 Years | 0 (0.0%) | 0 (0.0%) |
| 65 to 74 Years | 19 (100.0%) | 0 (0.0%) |
| 75 Years and over | 0 (0.0%) | 0 (0.0%) |
Technology Access in Rowe
Computing Device Access in Rowe
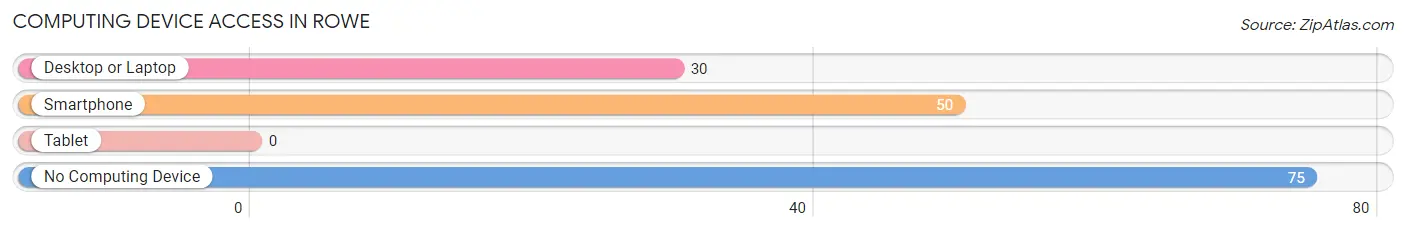
| Device Type | # Households | % Households |
| Desktop or Laptop | 30 | 24.0% |
| Smartphone | 50 | 40.0% |
| Tablet | 0 | 0.0% |
| No Computing Device | 75 | 60.0% |
| Total | 125 | 100.0% |
Internet Access in Rowe
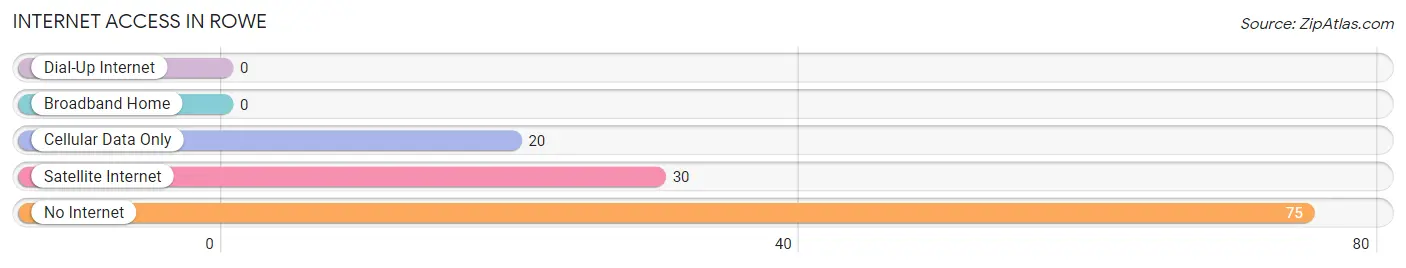
| Internet Type | # Households | % Households |
| Dial-Up Internet | 0 | 0.0% |
| Broadband Home | 0 | 0.0% |
| Cellular Data Only | 20 | 16.0% |
| Satellite Internet | 30 | 24.0% |
| No Internet | 75 | 60.0% |
| Total | 125 | 100.0% |
Rowe Summary
Rowe is a small town located in the northern part of New Mexico, in the United States. It is situated in the foothills of the Sangre de Cristo Mountains, and is part of the Santa Fe metropolitan area. The town has a population of approximately 1,000 people, and is known for its rural charm and scenic beauty.
History
Rowe was founded in 1876 by a group of settlers from the nearby town of Santa Fe. The settlers were looking for a place to settle and farm, and Rowe was the perfect spot. The town was named after the first settler, John Rowe, who was a rancher and farmer. The town quickly grew, and by the early 1900s, it had become a thriving agricultural community.
In the early 1900s, Rowe was a popular destination for tourists, who came to enjoy the scenic beauty of the area. The town was also known for its excellent hunting and fishing opportunities. In the 1920s, the town was home to a large number of artists, writers, and musicians, who were drawn to the area by its beauty and peaceful atmosphere.
Geography
Rowe is located in the northern part of New Mexico, in the foothills of the Sangre de Cristo Mountains. The town is situated at an elevation of 6,000 feet, and is surrounded by rolling hills and lush forests. The town is located approximately 30 miles north of Santa Fe, and is accessible by car or bus.
The climate in Rowe is semi-arid, with hot summers and cold winters. The average annual temperature is around 50 degrees Fahrenheit, and the average annual precipitation is around 12 inches.
Economy
The economy of Rowe is largely based on agriculture and tourism. The town is home to several small farms, which produce a variety of crops, including corn, wheat, and hay. The town is also home to several small businesses, including restaurants, shops, and galleries.
Tourism is an important part of the economy of Rowe. The town is a popular destination for outdoor enthusiasts, who come to enjoy the scenic beauty of the area. The town is also home to several art galleries, which feature the work of local artists.
Demographics
As of the 2010 census, the population of Rowe was 1,000 people. The racial makeup of the town was 94.2% White, 0.7% African American, 0.7% Native American, 0.7% Asian, 0.3% Pacific Islander, and 3.1% from other races. The median household income was $37,500, and the median family income was $45,000.
Rowe is a small town with a rich history and a unique culture. The town is known for its rural charm and scenic beauty, and is a popular destination for outdoor enthusiasts and art lovers alike. The town is home to a diverse population, and is a great place to live and work.
Common Questions
What is Per Capita Income in Rowe?
Per Capita income in Rowe is $21,203.
What is the Median Family Income in Rowe?
Median Family Income in Rowe is $91,333.
What is the Median Household income in Rowe?
Median Household Income in Rowe is $90,708.
What is Inequality or Gini Index in Rowe?
Inequality or Gini Index in Rowe is 0.28.
What is the Total Population of Rowe?
Total Population of Rowe is 582.
What is the Total Male Population of Rowe?
Total Male Population of Rowe is 428.
What is the Total Female Population of Rowe?
Total Female Population of Rowe is 154.
What is the Ratio of Males per 100 Females in Rowe?
There are 277.92 Males per 100 Females in Rowe.
What is the Ratio of Females per 100 Males in Rowe?
There are 35.98 Females per 100 Males in Rowe.
What is the Median Population Age in Rowe?
Median Population Age in Rowe is 36.2 Years.
What is the Average Family Size in Rowe
Average Family Size in Rowe is 5.2 People.
What is the Average Household Size in Rowe
Average Household Size in Rowe is 4.7 People.
How Large is the Labor Force in Rowe?
There are 274 People in the Labor Forcein in Rowe.
What is the Percentage of People in the Labor Force in Rowe?
57.4% of People are in the Labor Force in Rowe.