Red River, NM Map & Demographics
Red River Map
Red River Overview
$44,815
PER CAPITA INCOME
0.57
INEQUALITY / GINI INDEX
512
TOTAL POPULATION
142
MALE POPULATION
370
FEMALE POPULATION
38.38
MALES / 100 FEMALES
260.56
FEMALES / 100 MALES
43.3
MEDIAN AGE
2.1
AVG FAMILY SIZE
1.9
AVG HOUSEHOLD SIZE
260
LABOR FORCE [ PEOPLE ]
63.0%
PERCENT IN LABOR FORCE
Red River Zip Codes
Red River Area Codes
Income in Red River
Income Overview in Red River
| Characteristic | Number | Measure |
| Per Capita Income | 512 | $44,815 |
| Median Family Income | 172 | $0 |
| Mean Family Income | 172 | $76,757 |
| Median Household Income | 271 | $0 |
| Mean Household Income | 271 | $68,340 |
| Income Deficit | 172 | $0 |
| Wage / Income Gap (%) | 512 | 0.00% |
| Wage / Income Gap ($) | 512 | 100.00¢ per $1 |
| Gini / Inequality Index | 512 | 0.57 |
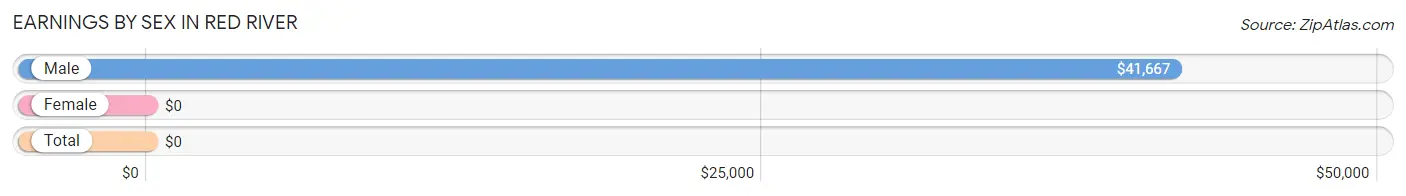
Earnings by Sex in Red River
| Sex | Number | Average Earnings |
| Male | 106 (30.2%) | $41,667 |
| Female | 245 (69.8%) | $0 |
| Total | 351 (100.0%) | $0 |
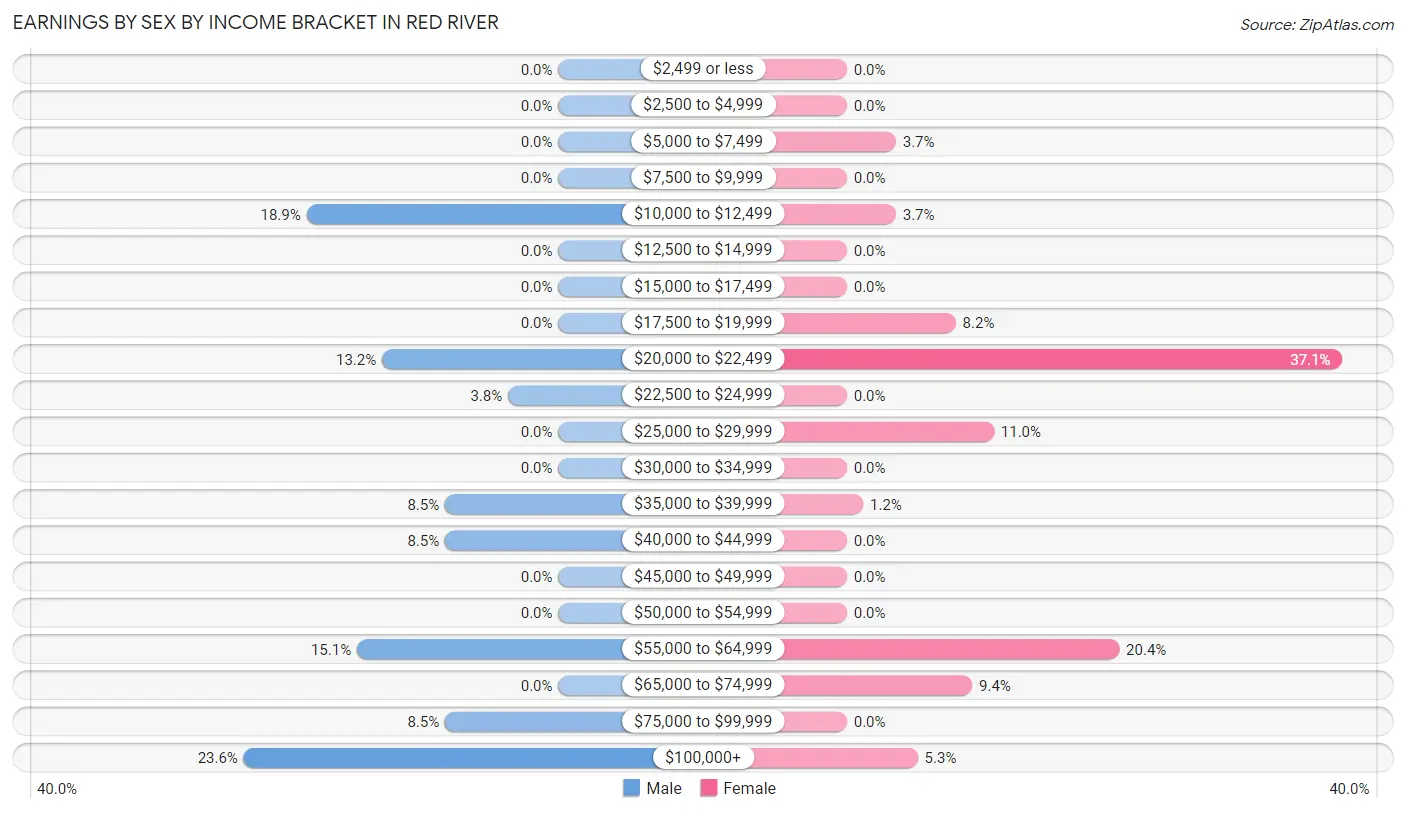
Earnings by Sex by Income Bracket in Red River
The most common earnings brackets in Red River are $100,000+ for men (25 | 23.6%) and $20,000 to $22,499 for women (91 | 37.1%).
| Income | Male | Female |
| $2,499 or less | 0 (0.0%) | 0 (0.0%) |
| $2,500 to $4,999 | 0 (0.0%) | 0 (0.0%) |
| $5,000 to $7,499 | 0 (0.0%) | 9 (3.7%) |
| $7,500 to $9,999 | 0 (0.0%) | 0 (0.0%) |
| $10,000 to $12,499 | 20 (18.9%) | 9 (3.7%) |
| $12,500 to $14,999 | 0 (0.0%) | 0 (0.0%) |
| $15,000 to $17,499 | 0 (0.0%) | 0 (0.0%) |
| $17,500 to $19,999 | 0 (0.0%) | 20 (8.2%) |
| $20,000 to $22,499 | 14 (13.2%) | 91 (37.1%) |
| $22,500 to $24,999 | 4 (3.8%) | 0 (0.0%) |
| $25,000 to $29,999 | 0 (0.0%) | 27 (11.0%) |
| $30,000 to $34,999 | 0 (0.0%) | 0 (0.0%) |
| $35,000 to $39,999 | 9 (8.5%) | 3 (1.2%) |
| $40,000 to $44,999 | 9 (8.5%) | 0 (0.0%) |
| $45,000 to $49,999 | 0 (0.0%) | 0 (0.0%) |
| $50,000 to $54,999 | 0 (0.0%) | 0 (0.0%) |
| $55,000 to $64,999 | 16 (15.1%) | 50 (20.4%) |
| $65,000 to $74,999 | 0 (0.0%) | 23 (9.4%) |
| $75,000 to $99,999 | 9 (8.5%) | 0 (0.0%) |
| $100,000+ | 25 (23.6%) | 13 (5.3%) |
| Total | 106 (100.0%) | 245 (100.0%) |
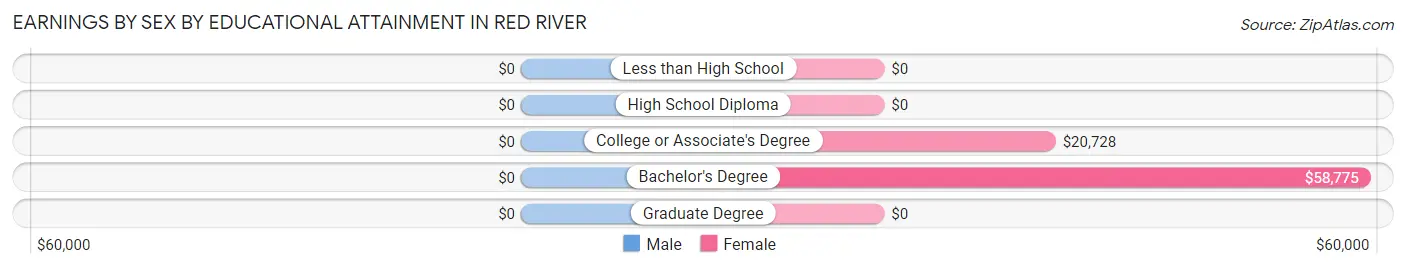
Earnings by Sex by Educational Attainment in Red River
| Educational Attainment | Male Income | Female Income |
| Less than High School | - | - |
| High School Diploma | - | - |
| College or Associate's Degree | - | - |
| Bachelor's Degree | - | - |
| Graduate Degree | - | - |
| Total | - | - |
Family Income in Red River
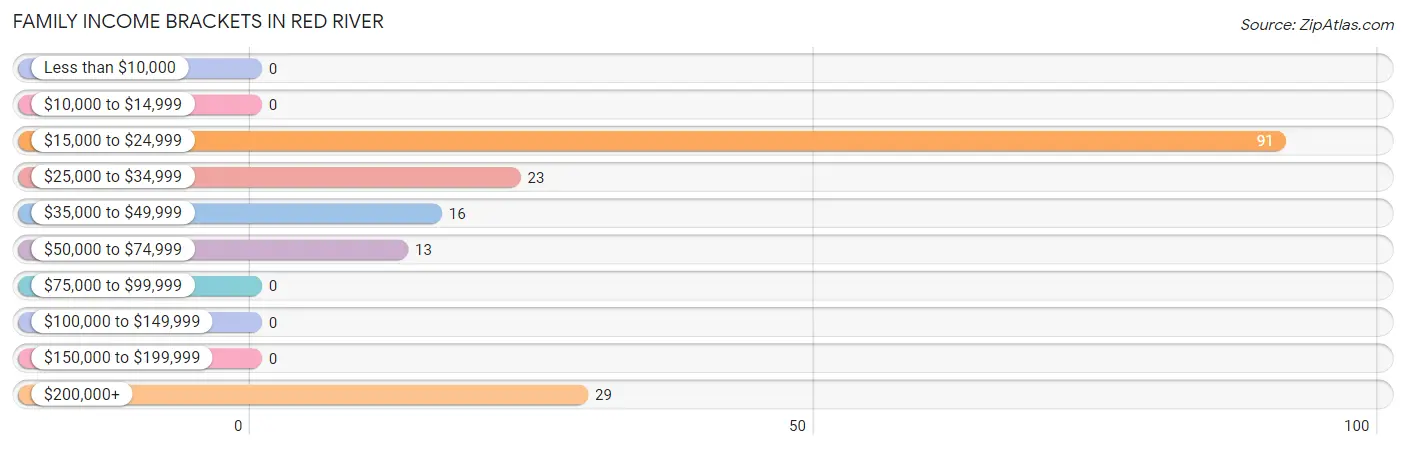
Family Income Brackets in Red River
According to the Red River family income data, there are 91 families falling into the $15,000 to $24,999 income range, which is the most common income bracket and makes up 52.9% of all families.
| Income Bracket | # Families | % Families |
| Less than $10,000 | 0 | 0.0% |
| $10,000 to $14,999 | 0 | 0.0% |
| $15,000 to $24,999 | 91 | 52.9% |
| $25,000 to $34,999 | 23 | 13.4% |
| $35,000 to $49,999 | 16 | 9.3% |
| $50,000 to $74,999 | 13 | 7.6% |
| $75,000 to $99,999 | 0 | 0.0% |
| $100,000 to $149,999 | 0 | 0.0% |
| $150,000 to $199,999 | 0 | 0.0% |
| $200,000+ | 29 | 16.9% |
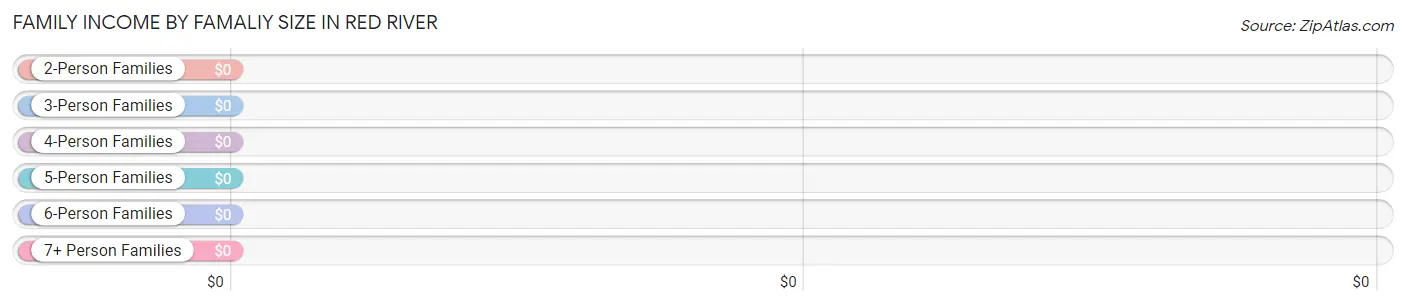
Family Income by Famaliy Size in Red River
| Income Bracket | # Families | Median Income |
| 2-Person Families | 172 (100.0%) | $0 |
| 3-Person Families | 0 (0.0%) | $0 |
| 4-Person Families | 0 (0.0%) | $0 |
| 5-Person Families | 0 (0.0%) | $0 |
| 6-Person Families | 0 (0.0%) | $0 |
| 7+ Person Families | 0 (0.0%) | $0 |
| Total | 172 (100.0%) | $0 |
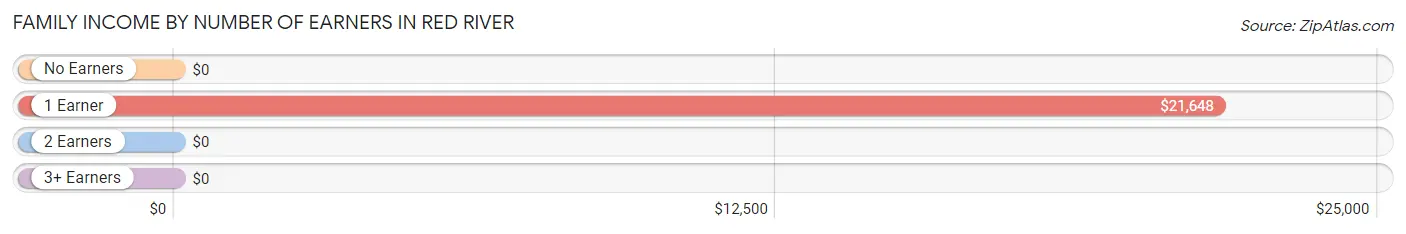
Family Income by Number of Earners in Red River
| Number of Earners | # Families | Median Income |
| No Earners | 15 (8.7%) | $0 |
| 1 Earner | 120 (69.8%) | $21,648 |
| 2 Earners | 37 (21.5%) | $0 |
| 3+ Earners | 0 (0.0%) | $0 |
| Total | 172 (100.0%) | $0 |
Household Income in Red River
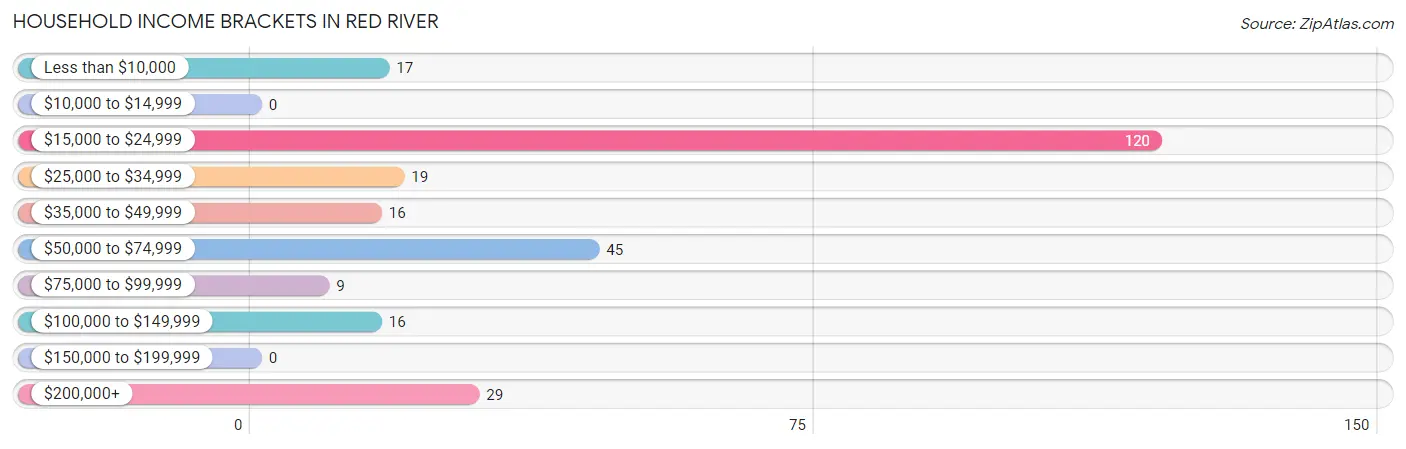
Household Income Brackets in Red River
With 120 households falling in the category, the $15,000 to $24,999 income range is the most frequent in Red River, accounting for 44.3% of all households.
| Income Bracket | # Households | % Households |
| Less than $10,000 | 17 | 6.3% |
| $10,000 to $14,999 | 0 | 0.0% |
| $15,000 to $24,999 | 120 | 44.3% |
| $25,000 to $34,999 | 19 | 7.0% |
| $35,000 to $49,999 | 16 | 5.9% |
| $50,000 to $74,999 | 45 | 16.6% |
| $75,000 to $99,999 | 9 | 3.3% |
| $100,000 to $149,999 | 16 | 5.9% |
| $150,000 to $199,999 | 0 | 0.0% |
| $200,000+ | 29 | 10.7% |
Household Income by Householder Age in Red River
| Income Bracket | # Households | Median Income |
| 15 to 24 Years | 9 (3.3%) | $0 |
| 25 to 44 Years | 153 (56.5%) | $0 |
| 45 to 64 Years | 54 (19.9%) | $0 |
| 65+ Years | 55 (20.3%) | $0 |
| Total | 271 (100.0%) | $0 |
Poverty in Red River
Income Below Poverty by Sex and Age in Red River
With 3.5% poverty level for males and 3.2% for females among the residents of Red River, 75 year old and over males and 55 to 64 year old females are the most vulnerable to poverty, with 5 males (31.2%) and 12 females (30.8%) in their respective age groups living below the poverty level.
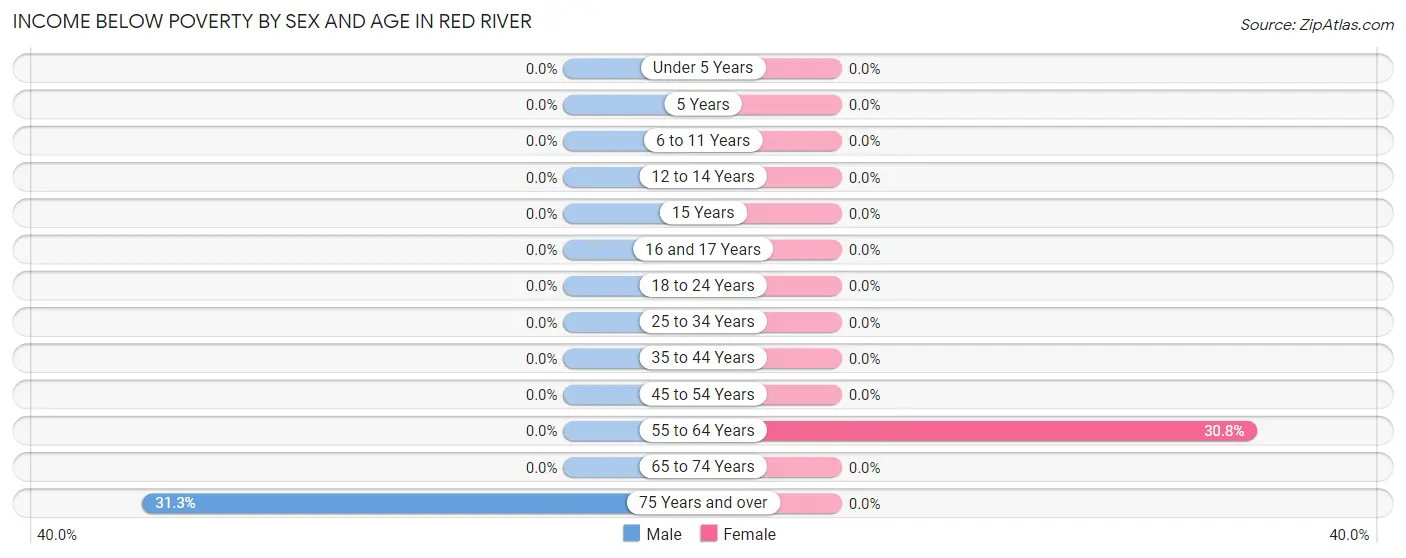
| Age Bracket | Male | Female |
| Under 5 Years | 0 (0.0%) | 0 (0.0%) |
| 5 Years | 0 (0.0%) | 0 (0.0%) |
| 6 to 11 Years | 0 (0.0%) | 0 (0.0%) |
| 12 to 14 Years | 0 (0.0%) | 0 (0.0%) |
| 15 Years | 0 (0.0%) | 0 (0.0%) |
| 16 and 17 Years | 0 (0.0%) | 0 (0.0%) |
| 18 to 24 Years | 0 (0.0%) | 0 (0.0%) |
| 25 to 34 Years | 0 (0.0%) | 0 (0.0%) |
| 35 to 44 Years | 0 (0.0%) | 0 (0.0%) |
| 45 to 54 Years | 0 (0.0%) | 0 (0.0%) |
| 55 to 64 Years | 0 (0.0%) | 12 (30.8%) |
| 65 to 74 Years | 0 (0.0%) | 0 (0.0%) |
| 75 Years and over | 5 (31.2%) | 0 (0.0%) |
| Total | 5 (3.5%) | 12 (3.2%) |
Income Above Poverty by Sex and Age in Red River
According to the poverty statistics in Red River, males aged 18 to 24 years and females aged under 5 years are the age groups that are most secure financially, with 100.0% of males and 100.0% of females in these age groups living above the poverty line.
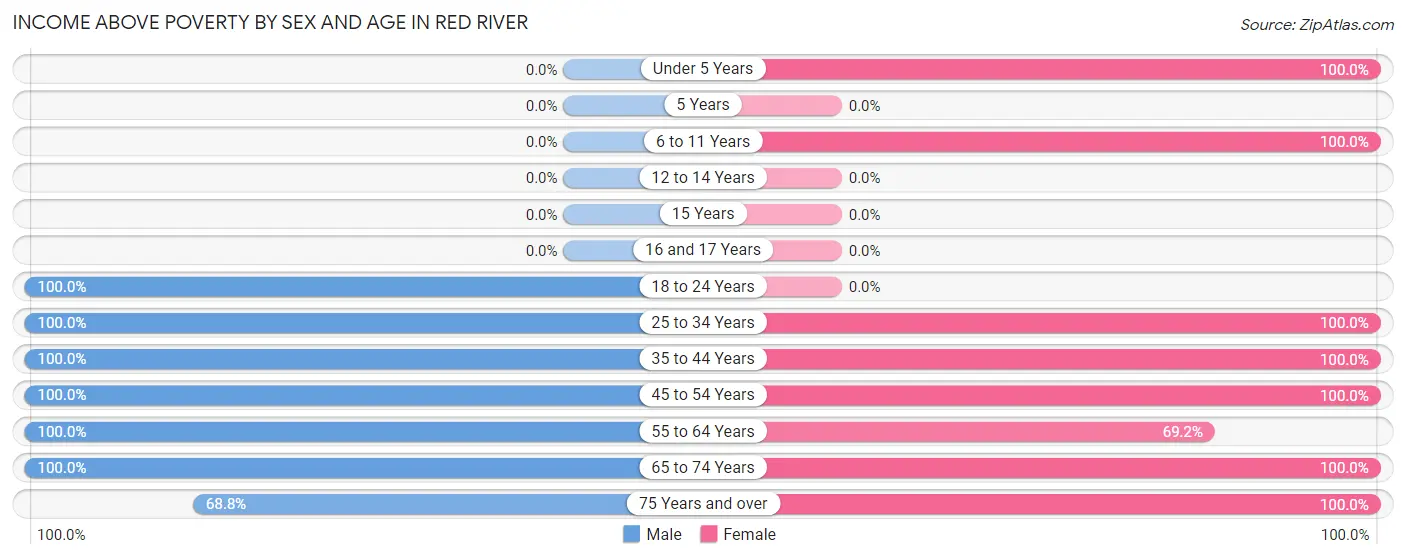
| Age Bracket | Male | Female |
| Under 5 Years | 0 (0.0%) | 14 (100.0%) |
| 5 Years | 0 (0.0%) | 0 (0.0%) |
| 6 to 11 Years | 0 (0.0%) | 85 (100.0%) |
| 12 to 14 Years | 0 (0.0%) | 0 (0.0%) |
| 15 Years | 0 (0.0%) | 0 (0.0%) |
| 16 and 17 Years | 0 (0.0%) | 0 (0.0%) |
| 18 to 24 Years | 18 (100.0%) | 0 (0.0%) |
| 25 to 34 Years | 27 (100.0%) | 18 (100.0%) |
| 35 to 44 Years | 16 (100.0%) | 155 (100.0%) |
| 45 to 54 Years | 9 (100.0%) | 3 (100.0%) |
| 55 to 64 Years | 27 (100.0%) | 27 (69.2%) |
| 65 to 74 Years | 29 (100.0%) | 36 (100.0%) |
| 75 Years and over | 11 (68.8%) | 20 (100.0%) |
| Total | 137 (96.5%) | 358 (96.8%) |
Income Below Poverty Among Married-Couple Families in Red River
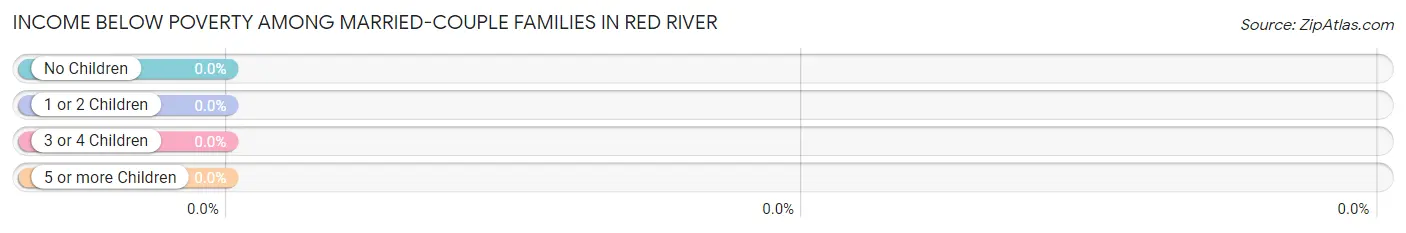
| Children | Above Poverty | Below Poverty |
| No Children | 63 (100.0%) | 0 (0.0%) |
| 1 or 2 Children | 0 (0.0%) | 0 (0.0%) |
| 3 or 4 Children | 0 (0.0%) | 0 (0.0%) |
| 5 or more Children | 0 (0.0%) | 0 (0.0%) |
| Total | 63 (100.0%) | 0 (0.0%) |
Income Below Poverty Among Single-Parent Households in Red River
| Children | Single Father | Single Mother |
| No Children | 0 (0.0%) | 0 (0.0%) |
| 1 or 2 Children | 0 (0.0%) | 0 (0.0%) |
| 3 or 4 Children | 0 (0.0%) | 0 (0.0%) |
| 5 or more Children | 0 (0.0%) | 0 (0.0%) |
| Total | 0 (0.0%) | 0 (0.0%) |
Income Below Poverty Among Married-Couple vs Single-Parent Households in Red River
| Children | Married-Couple Families | Single-Parent Households |
| No Children | 0 (0.0%) | 0 (0.0%) |
| 1 or 2 Children | 0 (0.0%) | 0 (0.0%) |
| 3 or 4 Children | 0 (0.0%) | 0 (0.0%) |
| 5 or more Children | 0 (0.0%) | 0 (0.0%) |
| Total | 0 (0.0%) | 0 (0.0%) |
Race in Red River
The most populous races in Red River are White / Caucasian (500 | 97.7%), Hispanic or Latino (50 | 9.8%), and Two or more Races (12 | 2.3%).
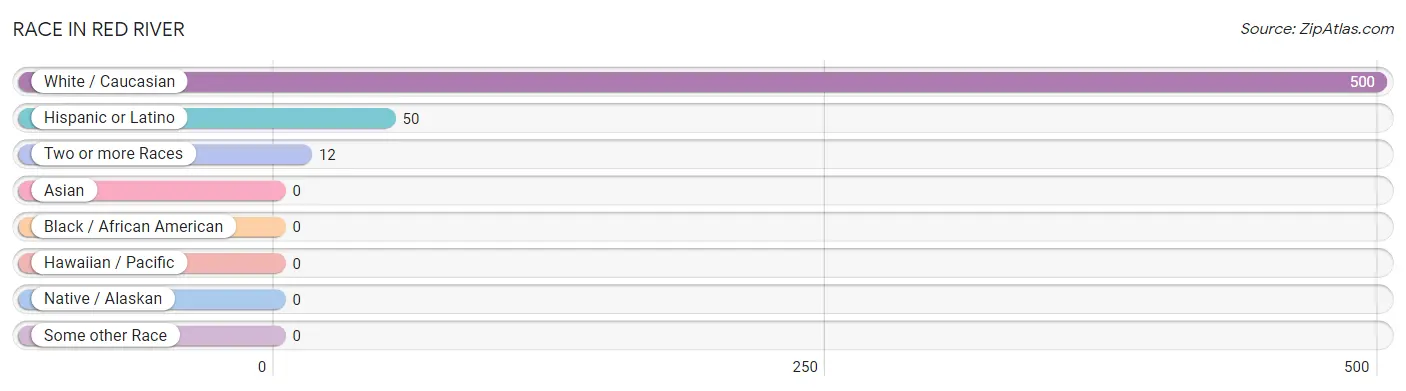
| Race | # Population | % Population |
| Asian | 0 | 0.0% |
| Black / African American | 0 | 0.0% |
| Hawaiian / Pacific | 0 | 0.0% |
| Hispanic or Latino | 50 | 9.8% |
| Native / Alaskan | 0 | 0.0% |
| White / Caucasian | 500 | 97.7% |
| Two or more Races | 12 | 2.3% |
| Some other Race | 0 | 0.0% |
| Total | 512 | 100.0% |
Ancestry in Red River
The most populous ancestries reported in Red River are Irish (235 | 45.9%), English (225 | 44.0%), German (59 | 11.5%), Italian (41 | 8.0%), and Colombian (23 | 4.5%), together accounting for 113.9% of all Red River residents.
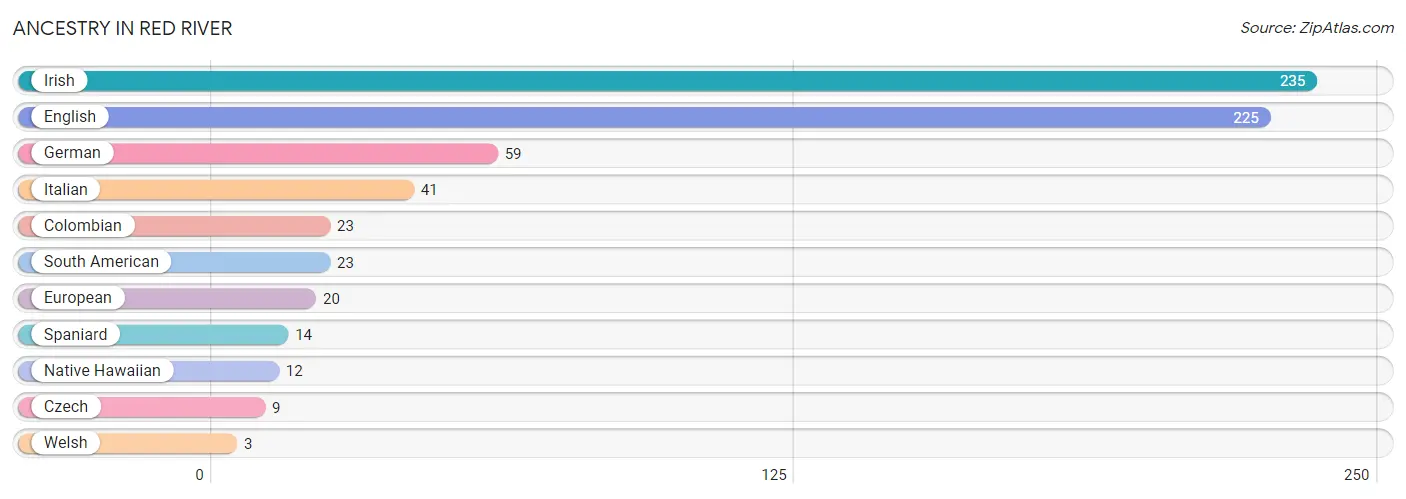
| Ancestry | # Population | % Population |
| Colombian | 23 | 4.5% |
| Czech | 9 | 1.8% |
| English | 225 | 44.0% |
| European | 20 | 3.9% |
| German | 59 | 11.5% |
| Irish | 235 | 45.9% |
| Italian | 41 | 8.0% |
| Native Hawaiian | 12 | 2.3% |
| South American | 23 | 4.5% |
| Spaniard | 14 | 2.7% |
| Welsh | 3 | 0.6% | View All 11 Rows |
Immigrants in Red River

| Immigration Origin | # Population | % Population | View All 0 Rows |
Sex and Age in Red River
Sex and Age in Red River
The most populous age groups in Red River are 70 to 74 Years (29 | 20.4%) for men and 40 to 44 Years (91 | 24.6%) for women.
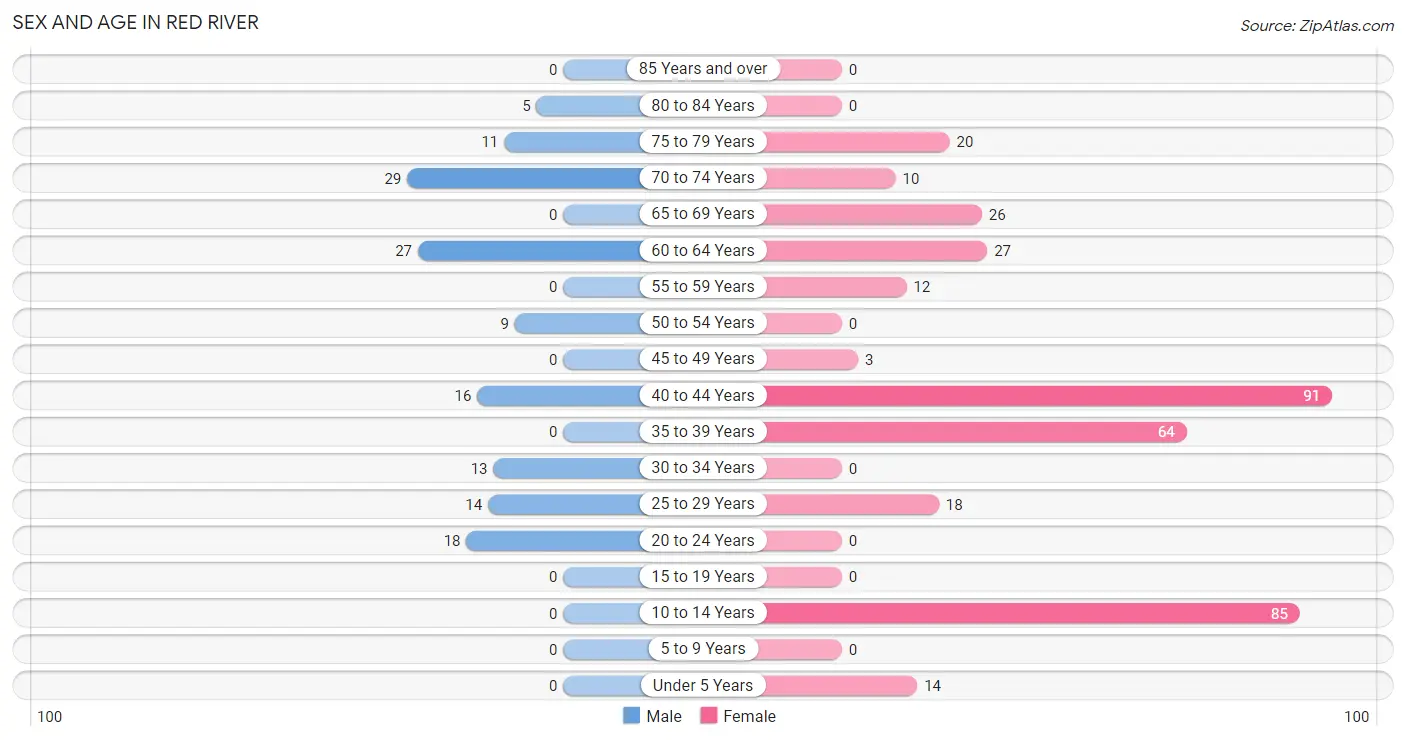
| Age Bracket | Male | Female |
| Under 5 Years | 0 (0.0%) | 14 (3.8%) |
| 5 to 9 Years | 0 (0.0%) | 0 (0.0%) |
| 10 to 14 Years | 0 (0.0%) | 85 (23.0%) |
| 15 to 19 Years | 0 (0.0%) | 0 (0.0%) |
| 20 to 24 Years | 18 (12.7%) | 0 (0.0%) |
| 25 to 29 Years | 14 (9.9%) | 18 (4.9%) |
| 30 to 34 Years | 13 (9.1%) | 0 (0.0%) |
| 35 to 39 Years | 0 (0.0%) | 64 (17.3%) |
| 40 to 44 Years | 16 (11.3%) | 91 (24.6%) |
| 45 to 49 Years | 0 (0.0%) | 3 (0.8%) |
| 50 to 54 Years | 9 (6.3%) | 0 (0.0%) |
| 55 to 59 Years | 0 (0.0%) | 12 (3.2%) |
| 60 to 64 Years | 27 (19.0%) | 27 (7.3%) |
| 65 to 69 Years | 0 (0.0%) | 26 (7.0%) |
| 70 to 74 Years | 29 (20.4%) | 10 (2.7%) |
| 75 to 79 Years | 11 (7.7%) | 20 (5.4%) |
| 80 to 84 Years | 5 (3.5%) | 0 (0.0%) |
| 85 Years and over | 0 (0.0%) | 0 (0.0%) |
| Total | 142 (100.0%) | 370 (100.0%) |
Families and Households in Red River
Median Family Size in Red River
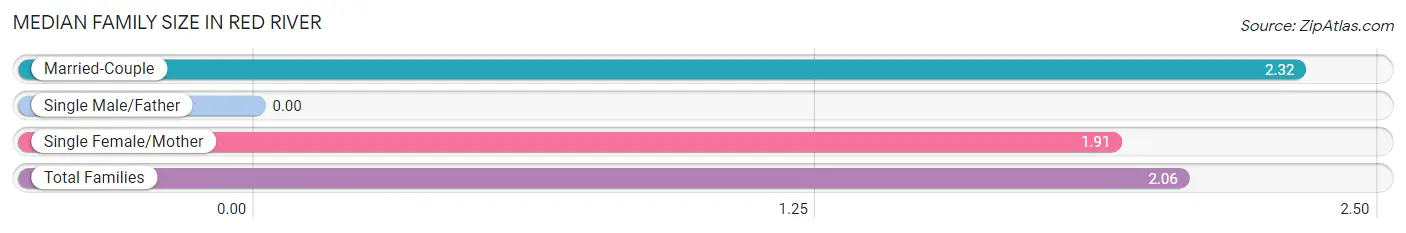
| Family Type | # Families | Family Size |
| Married-Couple | 63 (36.6%) | 2.32 |
| Single Male/Father | 0 (0.0%) | - |
| Single Female/Mother | 109 (63.4%) | 1.91 |
| Total Families | 172 (100.0%) | 2.06 |
Median Household Size in Red River
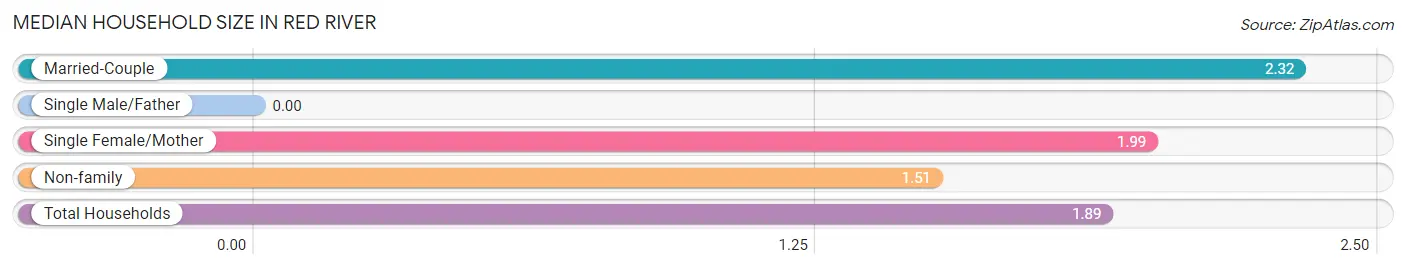
| Household Type | # Households | Household Size |
| Married-Couple | 63 (23.3%) | 2.32 |
| Single Male/Father | 0 (0.0%) | - |
| Single Female/Mother | 109 (40.2%) | 1.99 |
| Non-family | 99 (36.5%) | 1.51 |
| Total Households | 271 (100.0%) | 1.89 |
Household Size by Marriage Status in Red River
Out of a total of 271 households in Red River, 172 (63.5%) are family households, while 99 (36.5%) are nonfamily households. The most numerous type of family households are 2-person households, comprising 154, and the most common type of nonfamily households are 1-person households, comprising 83.
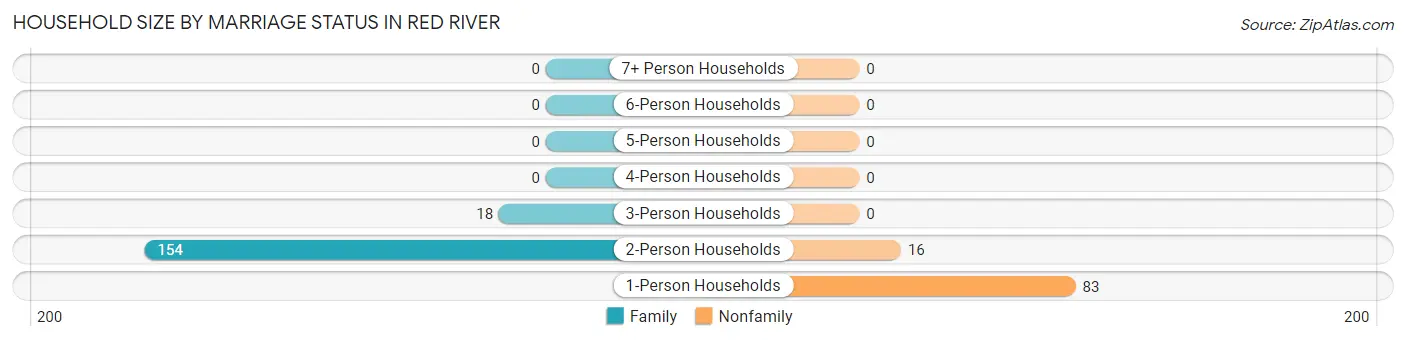
| Household Size | Family Households | Nonfamily Households |
| 1-Person Households | - | 83 (30.6%) |
| 2-Person Households | 154 (56.8%) | 16 (5.9%) |
| 3-Person Households | 18 (6.6%) | 0 (0.0%) |
| 4-Person Households | 0 (0.0%) | 0 (0.0%) |
| 5-Person Households | 0 (0.0%) | 0 (0.0%) |
| 6-Person Households | 0 (0.0%) | 0 (0.0%) |
| 7+ Person Households | 0 (0.0%) | 0 (0.0%) |
| Total | 172 (63.5%) | 99 (36.5%) |
Female Fertility in Red River
Fertility by Age in Red River
| Age Bracket | Women with Births | Births / 1,000 Women |
| 15 to 19 years | 0 (0.0%) | 0.0 |
| 20 to 34 years | 0 (0.0%) | 0.0 |
| 35 to 50 years | 0 (0.0%) | 0.0 |
| Total | 0 (0.0%) | 0.0 |
Fertility by Age by Marriage Status in Red River
| Age Bracket | Married | Unmarried |
| 15 to 19 years | 0 (0.0%) | 0 (0.0%) |
| 20 to 34 years | 0 (0.0%) | 0 (0.0%) |
| 35 to 50 years | 0 (0.0%) | 0 (0.0%) |
| Total | 0 (0.0%) | 0 (0.0%) |
Fertility by Education in Red River
| Educational Attainment | Women with Births | Births / 1,000 Women |
| Less than High School | 0 (0.0%) | 0.0 |
| High School Diploma | 0 (0.0%) | 0.0 |
| College or Associate's Degree | 0 (0.0%) | 0.0 |
| Bachelor's Degree | 0 (0.0%) | 0.0 |
| Graduate Degree | 0 (0.0%) | 0.0 |
| Total | 0 (0.0%) | 0.0 |
Fertility by Education by Marriage Status in Red River
| Educational Attainment | Married | Unmarried |
| Less than High School | 0 (0.0%) | 0 (0.0%) |
| High School Diploma | 0 (0.0%) | 0 (0.0%) |
| College or Associate's Degree | 0 (0.0%) | 0 (0.0%) |
| Bachelor's Degree | 0 (0.0%) | 0 (0.0%) |
| Graduate Degree | 0 (0.0%) | 0 (0.0%) |
| Total | 0 (0.0%) | 0 (0.0%) |
Employment Characteristics in Red River
Employment by Class of Employer in Red River
Among the 260 employed individuals in Red River, private company employees (156 | 60.0%), state government employees (66 | 25.4%), and self-employed (not incorporated) (17 | 6.5%) make up the most common classes of employment.
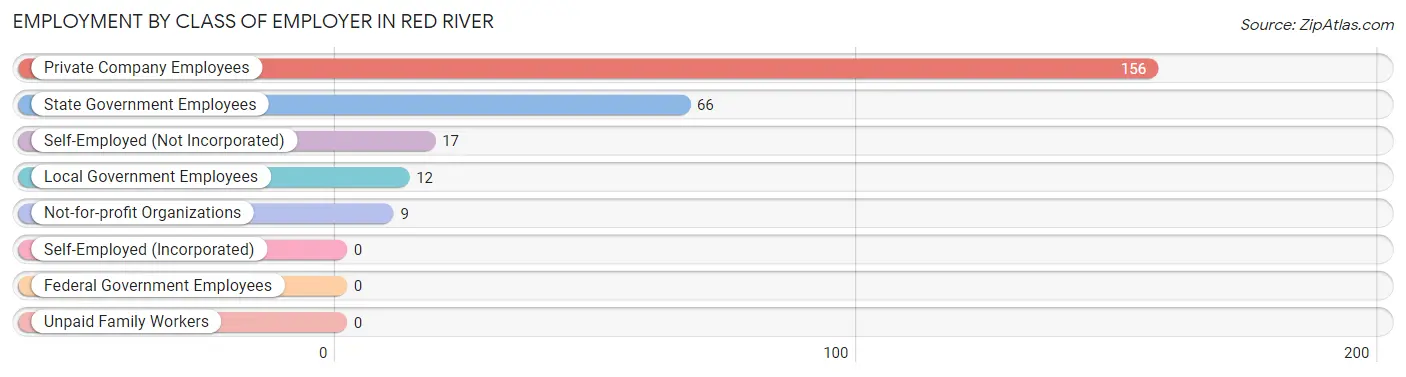
| Employer Class | # Employees | % Employees |
| Private Company Employees | 156 | 60.0% |
| Self-Employed (Incorporated) | 0 | 0.0% |
| Self-Employed (Not Incorporated) | 17 | 6.5% |
| Not-for-profit Organizations | 9 | 3.5% |
| Local Government Employees | 12 | 4.6% |
| State Government Employees | 66 | 25.4% |
| Federal Government Employees | 0 | 0.0% |
| Unpaid Family Workers | 0 | 0.0% |
| Total | 260 | 100.0% |
Employment Status by Age in Red River
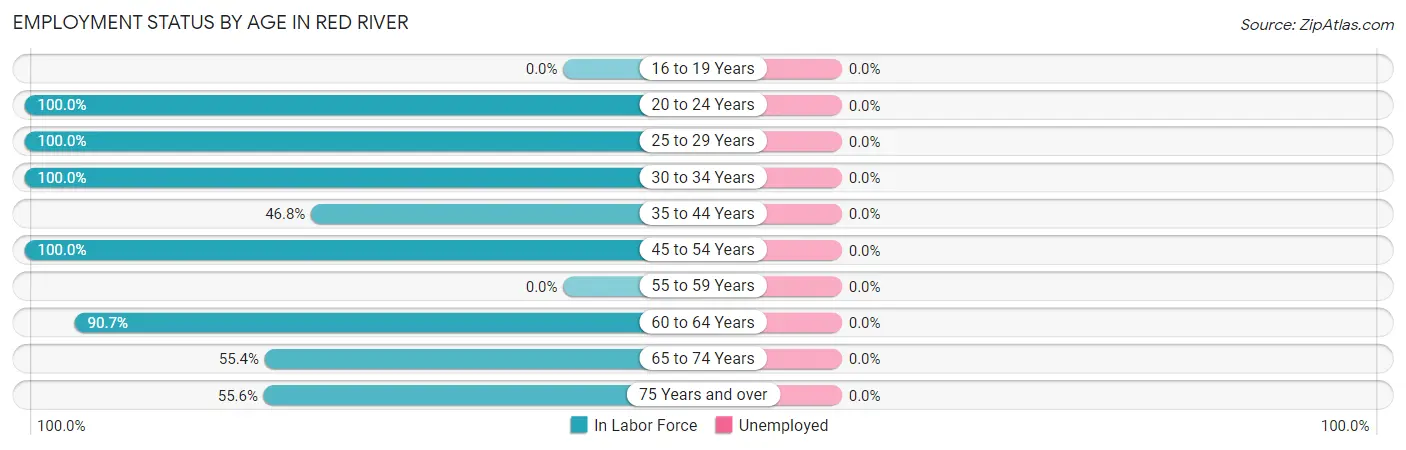
| Age Bracket | In Labor Force | Unemployed |
| 16 to 19 Years | 0 (0.0%) | 0 (0.0%) |
| 20 to 24 Years | 18 (100.0%) | 0 (0.0%) |
| 25 to 29 Years | 32 (100.0%) | 0 (0.0%) |
| 30 to 34 Years | 13 (100.0%) | 0 (0.0%) |
| 35 to 44 Years | 80 (46.8%) | 0 (0.0%) |
| 45 to 54 Years | 12 (100.0%) | 0 (0.0%) |
| 55 to 59 Years | 0 (0.0%) | 0 (0.0%) |
| 60 to 64 Years | 49 (90.7%) | 0 (0.0%) |
| 65 to 74 Years | 36 (55.4%) | 0 (0.0%) |
| 75 Years and over | 20 (55.6%) | 0 (0.0%) |
| Total | 260 (63.0%) | 0 (0.0%) |
Employment Status by Educational Attainment in Red River
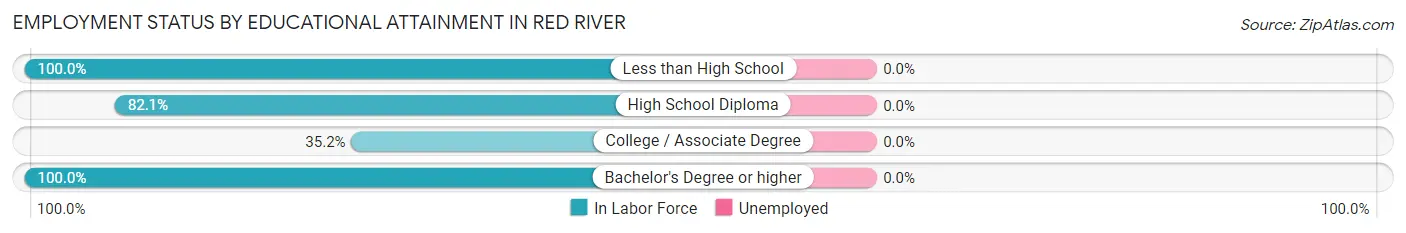
| Educational Attainment | In Labor Force | Unemployed |
| Less than High School | 18 (100.0%) | 0 (0.0%) |
| High School Diploma | 23 (82.1%) | 0 (0.0%) |
| College / Associate Degree | 56 (35.2%) | 0 (0.0%) |
| Bachelor's Degree or higher | 89 (100.0%) | 0 (0.0%) |
| Total | 186 (63.3%) | 0 (0.0%) |
Employment Occupations by Sex in Red River
Management, Business, Science and Arts Occupations
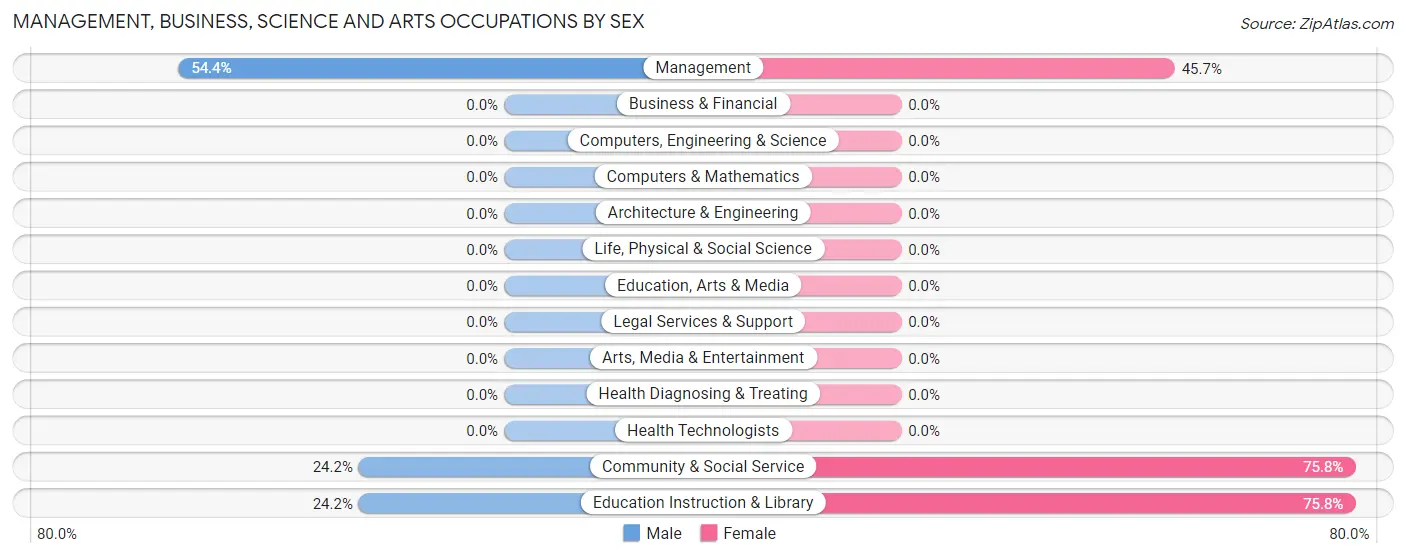
The most common Management, Business, Science and Arts occupations in Red River are Community & Social Service (66 | 25.4%), Education Instruction & Library (66 | 25.4%), and Management (46 | 17.7%).
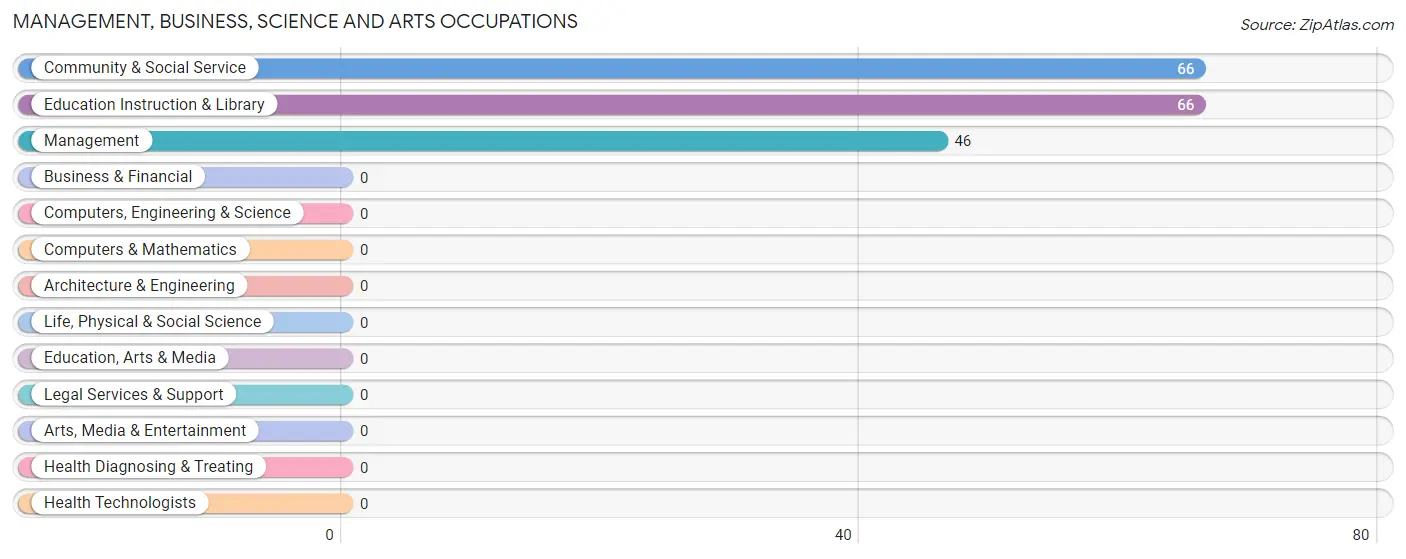
Management, Business, Science and Arts Occupations by Sex
Within the Management, Business, Science and Arts occupations in Red River, the most male-oriented occupations are Management (54.3%), Community & Social Service (24.2%), and Education Instruction & Library (24.2%), while the most female-oriented occupations are Community & Social Service (75.8%), Education Instruction & Library (75.8%), and Management (45.7%).
| Occupation | Male | Female |
| Management | 25 (54.3%) | 21 (45.7%) |
| Business & Financial | 0 (0.0%) | 0 (0.0%) |
| Computers, Engineering & Science | 0 (0.0%) | 0 (0.0%) |
| Computers & Mathematics | 0 (0.0%) | 0 (0.0%) |
| Architecture & Engineering | 0 (0.0%) | 0 (0.0%) |
| Life, Physical & Social Science | 0 (0.0%) | 0 (0.0%) |
| Community & Social Service | 16 (24.2%) | 50 (75.8%) |
| Education, Arts & Media | 0 (0.0%) | 0 (0.0%) |
| Legal Services & Support | 0 (0.0%) | 0 (0.0%) |
| Education Instruction & Library | 16 (24.2%) | 50 (75.8%) |
| Arts, Media & Entertainment | 0 (0.0%) | 0 (0.0%) |
| Health Diagnosing & Treating | 0 (0.0%) | 0 (0.0%) |
| Health Technologists | 0 (0.0%) | 0 (0.0%) |
| Total (Category) | 41 (36.6%) | 71 (63.4%) |
| Total (Overall) | 106 (40.8%) | 154 (59.2%) |
Services Occupations
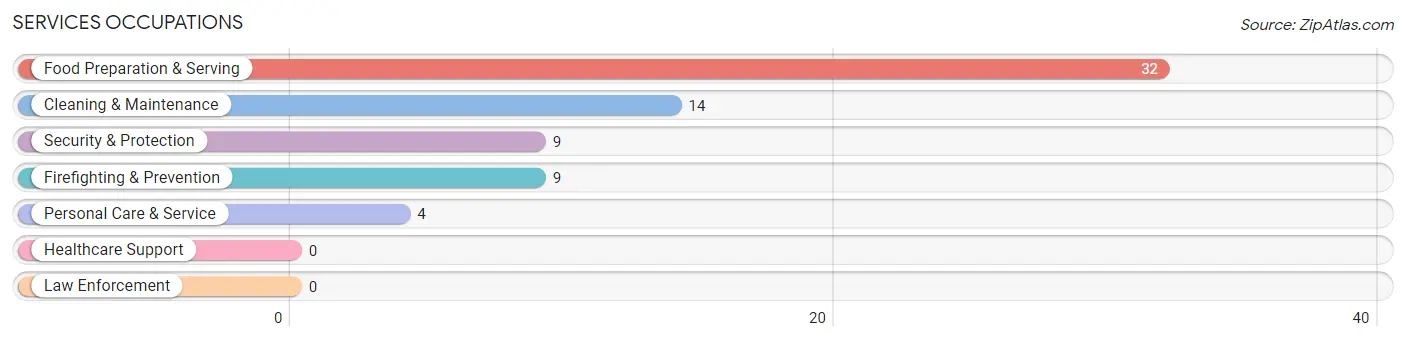
The most common Services occupations in Red River are Food Preparation & Serving (32 | 12.3%), Cleaning & Maintenance (14 | 5.4%), Security & Protection (9 | 3.5%), Firefighting & Prevention (9 | 3.5%), and Personal Care & Service (4 | 1.5%).
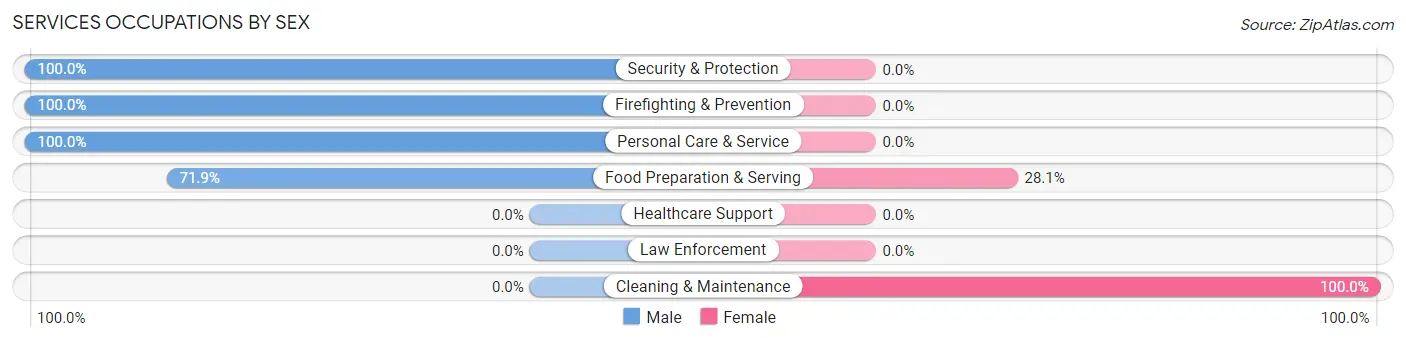
Services Occupations by Sex
Within the Services occupations in Red River, the most male-oriented occupations are Security & Protection (100.0%), Firefighting & Prevention (100.0%), and Personal Care & Service (100.0%), while the most female-oriented occupations are Cleaning & Maintenance (100.0%), and Food Preparation & Serving (28.1%).
| Occupation | Male | Female |
| Healthcare Support | 0 (0.0%) | 0 (0.0%) |
| Security & Protection | 9 (100.0%) | 0 (0.0%) |
| Firefighting & Prevention | 9 (100.0%) | 0 (0.0%) |
| Law Enforcement | 0 (0.0%) | 0 (0.0%) |
| Food Preparation & Serving | 23 (71.9%) | 9 (28.1%) |
| Cleaning & Maintenance | 0 (0.0%) | 14 (100.0%) |
| Personal Care & Service | 4 (100.0%) | 0 (0.0%) |
| Total (Category) | 36 (61.0%) | 23 (39.0%) |
| Total (Overall) | 106 (40.8%) | 154 (59.2%) |
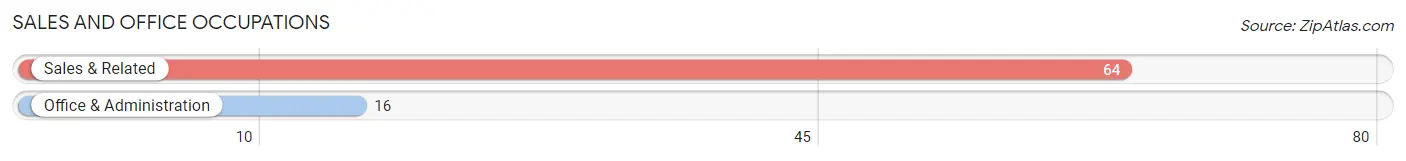
Sales and Office Occupations
The most common Sales and Office occupations in Red River are Sales & Related (64 | 24.6%), and Office & Administration (16 | 6.1%).
Sales and Office Occupations by Sex
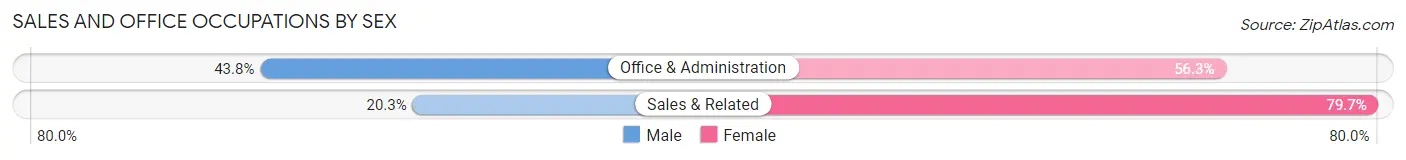
| Occupation | Male | Female |
| Sales & Related | 13 (20.3%) | 51 (79.7%) |
| Office & Administration | 7 (43.8%) | 9 (56.2%) |
| Total (Category) | 20 (25.0%) | 60 (75.0%) |
| Total (Overall) | 106 (40.8%) | 154 (59.2%) |
Natural Resources, Construction and Maintenance Occupations
Natural Resources, Construction and Maintenance Occupations by Sex
| Occupation | Male | Female |
| Farming, Fishing & Forestry | 0 (0.0%) | 0 (0.0%) |
| Construction & Extraction | 0 (0.0%) | 0 (0.0%) |
| Installation, Maintenance & Repair | 0 (0.0%) | 0 (0.0%) |
| Total (Category) | 0 (0.0%) | 0 (0.0%) |
| Total (Overall) | 106 (40.8%) | 154 (59.2%) |
Production, Transportation and Moving Occupations
The most common Production, Transportation and Moving occupations in Red River are , and Production (9 | 3.5%).
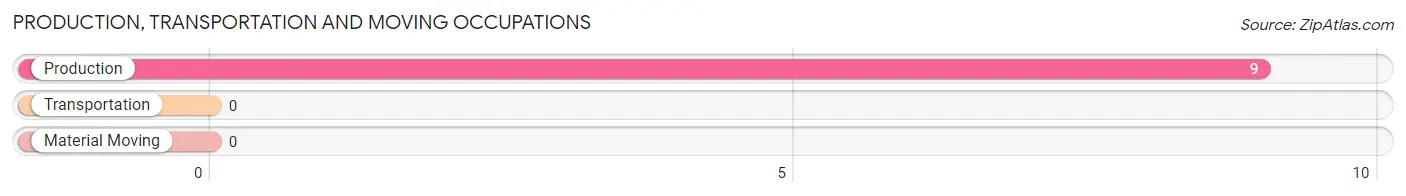
Production, Transportation and Moving Occupations by Sex
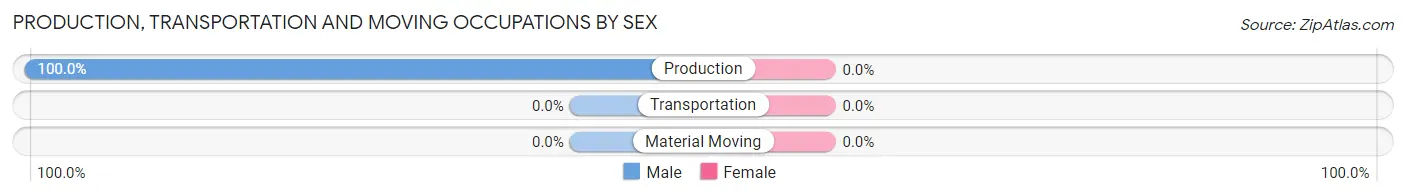
| Occupation | Male | Female |
| Production | 9 (100.0%) | 0 (0.0%) |
| Transportation | 0 (0.0%) | 0 (0.0%) |
| Material Moving | 0 (0.0%) | 0 (0.0%) |
| Total (Category) | 9 (100.0%) | 0 (0.0%) |
| Total (Overall) | 106 (40.8%) | 154 (59.2%) |
Employment Industries by Sex in Red River
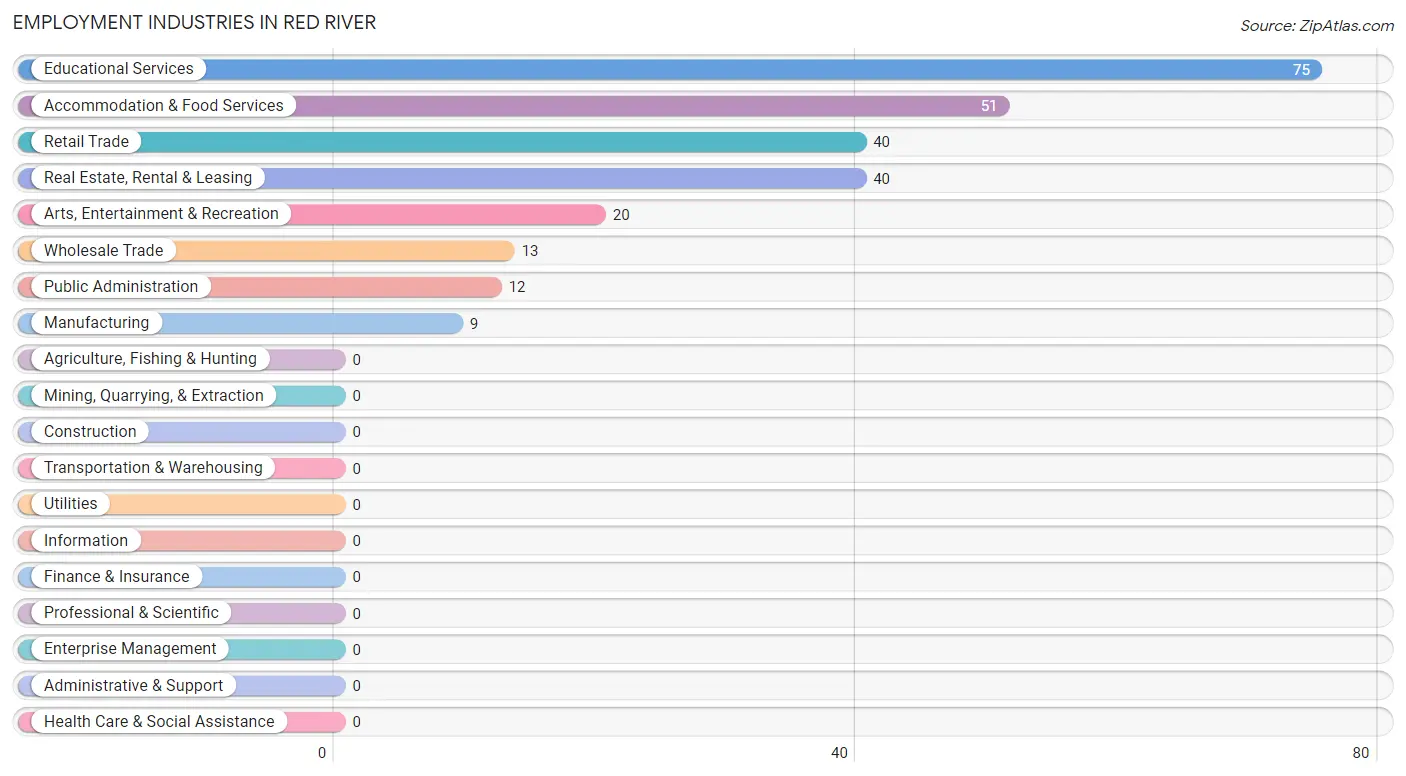
Employment Industries in Red River
The major employment industries in Red River include Educational Services (75 | 28.8%), Accommodation & Food Services (51 | 19.6%), Retail Trade (40 | 15.4%), Real Estate, Rental & Leasing (40 | 15.4%), and Arts, Entertainment & Recreation (20 | 7.7%).
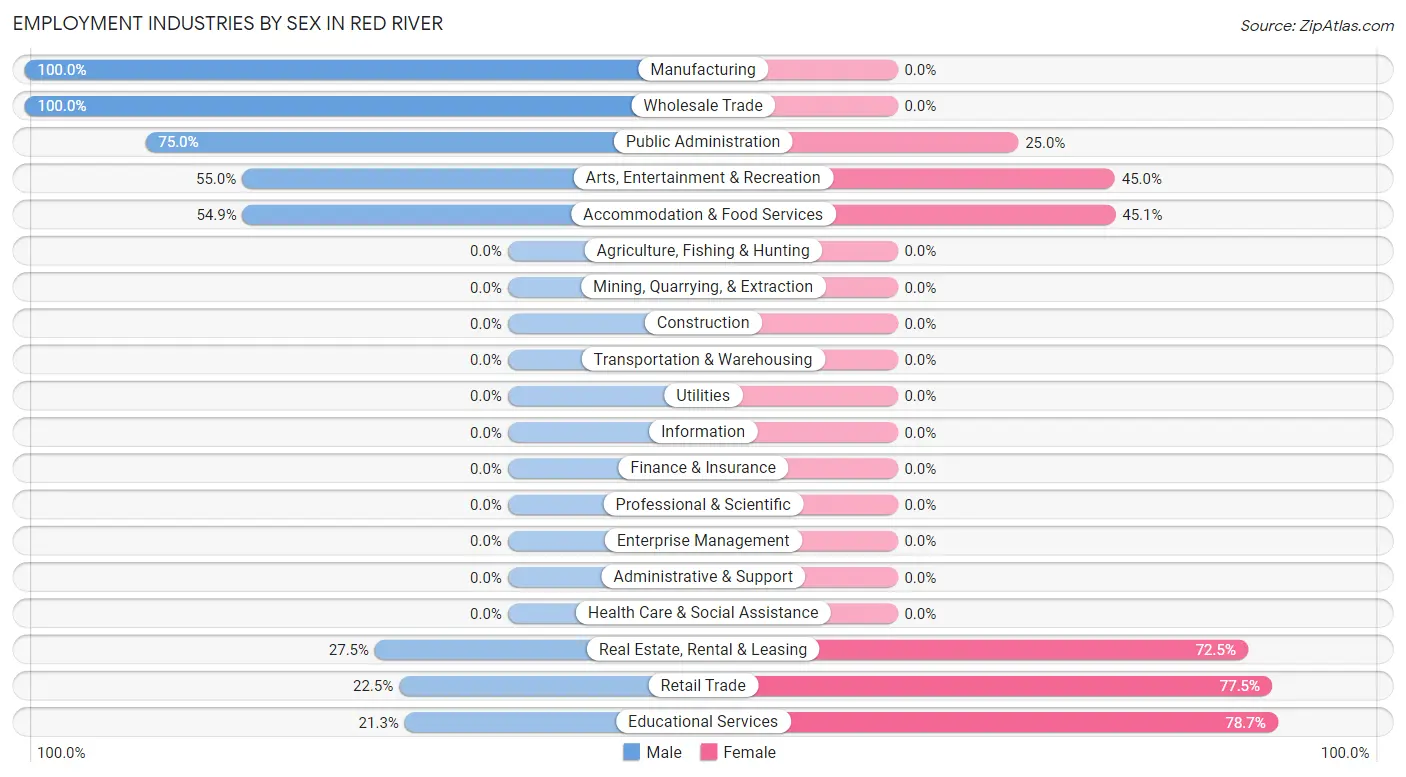
Employment Industries by Sex in Red River
The Red River industries that see more men than women are Manufacturing (100.0%), Wholesale Trade (100.0%), and Public Administration (75.0%), whereas the industries that tend to have a higher number of women are Educational Services (78.7%), Retail Trade (77.5%), and Real Estate, Rental & Leasing (72.5%).
| Industry | Male | Female |
| Agriculture, Fishing & Hunting | 0 (0.0%) | 0 (0.0%) |
| Mining, Quarrying, & Extraction | 0 (0.0%) | 0 (0.0%) |
| Construction | 0 (0.0%) | 0 (0.0%) |
| Manufacturing | 9 (100.0%) | 0 (0.0%) |
| Wholesale Trade | 13 (100.0%) | 0 (0.0%) |
| Retail Trade | 9 (22.5%) | 31 (77.5%) |
| Transportation & Warehousing | 0 (0.0%) | 0 (0.0%) |
| Utilities | 0 (0.0%) | 0 (0.0%) |
| Information | 0 (0.0%) | 0 (0.0%) |
| Finance & Insurance | 0 (0.0%) | 0 (0.0%) |
| Real Estate, Rental & Leasing | 11 (27.5%) | 29 (72.5%) |
| Professional & Scientific | 0 (0.0%) | 0 (0.0%) |
| Enterprise Management | 0 (0.0%) | 0 (0.0%) |
| Administrative & Support | 0 (0.0%) | 0 (0.0%) |
| Educational Services | 16 (21.3%) | 59 (78.7%) |
| Health Care & Social Assistance | 0 (0.0%) | 0 (0.0%) |
| Arts, Entertainment & Recreation | 11 (55.0%) | 9 (45.0%) |
| Accommodation & Food Services | 28 (54.9%) | 23 (45.1%) |
| Public Administration | 9 (75.0%) | 3 (25.0%) |
| Total | 106 (40.8%) | 154 (59.2%) |
Education in Red River
School Enrollment in Red River
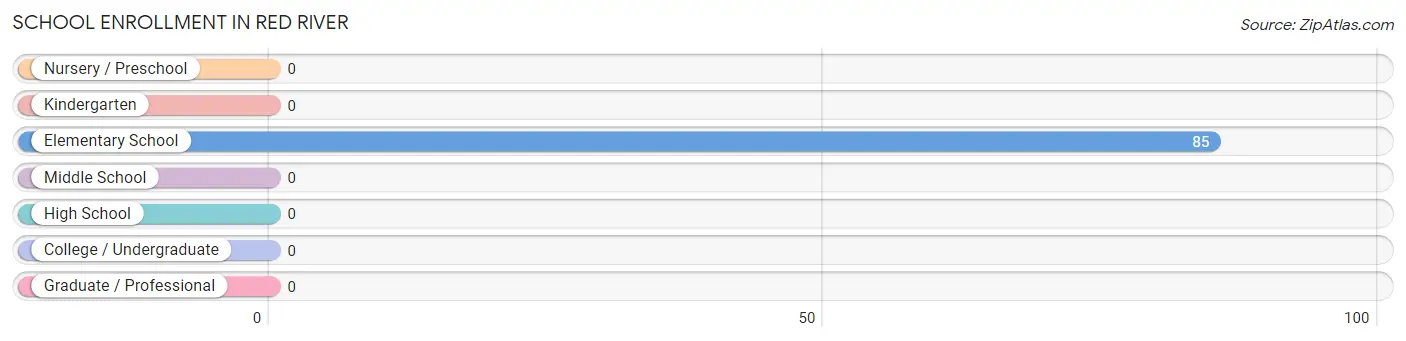
| School Level | # Students | % Students |
| Nursery / Preschool | 0 | 0.0% |
| Kindergarten | 0 | 0.0% |
| Elementary School | 85 | 100.0% |
| Middle School | 0 | 0.0% |
| High School | 0 | 0.0% |
| College / Undergraduate | 0 | 0.0% |
| Graduate / Professional | 0 | 0.0% |
| Total | 85 | 100.0% |
School Enrollment by Age by Funding Source in Red River
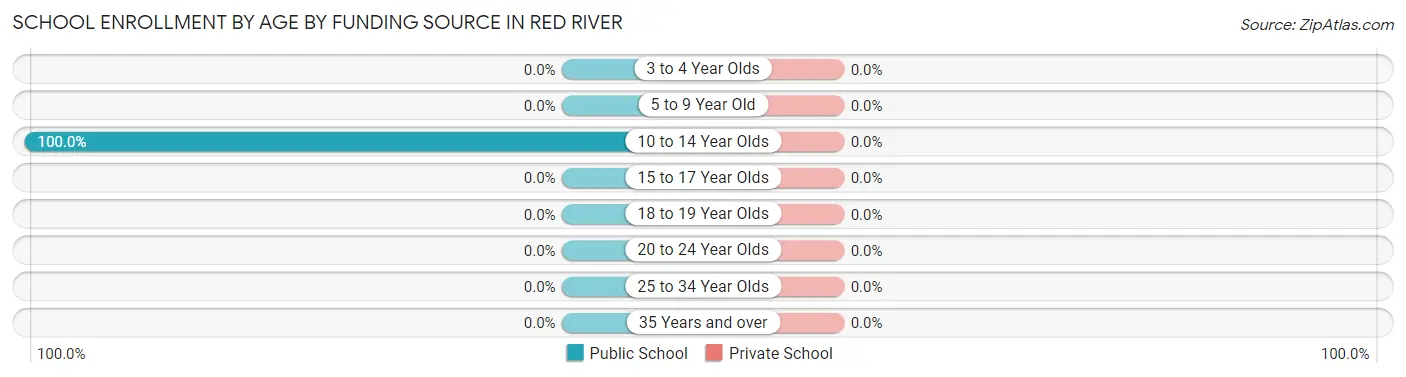
| Age Bracket | Public School | Private School |
| 3 to 4 Year Olds | 0 (0.0%) | 0 (0.0%) |
| 5 to 9 Year Old | 0 (0.0%) | 0 (0.0%) |
| 10 to 14 Year Olds | 85 (100.0%) | 0 (0.0%) |
| 15 to 17 Year Olds | 0 (0.0%) | 0 (0.0%) |
| 18 to 19 Year Olds | 0 (0.0%) | 0 (0.0%) |
| 20 to 24 Year Olds | 0 (0.0%) | 0 (0.0%) |
| 25 to 34 Year Olds | 0 (0.0%) | 0 (0.0%) |
| 35 Years and over | 0 (0.0%) | 0 (0.0%) |
| Total | 85 (100.0%) | 0 (0.0%) |
Educational Attainment by Field of Study in Red River
Education (105 | 63.2%), business (16 | 9.6%), science & technology (15 | 9.0%), physical & health sciences (13 | 7.8%), and psychology (10 | 6.0%) are the most common fields of study among 166 individuals in Red River who have obtained a bachelor's degree or higher.
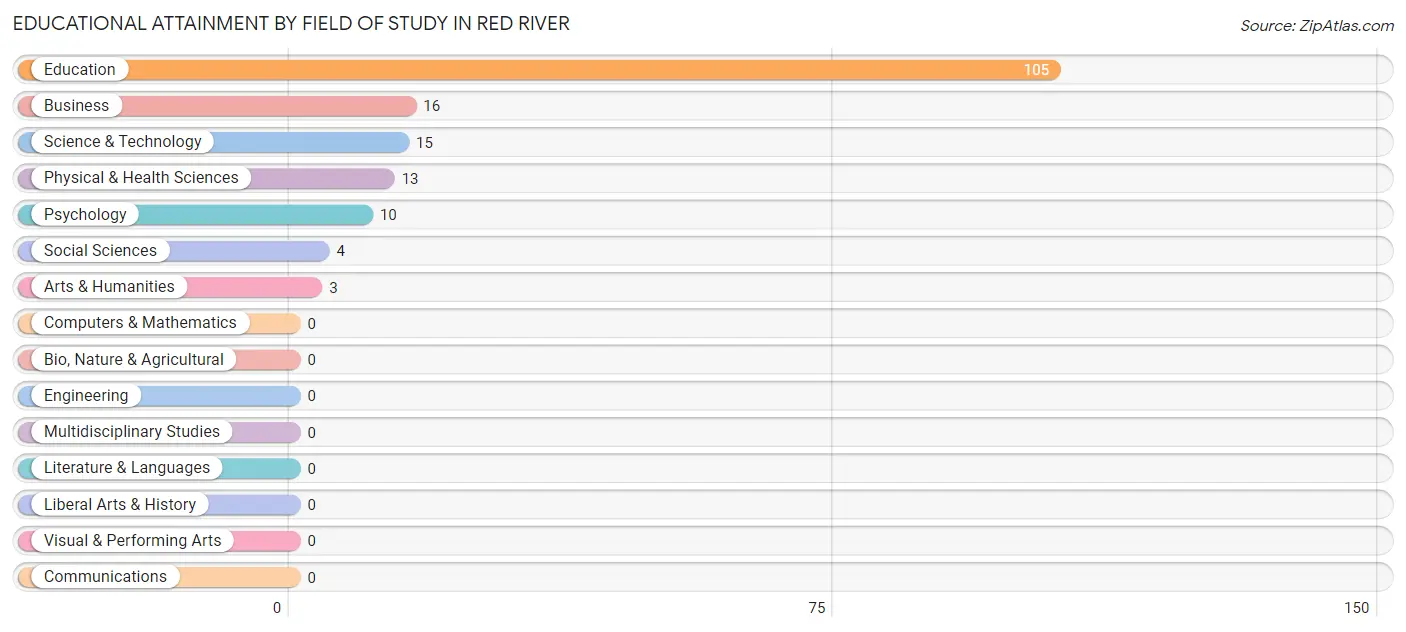
| Field of Study | # Graduates | % Graduates |
| Computers & Mathematics | 0 | 0.0% |
| Bio, Nature & Agricultural | 0 | 0.0% |
| Physical & Health Sciences | 13 | 7.8% |
| Psychology | 10 | 6.0% |
| Social Sciences | 4 | 2.4% |
| Engineering | 0 | 0.0% |
| Multidisciplinary Studies | 0 | 0.0% |
| Science & Technology | 15 | 9.0% |
| Business | 16 | 9.6% |
| Education | 105 | 63.2% |
| Literature & Languages | 0 | 0.0% |
| Liberal Arts & History | 0 | 0.0% |
| Visual & Performing Arts | 0 | 0.0% |
| Communications | 0 | 0.0% |
| Arts & Humanities | 3 | 1.8% |
| Total | 166 | 100.0% |
Transportation & Commute in Red River
Vehicle Availability by Sex in Red River
The most prevalent vehicle ownership categories in Red River are males with 2 vehicles (37, accounting for 34.9%) and females with 2 vehicles (68, making up 24.0%).
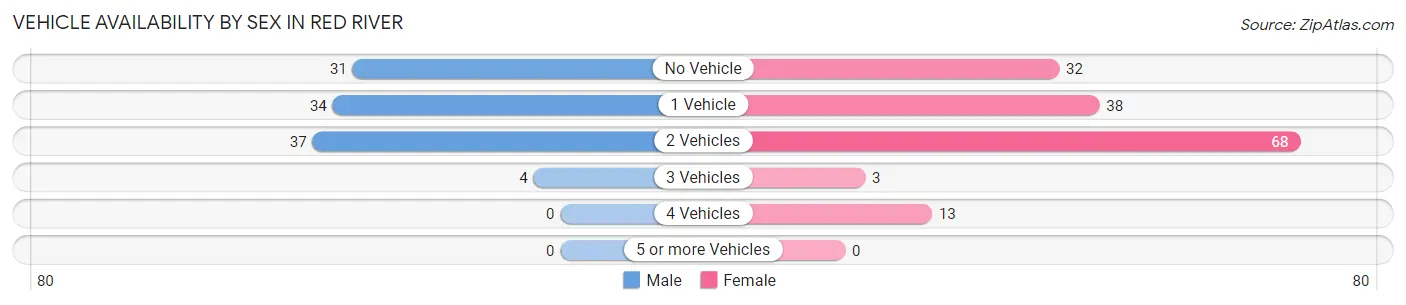
| Vehicles Available | Male | Female |
| No Vehicle | 31 (29.2%) | 32 (20.8%) |
| 1 Vehicle | 34 (32.1%) | 38 (24.7%) |
| 2 Vehicles | 37 (34.9%) | 68 (44.2%) |
| 3 Vehicles | 4 (3.8%) | 3 (1.9%) |
| 4 Vehicles | 0 (0.0%) | 13 (8.4%) |
| 5 or more Vehicles | 0 (0.0%) | 0 (0.0%) |
| Total | 106 (100.0%) | 154 (100.0%) |
Commute Time in Red River
The most frequently occuring commute durations in Red River are less than 5 minutes (118 commuters, 58.7%), 15 to 19 minutes (59 commuters, 29.3%), and 5 to 9 minutes (24 commuters, 11.9%).
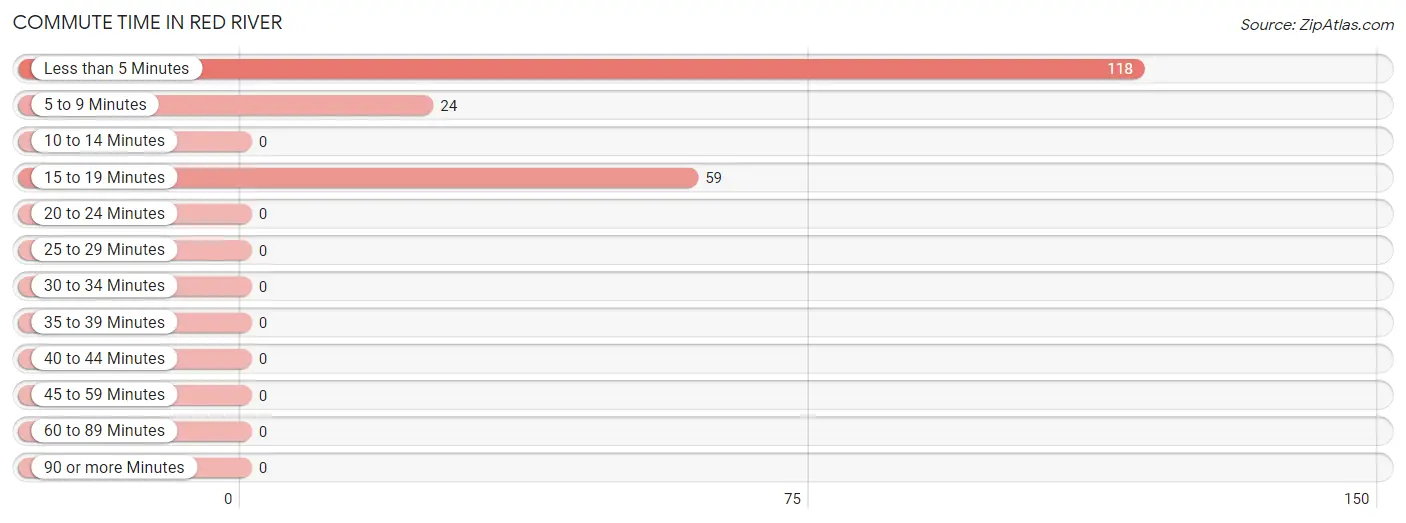
| Commute Time | # Commuters | % Commuters |
| Less than 5 Minutes | 118 | 58.7% |
| 5 to 9 Minutes | 24 | 11.9% |
| 10 to 14 Minutes | 0 | 0.0% |
| 15 to 19 Minutes | 59 | 29.3% |
| 20 to 24 Minutes | 0 | 0.0% |
| 25 to 29 Minutes | 0 | 0.0% |
| 30 to 34 Minutes | 0 | 0.0% |
| 35 to 39 Minutes | 0 | 0.0% |
| 40 to 44 Minutes | 0 | 0.0% |
| 45 to 59 Minutes | 0 | 0.0% |
| 60 to 89 Minutes | 0 | 0.0% |
| 90 or more Minutes | 0 | 0.0% |
Commute Time by Sex in Red River
The most common commute times in Red River are less than 5 minutes (52 commuters, 80.0%) for males and less than 5 minutes (66 commuters, 48.5%) for females.
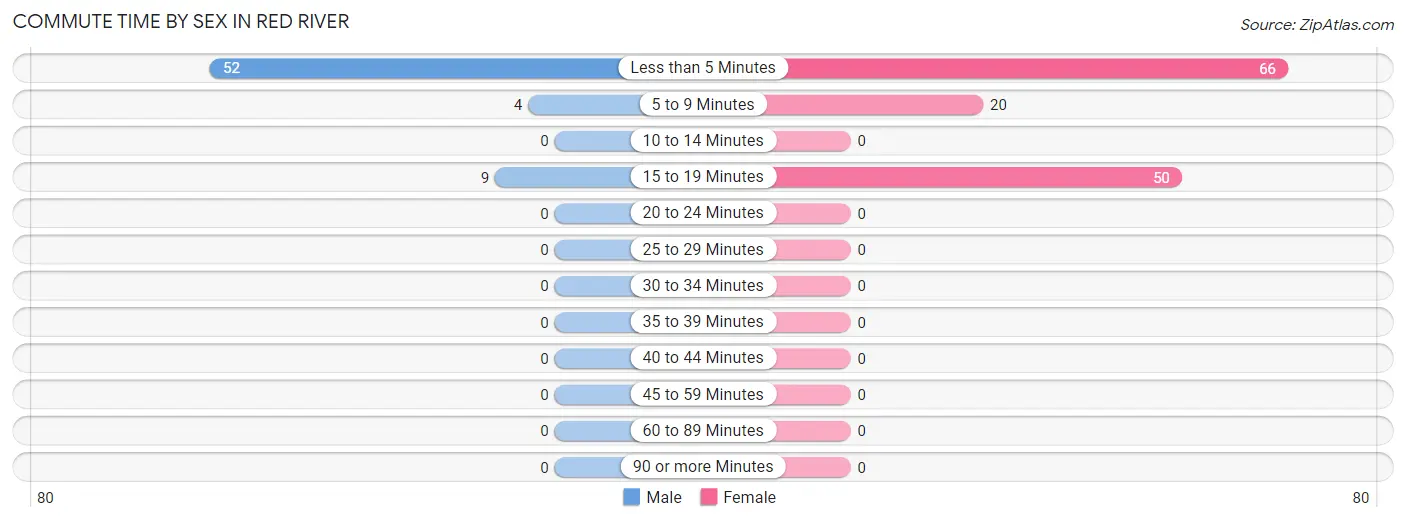
| Commute Time | Male | Female |
| Less than 5 Minutes | 52 (80.0%) | 66 (48.5%) |
| 5 to 9 Minutes | 4 (6.1%) | 20 (14.7%) |
| 10 to 14 Minutes | 0 (0.0%) | 0 (0.0%) |
| 15 to 19 Minutes | 9 (13.9%) | 50 (36.8%) |
| 20 to 24 Minutes | 0 (0.0%) | 0 (0.0%) |
| 25 to 29 Minutes | 0 (0.0%) | 0 (0.0%) |
| 30 to 34 Minutes | 0 (0.0%) | 0 (0.0%) |
| 35 to 39 Minutes | 0 (0.0%) | 0 (0.0%) |
| 40 to 44 Minutes | 0 (0.0%) | 0 (0.0%) |
| 45 to 59 Minutes | 0 (0.0%) | 0 (0.0%) |
| 60 to 89 Minutes | 0 (0.0%) | 0 (0.0%) |
| 90 or more Minutes | 0 (0.0%) | 0 (0.0%) |
Time of Departure to Work by Sex in Red River
The most frequent times of departure to work in Red River are 9:00 AM to 9:59 AM (26, 40.0%) for males and 12:00 PM to 3:59 PM (50, 36.8%) for females.
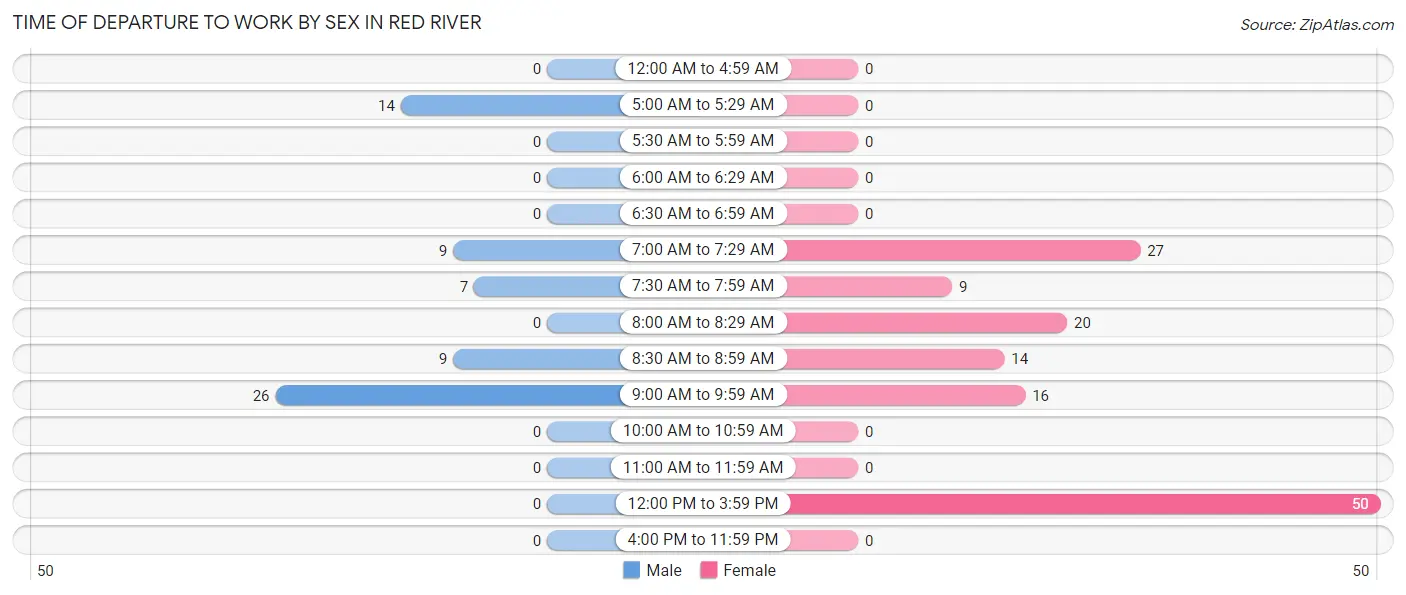
| Time of Departure | Male | Female |
| 12:00 AM to 4:59 AM | 0 (0.0%) | 0 (0.0%) |
| 5:00 AM to 5:29 AM | 14 (21.5%) | 0 (0.0%) |
| 5:30 AM to 5:59 AM | 0 (0.0%) | 0 (0.0%) |
| 6:00 AM to 6:29 AM | 0 (0.0%) | 0 (0.0%) |
| 6:30 AM to 6:59 AM | 0 (0.0%) | 0 (0.0%) |
| 7:00 AM to 7:29 AM | 9 (13.9%) | 27 (19.9%) |
| 7:30 AM to 7:59 AM | 7 (10.8%) | 9 (6.6%) |
| 8:00 AM to 8:29 AM | 0 (0.0%) | 20 (14.7%) |
| 8:30 AM to 8:59 AM | 9 (13.9%) | 14 (10.3%) |
| 9:00 AM to 9:59 AM | 26 (40.0%) | 16 (11.8%) |
| 10:00 AM to 10:59 AM | 0 (0.0%) | 0 (0.0%) |
| 11:00 AM to 11:59 AM | 0 (0.0%) | 0 (0.0%) |
| 12:00 PM to 3:59 PM | 0 (0.0%) | 50 (36.8%) |
| 4:00 PM to 11:59 PM | 0 (0.0%) | 0 (0.0%) |
| Total | 65 (100.0%) | 136 (100.0%) |
Housing Occupancy in Red River
Occupancy by Ownership in Red River
Of the total 271 dwellings in Red River, owner-occupied units account for 84 (31.0%), while renter-occupied units make up 187 (69.0%).
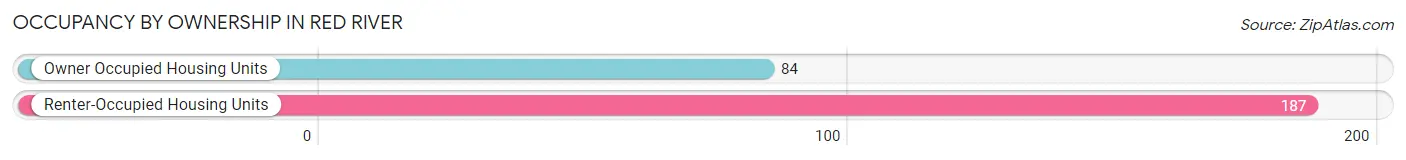
| Occupancy | # Housing Units | % Housing Units |
| Owner Occupied Housing Units | 84 | 31.0% |
| Renter-Occupied Housing Units | 187 | 69.0% |
| Total Occupied Housing Units | 271 | 100.0% |
Occupancy by Household Size in Red River
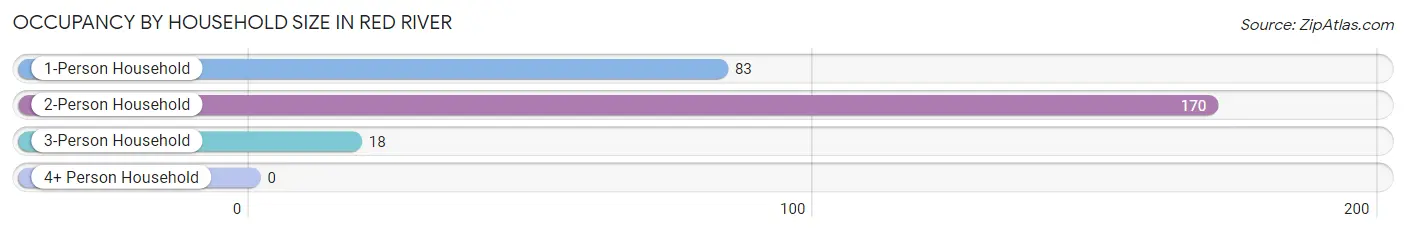
| Household Size | # Housing Units | % Housing Units |
| 1-Person Household | 83 | 30.6% |
| 2-Person Household | 170 | 62.7% |
| 3-Person Household | 18 | 6.6% |
| 4+ Person Household | 0 | 0.0% |
| Total Housing Units | 271 | 100.0% |
Occupancy by Ownership by Household Size in Red River
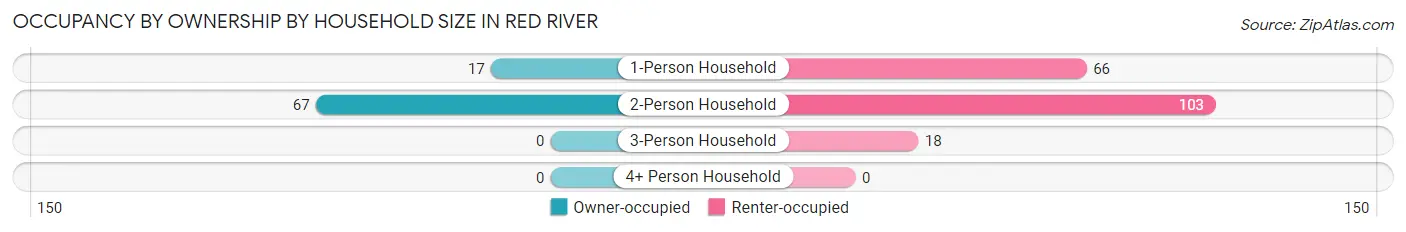
| Household Size | Owner-occupied | Renter-occupied |
| 1-Person Household | 17 (20.5%) | 66 (79.5%) |
| 2-Person Household | 67 (39.4%) | 103 (60.6%) |
| 3-Person Household | 0 (0.0%) | 18 (100.0%) |
| 4+ Person Household | 0 (0.0%) | 0 (0.0%) |
| Total Housing Units | 84 (31.0%) | 187 (69.0%) |
Occupancy by Educational Attainment in Red River
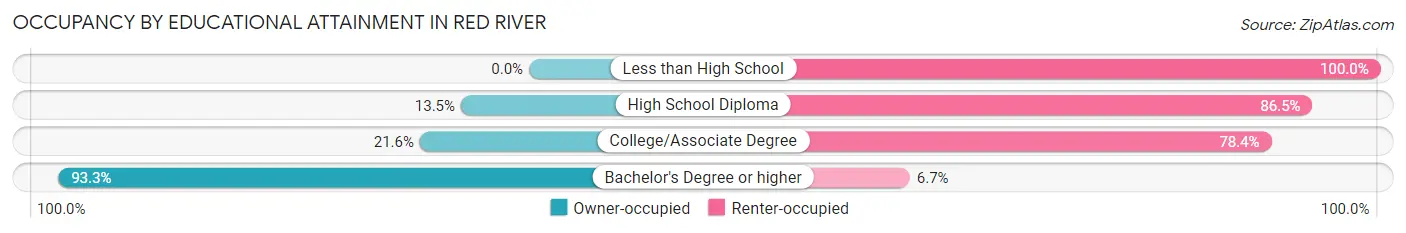
| Household Size | Owner-occupied | Renter-occupied |
| Less than High School | 0 (0.0%) | 18 (100.0%) |
| High School Diploma | 5 (13.5%) | 32 (86.5%) |
| College/Associate Degree | 37 (21.6%) | 134 (78.4%) |
| Bachelor's Degree or higher | 42 (93.3%) | 3 (6.7%) |
Occupancy by Age of Householder in Red River
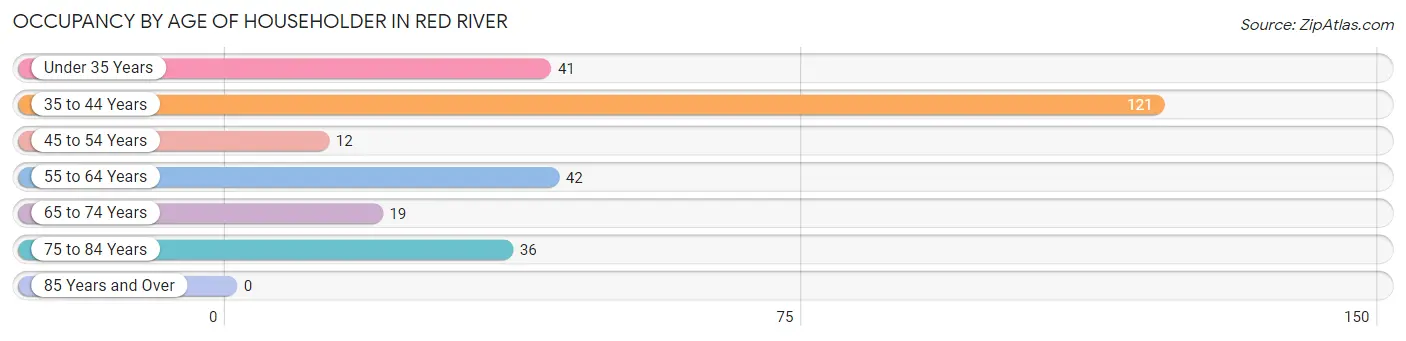
| Age Bracket | # Households | % Households |
| Under 35 Years | 41 | 15.1% |
| 35 to 44 Years | 121 | 44.7% |
| 45 to 54 Years | 12 | 4.4% |
| 55 to 64 Years | 42 | 15.5% |
| 65 to 74 Years | 19 | 7.0% |
| 75 to 84 Years | 36 | 13.3% |
| 85 Years and Over | 0 | 0.0% |
| Total | 271 | 100.0% |
Housing Finances in Red River
Median Income by Occupancy in Red River
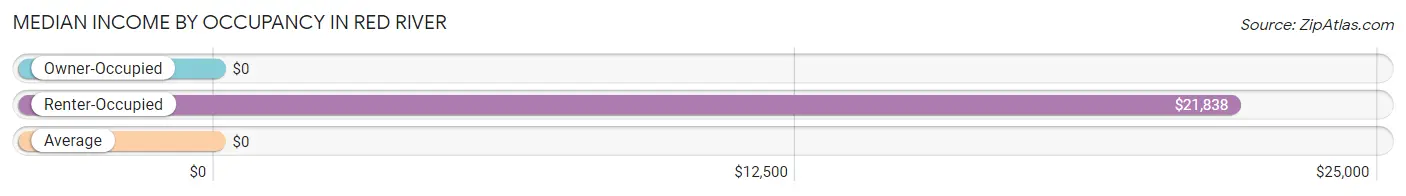
| Occupancy Type | # Households | Median Income |
| Owner-Occupied | 84 (31.0%) | $0 |
| Renter-Occupied | 187 (69.0%) | $21,838 |
| Average | 271 (100.0%) | $0 |
Occupancy by Householder Income Bracket in Red River
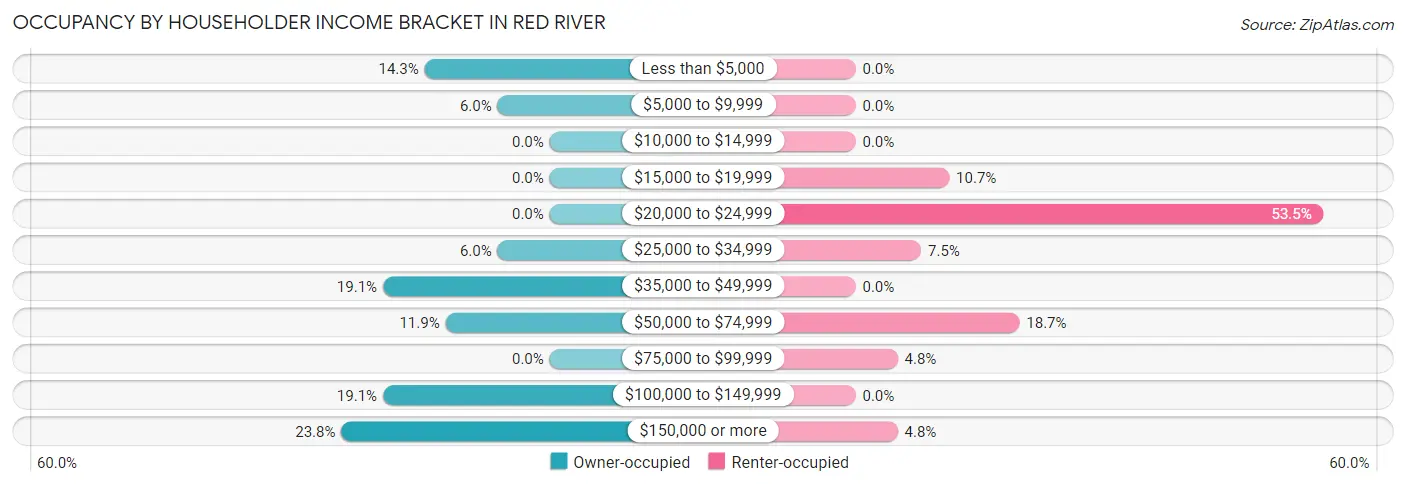
| Income Bracket | Owner-occupied | Renter-occupied |
| Less than $5,000 | 12 (14.3%) | 0 (0.0%) |
| $5,000 to $9,999 | 5 (5.9%) | 0 (0.0%) |
| $10,000 to $14,999 | 0 (0.0%) | 0 (0.0%) |
| $15,000 to $19,999 | 0 (0.0%) | 20 (10.7%) |
| $20,000 to $24,999 | 0 (0.0%) | 100 (53.5%) |
| $25,000 to $34,999 | 5 (5.9%) | 14 (7.5%) |
| $35,000 to $49,999 | 16 (19.1%) | 0 (0.0%) |
| $50,000 to $74,999 | 10 (11.9%) | 35 (18.7%) |
| $75,000 to $99,999 | 0 (0.0%) | 9 (4.8%) |
| $100,000 to $149,999 | 16 (19.1%) | 0 (0.0%) |
| $150,000 or more | 20 (23.8%) | 9 (4.8%) |
| Total | 84 (100.0%) | 187 (100.0%) |
Monthly Housing Cost Tiers in Red River
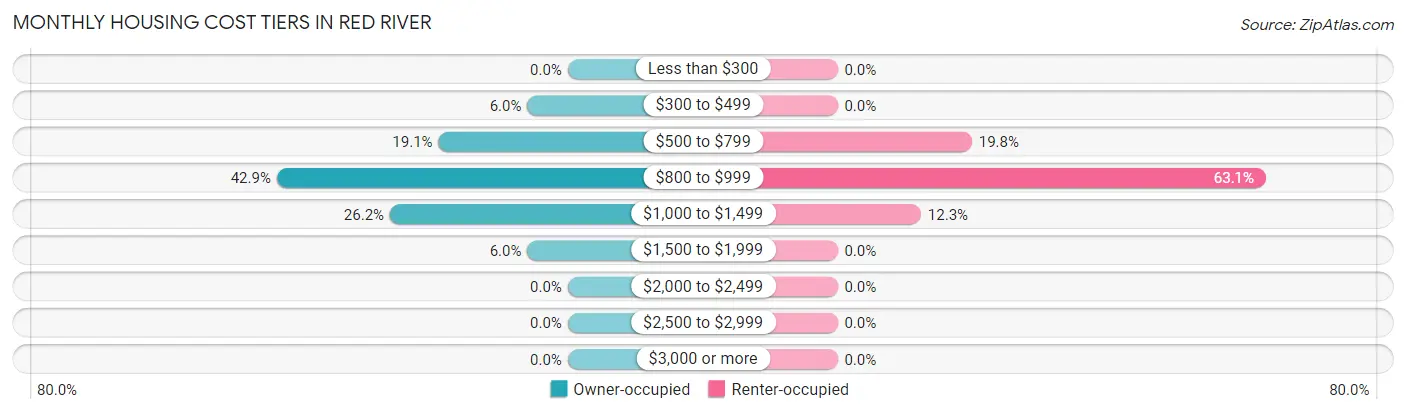
| Monthly Cost | Owner-occupied | Renter-occupied |
| Less than $300 | 0 (0.0%) | 0 (0.0%) |
| $300 to $499 | 5 (5.9%) | 0 (0.0%) |
| $500 to $799 | 16 (19.1%) | 37 (19.8%) |
| $800 to $999 | 36 (42.9%) | 118 (63.1%) |
| $1,000 to $1,499 | 22 (26.2%) | 23 (12.3%) |
| $1,500 to $1,999 | 5 (5.9%) | 0 (0.0%) |
| $2,000 to $2,499 | 0 (0.0%) | 0 (0.0%) |
| $2,500 to $2,999 | 0 (0.0%) | 0 (0.0%) |
| $3,000 or more | 0 (0.0%) | 0 (0.0%) |
| Total | 84 (100.0%) | 187 (100.0%) |
Physical Housing Characteristics in Red River
Housing Structures in Red River
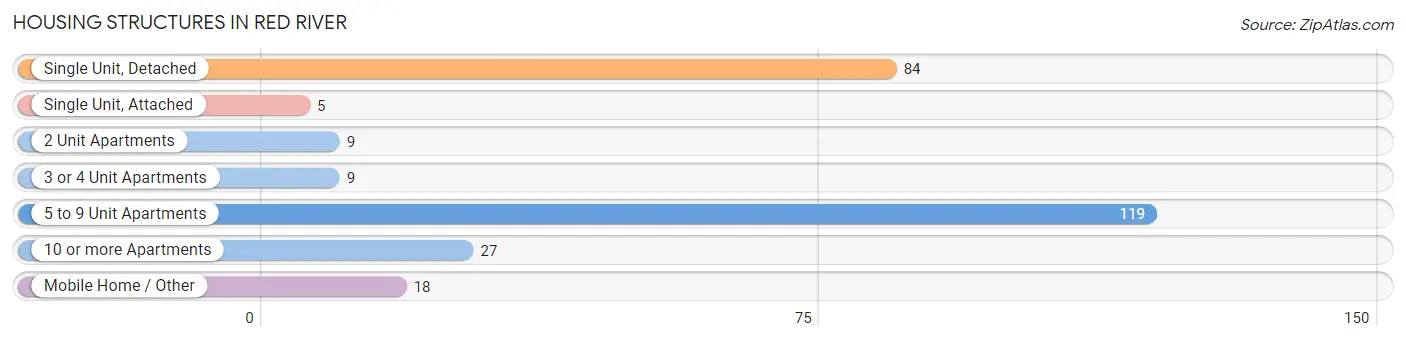
| Structure Type | # Housing Units | % Housing Units |
| Single Unit, Detached | 84 | 31.0% |
| Single Unit, Attached | 5 | 1.8% |
| 2 Unit Apartments | 9 | 3.3% |
| 3 or 4 Unit Apartments | 9 | 3.3% |
| 5 to 9 Unit Apartments | 119 | 43.9% |
| 10 or more Apartments | 27 | 10.0% |
| Mobile Home / Other | 18 | 6.6% |
| Total | 271 | 100.0% |
Housing Structures by Occupancy in Red River
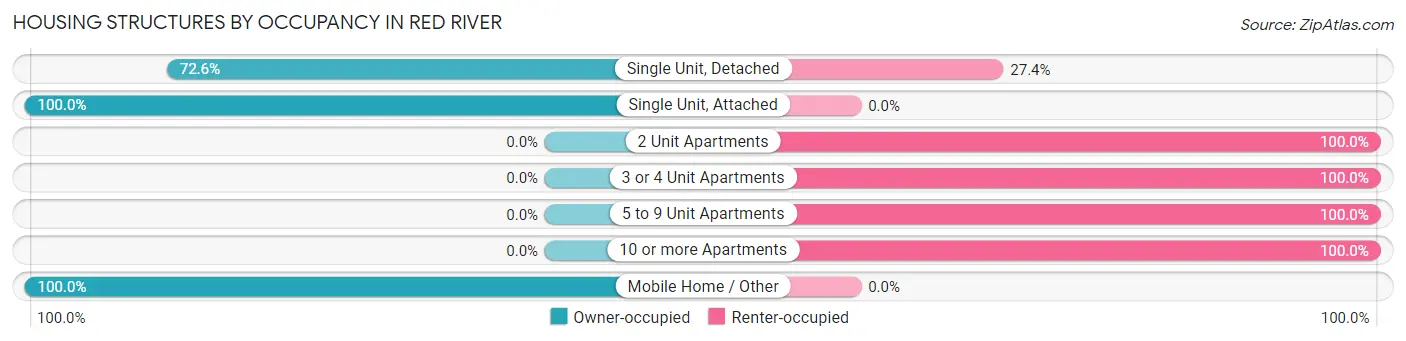
| Structure Type | Owner-occupied | Renter-occupied |
| Single Unit, Detached | 61 (72.6%) | 23 (27.4%) |
| Single Unit, Attached | 5 (100.0%) | 0 (0.0%) |
| 2 Unit Apartments | 0 (0.0%) | 9 (100.0%) |
| 3 or 4 Unit Apartments | 0 (0.0%) | 9 (100.0%) |
| 5 to 9 Unit Apartments | 0 (0.0%) | 119 (100.0%) |
| 10 or more Apartments | 0 (0.0%) | 27 (100.0%) |
| Mobile Home / Other | 18 (100.0%) | 0 (0.0%) |
| Total | 84 (31.0%) | 187 (69.0%) |
Housing Structures by Number of Rooms in Red River
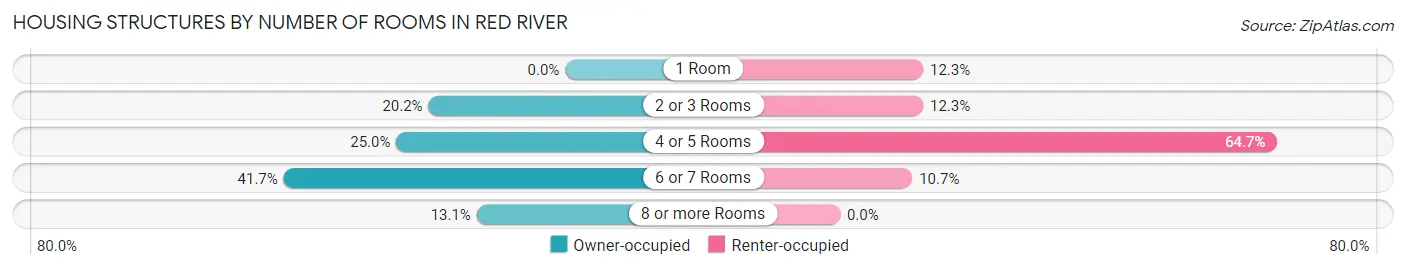
| Number of Rooms | Owner-occupied | Renter-occupied |
| 1 Room | 0 (0.0%) | 23 (12.3%) |
| 2 or 3 Rooms | 17 (20.2%) | 23 (12.3%) |
| 4 or 5 Rooms | 21 (25.0%) | 121 (64.7%) |
| 6 or 7 Rooms | 35 (41.7%) | 20 (10.7%) |
| 8 or more Rooms | 11 (13.1%) | 0 (0.0%) |
| Total | 84 (100.0%) | 187 (100.0%) |
Housing Structure by Heating Type in Red River
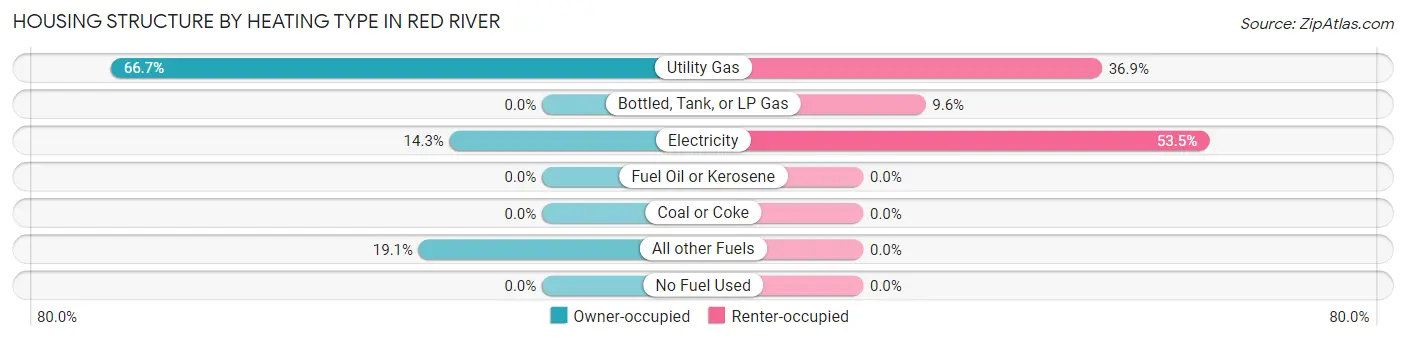
| Heating Type | Owner-occupied | Renter-occupied |
| Utility Gas | 56 (66.7%) | 69 (36.9%) |
| Bottled, Tank, or LP Gas | 0 (0.0%) | 18 (9.6%) |
| Electricity | 12 (14.3%) | 100 (53.5%) |
| Fuel Oil or Kerosene | 0 (0.0%) | 0 (0.0%) |
| Coal or Coke | 0 (0.0%) | 0 (0.0%) |
| All other Fuels | 16 (19.1%) | 0 (0.0%) |
| No Fuel Used | 0 (0.0%) | 0 (0.0%) |
| Total | 84 (100.0%) | 187 (100.0%) |
Household Vehicle Usage in Red River
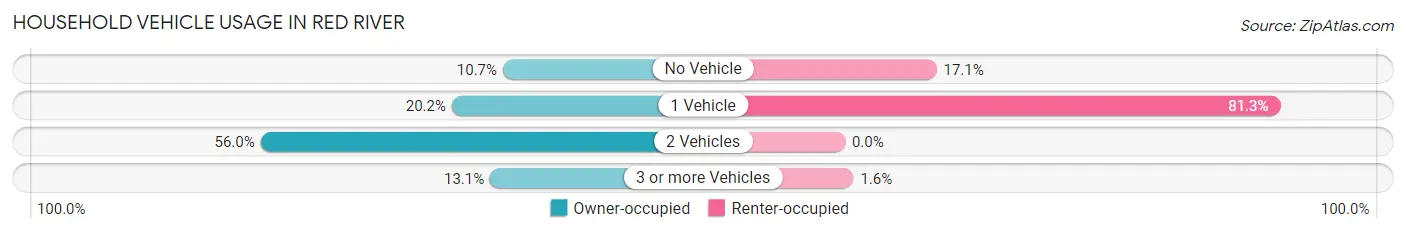
| Vehicles per Household | Owner-occupied | Renter-occupied |
| No Vehicle | 9 (10.7%) | 32 (17.1%) |
| 1 Vehicle | 17 (20.2%) | 152 (81.3%) |
| 2 Vehicles | 47 (55.9%) | 0 (0.0%) |
| 3 or more Vehicles | 11 (13.1%) | 3 (1.6%) |
| Total | 84 (100.0%) | 187 (100.0%) |
Real Estate & Mortgages in Red River
Real Estate and Mortgage Overview in Red River
| Characteristic | Without Mortgage | With Mortgage |
| Housing Units | 32 | 52 |
| Median Property Value | - | - |
| Median Household Income | - | - |
| Monthly Housing Costs | $744 | $0 |
| Real Estate Taxes | $1,556 | $0 |
Property Value by Mortgage Status in Red River
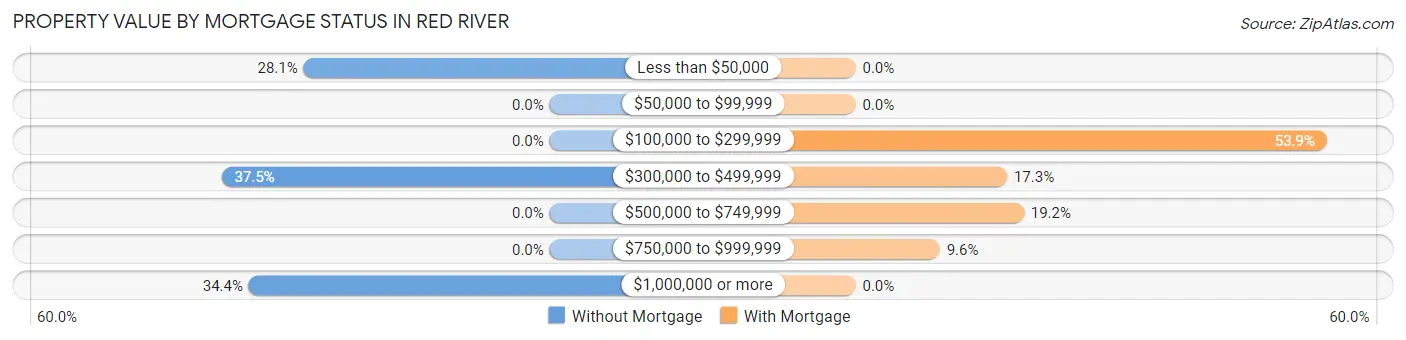
| Property Value | Without Mortgage | With Mortgage |
| Less than $50,000 | 9 (28.1%) | 0 (0.0%) |
| $50,000 to $99,999 | 0 (0.0%) | 0 (0.0%) |
| $100,000 to $299,999 | 0 (0.0%) | 28 (53.8%) |
| $300,000 to $499,999 | 12 (37.5%) | 9 (17.3%) |
| $500,000 to $749,999 | 0 (0.0%) | 10 (19.2%) |
| $750,000 to $999,999 | 0 (0.0%) | 5 (9.6%) |
| $1,000,000 or more | 11 (34.4%) | 0 (0.0%) |
| Total | 32 (100.0%) | 52 (100.0%) |
Household Income by Mortgage Status in Red River
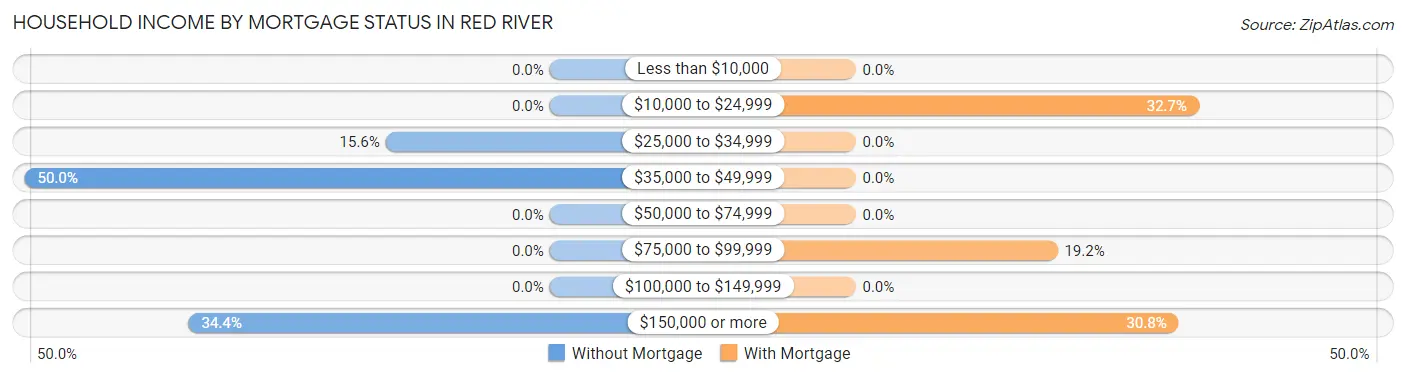
| Household Income | Without Mortgage | With Mortgage |
| Less than $10,000 | 0 (0.0%) | 0 (0.0%) |
| $10,000 to $24,999 | 0 (0.0%) | 17 (32.7%) |
| $25,000 to $34,999 | 5 (15.6%) | 0 (0.0%) |
| $35,000 to $49,999 | 16 (50.0%) | 0 (0.0%) |
| $50,000 to $74,999 | 0 (0.0%) | 0 (0.0%) |
| $75,000 to $99,999 | 0 (0.0%) | 10 (19.2%) |
| $100,000 to $149,999 | 0 (0.0%) | 0 (0.0%) |
| $150,000 or more | 11 (34.4%) | 16 (30.8%) |
| Total | 32 (100.0%) | 52 (100.0%) |
Property Value to Household Income Ratio in Red River
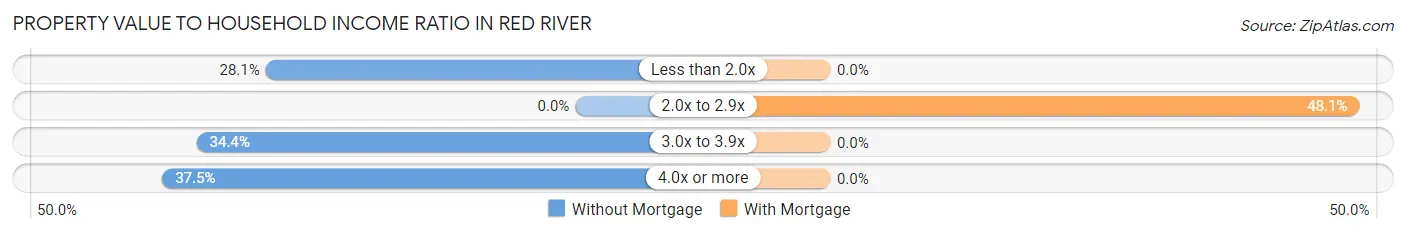
| Value-to-Income Ratio | Without Mortgage | With Mortgage |
| Less than 2.0x | 9 (28.1%) | 0 (0.0%) |
| 2.0x to 2.9x | 0 (0.0%) | 25 (48.1%) |
| 3.0x to 3.9x | 11 (34.4%) | 0 (0.0%) |
| 4.0x or more | 12 (37.5%) | 0 (0.0%) |
| Total | 32 (100.0%) | 52 (100.0%) |
Real Estate Taxes by Mortgage Status in Red River
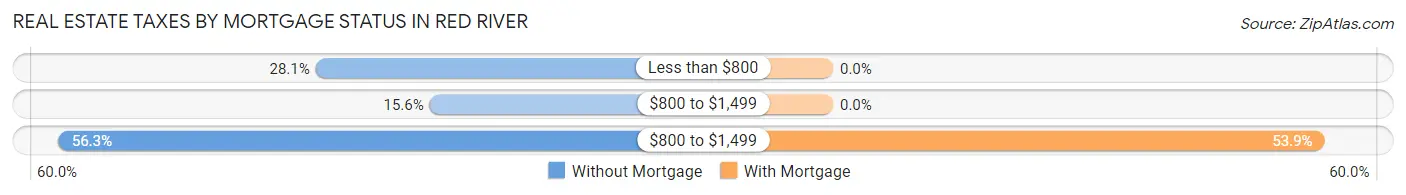
| Property Taxes | Without Mortgage | With Mortgage |
| Less than $800 | 9 (28.1%) | 0 (0.0%) |
| $800 to $1,499 | 5 (15.6%) | 0 (0.0%) |
| $800 to $1,499 | 18 (56.2%) | 28 (53.8%) |
| Total | 32 (100.0%) | 52 (100.0%) |
Health & Disability in Red River
Health Insurance Coverage by Age in Red River
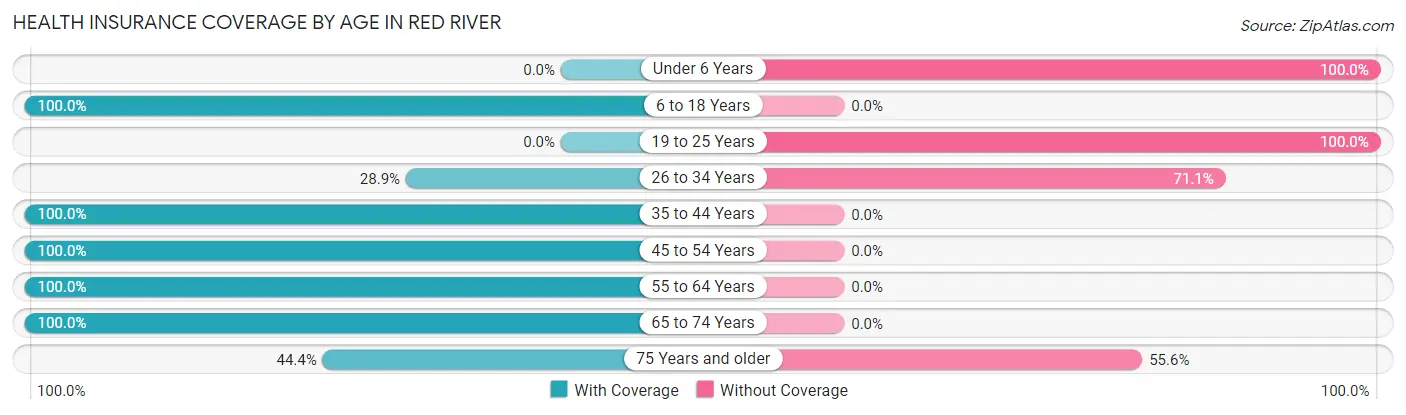
| Age Bracket | With Coverage | Without Coverage |
| Under 6 Years | 0 (0.0%) | 14 (100.0%) |
| 6 to 18 Years | 85 (100.0%) | 0 (0.0%) |
| 19 to 25 Years | 0 (0.0%) | 18 (100.0%) |
| 26 to 34 Years | 13 (28.9%) | 32 (71.1%) |
| 35 to 44 Years | 171 (100.0%) | 0 (0.0%) |
| 45 to 54 Years | 12 (100.0%) | 0 (0.0%) |
| 55 to 64 Years | 66 (100.0%) | 0 (0.0%) |
| 65 to 74 Years | 65 (100.0%) | 0 (0.0%) |
| 75 Years and older | 16 (44.4%) | 20 (55.6%) |
| Total | 428 (83.6%) | 84 (16.4%) |
Health Insurance Coverage by Citizenship Status in Red River
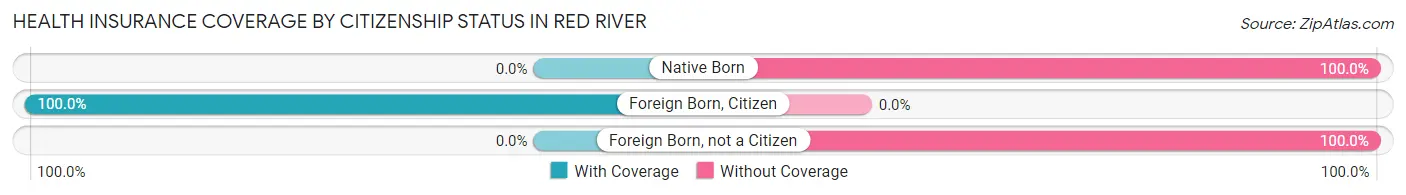
| Citizenship Status | With Coverage | Without Coverage |
| Native Born | 0 (0.0%) | 14 (100.0%) |
| Foreign Born, Citizen | 85 (100.0%) | 0 (0.0%) |
| Foreign Born, not a Citizen | 0 (0.0%) | 18 (100.0%) |
Health Insurance Coverage by Household Income in Red River
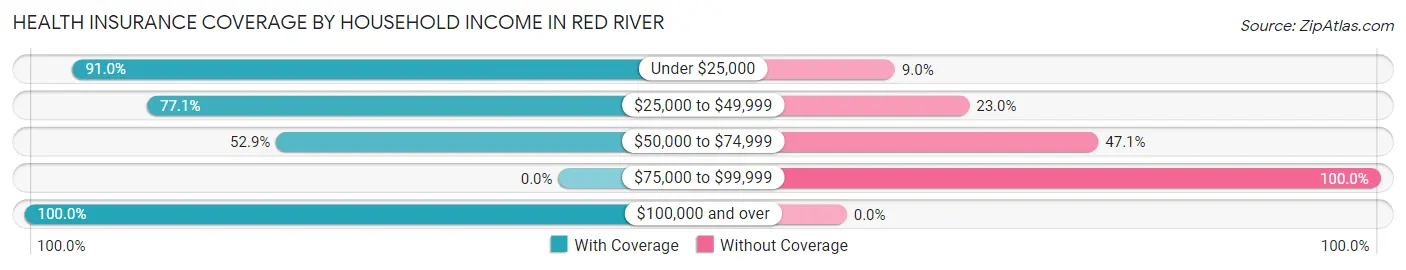
| Household Income | With Coverage | Without Coverage |
| Under $25,000 | 202 (91.0%) | 20 (9.0%) |
| $25,000 to $49,999 | 47 (77.0%) | 14 (23.0%) |
| $50,000 to $74,999 | 46 (52.9%) | 41 (47.1%) |
| $75,000 to $99,999 | 0 (0.0%) | 9 (100.0%) |
| $100,000 and over | 133 (100.0%) | 0 (0.0%) |
Public vs Private Health Insurance Coverage by Age in Red River
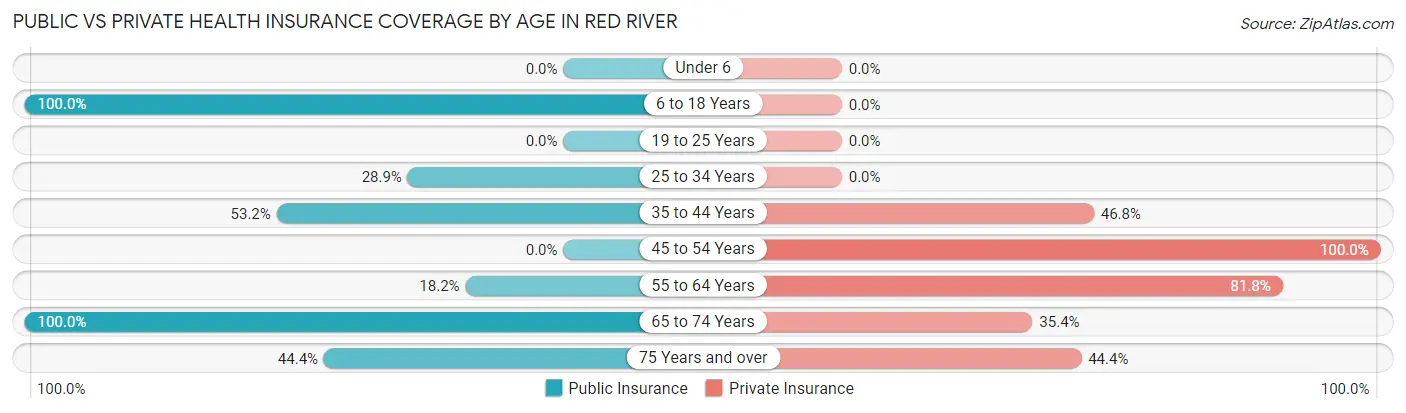
| Age Bracket | Public Insurance | Private Insurance |
| Under 6 | 0 (0.0%) | 0 (0.0%) |
| 6 to 18 Years | 85 (100.0%) | 0 (0.0%) |
| 19 to 25 Years | 0 (0.0%) | 0 (0.0%) |
| 25 to 34 Years | 13 (28.9%) | 0 (0.0%) |
| 35 to 44 Years | 91 (53.2%) | 80 (46.8%) |
| 45 to 54 Years | 0 (0.0%) | 12 (100.0%) |
| 55 to 64 Years | 12 (18.2%) | 54 (81.8%) |
| 65 to 74 Years | 65 (100.0%) | 23 (35.4%) |
| 75 Years and over | 16 (44.4%) | 16 (44.4%) |
| Total | 282 (55.1%) | 185 (36.1%) |
Disability Status by Sex by Age in Red River
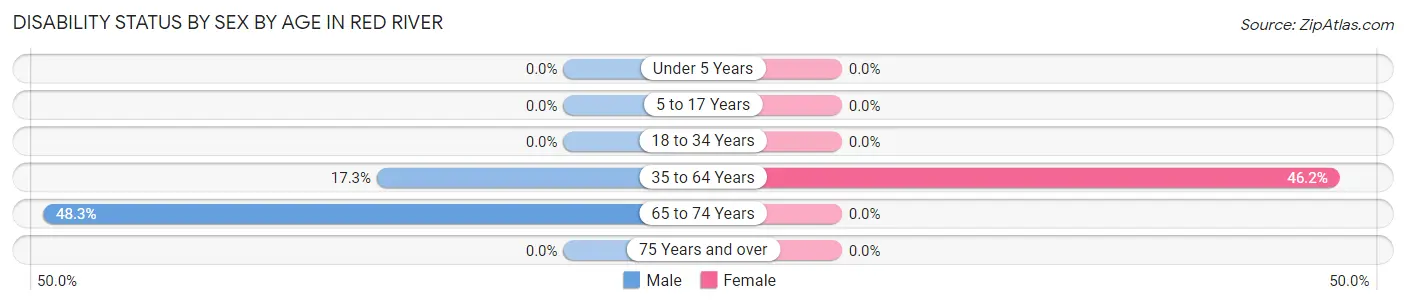
| Age Bracket | Male | Female |
| Under 5 Years | 0 (0.0%) | 0 (0.0%) |
| 5 to 17 Years | 0 (0.0%) | 0 (0.0%) |
| 18 to 34 Years | 0 (0.0%) | 0 (0.0%) |
| 35 to 64 Years | 9 (17.3%) | 91 (46.2%) |
| 65 to 74 Years | 14 (48.3%) | 0 (0.0%) |
| 75 Years and over | 0 (0.0%) | 0 (0.0%) |
Disability Class by Sex by Age in Red River
Disability Class: Hearing Difficulty
| Age Bracket | Male | Female |
| Under 5 Years | 0 (0.0%) | 0 (0.0%) |
| 5 to 17 Years | 0 (0.0%) | 0 (0.0%) |
| 18 to 34 Years | 0 (0.0%) | 0 (0.0%) |
| 35 to 64 Years | 0 (0.0%) | 0 (0.0%) |
| 65 to 74 Years | 0 (0.0%) | 0 (0.0%) |
| 75 Years and over | 0 (0.0%) | 0 (0.0%) |
Disability Class: Vision Difficulty
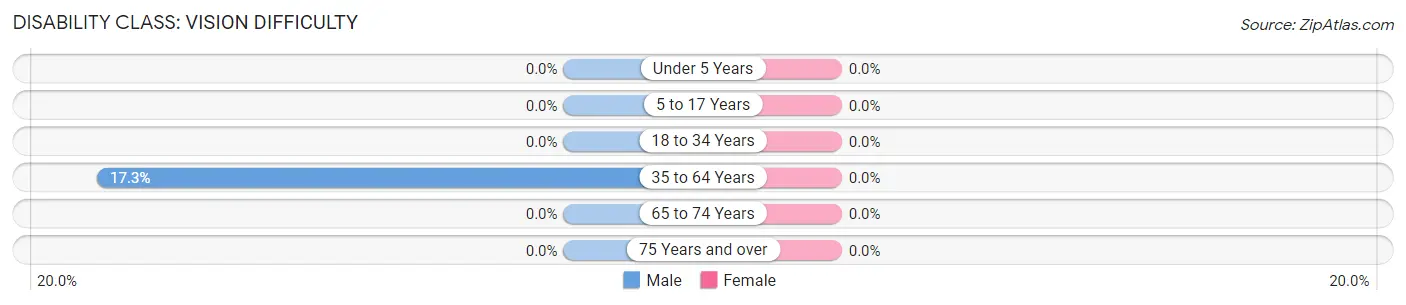
| Age Bracket | Male | Female |
| Under 5 Years | 0 (0.0%) | 0 (0.0%) |
| 5 to 17 Years | 0 (0.0%) | 0 (0.0%) |
| 18 to 34 Years | 0 (0.0%) | 0 (0.0%) |
| 35 to 64 Years | 9 (17.3%) | 0 (0.0%) |
| 65 to 74 Years | 0 (0.0%) | 0 (0.0%) |
| 75 Years and over | 0 (0.0%) | 0 (0.0%) |
Disability Class: Cognitive Difficulty
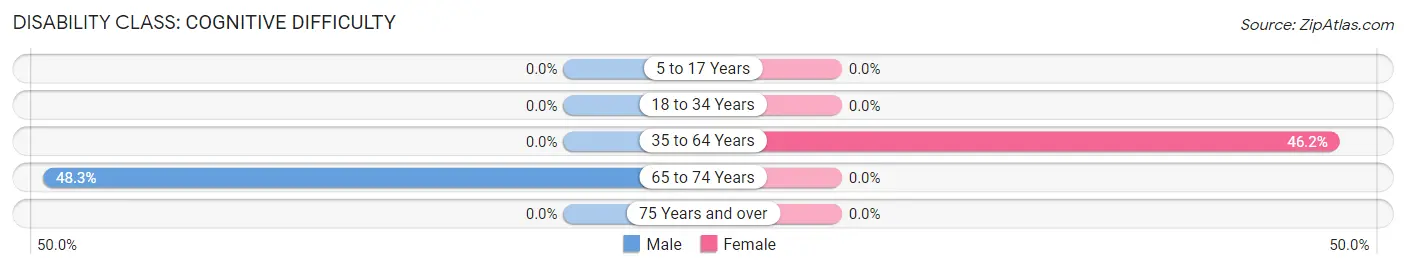
| Age Bracket | Male | Female |
| 5 to 17 Years | 0 (0.0%) | 0 (0.0%) |
| 18 to 34 Years | 0 (0.0%) | 0 (0.0%) |
| 35 to 64 Years | 0 (0.0%) | 91 (46.2%) |
| 65 to 74 Years | 14 (48.3%) | 0 (0.0%) |
| 75 Years and over | 0 (0.0%) | 0 (0.0%) |
Disability Class: Ambulatory Difficulty
| Age Bracket | Male | Female |
| 5 to 17 Years | 0 (0.0%) | 0 (0.0%) |
| 18 to 34 Years | 0 (0.0%) | 0 (0.0%) |
| 35 to 64 Years | 0 (0.0%) | 0 (0.0%) |
| 65 to 74 Years | 0 (0.0%) | 0 (0.0%) |
| 75 Years and over | 0 (0.0%) | 0 (0.0%) |
Disability Class: Self-Care Difficulty
| Age Bracket | Male | Female |
| 5 to 17 Years | 0 (0.0%) | 0 (0.0%) |
| 18 to 34 Years | 0 (0.0%) | 0 (0.0%) |
| 35 to 64 Years | 0 (0.0%) | 0 (0.0%) |
| 65 to 74 Years | 0 (0.0%) | 0 (0.0%) |
| 75 Years and over | 0 (0.0%) | 0 (0.0%) |
Technology Access in Red River
Computing Device Access in Red River
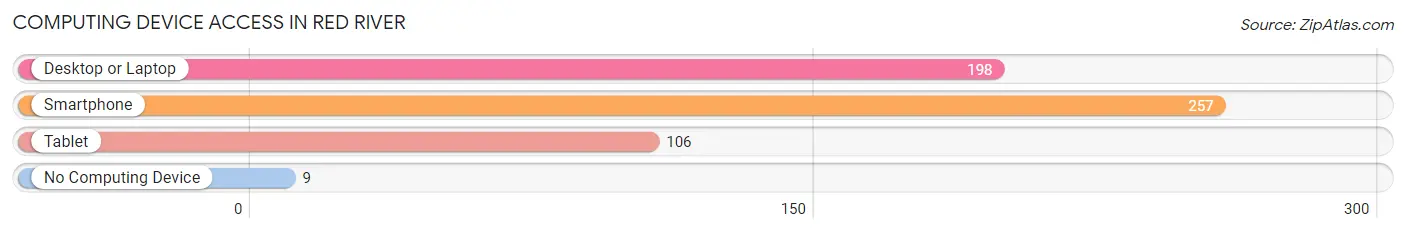
| Device Type | # Households | % Households |
| Desktop or Laptop | 198 | 73.1% |
| Smartphone | 257 | 94.8% |
| Tablet | 106 | 39.1% |
| No Computing Device | 9 | 3.3% |
| Total | 271 | 100.0% |
Internet Access in Red River
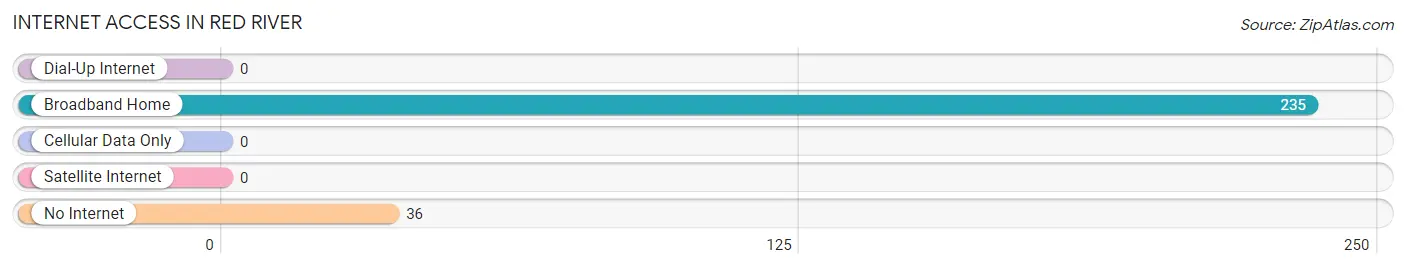
| Internet Type | # Households | % Households |
| Dial-Up Internet | 0 | 0.0% |
| Broadband Home | 235 | 86.7% |
| Cellular Data Only | 0 | 0.0% |
| Satellite Internet | 0 | 0.0% |
| No Internet | 36 | 13.3% |
| Total | 271 | 100.0% |
Red River Summary
Red River, New Mexico is a small mountain town located in the Sangre de Cristo Mountains of northern New Mexico. It is situated in Taos County, approximately two hours north of Santa Fe and two hours south of Taos. The town is known for its stunning mountain scenery, outdoor activities, and its historic downtown. Red River has a population of approximately 500 people and is a popular tourist destination for those looking to escape the hustle and bustle of city life.
Geography
Red River is located in the Sangre de Cristo Mountains of northern New Mexico. The town is situated at an elevation of 8,750 feet, making it one of the highest towns in the state. The town is surrounded by the Carson National Forest, which provides a stunning backdrop of mountains and forests. Red River is located in a valley, with the Red River running through the center of town. The town is located approximately two hours north of Santa Fe and two hours south of Taos.
Economy
Red River’s economy is largely based on tourism. The town is a popular destination for those looking to escape the hustle and bustle of city life. The town is known for its stunning mountain scenery, outdoor activities, and its historic downtown. The town is home to several ski resorts, including Red River Ski Area, which is the largest ski resort in New Mexico. The town also has several restaurants, bars, and shops, as well as a variety of lodging options.
Demographics
As of the 2010 census, Red River had a population of 500 people. The town is predominantly white, with approximately 85% of the population identifying as white. The remaining 15% of the population is made up of Hispanic, Native American, and other ethnicities. The median age of the population is 44.5 years, with the majority of the population being between the ages of 25 and 44. The median household income is $41,250, and the median home value is $220,000.
History
Red River was founded in 1881 by a group of prospectors who were searching for gold in the area. The town was originally named “Red River City”, but the name was later changed to Red River. The town quickly grew in popularity as a mining town, and by the early 1900s, it had become a popular tourist destination. The town was incorporated in 1906, and the first mayor was elected in 1907. The town has remained a popular tourist destination ever since, and it continues to attract visitors from all over the world.
Red River is a small mountain town with a rich history and a vibrant economy. The town is known for its stunning mountain scenery, outdoor activities, and its historic downtown. The town has a population of approximately 500 people and is a popular tourist destination for those looking to escape the hustle and bustle of city life. Red River is a great place to visit, and it is sure to provide visitors with a unique and memorable experience.
Common Questions
What is Per Capita Income in Red River?
Per Capita income in Red River is $44,815.
What is Inequality or Gini Index in Red River?
Inequality or Gini Index in Red River is 0.57.
What is the Total Population of Red River?
Total Population of Red River is 512.
What is the Total Male Population of Red River?
Total Male Population of Red River is 142.
What is the Total Female Population of Red River?
Total Female Population of Red River is 370.
What is the Ratio of Males per 100 Females in Red River?
There are 38.38 Males per 100 Females in Red River.
What is the Ratio of Females per 100 Males in Red River?
There are 260.56 Females per 100 Males in Red River.
What is the Median Population Age in Red River?
Median Population Age in Red River is 43.3 Years.
What is the Average Family Size in Red River
Average Family Size in Red River is 2.1 People.
What is the Average Household Size in Red River
Average Household Size in Red River is 1.9 People.
How Large is the Labor Force in Red River?
There are 260 People in the Labor Forcein in Red River.
What is the Percentage of People in the Labor Force in Red River?
63.0% of People are in the Labor Force in Red River.