Raton, NM Map & Demographics
Raton Map
Raton Overview
$25,679
PER CAPITA INCOME
$52,260
AVG FAMILY INCOME
$40,899
AVG HOUSEHOLD INCOME
25.4%
WAGE / INCOME GAP [ % ]
74.6¢/ $1
WAGE / INCOME GAP [ $ ]
0.40
INEQUALITY / GINI INDEX
6,046
TOTAL POPULATION
2,906
MALE POPULATION
3,140
FEMALE POPULATION
92.55
MALES / 100 FEMALES
108.05
FEMALES / 100 MALES
44.4
MEDIAN AGE
2.7
AVG FAMILY SIZE
2.1
AVG HOUSEHOLD SIZE
2,694
LABOR FORCE [ PEOPLE ]
52.1%
PERCENT IN LABOR FORCE
0.8%
UNEMPLOYMENT RATE
Raton Zip Codes
Raton Area Codes
Income in Raton
Income Overview in Raton
Per Capita Income in Raton is $25,679, while median incomes of families and households are $52,260 and $40,899 respectively.
| Characteristic | Number | Measure |
| Per Capita Income | 6,046 | $25,679 |
| Median Family Income | 1,535 | $52,260 |
| Mean Family Income | 1,535 | $63,948 |
| Median Household Income | 2,843 | $40,899 |
| Mean Household Income | 2,843 | $52,211 |
| Income Deficit | 1,535 | $0 |
| Wage / Income Gap (%) | 6,046 | 25.40% |
| Wage / Income Gap ($) | 6,046 | 74.60¢ per $1 |
| Gini / Inequality Index | 6,046 | 0.40 |
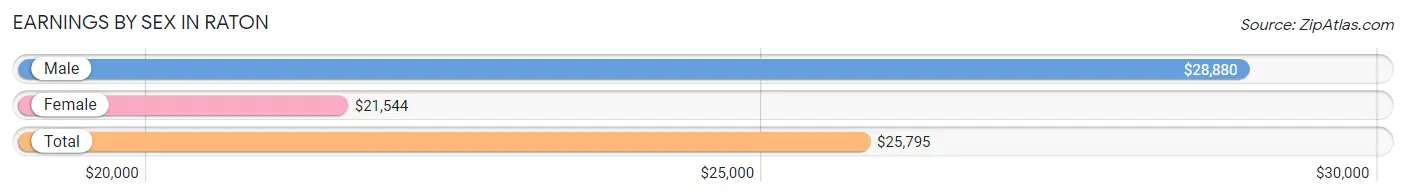
Earnings by Sex in Raton
Average Earnings in Raton are $25,795, $28,880 for men and $21,544 for women, a difference of 25.4%.
| Sex | Number | Average Earnings |
| Male | 1,445 (50.3%) | $28,880 |
| Female | 1,425 (49.6%) | $21,544 |
| Total | 2,870 (100.0%) | $25,795 |
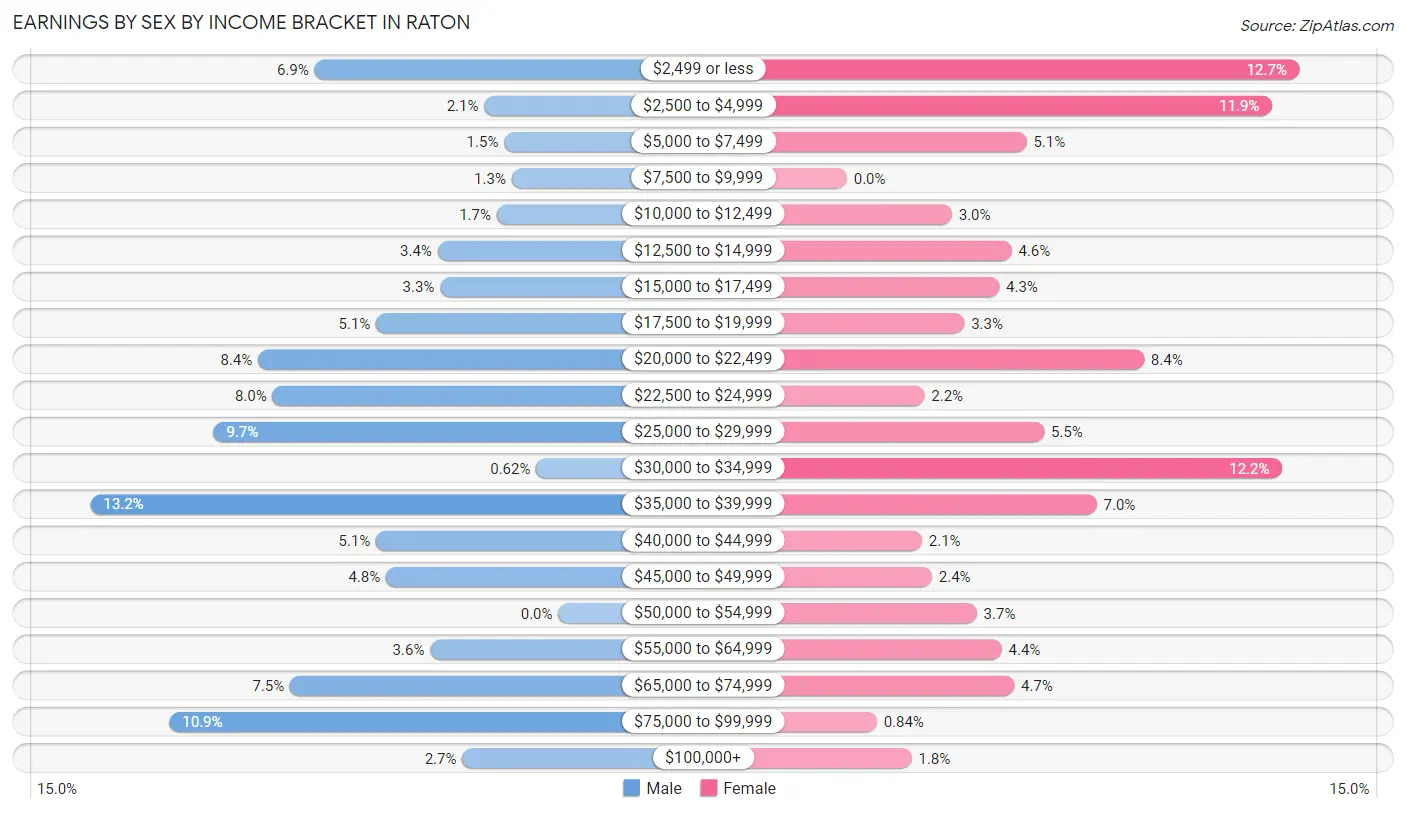
Earnings by Sex by Income Bracket in Raton
The most common earnings brackets in Raton are $35,000 to $39,999 for men (190 | 13.2%) and $2,499 or less for women (181 | 12.7%).
| Income | Male | Female |
| $2,499 or less | 99 (6.9%) | 181 (12.7%) |
| $2,500 to $4,999 | 30 (2.1%) | 170 (11.9%) |
| $5,000 to $7,499 | 22 (1.5%) | 72 (5.1%) |
| $7,500 to $9,999 | 19 (1.3%) | 0 (0.0%) |
| $10,000 to $12,499 | 25 (1.7%) | 42 (2.9%) |
| $12,500 to $14,999 | 49 (3.4%) | 66 (4.6%) |
| $15,000 to $17,499 | 48 (3.3%) | 61 (4.3%) |
| $17,500 to $19,999 | 74 (5.1%) | 47 (3.3%) |
| $20,000 to $22,499 | 122 (8.4%) | 119 (8.4%) |
| $22,500 to $24,999 | 116 (8.0%) | 31 (2.2%) |
| $25,000 to $29,999 | 140 (9.7%) | 79 (5.5%) |
| $30,000 to $34,999 | 9 (0.6%) | 174 (12.2%) |
| $35,000 to $39,999 | 190 (13.2%) | 100 (7.0%) |
| $40,000 to $44,999 | 74 (5.1%) | 30 (2.1%) |
| $45,000 to $49,999 | 70 (4.8%) | 34 (2.4%) |
| $50,000 to $54,999 | 0 (0.0%) | 52 (3.6%) |
| $55,000 to $64,999 | 52 (3.6%) | 62 (4.3%) |
| $65,000 to $74,999 | 109 (7.5%) | 67 (4.7%) |
| $75,000 to $99,999 | 158 (10.9%) | 12 (0.8%) |
| $100,000+ | 39 (2.7%) | 26 (1.8%) |
| Total | 1,445 (100.0%) | 1,425 (100.0%) |
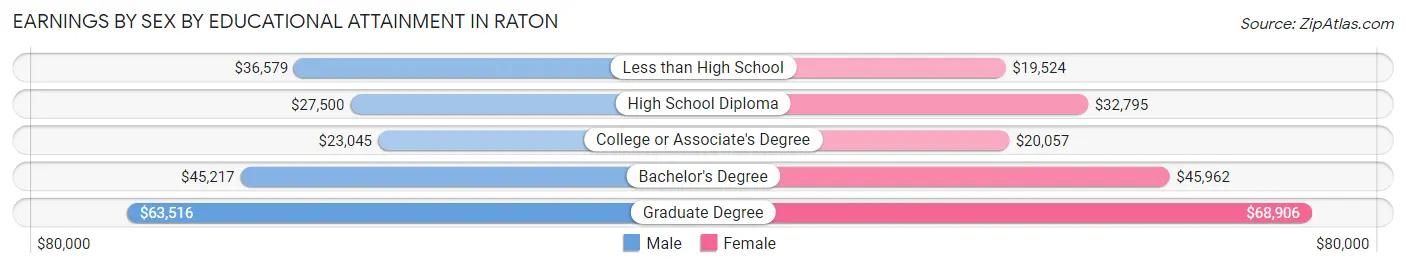
Earnings by Sex by Educational Attainment in Raton
Average earnings in Raton are $28,672 for men and $23,669 for women, a difference of 17.4%. Men with an educational attainment of graduate degree enjoy the highest average annual earnings of $63,516, while those with college or associate's degree education earn the least with $23,045. Women with an educational attainment of graduate degree earn the most with the average annual earnings of $68,906, while those with less than high school education have the smallest earnings of $19,524.
| Educational Attainment | Male Income | Female Income |
| Less than High School | $36,579 | $19,524 |
| High School Diploma | $27,500 | $32,795 |
| College or Associate's Degree | $23,045 | $20,057 |
| Bachelor's Degree | $45,217 | $45,962 |
| Graduate Degree | $63,516 | $68,906 |
| Total | $28,672 | $23,669 |
Family Income in Raton
Family Income Brackets in Raton
According to the Raton family income data, there are 394 families falling into the $50,000 to $74,999 income range, which is the most common income bracket and makes up 25.7% of all families. Conversely, the $10,000 to $14,999 income bracket is the least frequent group with only 9 families (0.6%) belonging to this category.
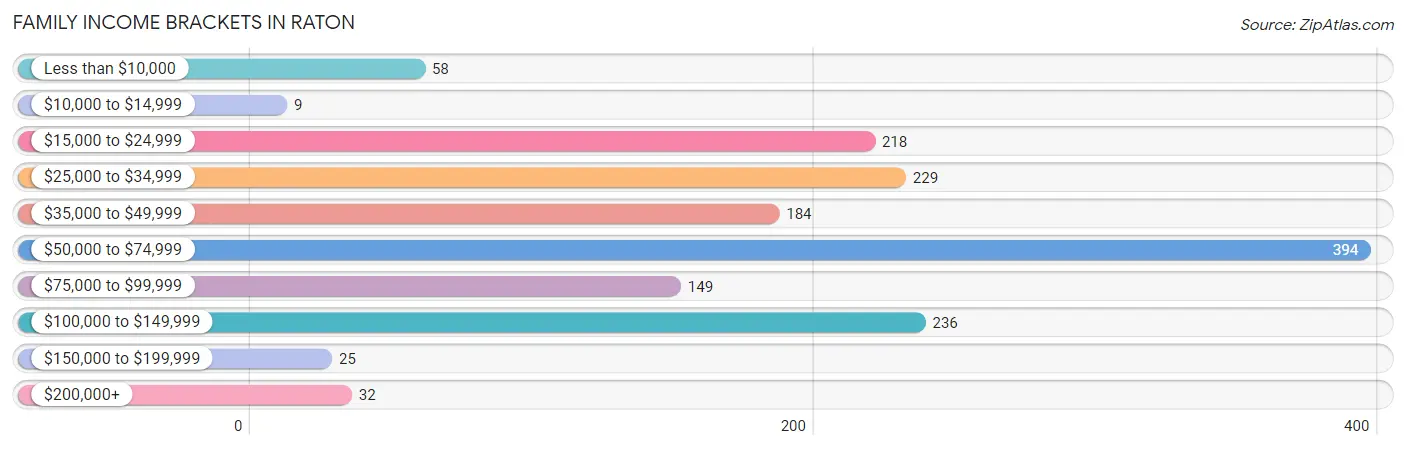
| Income Bracket | # Families | % Families |
| Less than $10,000 | 58 | 3.8% |
| $10,000 to $14,999 | 9 | 0.6% |
| $15,000 to $24,999 | 218 | 14.2% |
| $25,000 to $34,999 | 229 | 14.9% |
| $35,000 to $49,999 | 184 | 12.0% |
| $50,000 to $74,999 | 394 | 25.7% |
| $75,000 to $99,999 | 149 | 9.7% |
| $100,000 to $149,999 | 236 | 15.4% |
| $150,000 to $199,999 | 25 | 1.6% |
| $200,000+ | 32 | 2.1% |
Family Income by Famaliy Size in Raton
2-person families (851 | 55.4%) account for the highest median family income in Raton with $56,438 per family, while 2-person families (851 | 55.4%) have the highest median income of $28,219 per family member.
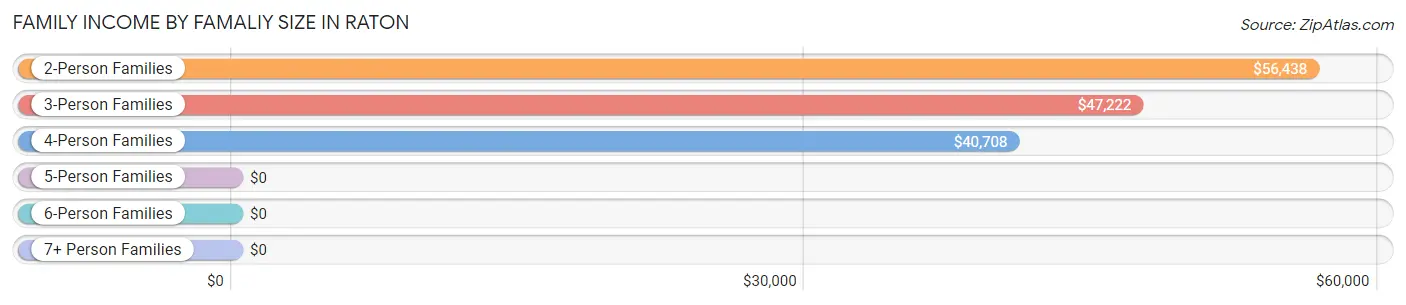
| Income Bracket | # Families | Median Income |
| 2-Person Families | 851 (55.4%) | $56,438 |
| 3-Person Families | 352 (22.9%) | $47,222 |
| 4-Person Families | 158 (10.3%) | $40,708 |
| 5-Person Families | 128 (8.3%) | $0 |
| 6-Person Families | 20 (1.3%) | $0 |
| 7+ Person Families | 26 (1.7%) | $0 |
| Total | 1,535 (100.0%) | $52,260 |
Family Income by Number of Earners in Raton
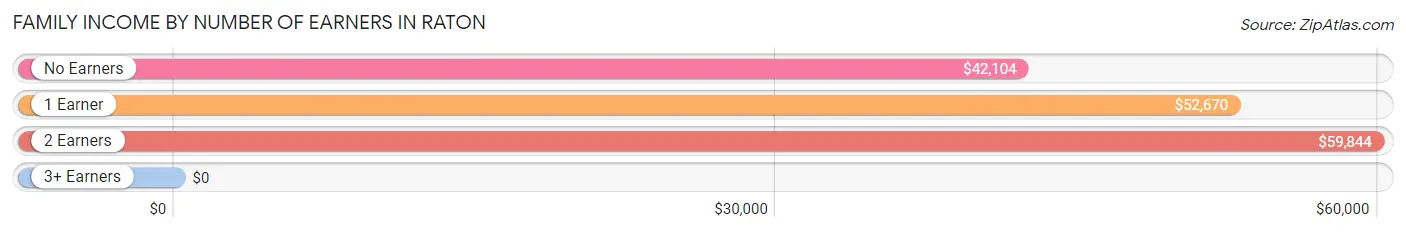
| Number of Earners | # Families | Median Income |
| No Earners | 444 (28.9%) | $42,104 |
| 1 Earner | 423 (27.6%) | $52,670 |
| 2 Earners | 635 (41.4%) | $59,844 |
| 3+ Earners | 33 (2.1%) | $0 |
| Total | 1,535 (100.0%) | $52,260 |
Household Income in Raton
Household Income Brackets in Raton
With 702 households falling in the category, the $50,000 to $74,999 income range is the most frequent in Raton, accounting for 24.7% of all households. In contrast, only 26 households (0.9%) fall into the $150,000 to $199,999 income bracket, making it the least populous group.
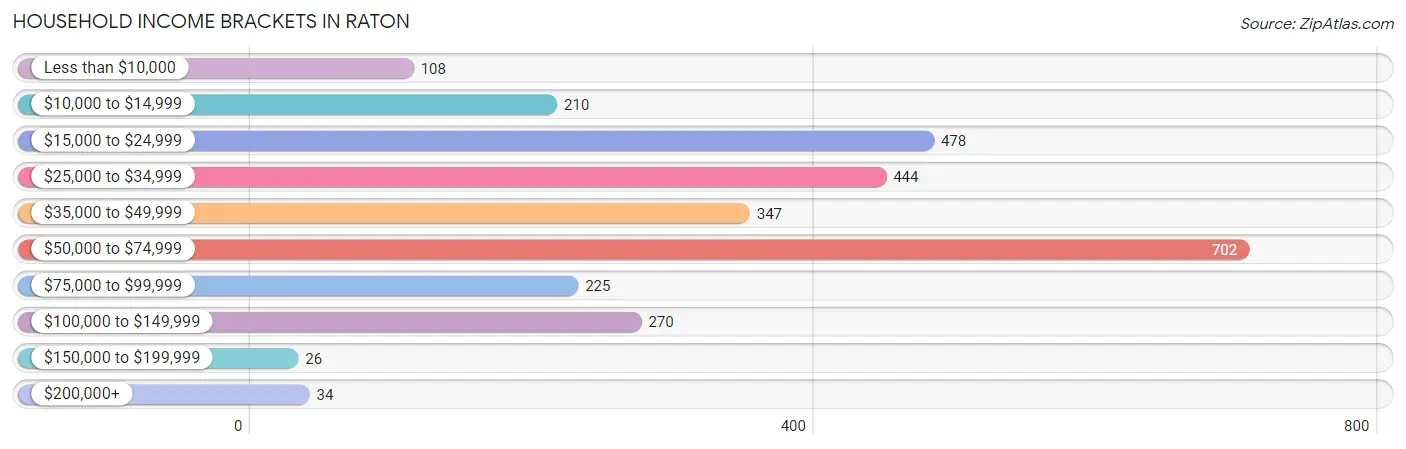
| Income Bracket | # Households | % Households |
| Less than $10,000 | 108 | 3.8% |
| $10,000 to $14,999 | 210 | 7.4% |
| $15,000 to $24,999 | 478 | 16.8% |
| $25,000 to $34,999 | 444 | 15.6% |
| $35,000 to $49,999 | 347 | 12.2% |
| $50,000 to $74,999 | 702 | 24.7% |
| $75,000 to $99,999 | 225 | 7.9% |
| $100,000 to $149,999 | 270 | 9.5% |
| $150,000 to $199,999 | 26 | 0.9% |
| $200,000+ | 34 | 1.2% |
Household Income by Householder Age in Raton
The median household income in Raton is $40,899, with the highest median household income of $65,539 found in the 15 to 24 years age bracket for the primary householder. A total of 120 households (4.2%) fall into this category. Meanwhile, the 25 to 44 years age bracket for the primary householder has the lowest median household income of $38,254, with 769 households (27.1%) in this group.
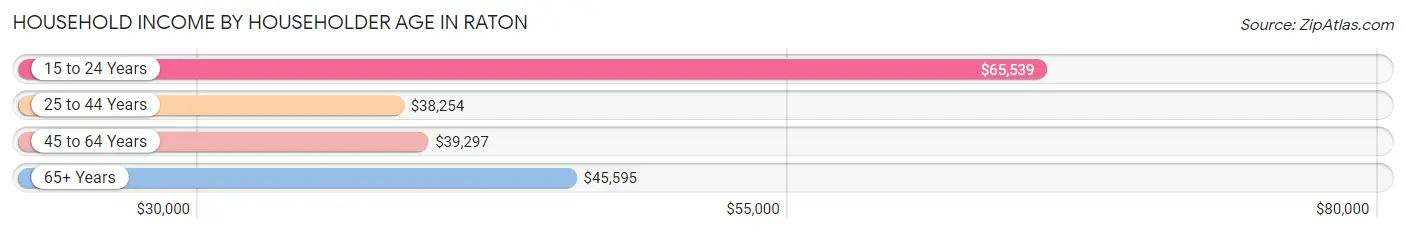
| Income Bracket | # Households | Median Income |
| 15 to 24 Years | 120 (4.2%) | $65,539 |
| 25 to 44 Years | 769 (27.1%) | $38,254 |
| 45 to 64 Years | 858 (30.2%) | $39,297 |
| 65+ Years | 1,096 (38.6%) | $45,595 |
| Total | 2,843 (100.0%) | $40,899 |
Poverty in Raton
Income Below Poverty by Sex and Age in Raton
With 21.3% poverty level for males and 21.8% for females among the residents of Raton, under 5 year old males and 5 year old females are the most vulnerable to poverty, with 83 males (75.4%) and 68 females (71.6%) in their respective age groups living below the poverty level.
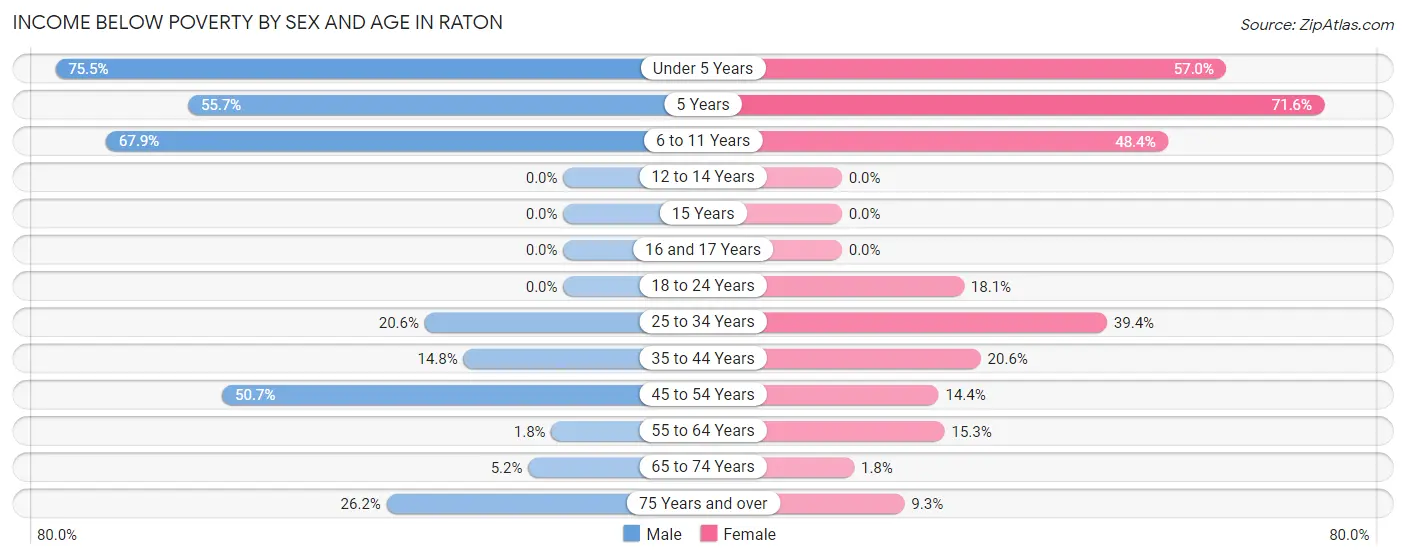
| Age Bracket | Male | Female |
| Under 5 Years | 83 (75.4%) | 73 (57.0%) |
| 5 Years | 34 (55.7%) | 68 (71.6%) |
| 6 to 11 Years | 108 (67.9%) | 118 (48.4%) |
| 12 to 14 Years | 0 (0.0%) | 0 (0.0%) |
| 15 Years | 0 (0.0%) | 0 (0.0%) |
| 16 and 17 Years | 0 (0.0%) | 0 (0.0%) |
| 18 to 24 Years | 0 (0.0%) | 31 (18.1%) |
| 25 to 34 Years | 64 (20.6%) | 150 (39.4%) |
| 35 to 44 Years | 64 (14.8%) | 80 (20.6%) |
| 45 to 54 Years | 149 (50.7%) | 48 (14.4%) |
| 55 to 64 Years | 6 (1.8%) | 67 (15.3%) |
| 65 to 74 Years | 22 (5.2%) | 9 (1.8%) |
| 75 Years and over | 53 (26.2%) | 28 (9.3%) |
| Total | 583 (21.3%) | 672 (21.8%) |
Income Above Poverty by Sex and Age in Raton
According to the poverty statistics in Raton, males aged 12 to 14 years and females aged 12 to 14 years are the age groups that are most secure financially, with 100.0% of males and 100.0% of females in these age groups living above the poverty line.
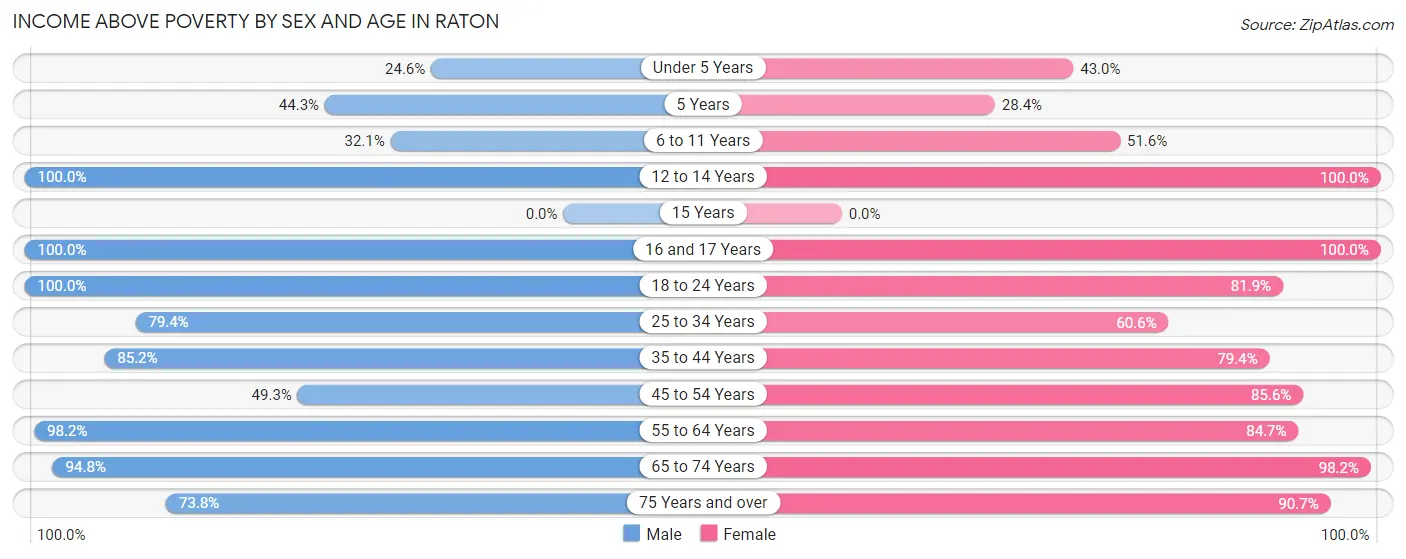
| Age Bracket | Male | Female |
| Under 5 Years | 27 (24.5%) | 55 (43.0%) |
| 5 Years | 27 (44.3%) | 27 (28.4%) |
| 6 to 11 Years | 51 (32.1%) | 126 (51.6%) |
| 12 to 14 Years | 12 (100.0%) | 33 (100.0%) |
| 15 Years | 0 (0.0%) | 0 (0.0%) |
| 16 and 17 Years | 82 (100.0%) | 74 (100.0%) |
| 18 to 24 Years | 315 (100.0%) | 140 (81.9%) |
| 25 to 34 Years | 247 (79.4%) | 231 (60.6%) |
| 35 to 44 Years | 368 (85.2%) | 308 (79.4%) |
| 45 to 54 Years | 145 (49.3%) | 286 (85.6%) |
| 55 to 64 Years | 333 (98.2%) | 372 (84.7%) |
| 65 to 74 Years | 400 (94.8%) | 485 (98.2%) |
| 75 Years and over | 149 (73.8%) | 273 (90.7%) |
| Total | 2,156 (78.7%) | 2,410 (78.2%) |
Income Below Poverty Among Married-Couple Families in Raton
The poverty statistics for married-couple families in Raton show that 12.3% or 112 of the total 907 families live below the poverty line. Families with 5 or more children have the highest poverty rate of 100.0%, comprising of 26 families. On the other hand, families with 1 or 2 children have the lowest poverty rate of 0.0%, which includes 0 families.
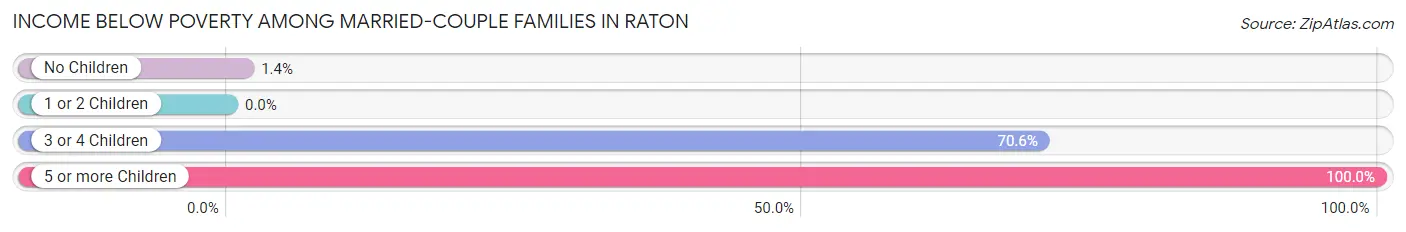
| Children | Above Poverty | Below Poverty |
| No Children | 631 (98.6%) | 9 (1.4%) |
| 1 or 2 Children | 132 (100.0%) | 0 (0.0%) |
| 3 or 4 Children | 32 (29.4%) | 77 (70.6%) |
| 5 or more Children | 0 (0.0%) | 26 (100.0%) |
| Total | 795 (87.6%) | 112 (12.3%) |
Income Below Poverty Among Single-Parent Households in Raton
According to the poverty data in Raton, 22.7% or 60 single-father households and 24.7% or 90 single-mother households are living below the poverty line. Among single-father households, those with no children have the highest poverty rate, with 31 households (25.8%) experiencing poverty. Likewise, among single-mother households, those with 1 or 2 children have the highest poverty rate, with 90 households (42.2%) falling below the poverty line.
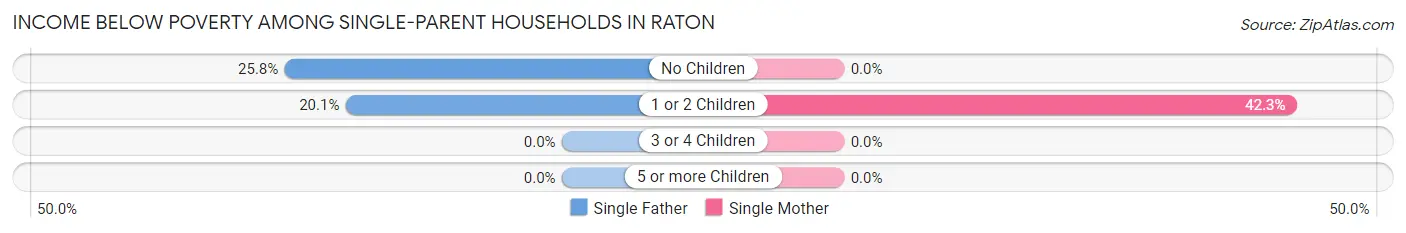
| Children | Single Father | Single Mother |
| No Children | 31 (25.8%) | 0 (0.0%) |
| 1 or 2 Children | 29 (20.1%) | 90 (42.2%) |
| 3 or 4 Children | 0 (0.0%) | 0 (0.0%) |
| 5 or more Children | 0 (0.0%) | 0 (0.0%) |
| Total | 60 (22.7%) | 90 (24.7%) |
Income Below Poverty Among Married-Couple vs Single-Parent Households in Raton
The poverty data for Raton shows that 112 of the married-couple family households (12.3%) and 150 of the single-parent households (23.9%) are living below the poverty level. Within the married-couple family households, those with 5 or more children have the highest poverty rate, with 26 households (100.0%) falling below the poverty line. Among the single-parent households, those with 1 or 2 children have the highest poverty rate, with 119 household (33.3%) living below poverty.
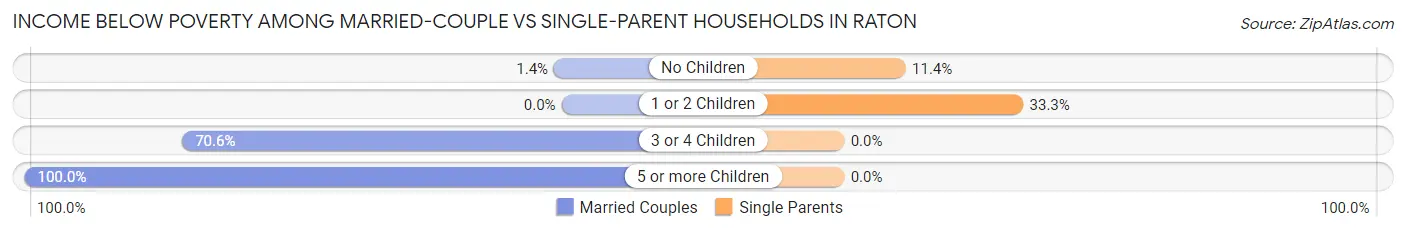
| Children | Married-Couple Families | Single-Parent Households |
| No Children | 9 (1.4%) | 31 (11.4%) |
| 1 or 2 Children | 0 (0.0%) | 119 (33.3%) |
| 3 or 4 Children | 77 (70.6%) | 0 (0.0%) |
| 5 or more Children | 26 (100.0%) | 0 (0.0%) |
| Total | 112 (12.3%) | 150 (23.9%) |
Race in Raton
The most populous races in Raton are White / Caucasian (4,302 | 71.2%), Hispanic or Latino (3,361 | 55.6%), and Two or more Races (956 | 15.8%).
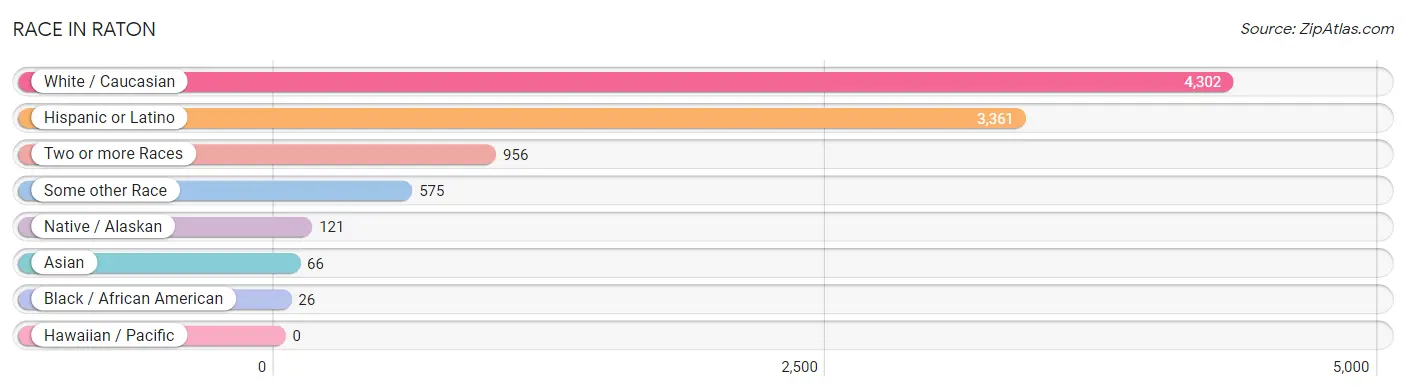
| Race | # Population | % Population |
| Asian | 66 | 1.1% |
| Black / African American | 26 | 0.4% |
| Hawaiian / Pacific | 0 | 0.0% |
| Hispanic or Latino | 3,361 | 55.6% |
| Native / Alaskan | 121 | 2.0% |
| White / Caucasian | 4,302 | 71.2% |
| Two or more Races | 956 | 15.8% |
| Some other Race | 575 | 9.5% |
| Total | 6,046 | 100.0% |
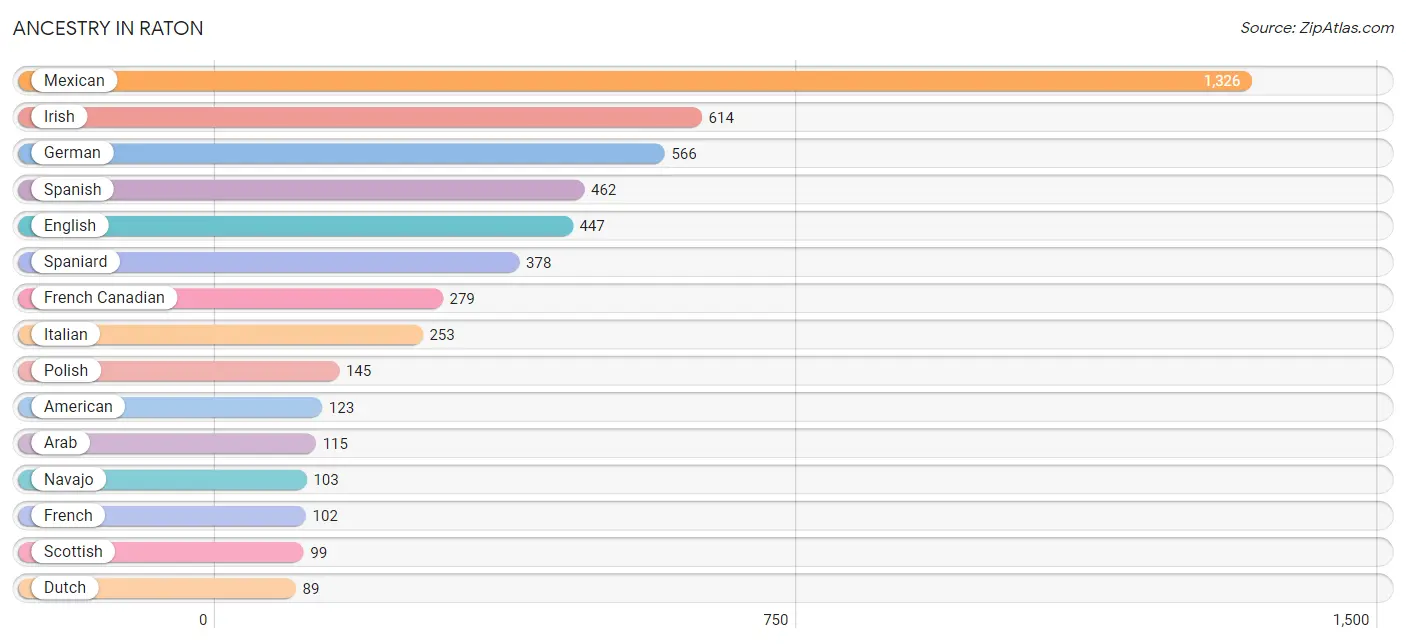
Ancestry in Raton
The most populous ancestries reported in Raton are Mexican (1,326 | 21.9%), Irish (614 | 10.2%), German (566 | 9.4%), Spanish (462 | 7.6%), and English (447 | 7.4%), together accounting for 56.5% of all Raton residents.
| Ancestry | # Population | % Population |
| African | 28 | 0.5% |
| American | 123 | 2.0% |
| Apache | 66 | 1.1% |
| Arab | 115 | 1.9% |
| Austrian | 10 | 0.2% |
| British | 24 | 0.4% |
| Cherokee | 32 | 0.5% |
| Chickasaw | 32 | 0.5% |
| Choctaw | 2 | 0.0% |
| Danish | 22 | 0.4% |
| Dutch | 89 | 1.5% |
| Dutch West Indian | 13 | 0.2% |
| Eastern European | 9 | 0.2% |
| English | 447 | 7.4% |
| European | 84 | 1.4% |
| French | 102 | 1.7% |
| French Canadian | 279 | 4.6% |
| German | 566 | 9.4% |
| Greek | 65 | 1.1% |
| Irish | 614 | 10.2% |
| Italian | 253 | 4.2% |
| Lebanese | 56 | 0.9% |
| Mexican | 1,326 | 21.9% |
| Navajo | 103 | 1.7% |
| Norwegian | 58 | 1.0% |
| Palestinian | 10 | 0.2% |
| Polish | 145 | 2.4% |
| Puerto Rican | 43 | 0.7% |
| Russian | 32 | 0.5% |
| Scandinavian | 17 | 0.3% |
| Scotch-Irish | 51 | 0.8% |
| Scottish | 99 | 1.6% |
| Sioux | 6 | 0.1% |
| Slavic | 18 | 0.3% |
| Spaniard | 378 | 6.2% |
| Spanish | 462 | 7.6% |
| Spanish American | 41 | 0.7% |
| Subsaharan African | 28 | 0.5% |
| Swedish | 11 | 0.2% |
| Thai | 66 | 1.1% |
| Yugoslavian | 18 | 0.3% | View All 41 Rows |
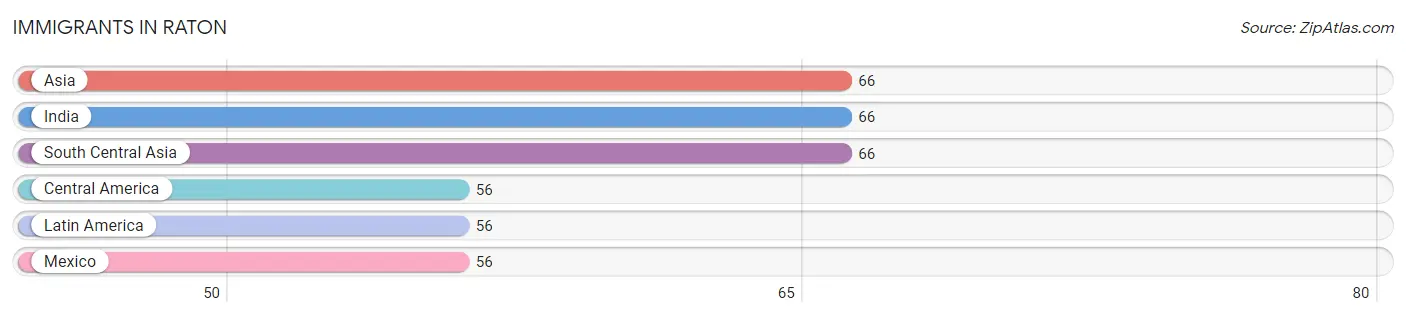
Immigrants in Raton
The most numerous immigrant groups reported in Raton came from Asia (66 | 1.1%), India (66 | 1.1%), South Central Asia (66 | 1.1%), Central America (56 | 0.9%), and Latin America (56 | 0.9%), together accounting for 5.1% of all Raton residents.
| Immigration Origin | # Population | % Population |
| Asia | 66 | 1.1% |
| Central America | 56 | 0.9% |
| India | 66 | 1.1% |
| Latin America | 56 | 0.9% |
| Mexico | 56 | 0.9% |
| South Central Asia | 66 | 1.1% | View All 6 Rows |
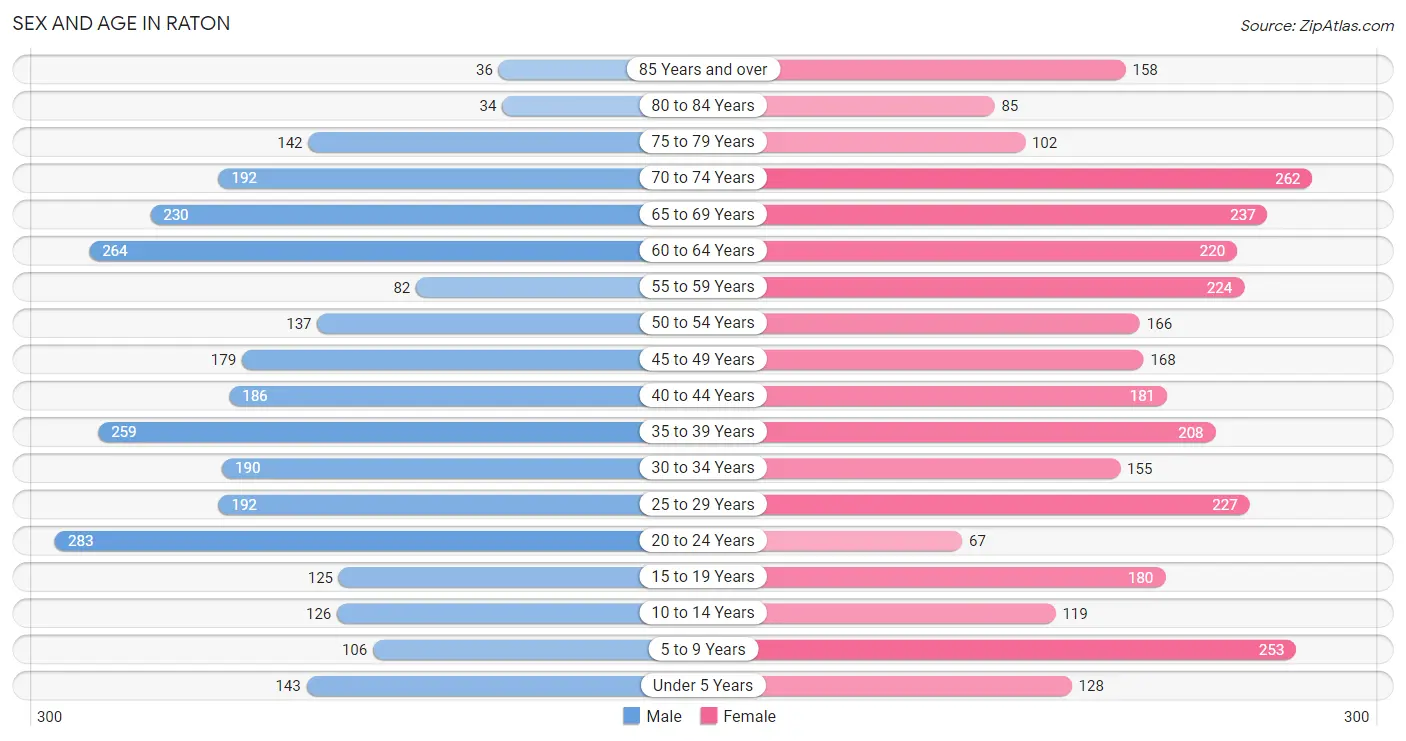
Sex and Age in Raton
Sex and Age in Raton
The most populous age groups in Raton are 20 to 24 Years (283 | 9.7%) for men and 70 to 74 Years (262 | 8.3%) for women.
| Age Bracket | Male | Female |
| Under 5 Years | 143 (4.9%) | 128 (4.1%) |
| 5 to 9 Years | 106 (3.6%) | 253 (8.1%) |
| 10 to 14 Years | 126 (4.3%) | 119 (3.8%) |
| 15 to 19 Years | 125 (4.3%) | 180 (5.7%) |
| 20 to 24 Years | 283 (9.7%) | 67 (2.1%) |
| 25 to 29 Years | 192 (6.6%) | 227 (7.2%) |
| 30 to 34 Years | 190 (6.5%) | 155 (4.9%) |
| 35 to 39 Years | 259 (8.9%) | 208 (6.6%) |
| 40 to 44 Years | 186 (6.4%) | 181 (5.8%) |
| 45 to 49 Years | 179 (6.2%) | 168 (5.3%) |
| 50 to 54 Years | 137 (4.7%) | 166 (5.3%) |
| 55 to 59 Years | 82 (2.8%) | 224 (7.1%) |
| 60 to 64 Years | 264 (9.1%) | 220 (7.0%) |
| 65 to 69 Years | 230 (7.9%) | 237 (7.5%) |
| 70 to 74 Years | 192 (6.6%) | 262 (8.3%) |
| 75 to 79 Years | 142 (4.9%) | 102 (3.3%) |
| 80 to 84 Years | 34 (1.2%) | 85 (2.7%) |
| 85 Years and over | 36 (1.2%) | 158 (5.0%) |
| Total | 2,906 (100.0%) | 3,140 (100.0%) |
Families and Households in Raton
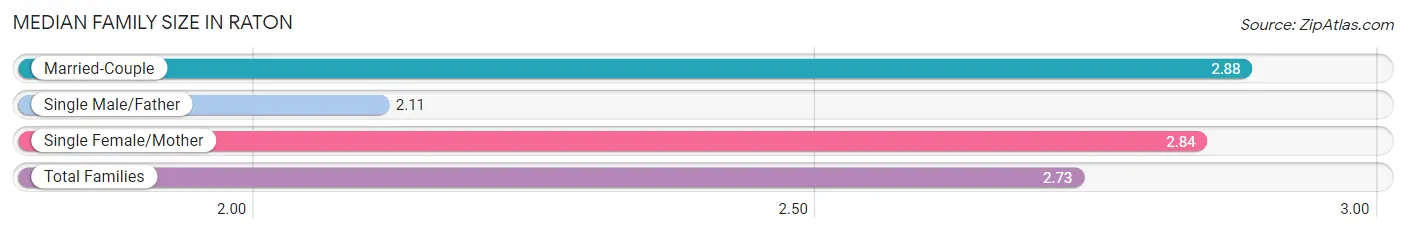
Median Family Size in Raton
The median family size in Raton is 2.73 persons per family, with married-couple families (907 | 59.1%) accounting for the largest median family size of 2.88 persons per family. On the other hand, single male/father families (264 | 17.2%) represent the smallest median family size with 2.11 persons per family.
| Family Type | # Families | Family Size |
| Married-Couple | 907 (59.1%) | 2.88 |
| Single Male/Father | 264 (17.2%) | 2.11 |
| Single Female/Mother | 364 (23.7%) | 2.84 |
| Total Families | 1,535 (100.0%) | 2.73 |
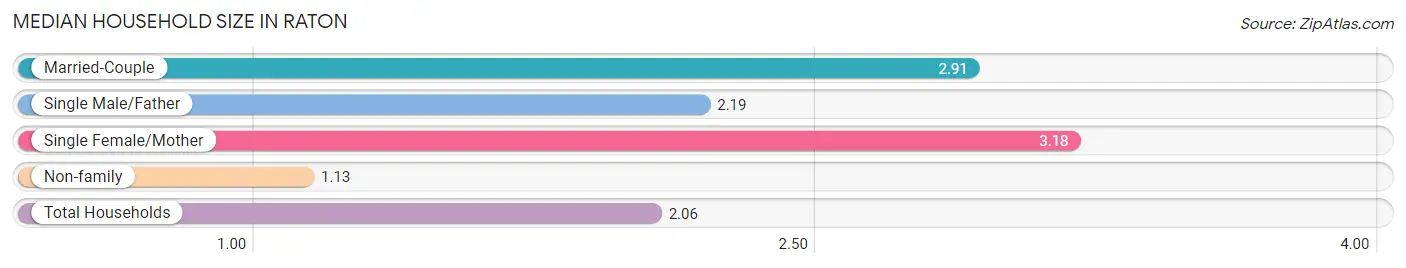
Median Household Size in Raton
The median household size in Raton is 2.06 persons per household, with single female/mother households (364 | 12.8%) accounting for the largest median household size of 3.18 persons per household. non-family households (1,308 | 46.0%) represent the smallest median household size with 1.13 persons per household.
| Household Type | # Households | Household Size |
| Married-Couple | 907 (31.9%) | 2.91 |
| Single Male/Father | 264 (9.3%) | 2.19 |
| Single Female/Mother | 364 (12.8%) | 3.18 |
| Non-family | 1,308 (46.0%) | 1.13 |
| Total Households | 2,843 (100.0%) | 2.06 |
Household Size by Marriage Status in Raton
Out of a total of 2,843 households in Raton, 1,535 (54.0%) are family households, while 1,308 (46.0%) are nonfamily households. The most numerous type of family households are 2-person households, comprising 805, and the most common type of nonfamily households are 1-person households, comprising 1,126.
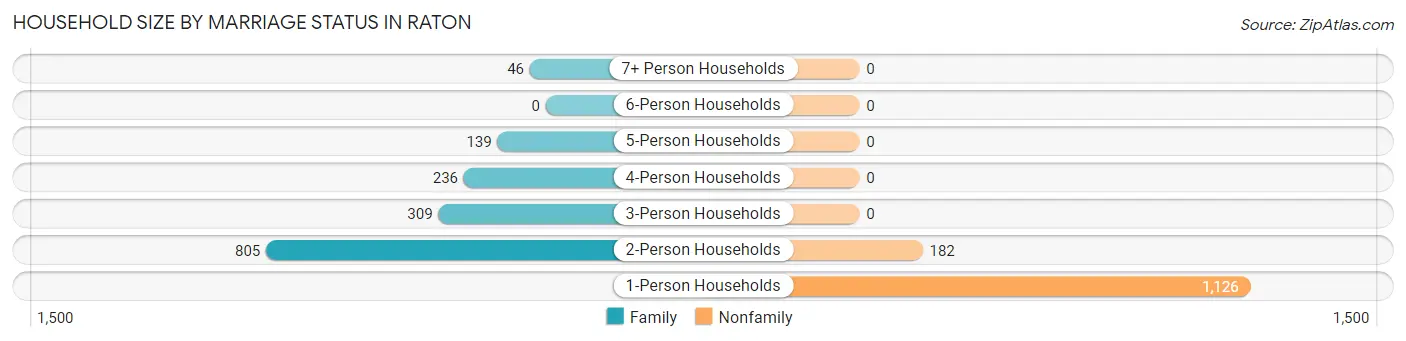
| Household Size | Family Households | Nonfamily Households |
| 1-Person Households | - | 1,126 (39.6%) |
| 2-Person Households | 805 (28.3%) | 182 (6.4%) |
| 3-Person Households | 309 (10.9%) | 0 (0.0%) |
| 4-Person Households | 236 (8.3%) | 0 (0.0%) |
| 5-Person Households | 139 (4.9%) | 0 (0.0%) |
| 6-Person Households | 0 (0.0%) | 0 (0.0%) |
| 7+ Person Households | 46 (1.6%) | 0 (0.0%) |
| Total | 1,535 (54.0%) | 1,308 (46.0%) |
Female Fertility in Raton
Fertility by Age in Raton
Average fertility rate in Raton is 47.0 births per 1,000 women. Women in the age bracket of 15 to 19 years have the highest fertility rate with 94.0 births per 1,000 women. Women in the age bracket of 20 to 34 years acount for 70.2% of all women with births.
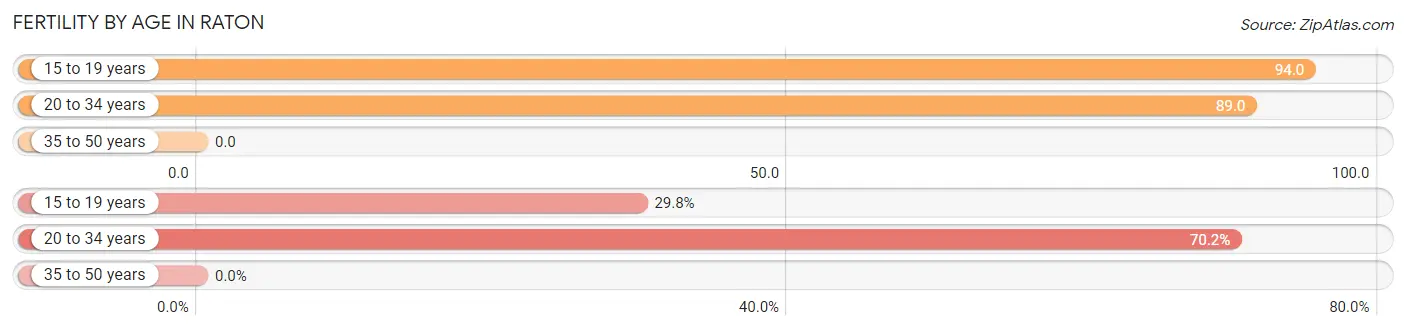
| Age Bracket | Women with Births | Births / 1,000 Women |
| 15 to 19 years | 17 (29.8%) | 94.0 |
| 20 to 34 years | 40 (70.2%) | 89.0 |
| 35 to 50 years | 0 (0.0%) | 0.0 |
| Total | 57 (100.0%) | 47.0 |
Fertility by Age by Marriage Status in Raton
45.6% of women with births (57) in Raton are married. The highest percentage of unmarried women with births falls into 15 to 19 years age bracket with 100.0% of them unmarried at the time of birth, while the lowest percentage of unmarried women with births belong to 20 to 34 years age bracket with 35.0% of them unmarried.
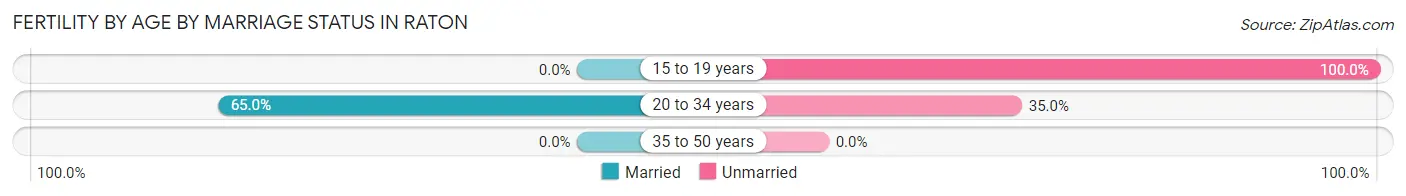
| Age Bracket | Married | Unmarried |
| 15 to 19 years | 0 (0.0%) | 17 (100.0%) |
| 20 to 34 years | 26 (65.0%) | 14 (35.0%) |
| 35 to 50 years | 0 (0.0%) | 0 (0.0%) |
| Total | 26 (45.6%) | 31 (54.4%) |
Fertility by Education in Raton
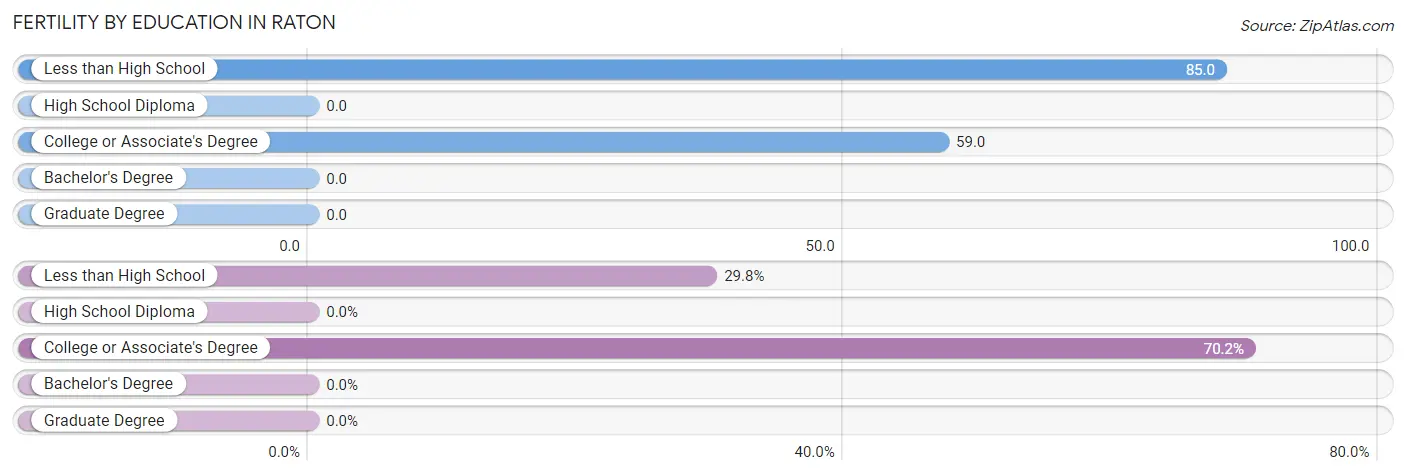
| Educational Attainment | Women with Births | Births / 1,000 Women |
| Less than High School | 17 (29.8%) | 85.0 |
| High School Diploma | 0 (0.0%) | 0.0 |
| College or Associate's Degree | 40 (70.2%) | 59.0 |
| Bachelor's Degree | 0 (0.0%) | 0.0 |
| Graduate Degree | 0 (0.0%) | 0.0 |
| Total | 57 (100.0%) | 47.0 |
Fertility by Education by Marriage Status in Raton
54.4% of women with births in Raton are unmarried. Women with the educational attainment of college or associate's degree are most likely to be married with 65.0% of them married at childbirth, while women with the educational attainment of less than high school are least likely to be married with 100.0% of them unmarried at childbirth.
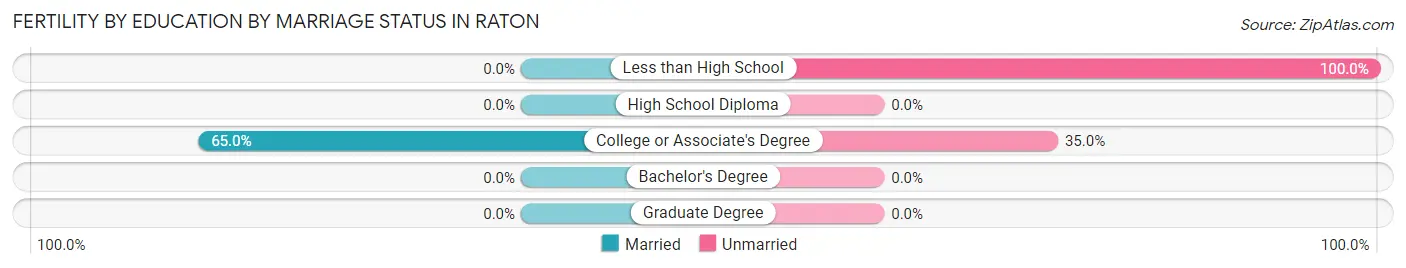
| Educational Attainment | Married | Unmarried |
| Less than High School | 0 (0.0%) | 17 (100.0%) |
| High School Diploma | 0 (0.0%) | 0 (0.0%) |
| College or Associate's Degree | 26 (65.0%) | 14 (35.0%) |
| Bachelor's Degree | 0 (0.0%) | 0 (0.0%) |
| Graduate Degree | 0 (0.0%) | 0 (0.0%) |
| Total | 26 (45.6%) | 31 (54.4%) |
Employment Characteristics in Raton
Employment by Class of Employer in Raton
Among the 2,516 employed individuals in Raton, private company employees (1,466 | 58.3%), state government employees (363 | 14.4%), and not-for-profit organizations (249 | 9.9%) make up the most common classes of employment.
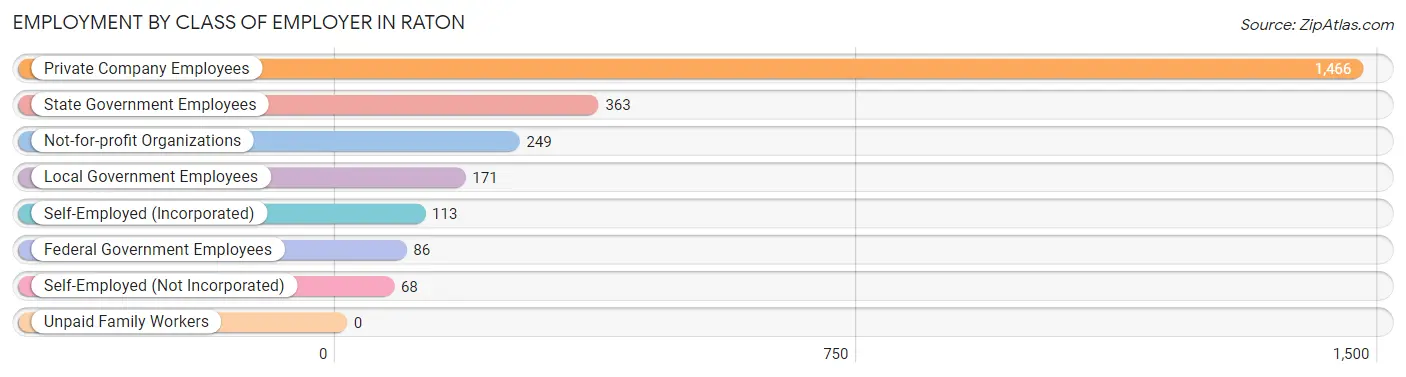
| Employer Class | # Employees | % Employees |
| Private Company Employees | 1,466 | 58.3% |
| Self-Employed (Incorporated) | 113 | 4.5% |
| Self-Employed (Not Incorporated) | 68 | 2.7% |
| Not-for-profit Organizations | 249 | 9.9% |
| Local Government Employees | 171 | 6.8% |
| State Government Employees | 363 | 14.4% |
| Federal Government Employees | 86 | 3.4% |
| Unpaid Family Workers | 0 | 0.0% |
| Total | 2,516 | 100.0% |
Employment Status by Age in Raton
According to the labor force statistics for Raton, out of the total population over 16 years of age (5,171), 52.1% or 2,694 individuals are in the labor force, with 0.8% or 22 of them unemployed. The age group with the highest labor force participation rate is 25 to 29 years, with 84.7% or 355 individuals in the labor force. Within the labor force, the 45 to 54 years age range has the highest percentage of unemployed individuals, with 3.0% or 11 of them being unemployed.
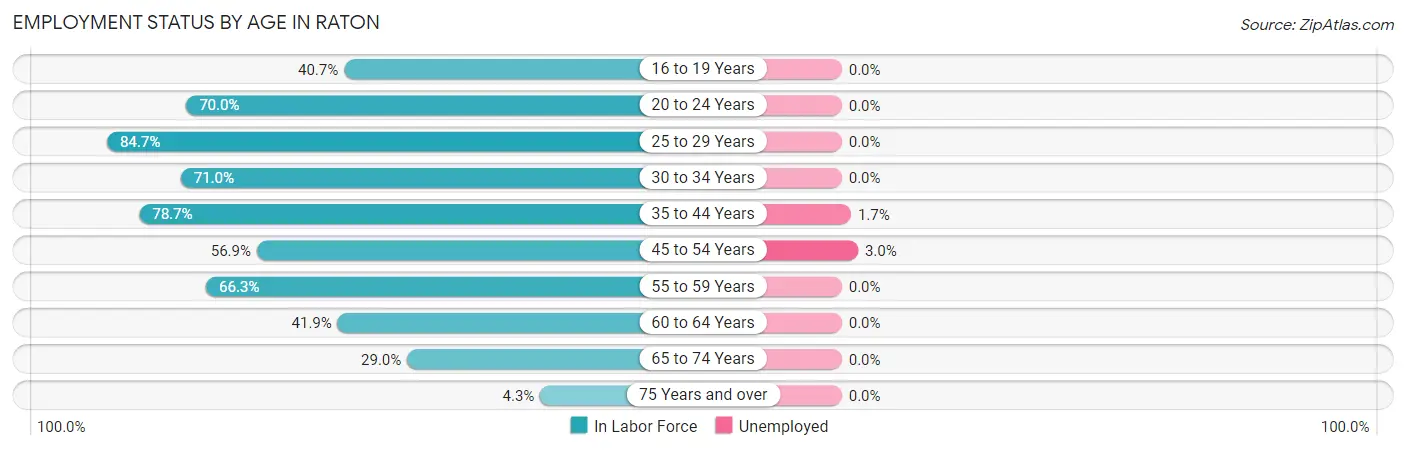
| Age Bracket | In Labor Force | Unemployed |
| 16 to 19 Years | 124 (40.7%) | 0 (0.0%) |
| 20 to 24 Years | 245 (70.0%) | 0 (0.0%) |
| 25 to 29 Years | 355 (84.7%) | 0 (0.0%) |
| 30 to 34 Years | 245 (71.0%) | 0 (0.0%) |
| 35 to 44 Years | 656 (78.7%) | 11 (1.7%) |
| 45 to 54 Years | 370 (56.9%) | 11 (3.0%) |
| 55 to 59 Years | 203 (66.3%) | 0 (0.0%) |
| 60 to 64 Years | 203 (41.9%) | 0 (0.0%) |
| 65 to 74 Years | 267 (29.0%) | 0 (0.0%) |
| 75 Years and over | 24 (4.3%) | 0 (0.0%) |
| Total | 2,694 (52.1%) | 22 (0.8%) |
Employment Status by Educational Attainment in Raton
According to labor force statistics for Raton, 66.9% of individuals (2,032) out of the total population between 25 and 64 years of age (3,038) are in the labor force, with 1.1% or 22 of them being unemployed. The group with the highest labor force participation rate are those with the educational attainment of bachelor's degree or higher, with 77.2% or 318 individuals in the labor force. Within the labor force, individuals with less than high school education have the highest percentage of unemployment, with 8.3% or 11 of them being unemployed.
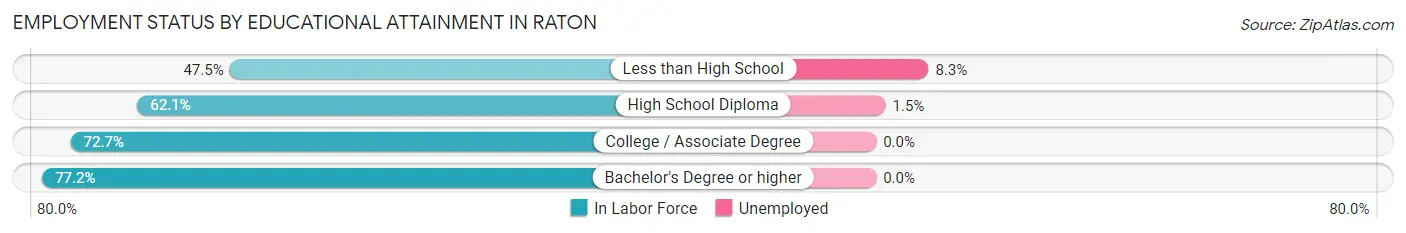
| Educational Attainment | In Labor Force | Unemployed |
| Less than High School | 133 (47.5%) | 23 (8.3%) |
| High School Diploma | 728 (62.1%) | 18 (1.5%) |
| College / Associate Degree | 853 (72.7%) | 0 (0.0%) |
| Bachelor's Degree or higher | 318 (77.2%) | 0 (0.0%) |
| Total | 2,032 (66.9%) | 33 (1.1%) |
Employment Occupations by Sex in Raton
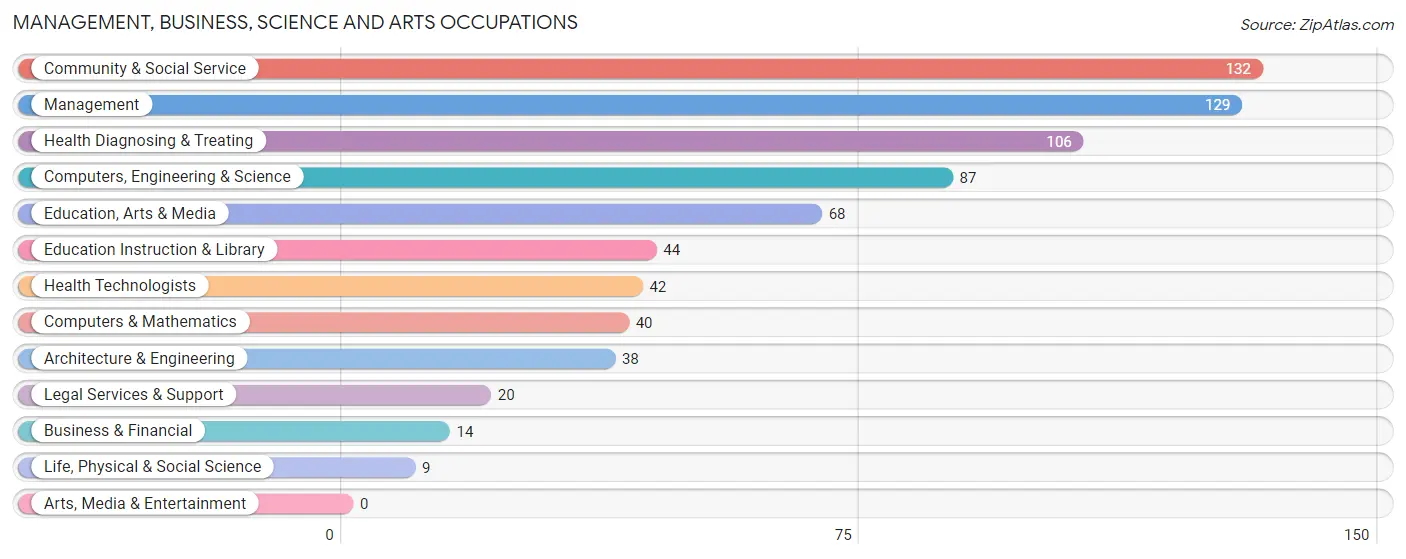
Management, Business, Science and Arts Occupations
The most common Management, Business, Science and Arts occupations in Raton are Community & Social Service (132 | 4.9%), Management (129 | 4.8%), Health Diagnosing & Treating (106 | 4.0%), Computers, Engineering & Science (87 | 3.3%), and Education, Arts & Media (68 | 2.5%).
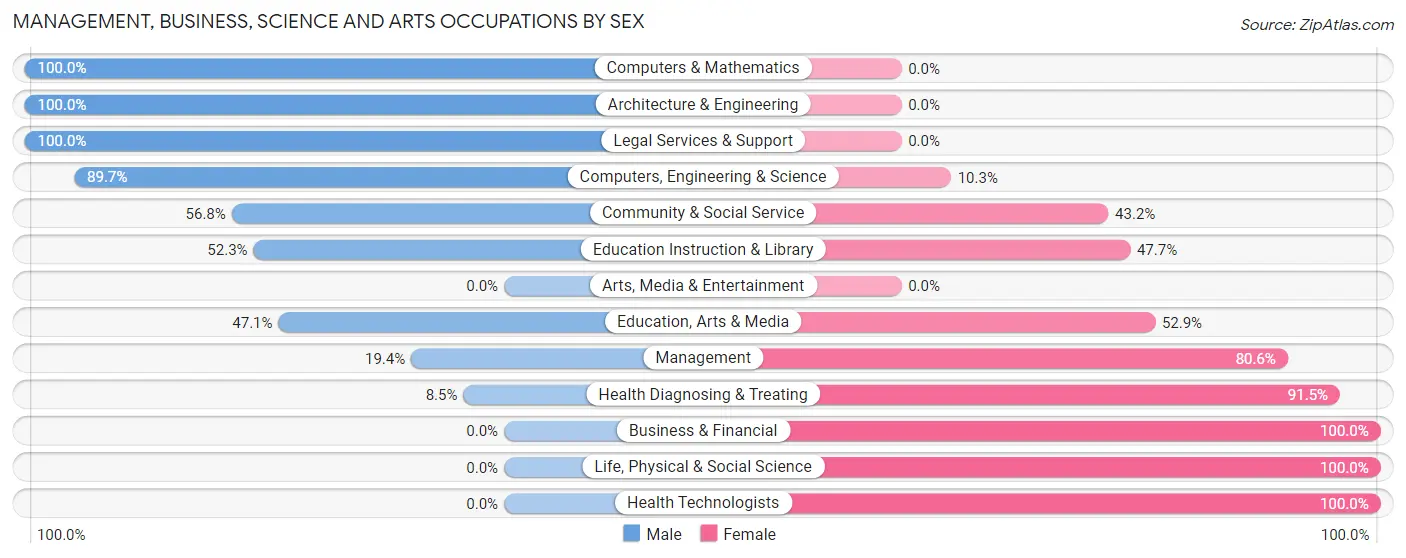
Management, Business, Science and Arts Occupations by Sex
Within the Management, Business, Science and Arts occupations in Raton, the most male-oriented occupations are Computers & Mathematics (100.0%), Architecture & Engineering (100.0%), and Legal Services & Support (100.0%), while the most female-oriented occupations are Business & Financial (100.0%), Life, Physical & Social Science (100.0%), and Health Technologists (100.0%).
| Occupation | Male | Female |
| Management | 25 (19.4%) | 104 (80.6%) |
| Business & Financial | 0 (0.0%) | 14 (100.0%) |
| Computers, Engineering & Science | 78 (89.7%) | 9 (10.3%) |
| Computers & Mathematics | 40 (100.0%) | 0 (0.0%) |
| Architecture & Engineering | 38 (100.0%) | 0 (0.0%) |
| Life, Physical & Social Science | 0 (0.0%) | 9 (100.0%) |
| Community & Social Service | 75 (56.8%) | 57 (43.2%) |
| Education, Arts & Media | 32 (47.1%) | 36 (52.9%) |
| Legal Services & Support | 20 (100.0%) | 0 (0.0%) |
| Education Instruction & Library | 23 (52.3%) | 21 (47.7%) |
| Arts, Media & Entertainment | 0 (0.0%) | 0 (0.0%) |
| Health Diagnosing & Treating | 9 (8.5%) | 97 (91.5%) |
| Health Technologists | 0 (0.0%) | 42 (100.0%) |
| Total (Category) | 187 (40.0%) | 281 (60.0%) |
| Total (Overall) | 1,324 (49.6%) | 1,346 (50.4%) |
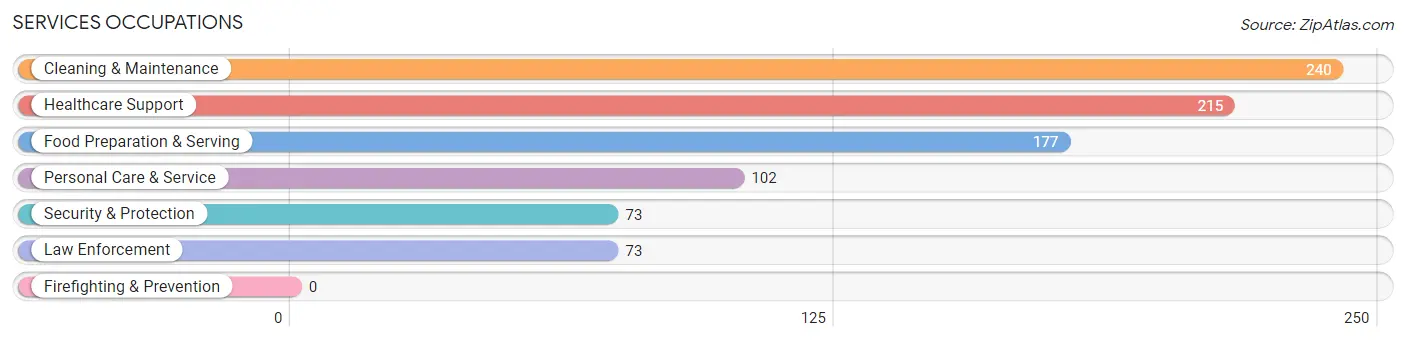
Services Occupations
The most common Services occupations in Raton are Cleaning & Maintenance (240 | 9.0%), Healthcare Support (215 | 8.1%), Food Preparation & Serving (177 | 6.6%), Personal Care & Service (102 | 3.8%), and Security & Protection (73 | 2.7%).
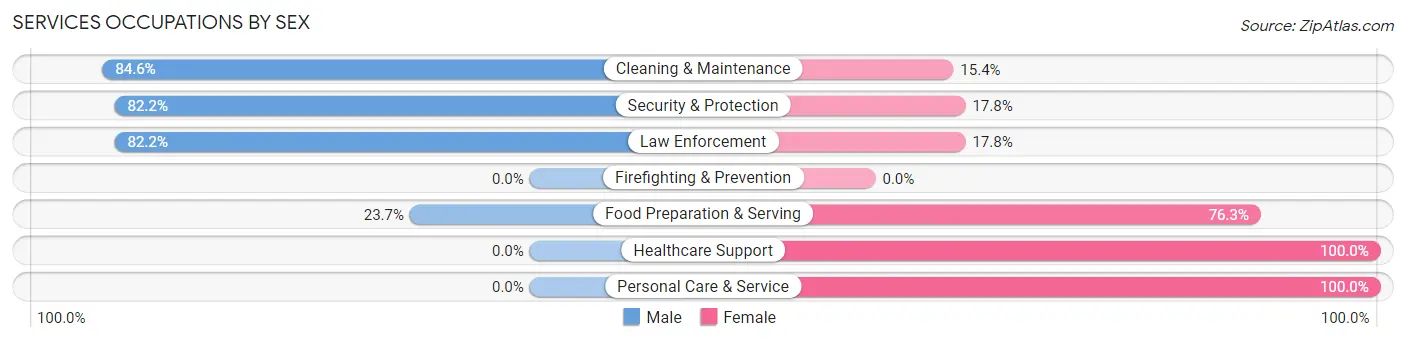
Services Occupations by Sex
Within the Services occupations in Raton, the most male-oriented occupations are Cleaning & Maintenance (84.6%), Security & Protection (82.2%), and Law Enforcement (82.2%), while the most female-oriented occupations are Healthcare Support (100.0%), Personal Care & Service (100.0%), and Food Preparation & Serving (76.3%).
| Occupation | Male | Female |
| Healthcare Support | 0 (0.0%) | 215 (100.0%) |
| Security & Protection | 60 (82.2%) | 13 (17.8%) |
| Firefighting & Prevention | 0 (0.0%) | 0 (0.0%) |
| Law Enforcement | 60 (82.2%) | 13 (17.8%) |
| Food Preparation & Serving | 42 (23.7%) | 135 (76.3%) |
| Cleaning & Maintenance | 203 (84.6%) | 37 (15.4%) |
| Personal Care & Service | 0 (0.0%) | 102 (100.0%) |
| Total (Category) | 305 (37.8%) | 502 (62.2%) |
| Total (Overall) | 1,324 (49.6%) | 1,346 (50.4%) |
Sales and Office Occupations
The most common Sales and Office occupations in Raton are Sales & Related (487 | 18.2%), and Office & Administration (186 | 7.0%).
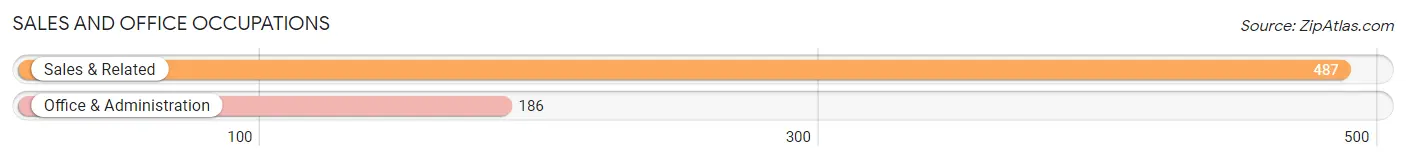
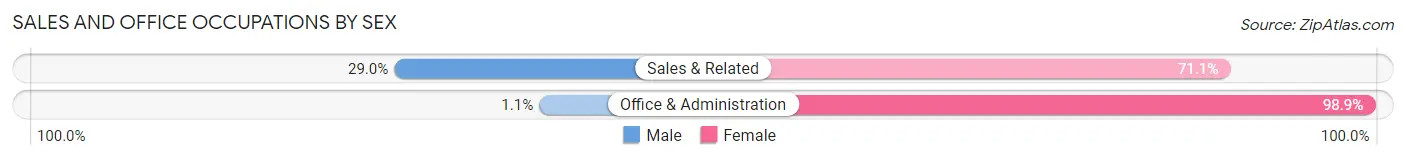
Sales and Office Occupations by Sex
| Occupation | Male | Female |
| Sales & Related | 141 (28.9%) | 346 (71.1%) |
| Office & Administration | 2 (1.1%) | 184 (98.9%) |
| Total (Category) | 143 (21.2%) | 530 (78.7%) |
| Total (Overall) | 1,324 (49.6%) | 1,346 (50.4%) |
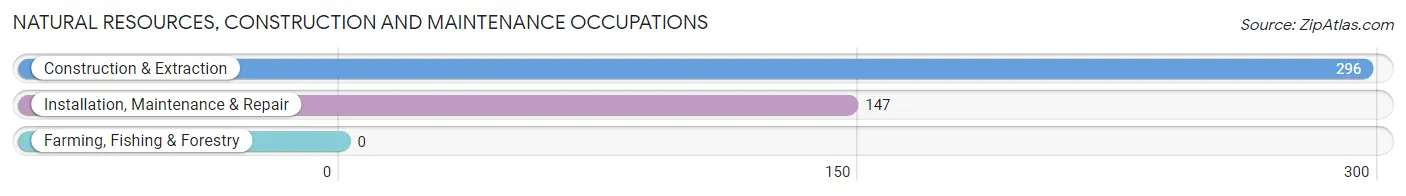
Natural Resources, Construction and Maintenance Occupations
The most common Natural Resources, Construction and Maintenance occupations in Raton are Construction & Extraction (296 | 11.1%), and Installation, Maintenance & Repair (147 | 5.5%).
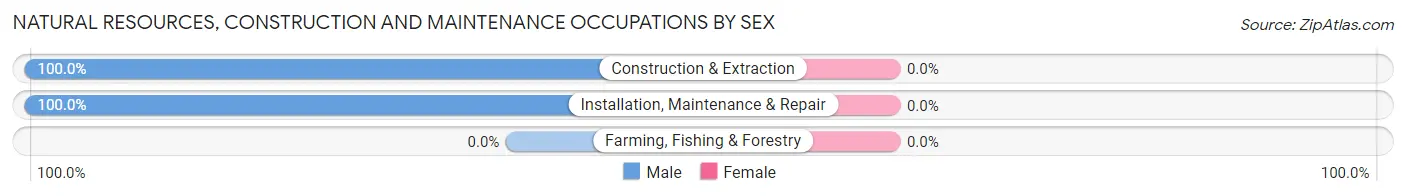
Natural Resources, Construction and Maintenance Occupations by Sex
| Occupation | Male | Female |
| Farming, Fishing & Forestry | 0 (0.0%) | 0 (0.0%) |
| Construction & Extraction | 296 (100.0%) | 0 (0.0%) |
| Installation, Maintenance & Repair | 147 (100.0%) | 0 (0.0%) |
| Total (Category) | 443 (100.0%) | 0 (0.0%) |
| Total (Overall) | 1,324 (49.6%) | 1,346 (50.4%) |
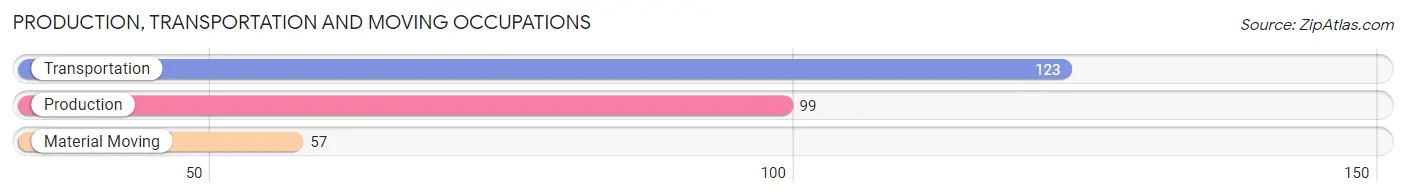
Production, Transportation and Moving Occupations
The most common Production, Transportation and Moving occupations in Raton are Transportation (123 | 4.6%), Production (99 | 3.7%), and Material Moving (57 | 2.1%).
Production, Transportation and Moving Occupations by Sex
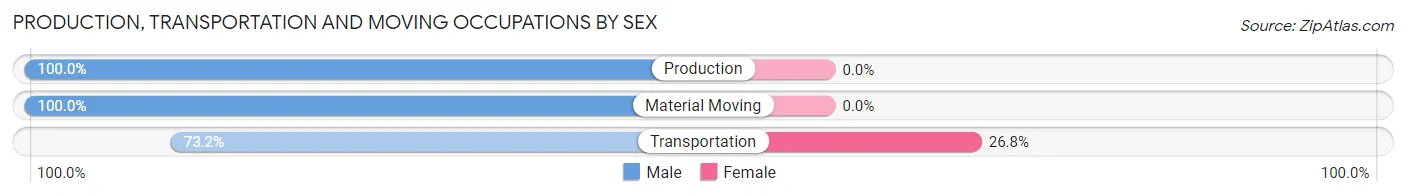
| Occupation | Male | Female |
| Production | 99 (100.0%) | 0 (0.0%) |
| Transportation | 90 (73.2%) | 33 (26.8%) |
| Material Moving | 57 (100.0%) | 0 (0.0%) |
| Total (Category) | 246 (88.2%) | 33 (11.8%) |
| Total (Overall) | 1,324 (49.6%) | 1,346 (50.4%) |
Employment Industries by Sex in Raton
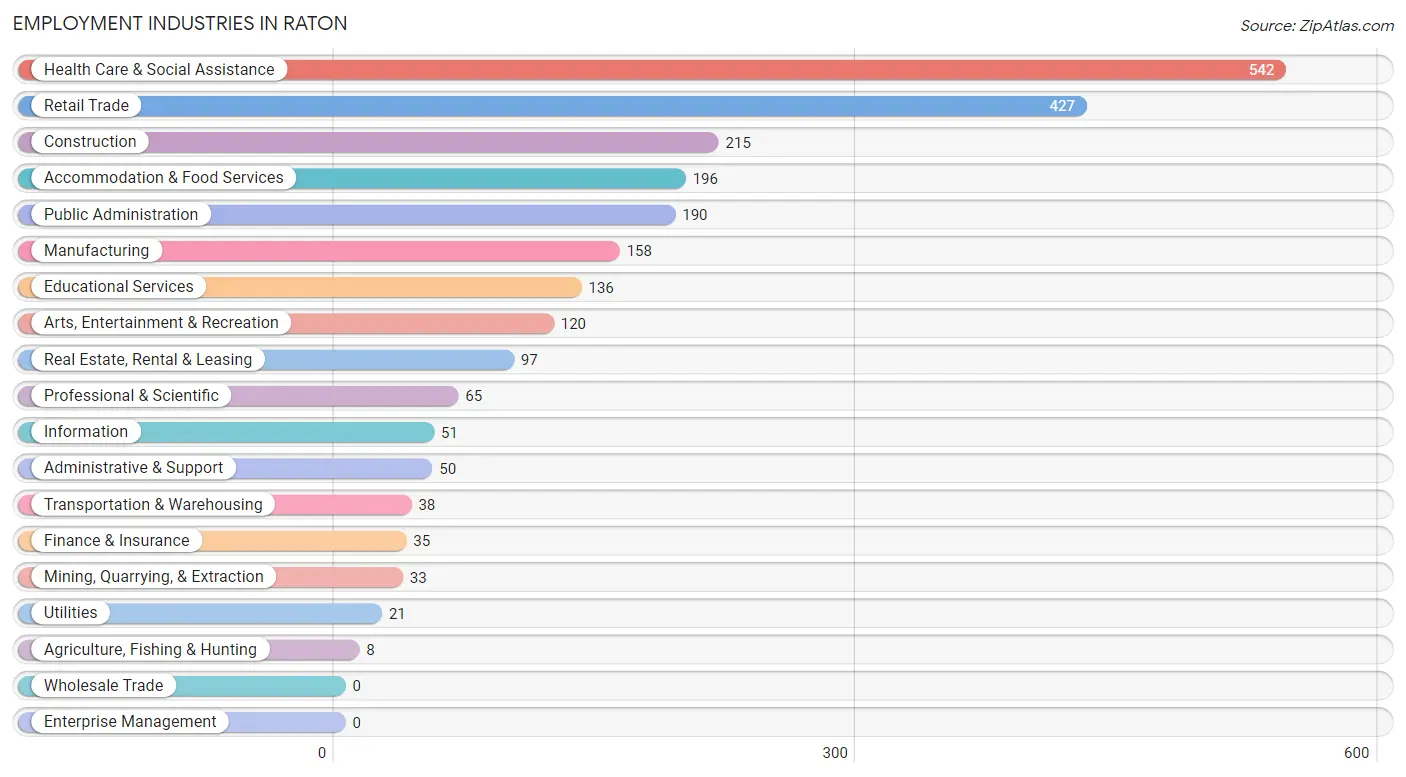
Employment Industries in Raton
The major employment industries in Raton include Health Care & Social Assistance (542 | 20.3%), Retail Trade (427 | 16.0%), Construction (215 | 8.1%), Accommodation & Food Services (196 | 7.3%), and Public Administration (190 | 7.1%).
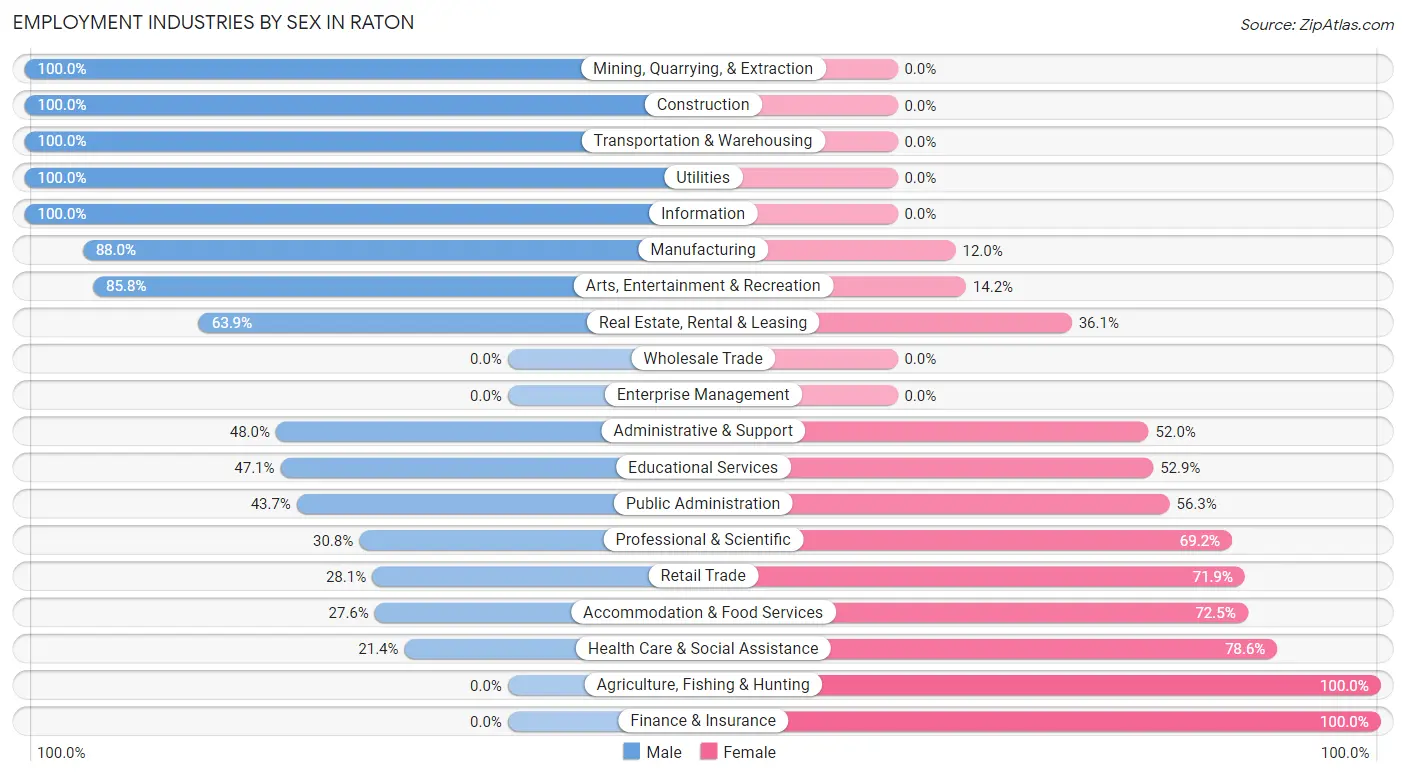
Employment Industries by Sex in Raton
The Raton industries that see more men than women are Mining, Quarrying, & Extraction (100.0%), Construction (100.0%), and Transportation & Warehousing (100.0%), whereas the industries that tend to have a higher number of women are Agriculture, Fishing & Hunting (100.0%), Finance & Insurance (100.0%), and Health Care & Social Assistance (78.6%).
| Industry | Male | Female |
| Agriculture, Fishing & Hunting | 0 (0.0%) | 8 (100.0%) |
| Mining, Quarrying, & Extraction | 33 (100.0%) | 0 (0.0%) |
| Construction | 215 (100.0%) | 0 (0.0%) |
| Manufacturing | 139 (88.0%) | 19 (12.0%) |
| Wholesale Trade | 0 (0.0%) | 0 (0.0%) |
| Retail Trade | 120 (28.1%) | 307 (71.9%) |
| Transportation & Warehousing | 38 (100.0%) | 0 (0.0%) |
| Utilities | 21 (100.0%) | 0 (0.0%) |
| Information | 51 (100.0%) | 0 (0.0%) |
| Finance & Insurance | 0 (0.0%) | 35 (100.0%) |
| Real Estate, Rental & Leasing | 62 (63.9%) | 35 (36.1%) |
| Professional & Scientific | 20 (30.8%) | 45 (69.2%) |
| Enterprise Management | 0 (0.0%) | 0 (0.0%) |
| Administrative & Support | 24 (48.0%) | 26 (52.0%) |
| Educational Services | 64 (47.1%) | 72 (52.9%) |
| Health Care & Social Assistance | 116 (21.4%) | 426 (78.6%) |
| Arts, Entertainment & Recreation | 103 (85.8%) | 17 (14.2%) |
| Accommodation & Food Services | 54 (27.6%) | 142 (72.5%) |
| Public Administration | 83 (43.7%) | 107 (56.3%) |
| Total | 1,324 (49.6%) | 1,346 (50.4%) |
Education in Raton
School Enrollment in Raton
The most common levels of schooling among the 1,011 students in Raton are college / undergraduate (290 | 28.7%), elementary school (221 | 21.9%), and high school (214 | 21.2%).
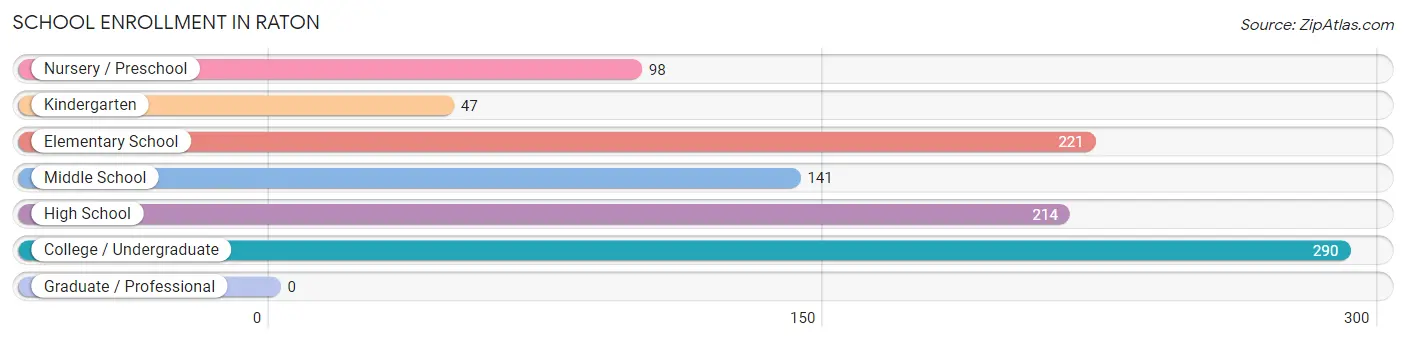
| School Level | # Students | % Students |
| Nursery / Preschool | 98 | 9.7% |
| Kindergarten | 47 | 4.6% |
| Elementary School | 221 | 21.9% |
| Middle School | 141 | 14.0% |
| High School | 214 | 21.2% |
| College / Undergraduate | 290 | 28.7% |
| Graduate / Professional | 0 | 0.0% |
| Total | 1,011 | 100.0% |
School Enrollment by Age by Funding Source in Raton
Out of a total of 1,011 students who are enrolled in schools in Raton, 227 (22.5%) attend a private institution, while the remaining 784 (77.5%) are enrolled in public schools. The age group of 20 to 24 year olds has the highest likelihood of being enrolled in private schools, with 40 (43.5% in the age bracket) enrolled. Conversely, the age group of 15 to 17 year olds has the lowest likelihood of being enrolled in a private school, with 155 (99.4% in the age bracket) attending a public institution.
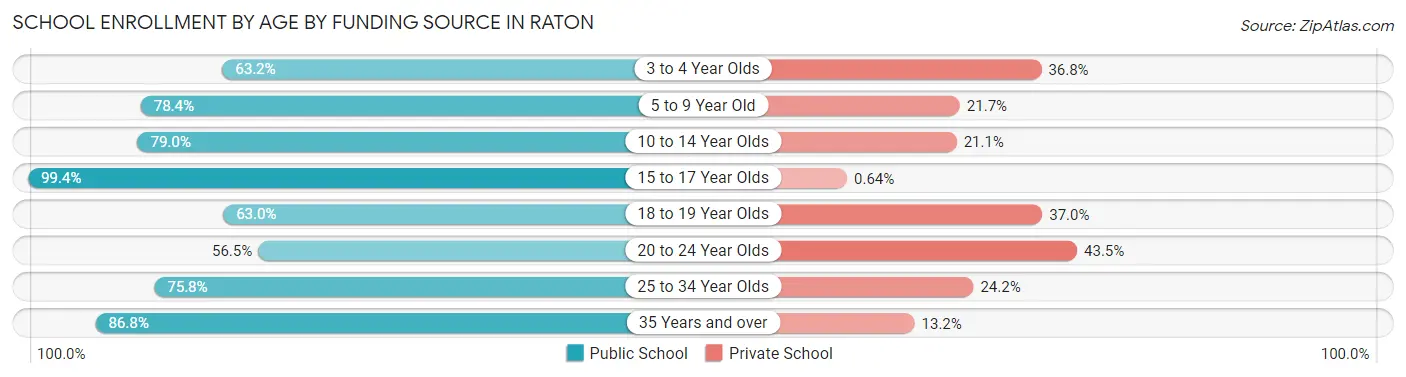
| Age Bracket | Public School | Private School |
| 3 to 4 Year Olds | 36 (63.2%) | 21 (36.8%) |
| 5 to 9 Year Old | 228 (78.3%) | 63 (21.6%) |
| 10 to 14 Year Olds | 135 (78.9%) | 36 (21.0%) |
| 15 to 17 Year Olds | 155 (99.4%) | 1 (0.6%) |
| 18 to 19 Year Olds | 63 (63.0%) | 37 (37.0%) |
| 20 to 24 Year Olds | 52 (56.5%) | 40 (43.5%) |
| 25 to 34 Year Olds | 69 (75.8%) | 22 (24.2%) |
| 35 Years and over | 46 (86.8%) | 7 (13.2%) |
| Total | 784 (77.5%) | 227 (22.5%) |
Educational Attainment by Field of Study in Raton
Education (201 | 26.5%), social sciences (107 | 14.1%), science & technology (74 | 9.8%), arts & humanities (65 | 8.6%), and psychology (51 | 6.7%) are the most common fields of study among 759 individuals in Raton who have obtained a bachelor's degree or higher.
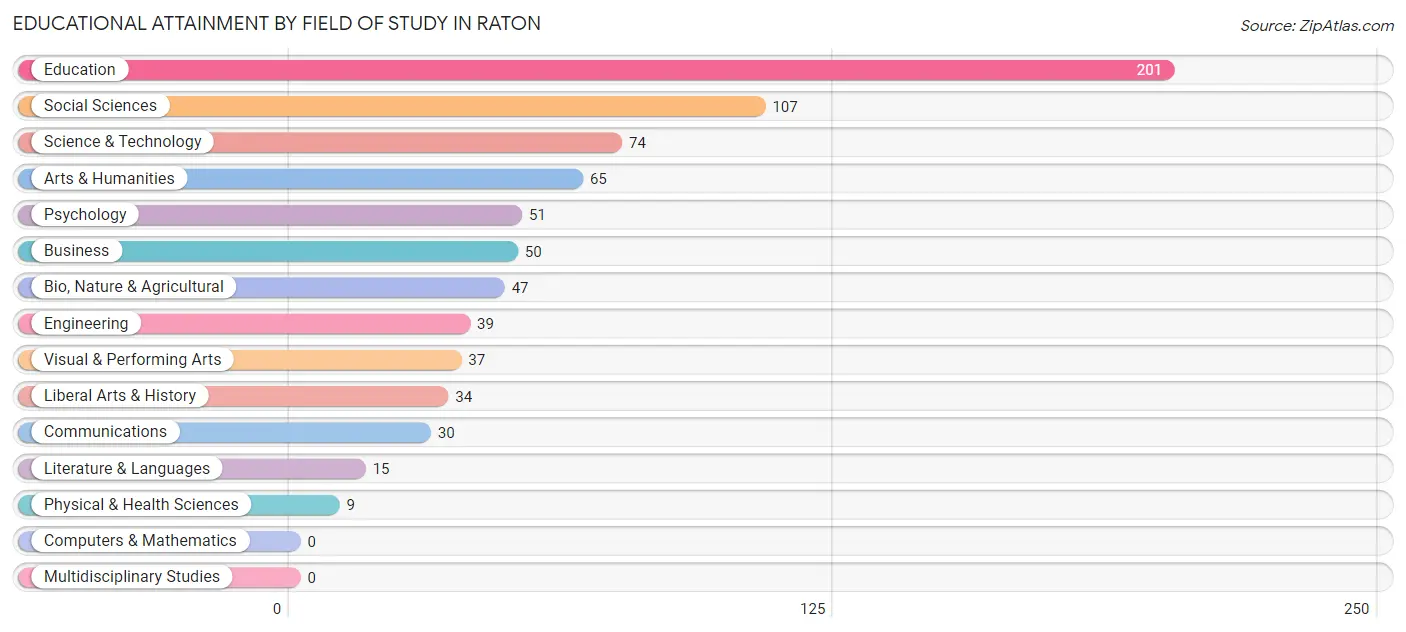
| Field of Study | # Graduates | % Graduates |
| Computers & Mathematics | 0 | 0.0% |
| Bio, Nature & Agricultural | 47 | 6.2% |
| Physical & Health Sciences | 9 | 1.2% |
| Psychology | 51 | 6.7% |
| Social Sciences | 107 | 14.1% |
| Engineering | 39 | 5.1% |
| Multidisciplinary Studies | 0 | 0.0% |
| Science & Technology | 74 | 9.8% |
| Business | 50 | 6.6% |
| Education | 201 | 26.5% |
| Literature & Languages | 15 | 2.0% |
| Liberal Arts & History | 34 | 4.5% |
| Visual & Performing Arts | 37 | 4.9% |
| Communications | 30 | 4.0% |
| Arts & Humanities | 65 | 8.6% |
| Total | 759 | 100.0% |
Transportation & Commute in Raton
Vehicle Availability by Sex in Raton
The most prevalent vehicle ownership categories in Raton are males with 2 vehicles (429, accounting for 32.7%) and females with 2 vehicles (316, making up 35.6%).
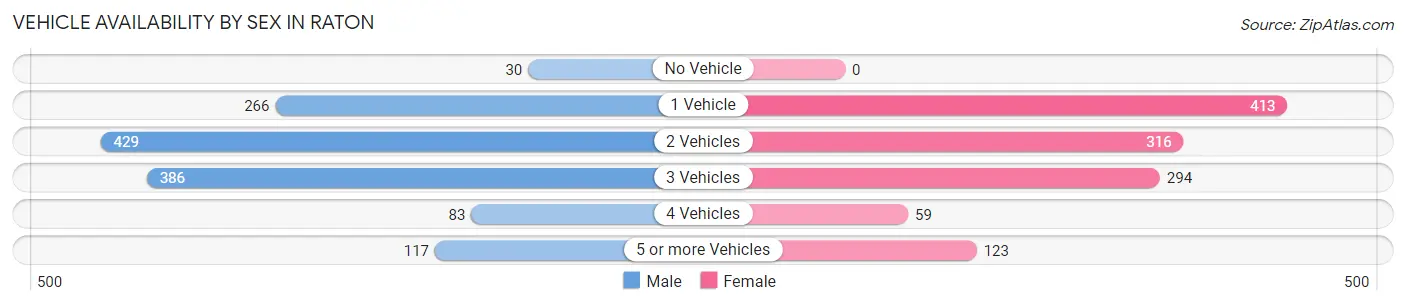
| Vehicles Available | Male | Female |
| No Vehicle | 30 (2.3%) | 0 (0.0%) |
| 1 Vehicle | 266 (20.3%) | 413 (34.3%) |
| 2 Vehicles | 429 (32.7%) | 316 (26.2%) |
| 3 Vehicles | 386 (29.4%) | 294 (24.4%) |
| 4 Vehicles | 83 (6.3%) | 59 (4.9%) |
| 5 or more Vehicles | 117 (8.9%) | 123 (10.2%) |
| Total | 1,311 (100.0%) | 1,205 (100.0%) |
Commute Time in Raton
The most frequently occuring commute durations in Raton are 5 to 9 minutes (1,097 commuters, 44.0%), 10 to 14 minutes (406 commuters, 16.3%), and less than 5 minutes (268 commuters, 10.7%).
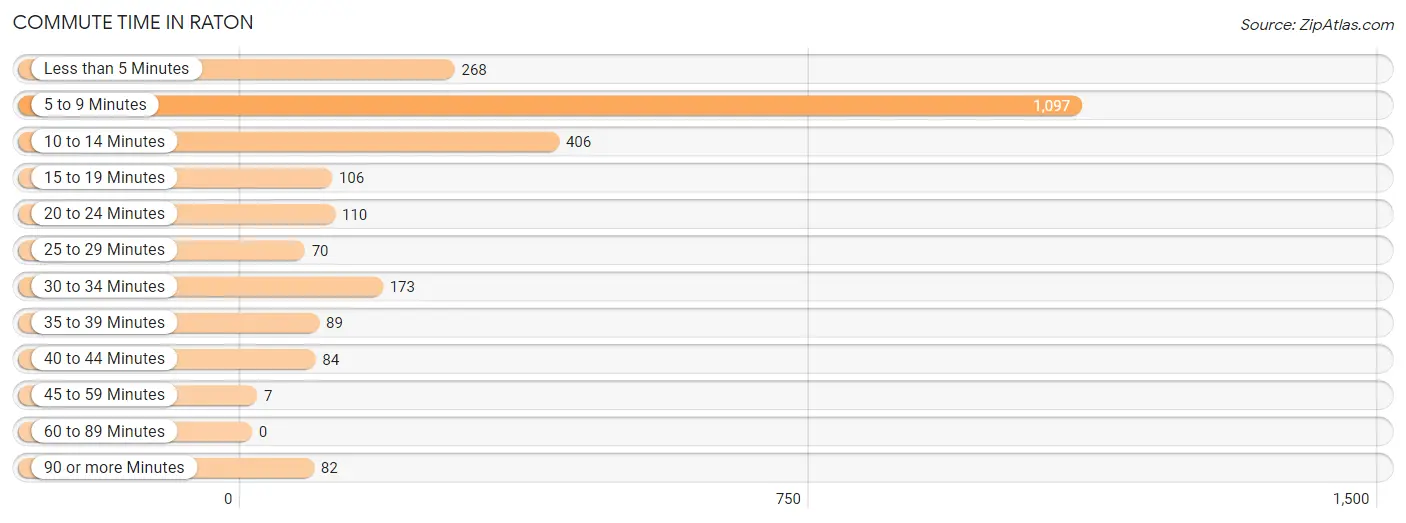
| Commute Time | # Commuters | % Commuters |
| Less than 5 Minutes | 268 | 10.7% |
| 5 to 9 Minutes | 1,097 | 44.0% |
| 10 to 14 Minutes | 406 | 16.3% |
| 15 to 19 Minutes | 106 | 4.3% |
| 20 to 24 Minutes | 110 | 4.4% |
| 25 to 29 Minutes | 70 | 2.8% |
| 30 to 34 Minutes | 173 | 6.9% |
| 35 to 39 Minutes | 89 | 3.6% |
| 40 to 44 Minutes | 84 | 3.4% |
| 45 to 59 Minutes | 7 | 0.3% |
| 60 to 89 Minutes | 0 | 0.0% |
| 90 or more Minutes | 82 | 3.3% |
Commute Time by Sex in Raton
The most common commute times in Raton are 5 to 9 minutes (431 commuters, 32.9%) for males and 5 to 9 minutes (666 commuters, 56.4%) for females.
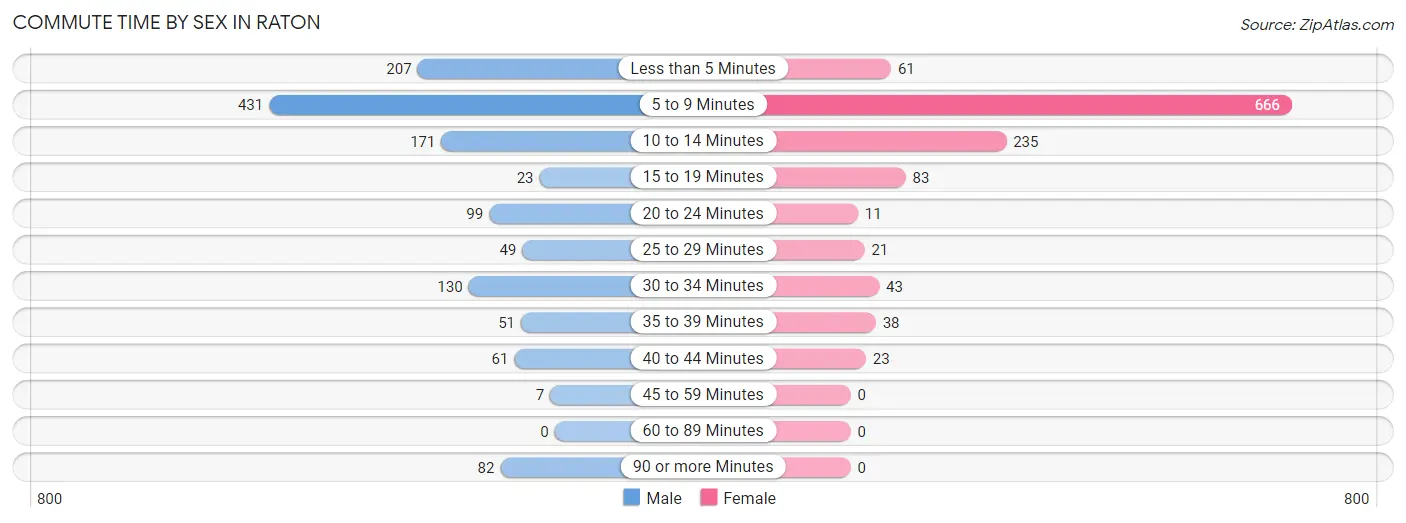
| Commute Time | Male | Female |
| Less than 5 Minutes | 207 (15.8%) | 61 (5.2%) |
| 5 to 9 Minutes | 431 (32.9%) | 666 (56.4%) |
| 10 to 14 Minutes | 171 (13.0%) | 235 (19.9%) |
| 15 to 19 Minutes | 23 (1.8%) | 83 (7.0%) |
| 20 to 24 Minutes | 99 (7.5%) | 11 (0.9%) |
| 25 to 29 Minutes | 49 (3.7%) | 21 (1.8%) |
| 30 to 34 Minutes | 130 (9.9%) | 43 (3.6%) |
| 35 to 39 Minutes | 51 (3.9%) | 38 (3.2%) |
| 40 to 44 Minutes | 61 (4.6%) | 23 (1.9%) |
| 45 to 59 Minutes | 7 (0.5%) | 0 (0.0%) |
| 60 to 89 Minutes | 0 (0.0%) | 0 (0.0%) |
| 90 or more Minutes | 82 (6.2%) | 0 (0.0%) |
Time of Departure to Work by Sex in Raton
The most frequent times of departure to work in Raton are 6:30 AM to 6:59 AM (252, 19.2%) for males and 7:30 AM to 7:59 AM (229, 19.4%) for females.
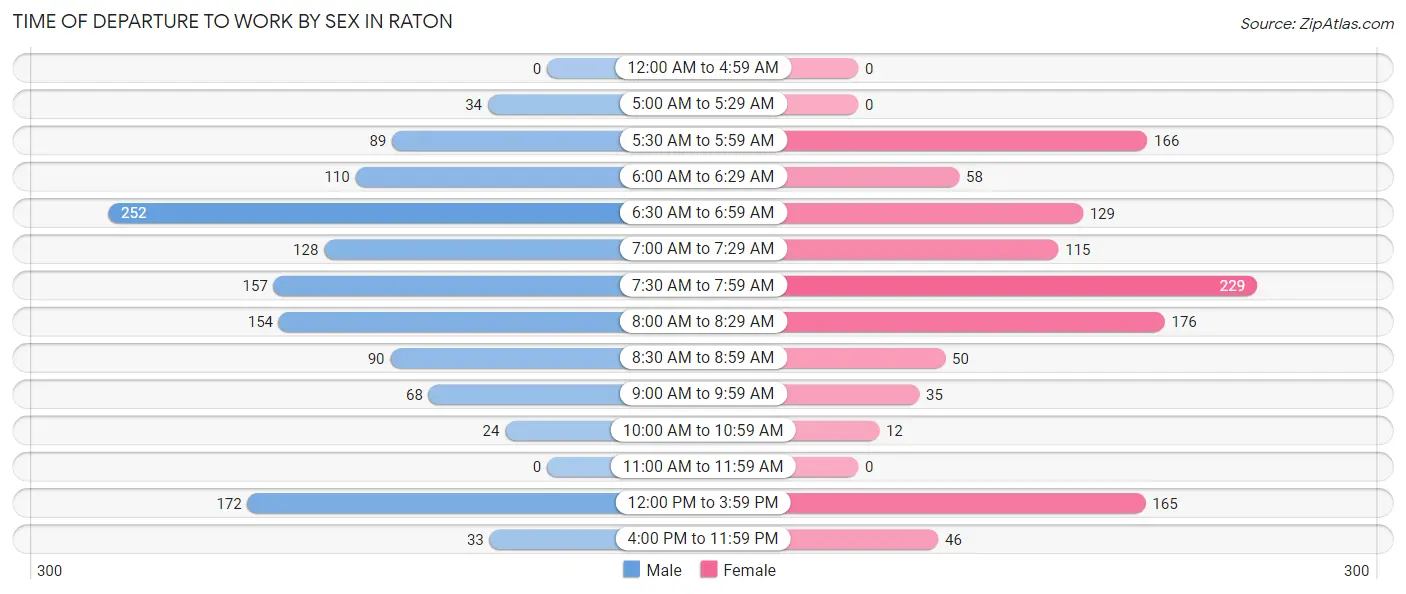
| Time of Departure | Male | Female |
| 12:00 AM to 4:59 AM | 0 (0.0%) | 0 (0.0%) |
| 5:00 AM to 5:29 AM | 34 (2.6%) | 0 (0.0%) |
| 5:30 AM to 5:59 AM | 89 (6.8%) | 166 (14.1%) |
| 6:00 AM to 6:29 AM | 110 (8.4%) | 58 (4.9%) |
| 6:30 AM to 6:59 AM | 252 (19.2%) | 129 (10.9%) |
| 7:00 AM to 7:29 AM | 128 (9.8%) | 115 (9.7%) |
| 7:30 AM to 7:59 AM | 157 (12.0%) | 229 (19.4%) |
| 8:00 AM to 8:29 AM | 154 (11.7%) | 176 (14.9%) |
| 8:30 AM to 8:59 AM | 90 (6.9%) | 50 (4.2%) |
| 9:00 AM to 9:59 AM | 68 (5.2%) | 35 (3.0%) |
| 10:00 AM to 10:59 AM | 24 (1.8%) | 12 (1.0%) |
| 11:00 AM to 11:59 AM | 0 (0.0%) | 0 (0.0%) |
| 12:00 PM to 3:59 PM | 172 (13.1%) | 165 (14.0%) |
| 4:00 PM to 11:59 PM | 33 (2.5%) | 46 (3.9%) |
| Total | 1,311 (100.0%) | 1,181 (100.0%) |
Housing Occupancy in Raton
Occupancy by Ownership in Raton
Of the total 2,843 dwellings in Raton, owner-occupied units account for 1,952 (68.7%), while renter-occupied units make up 891 (31.3%).
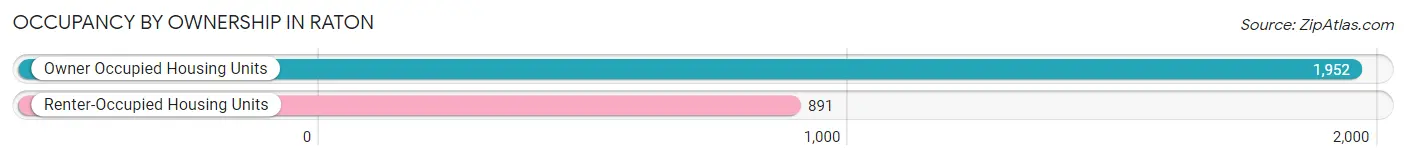
| Occupancy | # Housing Units | % Housing Units |
| Owner Occupied Housing Units | 1,952 | 68.7% |
| Renter-Occupied Housing Units | 891 | 31.3% |
| Total Occupied Housing Units | 2,843 | 100.0% |
Occupancy by Household Size in Raton
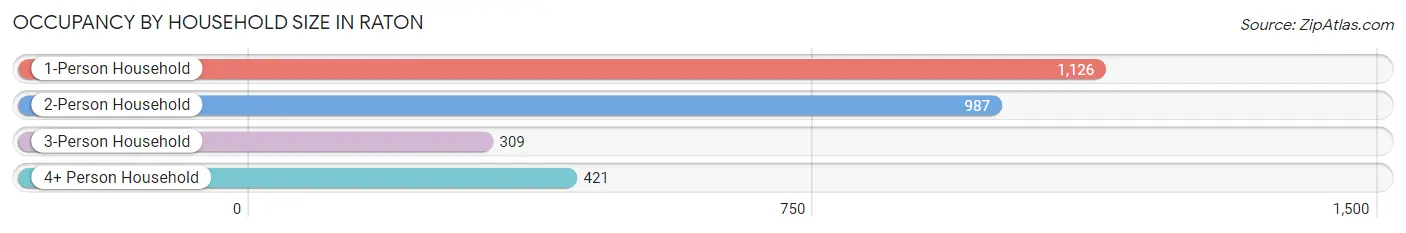
| Household Size | # Housing Units | % Housing Units |
| 1-Person Household | 1,126 | 39.6% |
| 2-Person Household | 987 | 34.7% |
| 3-Person Household | 309 | 10.9% |
| 4+ Person Household | 421 | 14.8% |
| Total Housing Units | 2,843 | 100.0% |
Occupancy by Ownership by Household Size in Raton
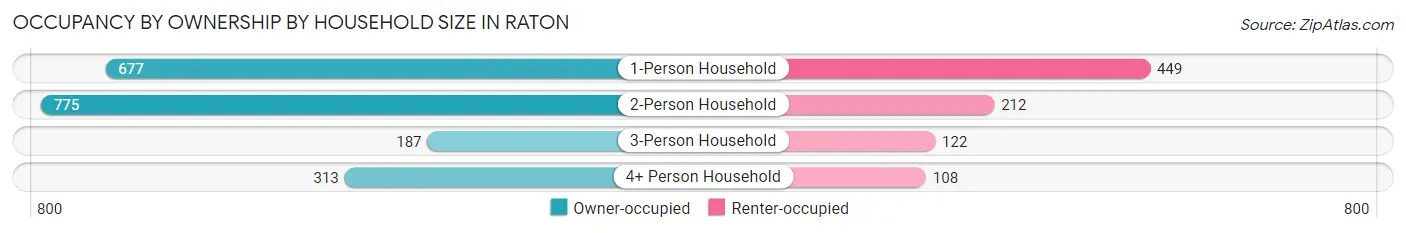
| Household Size | Owner-occupied | Renter-occupied |
| 1-Person Household | 677 (60.1%) | 449 (39.9%) |
| 2-Person Household | 775 (78.5%) | 212 (21.5%) |
| 3-Person Household | 187 (60.5%) | 122 (39.5%) |
| 4+ Person Household | 313 (74.4%) | 108 (25.7%) |
| Total Housing Units | 1,952 (68.7%) | 891 (31.3%) |
Occupancy by Educational Attainment in Raton
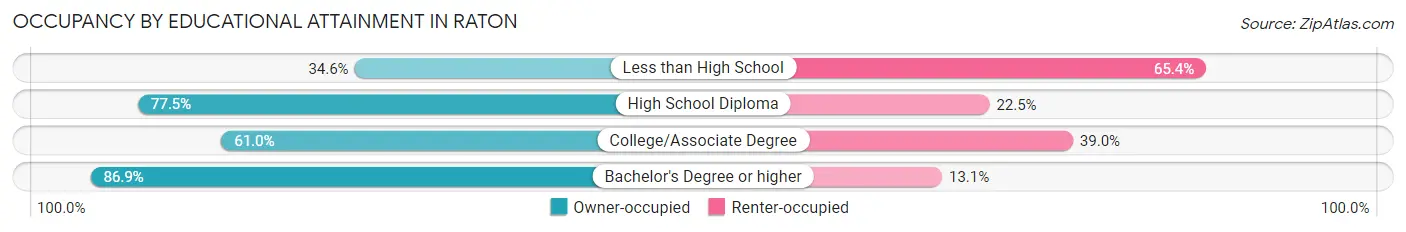
| Household Size | Owner-occupied | Renter-occupied |
| Less than High School | 100 (34.6%) | 189 (65.4%) |
| High School Diploma | 839 (77.5%) | 243 (22.5%) |
| College/Associate Degree | 627 (61.0%) | 401 (39.0%) |
| Bachelor's Degree or higher | 386 (86.9%) | 58 (13.1%) |
Occupancy by Age of Householder in Raton
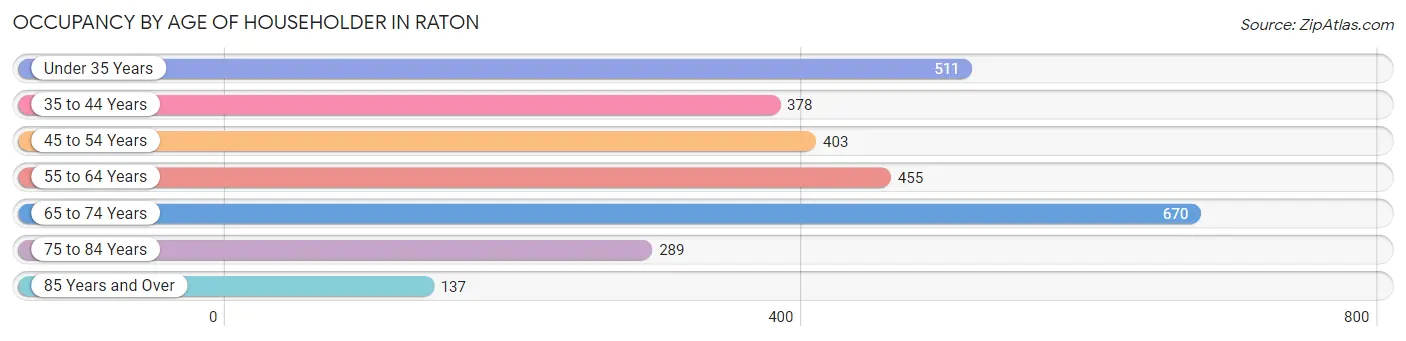
| Age Bracket | # Households | % Households |
| Under 35 Years | 511 | 18.0% |
| 35 to 44 Years | 378 | 13.3% |
| 45 to 54 Years | 403 | 14.2% |
| 55 to 64 Years | 455 | 16.0% |
| 65 to 74 Years | 670 | 23.6% |
| 75 to 84 Years | 289 | 10.2% |
| 85 Years and Over | 137 | 4.8% |
| Total | 2,843 | 100.0% |
Housing Finances in Raton
Median Income by Occupancy in Raton
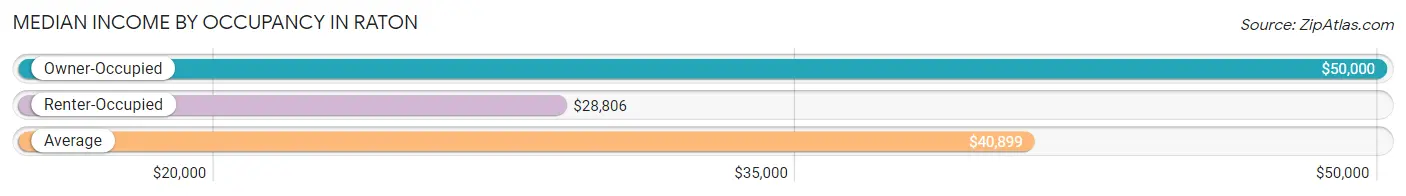
| Occupancy Type | # Households | Median Income |
| Owner-Occupied | 1,952 (68.7%) | $50,000 |
| Renter-Occupied | 891 (31.3%) | $28,806 |
| Average | 2,843 (100.0%) | $40,899 |
Occupancy by Householder Income Bracket in Raton
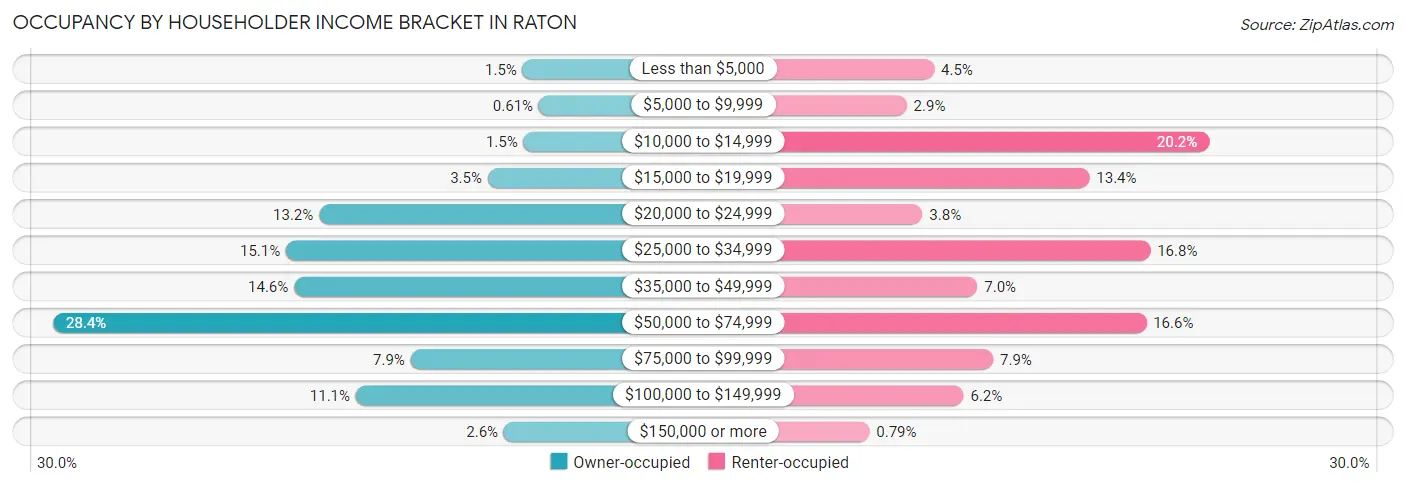
| Income Bracket | Owner-occupied | Renter-occupied |
| Less than $5,000 | 30 (1.5%) | 40 (4.5%) |
| $5,000 to $9,999 | 12 (0.6%) | 26 (2.9%) |
| $10,000 to $14,999 | 29 (1.5%) | 180 (20.2%) |
| $15,000 to $19,999 | 69 (3.5%) | 119 (13.4%) |
| $20,000 to $24,999 | 257 (13.2%) | 34 (3.8%) |
| $25,000 to $34,999 | 294 (15.1%) | 150 (16.8%) |
| $35,000 to $49,999 | 285 (14.6%) | 62 (7.0%) |
| $50,000 to $74,999 | 554 (28.4%) | 148 (16.6%) |
| $75,000 to $99,999 | 155 (7.9%) | 70 (7.9%) |
| $100,000 to $149,999 | 216 (11.1%) | 55 (6.2%) |
| $150,000 or more | 51 (2.6%) | 7 (0.8%) |
| Total | 1,952 (100.0%) | 891 (100.0%) |
Monthly Housing Cost Tiers in Raton
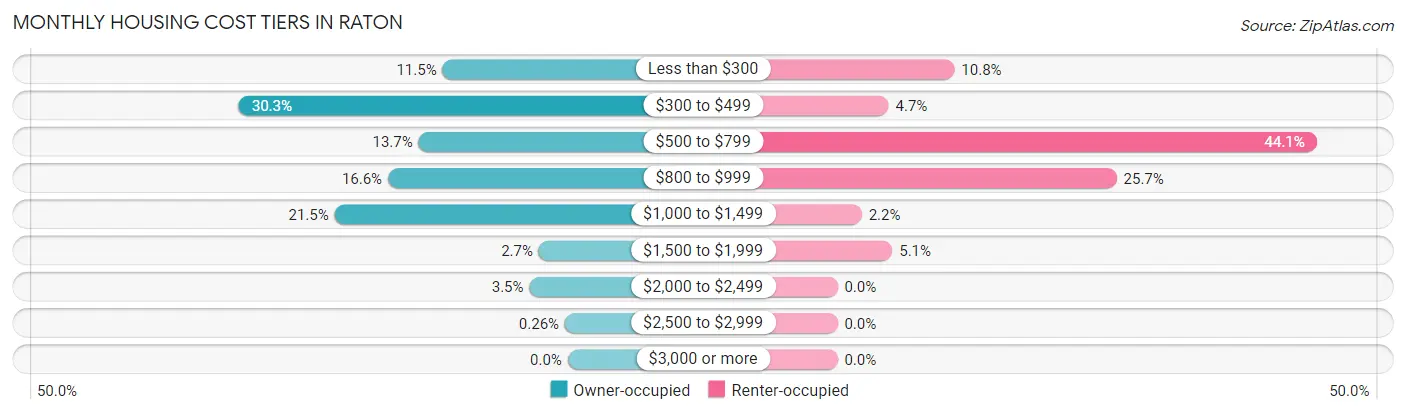
| Monthly Cost | Owner-occupied | Renter-occupied |
| Less than $300 | 225 (11.5%) | 96 (10.8%) |
| $300 to $499 | 591 (30.3%) | 42 (4.7%) |
| $500 to $799 | 268 (13.7%) | 393 (44.1%) |
| $800 to $999 | 323 (16.6%) | 229 (25.7%) |
| $1,000 to $1,499 | 419 (21.5%) | 20 (2.2%) |
| $1,500 to $1,999 | 52 (2.7%) | 45 (5.1%) |
| $2,000 to $2,499 | 69 (3.5%) | 0 (0.0%) |
| $2,500 to $2,999 | 5 (0.3%) | 0 (0.0%) |
| $3,000 or more | 0 (0.0%) | 0 (0.0%) |
| Total | 1,952 (100.0%) | 891 (100.0%) |
Physical Housing Characteristics in Raton
Housing Structures in Raton
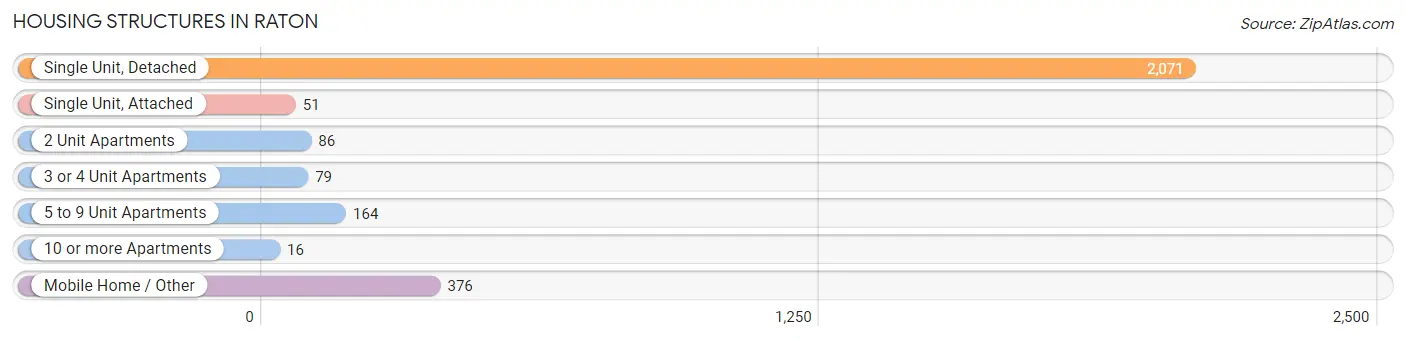
| Structure Type | # Housing Units | % Housing Units |
| Single Unit, Detached | 2,071 | 72.9% |
| Single Unit, Attached | 51 | 1.8% |
| 2 Unit Apartments | 86 | 3.0% |
| 3 or 4 Unit Apartments | 79 | 2.8% |
| 5 to 9 Unit Apartments | 164 | 5.8% |
| 10 or more Apartments | 16 | 0.6% |
| Mobile Home / Other | 376 | 13.2% |
| Total | 2,843 | 100.0% |
Housing Structures by Occupancy in Raton
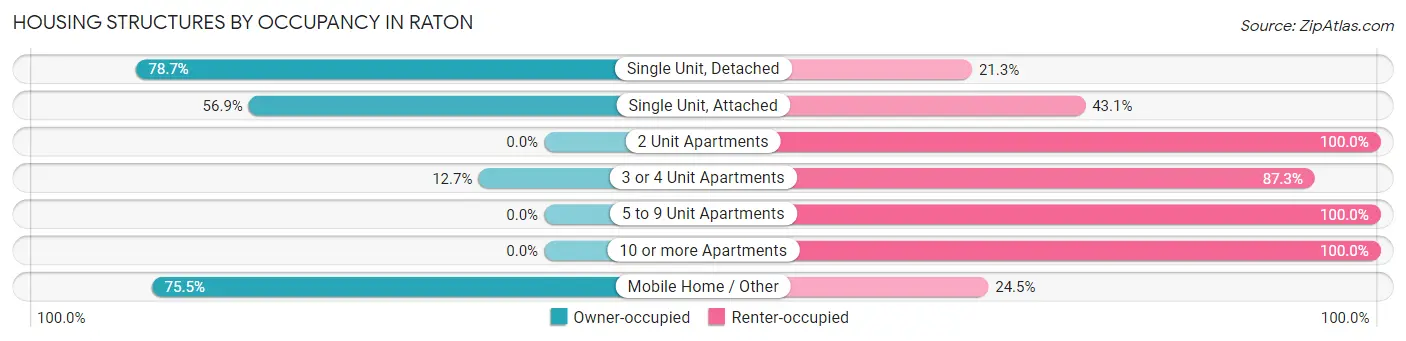
| Structure Type | Owner-occupied | Renter-occupied |
| Single Unit, Detached | 1,629 (78.7%) | 442 (21.3%) |
| Single Unit, Attached | 29 (56.9%) | 22 (43.1%) |
| 2 Unit Apartments | 0 (0.0%) | 86 (100.0%) |
| 3 or 4 Unit Apartments | 10 (12.7%) | 69 (87.3%) |
| 5 to 9 Unit Apartments | 0 (0.0%) | 164 (100.0%) |
| 10 or more Apartments | 0 (0.0%) | 16 (100.0%) |
| Mobile Home / Other | 284 (75.5%) | 92 (24.5%) |
| Total | 1,952 (68.7%) | 891 (31.3%) |
Housing Structures by Number of Rooms in Raton
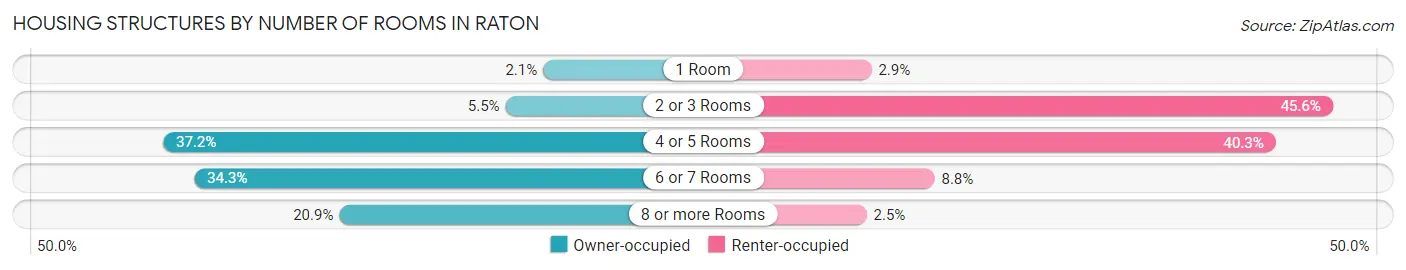
| Number of Rooms | Owner-occupied | Renter-occupied |
| 1 Room | 40 (2.1%) | 26 (2.9%) |
| 2 or 3 Rooms | 108 (5.5%) | 406 (45.6%) |
| 4 or 5 Rooms | 726 (37.2%) | 359 (40.3%) |
| 6 or 7 Rooms | 670 (34.3%) | 78 (8.7%) |
| 8 or more Rooms | 408 (20.9%) | 22 (2.5%) |
| Total | 1,952 (100.0%) | 891 (100.0%) |
Housing Structure by Heating Type in Raton
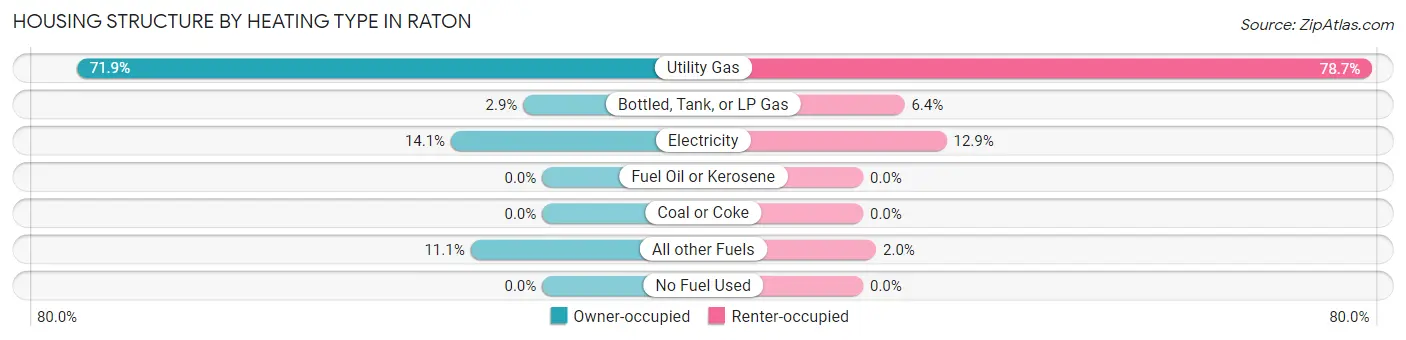
| Heating Type | Owner-occupied | Renter-occupied |
| Utility Gas | 1,404 (71.9%) | 701 (78.7%) |
| Bottled, Tank, or LP Gas | 57 (2.9%) | 57 (6.4%) |
| Electricity | 275 (14.1%) | 115 (12.9%) |
| Fuel Oil or Kerosene | 0 (0.0%) | 0 (0.0%) |
| Coal or Coke | 0 (0.0%) | 0 (0.0%) |
| All other Fuels | 216 (11.1%) | 18 (2.0%) |
| No Fuel Used | 0 (0.0%) | 0 (0.0%) |
| Total | 1,952 (100.0%) | 891 (100.0%) |
Household Vehicle Usage in Raton
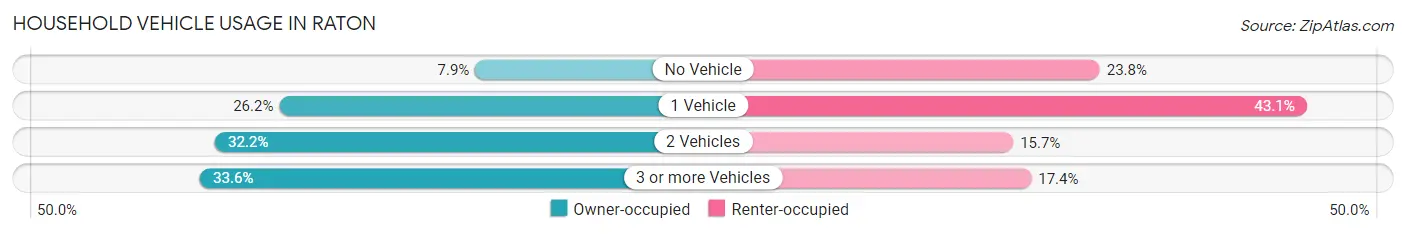
| Vehicles per Household | Owner-occupied | Renter-occupied |
| No Vehicle | 155 (7.9%) | 212 (23.8%) |
| 1 Vehicle | 512 (26.2%) | 384 (43.1%) |
| 2 Vehicles | 629 (32.2%) | 140 (15.7%) |
| 3 or more Vehicles | 656 (33.6%) | 155 (17.4%) |
| Total | 1,952 (100.0%) | 891 (100.0%) |
Real Estate & Mortgages in Raton
Real Estate and Mortgage Overview in Raton
| Characteristic | Without Mortgage | With Mortgage |
| Housing Units | 1,007 | 945 |
| Median Property Value | $112,200 | $123,600 |
| Median Household Income | $51,265 | $12 |
| Monthly Housing Costs | $383 | $0 |
| Real Estate Taxes | $600 | $0 |
Property Value by Mortgage Status in Raton
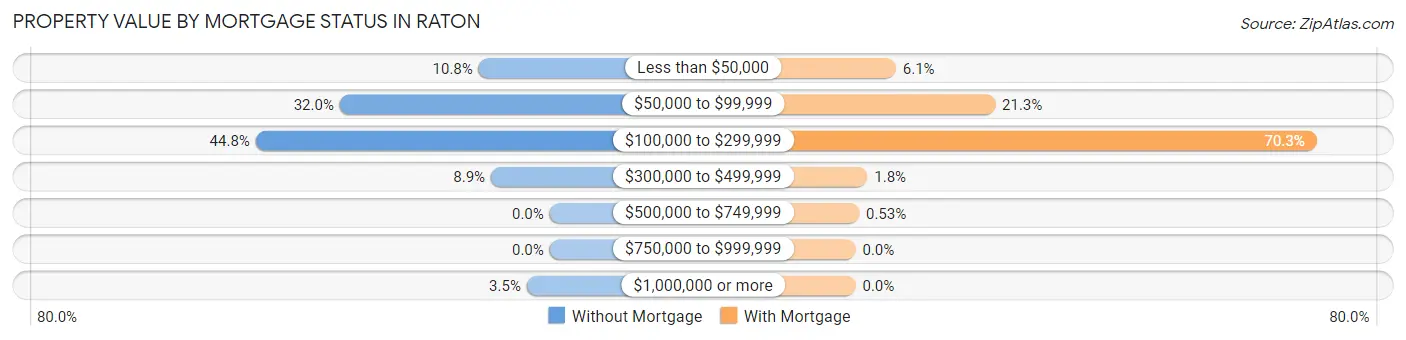
| Property Value | Without Mortgage | With Mortgage |
| Less than $50,000 | 109 (10.8%) | 58 (6.1%) |
| $50,000 to $99,999 | 322 (32.0%) | 201 (21.3%) |
| $100,000 to $299,999 | 451 (44.8%) | 664 (70.3%) |
| $300,000 to $499,999 | 90 (8.9%) | 17 (1.8%) |
| $500,000 to $749,999 | 0 (0.0%) | 5 (0.5%) |
| $750,000 to $999,999 | 0 (0.0%) | 0 (0.0%) |
| $1,000,000 or more | 35 (3.5%) | 0 (0.0%) |
| Total | 1,007 (100.0%) | 945 (100.0%) |
Household Income by Mortgage Status in Raton
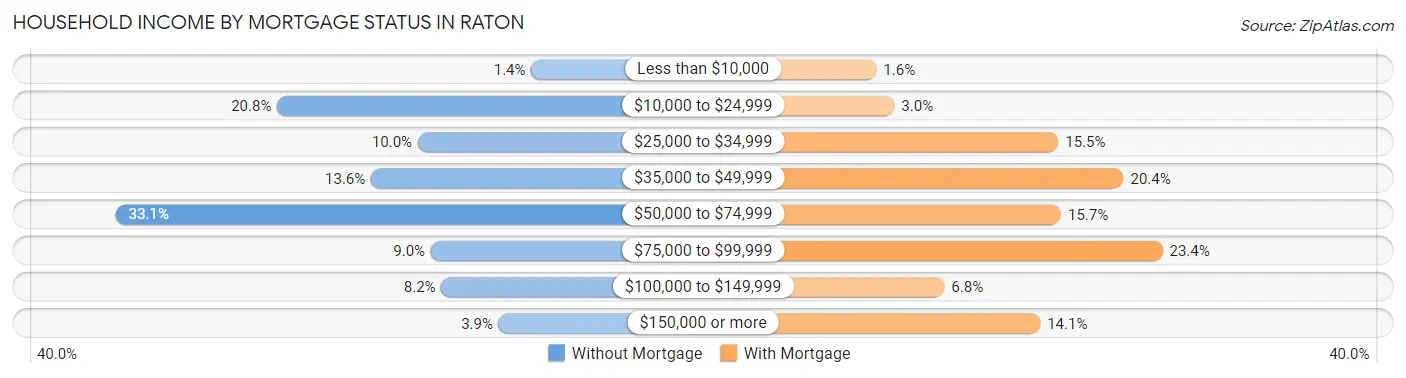
| Household Income | Without Mortgage | With Mortgage |
| Less than $10,000 | 14 (1.4%) | 15 (1.6%) |
| $10,000 to $24,999 | 209 (20.7%) | 28 (3.0%) |
| $25,000 to $34,999 | 101 (10.0%) | 146 (15.4%) |
| $35,000 to $49,999 | 137 (13.6%) | 193 (20.4%) |
| $50,000 to $74,999 | 333 (33.1%) | 148 (15.7%) |
| $75,000 to $99,999 | 91 (9.0%) | 221 (23.4%) |
| $100,000 to $149,999 | 83 (8.2%) | 64 (6.8%) |
| $150,000 or more | 39 (3.9%) | 133 (14.1%) |
| Total | 1,007 (100.0%) | 945 (100.0%) |
Property Value to Household Income Ratio in Raton
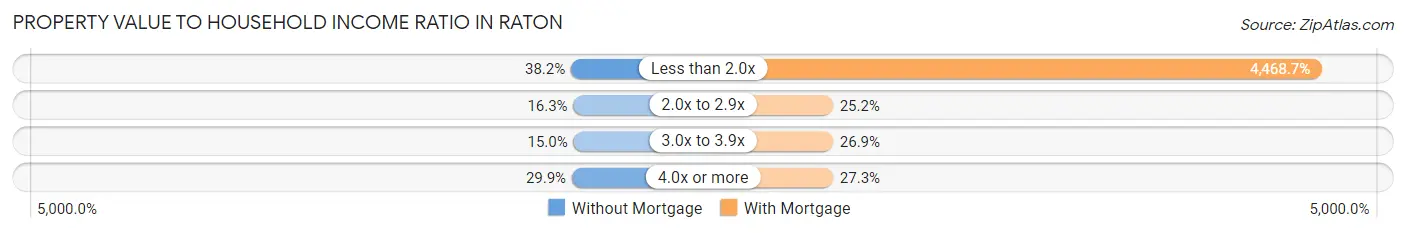
| Value-to-Income Ratio | Without Mortgage | With Mortgage |
| Less than 2.0x | 385 (38.2%) | 42,229 (4,468.7%) |
| 2.0x to 2.9x | 164 (16.3%) | 238 (25.2%) |
| 3.0x to 3.9x | 151 (15.0%) | 254 (26.9%) |
| 4.0x or more | 301 (29.9%) | 258 (27.3%) |
| Total | 1,007 (100.0%) | 945 (100.0%) |
Real Estate Taxes by Mortgage Status in Raton
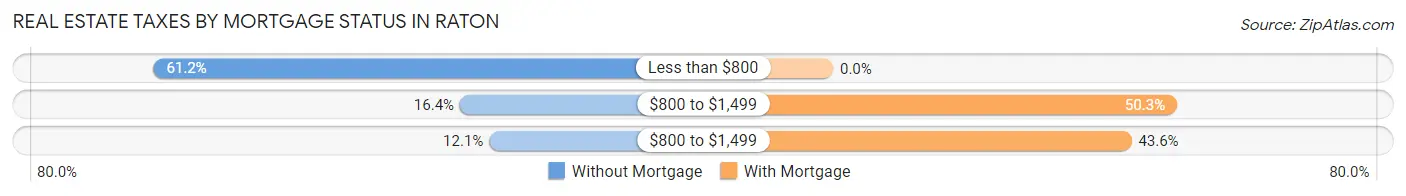
| Property Taxes | Without Mortgage | With Mortgage |
| Less than $800 | 616 (61.2%) | 0 (0.0%) |
| $800 to $1,499 | 165 (16.4%) | 475 (50.3%) |
| $800 to $1,499 | 122 (12.1%) | 412 (43.6%) |
| Total | 1,007 (100.0%) | 945 (100.0%) |
Health & Disability in Raton
Health Insurance Coverage by Age in Raton
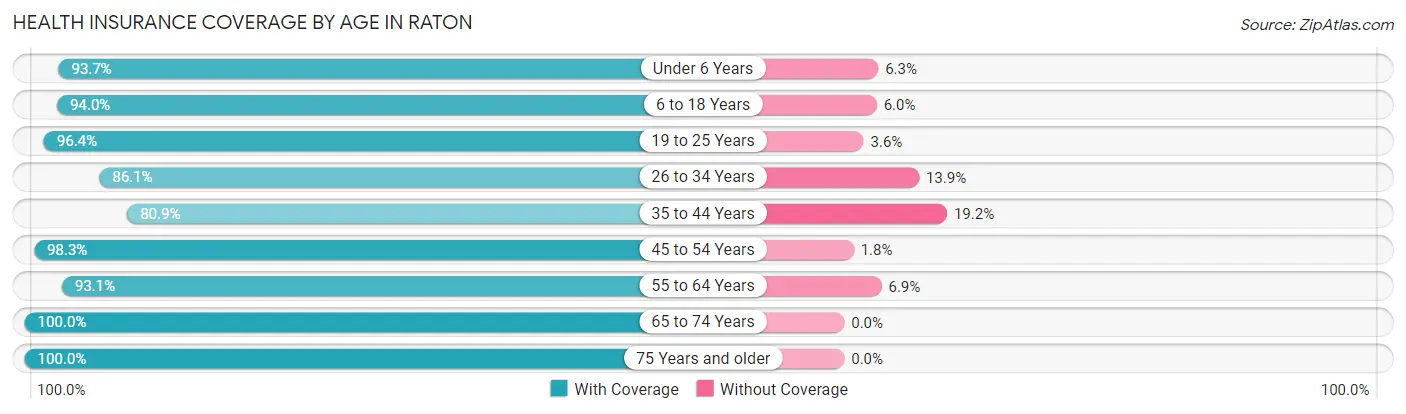
| Age Bracket | With Coverage | Without Coverage |
| Under 6 Years | 400 (93.7%) | 27 (6.3%) |
| 6 to 18 Years | 638 (94.0%) | 41 (6.0%) |
| 19 to 25 Years | 482 (96.4%) | 18 (3.6%) |
| 26 to 34 Years | 519 (86.1%) | 84 (13.9%) |
| 35 to 44 Years | 663 (80.8%) | 157 (19.2%) |
| 45 to 54 Years | 617 (98.3%) | 11 (1.8%) |
| 55 to 64 Years | 724 (93.1%) | 54 (6.9%) |
| 65 to 74 Years | 916 (100.0%) | 0 (0.0%) |
| 75 Years and older | 503 (100.0%) | 0 (0.0%) |
| Total | 5,462 (93.3%) | 392 (6.7%) |
Health Insurance Coverage by Citizenship Status in Raton
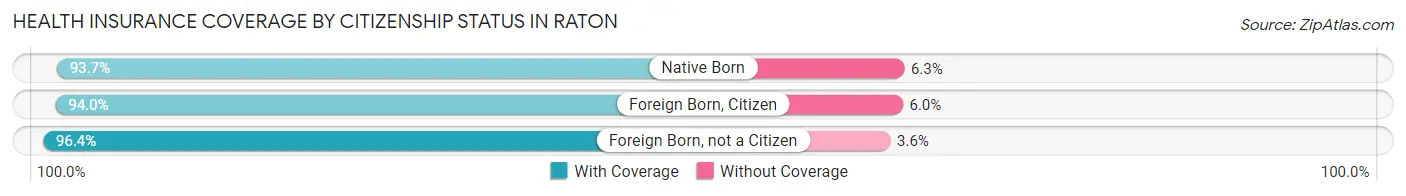
| Citizenship Status | With Coverage | Without Coverage |
| Native Born | 400 (93.7%) | 27 (6.3%) |
| Foreign Born, Citizen | 638 (94.0%) | 41 (6.0%) |
| Foreign Born, not a Citizen | 482 (96.4%) | 18 (3.6%) |
Health Insurance Coverage by Household Income in Raton
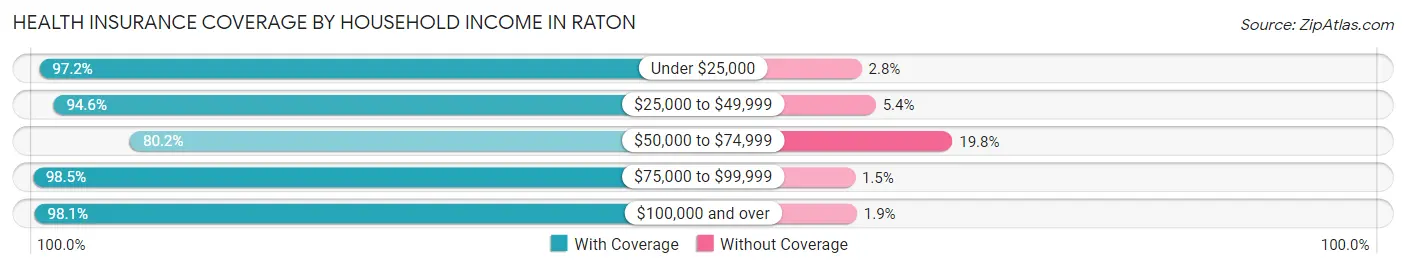
| Household Income | With Coverage | Without Coverage |
| Under $25,000 | 1,400 (97.2%) | 40 (2.8%) |
| $25,000 to $49,999 | 1,500 (94.6%) | 86 (5.4%) |
| $50,000 to $74,999 | 966 (80.2%) | 238 (19.8%) |
| $75,000 to $99,999 | 708 (98.5%) | 11 (1.5%) |
| $100,000 and over | 888 (98.1%) | 17 (1.9%) |
Public vs Private Health Insurance Coverage by Age in Raton
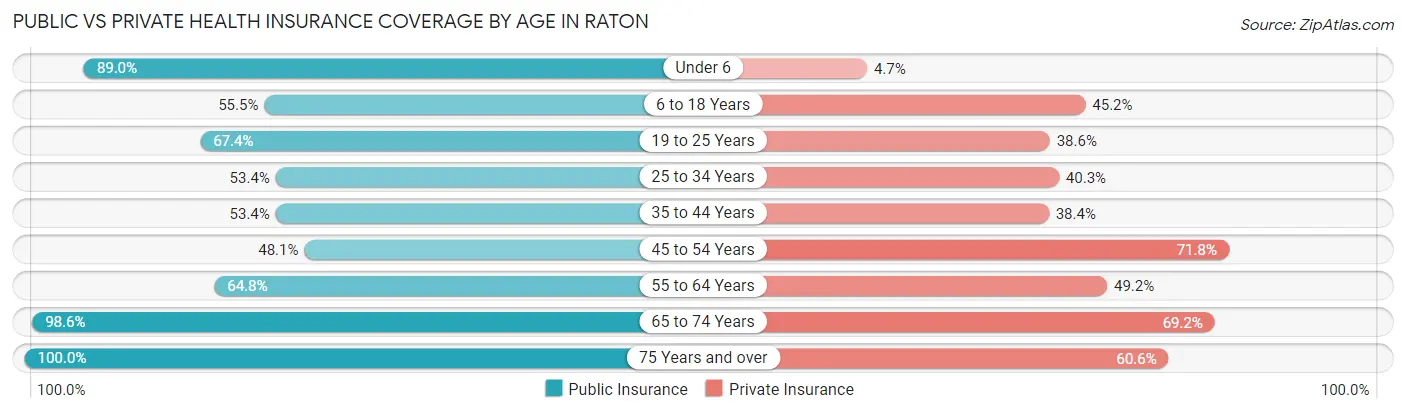
| Age Bracket | Public Insurance | Private Insurance |
| Under 6 | 380 (89.0%) | 20 (4.7%) |
| 6 to 18 Years | 377 (55.5%) | 307 (45.2%) |
| 19 to 25 Years | 337 (67.4%) | 193 (38.6%) |
| 25 to 34 Years | 322 (53.4%) | 243 (40.3%) |
| 35 to 44 Years | 438 (53.4%) | 315 (38.4%) |
| 45 to 54 Years | 302 (48.1%) | 451 (71.8%) |
| 55 to 64 Years | 504 (64.8%) | 383 (49.2%) |
| 65 to 74 Years | 903 (98.6%) | 634 (69.2%) |
| 75 Years and over | 503 (100.0%) | 305 (60.6%) |
| Total | 4,066 (69.5%) | 2,851 (48.7%) |
Disability Status by Sex by Age in Raton
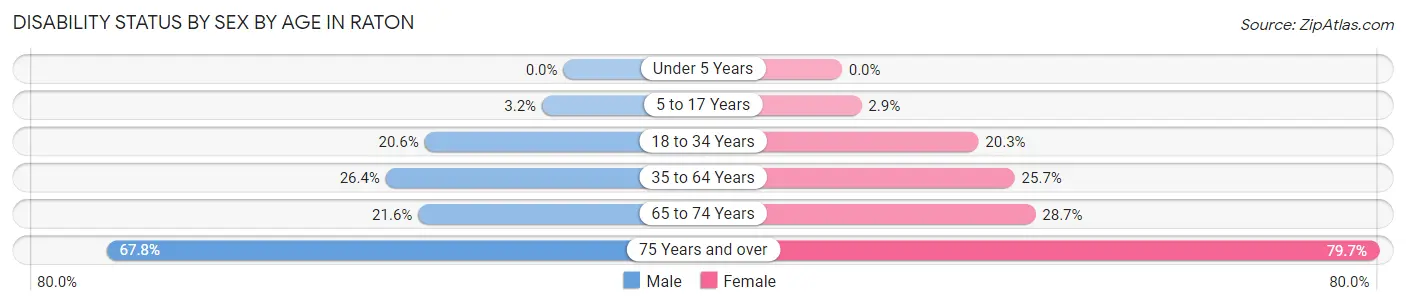
| Age Bracket | Male | Female |
| Under 5 Years | 0 (0.0%) | 0 (0.0%) |
| 5 to 17 Years | 10 (3.2%) | 13 (2.9%) |
| 18 to 34 Years | 129 (20.6%) | 112 (20.3%) |
| 35 to 64 Years | 281 (26.4%) | 298 (25.7%) |
| 65 to 74 Years | 91 (21.6%) | 142 (28.7%) |
| 75 Years and over | 137 (67.8%) | 240 (79.7%) |
Disability Class by Sex by Age in Raton
Disability Class: Hearing Difficulty
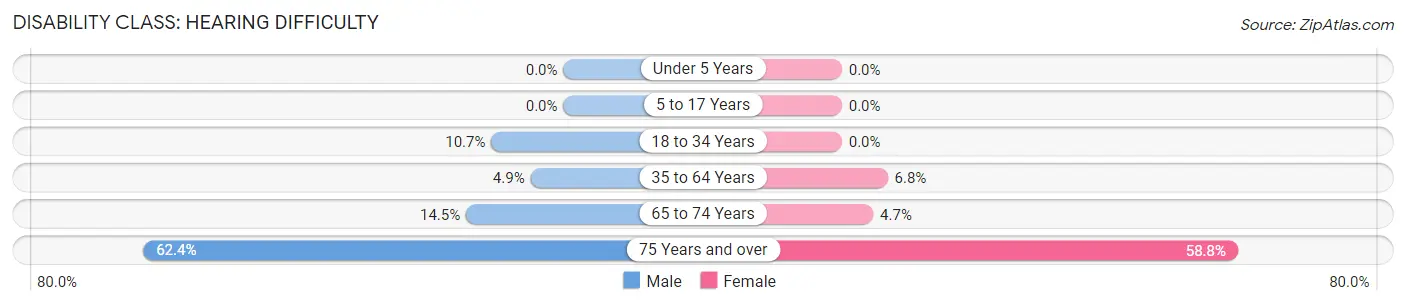
| Age Bracket | Male | Female |
| Under 5 Years | 0 (0.0%) | 0 (0.0%) |
| 5 to 17 Years | 0 (0.0%) | 0 (0.0%) |
| 18 to 34 Years | 67 (10.7%) | 0 (0.0%) |
| 35 to 64 Years | 52 (4.9%) | 79 (6.8%) |
| 65 to 74 Years | 61 (14.4%) | 23 (4.7%) |
| 75 Years and over | 126 (62.4%) | 177 (58.8%) |
Disability Class: Vision Difficulty
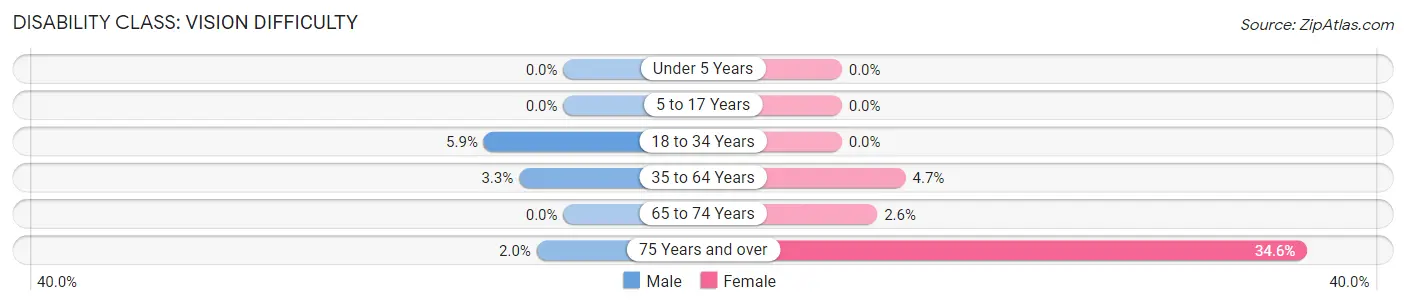
| Age Bracket | Male | Female |
| Under 5 Years | 0 (0.0%) | 0 (0.0%) |
| 5 to 17 Years | 0 (0.0%) | 0 (0.0%) |
| 18 to 34 Years | 37 (5.9%) | 0 (0.0%) |
| 35 to 64 Years | 35 (3.3%) | 55 (4.7%) |
| 65 to 74 Years | 0 (0.0%) | 13 (2.6%) |
| 75 Years and over | 4 (2.0%) | 104 (34.5%) |
Disability Class: Cognitive Difficulty
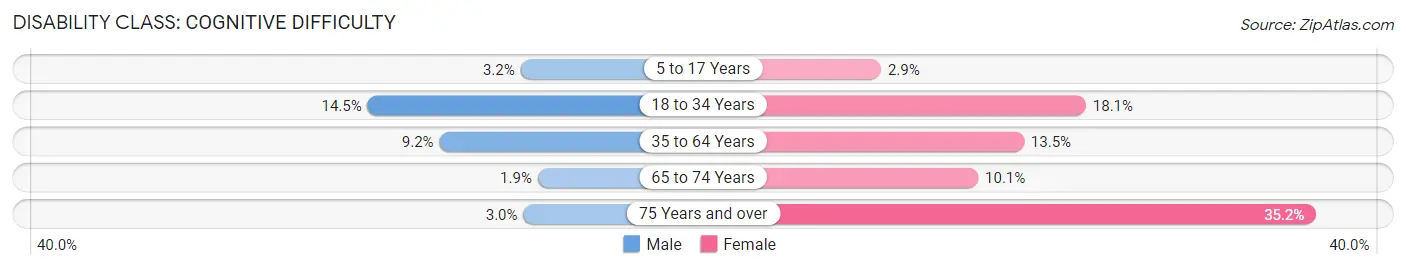
| Age Bracket | Male | Female |
| 5 to 17 Years | 10 (3.2%) | 13 (2.9%) |
| 18 to 34 Years | 91 (14.5%) | 100 (18.1%) |
| 35 to 64 Years | 98 (9.2%) | 157 (13.5%) |
| 65 to 74 Years | 8 (1.9%) | 50 (10.1%) |
| 75 Years and over | 6 (3.0%) | 106 (35.2%) |
Disability Class: Ambulatory Difficulty
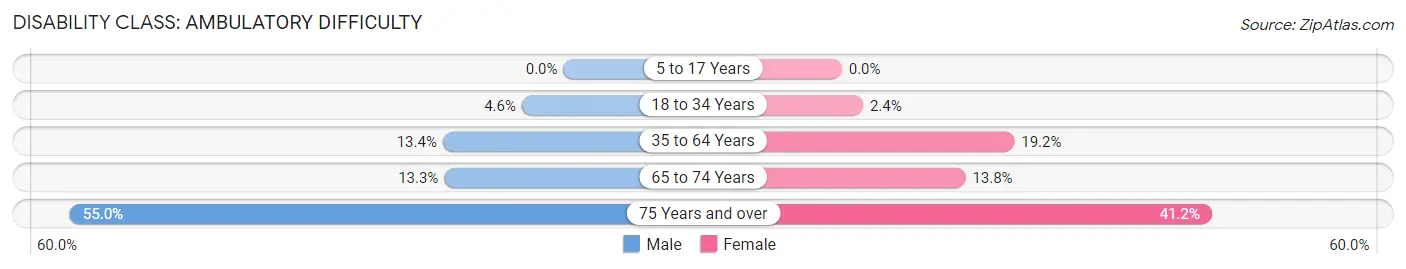
| Age Bracket | Male | Female |
| 5 to 17 Years | 0 (0.0%) | 0 (0.0%) |
| 18 to 34 Years | 29 (4.6%) | 13 (2.4%) |
| 35 to 64 Years | 143 (13.4%) | 223 (19.2%) |
| 65 to 74 Years | 56 (13.3%) | 68 (13.8%) |
| 75 Years and over | 111 (54.9%) | 124 (41.2%) |
Disability Class: Self-Care Difficulty
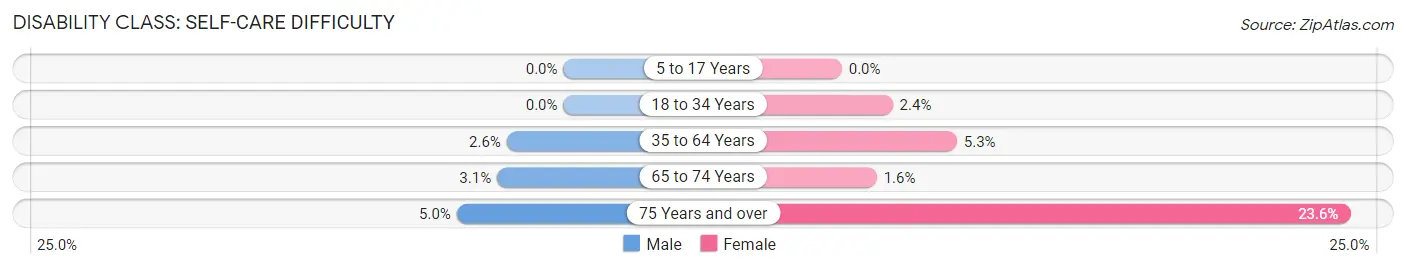
| Age Bracket | Male | Female |
| 5 to 17 Years | 0 (0.0%) | 0 (0.0%) |
| 18 to 34 Years | 0 (0.0%) | 13 (2.4%) |
| 35 to 64 Years | 28 (2.6%) | 62 (5.3%) |
| 65 to 74 Years | 13 (3.1%) | 8 (1.6%) |
| 75 Years and over | 10 (5.0%) | 71 (23.6%) |
Technology Access in Raton
Computing Device Access in Raton
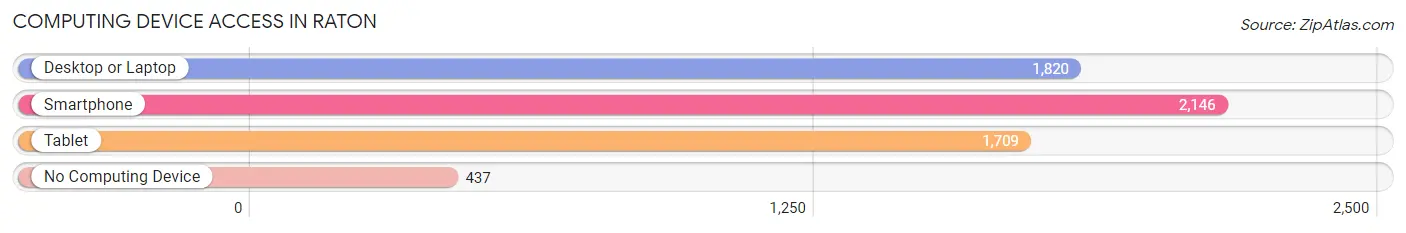
| Device Type | # Households | % Households |
| Desktop or Laptop | 1,820 | 64.0% |
| Smartphone | 2,146 | 75.5% |
| Tablet | 1,709 | 60.1% |
| No Computing Device | 437 | 15.4% |
| Total | 2,843 | 100.0% |
Internet Access in Raton
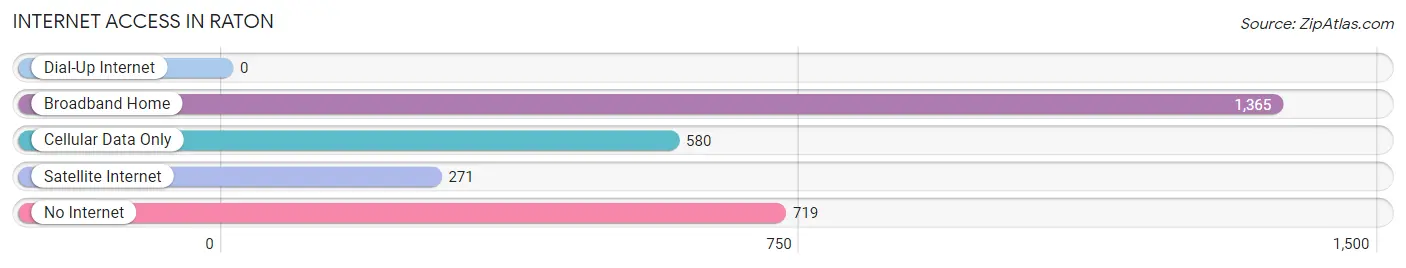
| Internet Type | # Households | % Households |
| Dial-Up Internet | 0 | 0.0% |
| Broadband Home | 1,365 | 48.0% |
| Cellular Data Only | 580 | 20.4% |
| Satellite Internet | 271 | 9.5% |
| No Internet | 719 | 25.3% |
| Total | 2,843 | 100.0% |
Raton Summary
Raton, New Mexico is a small city located in Colfax County in the northeastern corner of the state. It is situated at the base of Raton Pass, a mountain pass that was historically used by Native Americans, Spanish explorers, and settlers to cross the Rocky Mountains. The city is located near the Colorado border and is the county seat of Colfax County.
Raton has a population of approximately 6,000 people and is the largest city in Colfax County. The city is located at an elevation of 6,890 feet and has a total area of 4.2 square miles. The city is located in the Raton Basin, which is a large valley surrounded by the Sangre de Cristo Mountains to the east and the Raton Mesa to the west.
The economy of Raton is largely based on agriculture, tourism, and retail. The city is home to several large agricultural operations, including a large dairy farm and a large cattle ranch. The city is also home to several tourist attractions, including the Raton Museum of Natural History, the Raton Pass National Historic Site, and the Raton Country Club. The city also has several retail stores, including a Walmart Supercenter, a Lowe's Home Improvement store, and several restaurants.
The demographics of Raton are largely Hispanic, with approximately 70% of the population identifying as Hispanic or Latino. The median household income in Raton is $37,000, and the median age is 37. The city has a high rate of poverty, with approximately 25% of the population living below the poverty line.
Raton is served by the Raton Municipal Airport, which provides air service to the city. The city is also served by the Raton Amtrak station, which provides rail service to the city. The city is also served by several highways, including Interstate 25, US Route 64, and US Route 87.
Raton is a small city with a rich history and a diverse economy. The city is home to several tourist attractions, agricultural operations, and retail stores. The city has a large Hispanic population and a high rate of poverty. The city is served by the Raton Municipal Airport, the Raton Amtrak station, and several highways.
Common Questions
What is Per Capita Income in Raton?
Per Capita income in Raton is $25,679.
What is the Median Family Income in Raton?
Median Family Income in Raton is $52,260.
What is the Median Household income in Raton?
Median Household Income in Raton is $40,899.
What is Income or Wage Gap in Raton?
Income or Wage Gap in Raton is 25.4%.
Women in Raton earn 74.6 cents for every dollar earned by a man.
What is Inequality or Gini Index in Raton?
Inequality or Gini Index in Raton is 0.40.
What is the Total Population of Raton?
Total Population of Raton is 6,046.
What is the Total Male Population of Raton?
Total Male Population of Raton is 2,906.
What is the Total Female Population of Raton?
Total Female Population of Raton is 3,140.
What is the Ratio of Males per 100 Females in Raton?
There are 92.55 Males per 100 Females in Raton.
What is the Ratio of Females per 100 Males in Raton?
There are 108.05 Females per 100 Males in Raton.
What is the Median Population Age in Raton?
Median Population Age in Raton is 44.4 Years.
What is the Average Family Size in Raton
Average Family Size in Raton is 2.7 People.
What is the Average Household Size in Raton
Average Household Size in Raton is 2.1 People.
How Large is the Labor Force in Raton?
There are 2,694 People in the Labor Forcein in Raton.
What is the Percentage of People in the Labor Force in Raton?
52.1% of People are in the Labor Force in Raton.
What is the Unemployment Rate in Raton?
Unemployment Rate in Raton is 0.8%.