Radium Springs, NM Map & Demographics
Radium Springs Map
Radium Springs Overview
$25,377
PER CAPITA INCOME
$39,914
AVG FAMILY INCOME
$41,750
AVG HOUSEHOLD INCOME
54.1%
WAGE / INCOME GAP [ % ]
45.9¢/ $1
WAGE / INCOME GAP [ $ ]
0.47
INEQUALITY / GINI INDEX
1,657
TOTAL POPULATION
828
MALE POPULATION
829
FEMALE POPULATION
99.88
MALES / 100 FEMALES
100.12
FEMALES / 100 MALES
32.1
MEDIAN AGE
3.5
AVG FAMILY SIZE
3.2
AVG HOUSEHOLD SIZE
647
LABOR FORCE [ PEOPLE ]
49.4%
PERCENT IN LABOR FORCE
13.9%
UNEMPLOYMENT RATE
Radium Springs Area Codes
Income in Radium Springs
Income Overview in Radium Springs
Per Capita Income in Radium Springs is $25,377, while median incomes of families and households are $39,914 and $41,750 respectively.
| Characteristic | Number | Measure |
| Per Capita Income | 1,657 | $25,377 |
| Median Family Income | 421 | $39,914 |
| Mean Family Income | 421 | $77,221 |
| Median Household Income | 513 | $41,750 |
| Mean Household Income | 513 | $74,861 |
| Income Deficit | 421 | $0 |
| Wage / Income Gap (%) | 1,657 | 54.14% |
| Wage / Income Gap ($) | 1,657 | 45.86¢ per $1 |
| Gini / Inequality Index | 1,657 | 0.47 |
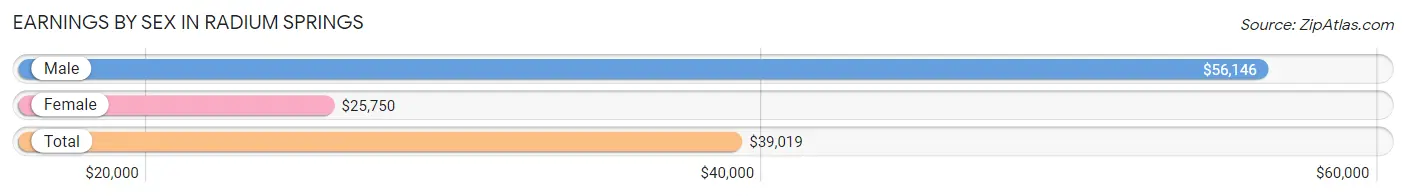
Earnings by Sex in Radium Springs
Average Earnings in Radium Springs are $39,019, $56,146 for men and $25,750 for women, a difference of 54.1%.
| Sex | Number | Average Earnings |
| Male | 281 (44.7%) | $56,146 |
| Female | 348 (55.3%) | $25,750 |
| Total | 629 (100.0%) | $39,019 |
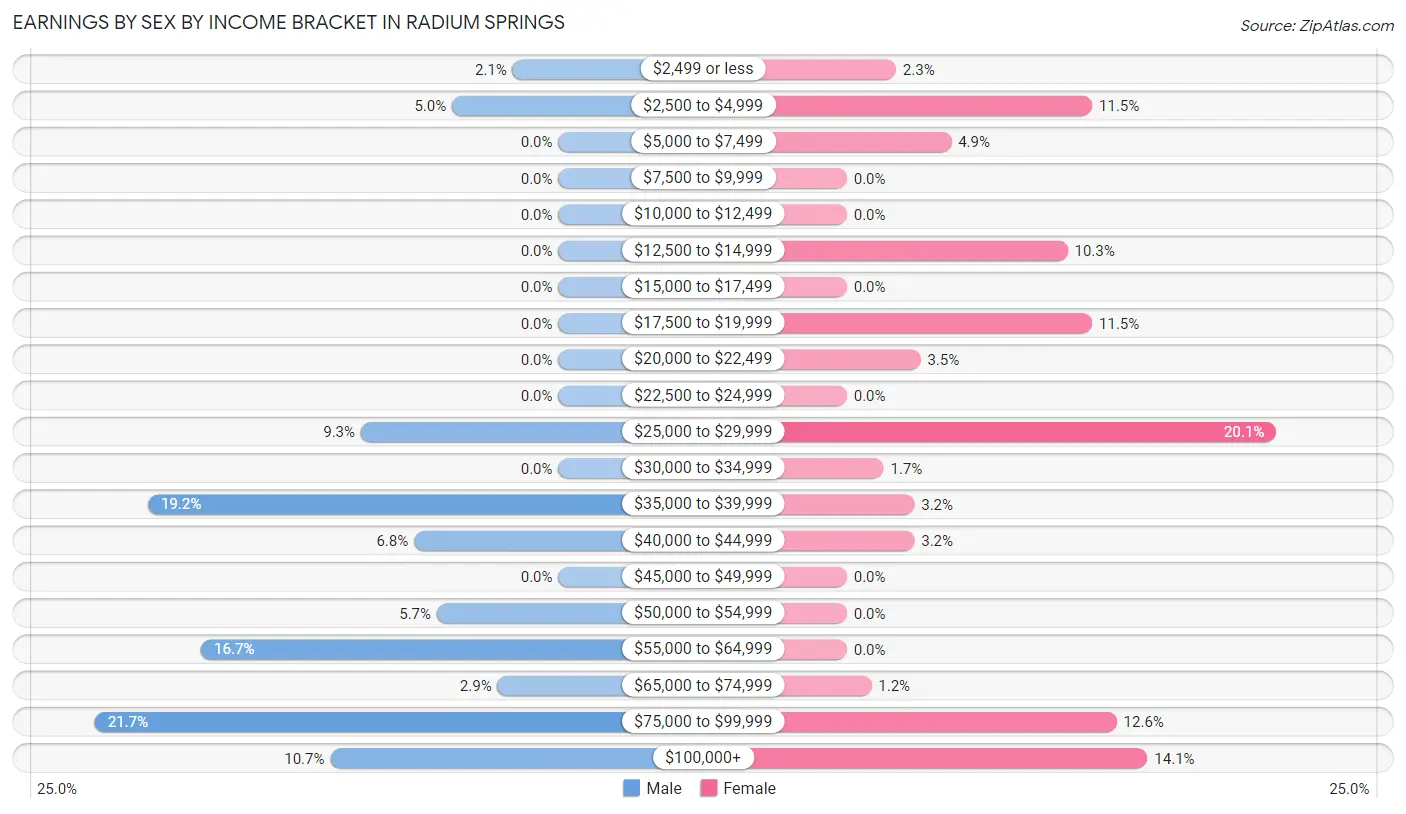
Earnings by Sex by Income Bracket in Radium Springs
The most common earnings brackets in Radium Springs are $75,000 to $99,999 for men (61 | 21.7%) and $25,000 to $29,999 for women (70 | 20.1%).
| Income | Male | Female |
| $2,499 or less | 6 (2.1%) | 8 (2.3%) |
| $2,500 to $4,999 | 14 (5.0%) | 40 (11.5%) |
| $5,000 to $7,499 | 0 (0.0%) | 17 (4.9%) |
| $7,500 to $9,999 | 0 (0.0%) | 0 (0.0%) |
| $10,000 to $12,499 | 0 (0.0%) | 0 (0.0%) |
| $12,500 to $14,999 | 0 (0.0%) | 36 (10.3%) |
| $15,000 to $17,499 | 0 (0.0%) | 0 (0.0%) |
| $17,500 to $19,999 | 0 (0.0%) | 40 (11.5%) |
| $20,000 to $22,499 | 0 (0.0%) | 12 (3.5%) |
| $22,500 to $24,999 | 0 (0.0%) | 0 (0.0%) |
| $25,000 to $29,999 | 26 (9.2%) | 70 (20.1%) |
| $30,000 to $34,999 | 0 (0.0%) | 6 (1.7%) |
| $35,000 to $39,999 | 54 (19.2%) | 11 (3.2%) |
| $40,000 to $44,999 | 19 (6.8%) | 11 (3.2%) |
| $45,000 to $49,999 | 0 (0.0%) | 0 (0.0%) |
| $50,000 to $54,999 | 16 (5.7%) | 0 (0.0%) |
| $55,000 to $64,999 | 47 (16.7%) | 0 (0.0%) |
| $65,000 to $74,999 | 8 (2.9%) | 4 (1.1%) |
| $75,000 to $99,999 | 61 (21.7%) | 44 (12.6%) |
| $100,000+ | 30 (10.7%) | 49 (14.1%) |
| Total | 281 (100.0%) | 348 (100.0%) |
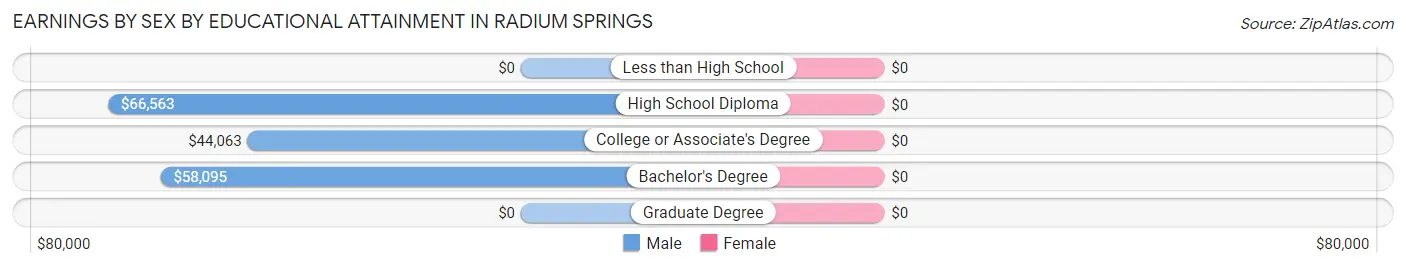
Earnings by Sex by Educational Attainment in Radium Springs
| Educational Attainment | Male Income | Female Income |
| Less than High School | - | - |
| High School Diploma | $66,563 | $0 |
| College or Associate's Degree | $44,063 | $0 |
| Bachelor's Degree | $58,095 | $0 |
| Graduate Degree | - | - |
| Total | $56,146 | $25,986 |
Family Income in Radium Springs
Family Income Brackets in Radium Springs
According to the Radium Springs family income data, there are 123 families falling into the $100,000 to $149,999 income range, which is the most common income bracket and makes up 29.2% of all families. Conversely, the $150,000 to $199,999 income bracket is the least frequent group with only 5 families (1.2%) belonging to this category.
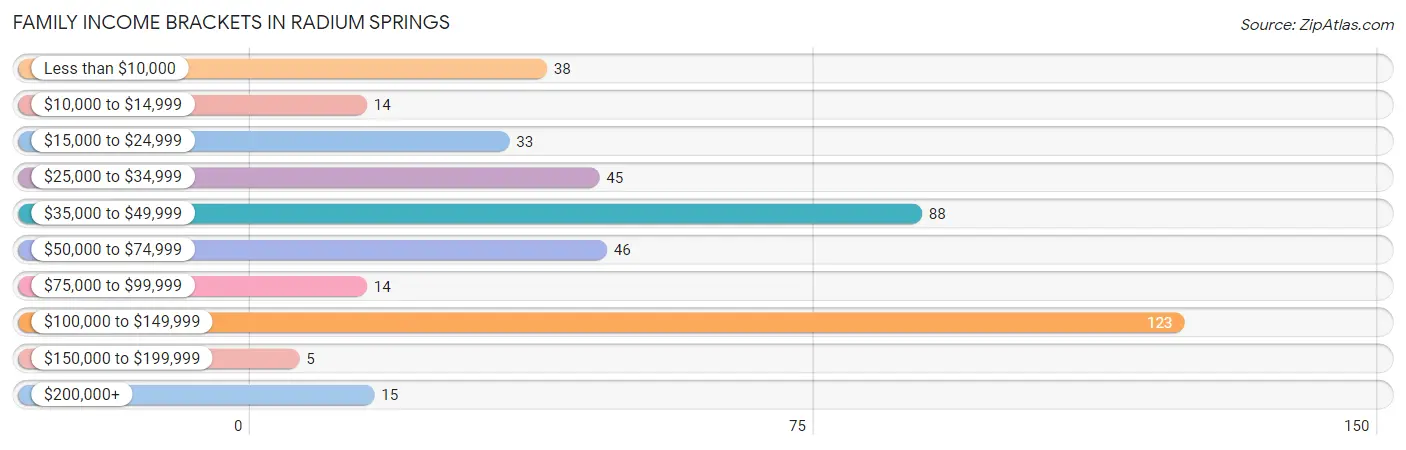
| Income Bracket | # Families | % Families |
| Less than $10,000 | 38 | 9.0% |
| $10,000 to $14,999 | 14 | 3.3% |
| $15,000 to $24,999 | 33 | 7.8% |
| $25,000 to $34,999 | 45 | 10.7% |
| $35,000 to $49,999 | 88 | 20.9% |
| $50,000 to $74,999 | 46 | 10.9% |
| $75,000 to $99,999 | 14 | 3.3% |
| $100,000 to $149,999 | 123 | 29.2% |
| $150,000 to $199,999 | 5 | 1.2% |
| $200,000+ | 15 | 3.6% |
Family Income by Famaliy Size in Radium Springs
2-person families (179 | 42.5%) account for the highest median family income in Radium Springs with $54,531 per family, while 2-person families (179 | 42.5%) have the highest median income of $27,266 per family member.
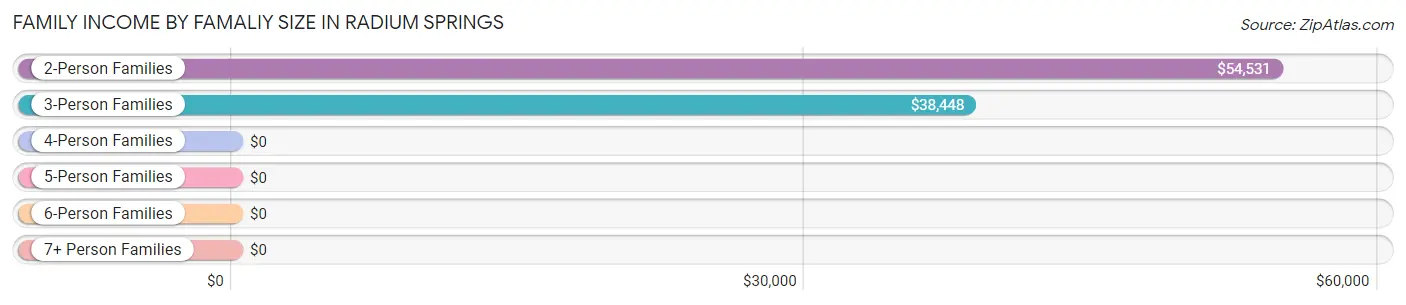
| Income Bracket | # Families | Median Income |
| 2-Person Families | 179 (42.5%) | $54,531 |
| 3-Person Families | 159 (37.8%) | $38,448 |
| 4-Person Families | 32 (7.6%) | $0 |
| 5-Person Families | 39 (9.3%) | $0 |
| 6-Person Families | 0 (0.0%) | $0 |
| 7+ Person Families | 12 (2.9%) | $0 |
| Total | 421 (100.0%) | $39,914 |
Family Income by Number of Earners in Radium Springs
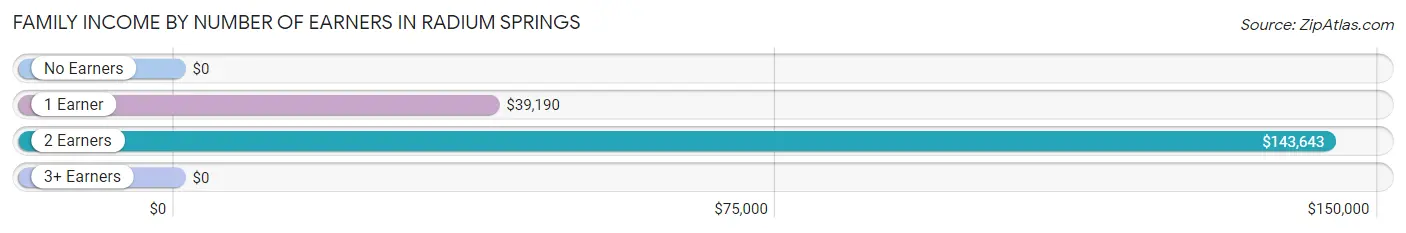
| Number of Earners | # Families | Median Income |
| No Earners | 98 (23.3%) | $0 |
| 1 Earner | 215 (51.1%) | $39,190 |
| 2 Earners | 102 (24.2%) | $143,643 |
| 3+ Earners | 6 (1.4%) | $0 |
| Total | 421 (100.0%) | $39,914 |
Household Income in Radium Springs
Household Income Brackets in Radium Springs
With 111 households falling in the category, the $100,000 to $149,999 income range is the most frequent in Radium Springs, accounting for 21.6% of all households. In contrast, only 14 households (2.7%) fall into the $10,000 to $14,999 income bracket, making it the least populous group.
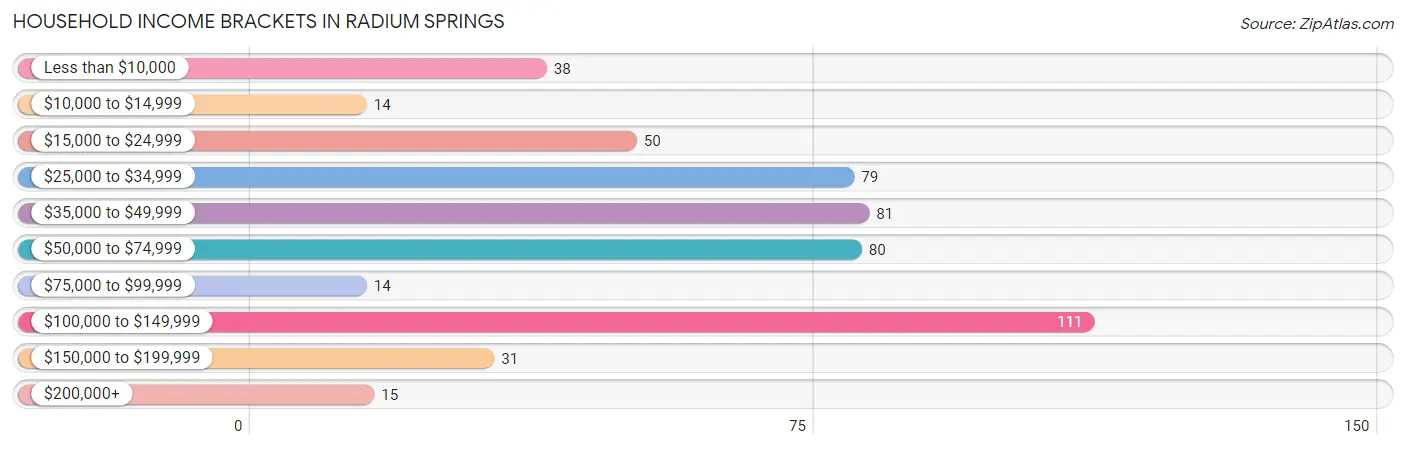
| Income Bracket | # Households | % Households |
| Less than $10,000 | 38 | 7.4% |
| $10,000 to $14,999 | 14 | 2.7% |
| $15,000 to $24,999 | 50 | 9.7% |
| $25,000 to $34,999 | 79 | 15.4% |
| $35,000 to $49,999 | 81 | 15.8% |
| $50,000 to $74,999 | 80 | 15.6% |
| $75,000 to $99,999 | 14 | 2.7% |
| $100,000 to $149,999 | 111 | 21.6% |
| $150,000 to $199,999 | 31 | 6.0% |
| $200,000+ | 15 | 2.9% |
Household Income by Householder Age in Radium Springs
The median household income in Radium Springs is $41,750, with the highest median household income of $119,968 found in the 45 to 64 years age bracket for the primary householder. A total of 145 households (28.3%) fall into this category.
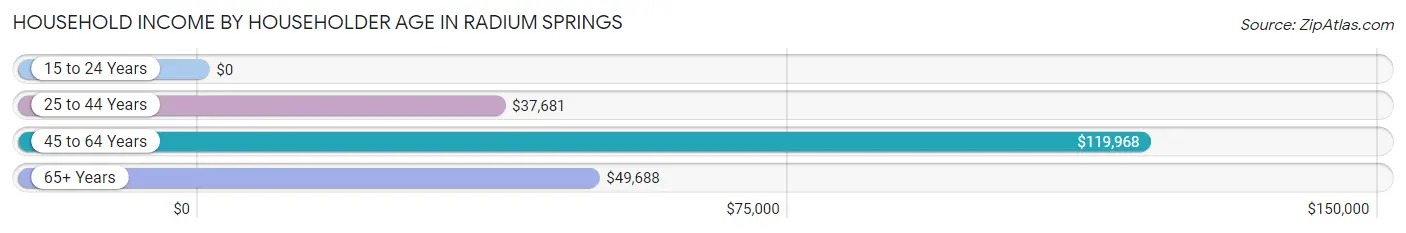
| Income Bracket | # Households | Median Income |
| 15 to 24 Years | 0 (0.0%) | $0 |
| 25 to 44 Years | 209 (40.7%) | $37,681 |
| 45 to 64 Years | 145 (28.3%) | $119,968 |
| 65+ Years | 159 (31.0%) | $49,688 |
| Total | 513 (100.0%) | $41,750 |
Poverty in Radium Springs
Income Below Poverty by Sex and Age in Radium Springs
With 9.5% poverty level for males and 25.1% for females among the residents of Radium Springs, 18 to 24 year old males and under 5 year old females are the most vulnerable to poverty, with 42 males (33.1%) and 13 females (100.0%) in their respective age groups living below the poverty level.
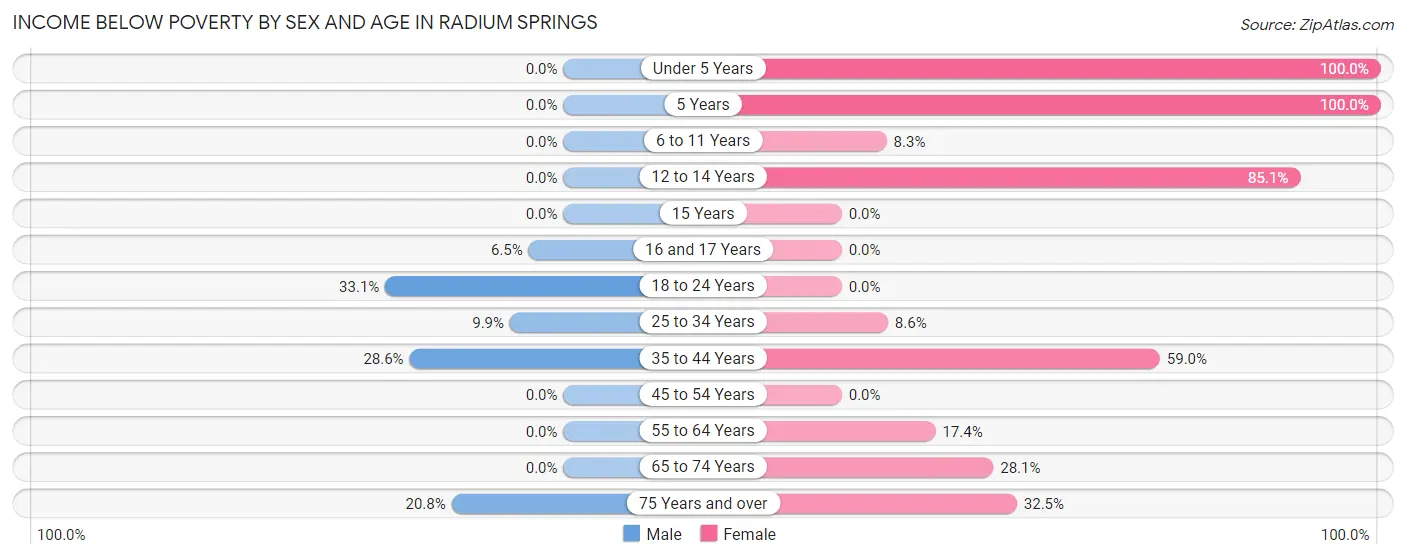
| Age Bracket | Male | Female |
| Under 5 Years | 0 (0.0%) | 13 (100.0%) |
| 5 Years | 0 (0.0%) | 6 (100.0%) |
| 6 to 11 Years | 0 (0.0%) | 6 (8.3%) |
| 12 to 14 Years | 0 (0.0%) | 57 (85.1%) |
| 15 Years | 0 (0.0%) | 0 (0.0%) |
| 16 and 17 Years | 6 (6.5%) | 0 (0.0%) |
| 18 to 24 Years | 42 (33.1%) | 0 (0.0%) |
| 25 to 34 Years | 14 (9.9%) | 16 (8.6%) |
| 35 to 44 Years | 6 (28.6%) | 49 (59.0%) |
| 45 to 54 Years | 0 (0.0%) | 0 (0.0%) |
| 55 to 64 Years | 0 (0.0%) | 12 (17.4%) |
| 65 to 74 Years | 0 (0.0%) | 36 (28.1%) |
| 75 Years and over | 11 (20.7%) | 13 (32.5%) |
| Total | 79 (9.5%) | 208 (25.1%) |
Income Above Poverty by Sex and Age in Radium Springs
According to the poverty statistics in Radium Springs, males aged under 5 years and females aged 15 years are the age groups that are most secure financially, with 100.0% of males and 100.0% of females in these age groups living above the poverty line.
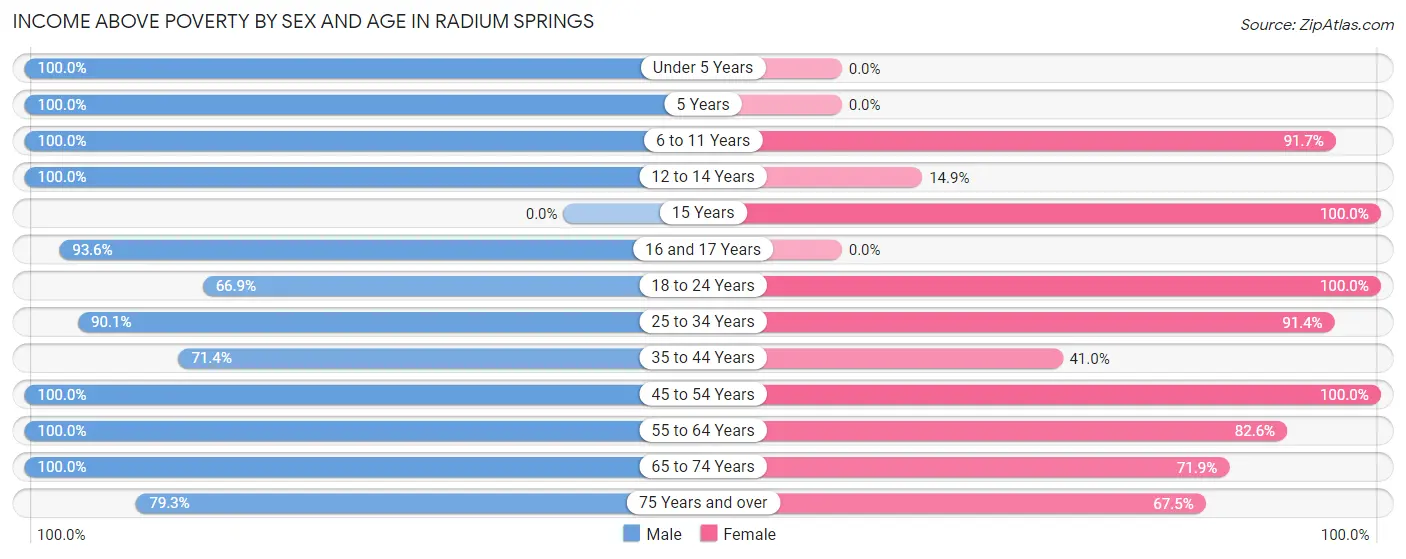
| Age Bracket | Male | Female |
| Under 5 Years | 51 (100.0%) | 0 (0.0%) |
| 5 Years | 7 (100.0%) | 0 (0.0%) |
| 6 to 11 Years | 15 (100.0%) | 66 (91.7%) |
| 12 to 14 Years | 71 (100.0%) | 10 (14.9%) |
| 15 Years | 0 (0.0%) | 46 (100.0%) |
| 16 and 17 Years | 87 (93.5%) | 0 (0.0%) |
| 18 to 24 Years | 85 (66.9%) | 35 (100.0%) |
| 25 to 34 Years | 127 (90.1%) | 171 (91.4%) |
| 35 to 44 Years | 15 (71.4%) | 34 (41.0%) |
| 45 to 54 Years | 98 (100.0%) | 83 (100.0%) |
| 55 to 64 Years | 38 (100.0%) | 57 (82.6%) |
| 65 to 74 Years | 113 (100.0%) | 92 (71.9%) |
| 75 Years and over | 42 (79.2%) | 27 (67.5%) |
| Total | 749 (90.5%) | 621 (74.9%) |
Income Below Poverty Among Married-Couple Families in Radium Springs
The poverty statistics for married-couple families in Radium Springs show that 4.2% or 11 of the total 263 families live below the poverty line. Families with 1 or 2 children have the highest poverty rate of 9.2%, comprising of 11 families. On the other hand, families with no children have the lowest poverty rate of 0.0%, which includes 0 families.
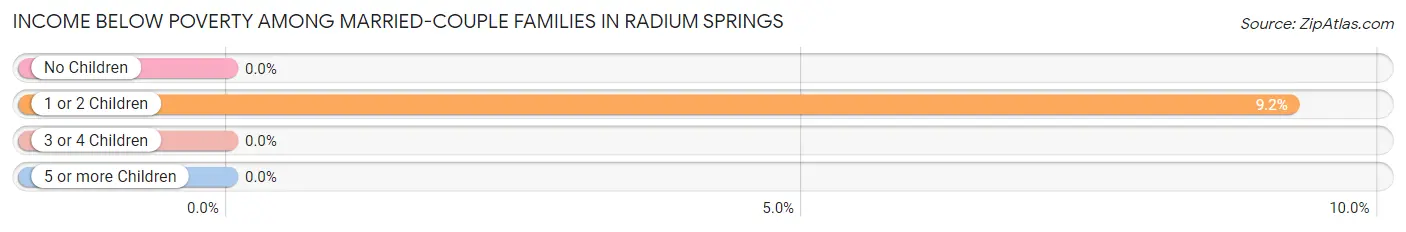
| Children | Above Poverty | Below Poverty |
| No Children | 132 (100.0%) | 0 (0.0%) |
| 1 or 2 Children | 108 (90.8%) | 11 (9.2%) |
| 3 or 4 Children | 12 (100.0%) | 0 (0.0%) |
| 5 or more Children | 0 (0.0%) | 0 (0.0%) |
| Total | 252 (95.8%) | 11 (4.2%) |
Income Below Poverty Among Single-Parent Households in Radium Springs
According to the poverty data in Radium Springs, 12.0% or 6 single-father households and 42.6% or 46 single-mother households are living below the poverty line. Among single-father households, those with 3 or 4 children have the highest poverty rate, with 6 households (100.0%) experiencing poverty. Likewise, among single-mother households, those with 1 or 2 children have the highest poverty rate, with 46 households (46.9%) falling below the poverty line.
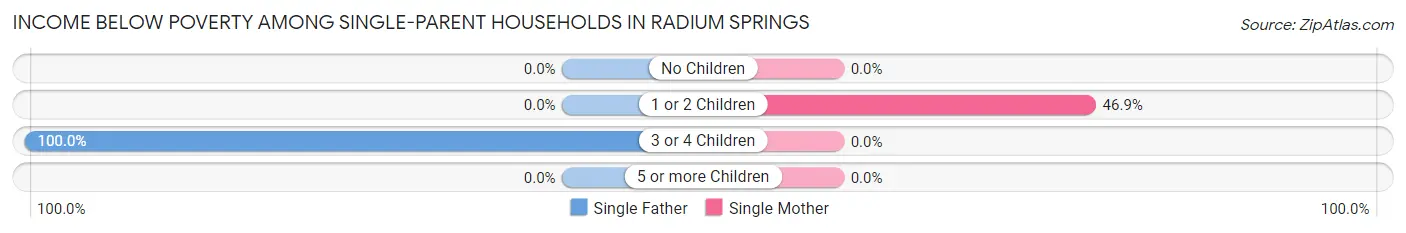
| Children | Single Father | Single Mother |
| No Children | 0 (0.0%) | 0 (0.0%) |
| 1 or 2 Children | 0 (0.0%) | 46 (46.9%) |
| 3 or 4 Children | 6 (100.0%) | 0 (0.0%) |
| 5 or more Children | 0 (0.0%) | 0 (0.0%) |
| Total | 6 (12.0%) | 46 (42.6%) |
Income Below Poverty Among Married-Couple vs Single-Parent Households in Radium Springs
The poverty data for Radium Springs shows that 11 of the married-couple family households (4.2%) and 52 of the single-parent households (32.9%) are living below the poverty level. Within the married-couple family households, those with 1 or 2 children have the highest poverty rate, with 11 households (9.2%) falling below the poverty line. Among the single-parent households, those with 3 or 4 children have the highest poverty rate, with 6 household (100.0%) living below poverty.
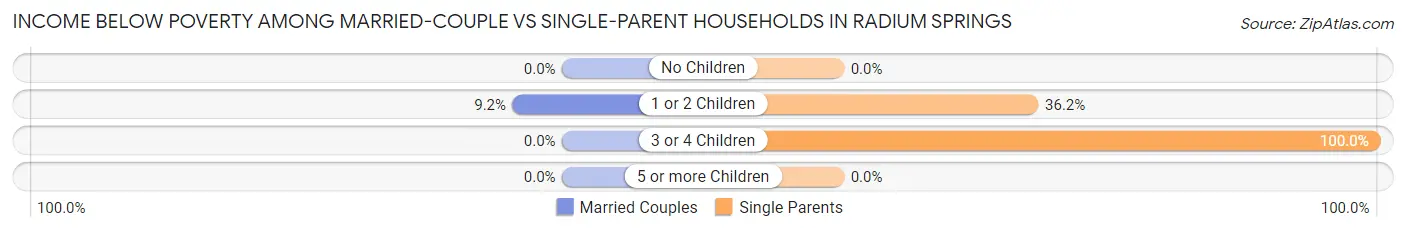
| Children | Married-Couple Families | Single-Parent Households |
| No Children | 0 (0.0%) | 0 (0.0%) |
| 1 or 2 Children | 11 (9.2%) | 46 (36.2%) |
| 3 or 4 Children | 0 (0.0%) | 6 (100.0%) |
| 5 or more Children | 0 (0.0%) | 0 (0.0%) |
| Total | 11 (4.2%) | 52 (32.9%) |
Race in Radium Springs
The most populous races in Radium Springs are White / Caucasian (1,091 | 65.8%), Hispanic or Latino (717 | 43.3%), and Some other Race (456 | 27.5%).

| Race | # Population | % Population |
| Asian | 14 | 0.8% |
| Black / African American | 0 | 0.0% |
| Hawaiian / Pacific | 0 | 0.0% |
| Hispanic or Latino | 717 | 43.3% |
| Native / Alaskan | 2 | 0.1% |
| White / Caucasian | 1,091 | 65.8% |
| Two or more Races | 94 | 5.7% |
| Some other Race | 456 | 27.5% |
| Total | 1,657 | 100.0% |
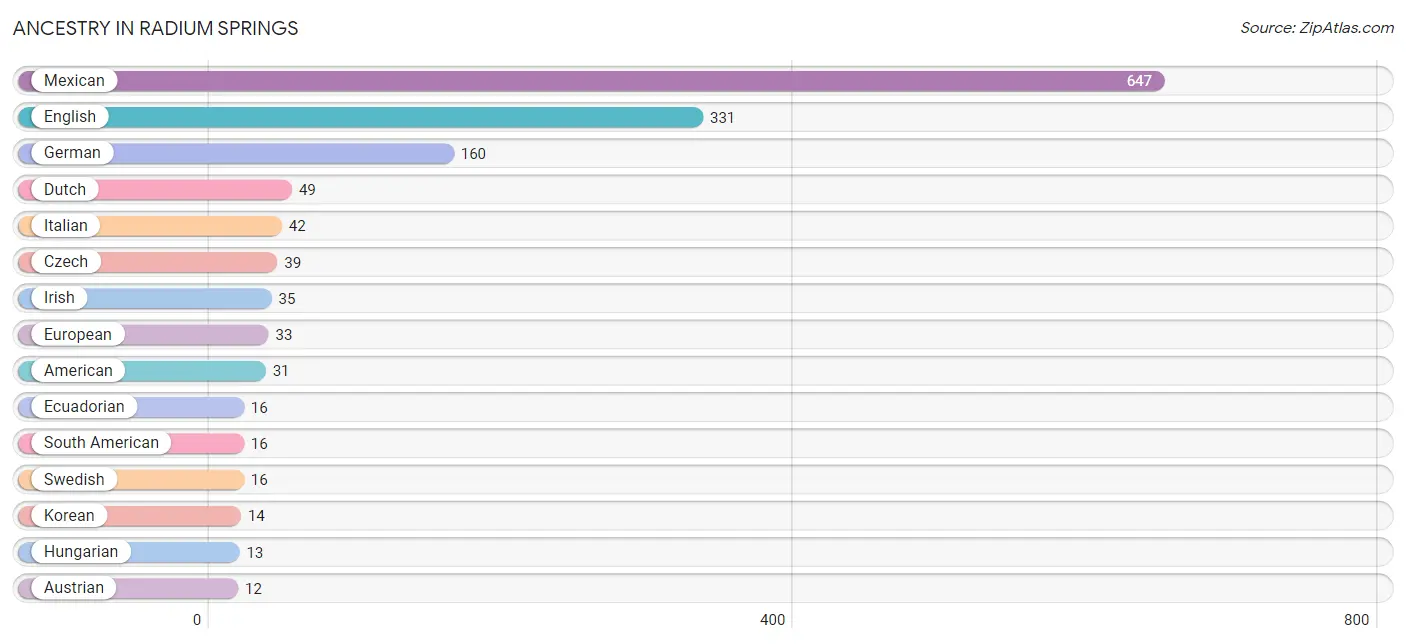
Ancestry in Radium Springs
The most populous ancestries reported in Radium Springs are Mexican (647 | 39.1%), English (331 | 20.0%), German (160 | 9.7%), Dutch (49 | 3.0%), and Italian (42 | 2.5%), together accounting for 74.2% of all Radium Springs residents.
| Ancestry | # Population | % Population |
| American | 31 | 1.9% |
| Arab | 4 | 0.2% |
| Austrian | 12 | 0.7% |
| British | 11 | 0.7% |
| Czech | 39 | 2.4% |
| Danish | 5 | 0.3% |
| Dutch | 49 | 3.0% |
| Ecuadorian | 16 | 1.0% |
| English | 331 | 20.0% |
| European | 33 | 2.0% |
| French | 5 | 0.3% |
| German | 160 | 9.7% |
| Hungarian | 13 | 0.8% |
| Irish | 35 | 2.1% |
| Italian | 42 | 2.5% |
| Korean | 14 | 0.8% |
| Mexican | 647 | 39.1% |
| Norwegian | 11 | 0.7% |
| Polish | 11 | 0.7% |
| Scotch-Irish | 12 | 0.7% |
| South American | 16 | 1.0% |
| Spaniard | 11 | 0.7% |
| Swedish | 16 | 1.0% |
| Syrian | 4 | 0.2% | View All 24 Rows |
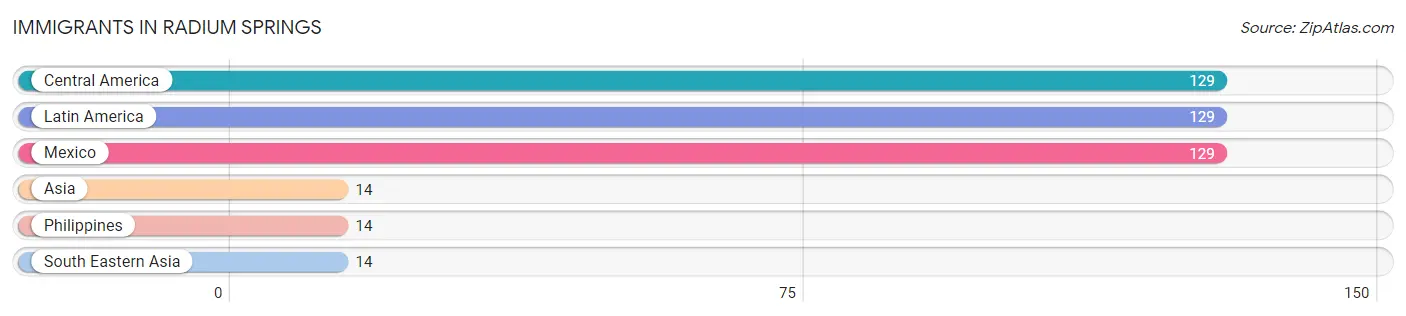
Immigrants in Radium Springs
The most numerous immigrant groups reported in Radium Springs came from Central America (129 | 7.8%), Latin America (129 | 7.8%), Mexico (129 | 7.8%), Asia (14 | 0.8%), and Philippines (14 | 0.8%), together accounting for 25.1% of all Radium Springs residents.
| Immigration Origin | # Population | % Population |
| Asia | 14 | 0.8% |
| Central America | 129 | 7.8% |
| Latin America | 129 | 7.8% |
| Mexico | 129 | 7.8% |
| Philippines | 14 | 0.8% |
| South Eastern Asia | 14 | 0.8% | View All 6 Rows |
Sex and Age in Radium Springs
Sex and Age in Radium Springs
The most populous age groups in Radium Springs are 15 to 19 Years (178 | 21.5%) for men and 10 to 14 Years (130 | 15.7%) for women.
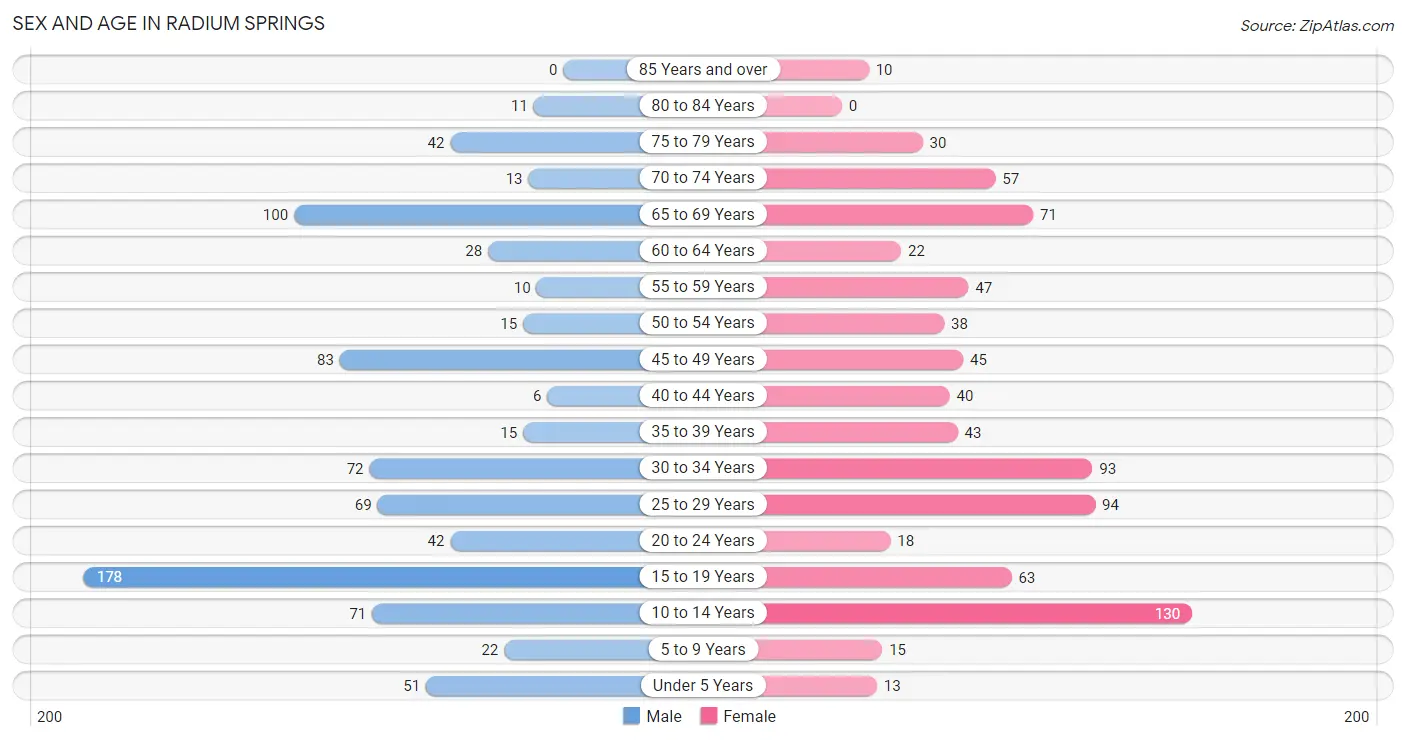
| Age Bracket | Male | Female |
| Under 5 Years | 51 (6.2%) | 13 (1.6%) |
| 5 to 9 Years | 22 (2.7%) | 15 (1.8%) |
| 10 to 14 Years | 71 (8.6%) | 130 (15.7%) |
| 15 to 19 Years | 178 (21.5%) | 63 (7.6%) |
| 20 to 24 Years | 42 (5.1%) | 18 (2.2%) |
| 25 to 29 Years | 69 (8.3%) | 94 (11.3%) |
| 30 to 34 Years | 72 (8.7%) | 93 (11.2%) |
| 35 to 39 Years | 15 (1.8%) | 43 (5.2%) |
| 40 to 44 Years | 6 (0.7%) | 40 (4.8%) |
| 45 to 49 Years | 83 (10.0%) | 45 (5.4%) |
| 50 to 54 Years | 15 (1.8%) | 38 (4.6%) |
| 55 to 59 Years | 10 (1.2%) | 47 (5.7%) |
| 60 to 64 Years | 28 (3.4%) | 22 (2.6%) |
| 65 to 69 Years | 100 (12.1%) | 71 (8.6%) |
| 70 to 74 Years | 13 (1.6%) | 57 (6.9%) |
| 75 to 79 Years | 42 (5.1%) | 30 (3.6%) |
| 80 to 84 Years | 11 (1.3%) | 0 (0.0%) |
| 85 Years and over | 0 (0.0%) | 10 (1.2%) |
| Total | 828 (100.0%) | 829 (100.0%) |
Families and Households in Radium Springs
Median Family Size in Radium Springs
The median family size in Radium Springs is 3.51 persons per family, with married-couple families (263 | 62.5%) accounting for the largest median family size of 4.01 persons per family. On the other hand, single male/father families (50 | 11.9%) represent the smallest median family size with 2.44 persons per family.
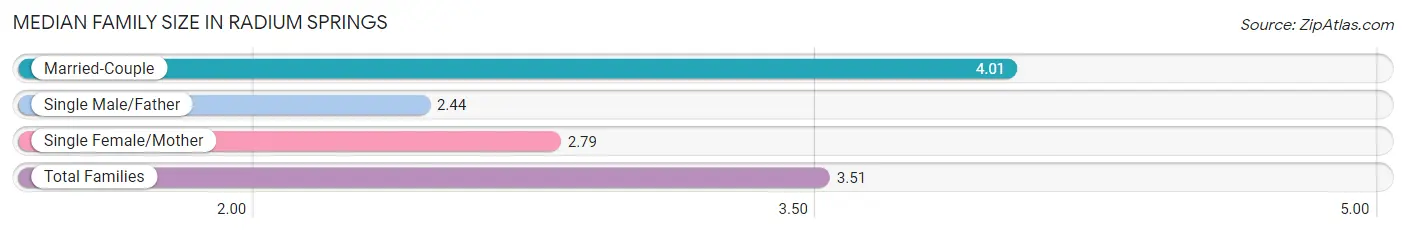
| Family Type | # Families | Family Size |
| Married-Couple | 263 (62.5%) | 4.01 |
| Single Male/Father | 50 (11.9%) | 2.44 |
| Single Female/Mother | 108 (25.7%) | 2.79 |
| Total Families | 421 (100.0%) | 3.51 |
Median Household Size in Radium Springs
The median household size in Radium Springs is 3.23 persons per household, with married-couple households (263 | 51.3%) accounting for the largest median household size of 4.11 persons per household. non-family households (92 | 17.9%) represent the smallest median household size with 1.34 persons per household.
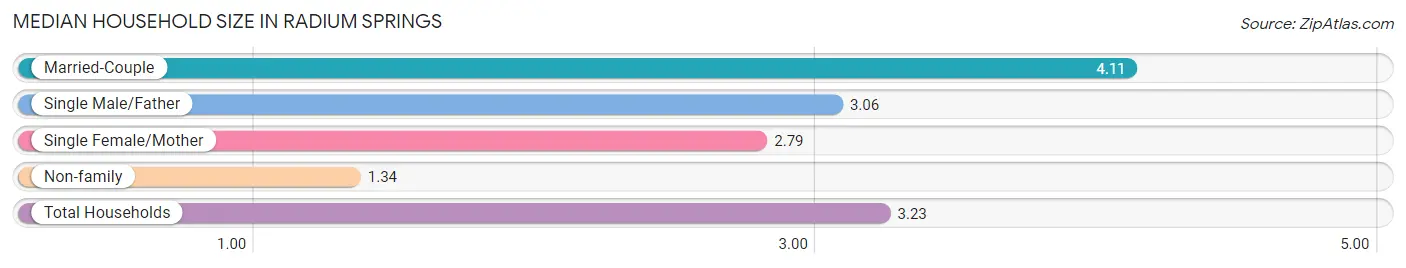
| Household Type | # Households | Household Size |
| Married-Couple | 263 (51.3%) | 4.11 |
| Single Male/Father | 50 (9.8%) | 3.06 |
| Single Female/Mother | 108 (21.0%) | 2.79 |
| Non-family | 92 (17.9%) | 1.34 |
| Total Households | 513 (100.0%) | 3.23 |
Household Size by Marriage Status in Radium Springs
Out of a total of 513 households in Radium Springs, 421 (82.1%) are family households, while 92 (17.9%) are nonfamily households. The most numerous type of family households are 3-person households, comprising 206, and the most common type of nonfamily households are 1-person households, comprising 51.
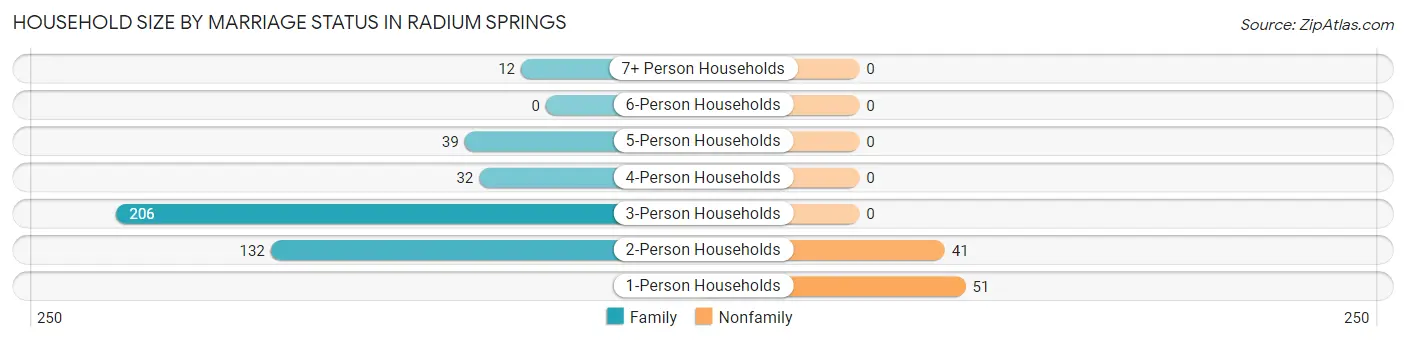
| Household Size | Family Households | Nonfamily Households |
| 1-Person Households | - | 51 (9.9%) |
| 2-Person Households | 132 (25.7%) | 41 (8.0%) |
| 3-Person Households | 206 (40.2%) | 0 (0.0%) |
| 4-Person Households | 32 (6.2%) | 0 (0.0%) |
| 5-Person Households | 39 (7.6%) | 0 (0.0%) |
| 6-Person Households | 0 (0.0%) | 0 (0.0%) |
| 7+ Person Households | 12 (2.3%) | 0 (0.0%) |
| Total | 421 (82.1%) | 92 (17.9%) |
Female Fertility in Radium Springs
Fertility by Age in Radium Springs
Average fertility rate in Radium Springs is 40.0 births per 1,000 women. Women in the age bracket of 35 to 50 years have the highest fertility rate with 108.0 births per 1,000 women. Women in the age bracket of 35 to 50 years acount for 100.0% of all women with births.
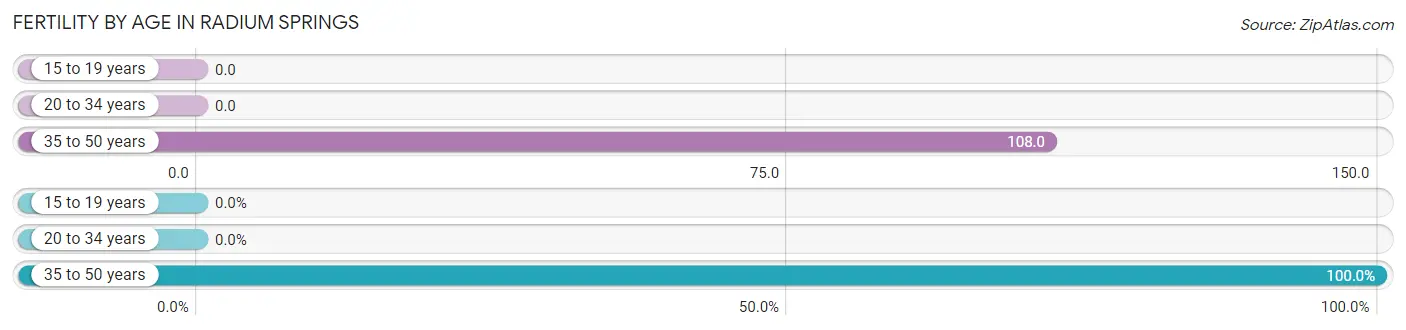
| Age Bracket | Women with Births | Births / 1,000 Women |
| 15 to 19 years | 0 (0.0%) | 0.0 |
| 20 to 34 years | 0 (0.0%) | 0.0 |
| 35 to 50 years | 17 (100.0%) | 108.0 |
| Total | 17 (100.0%) | 40.0 |
Fertility by Age by Marriage Status in Radium Springs
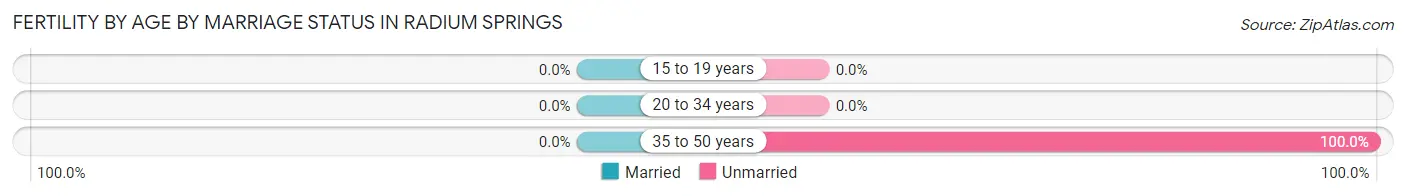
| Age Bracket | Married | Unmarried |
| 15 to 19 years | 0 (0.0%) | 0 (0.0%) |
| 20 to 34 years | 0 (0.0%) | 0 (0.0%) |
| 35 to 50 years | 0 (0.0%) | 17 (100.0%) |
| Total | 0 (0.0%) | 17 (100.0%) |
Fertility by Education in Radium Springs
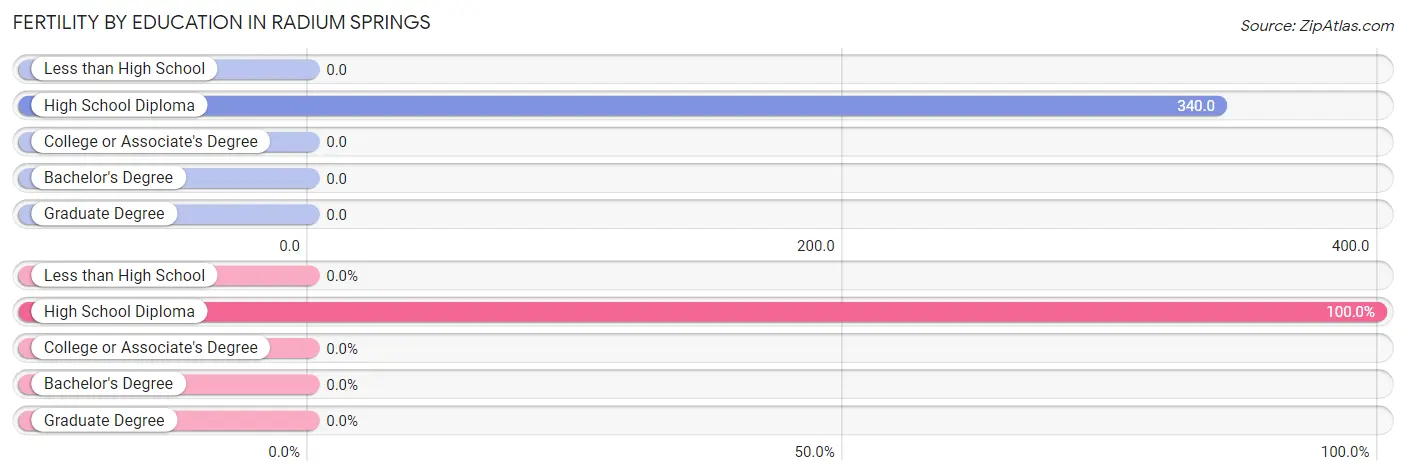
| Educational Attainment | Women with Births | Births / 1,000 Women |
| Less than High School | 0 (0.0%) | 0.0 |
| High School Diploma | 17 (100.0%) | 340.0 |
| College or Associate's Degree | 0 (0.0%) | 0.0 |
| Bachelor's Degree | 0 (0.0%) | 0.0 |
| Graduate Degree | 0 (0.0%) | 0.0 |
| Total | 17 (100.0%) | 40.0 |
Fertility by Education by Marriage Status in Radium Springs

| Educational Attainment | Married | Unmarried |
| Less than High School | 0 (0.0%) | 0 (0.0%) |
| High School Diploma | 0 (0.0%) | 17 (100.0%) |
| College or Associate's Degree | 0 (0.0%) | 0 (0.0%) |
| Bachelor's Degree | 0 (0.0%) | 0 (0.0%) |
| Graduate Degree | 0 (0.0%) | 0 (0.0%) |
| Total | 0 (0.0%) | 17 (100.0%) |
Employment Characteristics in Radium Springs
Employment by Class of Employer in Radium Springs
Among the 542 employed individuals in Radium Springs, private company employees (274 | 50.5%), not-for-profit organizations (95 | 17.5%), and federal government employees (74 | 13.7%) make up the most common classes of employment.
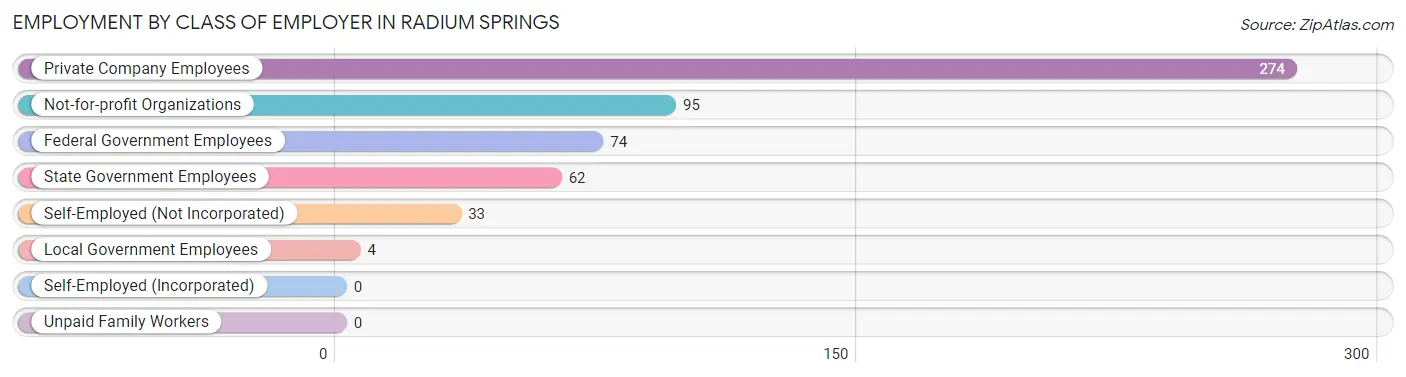
| Employer Class | # Employees | % Employees |
| Private Company Employees | 274 | 50.5% |
| Self-Employed (Incorporated) | 0 | 0.0% |
| Self-Employed (Not Incorporated) | 33 | 6.1% |
| Not-for-profit Organizations | 95 | 17.5% |
| Local Government Employees | 4 | 0.7% |
| State Government Employees | 62 | 11.4% |
| Federal Government Employees | 74 | 13.7% |
| Unpaid Family Workers | 0 | 0.0% |
| Total | 542 | 100.0% |
Employment Status by Age in Radium Springs
According to the labor force statistics for Radium Springs, out of the total population over 16 years of age (1,309), 49.4% or 647 individuals are in the labor force, with 13.9% or 90 of them unemployed. The age group with the highest labor force participation rate is 25 to 29 years, with 100.0% or 163 individuals in the labor force. Within the labor force, the 65 to 74 years age range has the highest percentage of unemployed individuals, with 71.7% or 43 of them being unemployed.
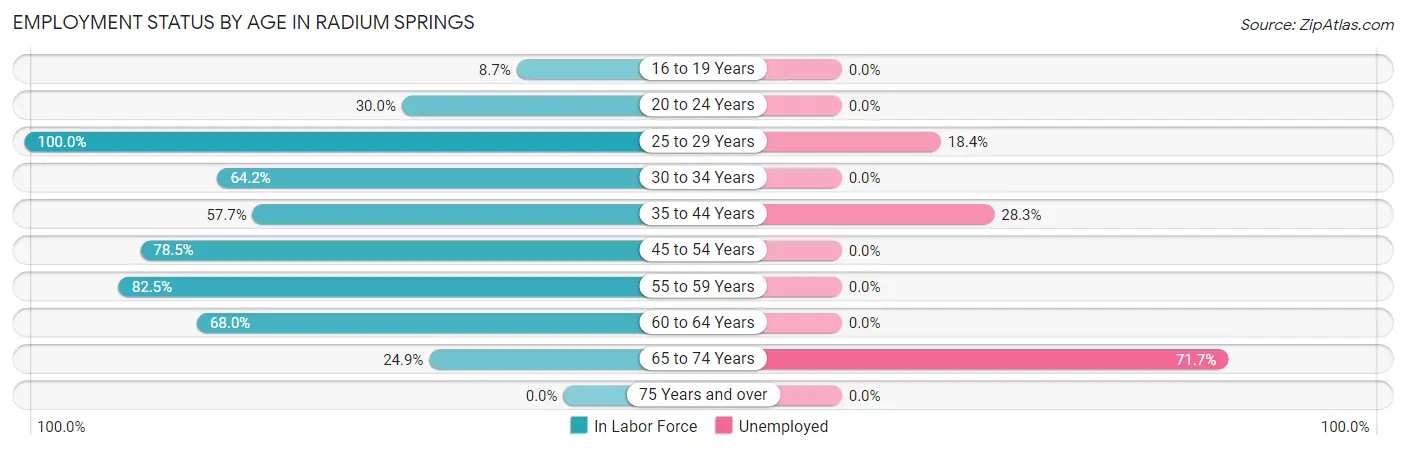
| Age Bracket | In Labor Force | Unemployed |
| 16 to 19 Years | 17 (8.7%) | 0 (0.0%) |
| 20 to 24 Years | 18 (30.0%) | 0 (0.0%) |
| 25 to 29 Years | 163 (100.0%) | 30 (18.4%) |
| 30 to 34 Years | 106 (64.2%) | 0 (0.0%) |
| 35 to 44 Years | 60 (57.7%) | 17 (28.3%) |
| 45 to 54 Years | 142 (78.5%) | 0 (0.0%) |
| 55 to 59 Years | 47 (82.5%) | 0 (0.0%) |
| 60 to 64 Years | 34 (68.0%) | 0 (0.0%) |
| 65 to 74 Years | 60 (24.9%) | 43 (71.7%) |
| 75 Years and over | 0 (0.0%) | 0 (0.0%) |
| Total | 647 (49.4%) | 90 (13.9%) |
Employment Status by Educational Attainment in Radium Springs
According to labor force statistics for Radium Springs, 76.7% of individuals (552) out of the total population between 25 and 64 years of age (720) are in the labor force, with 8.5% or 47 of them being unemployed. The group with the highest labor force participation rate are those with the educational attainment of high school diploma, with 95.0% or 189 individuals in the labor force. Within the labor force, individuals with high school diploma education have the highest percentage of unemployment, with 17.5% or 33 of them being unemployed.
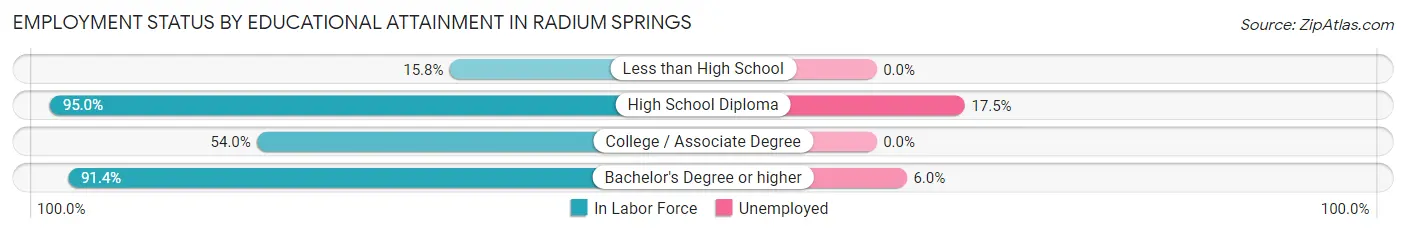
| Educational Attainment | In Labor Force | Unemployed |
| Less than High School | 6 (15.8%) | 0 (0.0%) |
| High School Diploma | 189 (95.0%) | 35 (17.5%) |
| College / Associate Degree | 122 (54.0%) | 0 (0.0%) |
| Bachelor's Degree or higher | 235 (91.4%) | 15 (6.0%) |
| Total | 552 (76.7%) | 61 (8.5%) |
Employment Occupations by Sex in Radium Springs
Management, Business, Science and Arts Occupations
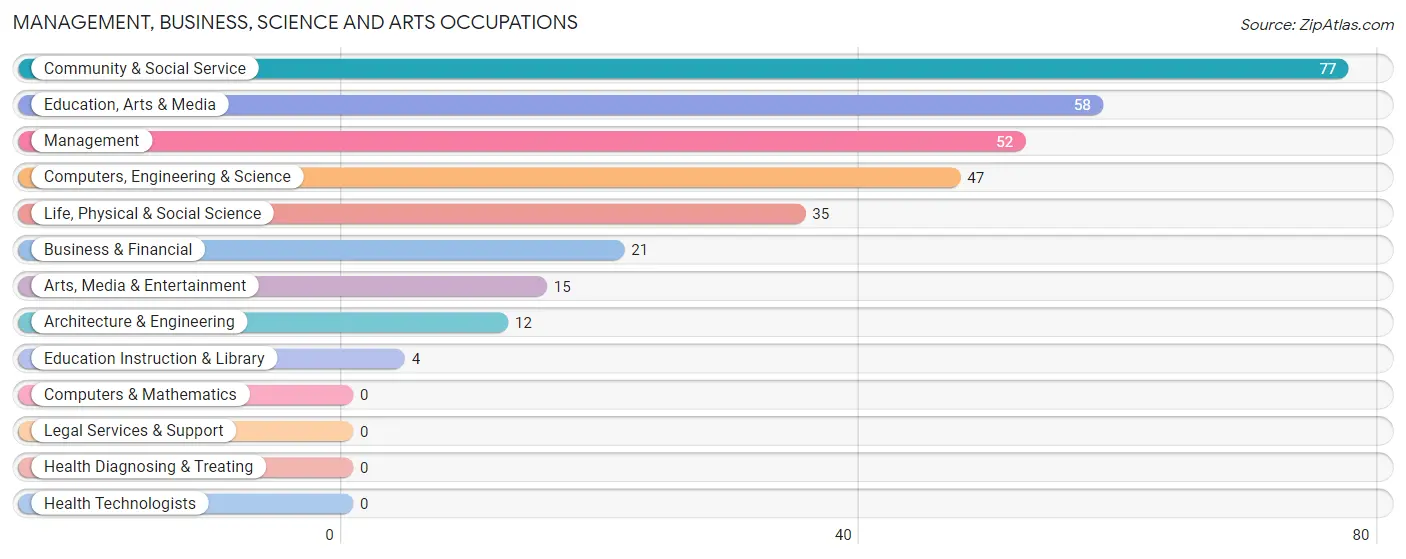
The most common Management, Business, Science and Arts occupations in Radium Springs are Community & Social Service (77 | 13.8%), Education, Arts & Media (58 | 10.4%), Management (52 | 9.3%), Computers, Engineering & Science (47 | 8.4%), and Life, Physical & Social Science (35 | 6.3%).
Management, Business, Science and Arts Occupations by Sex
Within the Management, Business, Science and Arts occupations in Radium Springs, the most male-oriented occupations are Business & Financial (100.0%), Architecture & Engineering (100.0%), and Arts, Media & Entertainment (100.0%), while the most female-oriented occupations are Life, Physical & Social Science (100.0%), Education, Arts & Media (100.0%), and Education Instruction & Library (100.0%).
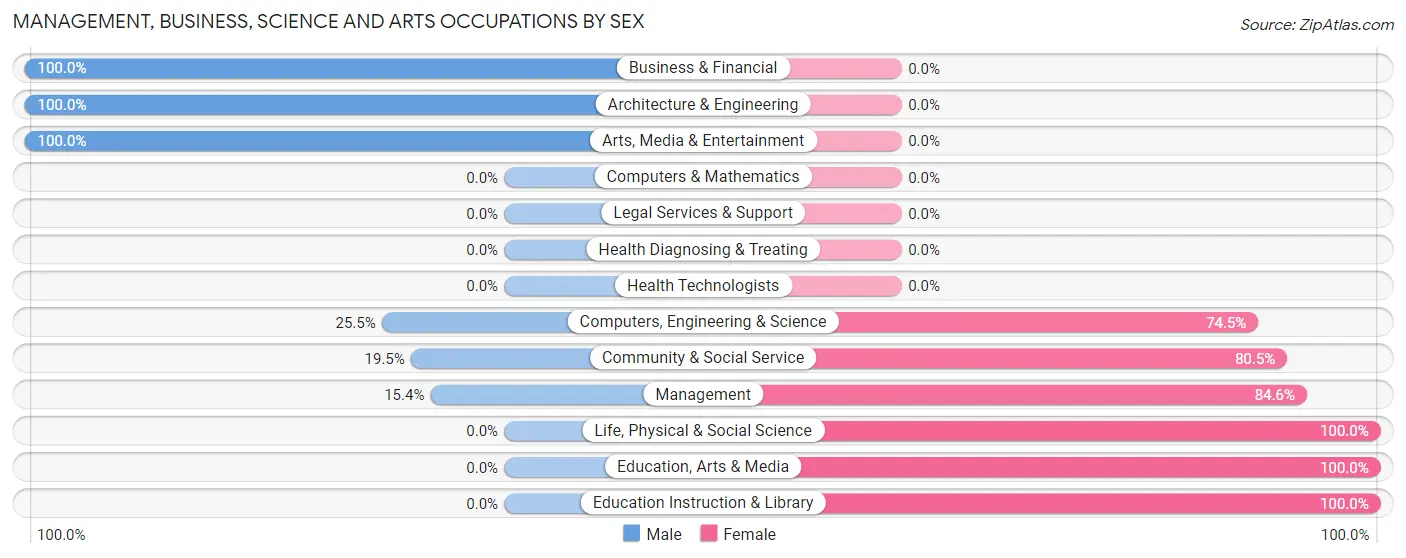
| Occupation | Male | Female |
| Management | 8 (15.4%) | 44 (84.6%) |
| Business & Financial | 21 (100.0%) | 0 (0.0%) |
| Computers, Engineering & Science | 12 (25.5%) | 35 (74.5%) |
| Computers & Mathematics | 0 (0.0%) | 0 (0.0%) |
| Architecture & Engineering | 12 (100.0%) | 0 (0.0%) |
| Life, Physical & Social Science | 0 (0.0%) | 35 (100.0%) |
| Community & Social Service | 15 (19.5%) | 62 (80.5%) |
| Education, Arts & Media | 0 (0.0%) | 58 (100.0%) |
| Legal Services & Support | 0 (0.0%) | 0 (0.0%) |
| Education Instruction & Library | 0 (0.0%) | 4 (100.0%) |
| Arts, Media & Entertainment | 15 (100.0%) | 0 (0.0%) |
| Health Diagnosing & Treating | 0 (0.0%) | 0 (0.0%) |
| Health Technologists | 0 (0.0%) | 0 (0.0%) |
| Total (Category) | 56 (28.4%) | 141 (71.6%) |
| Total (Overall) | 253 (45.4%) | 304 (54.6%) |
Services Occupations
The most common Services occupations in Radium Springs are Healthcare Support (74 | 13.3%), and Cleaning & Maintenance (12 | 2.1%).
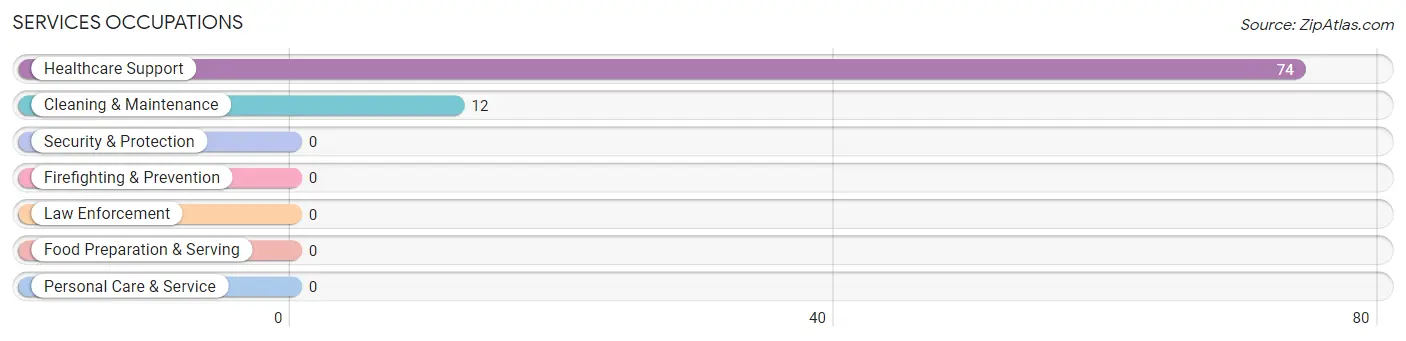
Services Occupations by Sex
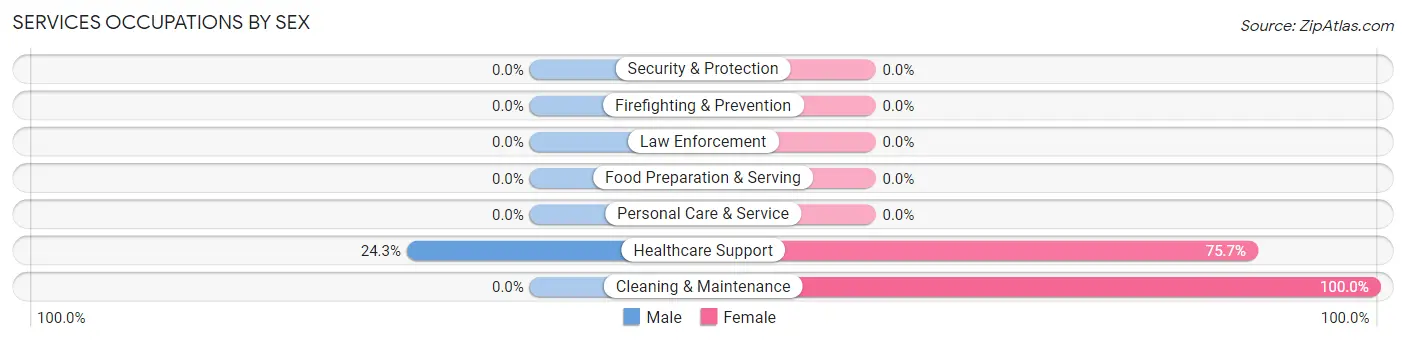
| Occupation | Male | Female |
| Healthcare Support | 18 (24.3%) | 56 (75.7%) |
| Security & Protection | 0 (0.0%) | 0 (0.0%) |
| Firefighting & Prevention | 0 (0.0%) | 0 (0.0%) |
| Law Enforcement | 0 (0.0%) | 0 (0.0%) |
| Food Preparation & Serving | 0 (0.0%) | 0 (0.0%) |
| Cleaning & Maintenance | 0 (0.0%) | 12 (100.0%) |
| Personal Care & Service | 0 (0.0%) | 0 (0.0%) |
| Total (Category) | 18 (20.9%) | 68 (79.1%) |
| Total (Overall) | 253 (45.4%) | 304 (54.6%) |
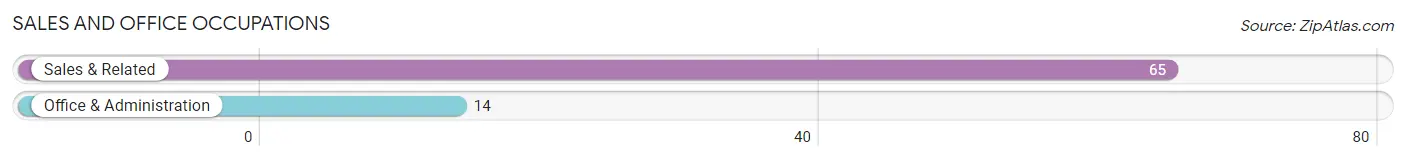
Sales and Office Occupations
The most common Sales and Office occupations in Radium Springs are Sales & Related (65 | 11.7%), and Office & Administration (14 | 2.5%).
Sales and Office Occupations by Sex
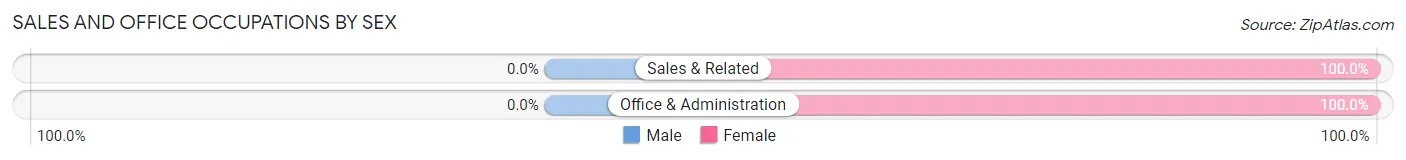
| Occupation | Male | Female |
| Sales & Related | 0 (0.0%) | 65 (100.0%) |
| Office & Administration | 0 (0.0%) | 14 (100.0%) |
| Total (Category) | 0 (0.0%) | 79 (100.0%) |
| Total (Overall) | 253 (45.4%) | 304 (54.6%) |
Natural Resources, Construction and Maintenance Occupations
The most common Natural Resources, Construction and Maintenance occupations in Radium Springs are Installation, Maintenance & Repair (56 | 10.1%), and Construction & Extraction (29 | 5.2%).
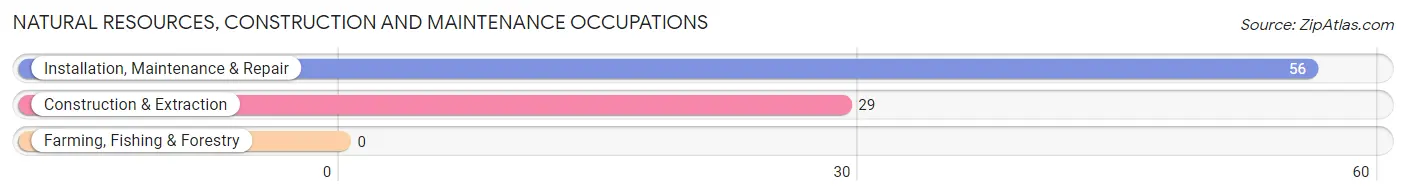
Natural Resources, Construction and Maintenance Occupations by Sex
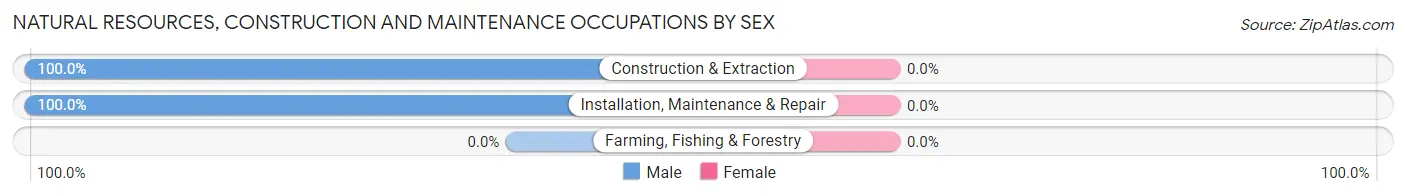
| Occupation | Male | Female |
| Farming, Fishing & Forestry | 0 (0.0%) | 0 (0.0%) |
| Construction & Extraction | 29 (100.0%) | 0 (0.0%) |
| Installation, Maintenance & Repair | 56 (100.0%) | 0 (0.0%) |
| Total (Category) | 85 (100.0%) | 0 (0.0%) |
| Total (Overall) | 253 (45.4%) | 304 (54.6%) |
Production, Transportation and Moving Occupations
The most common Production, Transportation and Moving occupations in Radium Springs are Transportation (76 | 13.6%), Production (28 | 5.0%), and Material Moving (6 | 1.1%).
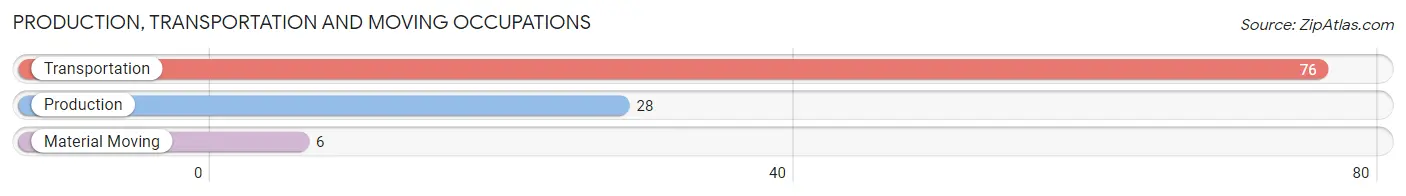
Production, Transportation and Moving Occupations by Sex
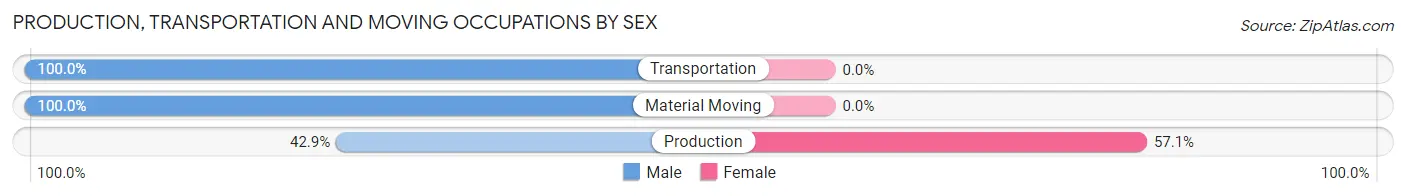
| Occupation | Male | Female |
| Production | 12 (42.9%) | 16 (57.1%) |
| Transportation | 76 (100.0%) | 0 (0.0%) |
| Material Moving | 6 (100.0%) | 0 (0.0%) |
| Total (Category) | 94 (85.5%) | 16 (14.5%) |
| Total (Overall) | 253 (45.4%) | 304 (54.6%) |
Employment Industries by Sex in Radium Springs
Employment Industries in Radium Springs
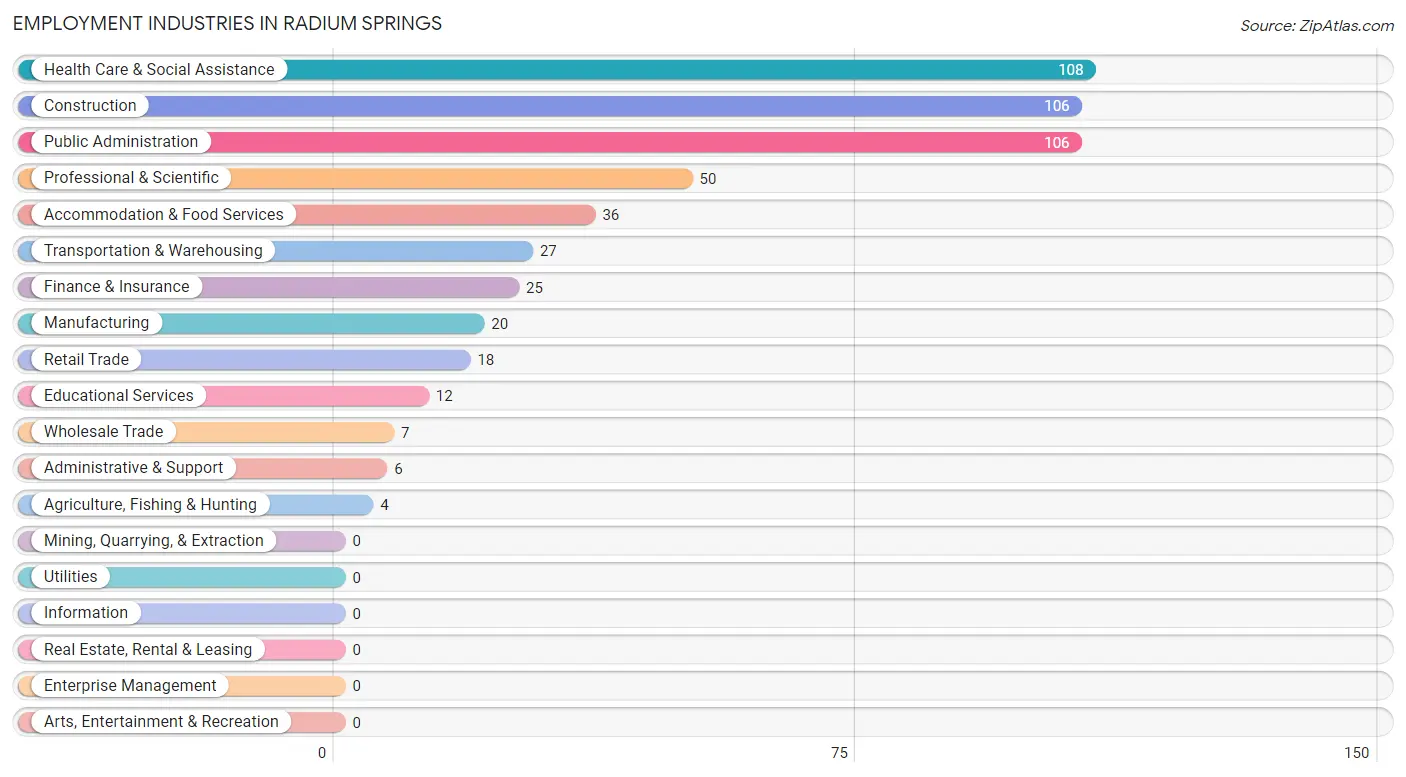
The major employment industries in Radium Springs include Health Care & Social Assistance (108 | 19.4%), Construction (106 | 19.0%), Public Administration (106 | 19.0%), Professional & Scientific (50 | 9.0%), and Accommodation & Food Services (36 | 6.5%).
Employment Industries by Sex in Radium Springs
The Radium Springs industries that see more men than women are Construction (100.0%), Wholesale Trade (100.0%), and Transportation & Warehousing (100.0%), whereas the industries that tend to have a higher number of women are Agriculture, Fishing & Hunting (100.0%), Retail Trade (100.0%), and Finance & Insurance (100.0%).
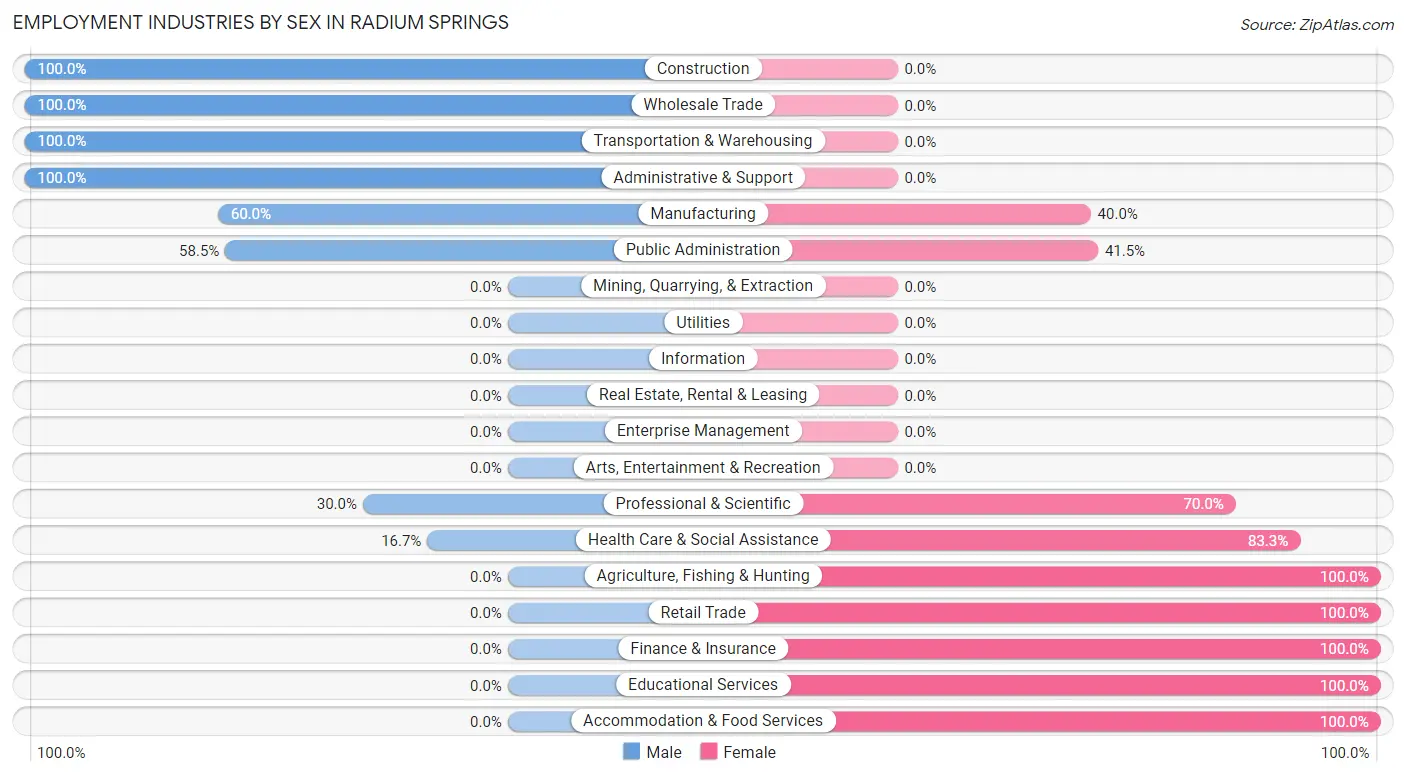
| Industry | Male | Female |
| Agriculture, Fishing & Hunting | 0 (0.0%) | 4 (100.0%) |
| Mining, Quarrying, & Extraction | 0 (0.0%) | 0 (0.0%) |
| Construction | 106 (100.0%) | 0 (0.0%) |
| Manufacturing | 12 (60.0%) | 8 (40.0%) |
| Wholesale Trade | 7 (100.0%) | 0 (0.0%) |
| Retail Trade | 0 (0.0%) | 18 (100.0%) |
| Transportation & Warehousing | 27 (100.0%) | 0 (0.0%) |
| Utilities | 0 (0.0%) | 0 (0.0%) |
| Information | 0 (0.0%) | 0 (0.0%) |
| Finance & Insurance | 0 (0.0%) | 25 (100.0%) |
| Real Estate, Rental & Leasing | 0 (0.0%) | 0 (0.0%) |
| Professional & Scientific | 15 (30.0%) | 35 (70.0%) |
| Enterprise Management | 0 (0.0%) | 0 (0.0%) |
| Administrative & Support | 6 (100.0%) | 0 (0.0%) |
| Educational Services | 0 (0.0%) | 12 (100.0%) |
| Health Care & Social Assistance | 18 (16.7%) | 90 (83.3%) |
| Arts, Entertainment & Recreation | 0 (0.0%) | 0 (0.0%) |
| Accommodation & Food Services | 0 (0.0%) | 36 (100.0%) |
| Public Administration | 62 (58.5%) | 44 (41.5%) |
| Total | 253 (45.4%) | 304 (54.6%) |
Education in Radium Springs
School Enrollment in Radium Springs
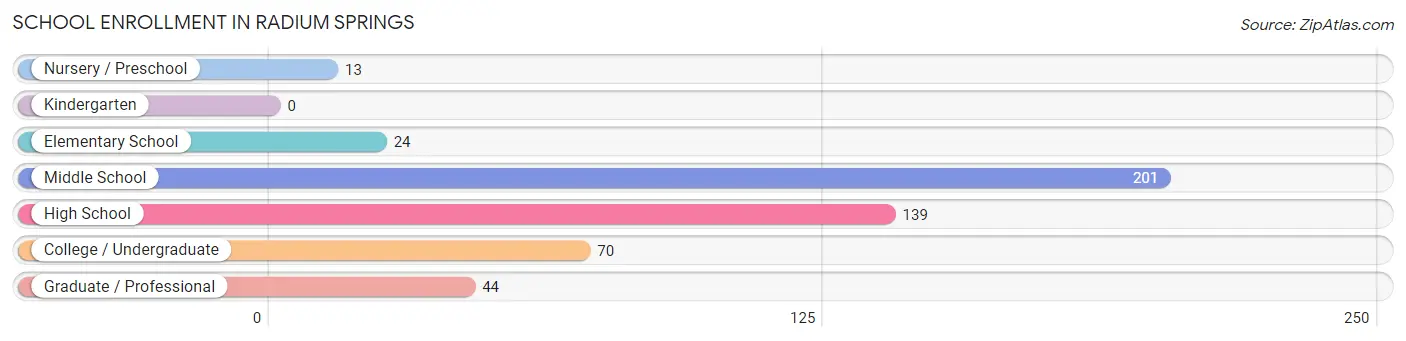
The most common levels of schooling among the 491 students in Radium Springs are middle school (201 | 40.9%), high school (139 | 28.3%), and college / undergraduate (70 | 14.3%).
| School Level | # Students | % Students |
| Nursery / Preschool | 13 | 2.6% |
| Kindergarten | 0 | 0.0% |
| Elementary School | 24 | 4.9% |
| Middle School | 201 | 40.9% |
| High School | 139 | 28.3% |
| College / Undergraduate | 70 | 14.3% |
| Graduate / Professional | 44 | 9.0% |
| Total | 491 | 100.0% |
School Enrollment by Age by Funding Source in Radium Springs
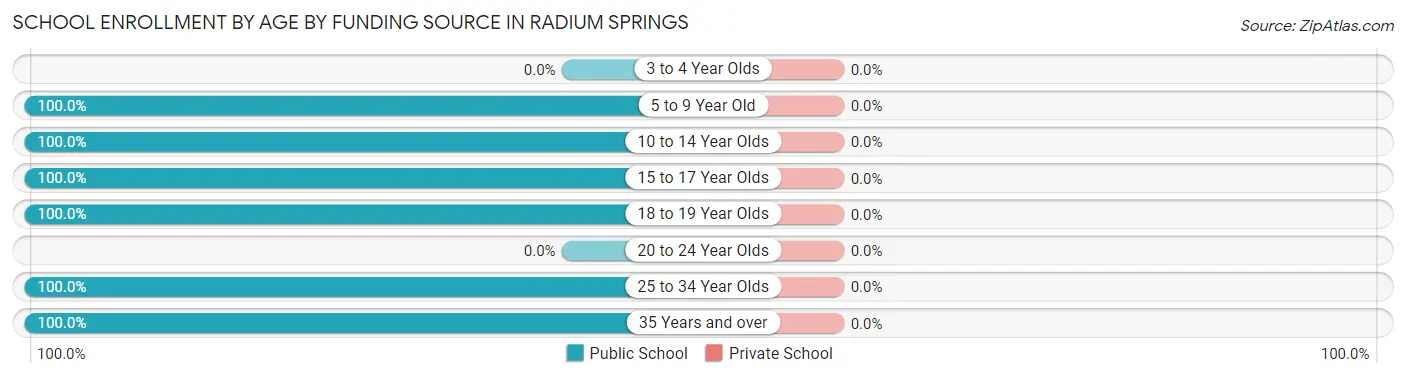
| Age Bracket | Public School | Private School |
| 3 to 4 Year Olds | 0 (0.0%) | 0 (0.0%) |
| 5 to 9 Year Old | 37 (100.0%) | 0 (0.0%) |
| 10 to 14 Year Olds | 201 (100.0%) | 0 (0.0%) |
| 15 to 17 Year Olds | 139 (100.0%) | 0 (0.0%) |
| 18 to 19 Year Olds | 17 (100.0%) | 0 (0.0%) |
| 20 to 24 Year Olds | 0 (0.0%) | 0 (0.0%) |
| 25 to 34 Year Olds | 54 (100.0%) | 0 (0.0%) |
| 35 Years and over | 43 (100.0%) | 0 (0.0%) |
| Total | 491 (100.0%) | 0 (0.0%) |
Educational Attainment by Field of Study in Radium Springs
Business (80 | 26.5%), bio, nature & agricultural (67 | 22.2%), engineering (40 | 13.3%), education (32 | 10.6%), and science & technology (24 | 8.0%) are the most common fields of study among 302 individuals in Radium Springs who have obtained a bachelor's degree or higher.
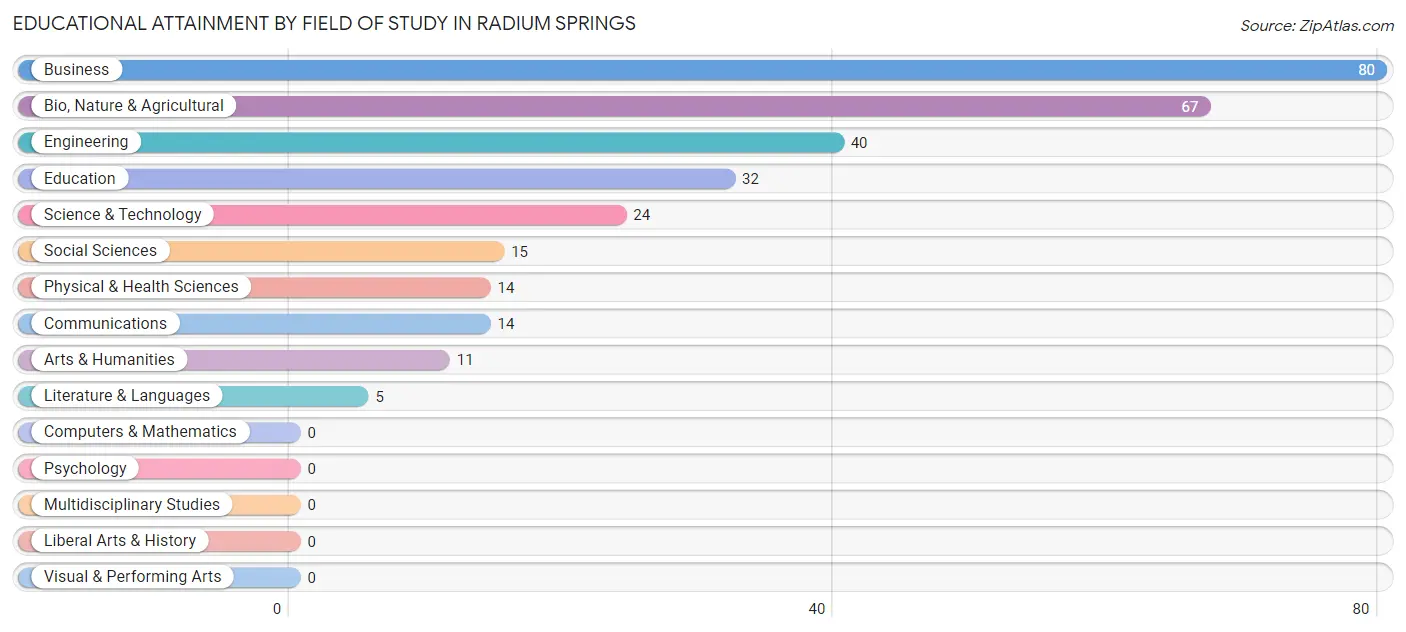
| Field of Study | # Graduates | % Graduates |
| Computers & Mathematics | 0 | 0.0% |
| Bio, Nature & Agricultural | 67 | 22.2% |
| Physical & Health Sciences | 14 | 4.6% |
| Psychology | 0 | 0.0% |
| Social Sciences | 15 | 5.0% |
| Engineering | 40 | 13.3% |
| Multidisciplinary Studies | 0 | 0.0% |
| Science & Technology | 24 | 8.0% |
| Business | 80 | 26.5% |
| Education | 32 | 10.6% |
| Literature & Languages | 5 | 1.7% |
| Liberal Arts & History | 0 | 0.0% |
| Visual & Performing Arts | 0 | 0.0% |
| Communications | 14 | 4.6% |
| Arts & Humanities | 11 | 3.6% |
| Total | 302 | 100.0% |
Transportation & Commute in Radium Springs
Vehicle Availability by Sex in Radium Springs
The most prevalent vehicle ownership categories in Radium Springs are males with 3 vehicles (117, accounting for 49.2%) and females with 3 vehicles (34, making up 38.5%).
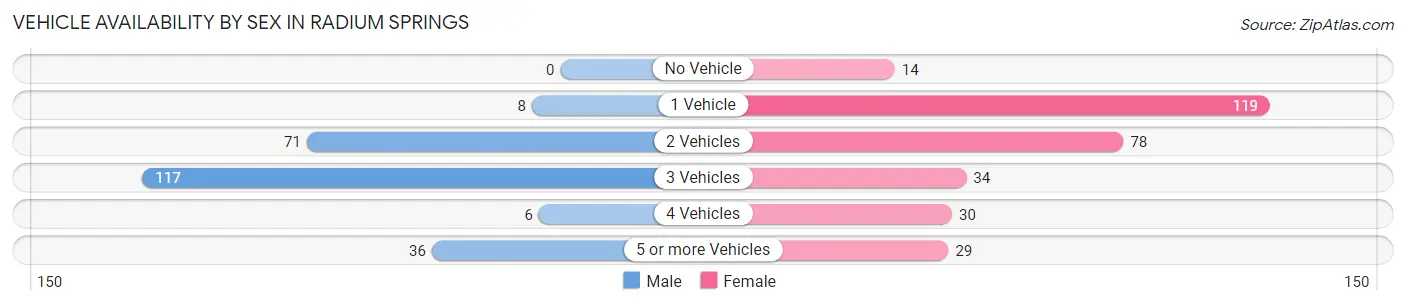
| Vehicles Available | Male | Female |
| No Vehicle | 0 (0.0%) | 14 (4.6%) |
| 1 Vehicle | 8 (3.4%) | 119 (39.1%) |
| 2 Vehicles | 71 (29.8%) | 78 (25.7%) |
| 3 Vehicles | 117 (49.2%) | 34 (11.2%) |
| 4 Vehicles | 6 (2.5%) | 30 (9.9%) |
| 5 or more Vehicles | 36 (15.1%) | 29 (9.5%) |
| Total | 238 (100.0%) | 304 (100.0%) |
Commute Time in Radium Springs
The most frequently occuring commute durations in Radium Springs are 30 to 34 minutes (162 commuters, 30.3%), 25 to 29 minutes (156 commuters, 29.2%), and 20 to 24 minutes (77 commuters, 14.4%).
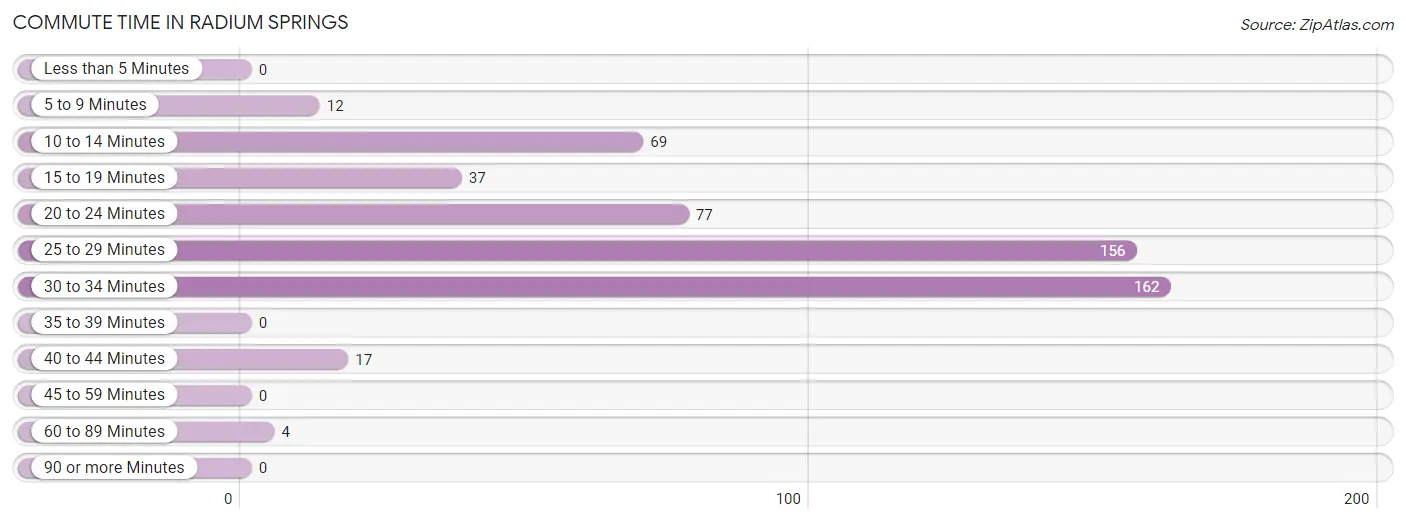
| Commute Time | # Commuters | % Commuters |
| Less than 5 Minutes | 0 | 0.0% |
| 5 to 9 Minutes | 12 | 2.2% |
| 10 to 14 Minutes | 69 | 12.9% |
| 15 to 19 Minutes | 37 | 6.9% |
| 20 to 24 Minutes | 77 | 14.4% |
| 25 to 29 Minutes | 156 | 29.2% |
| 30 to 34 Minutes | 162 | 30.3% |
| 35 to 39 Minutes | 0 | 0.0% |
| 40 to 44 Minutes | 17 | 3.2% |
| 45 to 59 Minutes | 0 | 0.0% |
| 60 to 89 Minutes | 4 | 0.7% |
| 90 or more Minutes | 0 | 0.0% |
Commute Time by Sex in Radium Springs
The most common commute times in Radium Springs are 30 to 34 minutes (128 commuters, 53.8%) for males and 25 to 29 minutes (137 commuters, 46.3%) for females.
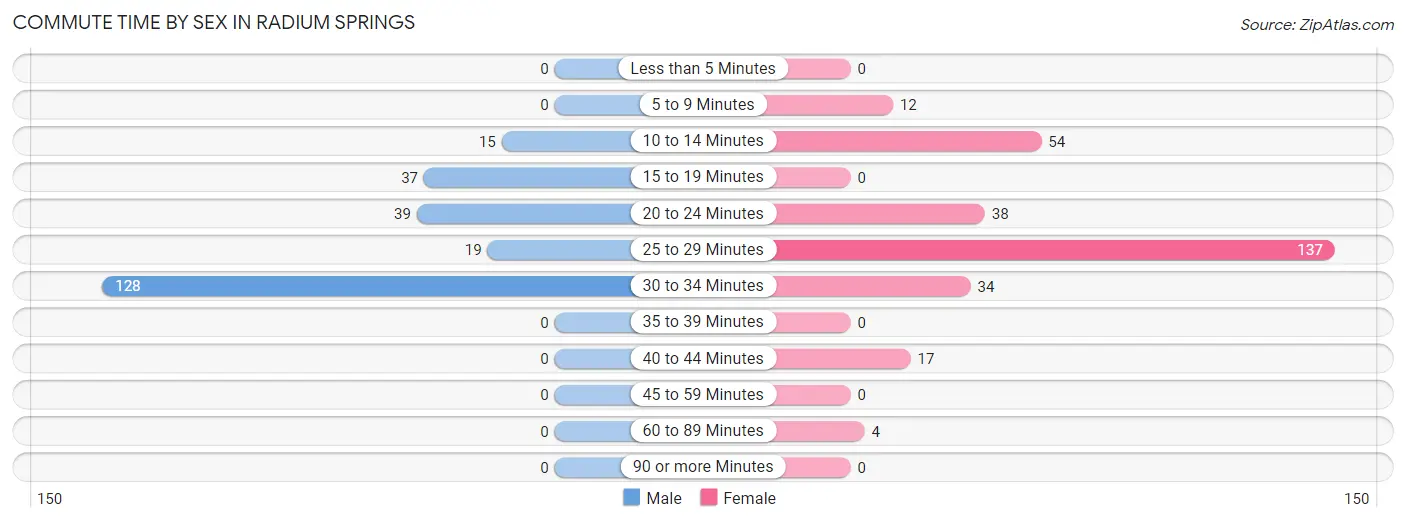
| Commute Time | Male | Female |
| Less than 5 Minutes | 0 (0.0%) | 0 (0.0%) |
| 5 to 9 Minutes | 0 (0.0%) | 12 (4.1%) |
| 10 to 14 Minutes | 15 (6.3%) | 54 (18.2%) |
| 15 to 19 Minutes | 37 (15.5%) | 0 (0.0%) |
| 20 to 24 Minutes | 39 (16.4%) | 38 (12.8%) |
| 25 to 29 Minutes | 19 (8.0%) | 137 (46.3%) |
| 30 to 34 Minutes | 128 (53.8%) | 34 (11.5%) |
| 35 to 39 Minutes | 0 (0.0%) | 0 (0.0%) |
| 40 to 44 Minutes | 0 (0.0%) | 17 (5.7%) |
| 45 to 59 Minutes | 0 (0.0%) | 0 (0.0%) |
| 60 to 89 Minutes | 0 (0.0%) | 4 (1.3%) |
| 90 or more Minutes | 0 (0.0%) | 0 (0.0%) |
Time of Departure to Work by Sex in Radium Springs
The most frequent times of departure to work in Radium Springs are 6:30 AM to 6:59 AM (67, 28.1%) for males and 7:30 AM to 7:59 AM (85, 28.7%) for females.
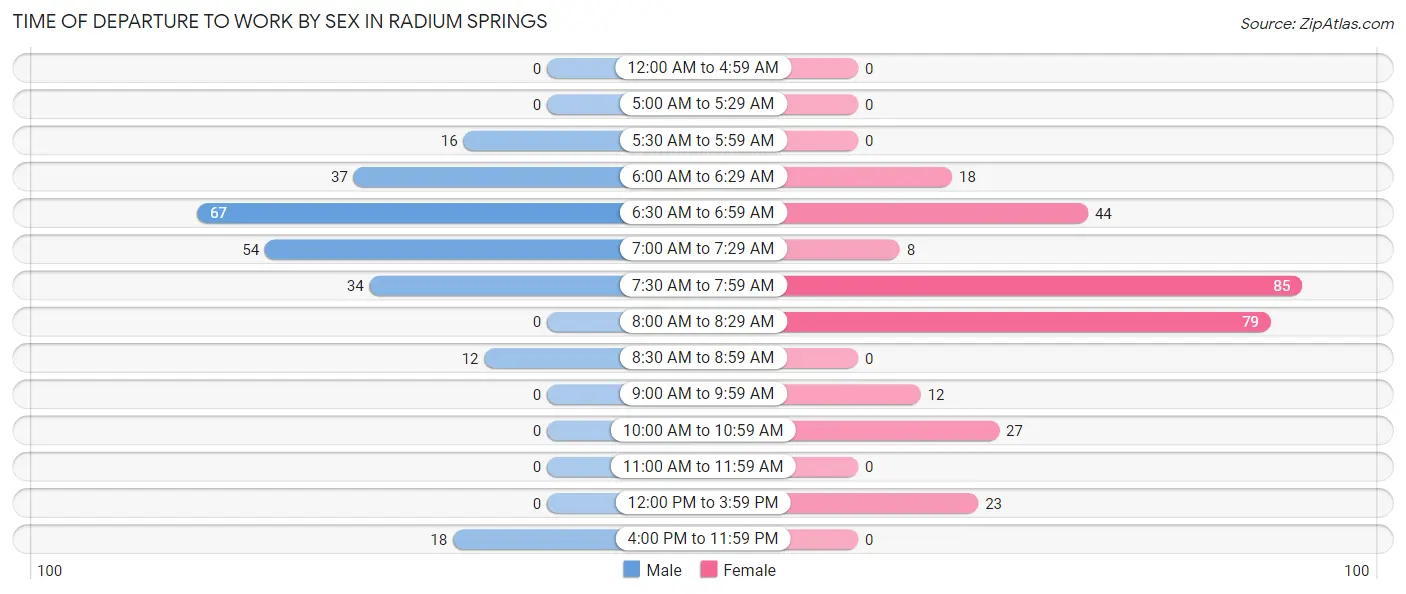
| Time of Departure | Male | Female |
| 12:00 AM to 4:59 AM | 0 (0.0%) | 0 (0.0%) |
| 5:00 AM to 5:29 AM | 0 (0.0%) | 0 (0.0%) |
| 5:30 AM to 5:59 AM | 16 (6.7%) | 0 (0.0%) |
| 6:00 AM to 6:29 AM | 37 (15.5%) | 18 (6.1%) |
| 6:30 AM to 6:59 AM | 67 (28.1%) | 44 (14.9%) |
| 7:00 AM to 7:29 AM | 54 (22.7%) | 8 (2.7%) |
| 7:30 AM to 7:59 AM | 34 (14.3%) | 85 (28.7%) |
| 8:00 AM to 8:29 AM | 0 (0.0%) | 79 (26.7%) |
| 8:30 AM to 8:59 AM | 12 (5.0%) | 0 (0.0%) |
| 9:00 AM to 9:59 AM | 0 (0.0%) | 12 (4.1%) |
| 10:00 AM to 10:59 AM | 0 (0.0%) | 27 (9.1%) |
| 11:00 AM to 11:59 AM | 0 (0.0%) | 0 (0.0%) |
| 12:00 PM to 3:59 PM | 0 (0.0%) | 23 (7.8%) |
| 4:00 PM to 11:59 PM | 18 (7.6%) | 0 (0.0%) |
| Total | 238 (100.0%) | 296 (100.0%) |
Housing Occupancy in Radium Springs
Occupancy by Ownership in Radium Springs
Of the total 513 dwellings in Radium Springs, owner-occupied units account for 417 (81.3%), while renter-occupied units make up 96 (18.7%).
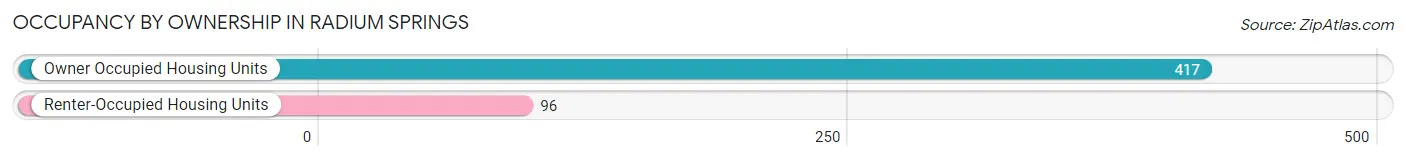
| Occupancy | # Housing Units | % Housing Units |
| Owner Occupied Housing Units | 417 | 81.3% |
| Renter-Occupied Housing Units | 96 | 18.7% |
| Total Occupied Housing Units | 513 | 100.0% |
Occupancy by Household Size in Radium Springs
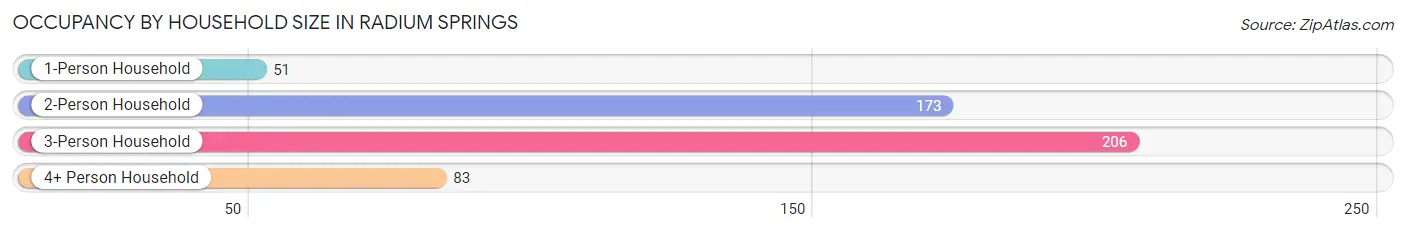
| Household Size | # Housing Units | % Housing Units |
| 1-Person Household | 51 | 9.9% |
| 2-Person Household | 173 | 33.7% |
| 3-Person Household | 206 | 40.2% |
| 4+ Person Household | 83 | 16.2% |
| Total Housing Units | 513 | 100.0% |
Occupancy by Ownership by Household Size in Radium Springs
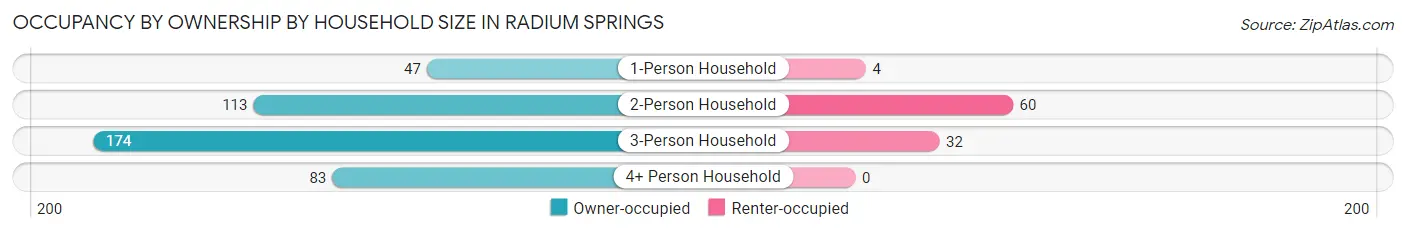
| Household Size | Owner-occupied | Renter-occupied |
| 1-Person Household | 47 (92.2%) | 4 (7.8%) |
| 2-Person Household | 113 (65.3%) | 60 (34.7%) |
| 3-Person Household | 174 (84.5%) | 32 (15.5%) |
| 4+ Person Household | 83 (100.0%) | 0 (0.0%) |
| Total Housing Units | 417 (81.3%) | 96 (18.7%) |
Occupancy by Educational Attainment in Radium Springs
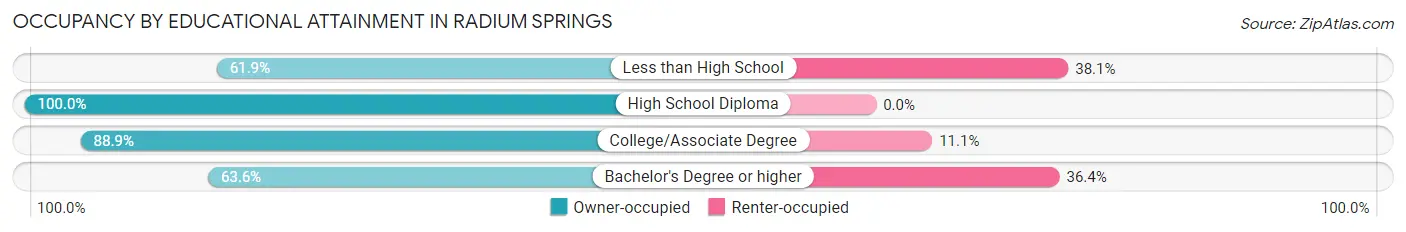
| Household Size | Owner-occupied | Renter-occupied |
| Less than High School | 52 (61.9%) | 32 (38.1%) |
| High School Diploma | 128 (100.0%) | 0 (0.0%) |
| College/Associate Degree | 160 (88.9%) | 20 (11.1%) |
| Bachelor's Degree or higher | 77 (63.6%) | 44 (36.4%) |
Occupancy by Age of Householder in Radium Springs
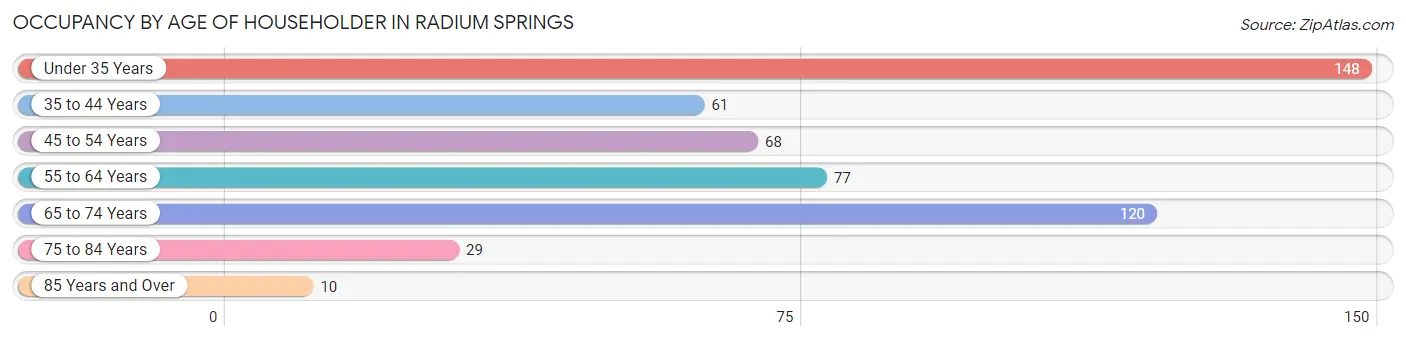
| Age Bracket | # Households | % Households |
| Under 35 Years | 148 | 28.8% |
| 35 to 44 Years | 61 | 11.9% |
| 45 to 54 Years | 68 | 13.3% |
| 55 to 64 Years | 77 | 15.0% |
| 65 to 74 Years | 120 | 23.4% |
| 75 to 84 Years | 29 | 5.7% |
| 85 Years and Over | 10 | 1.9% |
| Total | 513 | 100.0% |
Housing Finances in Radium Springs
Median Income by Occupancy in Radium Springs
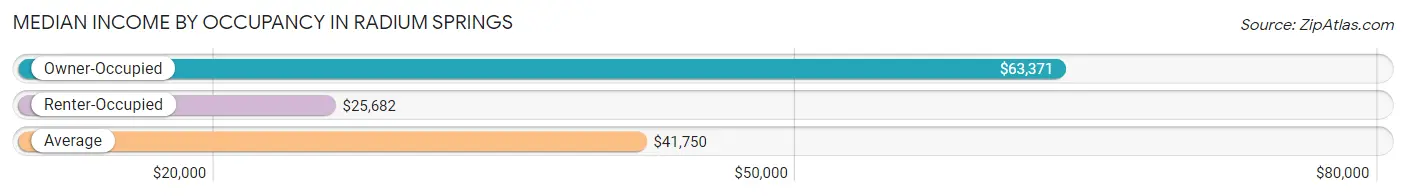
| Occupancy Type | # Households | Median Income |
| Owner-Occupied | 417 (81.3%) | $63,371 |
| Renter-Occupied | 96 (18.7%) | $25,682 |
| Average | 513 (100.0%) | $41,750 |
Occupancy by Householder Income Bracket in Radium Springs
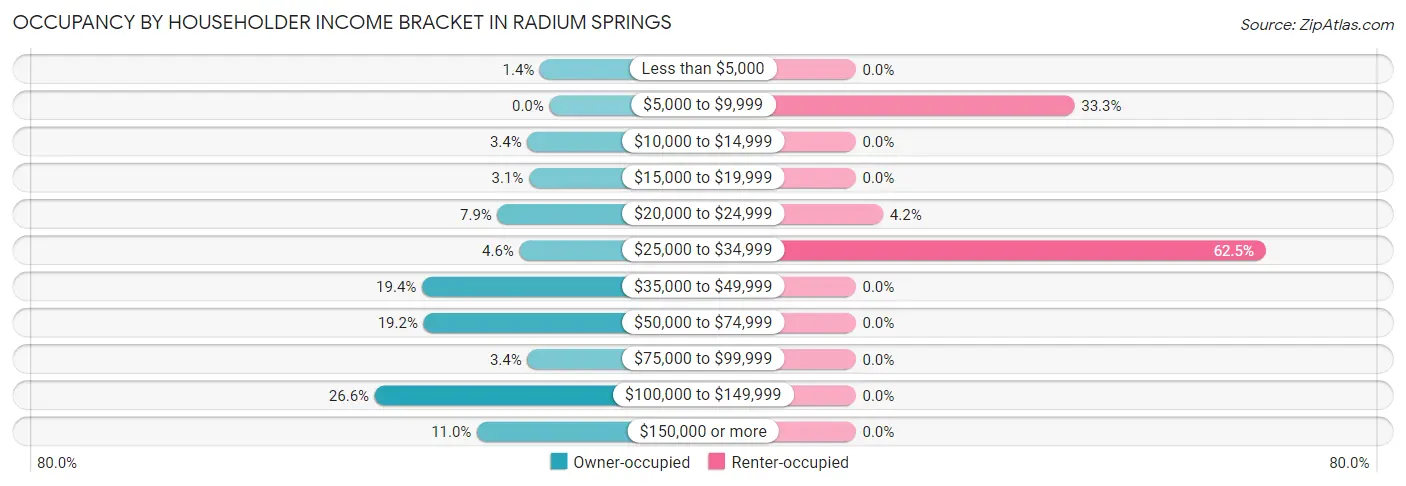
| Income Bracket | Owner-occupied | Renter-occupied |
| Less than $5,000 | 6 (1.4%) | 0 (0.0%) |
| $5,000 to $9,999 | 0 (0.0%) | 32 (33.3%) |
| $10,000 to $14,999 | 14 (3.4%) | 0 (0.0%) |
| $15,000 to $19,999 | 13 (3.1%) | 0 (0.0%) |
| $20,000 to $24,999 | 33 (7.9%) | 4 (4.2%) |
| $25,000 to $34,999 | 19 (4.6%) | 60 (62.5%) |
| $35,000 to $49,999 | 81 (19.4%) | 0 (0.0%) |
| $50,000 to $74,999 | 80 (19.2%) | 0 (0.0%) |
| $75,000 to $99,999 | 14 (3.4%) | 0 (0.0%) |
| $100,000 to $149,999 | 111 (26.6%) | 0 (0.0%) |
| $150,000 or more | 46 (11.0%) | 0 (0.0%) |
| Total | 417 (100.0%) | 96 (100.0%) |
Monthly Housing Cost Tiers in Radium Springs
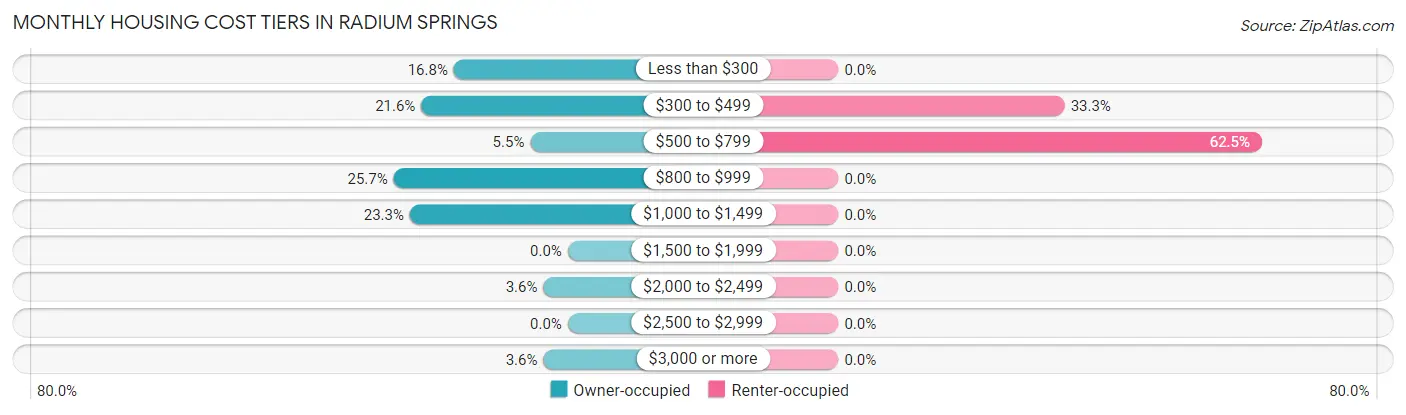
| Monthly Cost | Owner-occupied | Renter-occupied |
| Less than $300 | 70 (16.8%) | 0 (0.0%) |
| $300 to $499 | 90 (21.6%) | 32 (33.3%) |
| $500 to $799 | 23 (5.5%) | 60 (62.5%) |
| $800 to $999 | 107 (25.7%) | 0 (0.0%) |
| $1,000 to $1,499 | 97 (23.3%) | 0 (0.0%) |
| $1,500 to $1,999 | 0 (0.0%) | 0 (0.0%) |
| $2,000 to $2,499 | 15 (3.6%) | 0 (0.0%) |
| $2,500 to $2,999 | 0 (0.0%) | 0 (0.0%) |
| $3,000 or more | 15 (3.6%) | 0 (0.0%) |
| Total | 417 (100.0%) | 96 (100.0%) |
Physical Housing Characteristics in Radium Springs
Housing Structures in Radium Springs
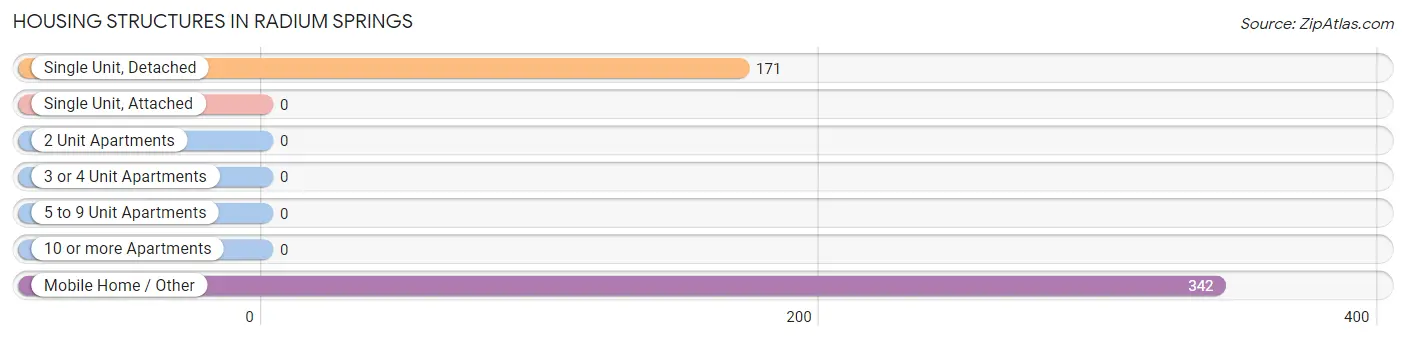
| Structure Type | # Housing Units | % Housing Units |
| Single Unit, Detached | 171 | 33.3% |
| Single Unit, Attached | 0 | 0.0% |
| 2 Unit Apartments | 0 | 0.0% |
| 3 or 4 Unit Apartments | 0 | 0.0% |
| 5 to 9 Unit Apartments | 0 | 0.0% |
| 10 or more Apartments | 0 | 0.0% |
| Mobile Home / Other | 342 | 66.7% |
| Total | 513 | 100.0% |
Housing Structures by Occupancy in Radium Springs
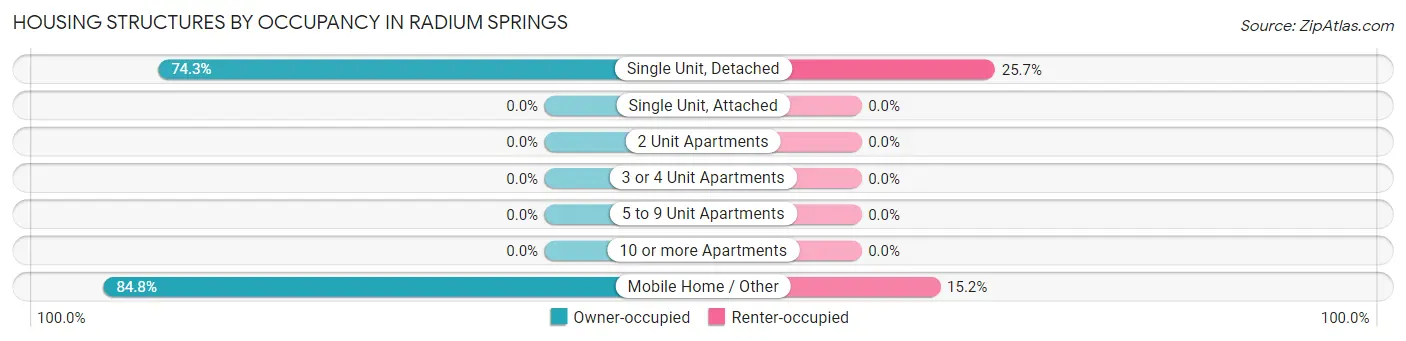
| Structure Type | Owner-occupied | Renter-occupied |
| Single Unit, Detached | 127 (74.3%) | 44 (25.7%) |
| Single Unit, Attached | 0 (0.0%) | 0 (0.0%) |
| 2 Unit Apartments | 0 (0.0%) | 0 (0.0%) |
| 3 or 4 Unit Apartments | 0 (0.0%) | 0 (0.0%) |
| 5 to 9 Unit Apartments | 0 (0.0%) | 0 (0.0%) |
| 10 or more Apartments | 0 (0.0%) | 0 (0.0%) |
| Mobile Home / Other | 290 (84.8%) | 52 (15.2%) |
| Total | 417 (81.3%) | 96 (18.7%) |
Housing Structures by Number of Rooms in Radium Springs
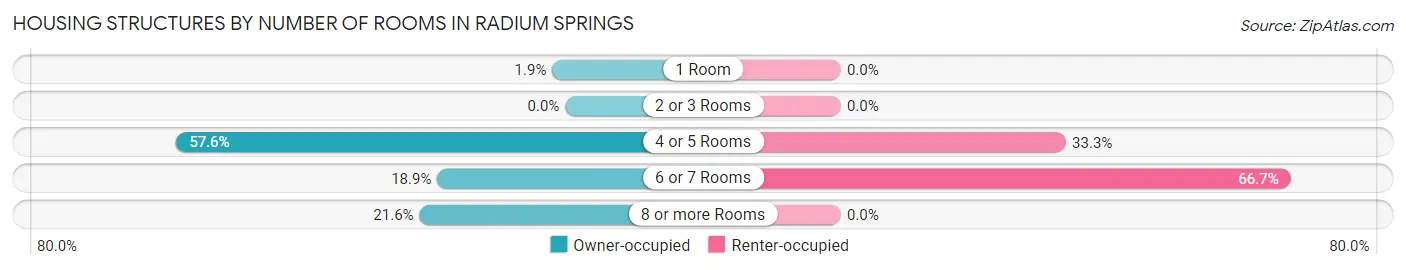
| Number of Rooms | Owner-occupied | Renter-occupied |
| 1 Room | 8 (1.9%) | 0 (0.0%) |
| 2 or 3 Rooms | 0 (0.0%) | 0 (0.0%) |
| 4 or 5 Rooms | 240 (57.6%) | 32 (33.3%) |
| 6 or 7 Rooms | 79 (18.9%) | 64 (66.7%) |
| 8 or more Rooms | 90 (21.6%) | 0 (0.0%) |
| Total | 417 (100.0%) | 96 (100.0%) |
Housing Structure by Heating Type in Radium Springs
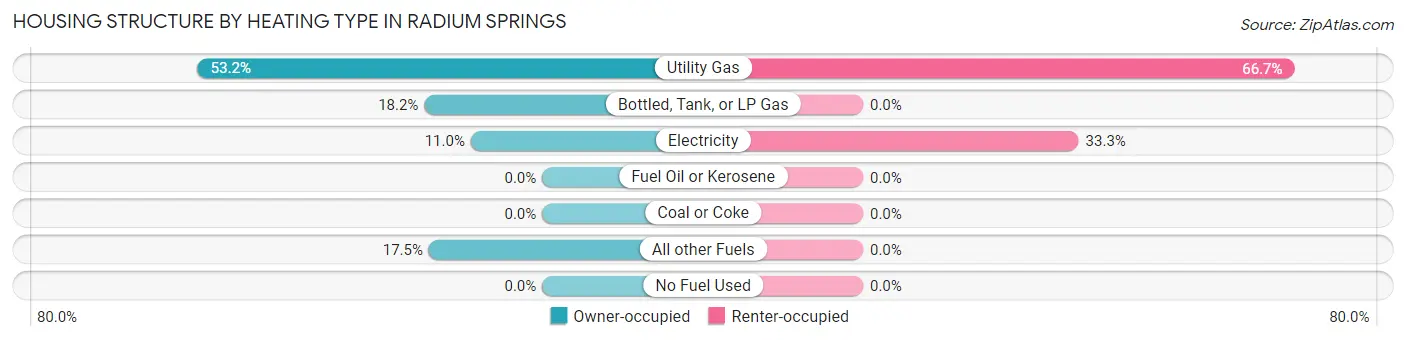
| Heating Type | Owner-occupied | Renter-occupied |
| Utility Gas | 222 (53.2%) | 64 (66.7%) |
| Bottled, Tank, or LP Gas | 76 (18.2%) | 0 (0.0%) |
| Electricity | 46 (11.0%) | 32 (33.3%) |
| Fuel Oil or Kerosene | 0 (0.0%) | 0 (0.0%) |
| Coal or Coke | 0 (0.0%) | 0 (0.0%) |
| All other Fuels | 73 (17.5%) | 0 (0.0%) |
| No Fuel Used | 0 (0.0%) | 0 (0.0%) |
| Total | 417 (100.0%) | 96 (100.0%) |
Household Vehicle Usage in Radium Springs
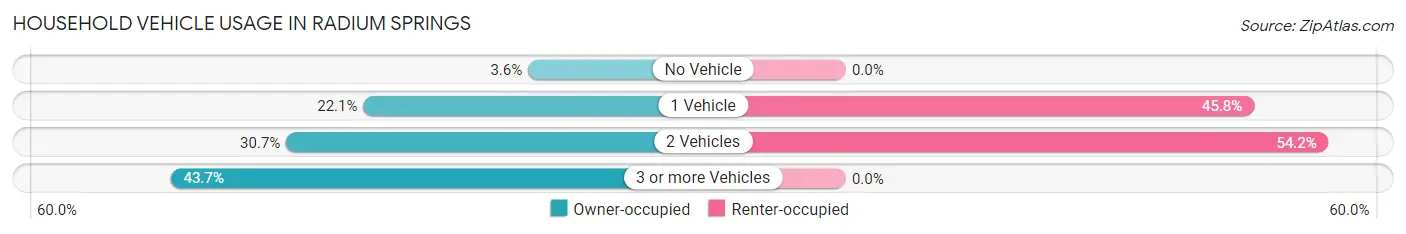
| Vehicles per Household | Owner-occupied | Renter-occupied |
| No Vehicle | 15 (3.6%) | 0 (0.0%) |
| 1 Vehicle | 92 (22.1%) | 44 (45.8%) |
| 2 Vehicles | 128 (30.7%) | 52 (54.2%) |
| 3 or more Vehicles | 182 (43.6%) | 0 (0.0%) |
| Total | 417 (100.0%) | 96 (100.0%) |
Real Estate & Mortgages in Radium Springs
Real Estate and Mortgage Overview in Radium Springs
| Characteristic | Without Mortgage | With Mortgage |
| Housing Units | 166 | 251 |
| Median Property Value | $48,800 | $123,000 |
| Median Household Income | $50,652 | $34 |
| Monthly Housing Costs | $323 | $15 |
| Real Estate Taxes | $611 | $19 |
Property Value by Mortgage Status in Radium Springs
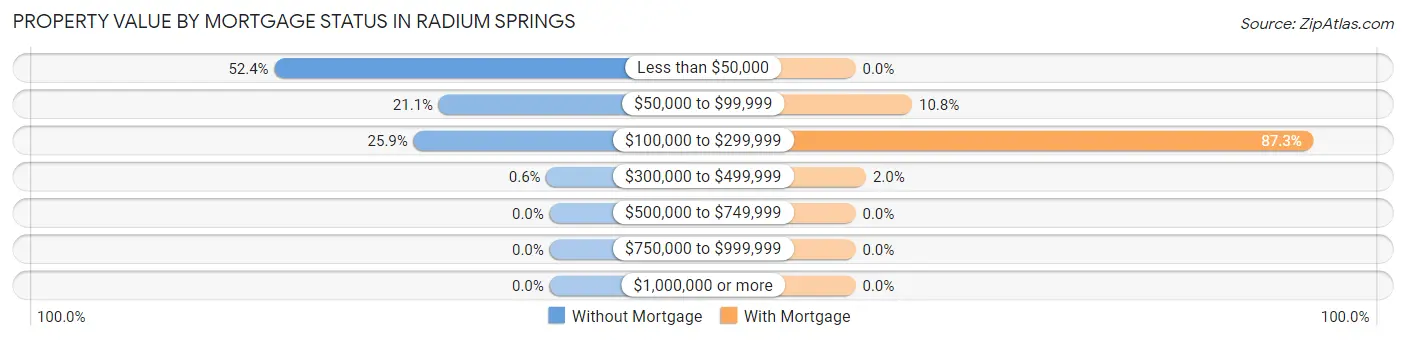
| Property Value | Without Mortgage | With Mortgage |
| Less than $50,000 | 87 (52.4%) | 0 (0.0%) |
| $50,000 to $99,999 | 35 (21.1%) | 27 (10.8%) |
| $100,000 to $299,999 | 43 (25.9%) | 219 (87.3%) |
| $300,000 to $499,999 | 1 (0.6%) | 5 (2.0%) |
| $500,000 to $749,999 | 0 (0.0%) | 0 (0.0%) |
| $750,000 to $999,999 | 0 (0.0%) | 0 (0.0%) |
| $1,000,000 or more | 0 (0.0%) | 0 (0.0%) |
| Total | 166 (100.0%) | 251 (100.0%) |
Household Income by Mortgage Status in Radium Springs
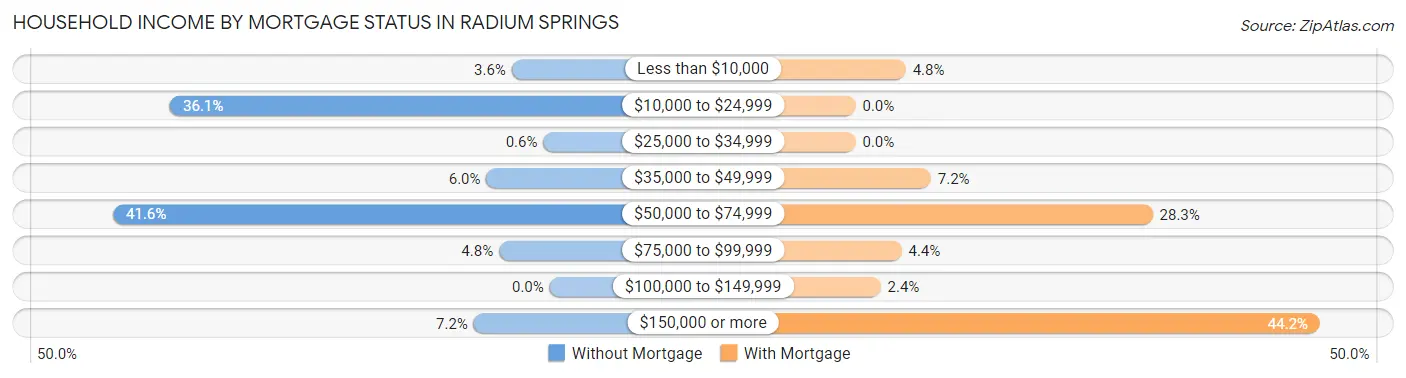
| Household Income | Without Mortgage | With Mortgage |
| Less than $10,000 | 6 (3.6%) | 12 (4.8%) |
| $10,000 to $24,999 | 60 (36.1%) | 0 (0.0%) |
| $25,000 to $34,999 | 1 (0.6%) | 0 (0.0%) |
| $35,000 to $49,999 | 10 (6.0%) | 18 (7.2%) |
| $50,000 to $74,999 | 69 (41.6%) | 71 (28.3%) |
| $75,000 to $99,999 | 8 (4.8%) | 11 (4.4%) |
| $100,000 to $149,999 | 0 (0.0%) | 6 (2.4%) |
| $150,000 or more | 12 (7.2%) | 111 (44.2%) |
| Total | 166 (100.0%) | 251 (100.0%) |
Property Value to Household Income Ratio in Radium Springs
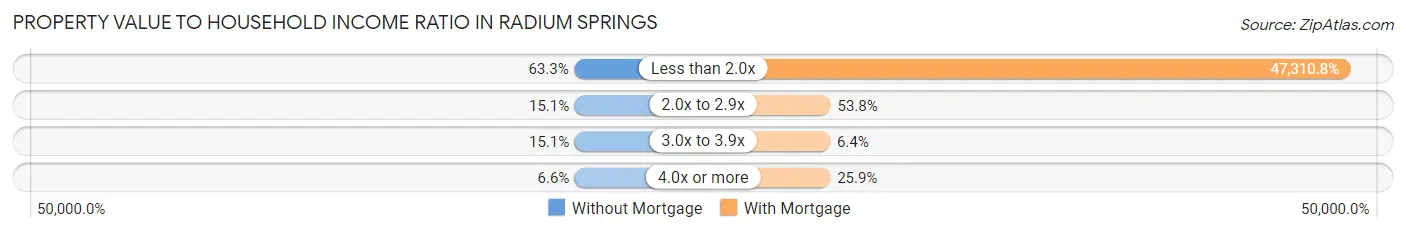
| Value-to-Income Ratio | Without Mortgage | With Mortgage |
| Less than 2.0x | 105 (63.2%) | 118,750 (47,310.8%) |
| 2.0x to 2.9x | 25 (15.1%) | 135 (53.8%) |
| 3.0x to 3.9x | 25 (15.1%) | 16 (6.4%) |
| 4.0x or more | 11 (6.6%) | 65 (25.9%) |
| Total | 166 (100.0%) | 251 (100.0%) |
Real Estate Taxes by Mortgage Status in Radium Springs
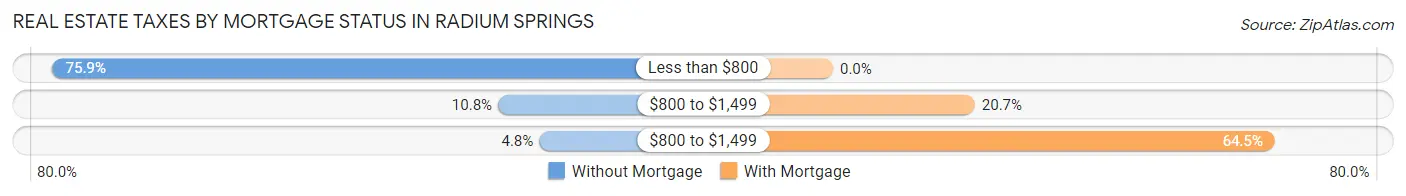
| Property Taxes | Without Mortgage | With Mortgage |
| Less than $800 | 126 (75.9%) | 0 (0.0%) |
| $800 to $1,499 | 18 (10.8%) | 52 (20.7%) |
| $800 to $1,499 | 8 (4.8%) | 162 (64.5%) |
| Total | 166 (100.0%) | 251 (100.0%) |
Health & Disability in Radium Springs
Health Insurance Coverage by Age in Radium Springs
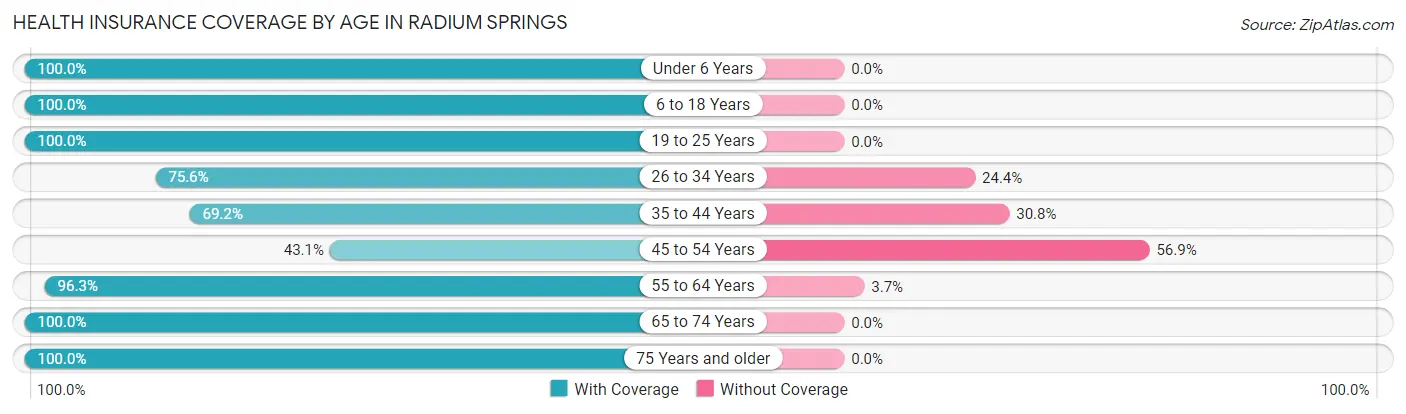
| Age Bracket | With Coverage | Without Coverage |
| Under 6 Years | 77 (100.0%) | 0 (0.0%) |
| 6 to 18 Years | 458 (100.0%) | 0 (0.0%) |
| 19 to 25 Years | 68 (100.0%) | 0 (0.0%) |
| 26 to 34 Years | 248 (75.6%) | 80 (24.4%) |
| 35 to 44 Years | 72 (69.2%) | 32 (30.8%) |
| 45 to 54 Years | 78 (43.1%) | 103 (56.9%) |
| 55 to 64 Years | 103 (96.3%) | 4 (3.7%) |
| 65 to 74 Years | 241 (100.0%) | 0 (0.0%) |
| 75 Years and older | 93 (100.0%) | 0 (0.0%) |
| Total | 1,438 (86.8%) | 219 (13.2%) |
Health Insurance Coverage by Citizenship Status in Radium Springs
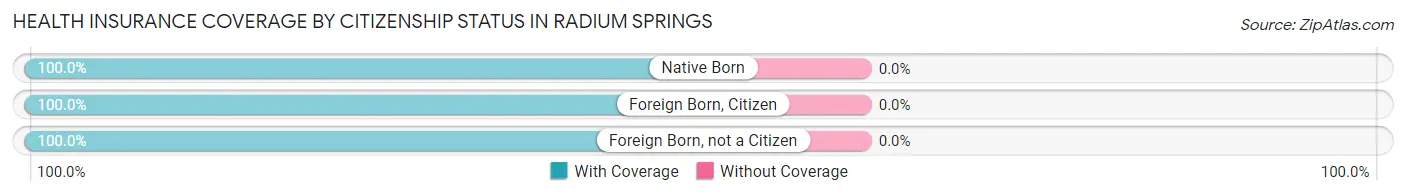
| Citizenship Status | With Coverage | Without Coverage |
| Native Born | 77 (100.0%) | 0 (0.0%) |
| Foreign Born, Citizen | 458 (100.0%) | 0 (0.0%) |
| Foreign Born, not a Citizen | 68 (100.0%) | 0 (0.0%) |
Health Insurance Coverage by Household Income in Radium Springs
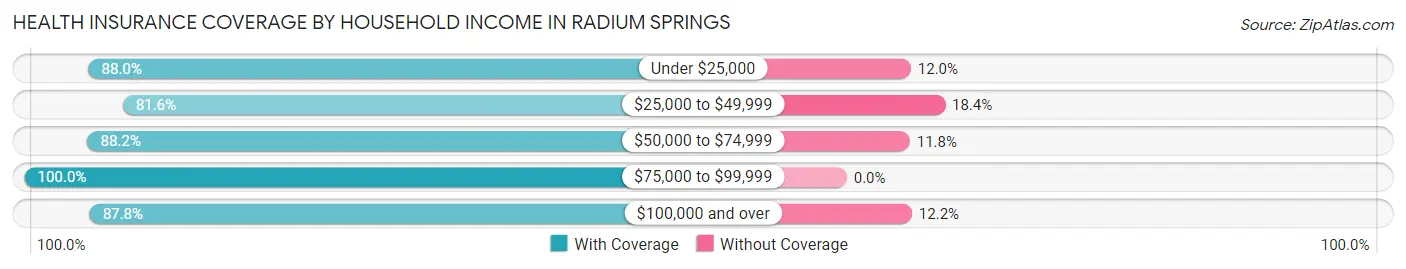
| Household Income | With Coverage | Without Coverage |
| Under $25,000 | 264 (88.0%) | 36 (12.0%) |
| $25,000 to $49,999 | 297 (81.6%) | 67 (18.4%) |
| $50,000 to $74,999 | 157 (88.2%) | 21 (11.8%) |
| $75,000 to $99,999 | 36 (100.0%) | 0 (0.0%) |
| $100,000 and over | 684 (87.8%) | 95 (12.2%) |
Public vs Private Health Insurance Coverage by Age in Radium Springs
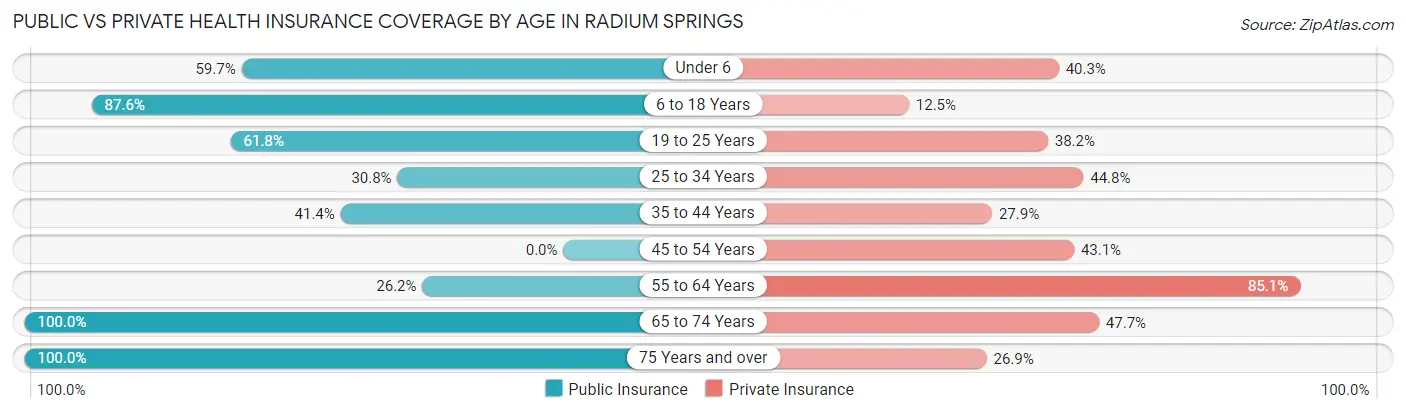
| Age Bracket | Public Insurance | Private Insurance |
| Under 6 | 46 (59.7%) | 31 (40.3%) |
| 6 to 18 Years | 401 (87.5%) | 57 (12.4%) |
| 19 to 25 Years | 42 (61.8%) | 26 (38.2%) |
| 25 to 34 Years | 101 (30.8%) | 147 (44.8%) |
| 35 to 44 Years | 43 (41.3%) | 29 (27.9%) |
| 45 to 54 Years | 0 (0.0%) | 78 (43.1%) |
| 55 to 64 Years | 28 (26.2%) | 91 (85.1%) |
| 65 to 74 Years | 241 (100.0%) | 115 (47.7%) |
| 75 Years and over | 93 (100.0%) | 25 (26.9%) |
| Total | 995 (60.1%) | 599 (36.1%) |
Disability Status by Sex by Age in Radium Springs
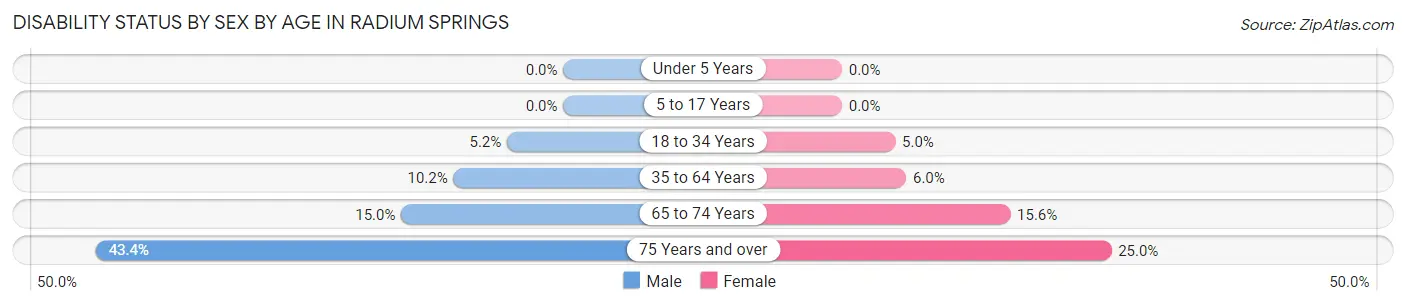
| Age Bracket | Male | Female |
| Under 5 Years | 0 (0.0%) | 0 (0.0%) |
| 5 to 17 Years | 0 (0.0%) | 0 (0.0%) |
| 18 to 34 Years | 14 (5.2%) | 11 (5.0%) |
| 35 to 64 Years | 16 (10.2%) | 14 (6.0%) |
| 65 to 74 Years | 17 (15.0%) | 20 (15.6%) |
| 75 Years and over | 23 (43.4%) | 10 (25.0%) |
Disability Class by Sex by Age in Radium Springs
Disability Class: Hearing Difficulty
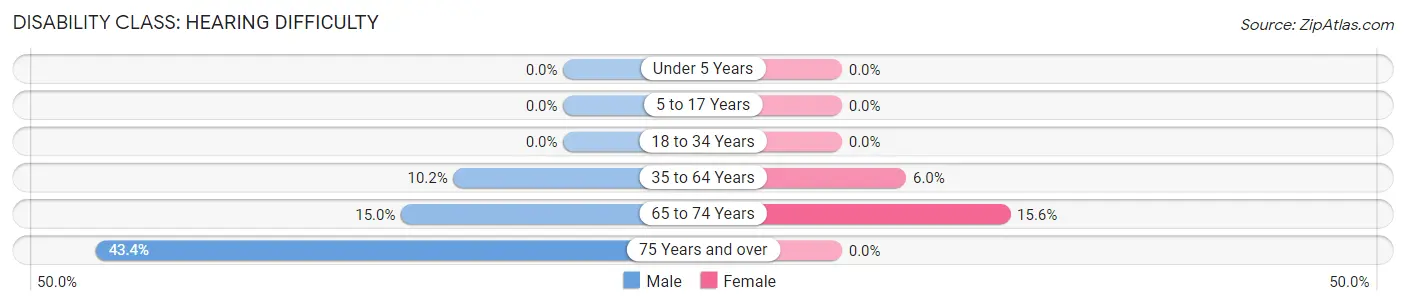
| Age Bracket | Male | Female |
| Under 5 Years | 0 (0.0%) | 0 (0.0%) |
| 5 to 17 Years | 0 (0.0%) | 0 (0.0%) |
| 18 to 34 Years | 0 (0.0%) | 0 (0.0%) |
| 35 to 64 Years | 16 (10.2%) | 14 (6.0%) |
| 65 to 74 Years | 17 (15.0%) | 20 (15.6%) |
| 75 Years and over | 23 (43.4%) | 0 (0.0%) |
Disability Class: Vision Difficulty
| Age Bracket | Male | Female |
| Under 5 Years | 0 (0.0%) | 0 (0.0%) |
| 5 to 17 Years | 0 (0.0%) | 0 (0.0%) |
| 18 to 34 Years | 0 (0.0%) | 0 (0.0%) |
| 35 to 64 Years | 0 (0.0%) | 0 (0.0%) |
| 65 to 74 Years | 0 (0.0%) | 0 (0.0%) |
| 75 Years and over | 0 (0.0%) | 0 (0.0%) |
Disability Class: Cognitive Difficulty
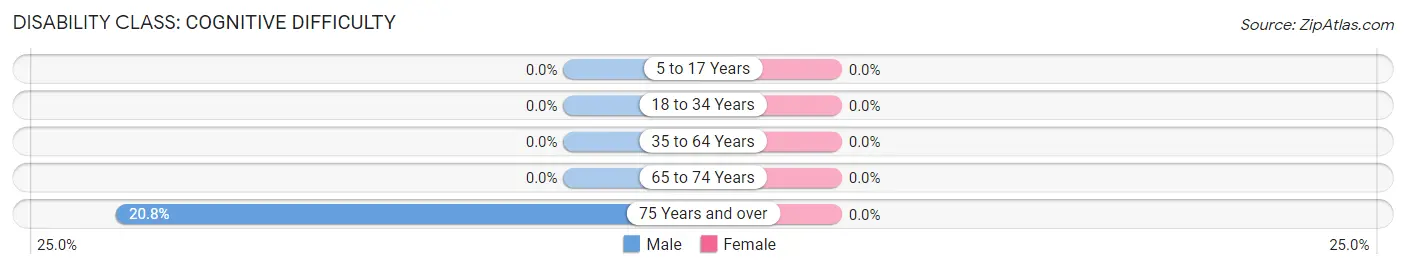
| Age Bracket | Male | Female |
| 5 to 17 Years | 0 (0.0%) | 0 (0.0%) |
| 18 to 34 Years | 0 (0.0%) | 0 (0.0%) |
| 35 to 64 Years | 0 (0.0%) | 0 (0.0%) |
| 65 to 74 Years | 0 (0.0%) | 0 (0.0%) |
| 75 Years and over | 11 (20.7%) | 0 (0.0%) |
Disability Class: Ambulatory Difficulty
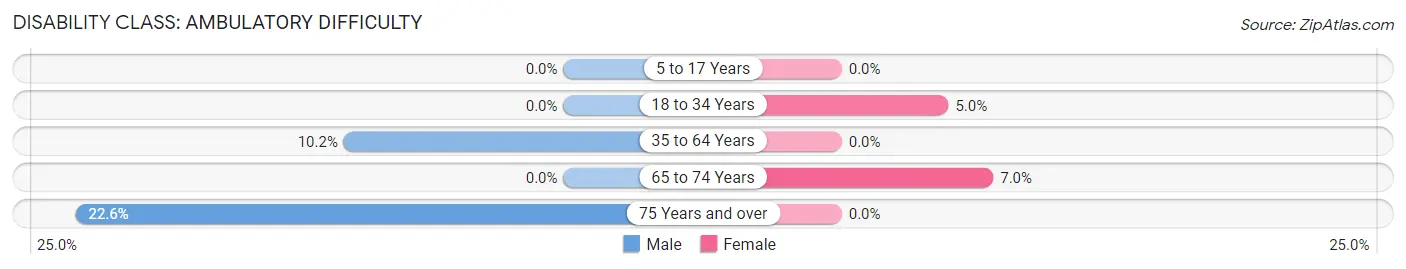
| Age Bracket | Male | Female |
| 5 to 17 Years | 0 (0.0%) | 0 (0.0%) |
| 18 to 34 Years | 0 (0.0%) | 11 (5.0%) |
| 35 to 64 Years | 16 (10.2%) | 0 (0.0%) |
| 65 to 74 Years | 0 (0.0%) | 9 (7.0%) |
| 75 Years and over | 12 (22.6%) | 0 (0.0%) |
Disability Class: Self-Care Difficulty
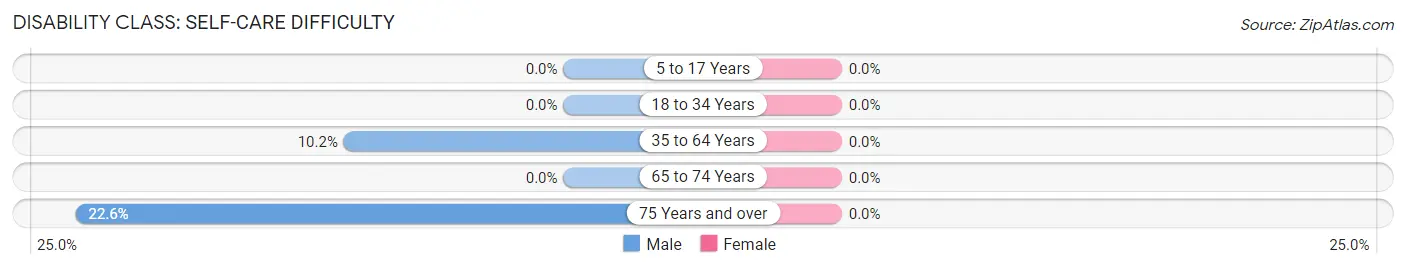
| Age Bracket | Male | Female |
| 5 to 17 Years | 0 (0.0%) | 0 (0.0%) |
| 18 to 34 Years | 0 (0.0%) | 0 (0.0%) |
| 35 to 64 Years | 16 (10.2%) | 0 (0.0%) |
| 65 to 74 Years | 0 (0.0%) | 0 (0.0%) |
| 75 Years and over | 12 (22.6%) | 0 (0.0%) |
Technology Access in Radium Springs
Computing Device Access in Radium Springs
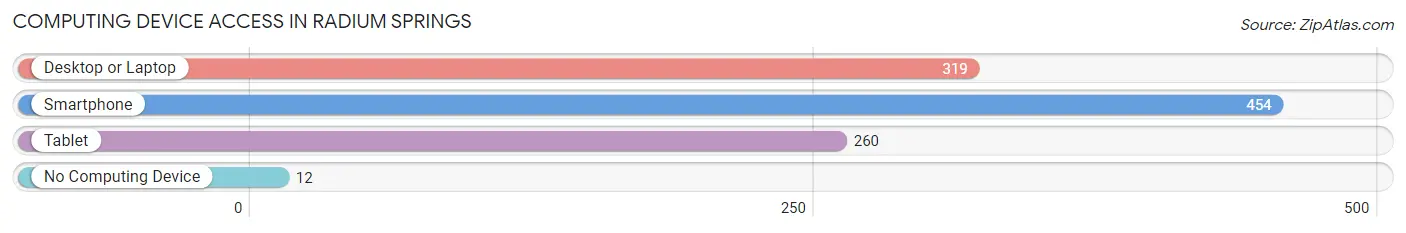
| Device Type | # Households | % Households |
| Desktop or Laptop | 319 | 62.2% |
| Smartphone | 454 | 88.5% |
| Tablet | 260 | 50.7% |
| No Computing Device | 12 | 2.3% |
| Total | 513 | 100.0% |
Internet Access in Radium Springs
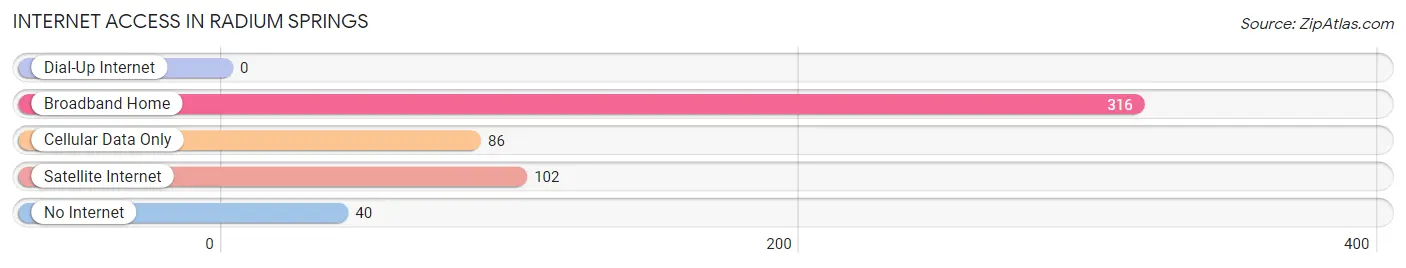
| Internet Type | # Households | % Households |
| Dial-Up Internet | 0 | 0.0% |
| Broadband Home | 316 | 61.6% |
| Cellular Data Only | 86 | 16.8% |
| Satellite Internet | 102 | 19.9% |
| No Internet | 40 | 7.8% |
| Total | 513 | 100.0% |
Radium Springs Summary
Radium Springs is a small unincorporated community located in Doña Ana County, New Mexico. It is situated along the Rio Grande, approximately 15 miles south of Las Cruces. The community is named after the nearby hot springs, which were discovered in the late 19th century and believed to have healing properties.
History
Radium Springs was first settled in the late 19th century by a group of settlers from El Paso, Texas. The settlers were drawn to the area by the hot springs, which were believed to have healing properties. The settlers built a small settlement around the springs, and the area soon became known as Radium Springs.
In the early 20th century, the area began to attract tourists who were drawn to the hot springs. The area was also home to a number of businesses, including a hotel, a general store, and a post office.
In the 1950s, the area began to decline as the hot springs lost their popularity. The businesses closed and the population dwindled. In the late 1970s, the area was revitalized when the New Mexico State University opened a research station in the area.
Geography
Radium Springs is located in Doña Ana County, New Mexico. It is situated along the Rio Grande, approximately 15 miles south of Las Cruces. The area is mostly flat, with some rolling hills. The climate is arid, with hot summers and mild winters.
Economy
Radium Springs is a small, rural community with a limited economy. The main sources of employment are agriculture and tourism. The area is home to a number of farms, which produce a variety of crops, including cotton, alfalfa, and pecans. The area is also home to a number of tourist attractions, including the hot springs, the Rio Grande, and the nearby Organ Mountains.
Demographics
As of the 2010 census, the population of Radium Springs was 1,845. The racial makeup of the town was 75.3% White, 0.7% African American, 0.9% Native American, 0.2% Asian, 0.1% Pacific Islander, and 22.8% from other races. Hispanic or Latino of any race were 57.2% of the population.
The median household income in Radium Springs was $25,938, and the median family income was $30,938. The per capita income was $13,938. About 24.3% of families and 28.2% of the population were below the poverty line, including 37.2% of those under age 18 and 16.2% of those age 65 or over.
Common Questions
What is Per Capita Income in Radium Springs?
Per Capita income in Radium Springs is $25,377.
What is the Median Family Income in Radium Springs?
Median Family Income in Radium Springs is $39,914.
What is the Median Household income in Radium Springs?
Median Household Income in Radium Springs is $41,750.
What is Income or Wage Gap in Radium Springs?
Income or Wage Gap in Radium Springs is 54.1%.
Women in Radium Springs earn 45.9 cents for every dollar earned by a man.
What is Inequality or Gini Index in Radium Springs?
Inequality or Gini Index in Radium Springs is 0.47.
What is the Total Population of Radium Springs?
Total Population of Radium Springs is 1,657.
What is the Total Male Population of Radium Springs?
Total Male Population of Radium Springs is 828.
What is the Total Female Population of Radium Springs?
Total Female Population of Radium Springs is 829.
What is the Ratio of Males per 100 Females in Radium Springs?
There are 99.88 Males per 100 Females in Radium Springs.
What is the Ratio of Females per 100 Males in Radium Springs?
There are 100.12 Females per 100 Males in Radium Springs.
What is the Median Population Age in Radium Springs?
Median Population Age in Radium Springs is 32.1 Years.
What is the Average Family Size in Radium Springs
Average Family Size in Radium Springs is 3.5 People.
What is the Average Household Size in Radium Springs
Average Household Size in Radium Springs is 3.2 People.
How Large is the Labor Force in Radium Springs?
There are 647 People in the Labor Forcein in Radium Springs.
What is the Percentage of People in the Labor Force in Radium Springs?
49.4% of People are in the Labor Force in Radium Springs.
What is the Unemployment Rate in Radium Springs?
Unemployment Rate in Radium Springs is 13.9%.