Portales, NM Map & Demographics
Portales Map
Portales Overview
$22,236
PER CAPITA INCOME
$67,600
AVG FAMILY INCOME
$49,313
AVG HOUSEHOLD INCOME
40.8%
WAGE / INCOME GAP [ % ]
59.2¢/ $1
WAGE / INCOME GAP [ $ ]
$13,066
FAMILY INCOME DEFICIT
0.43
INEQUALITY / GINI INDEX
12,085
TOTAL POPULATION
5,752
MALE POPULATION
6,333
FEMALE POPULATION
90.83
MALES / 100 FEMALES
110.10
FEMALES / 100 MALES
27.1
MEDIAN AGE
3.5
AVG FAMILY SIZE
2.6
AVG HOUSEHOLD SIZE
5,967
LABOR FORCE [ PEOPLE ]
64.2%
PERCENT IN LABOR FORCE
9.5%
UNEMPLOYMENT RATE
Portales Zip Codes
Income in Portales
Income Overview in Portales
Per Capita Income in Portales is $22,236, while median incomes of families and households are $67,600 and $49,313 respectively.
| Characteristic | Number | Measure |
| Per Capita Income | 12,085 | $22,236 |
| Median Family Income | 2,298 | $67,600 |
| Mean Family Income | 2,298 | $79,997 |
| Median Household Income | 4,285 | $49,313 |
| Mean Household Income | 4,285 | $61,814 |
| Income Deficit | 2,298 | $13,066 |
| Wage / Income Gap (%) | 12,085 | 40.76% |
| Wage / Income Gap ($) | 12,085 | 59.24¢ per $1 |
| Gini / Inequality Index | 12,085 | 0.43 |
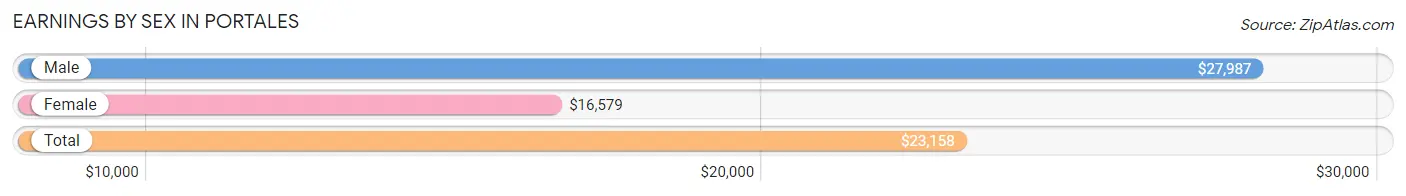
Earnings by Sex in Portales
Average Earnings in Portales are $23,158, $27,987 for men and $16,579 for women, a difference of 40.8%.
| Sex | Number | Average Earnings |
| Male | 3,363 (51.6%) | $27,987 |
| Female | 3,156 (48.4%) | $16,579 |
| Total | 6,519 (100.0%) | $23,158 |
Earnings by Sex by Income Bracket in Portales
The most common earnings brackets in Portales are $25,000 to $29,999 for men (370 | 11.0%) and $15,000 to $17,499 for women (445 | 14.1%).
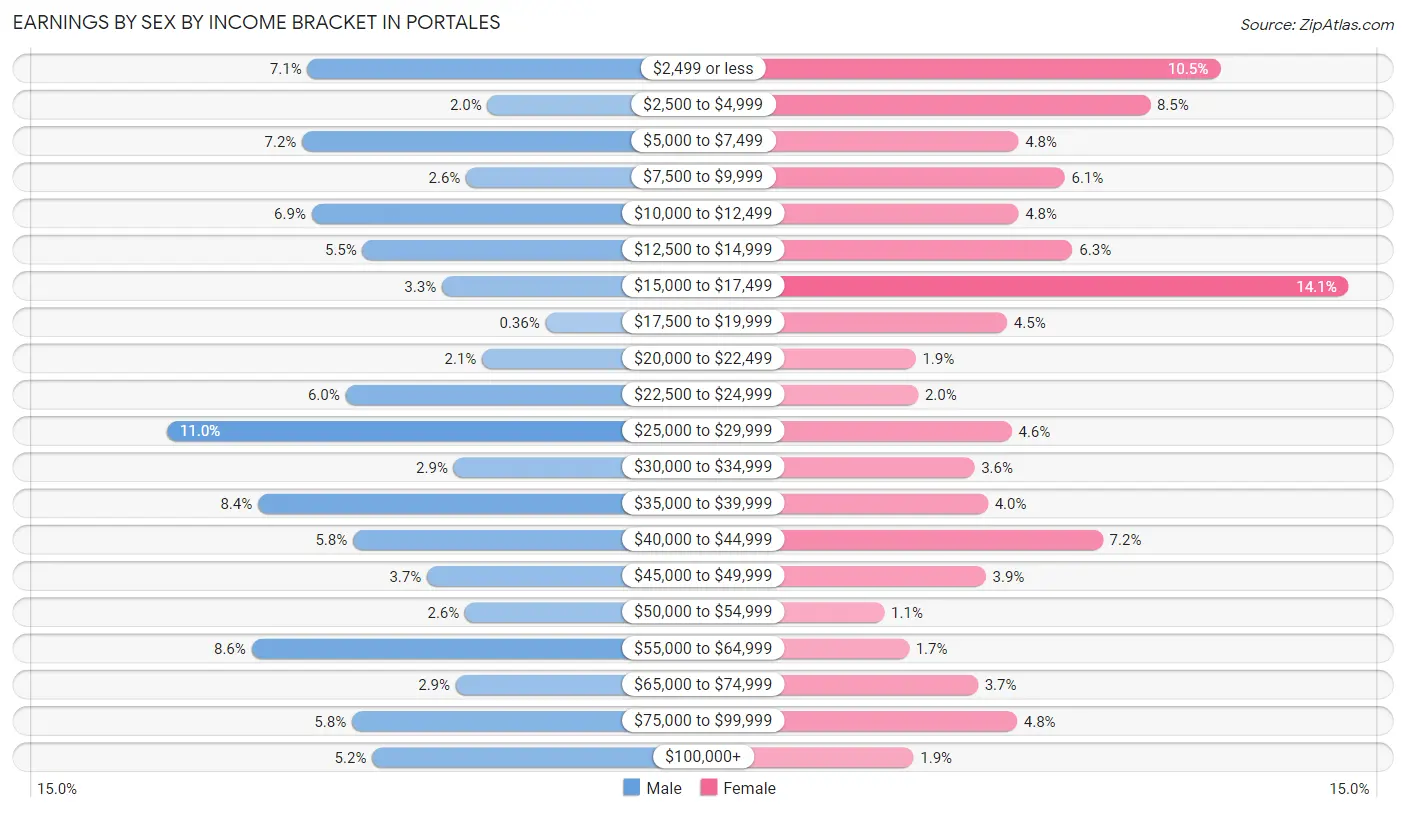
| Income | Male | Female |
| $2,499 or less | 237 (7.0%) | 331 (10.5%) |
| $2,500 to $4,999 | 67 (2.0%) | 269 (8.5%) |
| $5,000 to $7,499 | 242 (7.2%) | 152 (4.8%) |
| $7,500 to $9,999 | 87 (2.6%) | 193 (6.1%) |
| $10,000 to $12,499 | 233 (6.9%) | 152 (4.8%) |
| $12,500 to $14,999 | 185 (5.5%) | 200 (6.3%) |
| $15,000 to $17,499 | 110 (3.3%) | 445 (14.1%) |
| $17,500 to $19,999 | 12 (0.4%) | 142 (4.5%) |
| $20,000 to $22,499 | 72 (2.1%) | 61 (1.9%) |
| $22,500 to $24,999 | 201 (6.0%) | 63 (2.0%) |
| $25,000 to $29,999 | 370 (11.0%) | 146 (4.6%) |
| $30,000 to $34,999 | 99 (2.9%) | 113 (3.6%) |
| $35,000 to $39,999 | 284 (8.4%) | 125 (4.0%) |
| $40,000 to $44,999 | 194 (5.8%) | 227 (7.2%) |
| $45,000 to $49,999 | 124 (3.7%) | 123 (3.9%) |
| $50,000 to $54,999 | 88 (2.6%) | 33 (1.1%) |
| $55,000 to $64,999 | 290 (8.6%) | 55 (1.7%) |
| $65,000 to $74,999 | 97 (2.9%) | 116 (3.7%) |
| $75,000 to $99,999 | 195 (5.8%) | 151 (4.8%) |
| $100,000+ | 176 (5.2%) | 59 (1.9%) |
| Total | 3,363 (100.0%) | 3,156 (100.0%) |
Earnings by Sex by Educational Attainment in Portales
Average earnings in Portales are $39,277 for men and $25,531 for women, a difference of 35.0%. Men with an educational attainment of high school diploma enjoy the highest average annual earnings of $44,931, while those with college or associate's degree education earn the least with $38,539. Women with an educational attainment of graduate degree earn the most with the average annual earnings of $50,060, while those with college or associate's degree education have the smallest earnings of $20,991.
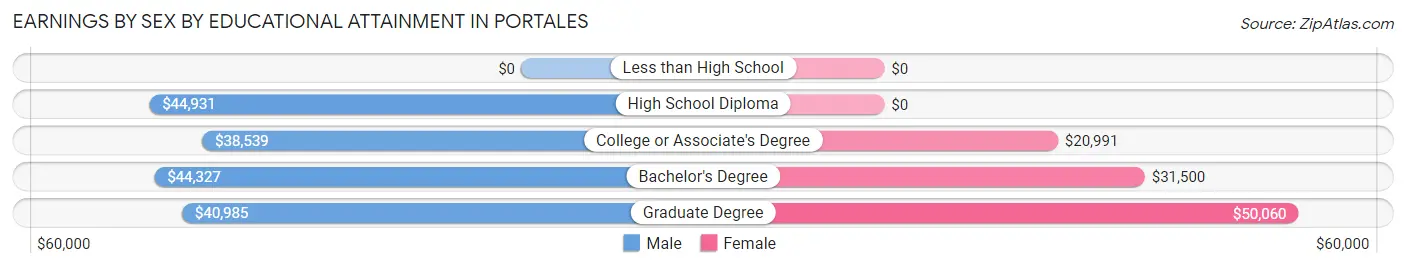
| Educational Attainment | Male Income | Female Income |
| Less than High School | - | - |
| High School Diploma | $44,931 | $0 |
| College or Associate's Degree | $38,539 | $20,991 |
| Bachelor's Degree | $44,327 | $31,500 |
| Graduate Degree | $40,985 | $50,060 |
| Total | $39,277 | $25,531 |
Family Income in Portales
Family Income Brackets in Portales
According to the Portales family income data, there are 476 families falling into the $50,000 to $74,999 income range, which is the most common income bracket and makes up 20.7% of all families. Conversely, the $200,000+ income bracket is the least frequent group with only 21 families (0.9%) belonging to this category.
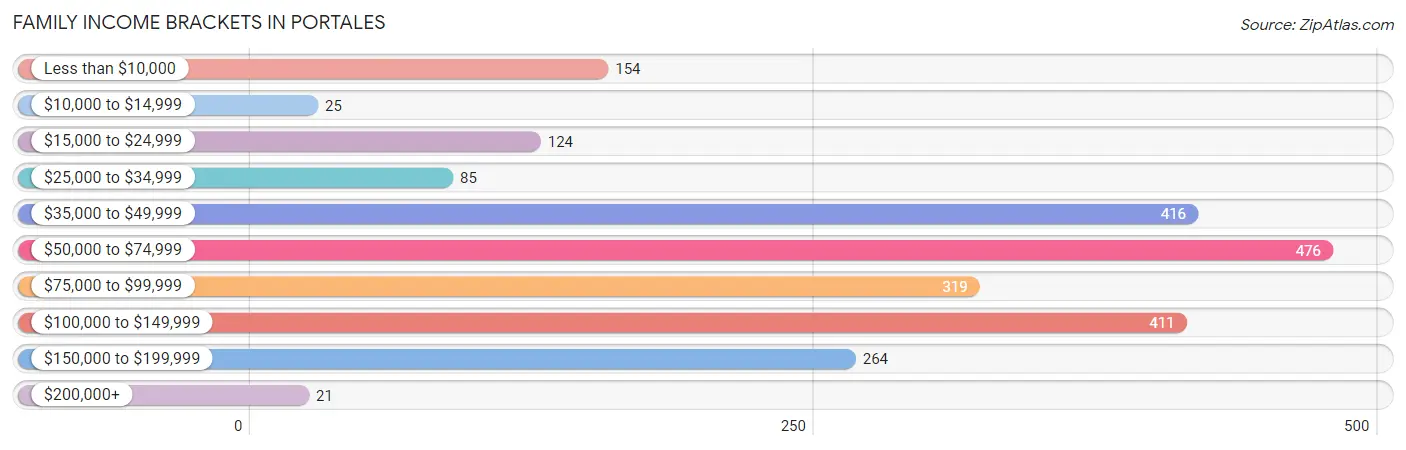
| Income Bracket | # Families | % Families |
| Less than $10,000 | 154 | 6.7% |
| $10,000 to $14,999 | 25 | 1.1% |
| $15,000 to $24,999 | 124 | 5.4% |
| $25,000 to $34,999 | 85 | 3.7% |
| $35,000 to $49,999 | 416 | 18.1% |
| $50,000 to $74,999 | 476 | 20.7% |
| $75,000 to $99,999 | 319 | 13.9% |
| $100,000 to $149,999 | 411 | 17.9% |
| $150,000 to $199,999 | 264 | 11.5% |
| $200,000+ | 21 | 0.9% |
Family Income by Famaliy Size in Portales
5-person families (487 | 21.2%) account for the highest median family income in Portales with $117,813 per family, while 2-person families (918 | 40.0%) have the highest median income of $31,280 per family member.
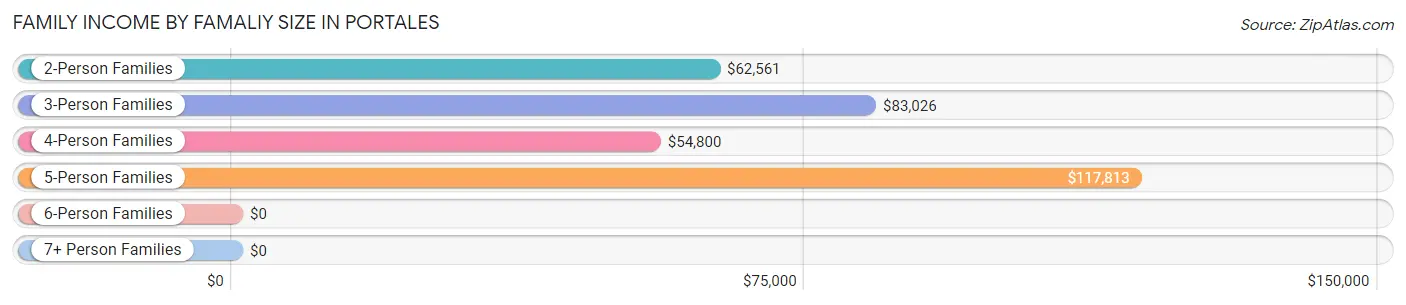
| Income Bracket | # Families | Median Income |
| 2-Person Families | 918 (40.0%) | $62,561 |
| 3-Person Families | 448 (19.5%) | $83,026 |
| 4-Person Families | 326 (14.2%) | $54,800 |
| 5-Person Families | 487 (21.2%) | $117,813 |
| 6-Person Families | 52 (2.3%) | $0 |
| 7+ Person Families | 67 (2.9%) | $0 |
| Total | 2,298 (100.0%) | $67,600 |
Family Income by Number of Earners in Portales
The median family income in Portales is $67,600, with families comprising 3+ earners (239) having the highest median family income of $132,250, while families with no earners (349) have the lowest median family income of $34,632, accounting for 10.4% and 15.2% of families, respectively.
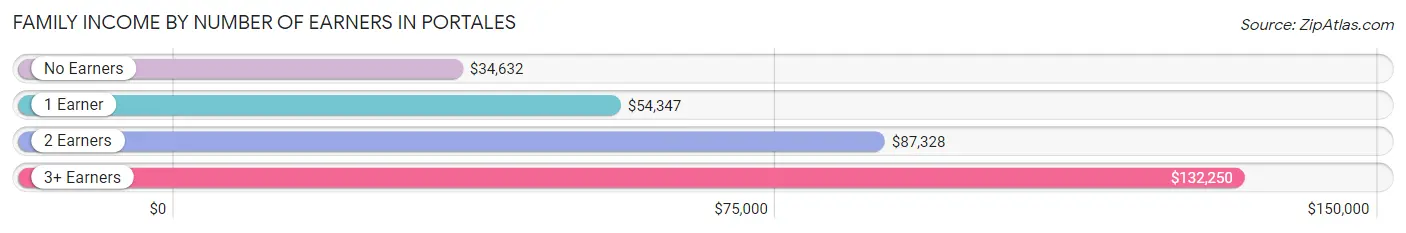
| Number of Earners | # Families | Median Income |
| No Earners | 349 (15.2%) | $34,632 |
| 1 Earner | 817 (35.5%) | $54,347 |
| 2 Earners | 893 (38.9%) | $87,328 |
| 3+ Earners | 239 (10.4%) | $132,250 |
| Total | 2,298 (100.0%) | $67,600 |
Household Income in Portales
Household Income Brackets in Portales
With 784 households falling in the category, the $50,000 to $74,999 income range is the most frequent in Portales, accounting for 18.3% of all households. In contrast, only 39 households (0.9%) fall into the $200,000+ income bracket, making it the least populous group.
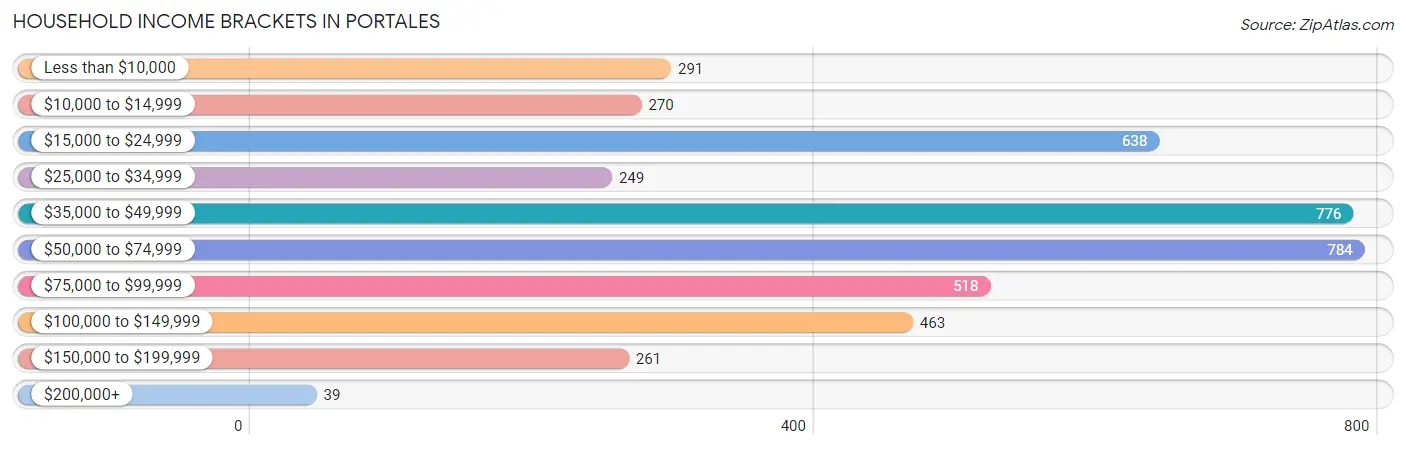
| Income Bracket | # Households | % Households |
| Less than $10,000 | 291 | 6.8% |
| $10,000 to $14,999 | 270 | 6.3% |
| $15,000 to $24,999 | 638 | 14.9% |
| $25,000 to $34,999 | 249 | 5.8% |
| $35,000 to $49,999 | 776 | 18.1% |
| $50,000 to $74,999 | 784 | 18.3% |
| $75,000 to $99,999 | 518 | 12.1% |
| $100,000 to $149,999 | 463 | 10.8% |
| $150,000 to $199,999 | 261 | 6.1% |
| $200,000+ | 39 | 0.9% |
Household Income by Householder Age in Portales
The median household income in Portales is $49,313, with the highest median household income of $56,507 found in the 25 to 44 years age bracket for the primary householder. A total of 1,673 households (39.0%) fall into this category. Meanwhile, the 15 to 24 years age bracket for the primary householder has the lowest median household income of $0, with 602 households (14.1%) in this group.
| Income Bracket | # Households | Median Income |
| 15 to 24 Years | 602 (14.1%) | $0 |
| 25 to 44 Years | 1,673 (39.0%) | $56,507 |
| 45 to 64 Years | 1,010 (23.6%) | $49,489 |
| 65+ Years | 1,000 (23.3%) | $44,868 |
| Total | 4,285 (100.0%) | $49,313 |
Poverty in Portales
Income Below Poverty by Sex and Age in Portales
With 19.0% poverty level for males and 23.2% for females among the residents of Portales, 5 year old males and 18 to 24 year old females are the most vulnerable to poverty, with 30 males (75.0%) and 415 females (49.5%) in their respective age groups living below the poverty level.
| Age Bracket | Male | Female |
| Under 5 Years | 92 (40.2%) | 12 (2.8%) |
| 5 Years | 30 (75.0%) | 16 (21.3%) |
| 6 to 11 Years | 141 (22.6%) | 129 (24.8%) |
| 12 to 14 Years | 38 (27.0%) | 47 (22.5%) |
| 15 Years | 6 (4.1%) | 55 (26.6%) |
| 16 and 17 Years | 57 (31.7%) | 15 (21.4%) |
| 18 to 24 Years | 286 (26.6%) | 415 (49.5%) |
| 25 to 34 Years | 17 (3.2%) | 149 (17.8%) |
| 35 to 44 Years | 160 (19.2%) | 174 (22.0%) |
| 45 to 54 Years | 16 (5.0%) | 29 (5.6%) |
| 55 to 64 Years | 13 (3.1%) | 124 (25.6%) |
| 65 to 74 Years | 69 (13.8%) | 54 (13.5%) |
| 75 Years and over | 70 (36.3%) | 114 (31.5%) |
| Total | 995 (19.0%) | 1,333 (23.2%) |
Income Above Poverty by Sex and Age in Portales
According to the poverty statistics in Portales, males aged 55 to 64 years and females aged under 5 years are the age groups that are most secure financially, with 96.9% of males and 97.2% of females in these age groups living above the poverty line.
| Age Bracket | Male | Female |
| Under 5 Years | 137 (59.8%) | 419 (97.2%) |
| 5 Years | 10 (25.0%) | 59 (78.7%) |
| 6 to 11 Years | 482 (77.4%) | 391 (75.2%) |
| 12 to 14 Years | 103 (73.1%) | 162 (77.5%) |
| 15 Years | 140 (95.9%) | 152 (73.4%) |
| 16 and 17 Years | 123 (68.3%) | 55 (78.6%) |
| 18 to 24 Years | 790 (73.4%) | 424 (50.5%) |
| 25 to 34 Years | 508 (96.8%) | 687 (82.2%) |
| 35 to 44 Years | 672 (80.8%) | 616 (78.0%) |
| 45 to 54 Years | 305 (95.0%) | 485 (94.4%) |
| 55 to 64 Years | 408 (96.9%) | 361 (74.4%) |
| 65 to 74 Years | 433 (86.3%) | 345 (86.5%) |
| 75 Years and over | 123 (63.7%) | 248 (68.5%) |
| Total | 4,234 (81.0%) | 4,404 (76.8%) |
Income Below Poverty Among Married-Couple Families in Portales
The poverty statistics for married-couple families in Portales show that 3.6% or 59 of the total 1,617 families live below the poverty line. Families with 5 or more children have the highest poverty rate of 100.0%, comprising of 23 families. On the other hand, families with 3 or 4 children have the lowest poverty rate of 0.0%, which includes 0 families.
| Children | Above Poverty | Below Poverty |
| No Children | 685 (97.9%) | 15 (2.1%) |
| 1 or 2 Children | 425 (95.3%) | 21 (4.7%) |
| 3 or 4 Children | 448 (100.0%) | 0 (0.0%) |
| 5 or more Children | 0 (0.0%) | 23 (100.0%) |
| Total | 1,558 (96.4%) | 59 (3.6%) |
Income Below Poverty Among Single-Parent Households in Portales
According to the poverty data in Portales, 34.9% or 60 single-father households and 42.2% or 215 single-mother households are living below the poverty line. Among single-father households, those with 3 or 4 children have the highest poverty rate, with 36 households (62.1%) experiencing poverty. Likewise, among single-mother households, those with 3 or 4 children have the highest poverty rate, with 88 households (100.0%) falling below the poverty line.
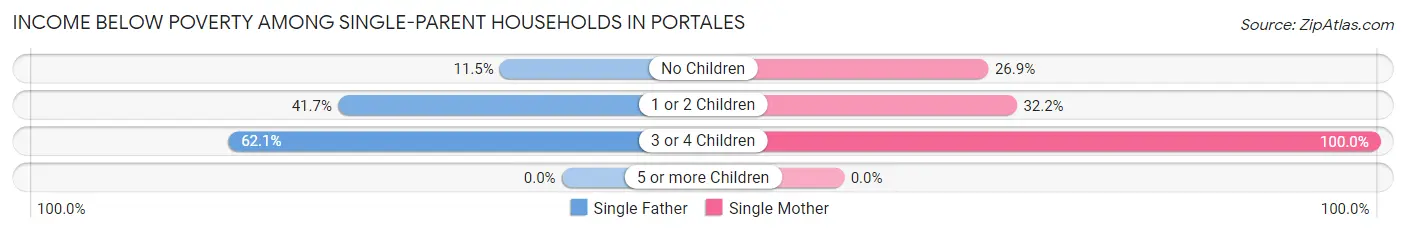
| Children | Single Father | Single Mother |
| No Children | 9 (11.5%) | 43 (26.9%) |
| 1 or 2 Children | 15 (41.7%) | 84 (32.2%) |
| 3 or 4 Children | 36 (62.1%) | 88 (100.0%) |
| 5 or more Children | 0 (0.0%) | 0 (0.0%) |
| Total | 60 (34.9%) | 215 (42.2%) |
Income Below Poverty Among Married-Couple vs Single-Parent Households in Portales
The poverty data for Portales shows that 59 of the married-couple family households (3.6%) and 275 of the single-parent households (40.4%) are living below the poverty level. Within the married-couple family households, those with 5 or more children have the highest poverty rate, with 23 households (100.0%) falling below the poverty line. Among the single-parent households, those with 3 or 4 children have the highest poverty rate, with 124 household (84.9%) living below poverty.
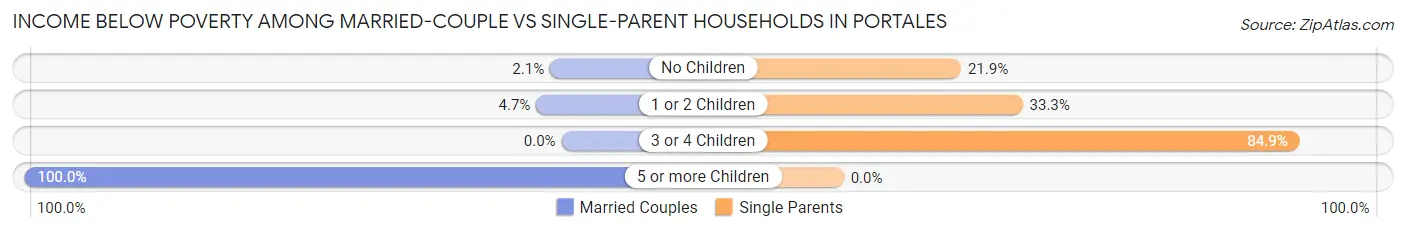
| Children | Married-Couple Families | Single-Parent Households |
| No Children | 15 (2.1%) | 52 (21.8%) |
| 1 or 2 Children | 21 (4.7%) | 99 (33.3%) |
| 3 or 4 Children | 0 (0.0%) | 124 (84.9%) |
| 5 or more Children | 23 (100.0%) | 0 (0.0%) |
| Total | 59 (3.6%) | 275 (40.4%) |
Race in Portales
The most populous races in Portales are White / Caucasian (8,441 | 69.9%), Hispanic or Latino (5,356 | 44.3%), and Some other Race (1,855 | 15.3%).
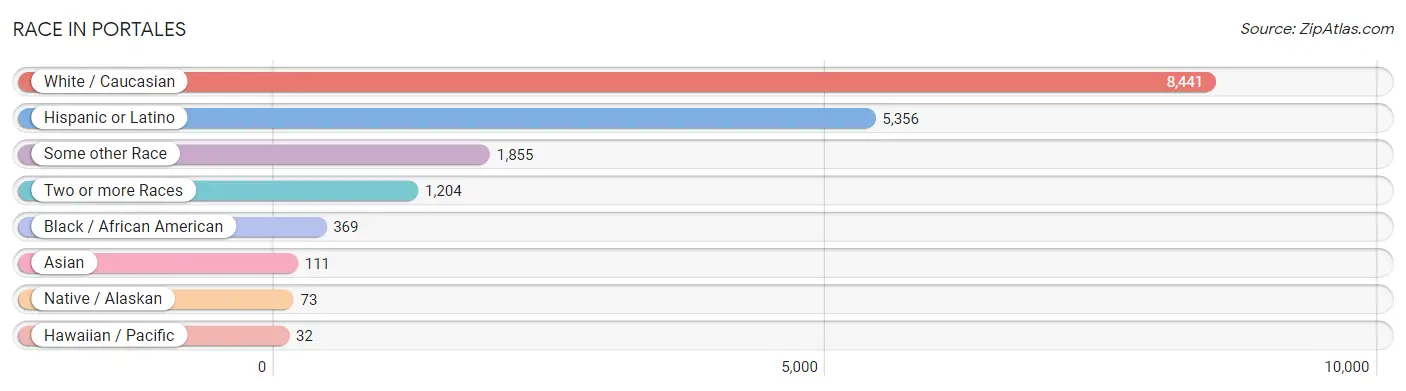
| Race | # Population | % Population |
| Asian | 111 | 0.9% |
| Black / African American | 369 | 3.0% |
| Hawaiian / Pacific | 32 | 0.3% |
| Hispanic or Latino | 5,356 | 44.3% |
| Native / Alaskan | 73 | 0.6% |
| White / Caucasian | 8,441 | 69.9% |
| Two or more Races | 1,204 | 10.0% |
| Some other Race | 1,855 | 15.3% |
| Total | 12,085 | 100.0% |
Ancestry in Portales
The most populous ancestries reported in Portales are Mexican (4,292 | 35.5%), German (1,280 | 10.6%), English (853 | 7.1%), Irish (823 | 6.8%), and American (634 | 5.2%), together accounting for 65.2% of all Portales residents.
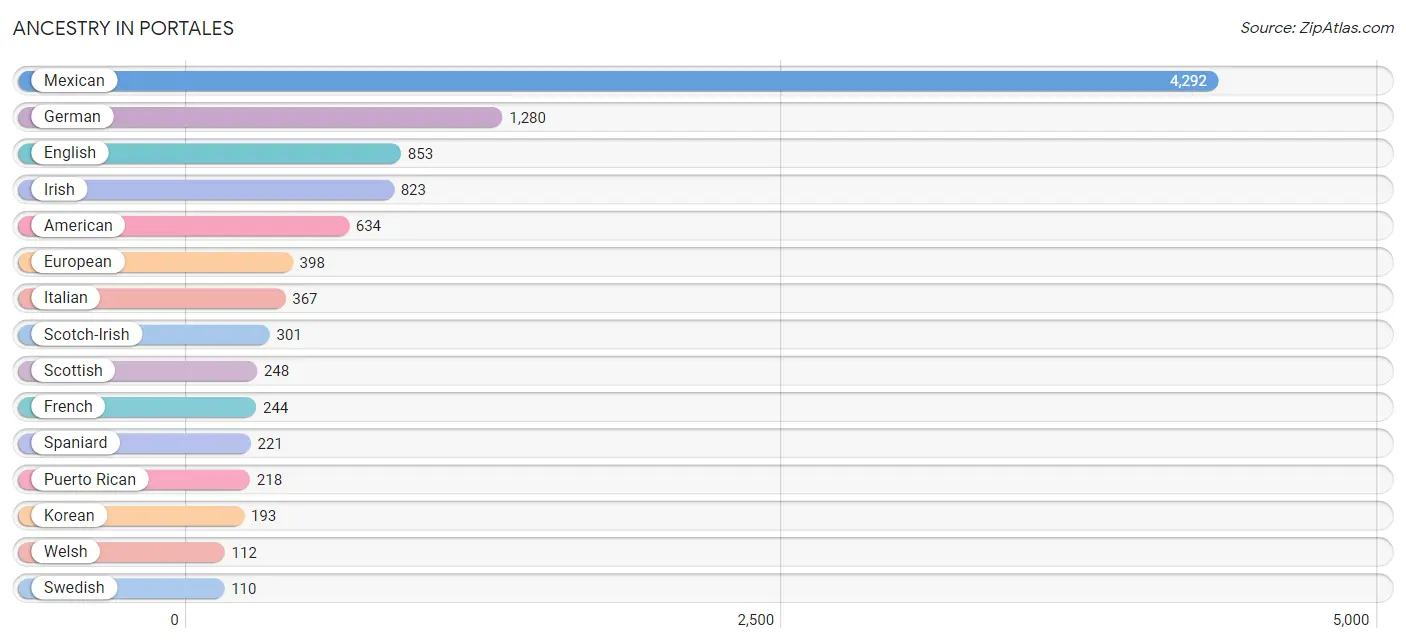
| Ancestry | # Population | % Population |
| American | 634 | 5.2% |
| Basque | 16 | 0.1% |
| Bhutanese | 6 | 0.1% |
| British | 96 | 0.8% |
| Bulgarian | 27 | 0.2% |
| Burmese | 48 | 0.4% |
| Cajun | 32 | 0.3% |
| Central American | 40 | 0.3% |
| Cherokee | 17 | 0.1% |
| Chippewa | 12 | 0.1% |
| Czech | 8 | 0.1% |
| Czechoslovakian | 12 | 0.1% |
| Dutch | 102 | 0.8% |
| Dutch West Indian | 8 | 0.1% |
| English | 853 | 7.1% |
| European | 398 | 3.3% |
| Finnish | 12 | 0.1% |
| French | 244 | 2.0% |
| German | 1,280 | 10.6% |
| Guatemalan | 32 | 0.3% |
| Haitian | 17 | 0.1% |
| Honduran | 8 | 0.1% |
| Indian (Asian) | 8 | 0.1% |
| Irish | 823 | 6.8% |
| Italian | 367 | 3.0% |
| Korean | 193 | 1.6% |
| Lithuanian | 11 | 0.1% |
| Mexican | 4,292 | 35.5% |
| Native Hawaiian | 32 | 0.3% |
| Navajo | 73 | 0.6% |
| Norwegian | 63 | 0.5% |
| Polish | 26 | 0.2% |
| Portuguese | 31 | 0.3% |
| Puerto Rican | 218 | 1.8% |
| Samoan | 34 | 0.3% |
| Scotch-Irish | 301 | 2.5% |
| Scottish | 248 | 2.1% |
| Sioux | 6 | 0.1% |
| Spaniard | 221 | 1.8% |
| Spanish | 63 | 0.5% |
| Spanish American Indian | 26 | 0.2% |
| Swedish | 110 | 0.9% |
| Thai | 13 | 0.1% |
| Welsh | 112 | 0.9% | View All 44 Rows |
Immigrants in Portales
The most numerous immigrant groups reported in Portales came from Latin America (611 | 5.1%), Central America (604 | 5.0%), Mexico (596 | 4.9%), Asia (110 | 0.9%), and Eastern Asia (56 | 0.5%), together accounting for 16.4% of all Portales residents.
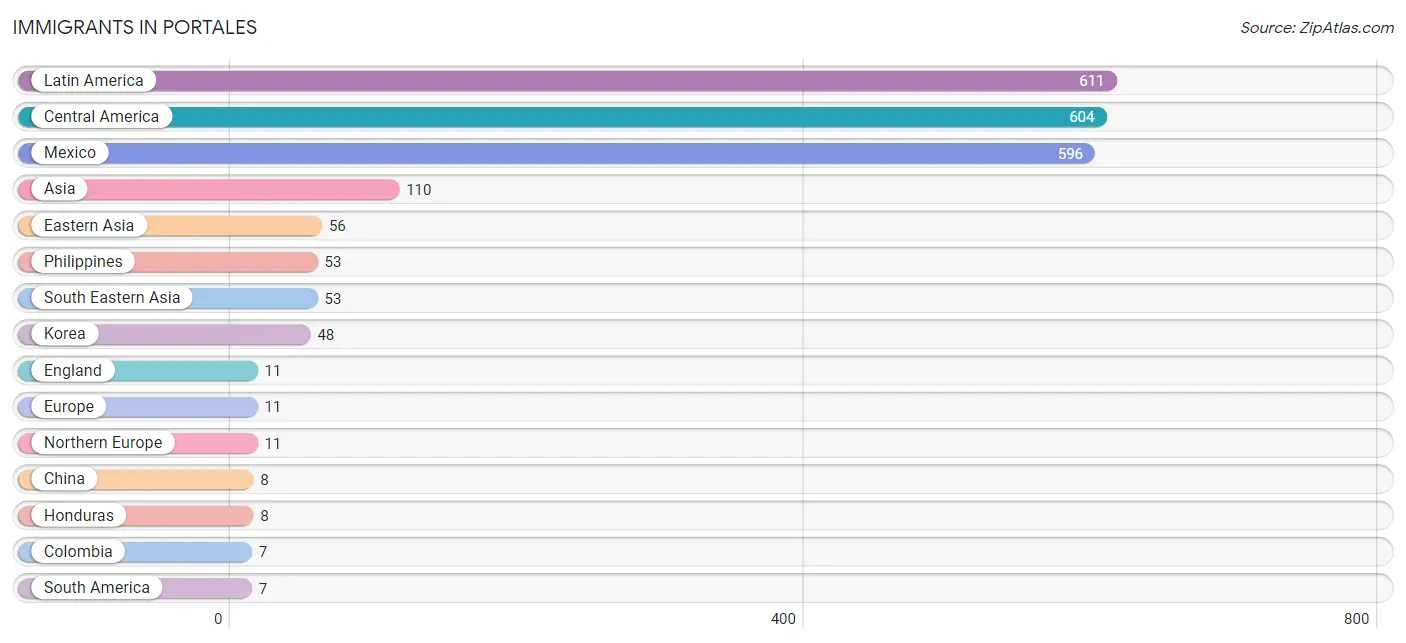
| Immigration Origin | # Population | % Population |
| Asia | 110 | 0.9% |
| Central America | 604 | 5.0% |
| China | 8 | 0.1% |
| Colombia | 7 | 0.1% |
| Eastern Asia | 56 | 0.5% |
| England | 11 | 0.1% |
| Europe | 11 | 0.1% |
| Honduras | 8 | 0.1% |
| India | 1 | 0.0% |
| Korea | 48 | 0.4% |
| Latin America | 611 | 5.1% |
| Mexico | 596 | 4.9% |
| Northern Europe | 11 | 0.1% |
| Philippines | 53 | 0.4% |
| South America | 7 | 0.1% |
| South Central Asia | 1 | 0.0% |
| South Eastern Asia | 53 | 0.4% | View All 17 Rows |
Sex and Age in Portales
Sex and Age in Portales
The most populous age groups in Portales are 20 to 24 Years (1,084 | 18.9%) for men and 20 to 24 Years (1,090 | 17.2%) for women.
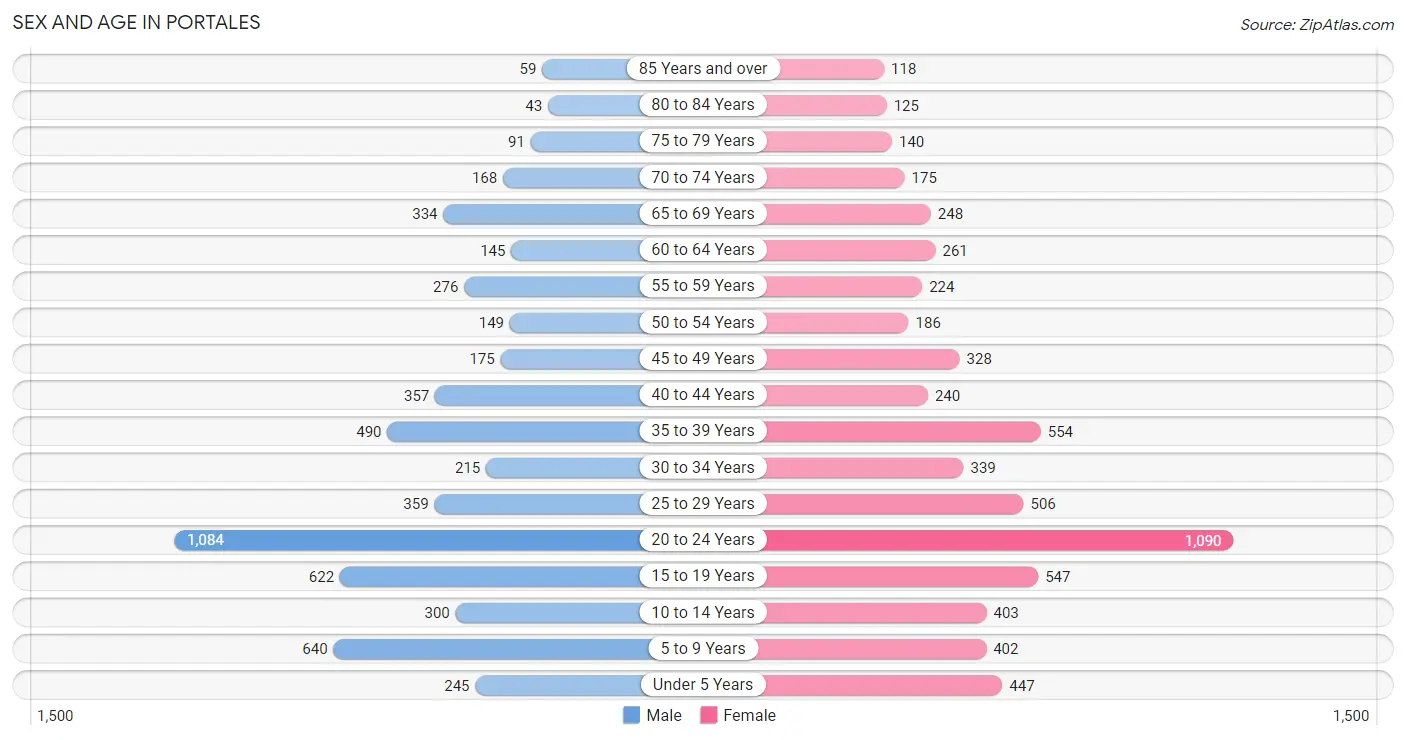
| Age Bracket | Male | Female |
| Under 5 Years | 245 (4.3%) | 447 (7.1%) |
| 5 to 9 Years | 640 (11.1%) | 402 (6.4%) |
| 10 to 14 Years | 300 (5.2%) | 403 (6.4%) |
| 15 to 19 Years | 622 (10.8%) | 547 (8.6%) |
| 20 to 24 Years | 1,084 (18.9%) | 1,090 (17.2%) |
| 25 to 29 Years | 359 (6.2%) | 506 (8.0%) |
| 30 to 34 Years | 215 (3.7%) | 339 (5.3%) |
| 35 to 39 Years | 490 (8.5%) | 554 (8.7%) |
| 40 to 44 Years | 357 (6.2%) | 240 (3.8%) |
| 45 to 49 Years | 175 (3.0%) | 328 (5.2%) |
| 50 to 54 Years | 149 (2.6%) | 186 (2.9%) |
| 55 to 59 Years | 276 (4.8%) | 224 (3.5%) |
| 60 to 64 Years | 145 (2.5%) | 261 (4.1%) |
| 65 to 69 Years | 334 (5.8%) | 248 (3.9%) |
| 70 to 74 Years | 168 (2.9%) | 175 (2.8%) |
| 75 to 79 Years | 91 (1.6%) | 140 (2.2%) |
| 80 to 84 Years | 43 (0.7%) | 125 (2.0%) |
| 85 Years and over | 59 (1.0%) | 118 (1.9%) |
| Total | 5,752 (100.0%) | 6,333 (100.0%) |
Families and Households in Portales
Median Family Size in Portales
The median family size in Portales is 3.45 persons per family, with single male/father families (172 | 7.5%) accounting for the largest median family size of 4.11 persons per family. On the other hand, single female/mother families (509 | 22.2%) represent the smallest median family size with 2.62 persons per family.
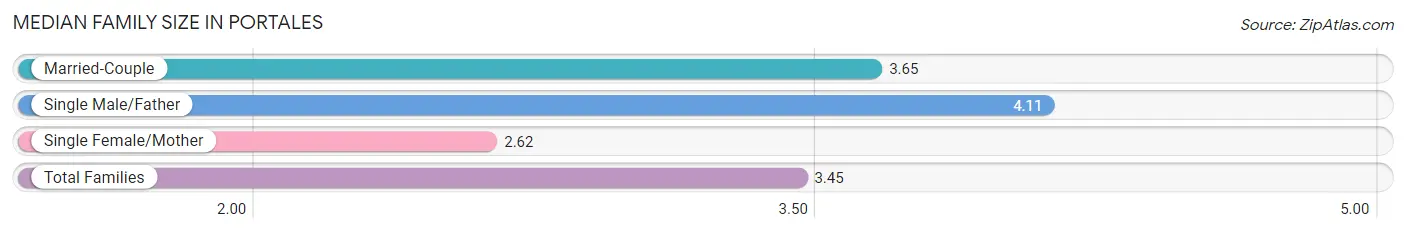
| Family Type | # Families | Family Size |
| Married-Couple | 1,617 (70.4%) | 3.65 |
| Single Male/Father | 172 (7.5%) | 4.11 |
| Single Female/Mother | 509 (22.2%) | 2.62 |
| Total Families | 2,298 (100.0%) | 3.45 |
Median Household Size in Portales
The median household size in Portales is 2.59 persons per household, with single male/father households (172 | 4.0%) accounting for the largest median household size of 4.78 persons per household. non-family households (1,987 | 46.4%) represent the smallest median household size with 1.36 persons per household.
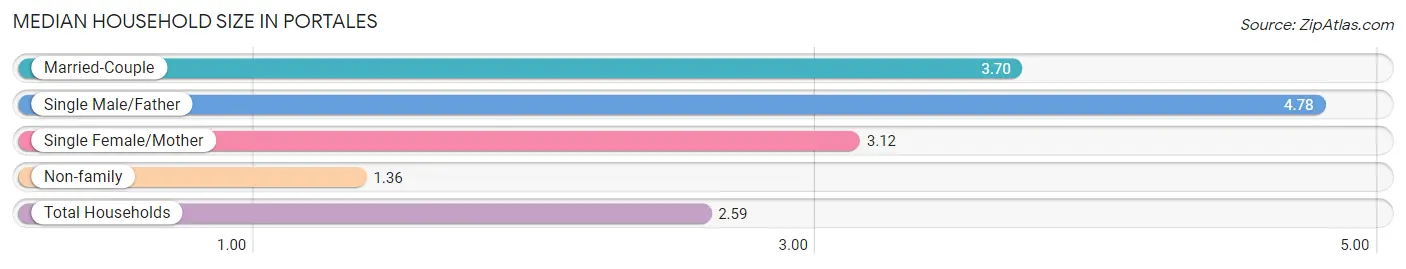
| Household Type | # Households | Household Size |
| Married-Couple | 1,617 (37.7%) | 3.70 |
| Single Male/Father | 172 (4.0%) | 4.78 |
| Single Female/Mother | 509 (11.9%) | 3.12 |
| Non-family | 1,987 (46.4%) | 1.36 |
| Total Households | 4,285 (100.0%) | 2.59 |
Household Size by Marriage Status in Portales
Out of a total of 4,285 households in Portales, 2,298 (53.6%) are family households, while 1,987 (46.4%) are nonfamily households. The most numerous type of family households are 2-person households, comprising 843, and the most common type of nonfamily households are 1-person households, comprising 1,631.
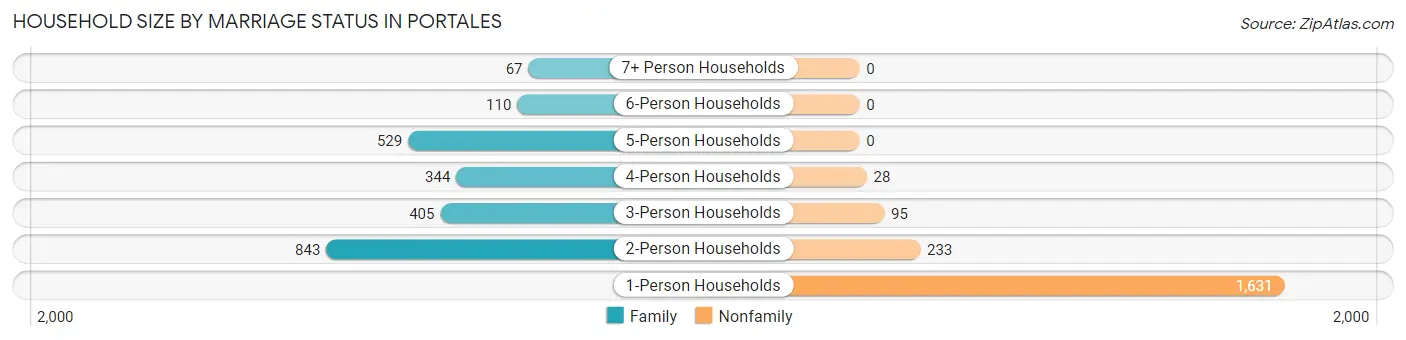
| Household Size | Family Households | Nonfamily Households |
| 1-Person Households | - | 1,631 (38.1%) |
| 2-Person Households | 843 (19.7%) | 233 (5.4%) |
| 3-Person Households | 405 (9.5%) | 95 (2.2%) |
| 4-Person Households | 344 (8.0%) | 28 (0.6%) |
| 5-Person Households | 529 (12.3%) | 0 (0.0%) |
| 6-Person Households | 110 (2.6%) | 0 (0.0%) |
| 7+ Person Households | 67 (1.6%) | 0 (0.0%) |
| Total | 2,298 (53.6%) | 1,987 (46.4%) |
Female Fertility in Portales
Fertility by Age in Portales
Average fertility rate in Portales is 36.0 births per 1,000 women. Women in the age bracket of 35 to 50 years have the highest fertility rate with 67.0 births per 1,000 women. Women in the age bracket of 35 to 50 years acount for 58.3% of all women with births.
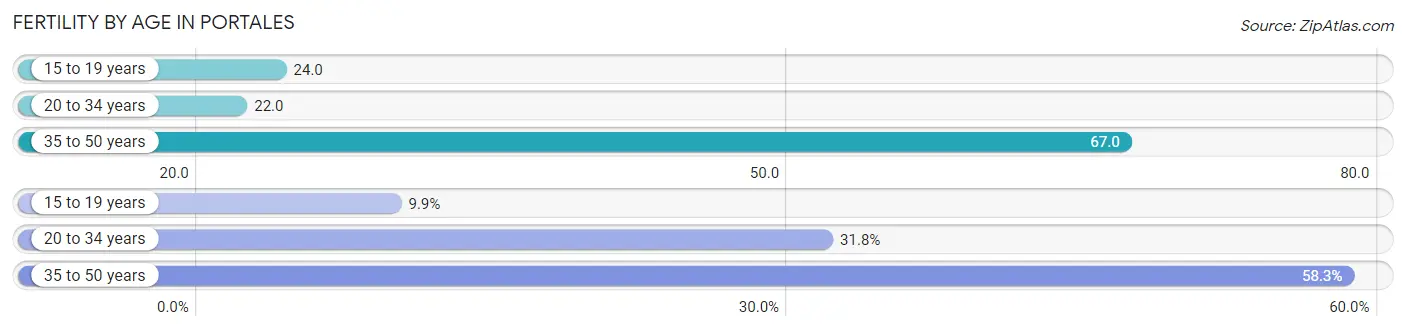
| Age Bracket | Women with Births | Births / 1,000 Women |
| 15 to 19 years | 13 (9.9%) | 24.0 |
| 20 to 34 years | 42 (31.8%) | 22.0 |
| 35 to 50 years | 77 (58.3%) | 67.0 |
| Total | 132 (100.0%) | 36.0 |
Fertility by Age by Marriage Status in Portales
46.2% of women with births (132) in Portales are married. The highest percentage of unmarried women with births falls into 15 to 19 years age bracket with 100.0% of them unmarried at the time of birth, while the lowest percentage of unmarried women with births belong to 35 to 50 years age bracket with 39.0% of them unmarried.
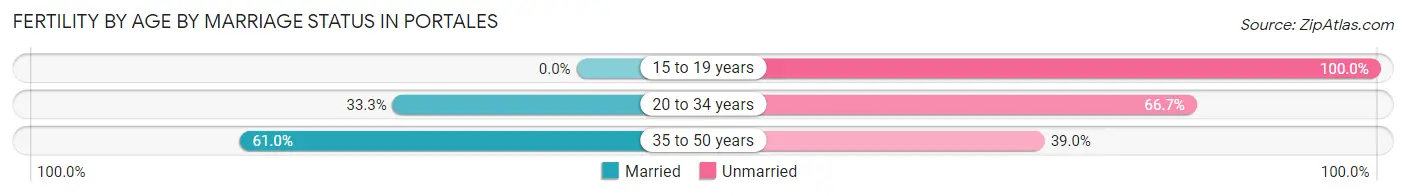
| Age Bracket | Married | Unmarried |
| 15 to 19 years | 0 (0.0%) | 13 (100.0%) |
| 20 to 34 years | 14 (33.3%) | 28 (66.7%) |
| 35 to 50 years | 47 (61.0%) | 30 (39.0%) |
| Total | 61 (46.2%) | 71 (53.8%) |
Fertility by Education in Portales
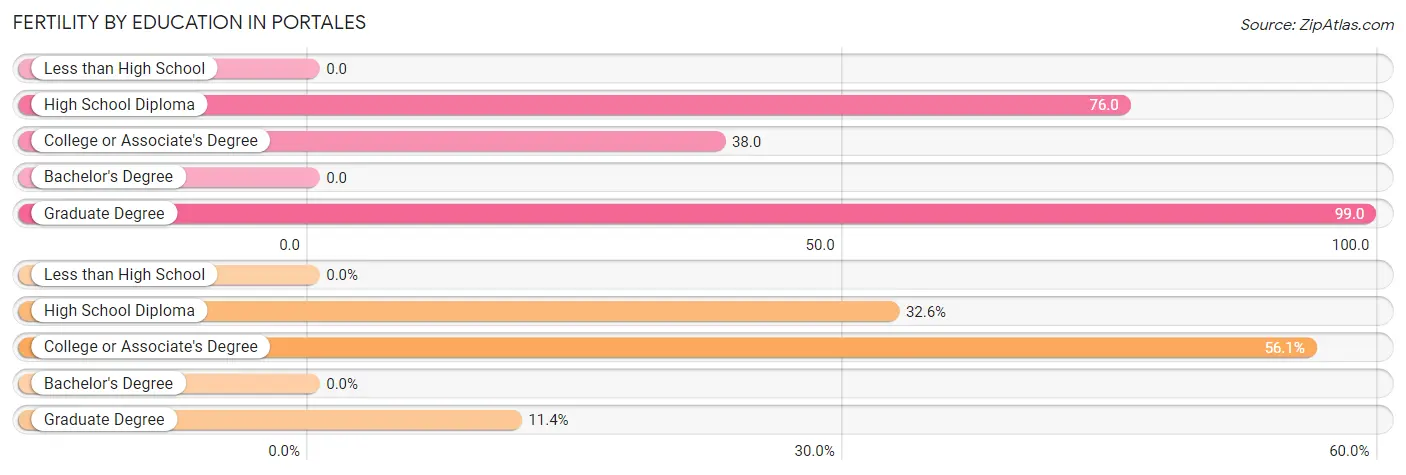
| Educational Attainment | Women with Births | Births / 1,000 Women |
| Less than High School | 0 (0.0%) | 0.0 |
| High School Diploma | 43 (32.6%) | 76.0 |
| College or Associate's Degree | 74 (56.1%) | 38.0 |
| Bachelor's Degree | 0 (0.0%) | 0.0 |
| Graduate Degree | 15 (11.4%) | 99.0 |
| Total | 132 (100.0%) | 36.0 |
Fertility by Education by Marriage Status in Portales
53.8% of women with births in Portales are unmarried. Women with the educational attainment of graduate degree are most likely to be married with 100.0% of them married at childbirth, while women with the educational attainment of high school diploma are least likely to be married with 100.0% of them unmarried at childbirth.
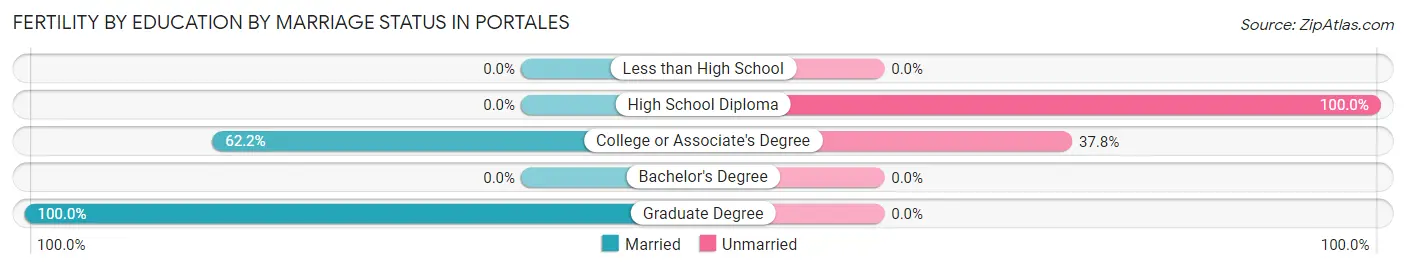
| Educational Attainment | Married | Unmarried |
| Less than High School | 0 (0.0%) | 0 (0.0%) |
| High School Diploma | 0 (0.0%) | 43 (100.0%) |
| College or Associate's Degree | 46 (62.2%) | 28 (37.8%) |
| Bachelor's Degree | 0 (0.0%) | 0 (0.0%) |
| Graduate Degree | 15 (100.0%) | 0 (0.0%) |
| Total | 61 (46.2%) | 71 (53.8%) |
Employment Characteristics in Portales
Employment by Class of Employer in Portales
Among the 5,376 employed individuals in Portales, private company employees (3,137 | 58.4%), state government employees (1,003 | 18.7%), and not-for-profit organizations (495 | 9.2%) make up the most common classes of employment.
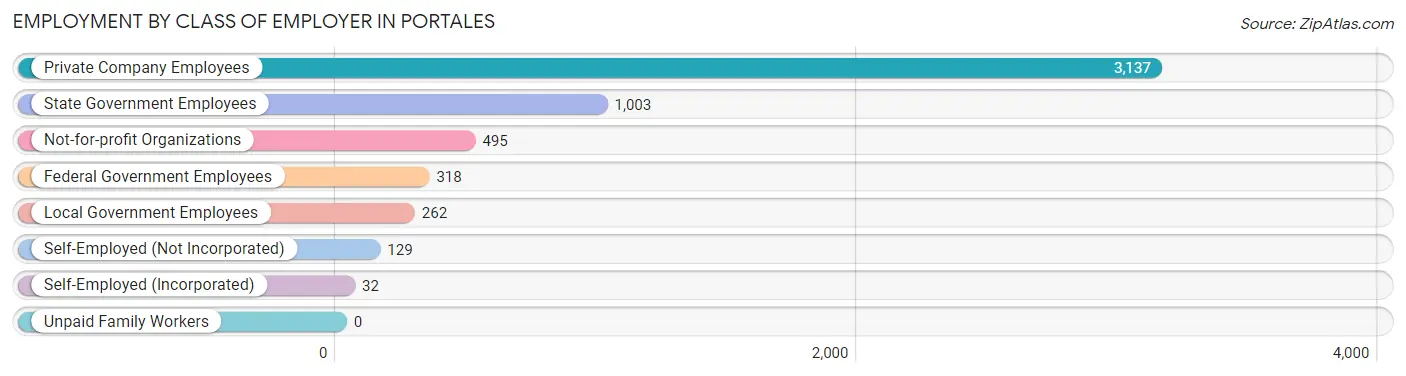
| Employer Class | # Employees | % Employees |
| Private Company Employees | 3,137 | 58.4% |
| Self-Employed (Incorporated) | 32 | 0.6% |
| Self-Employed (Not Incorporated) | 129 | 2.4% |
| Not-for-profit Organizations | 495 | 9.2% |
| Local Government Employees | 262 | 4.9% |
| State Government Employees | 1,003 | 18.7% |
| Federal Government Employees | 318 | 5.9% |
| Unpaid Family Workers | 0 | 0.0% |
| Total | 5,376 | 100.0% |
Employment Status by Age in Portales
According to the labor force statistics for Portales, out of the total population over 16 years of age (9,295), 64.2% or 5,967 individuals are in the labor force, with 9.5% or 567 of them unemployed. The age group with the highest labor force participation rate is 20 to 24 years, with 85.0% or 1,848 individuals in the labor force. Within the labor force, the 16 to 19 years age range has the highest percentage of unemployed individuals, with 61.6% or 271 of them being unemployed.
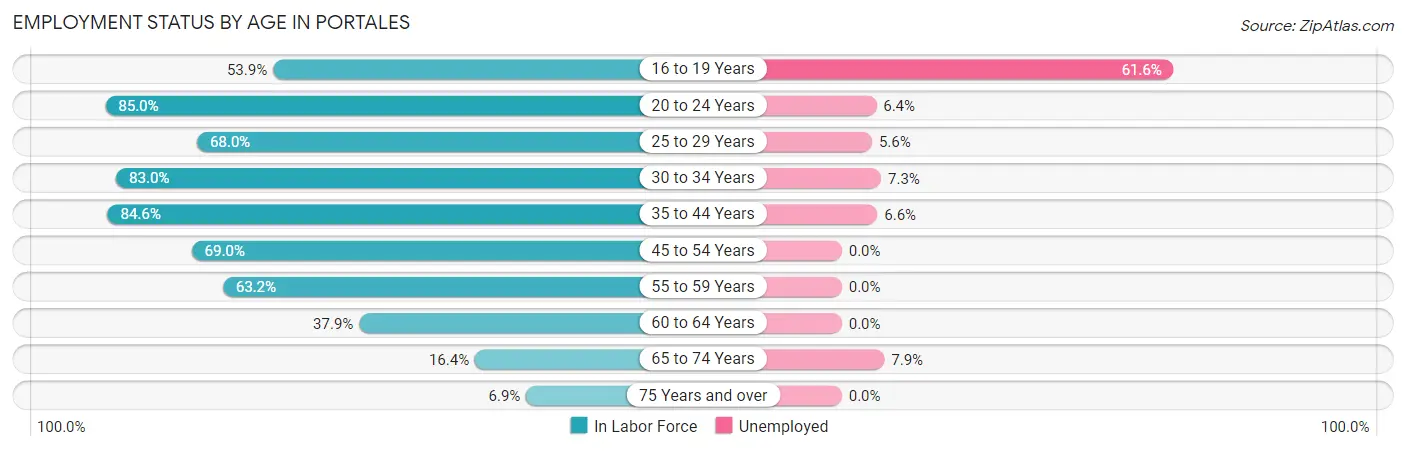
| Age Bracket | In Labor Force | Unemployed |
| 16 to 19 Years | 440 (53.9%) | 271 (61.6%) |
| 20 to 24 Years | 1,848 (85.0%) | 118 (6.4%) |
| 25 to 29 Years | 588 (68.0%) | 33 (5.6%) |
| 30 to 34 Years | 460 (83.0%) | 34 (7.3%) |
| 35 to 44 Years | 1,388 (84.6%) | 92 (6.6%) |
| 45 to 54 Years | 578 (69.0%) | 0 (0.0%) |
| 55 to 59 Years | 316 (63.2%) | 0 (0.0%) |
| 60 to 64 Years | 154 (37.9%) | 0 (0.0%) |
| 65 to 74 Years | 152 (16.4%) | 12 (7.9%) |
| 75 Years and over | 40 (6.9%) | 0 (0.0%) |
| Total | 5,967 (64.2%) | 567 (9.5%) |
Employment Status by Educational Attainment in Portales
According to labor force statistics for Portales, 72.5% of individuals (3,483) out of the total population between 25 and 64 years of age (4,804) are in the labor force, with 4.5% or 157 of them being unemployed. The group with the highest labor force participation rate are those with the educational attainment of college / associate degree, with 88.0% or 1,469 individuals in the labor force. Within the labor force, individuals with high school diploma education have the highest percentage of unemployment, with 7.4% or 73 of them being unemployed.
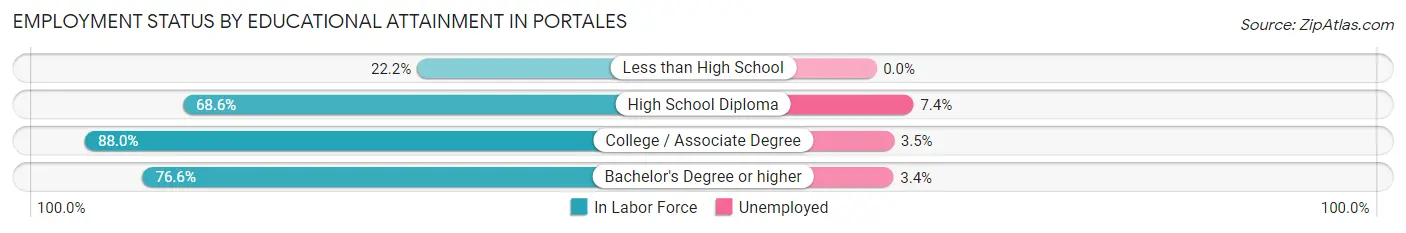
| Educational Attainment | In Labor Force | Unemployed |
| Less than High School | 110 (22.2%) | 0 (0.0%) |
| High School Diploma | 989 (68.6%) | 107 (7.4%) |
| College / Associate Degree | 1,469 (88.0%) | 58 (3.5%) |
| Bachelor's Degree or higher | 918 (76.6%) | 41 (3.4%) |
| Total | 3,483 (72.5%) | 216 (4.5%) |
Employment Occupations by Sex in Portales
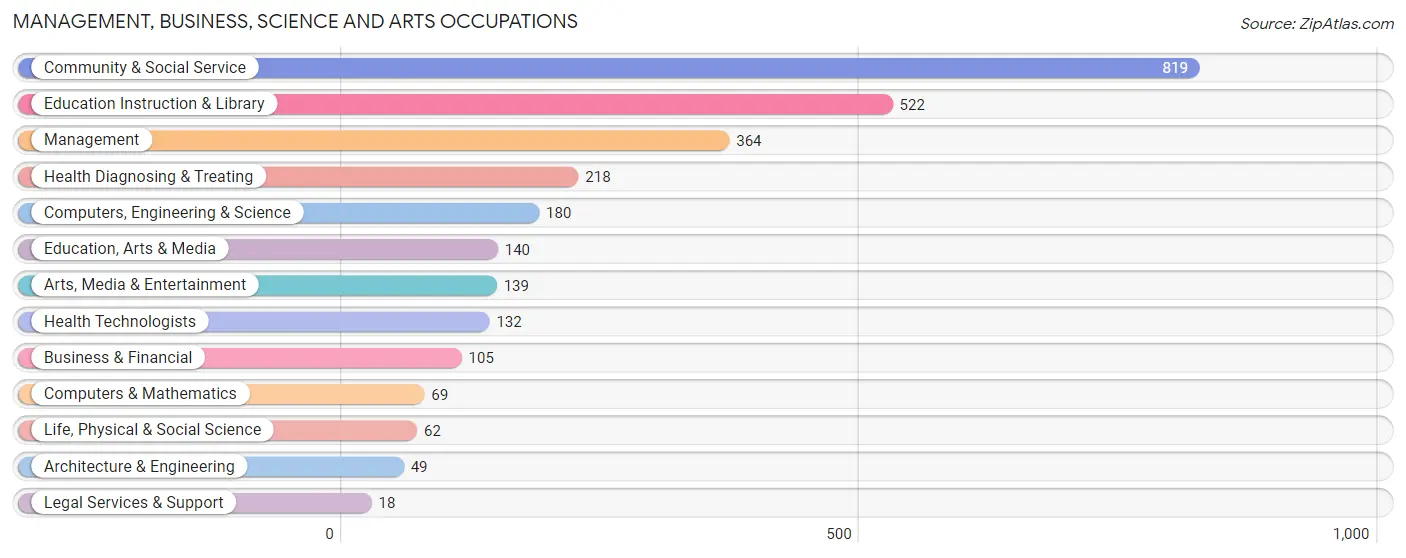
Management, Business, Science and Arts Occupations
The most common Management, Business, Science and Arts occupations in Portales are Community & Social Service (819 | 15.7%), Education Instruction & Library (522 | 10.0%), Management (364 | 7.0%), Health Diagnosing & Treating (218 | 4.2%), and Computers, Engineering & Science (180 | 3.4%).
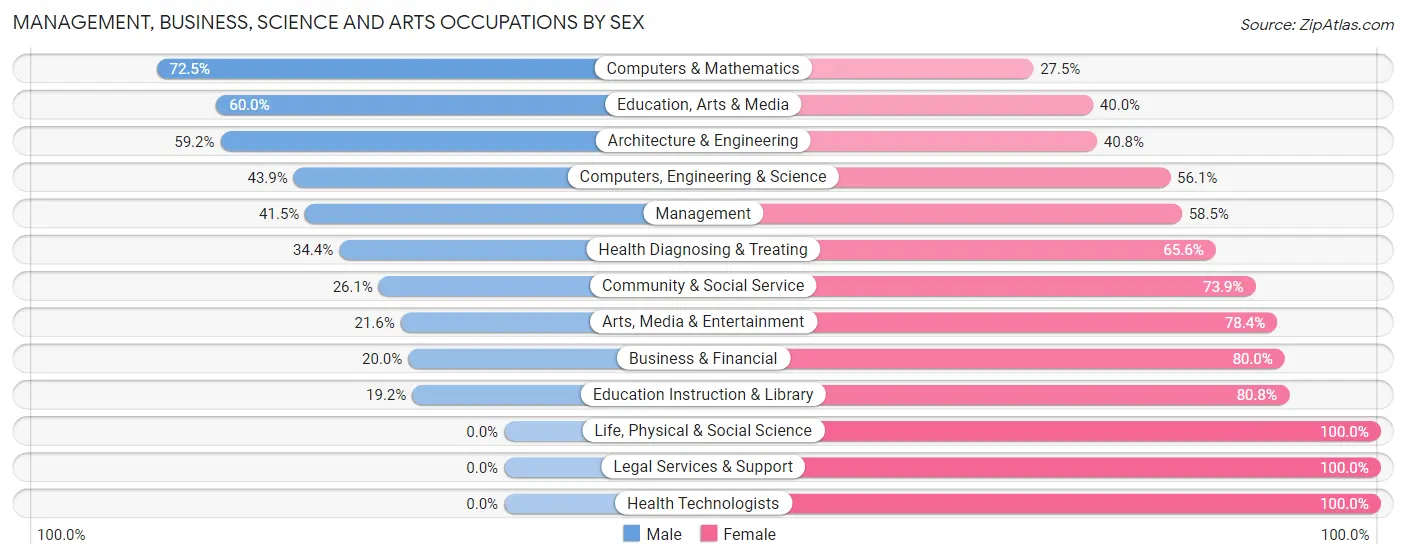
Management, Business, Science and Arts Occupations by Sex
Within the Management, Business, Science and Arts occupations in Portales, the most male-oriented occupations are Computers & Mathematics (72.5%), Education, Arts & Media (60.0%), and Architecture & Engineering (59.2%), while the most female-oriented occupations are Life, Physical & Social Science (100.0%), Legal Services & Support (100.0%), and Health Technologists (100.0%).
| Occupation | Male | Female |
| Management | 151 (41.5%) | 213 (58.5%) |
| Business & Financial | 21 (20.0%) | 84 (80.0%) |
| Computers, Engineering & Science | 79 (43.9%) | 101 (56.1%) |
| Computers & Mathematics | 50 (72.5%) | 19 (27.5%) |
| Architecture & Engineering | 29 (59.2%) | 20 (40.8%) |
| Life, Physical & Social Science | 0 (0.0%) | 62 (100.0%) |
| Community & Social Service | 214 (26.1%) | 605 (73.9%) |
| Education, Arts & Media | 84 (60.0%) | 56 (40.0%) |
| Legal Services & Support | 0 (0.0%) | 18 (100.0%) |
| Education Instruction & Library | 100 (19.2%) | 422 (80.8%) |
| Arts, Media & Entertainment | 30 (21.6%) | 109 (78.4%) |
| Health Diagnosing & Treating | 75 (34.4%) | 143 (65.6%) |
| Health Technologists | 0 (0.0%) | 132 (100.0%) |
| Total (Category) | 540 (32.0%) | 1,146 (68.0%) |
| Total (Overall) | 2,524 (48.3%) | 2,706 (51.7%) |
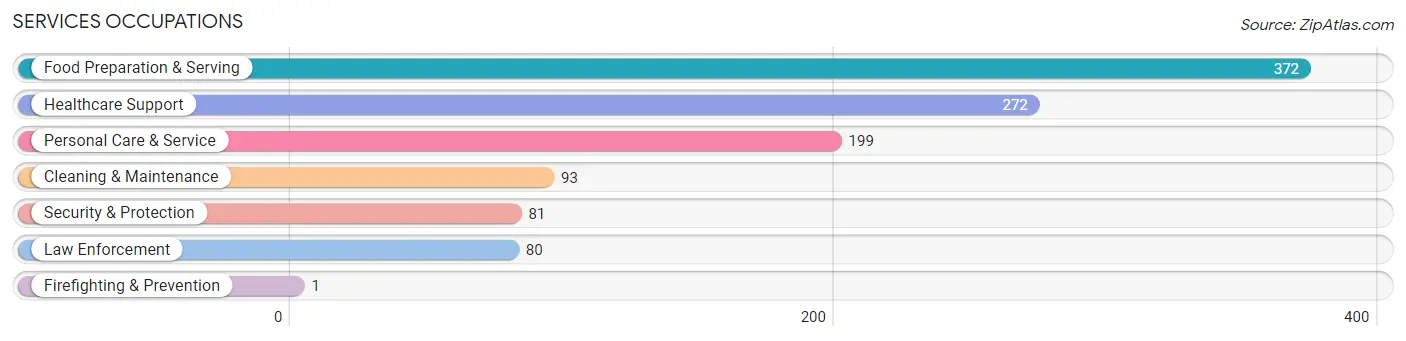
Services Occupations
The most common Services occupations in Portales are Food Preparation & Serving (372 | 7.1%), Healthcare Support (272 | 5.2%), Personal Care & Service (199 | 3.8%), Cleaning & Maintenance (93 | 1.8%), and Security & Protection (81 | 1.5%).
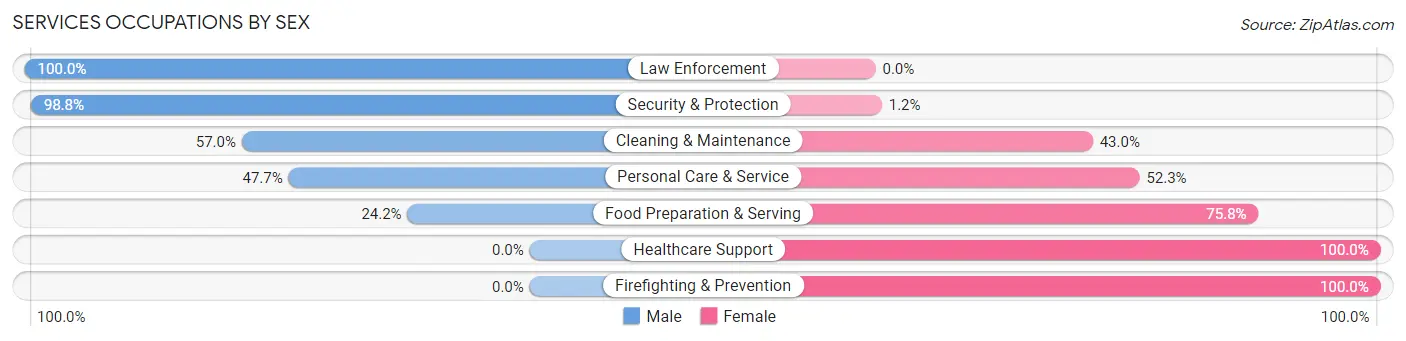
Services Occupations by Sex
Within the Services occupations in Portales, the most male-oriented occupations are Law Enforcement (100.0%), Security & Protection (98.8%), and Cleaning & Maintenance (57.0%), while the most female-oriented occupations are Healthcare Support (100.0%), Firefighting & Prevention (100.0%), and Food Preparation & Serving (75.8%).
| Occupation | Male | Female |
| Healthcare Support | 0 (0.0%) | 272 (100.0%) |
| Security & Protection | 80 (98.8%) | 1 (1.2%) |
| Firefighting & Prevention | 0 (0.0%) | 1 (100.0%) |
| Law Enforcement | 80 (100.0%) | 0 (0.0%) |
| Food Preparation & Serving | 90 (24.2%) | 282 (75.8%) |
| Cleaning & Maintenance | 53 (57.0%) | 40 (43.0%) |
| Personal Care & Service | 95 (47.7%) | 104 (52.3%) |
| Total (Category) | 318 (31.3%) | 699 (68.7%) |
| Total (Overall) | 2,524 (48.3%) | 2,706 (51.7%) |
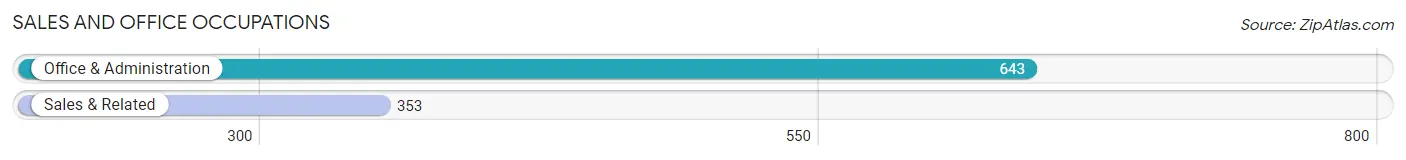
Sales and Office Occupations
The most common Sales and Office occupations in Portales are Office & Administration (643 | 12.3%), and Sales & Related (353 | 6.8%).
Sales and Office Occupations by Sex
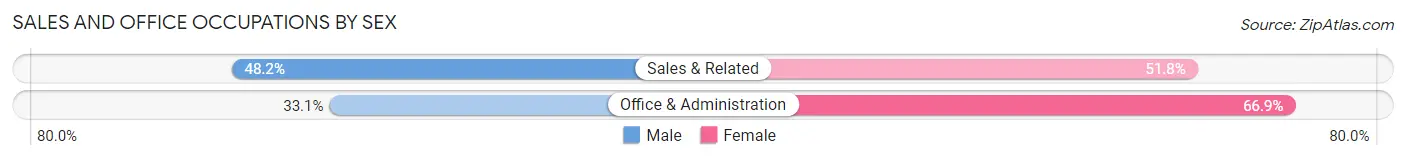
| Occupation | Male | Female |
| Sales & Related | 170 (48.2%) | 183 (51.8%) |
| Office & Administration | 213 (33.1%) | 430 (66.9%) |
| Total (Category) | 383 (38.5%) | 613 (61.6%) |
| Total (Overall) | 2,524 (48.3%) | 2,706 (51.7%) |
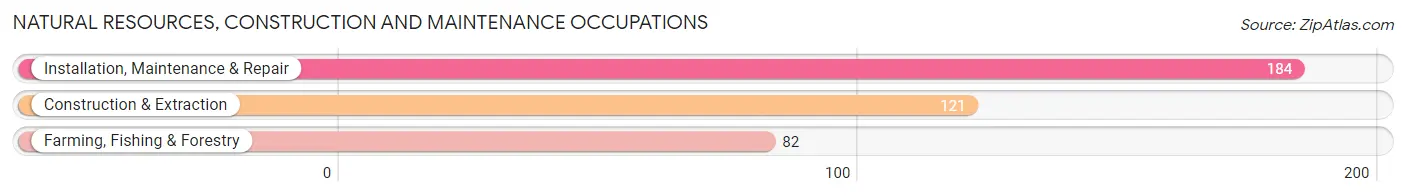
Natural Resources, Construction and Maintenance Occupations
The most common Natural Resources, Construction and Maintenance occupations in Portales are Installation, Maintenance & Repair (184 | 3.5%), Construction & Extraction (121 | 2.3%), and Farming, Fishing & Forestry (82 | 1.6%).
Natural Resources, Construction and Maintenance Occupations by Sex
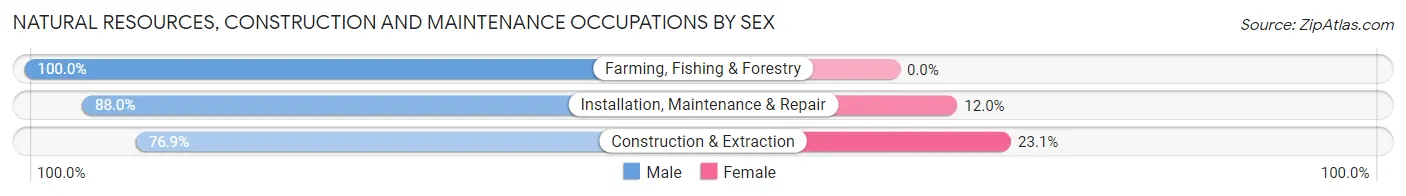
| Occupation | Male | Female |
| Farming, Fishing & Forestry | 82 (100.0%) | 0 (0.0%) |
| Construction & Extraction | 93 (76.9%) | 28 (23.1%) |
| Installation, Maintenance & Repair | 162 (88.0%) | 22 (12.0%) |
| Total (Category) | 337 (87.1%) | 50 (12.9%) |
| Total (Overall) | 2,524 (48.3%) | 2,706 (51.7%) |
Production, Transportation and Moving Occupations
The most common Production, Transportation and Moving occupations in Portales are Material Moving (411 | 7.9%), Production (373 | 7.1%), and Transportation (360 | 6.9%).
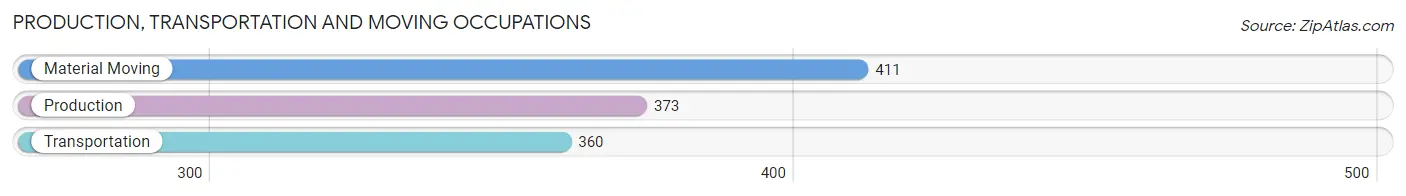
Production, Transportation and Moving Occupations by Sex
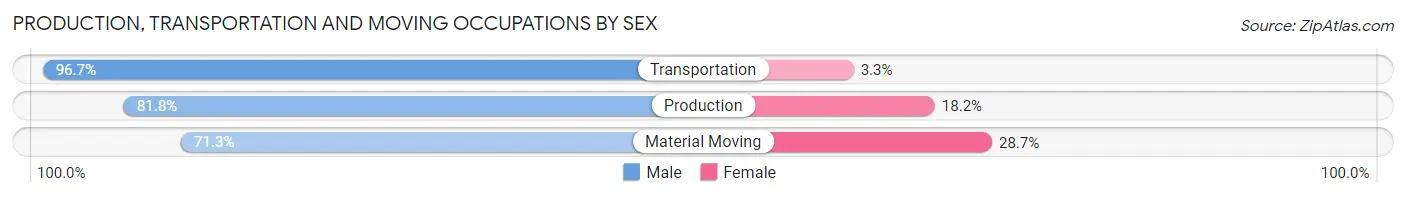
| Occupation | Male | Female |
| Production | 305 (81.8%) | 68 (18.2%) |
| Transportation | 348 (96.7%) | 12 (3.3%) |
| Material Moving | 293 (71.3%) | 118 (28.7%) |
| Total (Category) | 946 (82.7%) | 198 (17.3%) |
| Total (Overall) | 2,524 (48.3%) | 2,706 (51.7%) |
Employment Industries by Sex in Portales
Employment Industries in Portales
The major employment industries in Portales include Educational Services (939 | 17.9%), Retail Trade (736 | 14.1%), Health Care & Social Assistance (535 | 10.2%), Accommodation & Food Services (512 | 9.8%), and Manufacturing (459 | 8.8%).
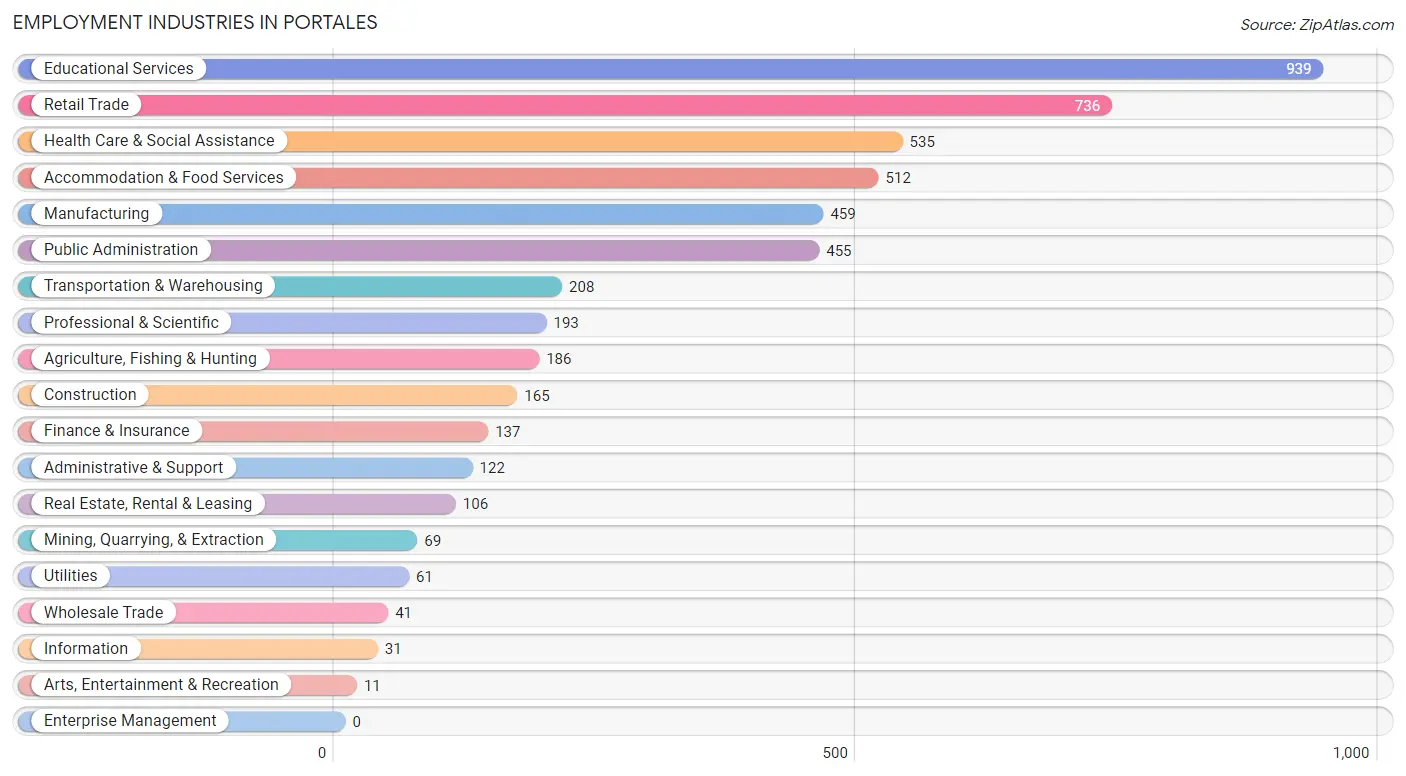
Employment Industries by Sex in Portales
The Portales industries that see more men than women are Mining, Quarrying, & Extraction (100.0%), Utilities (100.0%), and Arts, Entertainment & Recreation (100.0%), whereas the industries that tend to have a higher number of women are Information (100.0%), Real Estate, Rental & Leasing (100.0%), and Health Care & Social Assistance (95.1%).

| Industry | Male | Female |
| Agriculture, Fishing & Hunting | 167 (89.8%) | 19 (10.2%) |
| Mining, Quarrying, & Extraction | 69 (100.0%) | 0 (0.0%) |
| Construction | 125 (75.8%) | 40 (24.2%) |
| Manufacturing | 376 (81.9%) | 83 (18.1%) |
| Wholesale Trade | 23 (56.1%) | 18 (43.9%) |
| Retail Trade | 394 (53.5%) | 342 (46.5%) |
| Transportation & Warehousing | 196 (94.2%) | 12 (5.8%) |
| Utilities | 61 (100.0%) | 0 (0.0%) |
| Information | 0 (0.0%) | 31 (100.0%) |
| Finance & Insurance | 48 (35.0%) | 89 (65.0%) |
| Real Estate, Rental & Leasing | 0 (0.0%) | 106 (100.0%) |
| Professional & Scientific | 141 (73.1%) | 52 (26.9%) |
| Enterprise Management | 0 (0.0%) | 0 (0.0%) |
| Administrative & Support | 108 (88.5%) | 14 (11.5%) |
| Educational Services | 187 (19.9%) | 752 (80.1%) |
| Health Care & Social Assistance | 26 (4.9%) | 509 (95.1%) |
| Arts, Entertainment & Recreation | 11 (100.0%) | 0 (0.0%) |
| Accommodation & Food Services | 183 (35.7%) | 329 (64.3%) |
| Public Administration | 298 (65.5%) | 157 (34.5%) |
| Total | 2,524 (48.3%) | 2,706 (51.7%) |
Education in Portales
School Enrollment in Portales
The most common levels of schooling among the 4,319 students in Portales are college / undergraduate (1,799 | 41.6%), elementary school (1,032 | 23.9%), and high school (576 | 13.3%).
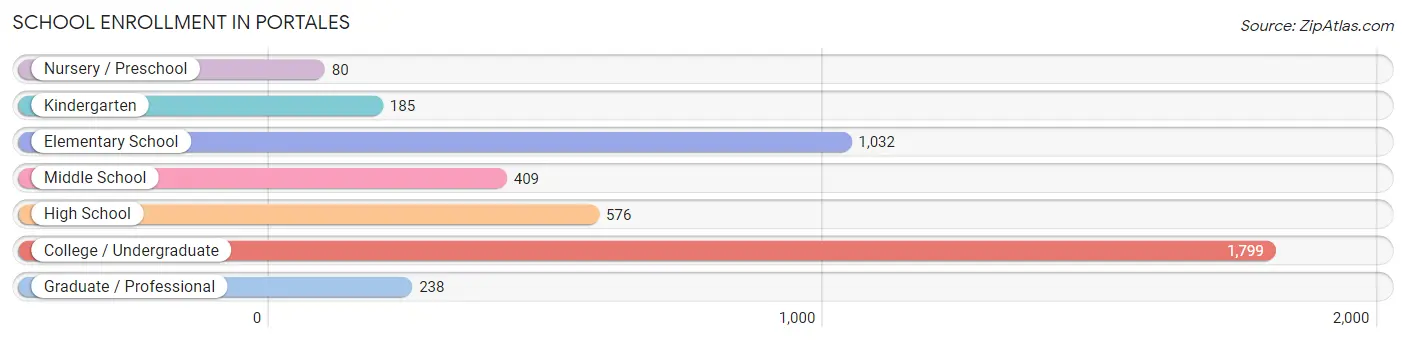
| School Level | # Students | % Students |
| Nursery / Preschool | 80 | 1.8% |
| Kindergarten | 185 | 4.3% |
| Elementary School | 1,032 | 23.9% |
| Middle School | 409 | 9.5% |
| High School | 576 | 13.3% |
| College / Undergraduate | 1,799 | 41.6% |
| Graduate / Professional | 238 | 5.5% |
| Total | 4,319 | 100.0% |
School Enrollment by Age by Funding Source in Portales
Out of a total of 4,319 students who are enrolled in schools in Portales, 255 (5.9%) attend a private institution, while the remaining 4,064 (94.1%) are enrolled in public schools. The age group of 35 years and over has the highest likelihood of being enrolled in private schools, with 39 (24.7% in the age bracket) enrolled. Conversely, the age group of 3 to 4 year olds has the lowest likelihood of being enrolled in a private school, with 102 (100.0% in the age bracket) attending a public institution.
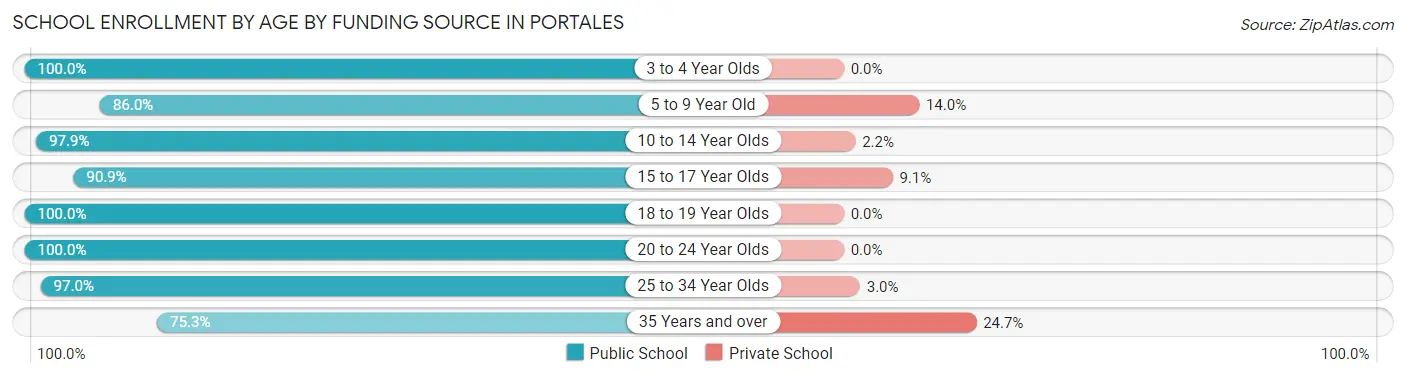
| Age Bracket | Public School | Private School |
| 3 to 4 Year Olds | 102 (100.0%) | 0 (0.0%) |
| 5 to 9 Year Old | 876 (86.0%) | 143 (14.0%) |
| 10 to 14 Year Olds | 592 (97.9%) | 13 (2.1%) |
| 15 to 17 Year Olds | 500 (90.9%) | 50 (9.1%) |
| 18 to 19 Year Olds | 472 (100.0%) | 0 (0.0%) |
| 20 to 24 Year Olds | 1,146 (100.0%) | 0 (0.0%) |
| 25 to 34 Year Olds | 259 (97.0%) | 8 (3.0%) |
| 35 Years and over | 119 (75.3%) | 39 (24.7%) |
| Total | 4,064 (94.1%) | 255 (5.9%) |
Educational Attainment by Field of Study in Portales
Business (291 | 17.5%), education (192 | 11.6%), liberal arts & history (191 | 11.5%), arts & humanities (174 | 10.5%), and bio, nature & agricultural (141 | 8.5%) are the most common fields of study among 1,663 individuals in Portales who have obtained a bachelor's degree or higher.
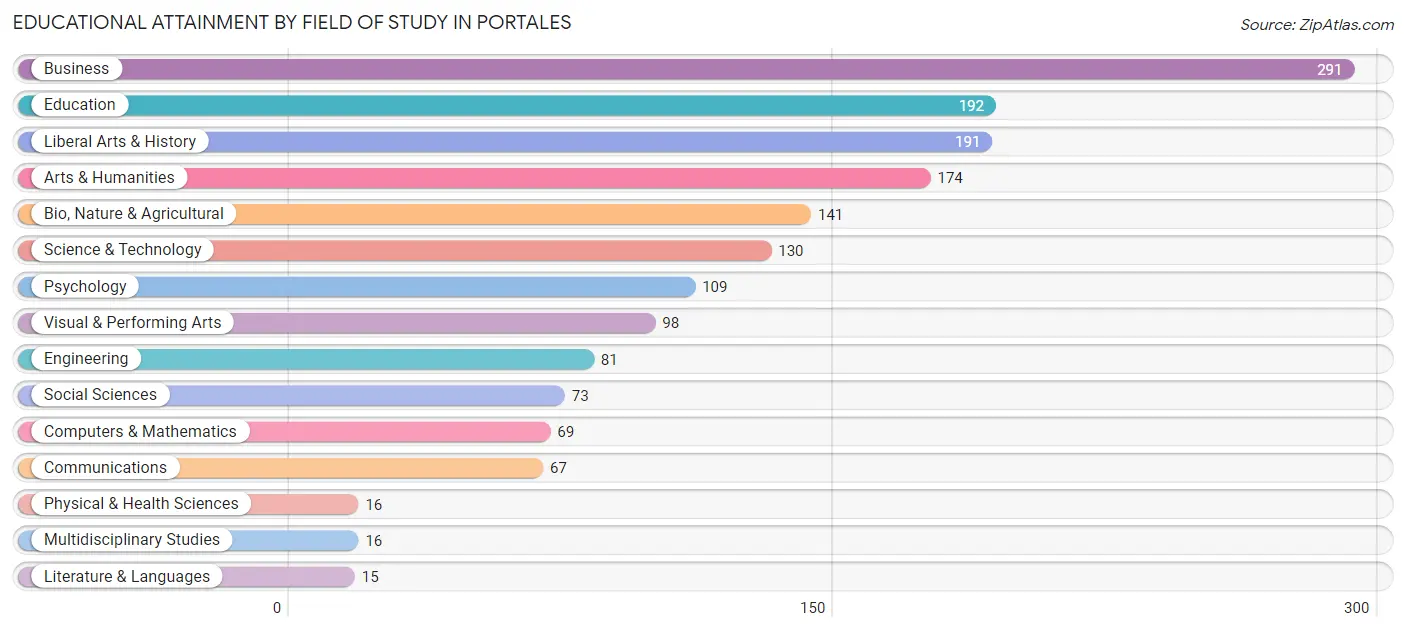
| Field of Study | # Graduates | % Graduates |
| Computers & Mathematics | 69 | 4.2% |
| Bio, Nature & Agricultural | 141 | 8.5% |
| Physical & Health Sciences | 16 | 1.0% |
| Psychology | 109 | 6.6% |
| Social Sciences | 73 | 4.4% |
| Engineering | 81 | 4.9% |
| Multidisciplinary Studies | 16 | 1.0% |
| Science & Technology | 130 | 7.8% |
| Business | 291 | 17.5% |
| Education | 192 | 11.6% |
| Literature & Languages | 15 | 0.9% |
| Liberal Arts & History | 191 | 11.5% |
| Visual & Performing Arts | 98 | 5.9% |
| Communications | 67 | 4.0% |
| Arts & Humanities | 174 | 10.5% |
| Total | 1,663 | 100.0% |
Transportation & Commute in Portales
Vehicle Availability by Sex in Portales
The most prevalent vehicle ownership categories in Portales are males with 2 vehicles (1,039, accounting for 39.9%) and females with 2 vehicles (735, making up 43.8%).
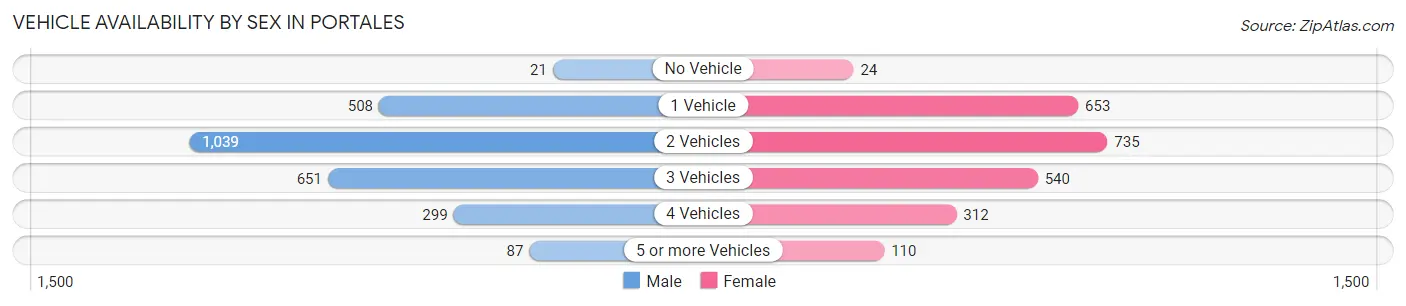
| Vehicles Available | Male | Female |
| No Vehicle | 21 (0.8%) | 24 (1.0%) |
| 1 Vehicle | 508 (19.5%) | 653 (27.5%) |
| 2 Vehicles | 1,039 (39.9%) | 735 (31.0%) |
| 3 Vehicles | 651 (25.0%) | 540 (22.8%) |
| 4 Vehicles | 299 (11.5%) | 312 (13.1%) |
| 5 or more Vehicles | 87 (3.3%) | 110 (4.6%) |
| Total | 2,605 (100.0%) | 2,374 (100.0%) |
Commute Time in Portales
The most frequently occuring commute durations in Portales are 5 to 9 minutes (1,650 commuters, 31.2%), less than 5 minutes (1,122 commuters, 21.2%), and 30 to 34 minutes (794 commuters, 15.0%).
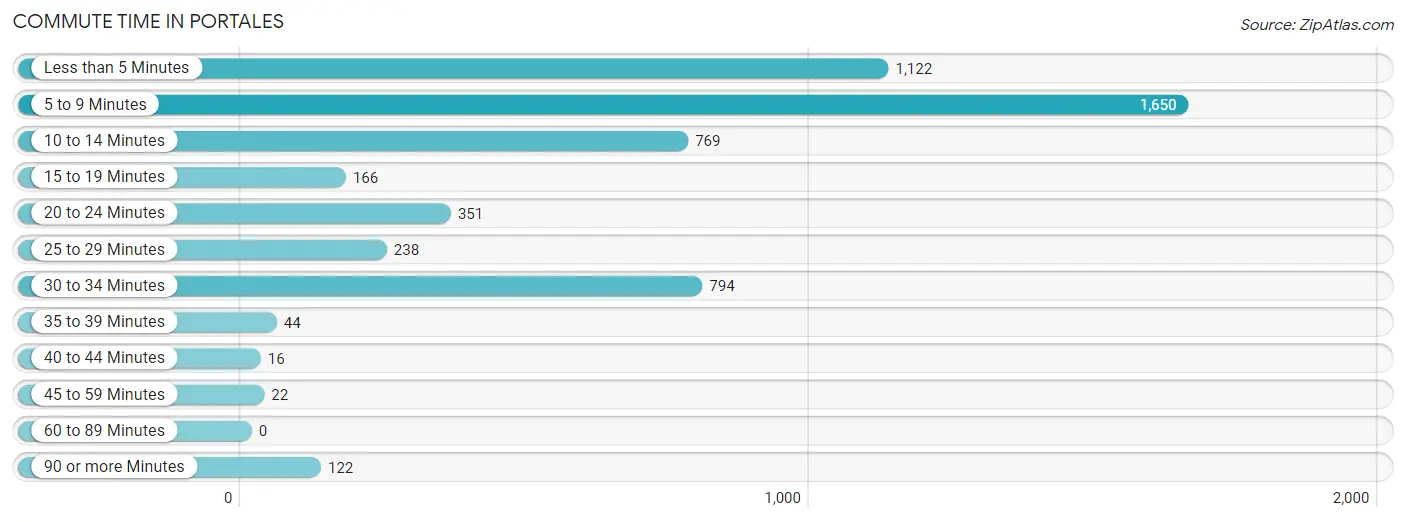
| Commute Time | # Commuters | % Commuters |
| Less than 5 Minutes | 1,122 | 21.2% |
| 5 to 9 Minutes | 1,650 | 31.2% |
| 10 to 14 Minutes | 769 | 14.5% |
| 15 to 19 Minutes | 166 | 3.1% |
| 20 to 24 Minutes | 351 | 6.6% |
| 25 to 29 Minutes | 238 | 4.5% |
| 30 to 34 Minutes | 794 | 15.0% |
| 35 to 39 Minutes | 44 | 0.8% |
| 40 to 44 Minutes | 16 | 0.3% |
| 45 to 59 Minutes | 22 | 0.4% |
| 60 to 89 Minutes | 0 | 0.0% |
| 90 or more Minutes | 122 | 2.3% |
Commute Time by Sex in Portales
The most common commute times in Portales are 5 to 9 minutes (848 commuters, 31.6%) for males and less than 5 minutes (855 commuters, 32.8%) for females.
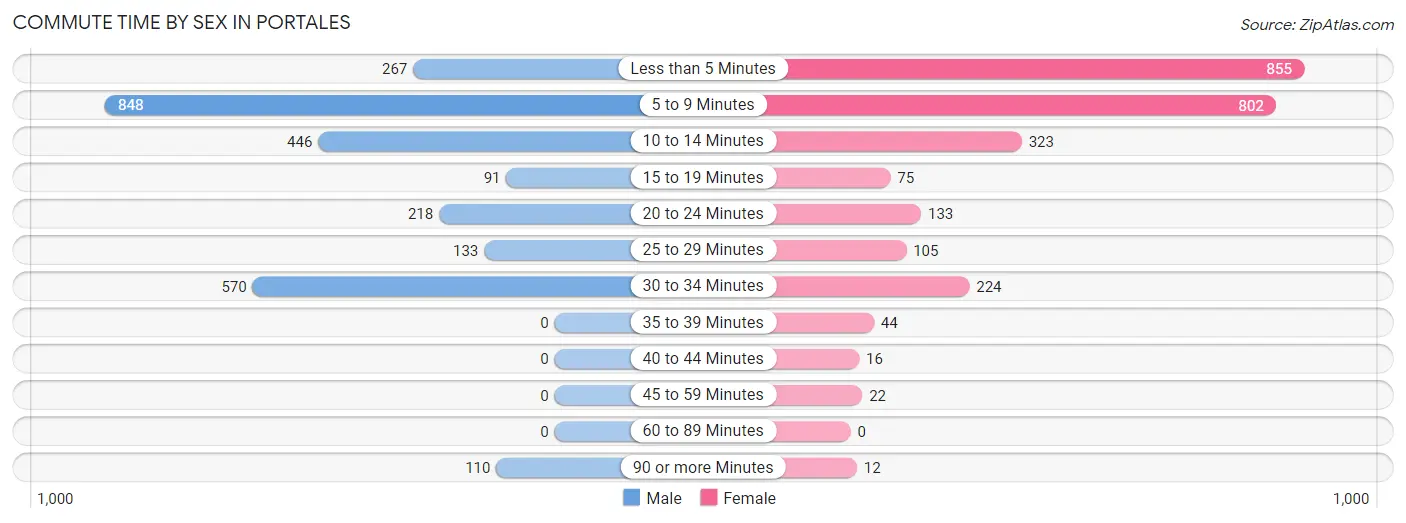
| Commute Time | Male | Female |
| Less than 5 Minutes | 267 (10.0%) | 855 (32.8%) |
| 5 to 9 Minutes | 848 (31.6%) | 802 (30.7%) |
| 10 to 14 Minutes | 446 (16.6%) | 323 (12.4%) |
| 15 to 19 Minutes | 91 (3.4%) | 75 (2.9%) |
| 20 to 24 Minutes | 218 (8.1%) | 133 (5.1%) |
| 25 to 29 Minutes | 133 (5.0%) | 105 (4.0%) |
| 30 to 34 Minutes | 570 (21.2%) | 224 (8.6%) |
| 35 to 39 Minutes | 0 (0.0%) | 44 (1.7%) |
| 40 to 44 Minutes | 0 (0.0%) | 16 (0.6%) |
| 45 to 59 Minutes | 0 (0.0%) | 22 (0.8%) |
| 60 to 89 Minutes | 0 (0.0%) | 0 (0.0%) |
| 90 or more Minutes | 110 (4.1%) | 12 (0.5%) |
Time of Departure to Work by Sex in Portales
The most frequent times of departure to work in Portales are 6:00 AM to 6:29 AM (416, 15.5%) for males and 7:30 AM to 7:59 AM (605, 23.2%) for females.
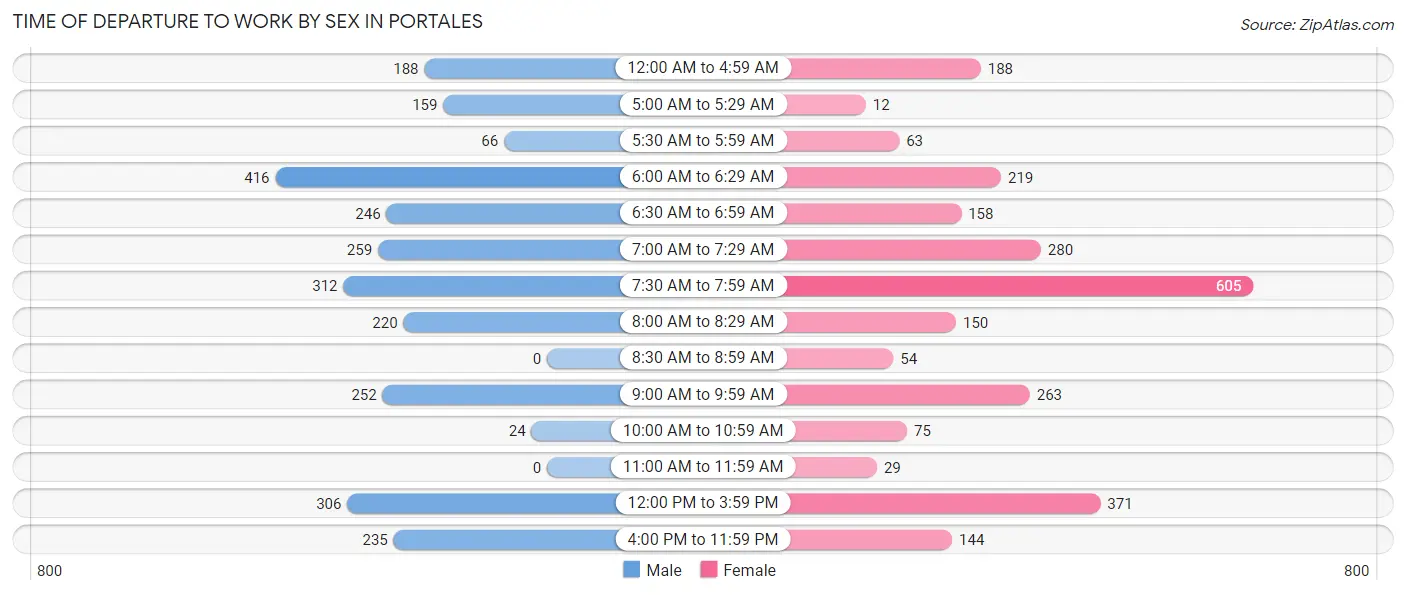
| Time of Departure | Male | Female |
| 12:00 AM to 4:59 AM | 188 (7.0%) | 188 (7.2%) |
| 5:00 AM to 5:29 AM | 159 (5.9%) | 12 (0.5%) |
| 5:30 AM to 5:59 AM | 66 (2.5%) | 63 (2.4%) |
| 6:00 AM to 6:29 AM | 416 (15.5%) | 219 (8.4%) |
| 6:30 AM to 6:59 AM | 246 (9.2%) | 158 (6.0%) |
| 7:00 AM to 7:29 AM | 259 (9.7%) | 280 (10.7%) |
| 7:30 AM to 7:59 AM | 312 (11.6%) | 605 (23.2%) |
| 8:00 AM to 8:29 AM | 220 (8.2%) | 150 (5.7%) |
| 8:30 AM to 8:59 AM | 0 (0.0%) | 54 (2.1%) |
| 9:00 AM to 9:59 AM | 252 (9.4%) | 263 (10.1%) |
| 10:00 AM to 10:59 AM | 24 (0.9%) | 75 (2.9%) |
| 11:00 AM to 11:59 AM | 0 (0.0%) | 29 (1.1%) |
| 12:00 PM to 3:59 PM | 306 (11.4%) | 371 (14.2%) |
| 4:00 PM to 11:59 PM | 235 (8.8%) | 144 (5.5%) |
| Total | 2,683 (100.0%) | 2,611 (100.0%) |
Housing Occupancy in Portales
Occupancy by Ownership in Portales
Of the total 4,285 dwellings in Portales, owner-occupied units account for 2,149 (50.1%), while renter-occupied units make up 2,136 (49.8%).
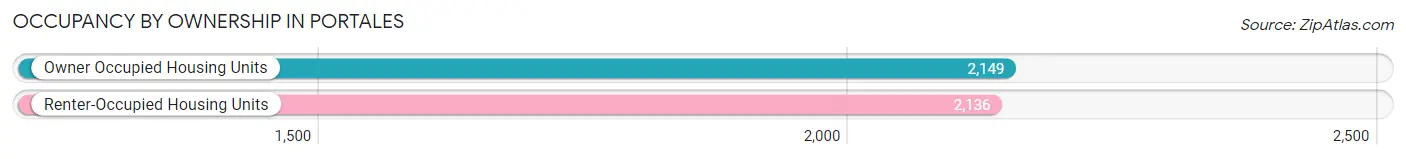
| Occupancy | # Housing Units | % Housing Units |
| Owner Occupied Housing Units | 2,149 | 50.1% |
| Renter-Occupied Housing Units | 2,136 | 49.8% |
| Total Occupied Housing Units | 4,285 | 100.0% |
Occupancy by Household Size in Portales
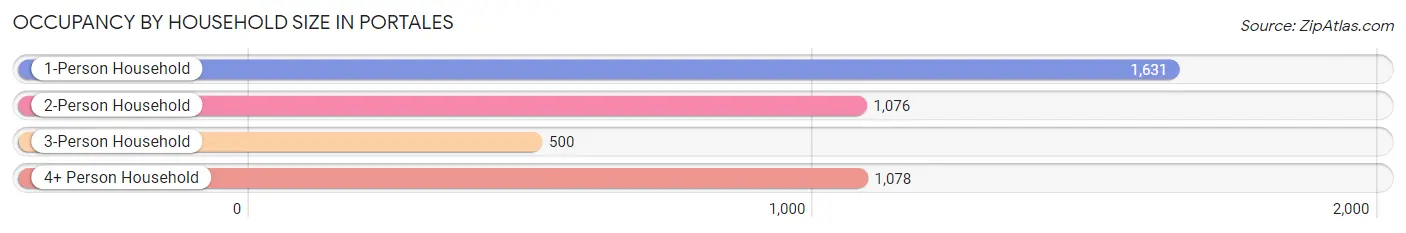
| Household Size | # Housing Units | % Housing Units |
| 1-Person Household | 1,631 | 38.1% |
| 2-Person Household | 1,076 | 25.1% |
| 3-Person Household | 500 | 11.7% |
| 4+ Person Household | 1,078 | 25.2% |
| Total Housing Units | 4,285 | 100.0% |
Occupancy by Ownership by Household Size in Portales
| Household Size | Owner-occupied | Renter-occupied |
| 1-Person Household | 549 (33.7%) | 1,082 (66.3%) |
| 2-Person Household | 673 (62.5%) | 403 (37.4%) |
| 3-Person Household | 330 (66.0%) | 170 (34.0%) |
| 4+ Person Household | 597 (55.4%) | 481 (44.6%) |
| Total Housing Units | 2,149 (50.1%) | 2,136 (49.8%) |
Occupancy by Educational Attainment in Portales
| Household Size | Owner-occupied | Renter-occupied |
| Less than High School | 235 (75.6%) | 76 (24.4%) |
| High School Diploma | 603 (45.0%) | 736 (55.0%) |
| College/Associate Degree | 564 (37.3%) | 948 (62.7%) |
| Bachelor's Degree or higher | 747 (66.5%) | 376 (33.5%) |
Occupancy by Age of Householder in Portales
| Age Bracket | # Households | % Households |
| Under 35 Years | 1,452 | 33.9% |
| 35 to 44 Years | 823 | 19.2% |
| 45 to 54 Years | 461 | 10.8% |
| 55 to 64 Years | 549 | 12.8% |
| 65 to 74 Years | 614 | 14.3% |
| 75 to 84 Years | 258 | 6.0% |
| 85 Years and Over | 128 | 3.0% |
| Total | 4,285 | 100.0% |
Housing Finances in Portales
Median Income by Occupancy in Portales
| Occupancy Type | # Households | Median Income |
| Owner-Occupied | 2,149 (50.1%) | $64,923 |
| Renter-Occupied | 2,136 (49.8%) | $39,885 |
| Average | 4,285 (100.0%) | $49,313 |
Occupancy by Householder Income Bracket in Portales
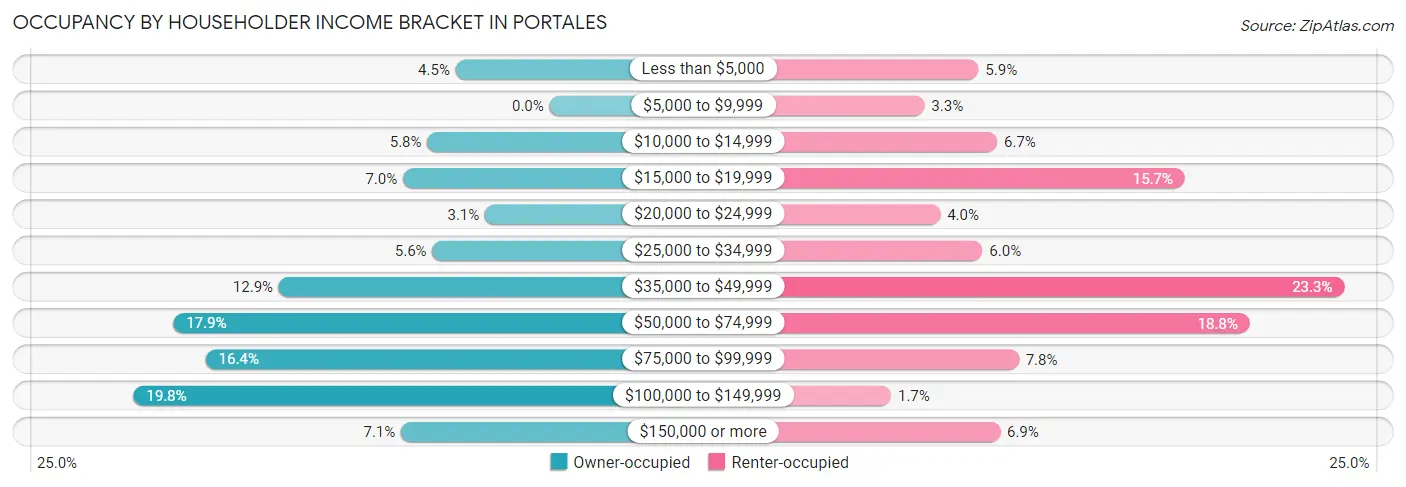
| Income Bracket | Owner-occupied | Renter-occupied |
| Less than $5,000 | 96 (4.5%) | 125 (5.9%) |
| $5,000 to $9,999 | 0 (0.0%) | 70 (3.3%) |
| $10,000 to $14,999 | 125 (5.8%) | 144 (6.7%) |
| $15,000 to $19,999 | 150 (7.0%) | 335 (15.7%) |
| $20,000 to $24,999 | 66 (3.1%) | 86 (4.0%) |
| $25,000 to $34,999 | 120 (5.6%) | 129 (6.0%) |
| $35,000 to $49,999 | 277 (12.9%) | 497 (23.3%) |
| $50,000 to $74,999 | 385 (17.9%) | 401 (18.8%) |
| $75,000 to $99,999 | 352 (16.4%) | 166 (7.8%) |
| $100,000 to $149,999 | 426 (19.8%) | 36 (1.7%) |
| $150,000 or more | 152 (7.1%) | 147 (6.9%) |
| Total | 2,149 (100.0%) | 2,136 (100.0%) |
Monthly Housing Cost Tiers in Portales
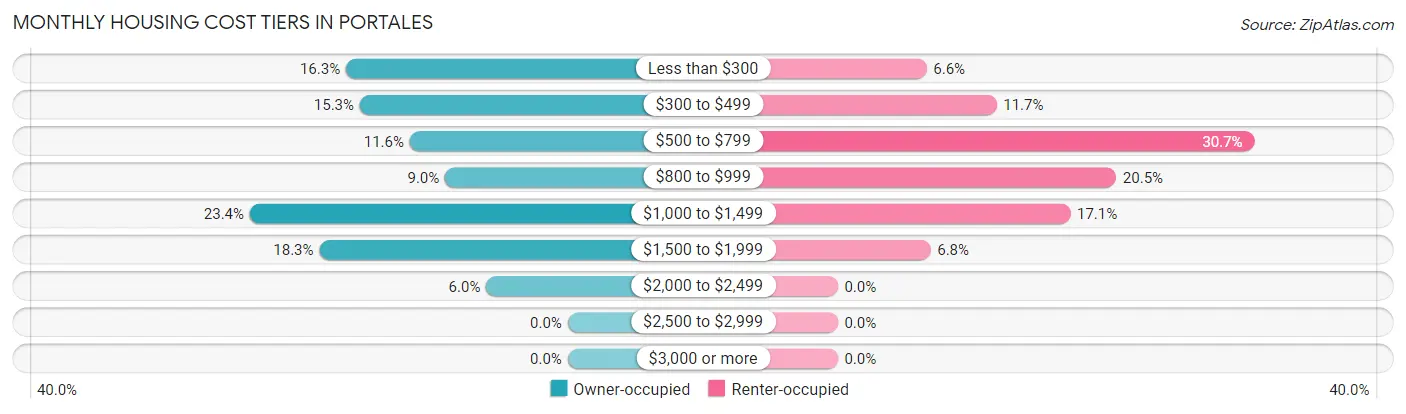
| Monthly Cost | Owner-occupied | Renter-occupied |
| Less than $300 | 351 (16.3%) | 140 (6.6%) |
| $300 to $499 | 329 (15.3%) | 250 (11.7%) |
| $500 to $799 | 250 (11.6%) | 656 (30.7%) |
| $800 to $999 | 194 (9.0%) | 438 (20.5%) |
| $1,000 to $1,499 | 503 (23.4%) | 366 (17.1%) |
| $1,500 to $1,999 | 393 (18.3%) | 146 (6.8%) |
| $2,000 to $2,499 | 129 (6.0%) | 0 (0.0%) |
| $2,500 to $2,999 | 0 (0.0%) | 0 (0.0%) |
| $3,000 or more | 0 (0.0%) | 0 (0.0%) |
| Total | 2,149 (100.0%) | 2,136 (100.0%) |
Physical Housing Characteristics in Portales
Housing Structures in Portales
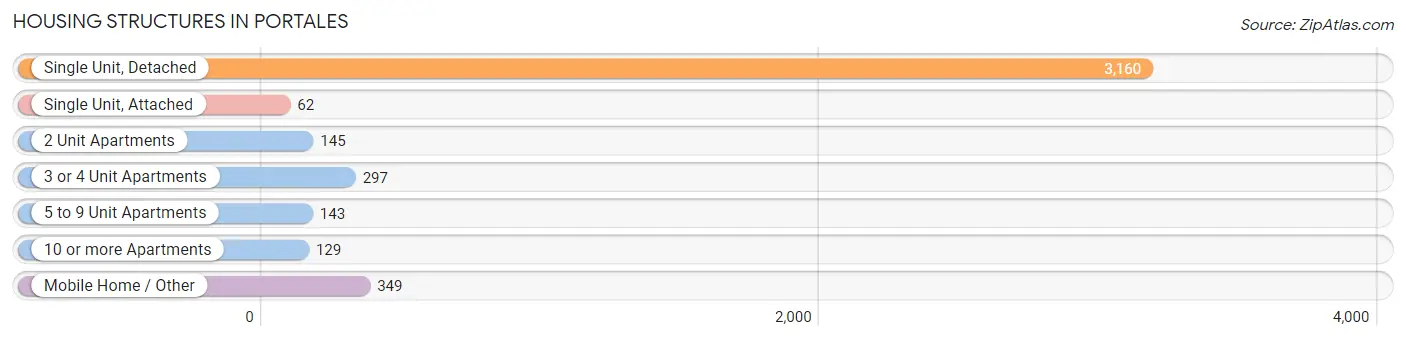
| Structure Type | # Housing Units | % Housing Units |
| Single Unit, Detached | 3,160 | 73.8% |
| Single Unit, Attached | 62 | 1.5% |
| 2 Unit Apartments | 145 | 3.4% |
| 3 or 4 Unit Apartments | 297 | 6.9% |
| 5 to 9 Unit Apartments | 143 | 3.3% |
| 10 or more Apartments | 129 | 3.0% |
| Mobile Home / Other | 349 | 8.1% |
| Total | 4,285 | 100.0% |
Housing Structures by Occupancy in Portales
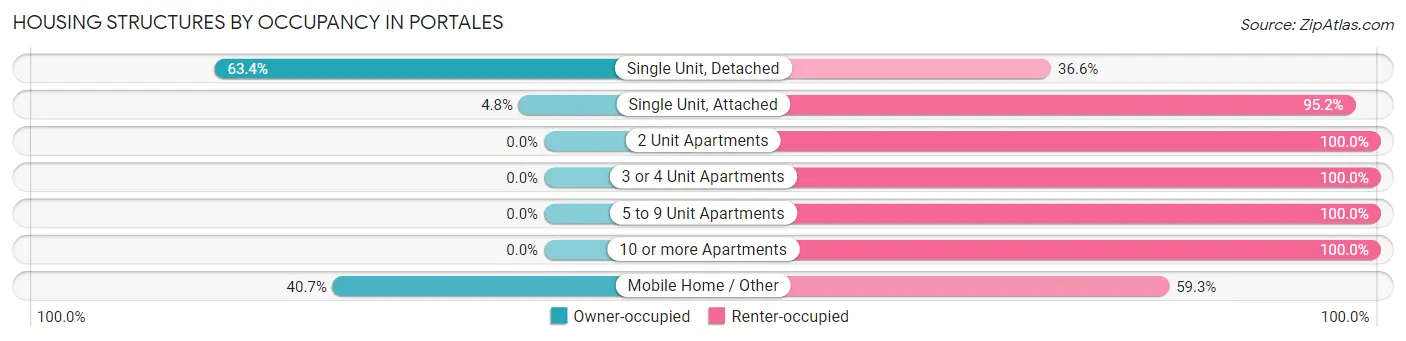
| Structure Type | Owner-occupied | Renter-occupied |
| Single Unit, Detached | 2,004 (63.4%) | 1,156 (36.6%) |
| Single Unit, Attached | 3 (4.8%) | 59 (95.2%) |
| 2 Unit Apartments | 0 (0.0%) | 145 (100.0%) |
| 3 or 4 Unit Apartments | 0 (0.0%) | 297 (100.0%) |
| 5 to 9 Unit Apartments | 0 (0.0%) | 143 (100.0%) |
| 10 or more Apartments | 0 (0.0%) | 129 (100.0%) |
| Mobile Home / Other | 142 (40.7%) | 207 (59.3%) |
| Total | 2,149 (50.1%) | 2,136 (49.8%) |
Housing Structures by Number of Rooms in Portales
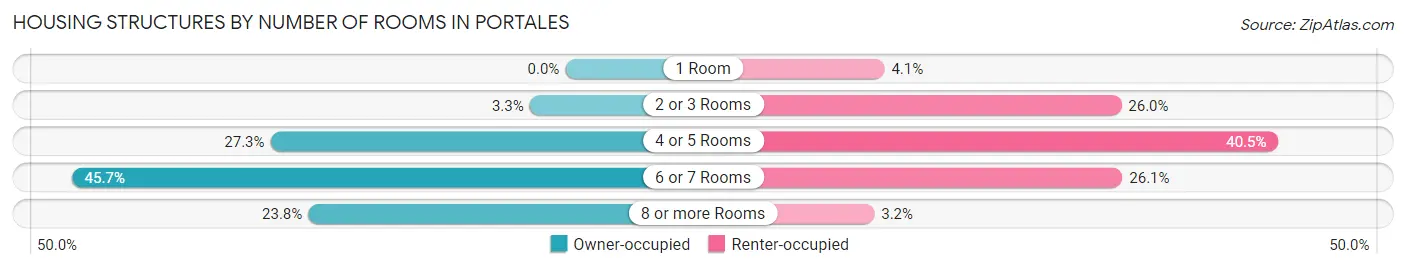
| Number of Rooms | Owner-occupied | Renter-occupied |
| 1 Room | 0 (0.0%) | 88 (4.1%) |
| 2 or 3 Rooms | 71 (3.3%) | 556 (26.0%) |
| 4 or 5 Rooms | 586 (27.3%) | 866 (40.5%) |
| 6 or 7 Rooms | 981 (45.7%) | 558 (26.1%) |
| 8 or more Rooms | 511 (23.8%) | 68 (3.2%) |
| Total | 2,149 (100.0%) | 2,136 (100.0%) |
Housing Structure by Heating Type in Portales
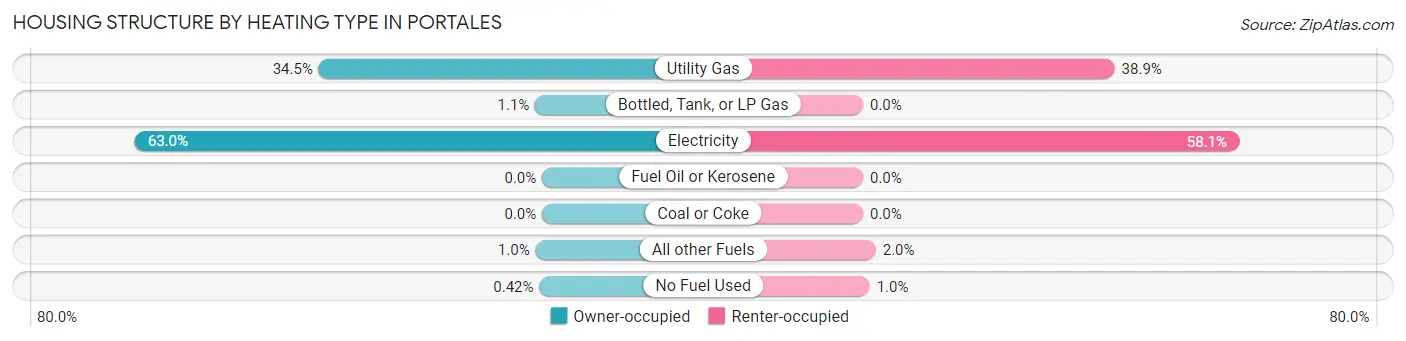
| Heating Type | Owner-occupied | Renter-occupied |
| Utility Gas | 742 (34.5%) | 831 (38.9%) |
| Bottled, Tank, or LP Gas | 23 (1.1%) | 0 (0.0%) |
| Electricity | 1,353 (63.0%) | 1,241 (58.1%) |
| Fuel Oil or Kerosene | 0 (0.0%) | 0 (0.0%) |
| Coal or Coke | 0 (0.0%) | 0 (0.0%) |
| All other Fuels | 22 (1.0%) | 42 (2.0%) |
| No Fuel Used | 9 (0.4%) | 22 (1.0%) |
| Total | 2,149 (100.0%) | 2,136 (100.0%) |
Household Vehicle Usage in Portales
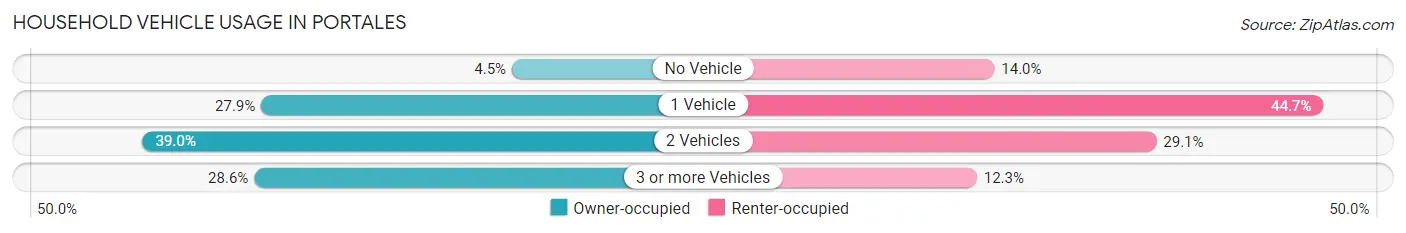
| Vehicles per Household | Owner-occupied | Renter-occupied |
| No Vehicle | 97 (4.5%) | 298 (14.0%) |
| 1 Vehicle | 600 (27.9%) | 954 (44.7%) |
| 2 Vehicles | 838 (39.0%) | 621 (29.1%) |
| 3 or more Vehicles | 614 (28.6%) | 263 (12.3%) |
| Total | 2,149 (100.0%) | 2,136 (100.0%) |
Real Estate & Mortgages in Portales
Real Estate and Mortgage Overview in Portales
| Characteristic | Without Mortgage | With Mortgage |
| Housing Units | 887 | 1,262 |
| Median Property Value | $77,900 | $179,100 |
| Median Household Income | $38,773 | $128 |
| Monthly Housing Costs | $333 | $0 |
| Real Estate Taxes | $439 | $94 |
Property Value by Mortgage Status in Portales
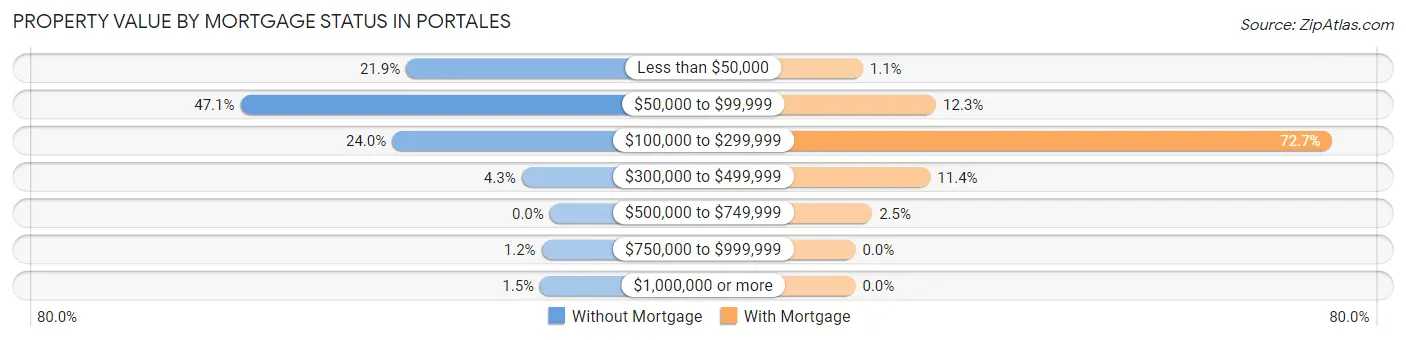
| Property Value | Without Mortgage | With Mortgage |
| Less than $50,000 | 194 (21.9%) | 14 (1.1%) |
| $50,000 to $99,999 | 418 (47.1%) | 155 (12.3%) |
| $100,000 to $299,999 | 213 (24.0%) | 917 (72.7%) |
| $300,000 to $499,999 | 38 (4.3%) | 144 (11.4%) |
| $500,000 to $749,999 | 0 (0.0%) | 32 (2.5%) |
| $750,000 to $999,999 | 11 (1.2%) | 0 (0.0%) |
| $1,000,000 or more | 13 (1.5%) | 0 (0.0%) |
| Total | 887 (100.0%) | 1,262 (100.0%) |
Household Income by Mortgage Status in Portales
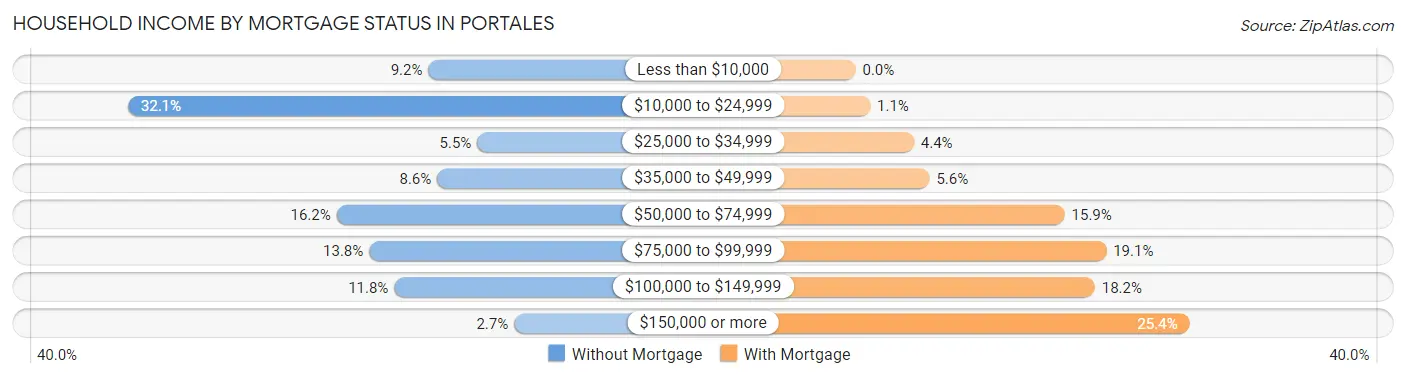
| Household Income | Without Mortgage | With Mortgage |
| Less than $10,000 | 82 (9.2%) | 0 (0.0%) |
| $10,000 to $24,999 | 285 (32.1%) | 14 (1.1%) |
| $25,000 to $34,999 | 49 (5.5%) | 56 (4.4%) |
| $35,000 to $49,999 | 76 (8.6%) | 71 (5.6%) |
| $50,000 to $74,999 | 144 (16.2%) | 201 (15.9%) |
| $75,000 to $99,999 | 122 (13.8%) | 241 (19.1%) |
| $100,000 to $149,999 | 105 (11.8%) | 230 (18.2%) |
| $150,000 or more | 24 (2.7%) | 321 (25.4%) |
| Total | 887 (100.0%) | 1,262 (100.0%) |
Property Value to Household Income Ratio in Portales
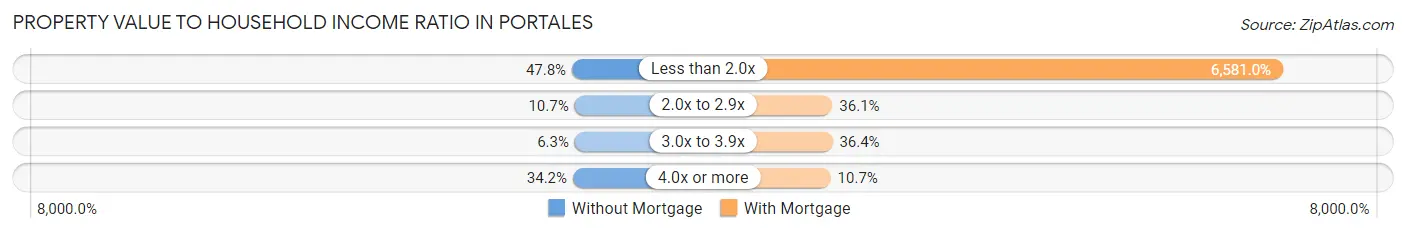
| Value-to-Income Ratio | Without Mortgage | With Mortgage |
| Less than 2.0x | 424 (47.8%) | 83,052 (6,581.0%) |
| 2.0x to 2.9x | 95 (10.7%) | 455 (36.0%) |
| 3.0x to 3.9x | 56 (6.3%) | 459 (36.4%) |
| 4.0x or more | 303 (34.2%) | 135 (10.7%) |
| Total | 887 (100.0%) | 1,262 (100.0%) |
Real Estate Taxes by Mortgage Status in Portales
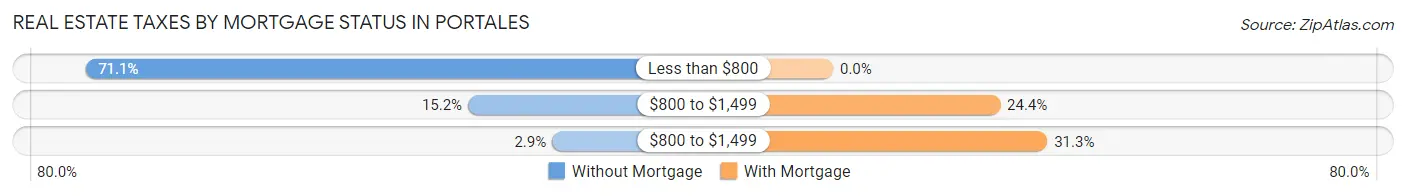
| Property Taxes | Without Mortgage | With Mortgage |
| Less than $800 | 631 (71.1%) | 0 (0.0%) |
| $800 to $1,499 | 135 (15.2%) | 308 (24.4%) |
| $800 to $1,499 | 26 (2.9%) | 395 (31.3%) |
| Total | 887 (100.0%) | 1,262 (100.0%) |
Health & Disability in Portales
Health Insurance Coverage by Age in Portales
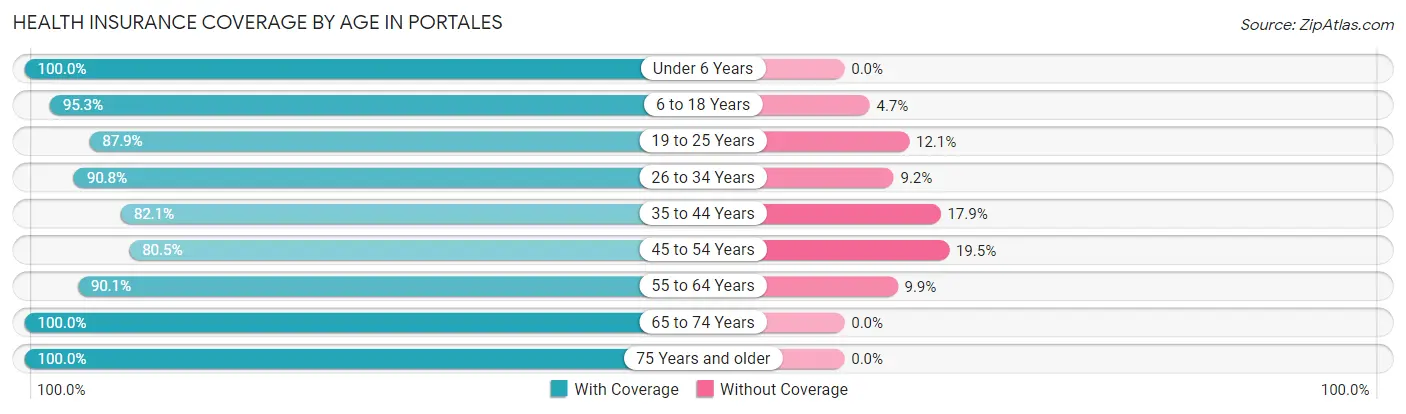
| Age Bracket | With Coverage | Without Coverage |
| Under 6 Years | 807 (100.0%) | 0 (0.0%) |
| 6 to 18 Years | 2,368 (95.3%) | 117 (4.7%) |
| 19 to 25 Years | 2,155 (87.9%) | 296 (12.1%) |
| 26 to 34 Years | 1,148 (90.8%) | 116 (9.2%) |
| 35 to 44 Years | 1,281 (82.1%) | 280 (17.9%) |
| 45 to 54 Years | 672 (80.5%) | 163 (19.5%) |
| 55 to 64 Years | 816 (90.1%) | 90 (9.9%) |
| 65 to 74 Years | 901 (100.0%) | 0 (0.0%) |
| 75 Years and older | 555 (100.0%) | 0 (0.0%) |
| Total | 10,703 (91.0%) | 1,062 (9.0%) |
Health Insurance Coverage by Citizenship Status in Portales
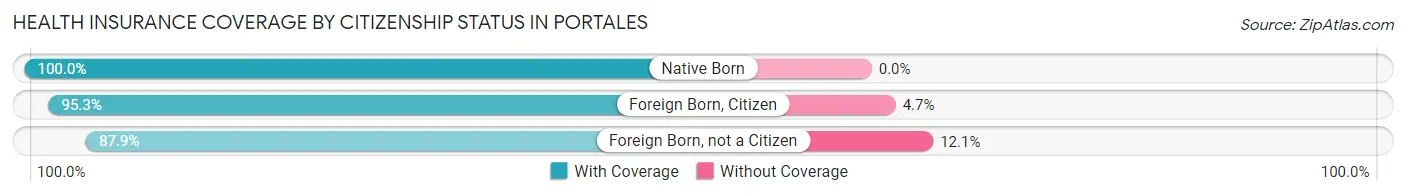
| Citizenship Status | With Coverage | Without Coverage |
| Native Born | 807 (100.0%) | 0 (0.0%) |
| Foreign Born, Citizen | 2,368 (95.3%) | 117 (4.7%) |
| Foreign Born, not a Citizen | 2,155 (87.9%) | 296 (12.1%) |
Health Insurance Coverage by Household Income in Portales
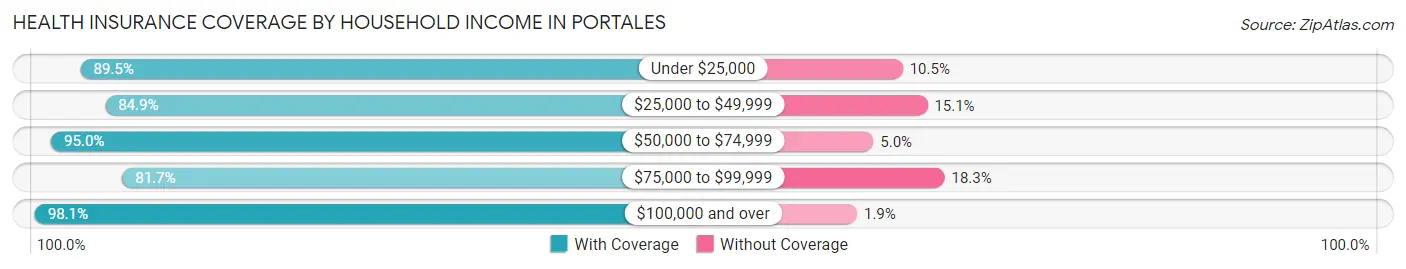
| Household Income | With Coverage | Without Coverage |
| Under $25,000 | 1,819 (89.5%) | 213 (10.5%) |
| $25,000 to $49,999 | 2,096 (84.9%) | 373 (15.1%) |
| $50,000 to $74,999 | 2,250 (95.0%) | 118 (5.0%) |
| $75,000 to $99,999 | 964 (81.7%) | 216 (18.3%) |
| $100,000 and over | 2,809 (98.1%) | 55 (1.9%) |
Public vs Private Health Insurance Coverage by Age in Portales
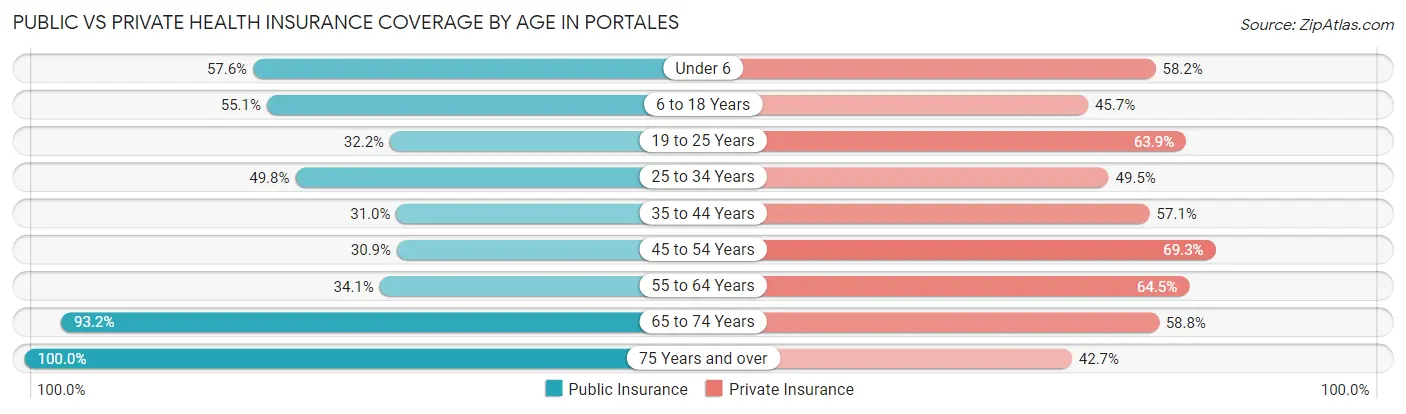
| Age Bracket | Public Insurance | Private Insurance |
| Under 6 | 465 (57.6%) | 470 (58.2%) |
| 6 to 18 Years | 1,368 (55.0%) | 1,136 (45.7%) |
| 19 to 25 Years | 789 (32.2%) | 1,566 (63.9%) |
| 25 to 34 Years | 629 (49.8%) | 626 (49.5%) |
| 35 to 44 Years | 484 (31.0%) | 892 (57.1%) |
| 45 to 54 Years | 258 (30.9%) | 579 (69.3%) |
| 55 to 64 Years | 309 (34.1%) | 584 (64.5%) |
| 65 to 74 Years | 840 (93.2%) | 530 (58.8%) |
| 75 Years and over | 555 (100.0%) | 237 (42.7%) |
| Total | 5,697 (48.4%) | 6,620 (56.3%) |
Disability Status by Sex by Age in Portales
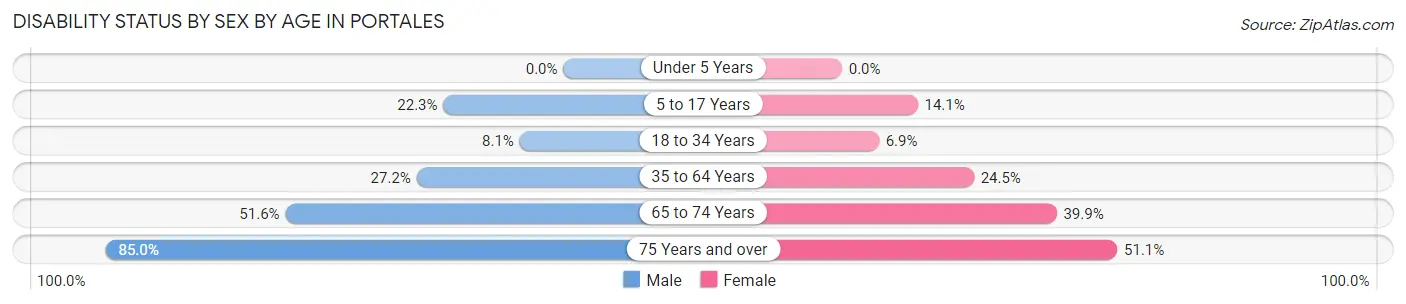
| Age Bracket | Male | Female |
| Under 5 Years | 0 (0.0%) | 0 (0.0%) |
| 5 to 17 Years | 282 (22.3%) | 152 (14.1%) |
| 18 to 34 Years | 144 (8.1%) | 150 (6.9%) |
| 35 to 64 Years | 412 (27.2%) | 438 (24.5%) |
| 65 to 74 Years | 259 (51.6%) | 159 (39.9%) |
| 75 Years and over | 164 (85.0%) | 185 (51.1%) |
Disability Class by Sex by Age in Portales
Disability Class: Hearing Difficulty
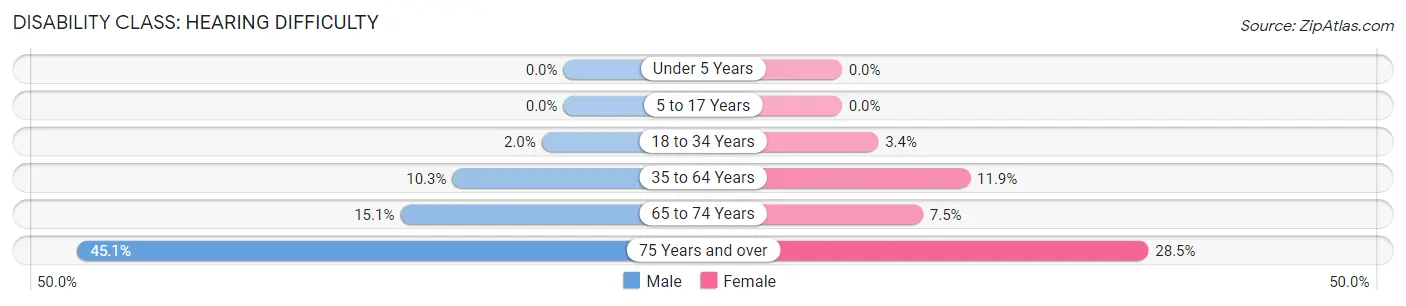
| Age Bracket | Male | Female |
| Under 5 Years | 0 (0.0%) | 0 (0.0%) |
| 5 to 17 Years | 0 (0.0%) | 0 (0.0%) |
| 18 to 34 Years | 36 (2.0%) | 74 (3.4%) |
| 35 to 64 Years | 156 (10.3%) | 213 (11.9%) |
| 65 to 74 Years | 76 (15.1%) | 30 (7.5%) |
| 75 Years and over | 87 (45.1%) | 103 (28.4%) |
Disability Class: Vision Difficulty
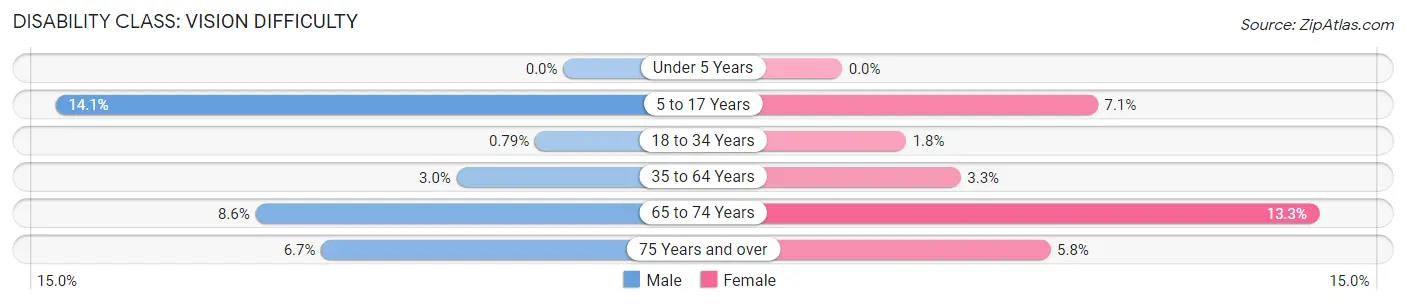
| Age Bracket | Male | Female |
| Under 5 Years | 0 (0.0%) | 0 (0.0%) |
| 5 to 17 Years | 179 (14.1%) | 77 (7.1%) |
| 18 to 34 Years | 14 (0.8%) | 39 (1.8%) |
| 35 to 64 Years | 45 (3.0%) | 59 (3.3%) |
| 65 to 74 Years | 43 (8.6%) | 53 (13.3%) |
| 75 Years and over | 13 (6.7%) | 21 (5.8%) |
Disability Class: Cognitive Difficulty
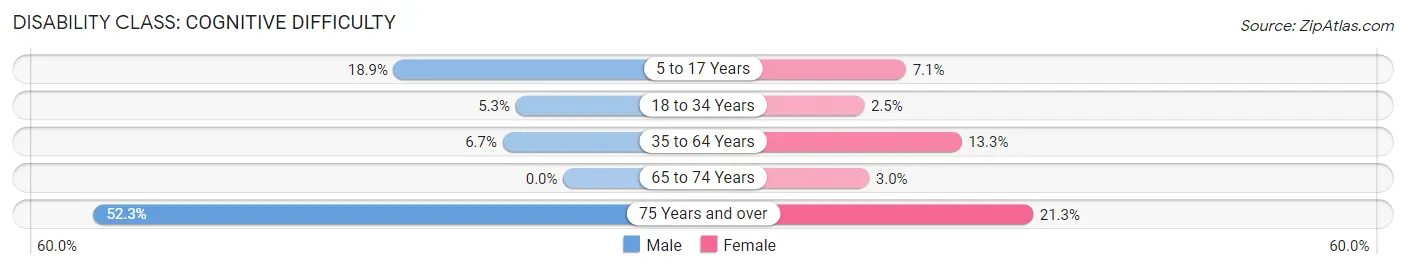
| Age Bracket | Male | Female |
| 5 to 17 Years | 239 (18.9%) | 77 (7.1%) |
| 18 to 34 Years | 94 (5.3%) | 54 (2.5%) |
| 35 to 64 Years | 102 (6.7%) | 238 (13.3%) |
| 65 to 74 Years | 0 (0.0%) | 12 (3.0%) |
| 75 Years and over | 101 (52.3%) | 77 (21.3%) |
Disability Class: Ambulatory Difficulty
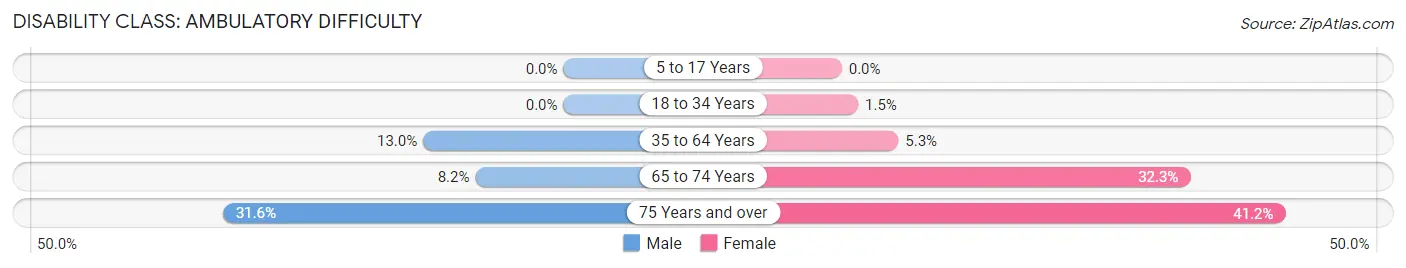
| Age Bracket | Male | Female |
| 5 to 17 Years | 0 (0.0%) | 0 (0.0%) |
| 18 to 34 Years | 0 (0.0%) | 33 (1.5%) |
| 35 to 64 Years | 197 (13.0%) | 94 (5.2%) |
| 65 to 74 Years | 41 (8.2%) | 129 (32.3%) |
| 75 Years and over | 61 (31.6%) | 149 (41.2%) |
Disability Class: Self-Care Difficulty
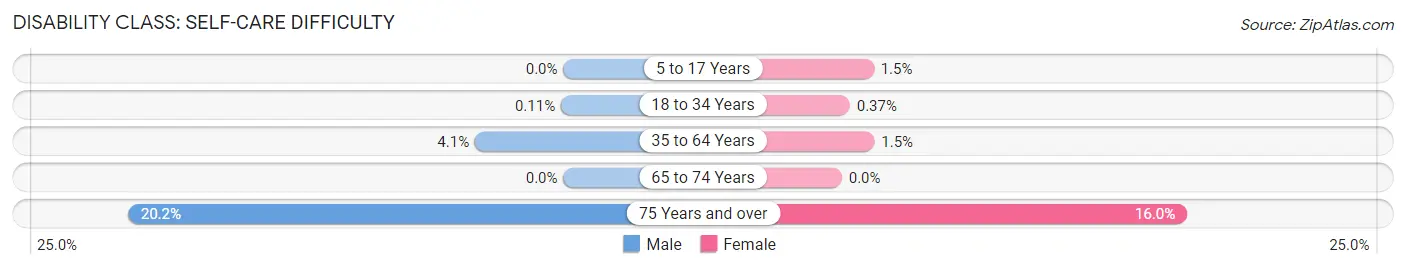
| Age Bracket | Male | Female |
| 5 to 17 Years | 0 (0.0%) | 16 (1.5%) |
| 18 to 34 Years | 2 (0.1%) | 8 (0.4%) |
| 35 to 64 Years | 62 (4.1%) | 27 (1.5%) |
| 65 to 74 Years | 0 (0.0%) | 0 (0.0%) |
| 75 Years and over | 39 (20.2%) | 58 (16.0%) |
Technology Access in Portales
Computing Device Access in Portales
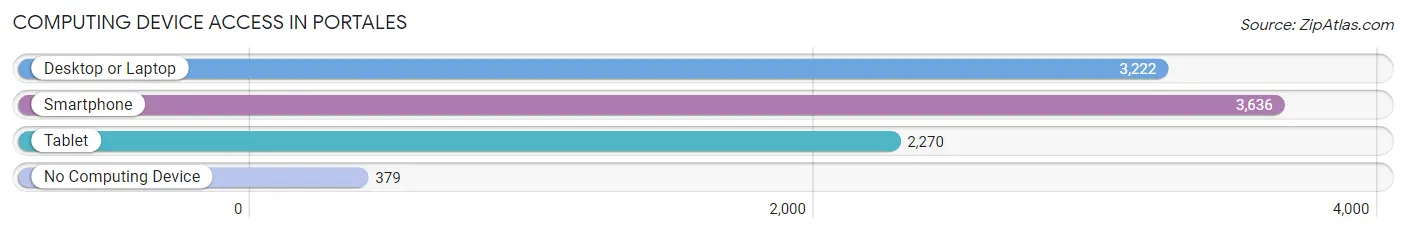
| Device Type | # Households | % Households |
| Desktop or Laptop | 3,222 | 75.2% |
| Smartphone | 3,636 | 84.9% |
| Tablet | 2,270 | 53.0% |
| No Computing Device | 379 | 8.8% |
| Total | 4,285 | 100.0% |
Internet Access in Portales
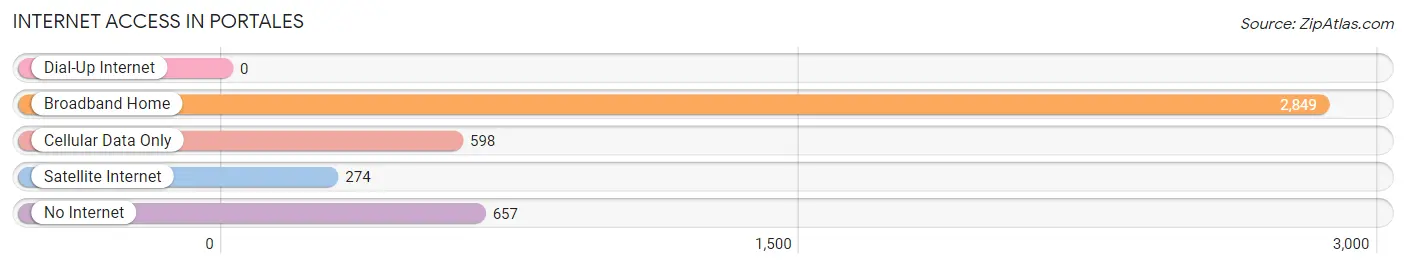
| Internet Type | # Households | % Households |
| Dial-Up Internet | 0 | 0.0% |
| Broadband Home | 2,849 | 66.5% |
| Cellular Data Only | 598 | 14.0% |
| Satellite Internet | 274 | 6.4% |
| No Internet | 657 | 15.3% |
| Total | 4,285 | 100.0% |
Portales Summary
Portales, New Mexico is a small city located in the eastern part of the state. It is the county seat of Roosevelt County and is home to about 11,000 people. The city is located in the Llano Estacado region of the state, which is known for its flat terrain and wide open spaces. The city is situated at an elevation of 3,845 feet and is located about 30 miles from the Texas border.
Portales was founded in 1898 by the Santa Fe Railroad and was named after the nearby Portales Valley. The city was originally a farming community, but it has since grown to become a major center for agriculture, education, and industry.
Geography
Portales is located in the Llano Estacado region of New Mexico, which is known for its flat terrain and wide open spaces. The city is situated at an elevation of 3,845 feet and is located about 30 miles from the Texas border. The city is located in the High Plains region of the state, which is characterized by its dry climate and sparse vegetation. The city is located in the center of Roosevelt County and is surrounded by the communities of Elida, Floyd, Dora, and Causey.
The city is located in the center of the Llano Estacado, which is a large area of flat land that stretches from the Texas Panhandle to the New Mexico border. The city is located in the center of the region, which is known for its wide open spaces and sparse vegetation. The city is located in a semi-arid climate, which is characterized by hot summers and cold winters.
Economy
Portales is a major center for agriculture, education, and industry. The city is home to several large agricultural operations, including dairy farms, cotton farms, and feedlots. The city is also home to several large food processing plants, which process and package food products for distribution throughout the region.
The city is also home to Eastern New Mexico University, which is a major employer in the city. The university is home to over 6,000 students and employs over 1,000 faculty and staff. The university is also home to several research centers, which focus on a variety of topics, including agriculture, energy, and health sciences.
The city is also home to several large manufacturing companies, which produce a variety of products, including furniture, clothing, and electronics. The city is also home to several large retail stores, which provide a variety of goods and services to the local community.
Demographics
As of the 2010 census, the population of Portales was 11,131. The city has a population density of 1,845 people per square mile. The racial makeup of the city is 73.3% White, 1.3% African American, 0.9% Native American, 0.7% Asian, 0.1% Pacific Islander, and 22.7% from other races. The median household income in the city is $31,945, and the median family income is $41,945.
The city is home to several large churches, including the First United Methodist Church, the First Baptist Church, and the Church of Jesus Christ of Latter-day Saints. The city is also home to several large parks, including the Portales Municipal Park, the Portales Recreation Center, and the Portales Sports Complex.
Conclusion
Portales, New Mexico is a small city located in the eastern part of the state. It is the county seat of Roosevelt County and is home to about 11,000 people. The city is located in the Llano Estacado region of the state, which is known for its flat terrain and wide open spaces. The city is a major center for agriculture, education, and industry, and is home to several large agricultural operations, food processing plants, and manufacturing companies. The city is also home to Eastern New Mexico University, which is a major employer in the city. The city has a population of 11,131, and the median household income is $31,945. The city is home to several large churches and parks, and is a great place to live and work.
Common Questions
What is Per Capita Income in Portales?
Per Capita income in Portales is $22,236.
What is the Median Family Income in Portales?
Median Family Income in Portales is $67,600.
What is the Median Household income in Portales?
Median Household Income in Portales is $49,313.
What is Income or Wage Gap in Portales?
Income or Wage Gap in Portales is 40.8%.
Women in Portales earn 59.2 cents for every dollar earned by a man.
What is Family Income Deficit in Portales?
Family Income Deficit in Portales is $13,066.
Families that are below poverty line in Portales earn $13,066 less on average than the poverty threshold level.
What is Inequality or Gini Index in Portales?
Inequality or Gini Index in Portales is 0.43.
What is the Total Population of Portales?
Total Population of Portales is 12,085.
What is the Total Male Population of Portales?
Total Male Population of Portales is 5,752.
What is the Total Female Population of Portales?
Total Female Population of Portales is 6,333.
What is the Ratio of Males per 100 Females in Portales?
There are 90.83 Males per 100 Females in Portales.
What is the Ratio of Females per 100 Males in Portales?
There are 110.10 Females per 100 Males in Portales.
What is the Median Population Age in Portales?
Median Population Age in Portales is 27.1 Years.
What is the Average Family Size in Portales
Average Family Size in Portales is 3.5 People.
What is the Average Household Size in Portales
Average Household Size in Portales is 2.6 People.
How Large is the Labor Force in Portales?
There are 5,967 People in the Labor Forcein in Portales.
What is the Percentage of People in the Labor Force in Portales?
64.2% of People are in the Labor Force in Portales.
What is the Unemployment Rate in Portales?
Unemployment Rate in Portales is 9.5%.