Pinos Altos, NM Map & Demographics
Pinos Altos Map
Pinos Altos Overview
$27,598
PER CAPITA INCOME
0.64
INEQUALITY / GINI INDEX
185
TOTAL POPULATION
101
MALE POPULATION
84
FEMALE POPULATION
120.24
MALES / 100 FEMALES
83.17
FEMALES / 100 MALES
55.9
MEDIAN AGE
3.1
AVG FAMILY SIZE
1.8
AVG HOUSEHOLD SIZE
29
LABOR FORCE [ PEOPLE ]
15.7%
PERCENT IN LABOR FORCE
37.9%
UNEMPLOYMENT RATE
Pinos Altos Zip Codes
Pinos Altos Area Codes
Income in Pinos Altos
Income Overview in Pinos Altos
| Characteristic | Number | Measure |
| Per Capita Income | 185 | $27,598 |
| Median Family Income | 39 | $0 |
| Mean Family Income | 39 | $100,928 |
| Median Household Income | 102 | $0 |
| Mean Household Income | 102 | $49,183 |
| Income Deficit | 39 | $0 |
| Wage / Income Gap (%) | 185 | 0.00% |
| Wage / Income Gap ($) | 185 | 100.00¢ per $1 |
| Gini / Inequality Index | 185 | 0.64 |
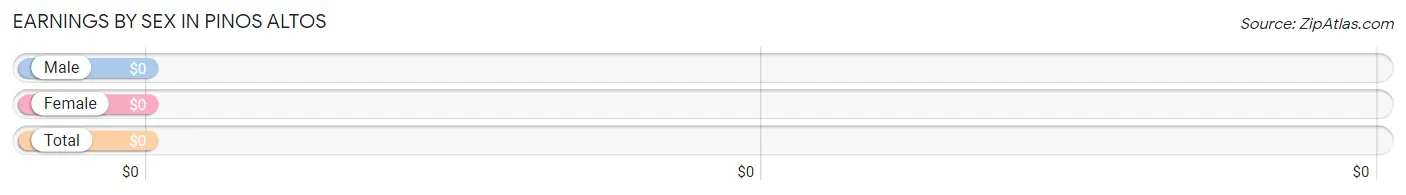
Earnings by Sex in Pinos Altos
| Sex | Number | Average Earnings |
| Male | 18 (100.0%) | $0 |
| Female | 0 (0.0%) | $0 |
| Total | 18 (100.0%) | $0 |
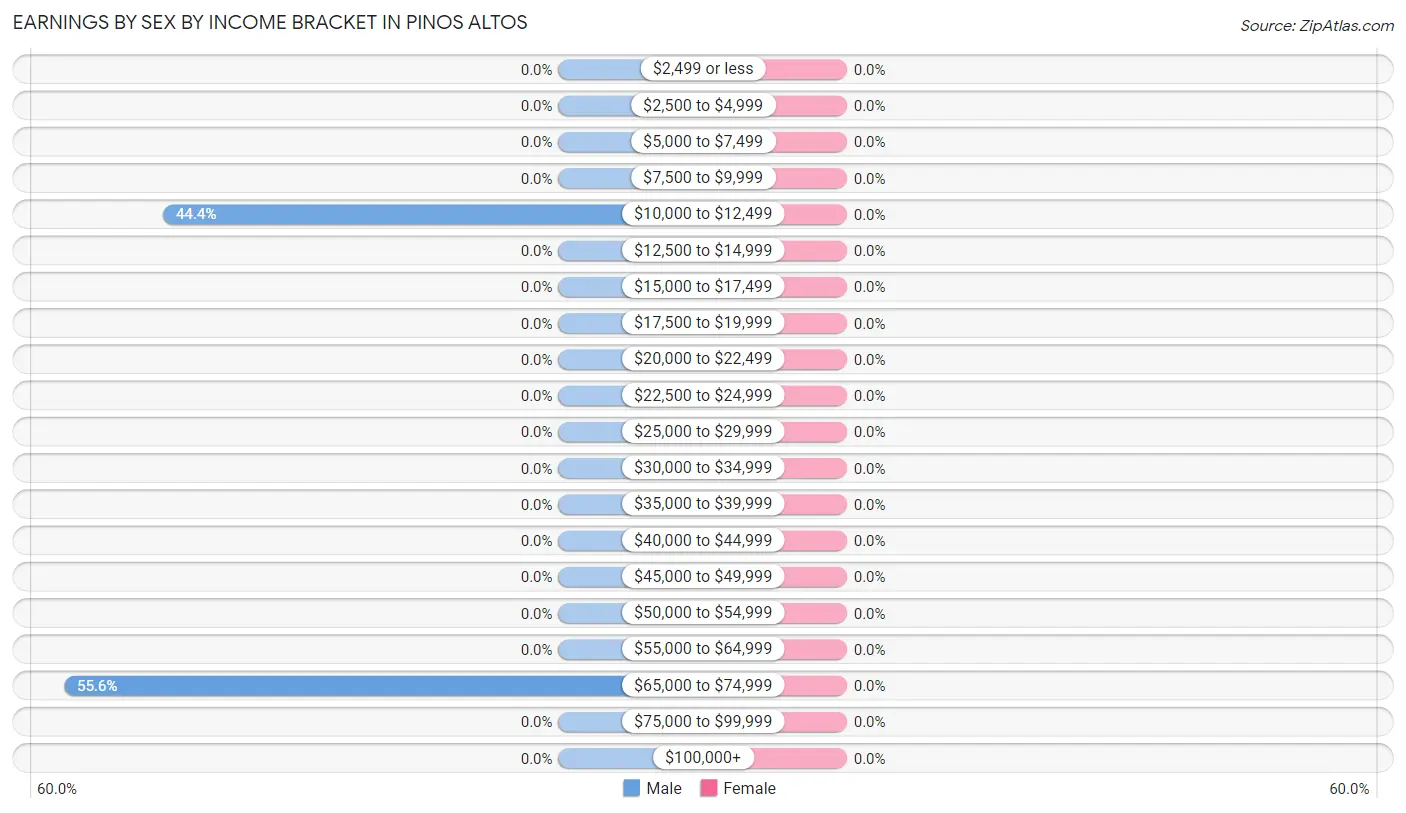
Earnings by Sex by Income Bracket in Pinos Altos
| Income | Male | Female |
| $2,499 or less | 0 (0.0%) | 0 (0.0%) |
| $2,500 to $4,999 | 0 (0.0%) | 0 (0.0%) |
| $5,000 to $7,499 | 0 (0.0%) | 0 (0.0%) |
| $7,500 to $9,999 | 0 (0.0%) | 0 (0.0%) |
| $10,000 to $12,499 | 8 (44.4%) | 0 (0.0%) |
| $12,500 to $14,999 | 0 (0.0%) | 0 (0.0%) |
| $15,000 to $17,499 | 0 (0.0%) | 0 (0.0%) |
| $17,500 to $19,999 | 0 (0.0%) | 0 (0.0%) |
| $20,000 to $22,499 | 0 (0.0%) | 0 (0.0%) |
| $22,500 to $24,999 | 0 (0.0%) | 0 (0.0%) |
| $25,000 to $29,999 | 0 (0.0%) | 0 (0.0%) |
| $30,000 to $34,999 | 0 (0.0%) | 0 (0.0%) |
| $35,000 to $39,999 | 0 (0.0%) | 0 (0.0%) |
| $40,000 to $44,999 | 0 (0.0%) | 0 (0.0%) |
| $45,000 to $49,999 | 0 (0.0%) | 0 (0.0%) |
| $50,000 to $54,999 | 0 (0.0%) | 0 (0.0%) |
| $55,000 to $64,999 | 0 (0.0%) | 0 (0.0%) |
| $65,000 to $74,999 | 10 (55.6%) | 0 (0.0%) |
| $75,000 to $99,999 | 0 (0.0%) | 0 (0.0%) |
| $100,000+ | 0 (0.0%) | 0 (0.0%) |
| Total | 18 (100.0%) | 0 (0.0%) |
Earnings by Sex by Educational Attainment in Pinos Altos
| Educational Attainment | Male Income | Female Income |
| Less than High School | - | - |
| High School Diploma | - | - |
| College or Associate's Degree | - | - |
| Bachelor's Degree | - | - |
| Graduate Degree | - | - |
| Total | - | - |
Family Income in Pinos Altos
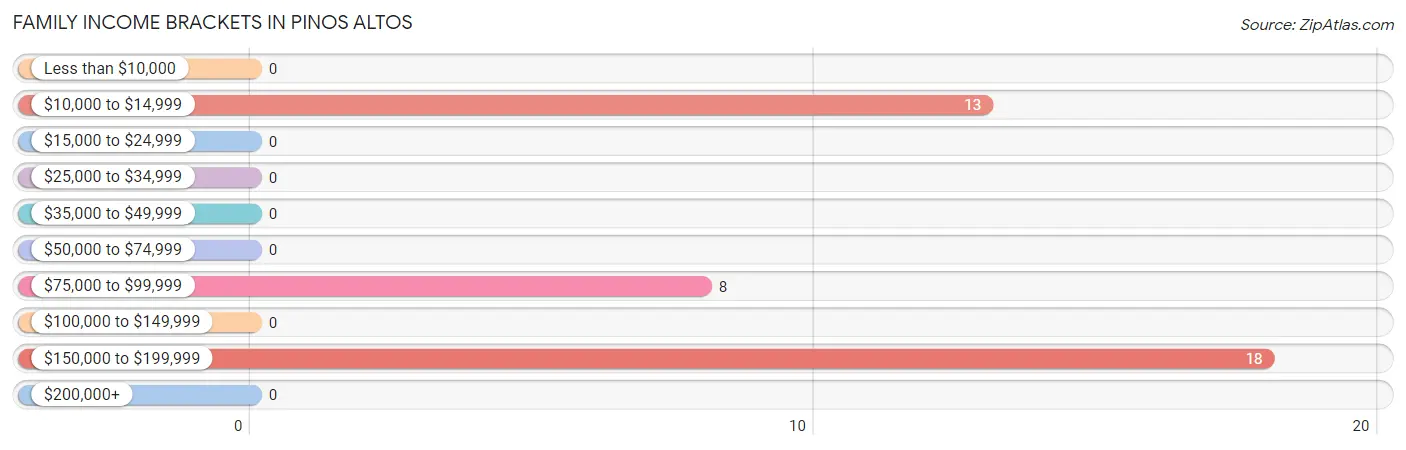
Family Income Brackets in Pinos Altos
According to the Pinos Altos family income data, there are 18 families falling into the $150,000 to $199,999 income range, which is the most common income bracket and makes up 46.2% of all families.
| Income Bracket | # Families | % Families |
| Less than $10,000 | 0 | 0.0% |
| $10,000 to $14,999 | 13 | 33.3% |
| $15,000 to $24,999 | 0 | 0.0% |
| $25,000 to $34,999 | 0 | 0.0% |
| $35,000 to $49,999 | 0 | 0.0% |
| $50,000 to $74,999 | 0 | 0.0% |
| $75,000 to $99,999 | 8 | 20.5% |
| $100,000 to $149,999 | 0 | 0.0% |
| $150,000 to $199,999 | 18 | 46.2% |
| $200,000+ | 0 | 0.0% |
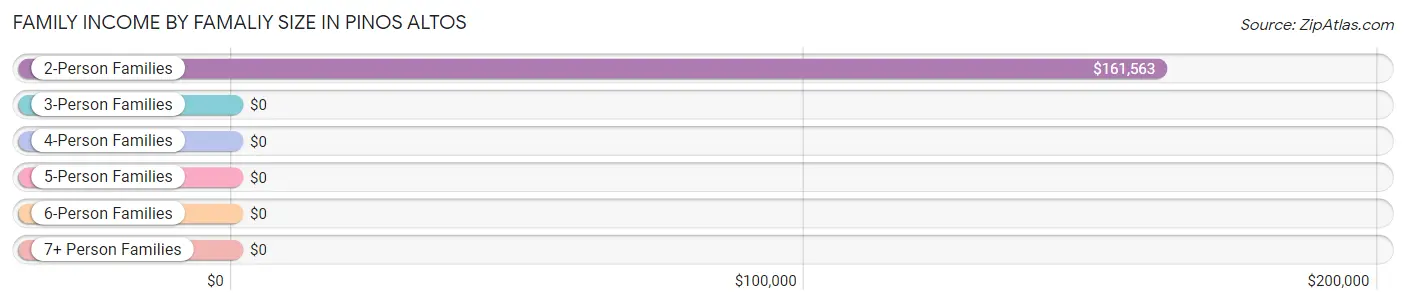
Family Income by Famaliy Size in Pinos Altos
2-person families (26 | 66.7%) account for the highest median family income in Pinos Altos with $161,563 per family, while 2-person families (26 | 66.7%) have the highest median income of $80,782 per family member.
| Income Bracket | # Families | Median Income |
| 2-Person Families | 26 (66.7%) | $161,563 |
| 3-Person Families | 13 (33.3%) | $0 |
| 4-Person Families | 0 (0.0%) | $0 |
| 5-Person Families | 0 (0.0%) | $0 |
| 6-Person Families | 0 (0.0%) | $0 |
| 7+ Person Families | 0 (0.0%) | $0 |
| Total | 39 (100.0%) | $0 |
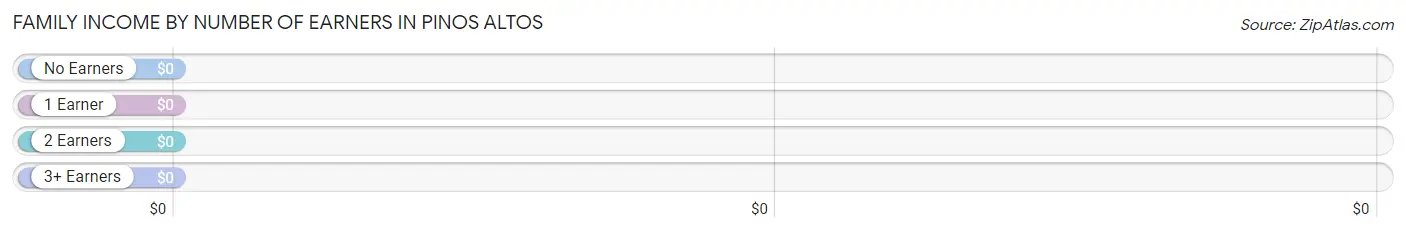
Family Income by Number of Earners in Pinos Altos
| Number of Earners | # Families | Median Income |
| No Earners | 21 (53.8%) | $0 |
| 1 Earner | 18 (46.2%) | $0 |
| 2 Earners | 0 (0.0%) | $0 |
| 3+ Earners | 0 (0.0%) | $0 |
| Total | 39 (100.0%) | $0 |
Household Income in Pinos Altos
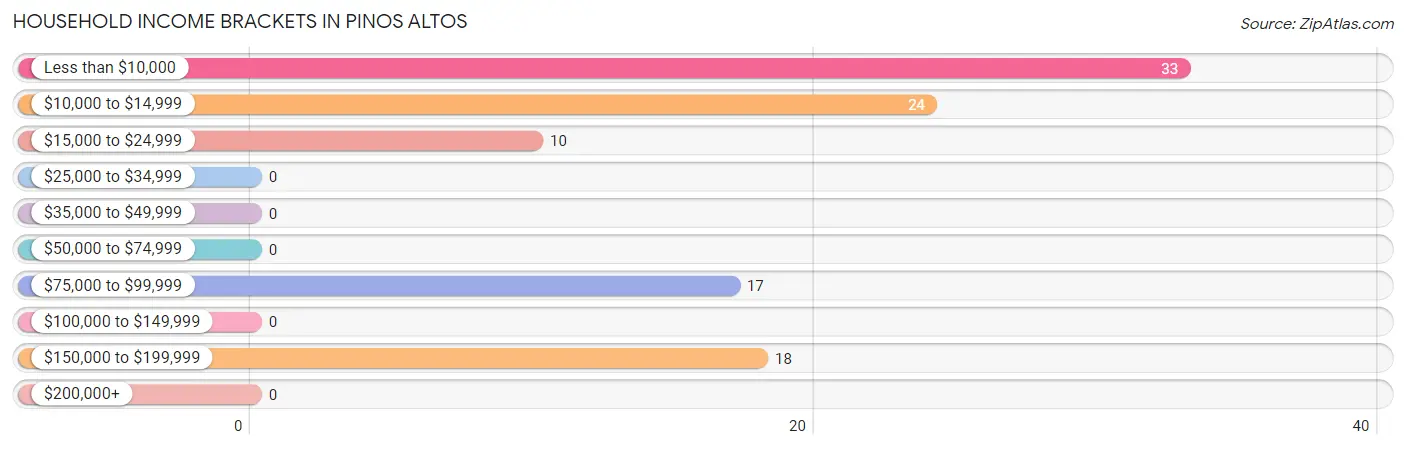
Household Income Brackets in Pinos Altos
With 33 households falling in the category, the less than $10,000 income range is the most frequent in Pinos Altos, accounting for 32.4% of all households.
| Income Bracket | # Households | % Households |
| Less than $10,000 | 33 | 32.4% |
| $10,000 to $14,999 | 24 | 23.5% |
| $15,000 to $24,999 | 10 | 9.8% |
| $25,000 to $34,999 | 0 | 0.0% |
| $35,000 to $49,999 | 0 | 0.0% |
| $50,000 to $74,999 | 0 | 0.0% |
| $75,000 to $99,999 | 17 | 16.7% |
| $100,000 to $149,999 | 0 | 0.0% |
| $150,000 to $199,999 | 18 | 17.6% |
| $200,000+ | 0 | 0.0% |
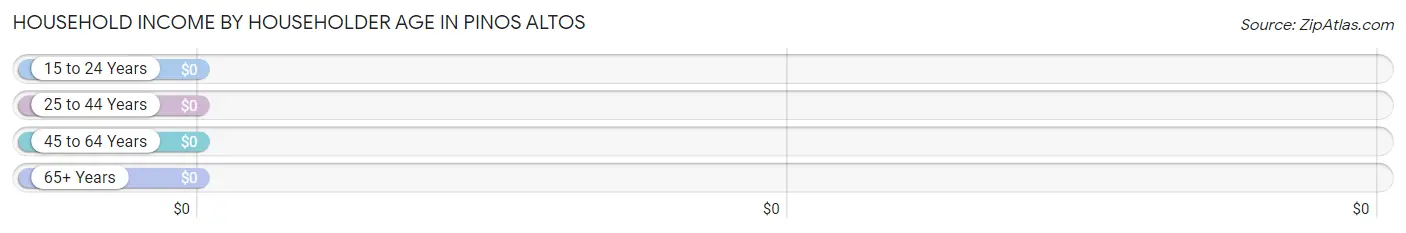
Household Income by Householder Age in Pinos Altos
| Income Bracket | # Households | Median Income |
| 15 to 24 Years | 0 (0.0%) | $0 |
| 25 to 44 Years | 0 (0.0%) | $0 |
| 45 to 64 Years | 44 (43.1%) | $0 |
| 65+ Years | 58 (56.9%) | $0 |
| Total | 102 (100.0%) | $0 |
Poverty in Pinos Altos
Income Below Poverty by Sex and Age in Pinos Altos
With 64.4% poverty level for males and 51.2% for females among the residents of Pinos Altos, 25 to 34 year old males and 45 to 54 year old females are the most vulnerable to poverty, with 41 males (100.0%) and 10 females (100.0%) in their respective age groups living below the poverty level.
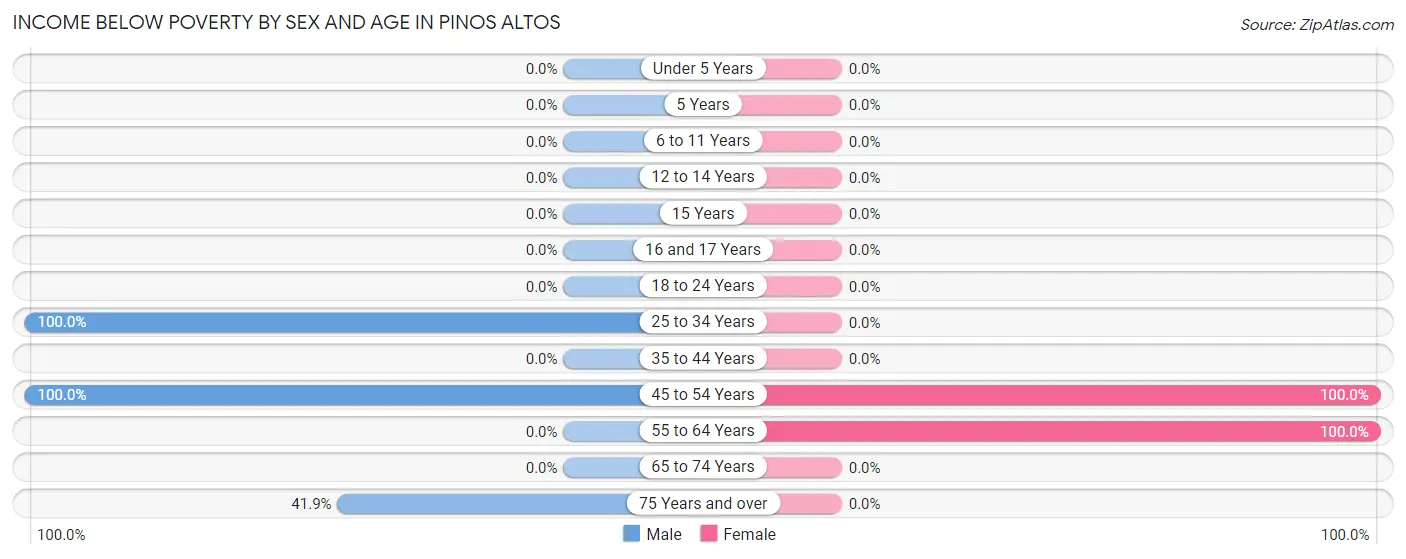
| Age Bracket | Male | Female |
| Under 5 Years | 0 (0.0%) | 0 (0.0%) |
| 5 Years | 0 (0.0%) | 0 (0.0%) |
| 6 to 11 Years | 0 (0.0%) | 0 (0.0%) |
| 12 to 14 Years | 0 (0.0%) | 0 (0.0%) |
| 15 Years | 0 (0.0%) | 0 (0.0%) |
| 16 and 17 Years | 0 (0.0%) | 0 (0.0%) |
| 18 to 24 Years | 0 (0.0%) | 0 (0.0%) |
| 25 to 34 Years | 41 (100.0%) | 0 (0.0%) |
| 35 to 44 Years | 0 (0.0%) | 0 (0.0%) |
| 45 to 54 Years | 11 (100.0%) | 10 (100.0%) |
| 55 to 64 Years | 0 (0.0%) | 33 (100.0%) |
| 65 to 74 Years | 0 (0.0%) | 0 (0.0%) |
| 75 Years and over | 13 (41.9%) | 0 (0.0%) |
| Total | 65 (64.4%) | 43 (51.2%) |
Income Above Poverty by Sex and Age in Pinos Altos
According to the poverty statistics in Pinos Altos, males aged 65 to 74 years and females aged 75 years and over are the age groups that are most secure financially, with 100.0% of males and 100.0% of females in these age groups living above the poverty line.
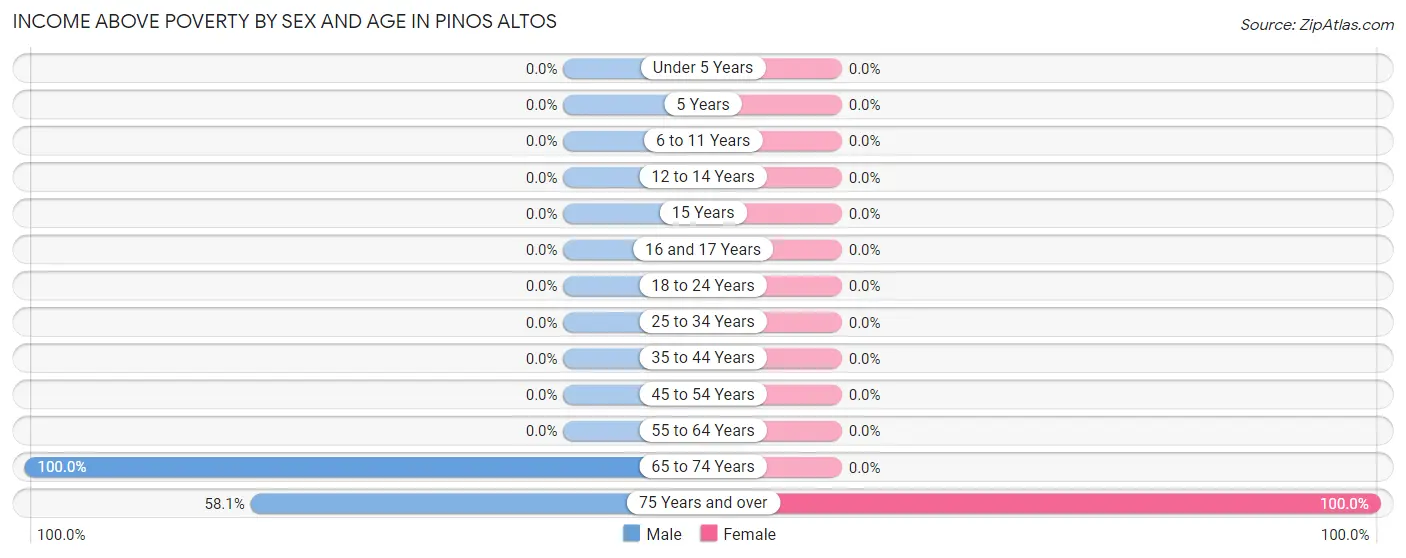
| Age Bracket | Male | Female |
| Under 5 Years | 0 (0.0%) | 0 (0.0%) |
| 5 Years | 0 (0.0%) | 0 (0.0%) |
| 6 to 11 Years | 0 (0.0%) | 0 (0.0%) |
| 12 to 14 Years | 0 (0.0%) | 0 (0.0%) |
| 15 Years | 0 (0.0%) | 0 (0.0%) |
| 16 and 17 Years | 0 (0.0%) | 0 (0.0%) |
| 18 to 24 Years | 0 (0.0%) | 0 (0.0%) |
| 25 to 34 Years | 0 (0.0%) | 0 (0.0%) |
| 35 to 44 Years | 0 (0.0%) | 0 (0.0%) |
| 45 to 54 Years | 0 (0.0%) | 0 (0.0%) |
| 55 to 64 Years | 0 (0.0%) | 0 (0.0%) |
| 65 to 74 Years | 18 (100.0%) | 0 (0.0%) |
| 75 Years and over | 18 (58.1%) | 41 (100.0%) |
| Total | 36 (35.6%) | 41 (48.8%) |
Income Below Poverty Among Married-Couple Families in Pinos Altos
The poverty statistics for married-couple families in Pinos Altos show that 33.3% or 13 of the total 39 families live below the poverty line. Families with no children have the highest poverty rate of 33.3%, comprising of 13 families. On the other hand, families with no children have the lowest poverty rate of 33.3%, which includes 13 families.
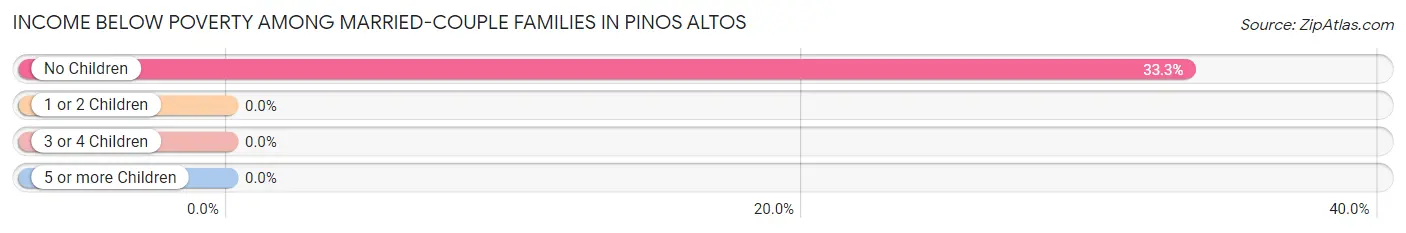
| Children | Above Poverty | Below Poverty |
| No Children | 26 (66.7%) | 13 (33.3%) |
| 1 or 2 Children | 0 (0.0%) | 0 (0.0%) |
| 3 or 4 Children | 0 (0.0%) | 0 (0.0%) |
| 5 or more Children | 0 (0.0%) | 0 (0.0%) |
| Total | 26 (66.7%) | 13 (33.3%) |
Income Below Poverty Among Single-Parent Households in Pinos Altos
| Children | Single Father | Single Mother |
| No Children | 0 (0.0%) | 0 (0.0%) |
| 1 or 2 Children | 0 (0.0%) | 0 (0.0%) |
| 3 or 4 Children | 0 (0.0%) | 0 (0.0%) |
| 5 or more Children | 0 (0.0%) | 0 (0.0%) |
| Total | 0 (0.0%) | 0 (0.0%) |
Income Below Poverty Among Married-Couple vs Single-Parent Households in Pinos Altos
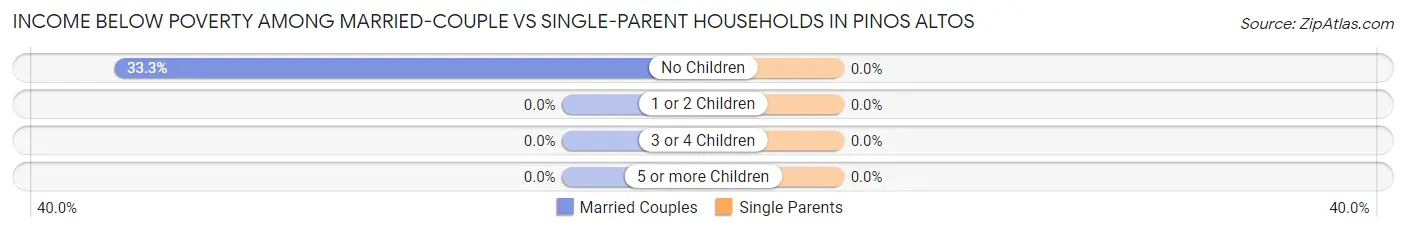
| Children | Married-Couple Families | Single-Parent Households |
| No Children | 13 (33.3%) | 0 (0.0%) |
| 1 or 2 Children | 0 (0.0%) | 0 (0.0%) |
| 3 or 4 Children | 0 (0.0%) | 0 (0.0%) |
| 5 or more Children | 0 (0.0%) | 0 (0.0%) |
| Total | 13 (33.3%) | 0 (0.0%) |
Race in Pinos Altos
The most populous races in Pinos Altos are White / Caucasian (99 | 53.5%), Hispanic or Latino (86 | 46.5%), and Two or more Races (86 | 46.5%).
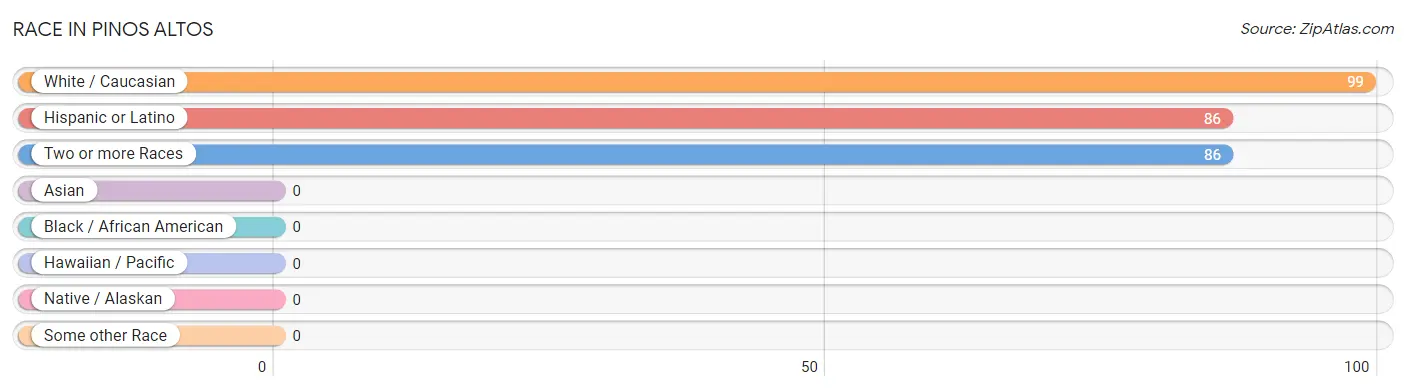
| Race | # Population | % Population |
| Asian | 0 | 0.0% |
| Black / African American | 0 | 0.0% |
| Hawaiian / Pacific | 0 | 0.0% |
| Hispanic or Latino | 86 | 46.5% |
| Native / Alaskan | 0 | 0.0% |
| White / Caucasian | 99 | 53.5% |
| Two or more Races | 86 | 46.5% |
| Some other Race | 0 | 0.0% |
| Total | 185 | 100.0% |
Ancestry in Pinos Altos
The most populous ancestries reported in Pinos Altos are Mexican (86 | 46.5%), Scottish (43 | 23.2%), German (30 | 16.2%), Irish (19 | 10.3%), and English (10 | 5.4%), together accounting for 101.6% of all Pinos Altos residents.
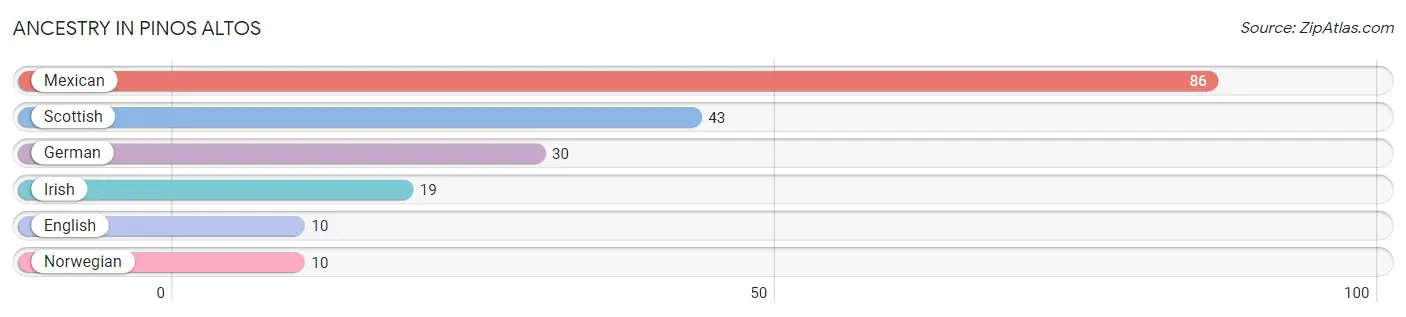
| Ancestry | # Population | % Population |
| English | 10 | 5.4% |
| German | 30 | 16.2% |
| Irish | 19 | 10.3% |
| Mexican | 86 | 46.5% |
| Norwegian | 10 | 5.4% |
| Scottish | 43 | 23.2% | View All 6 Rows |
Immigrants in Pinos Altos
The most numerous immigrant groups reported in Pinos Altos came from Central America (64 | 34.6%), Latin America (64 | 34.6%), and Mexico (64 | 34.6%), together accounting for 103.8% of all Pinos Altos residents.
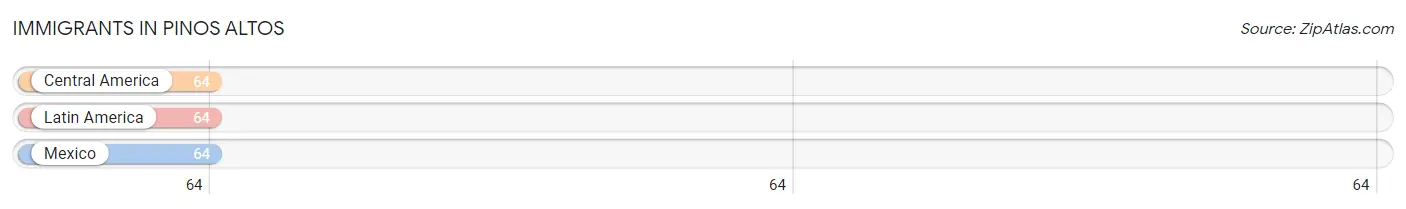
| Immigration Origin | # Population | % Population |
| Central America | 64 | 34.6% |
| Latin America | 64 | 34.6% |
| Mexico | 64 | 34.6% | View All 3 Rows |
Sex and Age in Pinos Altos
Sex and Age in Pinos Altos
The most populous age groups in Pinos Altos are 25 to 29 Years (41 | 40.6%) for men and 75 to 79 Years (41 | 48.8%) for women.
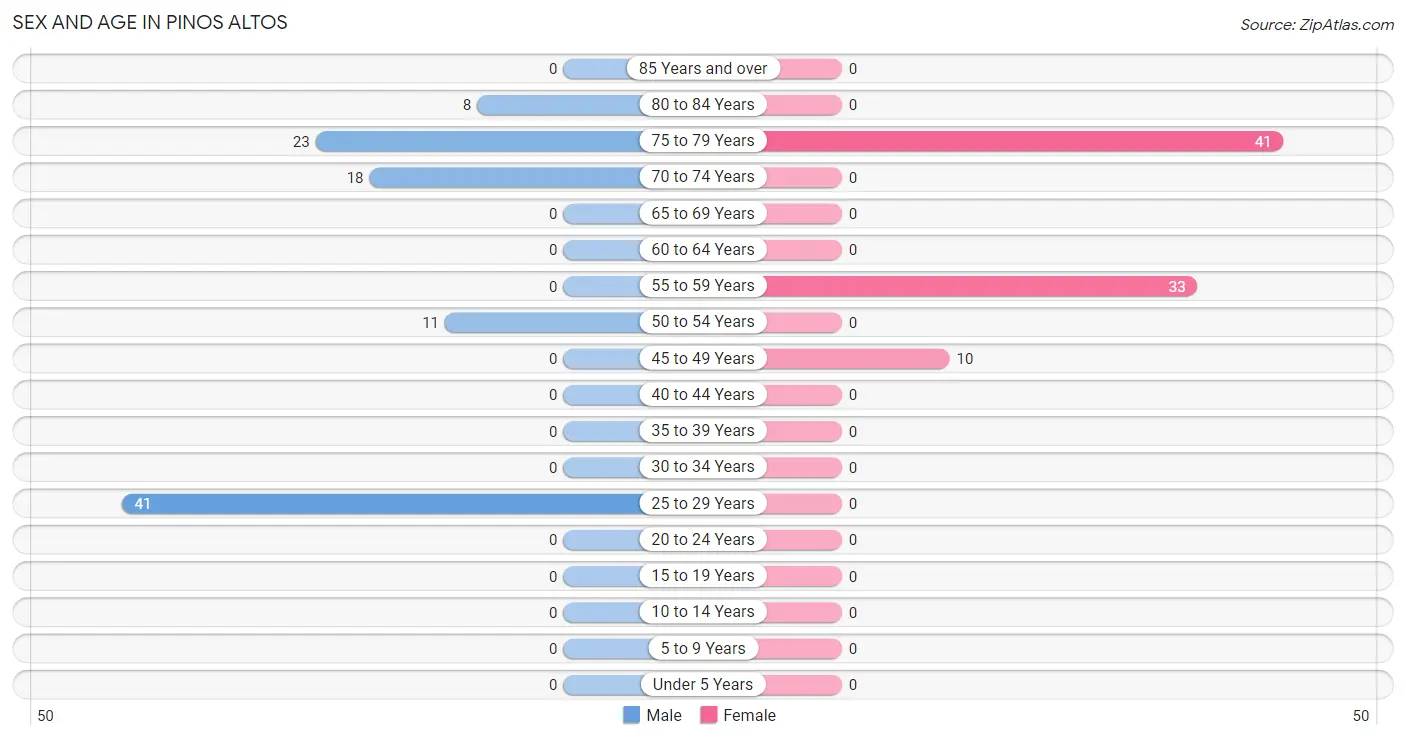
| Age Bracket | Male | Female |
| Under 5 Years | 0 (0.0%) | 0 (0.0%) |
| 5 to 9 Years | 0 (0.0%) | 0 (0.0%) |
| 10 to 14 Years | 0 (0.0%) | 0 (0.0%) |
| 15 to 19 Years | 0 (0.0%) | 0 (0.0%) |
| 20 to 24 Years | 0 (0.0%) | 0 (0.0%) |
| 25 to 29 Years | 41 (40.6%) | 0 (0.0%) |
| 30 to 34 Years | 0 (0.0%) | 0 (0.0%) |
| 35 to 39 Years | 0 (0.0%) | 0 (0.0%) |
| 40 to 44 Years | 0 (0.0%) | 0 (0.0%) |
| 45 to 49 Years | 0 (0.0%) | 10 (11.9%) |
| 50 to 54 Years | 11 (10.9%) | 0 (0.0%) |
| 55 to 59 Years | 0 (0.0%) | 33 (39.3%) |
| 60 to 64 Years | 0 (0.0%) | 0 (0.0%) |
| 65 to 69 Years | 0 (0.0%) | 0 (0.0%) |
| 70 to 74 Years | 18 (17.8%) | 0 (0.0%) |
| 75 to 79 Years | 23 (22.8%) | 41 (48.8%) |
| 80 to 84 Years | 8 (7.9%) | 0 (0.0%) |
| 85 Years and over | 0 (0.0%) | 0 (0.0%) |
| Total | 101 (100.0%) | 84 (100.0%) |
Families and Households in Pinos Altos
Median Family Size in Pinos Altos
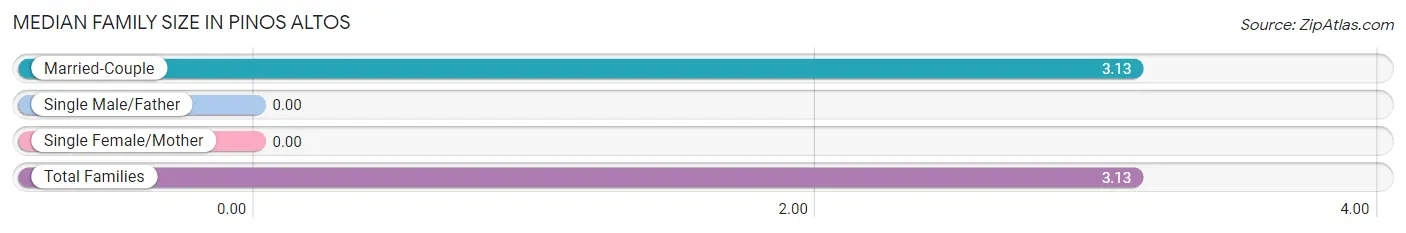
| Family Type | # Families | Family Size |
| Married-Couple | 39 (100.0%) | 3.13 |
| Single Male/Father | 0 (0.0%) | - |
| Single Female/Mother | 0 (0.0%) | - |
| Total Families | 39 (100.0%) | 3.13 |
Median Household Size in Pinos Altos
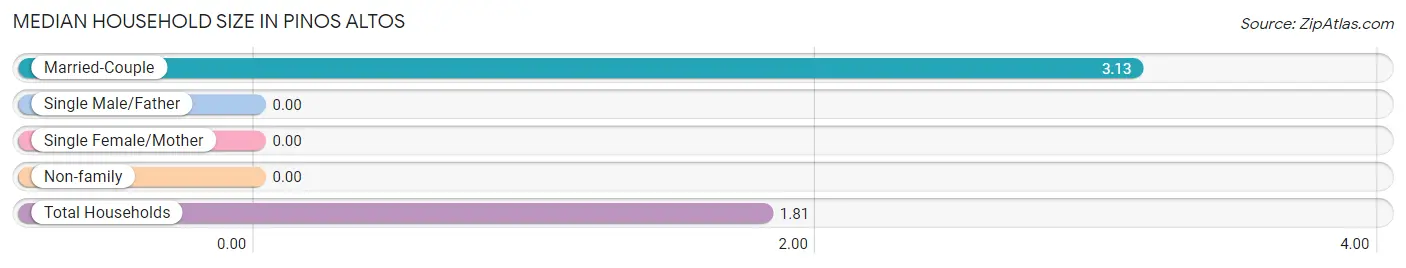
| Household Type | # Households | Household Size |
| Married-Couple | 39 (38.2%) | 3.13 |
| Single Male/Father | 0 (0.0%) | - |
| Single Female/Mother | 0 (0.0%) | - |
| Non-family | 63 (61.8%) | - |
| Total Households | 102 (100.0%) | 1.81 |
Household Size by Marriage Status in Pinos Altos
Out of a total of 102 households in Pinos Altos, 39 (38.2%) are family households, while 63 (61.8%) are nonfamily households. The most numerous type of family households are 2-person households, comprising 26, and the most common type of nonfamily households are 1-person households, comprising 63.
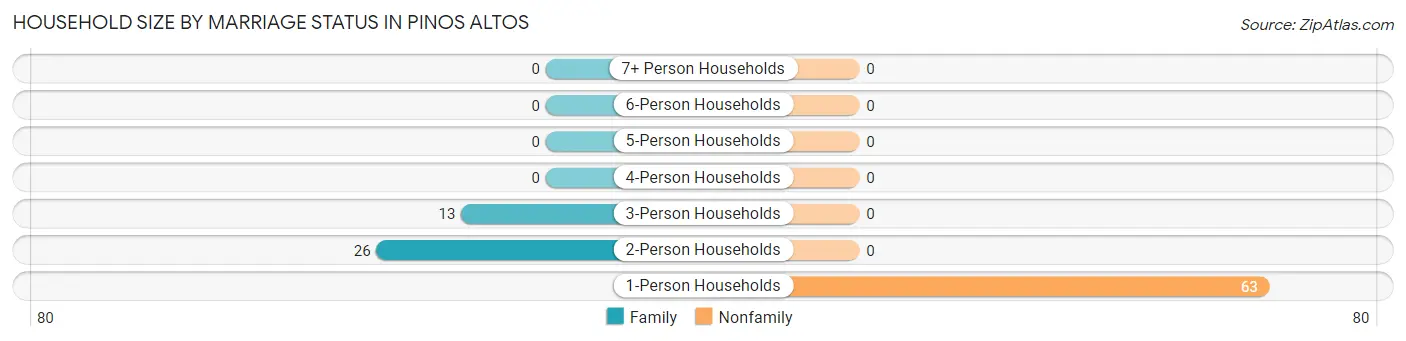
| Household Size | Family Households | Nonfamily Households |
| 1-Person Households | - | 63 (61.8%) |
| 2-Person Households | 26 (25.5%) | 0 (0.0%) |
| 3-Person Households | 13 (12.8%) | 0 (0.0%) |
| 4-Person Households | 0 (0.0%) | 0 (0.0%) |
| 5-Person Households | 0 (0.0%) | 0 (0.0%) |
| 6-Person Households | 0 (0.0%) | 0 (0.0%) |
| 7+ Person Households | 0 (0.0%) | 0 (0.0%) |
| Total | 39 (38.2%) | 63 (61.8%) |
Female Fertility in Pinos Altos
Fertility by Age in Pinos Altos
| Age Bracket | Women with Births | Births / 1,000 Women |
| 15 to 19 years | 0 (0.0%) | 0.0 |
| 20 to 34 years | 0 (0.0%) | 0.0 |
| 35 to 50 years | 0 (0.0%) | 0.0 |
| Total | 0 (0.0%) | 0.0 |
Fertility by Age by Marriage Status in Pinos Altos
| Age Bracket | Married | Unmarried |
| 15 to 19 years | 0 (0.0%) | 0 (0.0%) |
| 20 to 34 years | 0 (0.0%) | 0 (0.0%) |
| 35 to 50 years | 0 (0.0%) | 0 (0.0%) |
| Total | 0 (0.0%) | 0 (0.0%) |
Fertility by Education in Pinos Altos
| Educational Attainment | Women with Births | Births / 1,000 Women |
| Less than High School | 0 (0.0%) | 0.0 |
| High School Diploma | 0 (0.0%) | 0.0 |
| College or Associate's Degree | 0 (0.0%) | 0.0 |
| Bachelor's Degree | 0 (0.0%) | 0.0 |
| Graduate Degree | 0 (0.0%) | 0.0 |
| Total | 0 (0.0%) | 0.0 |
Fertility by Education by Marriage Status in Pinos Altos
| Educational Attainment | Married | Unmarried |
| Less than High School | 0 (0.0%) | 0 (0.0%) |
| High School Diploma | 0 (0.0%) | 0 (0.0%) |
| College or Associate's Degree | 0 (0.0%) | 0 (0.0%) |
| Bachelor's Degree | 0 (0.0%) | 0 (0.0%) |
| Graduate Degree | 0 (0.0%) | 0 (0.0%) |
| Total | 0 (0.0%) | 0 (0.0%) |
Employment Characteristics in Pinos Altos
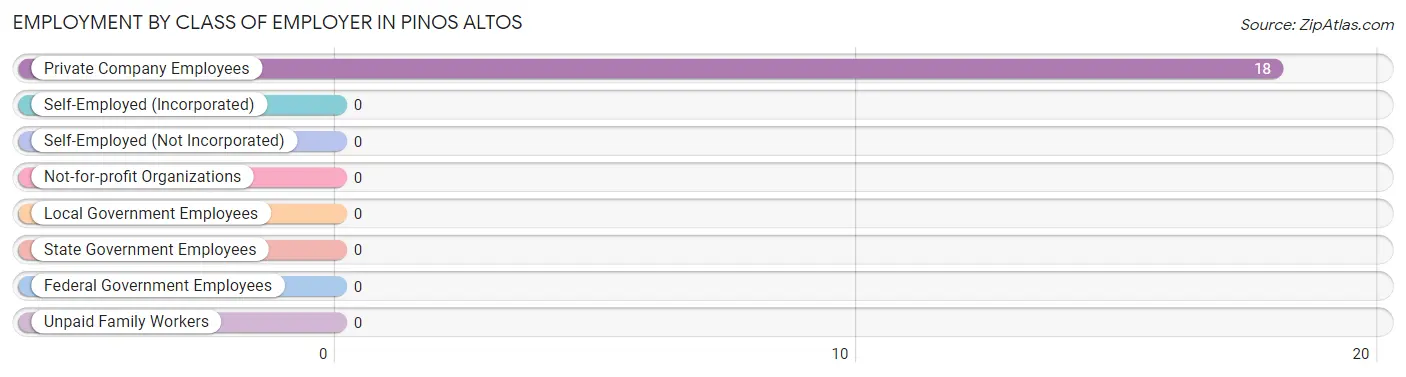
Employment by Class of Employer in Pinos Altos
Among the 18 employed individuals in Pinos Altos, , and private company employees (18 | 100.0%) make up the most common classes of employment.
| Employer Class | # Employees | % Employees |
| Private Company Employees | 18 | 100.0% |
| Self-Employed (Incorporated) | 0 | 0.0% |
| Self-Employed (Not Incorporated) | 0 | 0.0% |
| Not-for-profit Organizations | 0 | 0.0% |
| Local Government Employees | 0 | 0.0% |
| State Government Employees | 0 | 0.0% |
| Federal Government Employees | 0 | 0.0% |
| Unpaid Family Workers | 0 | 0.0% |
| Total | 18 | 100.0% |
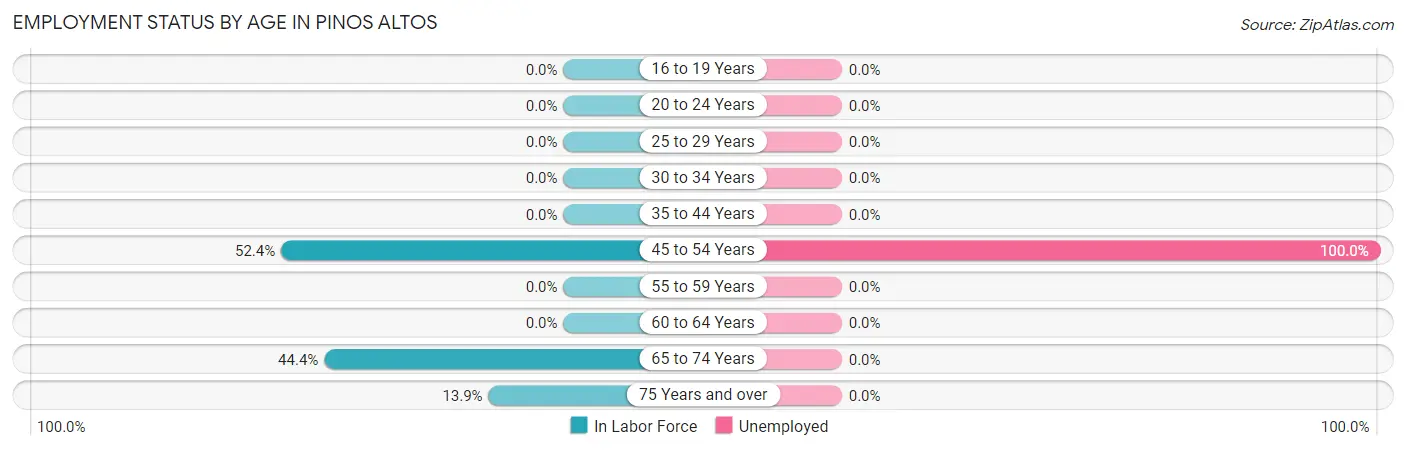
Employment Status by Age in Pinos Altos
According to the labor force statistics for Pinos Altos, out of the total population over 16 years of age (185), 15.7% or 29 individuals are in the labor force, with 37.9% or 11 of them unemployed. The age group with the highest labor force participation rate is 45 to 54 years, with 52.4% or 11 individuals in the labor force. Within the labor force, the 45 to 54 years age range has the highest percentage of unemployed individuals, with 100.0% or 11 of them being unemployed.
| Age Bracket | In Labor Force | Unemployed |
| 16 to 19 Years | 0 (0.0%) | 0 (0.0%) |
| 20 to 24 Years | 0 (0.0%) | 0 (0.0%) |
| 25 to 29 Years | 0 (0.0%) | 0 (0.0%) |
| 30 to 34 Years | 0 (0.0%) | 0 (0.0%) |
| 35 to 44 Years | 0 (0.0%) | 0 (0.0%) |
| 45 to 54 Years | 11 (52.4%) | 11 (100.0%) |
| 55 to 59 Years | 0 (0.0%) | 0 (0.0%) |
| 60 to 64 Years | 0 (0.0%) | 0 (0.0%) |
| 65 to 74 Years | 8 (44.4%) | 0 (0.0%) |
| 75 Years and over | 10 (13.9%) | 0 (0.0%) |
| Total | 29 (15.7%) | 11 (37.9%) |
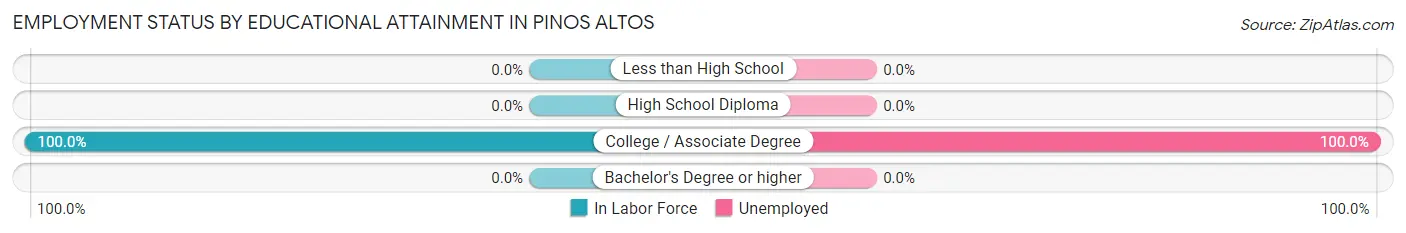
Employment Status by Educational Attainment in Pinos Altos
According to labor force statistics for Pinos Altos, 11.6% of individuals (11) out of the total population between 25 and 64 years of age (95) are in the labor force, with 100.0% or 11 of them being unemployed. The group with the highest labor force participation rate are those with the educational attainment of college / associate degree, with 100.0% or 11 individuals in the labor force. Within the labor force, individuals with college / associate degree education have the highest percentage of unemployment, with 100.0% or 11 of them being unemployed.
| Educational Attainment | In Labor Force | Unemployed |
| Less than High School | 0 (0.0%) | 0 (0.0%) |
| High School Diploma | 0 (0.0%) | 0 (0.0%) |
| College / Associate Degree | 11 (100.0%) | 11 (100.0%) |
| Bachelor's Degree or higher | 0 (0.0%) | 0 (0.0%) |
| Total | 11 (11.6%) | 95 (100.0%) |
Employment Occupations by Sex in Pinos Altos
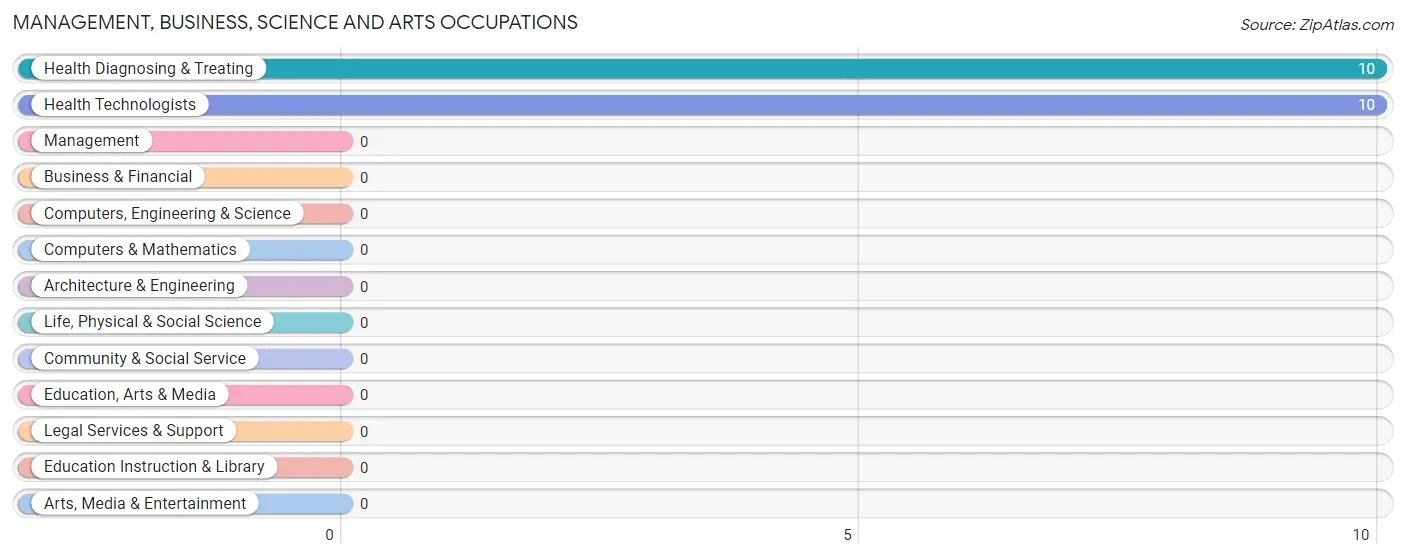
Management, Business, Science and Arts Occupations
The most common Management, Business, Science and Arts occupations in Pinos Altos are Health Diagnosing & Treating (10 | 55.6%), and Health Technologists (10 | 55.6%).
Management, Business, Science and Arts Occupations by Sex
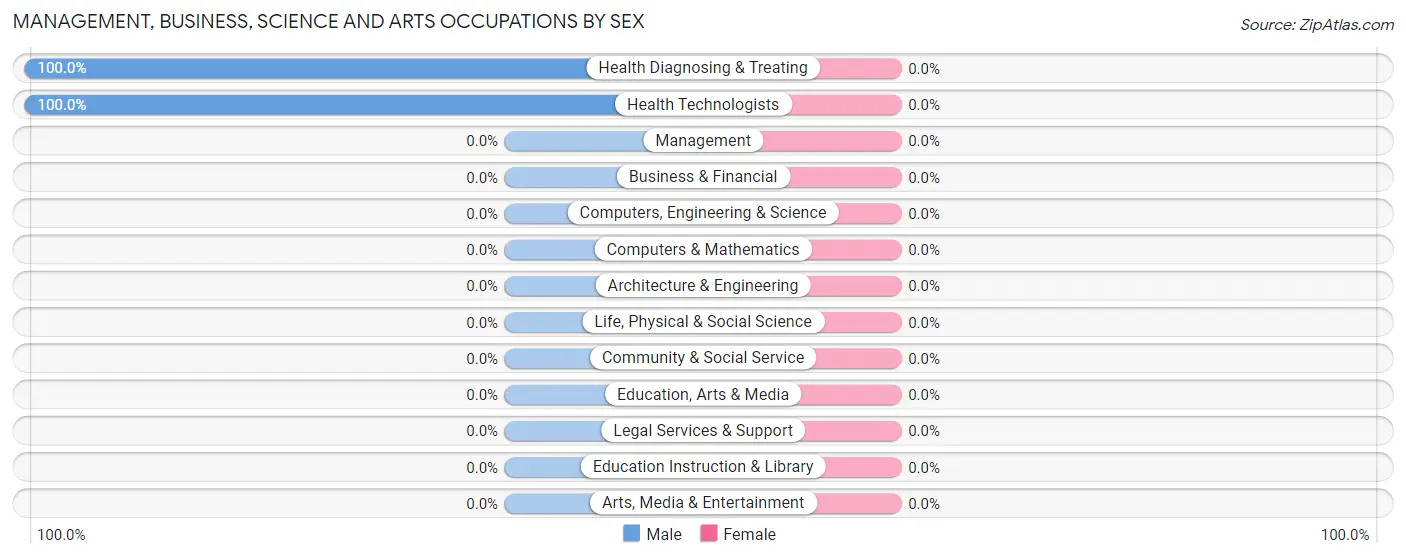
| Occupation | Male | Female |
| Management | 0 (0.0%) | 0 (0.0%) |
| Business & Financial | 0 (0.0%) | 0 (0.0%) |
| Computers, Engineering & Science | 0 (0.0%) | 0 (0.0%) |
| Computers & Mathematics | 0 (0.0%) | 0 (0.0%) |
| Architecture & Engineering | 0 (0.0%) | 0 (0.0%) |
| Life, Physical & Social Science | 0 (0.0%) | 0 (0.0%) |
| Community & Social Service | 0 (0.0%) | 0 (0.0%) |
| Education, Arts & Media | 0 (0.0%) | 0 (0.0%) |
| Legal Services & Support | 0 (0.0%) | 0 (0.0%) |
| Education Instruction & Library | 0 (0.0%) | 0 (0.0%) |
| Arts, Media & Entertainment | 0 (0.0%) | 0 (0.0%) |
| Health Diagnosing & Treating | 10 (100.0%) | 0 (0.0%) |
| Health Technologists | 10 (100.0%) | 0 (0.0%) |
| Total (Category) | 10 (100.0%) | 0 (0.0%) |
| Total (Overall) | 18 (100.0%) | 0 (0.0%) |
Services Occupations
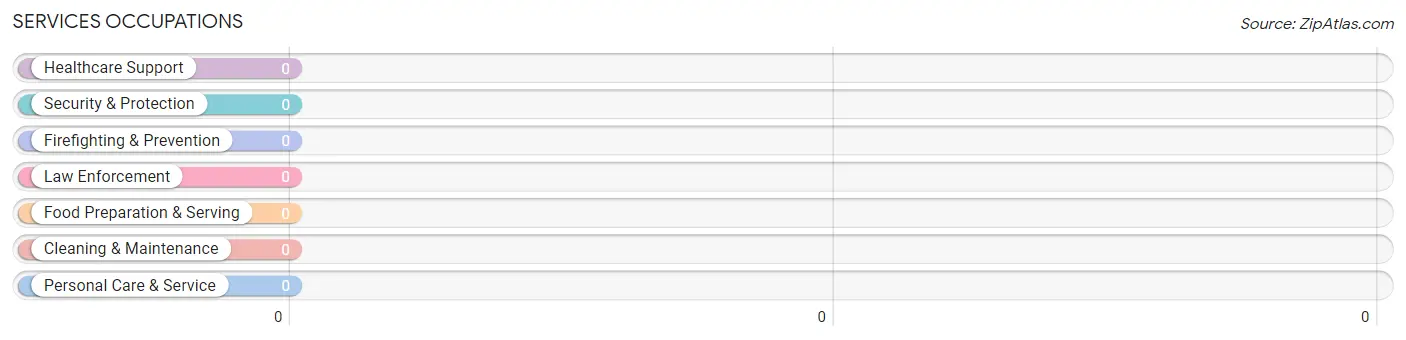
Services Occupations by Sex
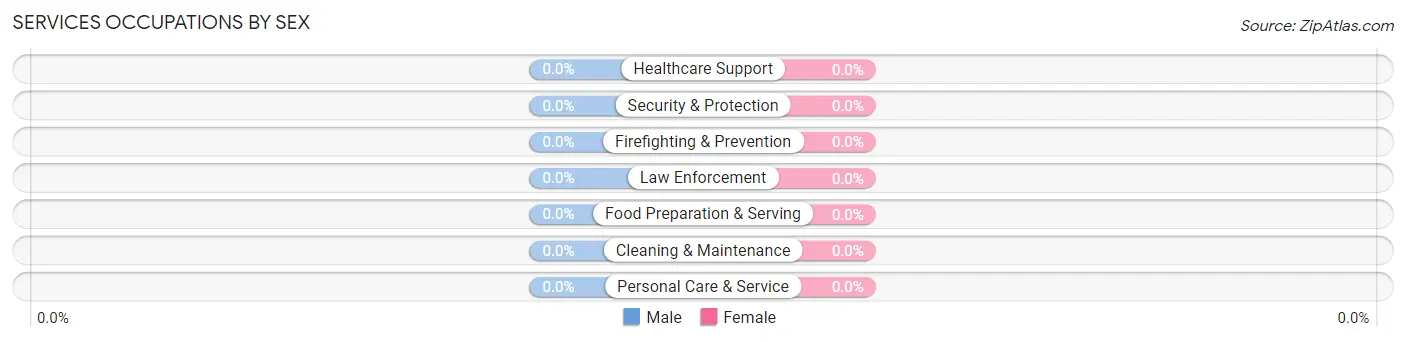
| Occupation | Male | Female |
| Healthcare Support | 0 (0.0%) | 0 (0.0%) |
| Security & Protection | 0 (0.0%) | 0 (0.0%) |
| Firefighting & Prevention | 0 (0.0%) | 0 (0.0%) |
| Law Enforcement | 0 (0.0%) | 0 (0.0%) |
| Food Preparation & Serving | 0 (0.0%) | 0 (0.0%) |
| Cleaning & Maintenance | 0 (0.0%) | 0 (0.0%) |
| Personal Care & Service | 0 (0.0%) | 0 (0.0%) |
| Total (Category) | 0 (0.0%) | 0 (0.0%) |
| Total (Overall) | 18 (100.0%) | 0 (0.0%) |
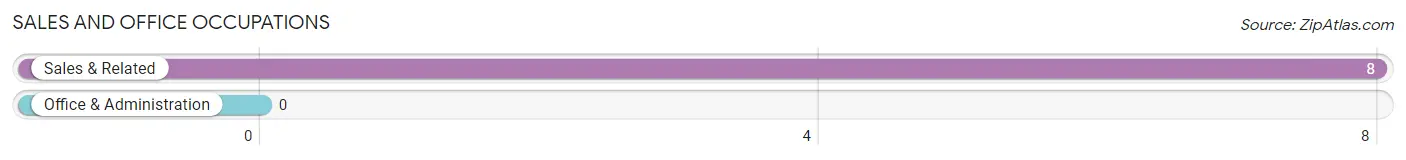
Sales and Office Occupations
The most common Sales and Office occupations in Pinos Altos are , and Sales & Related (8 | 44.4%).
Sales and Office Occupations by Sex

| Occupation | Male | Female |
| Sales & Related | 8 (100.0%) | 0 (0.0%) |
| Office & Administration | 0 (0.0%) | 0 (0.0%) |
| Total (Category) | 8 (100.0%) | 0 (0.0%) |
| Total (Overall) | 18 (100.0%) | 0 (0.0%) |
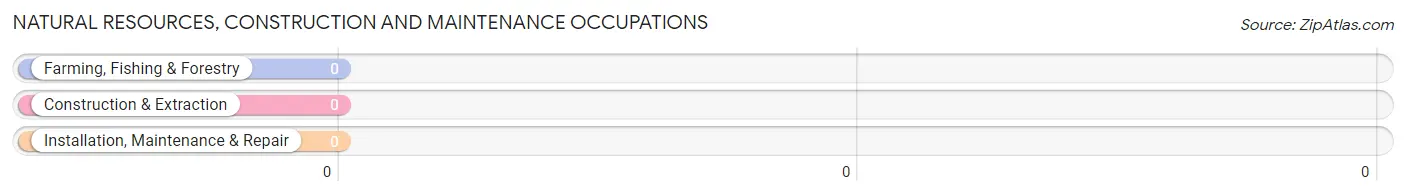
Natural Resources, Construction and Maintenance Occupations
Natural Resources, Construction and Maintenance Occupations by Sex
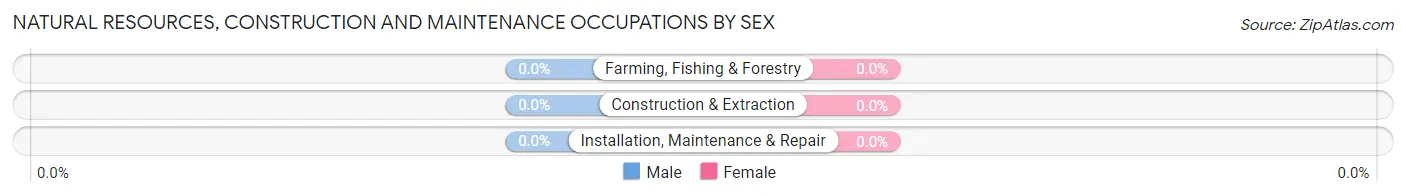
| Occupation | Male | Female |
| Farming, Fishing & Forestry | 0 (0.0%) | 0 (0.0%) |
| Construction & Extraction | 0 (0.0%) | 0 (0.0%) |
| Installation, Maintenance & Repair | 0 (0.0%) | 0 (0.0%) |
| Total (Category) | 0 (0.0%) | 0 (0.0%) |
| Total (Overall) | 18 (100.0%) | 0 (0.0%) |
Production, Transportation and Moving Occupations
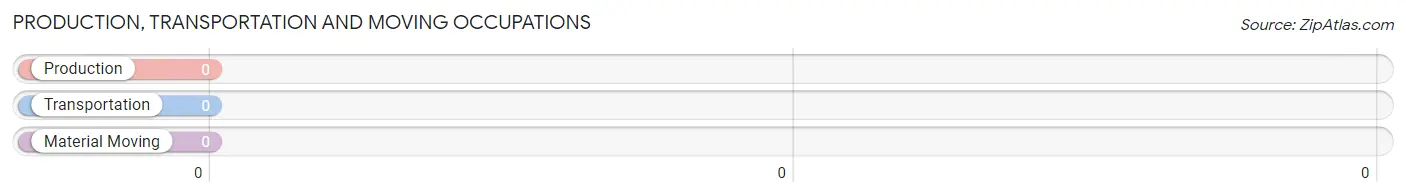
Production, Transportation and Moving Occupations by Sex
| Occupation | Male | Female |
| Production | 0 (0.0%) | 0 (0.0%) |
| Transportation | 0 (0.0%) | 0 (0.0%) |
| Material Moving | 0 (0.0%) | 0 (0.0%) |
| Total (Category) | 0 (0.0%) | 0 (0.0%) |
| Total (Overall) | 18 (100.0%) | 0 (0.0%) |
Employment Industries by Sex in Pinos Altos
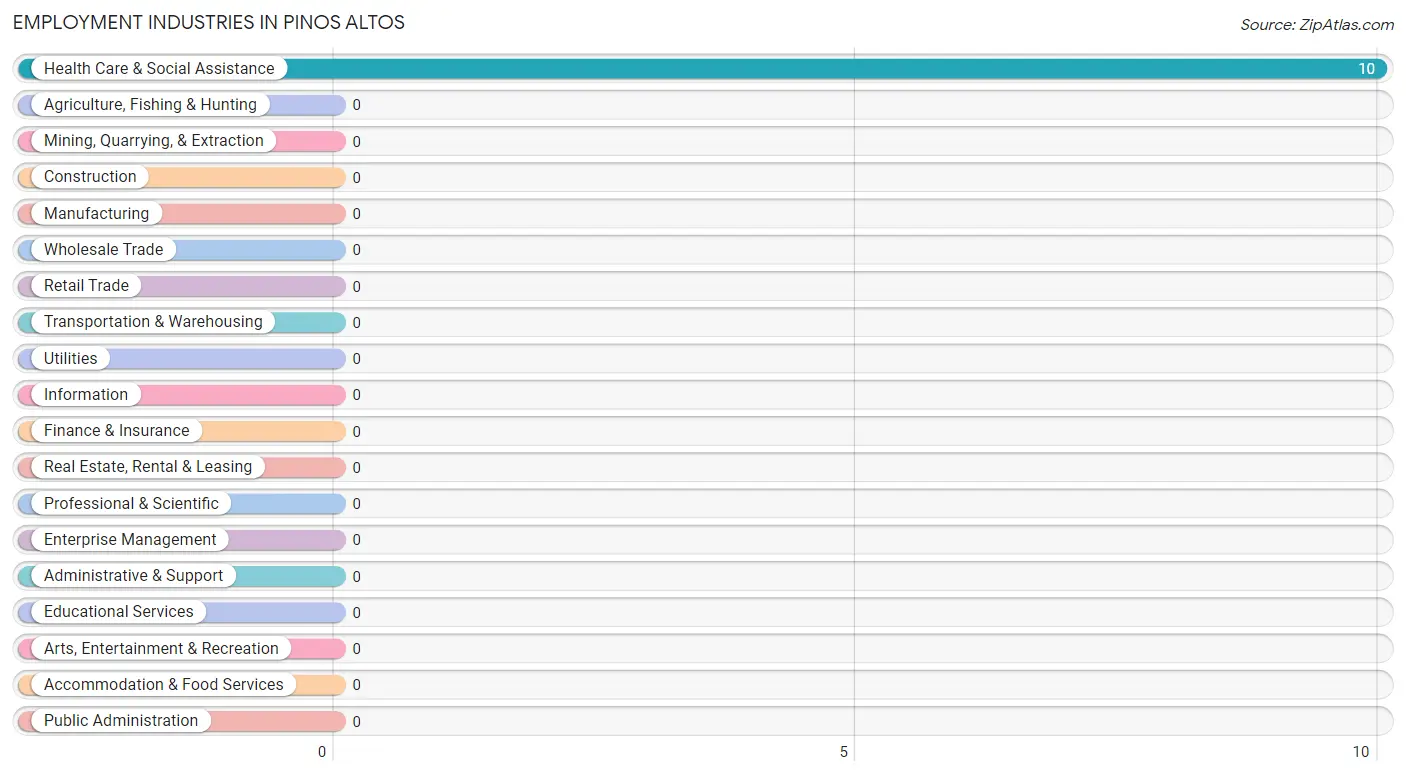
Employment Industries in Pinos Altos
The major employment industries in Pinos Altos include , and Health Care & Social Assistance (10 | 55.6%).
Employment Industries by Sex in Pinos Altos
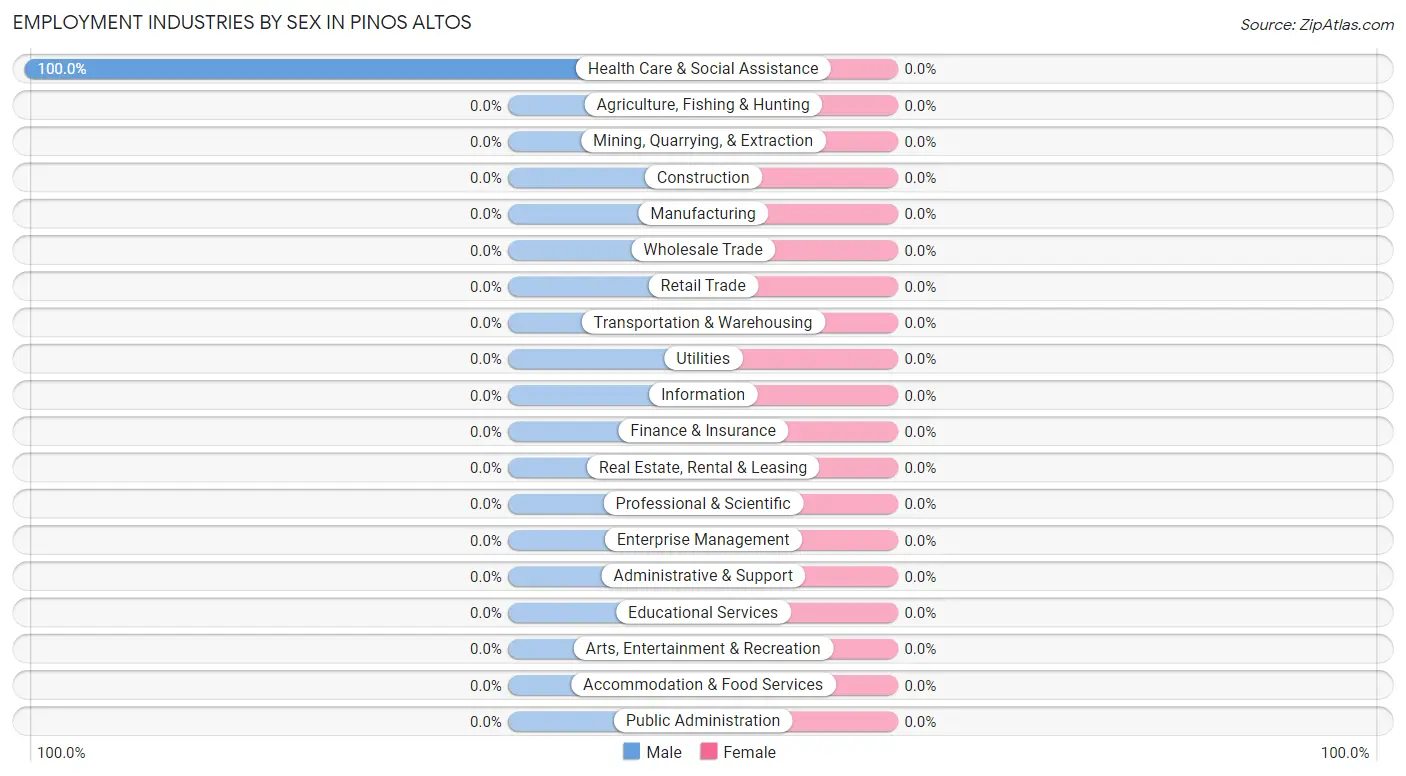
| Industry | Male | Female |
| Agriculture, Fishing & Hunting | 0 (0.0%) | 0 (0.0%) |
| Mining, Quarrying, & Extraction | 0 (0.0%) | 0 (0.0%) |
| Construction | 0 (0.0%) | 0 (0.0%) |
| Manufacturing | 0 (0.0%) | 0 (0.0%) |
| Wholesale Trade | 0 (0.0%) | 0 (0.0%) |
| Retail Trade | 0 (0.0%) | 0 (0.0%) |
| Transportation & Warehousing | 0 (0.0%) | 0 (0.0%) |
| Utilities | 0 (0.0%) | 0 (0.0%) |
| Information | 0 (0.0%) | 0 (0.0%) |
| Finance & Insurance | 0 (0.0%) | 0 (0.0%) |
| Real Estate, Rental & Leasing | 0 (0.0%) | 0 (0.0%) |
| Professional & Scientific | 0 (0.0%) | 0 (0.0%) |
| Enterprise Management | 0 (0.0%) | 0 (0.0%) |
| Administrative & Support | 0 (0.0%) | 0 (0.0%) |
| Educational Services | 0 (0.0%) | 0 (0.0%) |
| Health Care & Social Assistance | 10 (100.0%) | 0 (0.0%) |
| Arts, Entertainment & Recreation | 0 (0.0%) | 0 (0.0%) |
| Accommodation & Food Services | 0 (0.0%) | 0 (0.0%) |
| Public Administration | 0 (0.0%) | 0 (0.0%) |
| Total | 18 (100.0%) | 0 (0.0%) |
Education in Pinos Altos
School Enrollment in Pinos Altos
| School Level | # Students | % Students |
| Nursery / Preschool | 0 | 0.0% |
| Kindergarten | 0 | 0.0% |
| Elementary School | 0 | 0.0% |
| Middle School | 0 | 0.0% |
| High School | 0 | 0.0% |
| College / Undergraduate | 0 | 0.0% |
| Graduate / Professional | 0 | 0.0% |
| Total | 0 | 0.0% |
School Enrollment by Age by Funding Source in Pinos Altos
| Age Bracket | Public School | Private School |
| 3 to 4 Year Olds | 0 (0.0%) | 0 (0.0%) |
| 5 to 9 Year Old | 0 (0.0%) | 0 (0.0%) |
| 10 to 14 Year Olds | 0 (0.0%) | 0 (0.0%) |
| 15 to 17 Year Olds | 0 (0.0%) | 0 (0.0%) |
| 18 to 19 Year Olds | 0 (0.0%) | 0 (0.0%) |
| 20 to 24 Year Olds | 0 (0.0%) | 0 (0.0%) |
| 25 to 34 Year Olds | 0 (0.0%) | 0 (0.0%) |
| 35 Years and over | 0 (0.0%) | 0 (0.0%) |
| Total | 0 (0.0%) | 0 (0.0%) |
Educational Attainment by Field of Study in Pinos Altos
Business (43 | 50.0%), psychology (23 | 26.7%), bio, nature & agricultural (10 | 11.6%), and social sciences (10 | 11.6%) are the most common fields of study among 86 individuals in Pinos Altos who have obtained a bachelor's degree or higher.
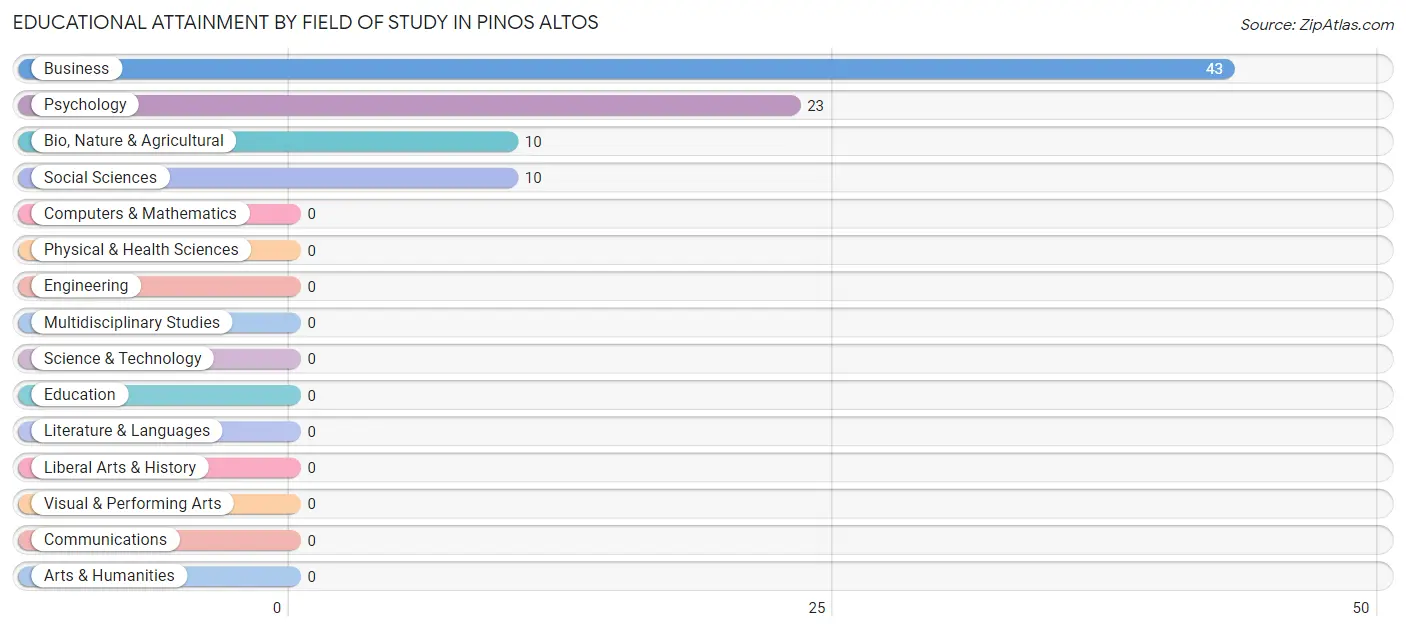
| Field of Study | # Graduates | % Graduates |
| Computers & Mathematics | 0 | 0.0% |
| Bio, Nature & Agricultural | 10 | 11.6% |
| Physical & Health Sciences | 0 | 0.0% |
| Psychology | 23 | 26.7% |
| Social Sciences | 10 | 11.6% |
| Engineering | 0 | 0.0% |
| Multidisciplinary Studies | 0 | 0.0% |
| Science & Technology | 0 | 0.0% |
| Business | 43 | 50.0% |
| Education | 0 | 0.0% |
| Literature & Languages | 0 | 0.0% |
| Liberal Arts & History | 0 | 0.0% |
| Visual & Performing Arts | 0 | 0.0% |
| Communications | 0 | 0.0% |
| Arts & Humanities | 0 | 0.0% |
| Total | 86 | 100.0% |
Transportation & Commute in Pinos Altos
Vehicle Availability by Sex in Pinos Altos
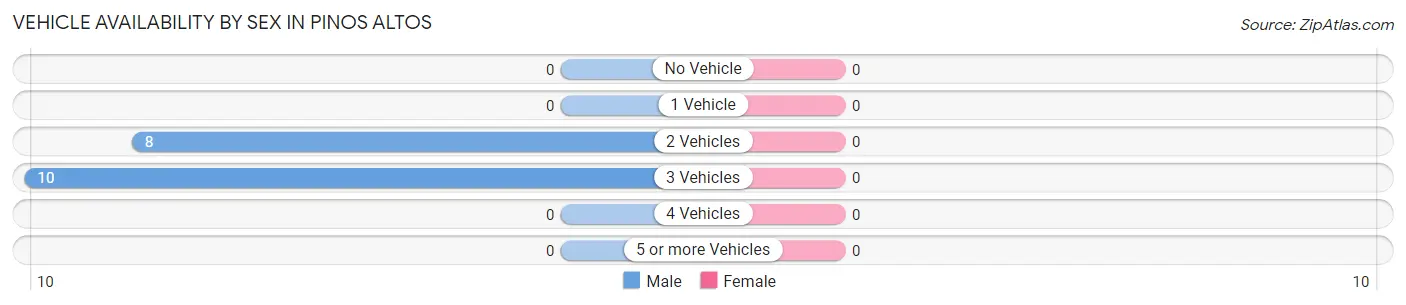
| Vehicles Available | Male | Female |
| No Vehicle | 0 (0.0%) | 0 (0.0%) |
| 1 Vehicle | 0 (0.0%) | 0 (0.0%) |
| 2 Vehicles | 8 (44.4%) | 0 (0.0%) |
| 3 Vehicles | 10 (55.6%) | 0 (0.0%) |
| 4 Vehicles | 0 (0.0%) | 0 (0.0%) |
| 5 or more Vehicles | 0 (0.0%) | 0 (0.0%) |
| Total | 18 (100.0%) | 0 (0.0%) |
Commute Time in Pinos Altos
The most frequently occuring commute durations in Pinos Altos are 25 to 29 minutes (10 commuters, 55.6%), 60 to 89 minutes (8 commuters, 44.4%), and less than 5 minutes (0 commuters, 0.0%).
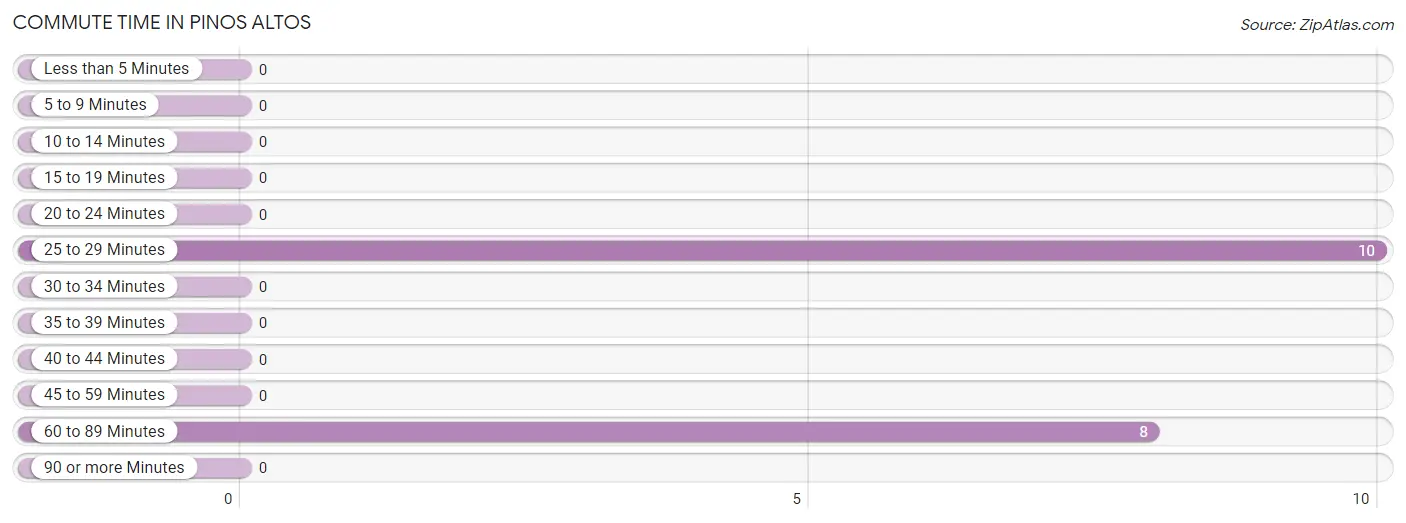
| Commute Time | # Commuters | % Commuters |
| Less than 5 Minutes | 0 | 0.0% |
| 5 to 9 Minutes | 0 | 0.0% |
| 10 to 14 Minutes | 0 | 0.0% |
| 15 to 19 Minutes | 0 | 0.0% |
| 20 to 24 Minutes | 0 | 0.0% |
| 25 to 29 Minutes | 10 | 55.6% |
| 30 to 34 Minutes | 0 | 0.0% |
| 35 to 39 Minutes | 0 | 0.0% |
| 40 to 44 Minutes | 0 | 0.0% |
| 45 to 59 Minutes | 0 | 0.0% |
| 60 to 89 Minutes | 8 | 44.4% |
| 90 or more Minutes | 0 | 0.0% |
Commute Time by Sex in Pinos Altos
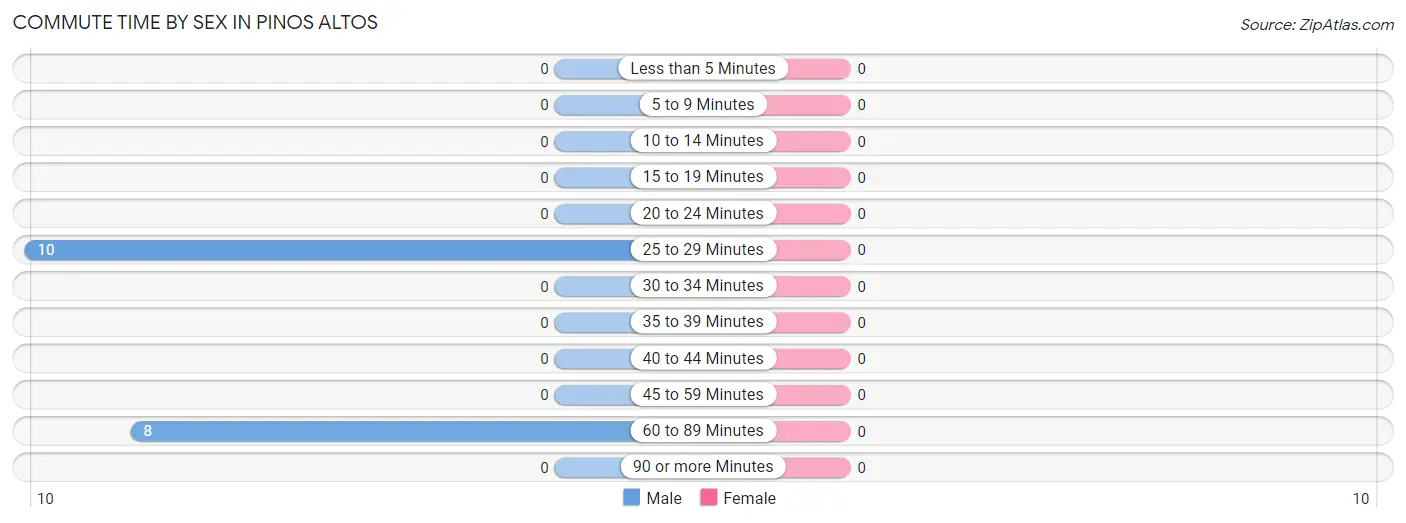
| Commute Time | Male | Female |
| Less than 5 Minutes | 0 (0.0%) | 0 (0.0%) |
| 5 to 9 Minutes | 0 (0.0%) | 0 (0.0%) |
| 10 to 14 Minutes | 0 (0.0%) | 0 (0.0%) |
| 15 to 19 Minutes | 0 (0.0%) | 0 (0.0%) |
| 20 to 24 Minutes | 0 (0.0%) | 0 (0.0%) |
| 25 to 29 Minutes | 10 (55.6%) | 0 (0.0%) |
| 30 to 34 Minutes | 0 (0.0%) | 0 (0.0%) |
| 35 to 39 Minutes | 0 (0.0%) | 0 (0.0%) |
| 40 to 44 Minutes | 0 (0.0%) | 0 (0.0%) |
| 45 to 59 Minutes | 0 (0.0%) | 0 (0.0%) |
| 60 to 89 Minutes | 8 (44.4%) | 0 (0.0%) |
| 90 or more Minutes | 0 (0.0%) | 0 (0.0%) |
Time of Departure to Work by Sex in Pinos Altos
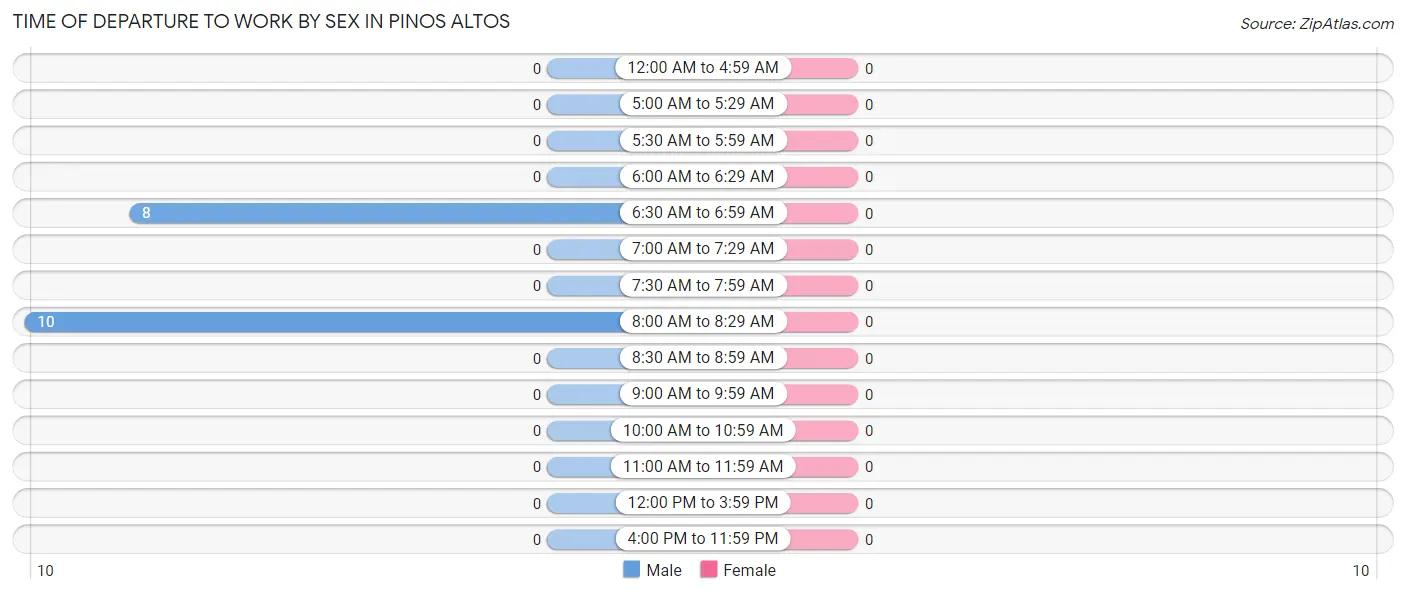
| Time of Departure | Male | Female |
| 12:00 AM to 4:59 AM | 0 (0.0%) | 0 (0.0%) |
| 5:00 AM to 5:29 AM | 0 (0.0%) | 0 (0.0%) |
| 5:30 AM to 5:59 AM | 0 (0.0%) | 0 (0.0%) |
| 6:00 AM to 6:29 AM | 0 (0.0%) | 0 (0.0%) |
| 6:30 AM to 6:59 AM | 8 (44.4%) | 0 (0.0%) |
| 7:00 AM to 7:29 AM | 0 (0.0%) | 0 (0.0%) |
| 7:30 AM to 7:59 AM | 0 (0.0%) | 0 (0.0%) |
| 8:00 AM to 8:29 AM | 10 (55.6%) | 0 (0.0%) |
| 8:30 AM to 8:59 AM | 0 (0.0%) | 0 (0.0%) |
| 9:00 AM to 9:59 AM | 0 (0.0%) | 0 (0.0%) |
| 10:00 AM to 10:59 AM | 0 (0.0%) | 0 (0.0%) |
| 11:00 AM to 11:59 AM | 0 (0.0%) | 0 (0.0%) |
| 12:00 PM to 3:59 PM | 0 (0.0%) | 0 (0.0%) |
| 4:00 PM to 11:59 PM | 0 (0.0%) | 0 (0.0%) |
| Total | 18 (100.0%) | 0 (0.0%) |
Housing Occupancy in Pinos Altos
Occupancy by Ownership in Pinos Altos
Of the total 102 dwellings in Pinos Altos, owner-occupied units account for 45 (44.1%), while renter-occupied units make up 57 (55.9%).
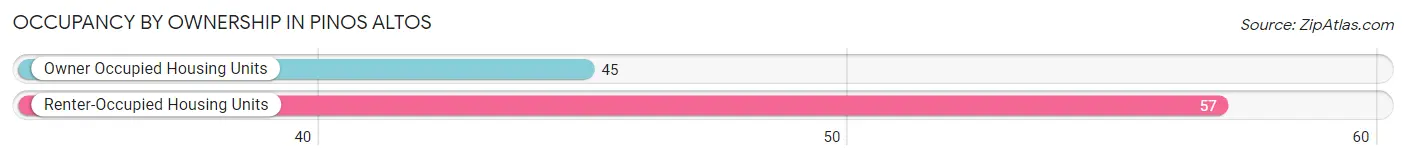
| Occupancy | # Housing Units | % Housing Units |
| Owner Occupied Housing Units | 45 | 44.1% |
| Renter-Occupied Housing Units | 57 | 55.9% |
| Total Occupied Housing Units | 102 | 100.0% |
Occupancy by Household Size in Pinos Altos
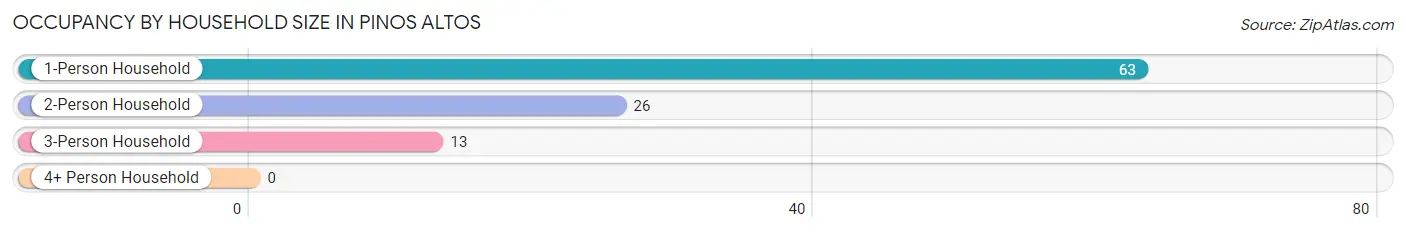
| Household Size | # Housing Units | % Housing Units |
| 1-Person Household | 63 | 61.8% |
| 2-Person Household | 26 | 25.5% |
| 3-Person Household | 13 | 12.8% |
| 4+ Person Household | 0 | 0.0% |
| Total Housing Units | 102 | 100.0% |
Occupancy by Ownership by Household Size in Pinos Altos
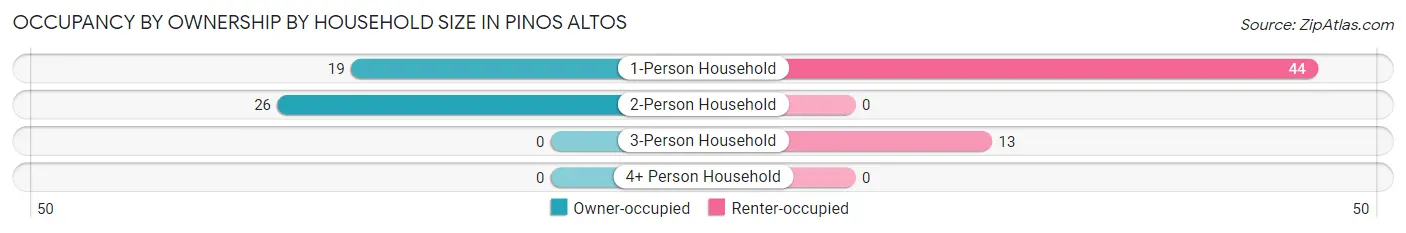
| Household Size | Owner-occupied | Renter-occupied |
| 1-Person Household | 19 (30.2%) | 44 (69.8%) |
| 2-Person Household | 26 (100.0%) | 0 (0.0%) |
| 3-Person Household | 0 (0.0%) | 13 (100.0%) |
| 4+ Person Household | 0 (0.0%) | 0 (0.0%) |
| Total Housing Units | 45 (44.1%) | 57 (55.9%) |
Occupancy by Educational Attainment in Pinos Altos
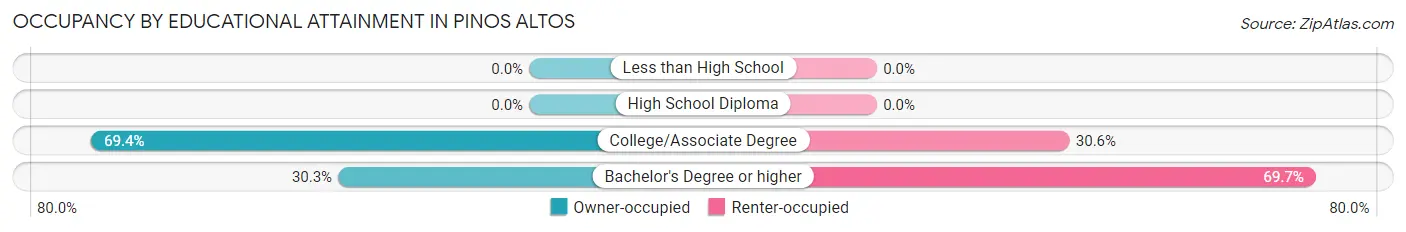
| Household Size | Owner-occupied | Renter-occupied |
| Less than High School | 0 (0.0%) | 0 (0.0%) |
| High School Diploma | 0 (0.0%) | 0 (0.0%) |
| College/Associate Degree | 25 (69.4%) | 11 (30.6%) |
| Bachelor's Degree or higher | 20 (30.3%) | 46 (69.7%) |
Occupancy by Age of Householder in Pinos Altos
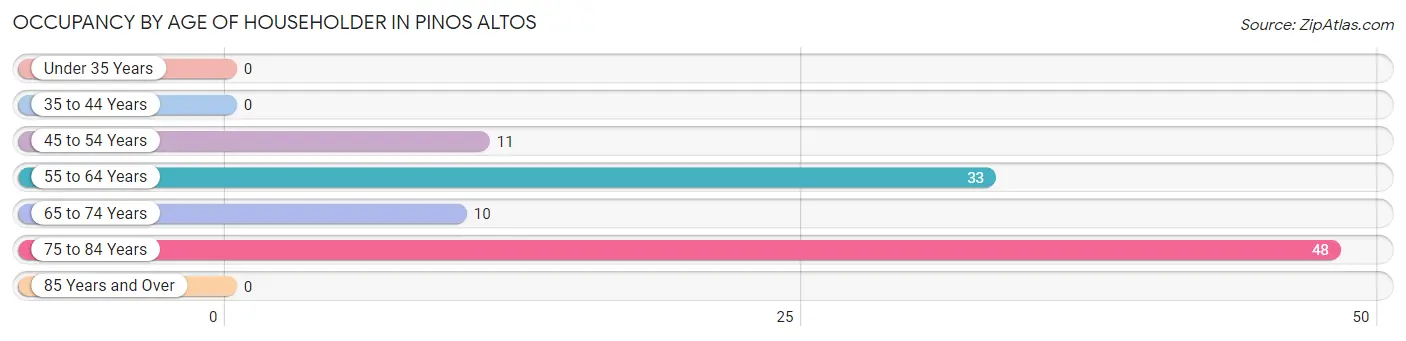
| Age Bracket | # Households | % Households |
| Under 35 Years | 0 | 0.0% |
| 35 to 44 Years | 0 | 0.0% |
| 45 to 54 Years | 11 | 10.8% |
| 55 to 64 Years | 33 | 32.4% |
| 65 to 74 Years | 10 | 9.8% |
| 75 to 84 Years | 48 | 47.1% |
| 85 Years and Over | 0 | 0.0% |
| Total | 102 | 100.0% |
Housing Finances in Pinos Altos
Median Income by Occupancy in Pinos Altos
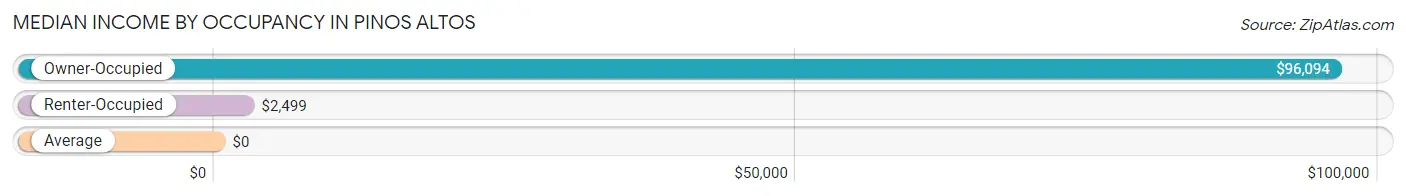
| Occupancy Type | # Households | Median Income |
| Owner-Occupied | 45 (44.1%) | $96,094 |
| Renter-Occupied | 57 (55.9%) | $2,499 |
| Average | 102 (100.0%) | $0 |
Occupancy by Householder Income Bracket in Pinos Altos
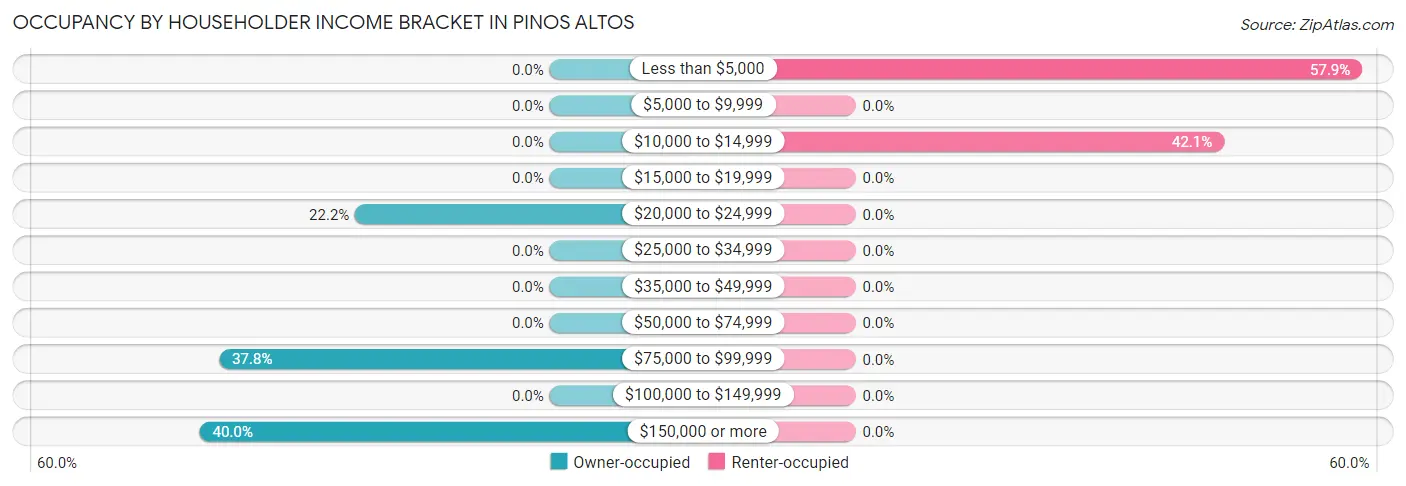
| Income Bracket | Owner-occupied | Renter-occupied |
| Less than $5,000 | 0 (0.0%) | 33 (57.9%) |
| $5,000 to $9,999 | 0 (0.0%) | 0 (0.0%) |
| $10,000 to $14,999 | 0 (0.0%) | 24 (42.1%) |
| $15,000 to $19,999 | 0 (0.0%) | 0 (0.0%) |
| $20,000 to $24,999 | 10 (22.2%) | 0 (0.0%) |
| $25,000 to $34,999 | 0 (0.0%) | 0 (0.0%) |
| $35,000 to $49,999 | 0 (0.0%) | 0 (0.0%) |
| $50,000 to $74,999 | 0 (0.0%) | 0 (0.0%) |
| $75,000 to $99,999 | 17 (37.8%) | 0 (0.0%) |
| $100,000 to $149,999 | 0 (0.0%) | 0 (0.0%) |
| $150,000 or more | 18 (40.0%) | 0 (0.0%) |
| Total | 45 (100.0%) | 57 (100.0%) |
Monthly Housing Cost Tiers in Pinos Altos
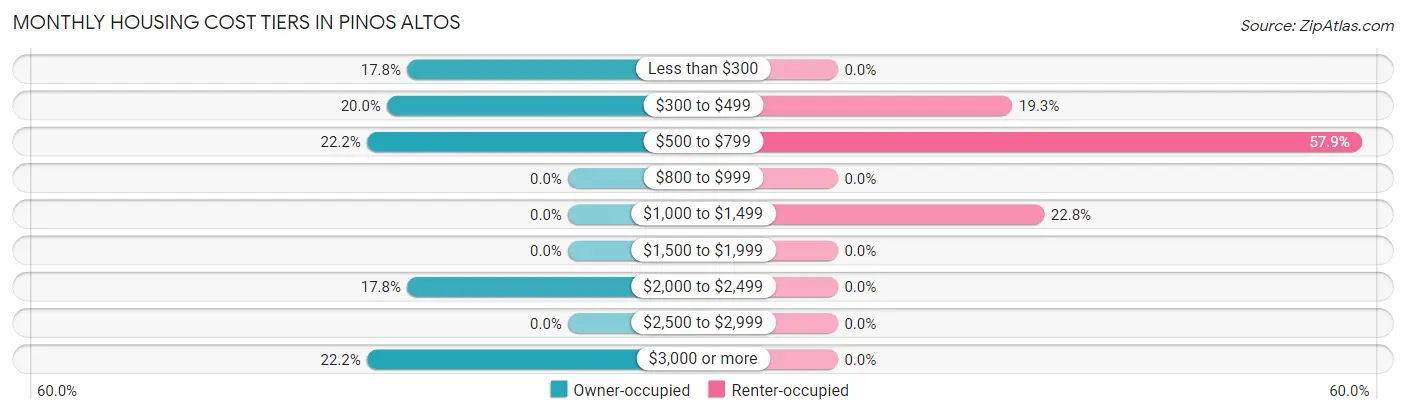
| Monthly Cost | Owner-occupied | Renter-occupied |
| Less than $300 | 8 (17.8%) | 0 (0.0%) |
| $300 to $499 | 9 (20.0%) | 11 (19.3%) |
| $500 to $799 | 10 (22.2%) | 33 (57.9%) |
| $800 to $999 | 0 (0.0%) | 0 (0.0%) |
| $1,000 to $1,499 | 0 (0.0%) | 13 (22.8%) |
| $1,500 to $1,999 | 0 (0.0%) | 0 (0.0%) |
| $2,000 to $2,499 | 8 (17.8%) | 0 (0.0%) |
| $2,500 to $2,999 | 0 (0.0%) | 0 (0.0%) |
| $3,000 or more | 10 (22.2%) | 0 (0.0%) |
| Total | 45 (100.0%) | 57 (100.0%) |
Physical Housing Characteristics in Pinos Altos
Housing Structures in Pinos Altos
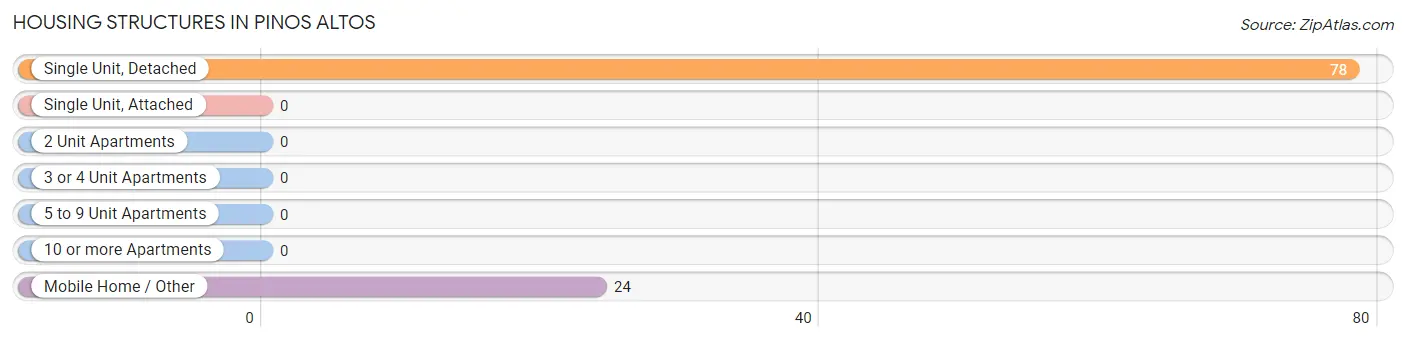
| Structure Type | # Housing Units | % Housing Units |
| Single Unit, Detached | 78 | 76.5% |
| Single Unit, Attached | 0 | 0.0% |
| 2 Unit Apartments | 0 | 0.0% |
| 3 or 4 Unit Apartments | 0 | 0.0% |
| 5 to 9 Unit Apartments | 0 | 0.0% |
| 10 or more Apartments | 0 | 0.0% |
| Mobile Home / Other | 24 | 23.5% |
| Total | 102 | 100.0% |
Housing Structures by Occupancy in Pinos Altos
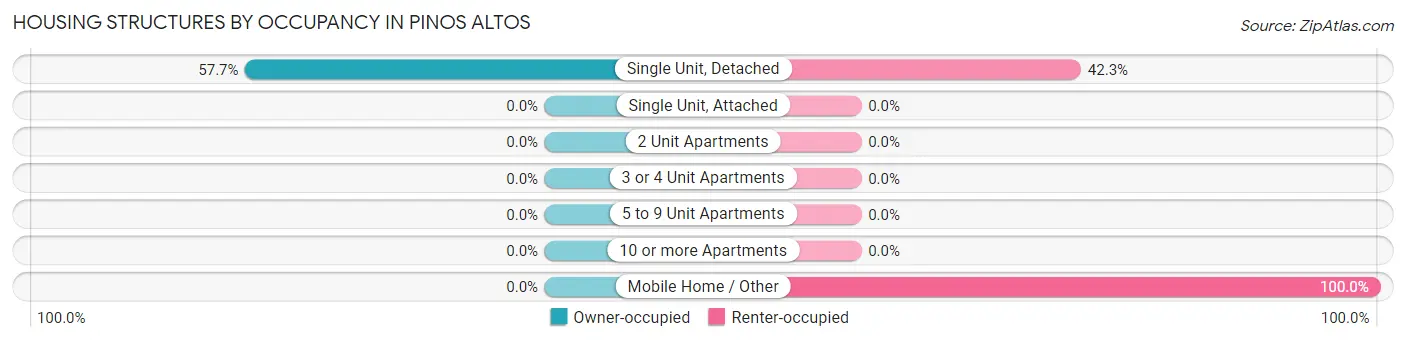
| Structure Type | Owner-occupied | Renter-occupied |
| Single Unit, Detached | 45 (57.7%) | 33 (42.3%) |
| Single Unit, Attached | 0 (0.0%) | 0 (0.0%) |
| 2 Unit Apartments | 0 (0.0%) | 0 (0.0%) |
| 3 or 4 Unit Apartments | 0 (0.0%) | 0 (0.0%) |
| 5 to 9 Unit Apartments | 0 (0.0%) | 0 (0.0%) |
| 10 or more Apartments | 0 (0.0%) | 0 (0.0%) |
| Mobile Home / Other | 0 (0.0%) | 24 (100.0%) |
| Total | 45 (44.1%) | 57 (55.9%) |
Housing Structures by Number of Rooms in Pinos Altos
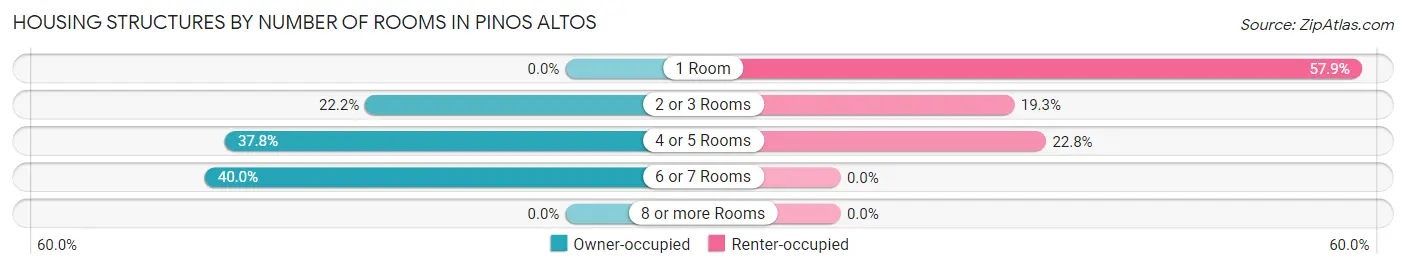
| Number of Rooms | Owner-occupied | Renter-occupied |
| 1 Room | 0 (0.0%) | 33 (57.9%) |
| 2 or 3 Rooms | 10 (22.2%) | 11 (19.3%) |
| 4 or 5 Rooms | 17 (37.8%) | 13 (22.8%) |
| 6 or 7 Rooms | 18 (40.0%) | 0 (0.0%) |
| 8 or more Rooms | 0 (0.0%) | 0 (0.0%) |
| Total | 45 (100.0%) | 57 (100.0%) |
Housing Structure by Heating Type in Pinos Altos
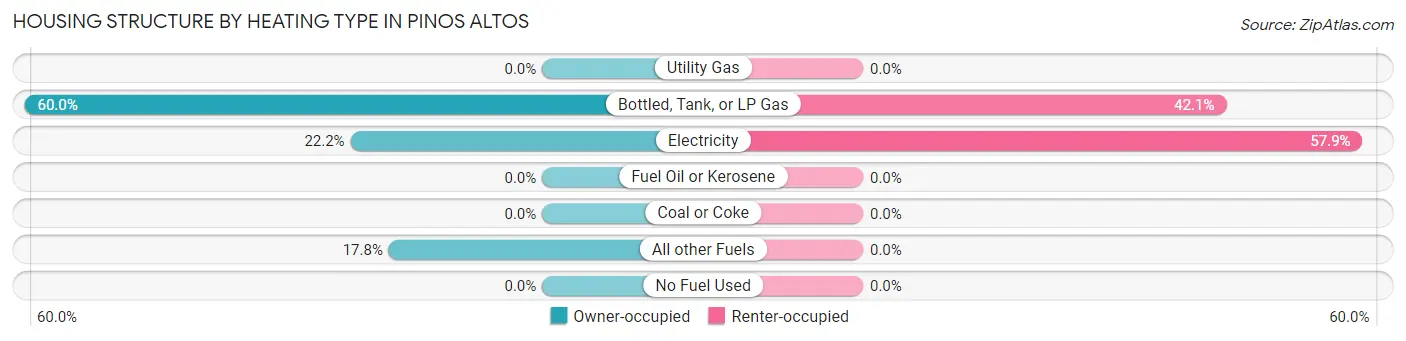
| Heating Type | Owner-occupied | Renter-occupied |
| Utility Gas | 0 (0.0%) | 0 (0.0%) |
| Bottled, Tank, or LP Gas | 27 (60.0%) | 24 (42.1%) |
| Electricity | 10 (22.2%) | 33 (57.9%) |
| Fuel Oil or Kerosene | 0 (0.0%) | 0 (0.0%) |
| Coal or Coke | 0 (0.0%) | 0 (0.0%) |
| All other Fuels | 8 (17.8%) | 0 (0.0%) |
| No Fuel Used | 0 (0.0%) | 0 (0.0%) |
| Total | 45 (100.0%) | 57 (100.0%) |
Household Vehicle Usage in Pinos Altos
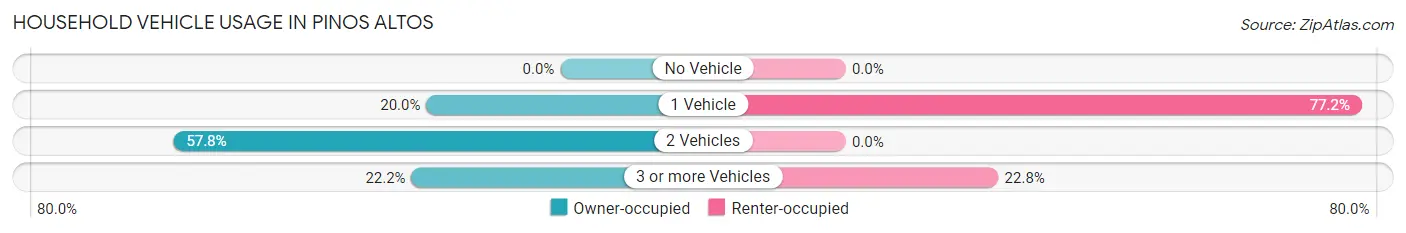
| Vehicles per Household | Owner-occupied | Renter-occupied |
| No Vehicle | 0 (0.0%) | 0 (0.0%) |
| 1 Vehicle | 9 (20.0%) | 44 (77.2%) |
| 2 Vehicles | 26 (57.8%) | 0 (0.0%) |
| 3 or more Vehicles | 10 (22.2%) | 13 (22.8%) |
| Total | 45 (100.0%) | 57 (100.0%) |
Real Estate & Mortgages in Pinos Altos
Real Estate and Mortgage Overview in Pinos Altos
| Characteristic | Without Mortgage | With Mortgage |
| Housing Units | 27 | 18 |
| Median Property Value | - | - |
| Median Household Income | - | - |
| Monthly Housing Costs | $461 | $10 |
| Real Estate Taxes | $1,306 | $0 |
Property Value by Mortgage Status in Pinos Altos
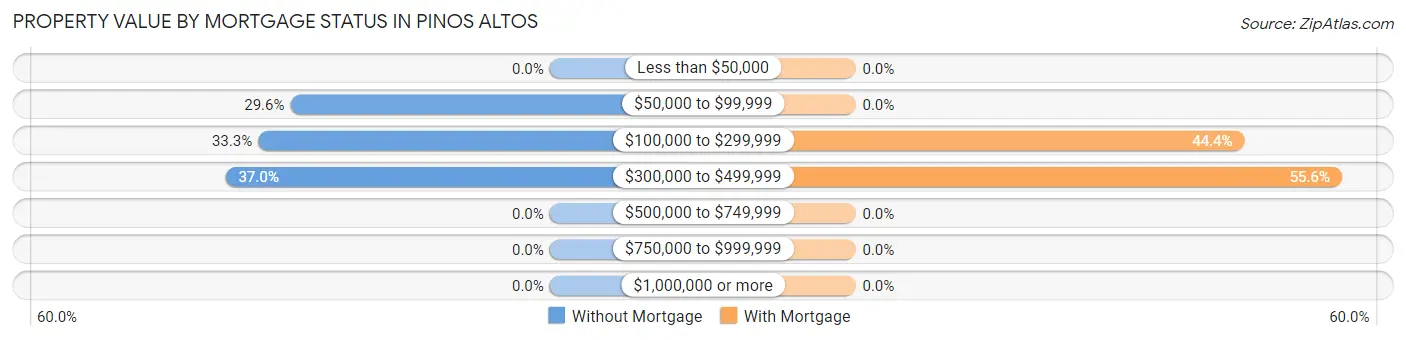
| Property Value | Without Mortgage | With Mortgage |
| Less than $50,000 | 0 (0.0%) | 0 (0.0%) |
| $50,000 to $99,999 | 8 (29.6%) | 0 (0.0%) |
| $100,000 to $299,999 | 9 (33.3%) | 8 (44.4%) |
| $300,000 to $499,999 | 10 (37.0%) | 10 (55.6%) |
| $500,000 to $749,999 | 0 (0.0%) | 0 (0.0%) |
| $750,000 to $999,999 | 0 (0.0%) | 0 (0.0%) |
| $1,000,000 or more | 0 (0.0%) | 0 (0.0%) |
| Total | 27 (100.0%) | 18 (100.0%) |
Household Income by Mortgage Status in Pinos Altos
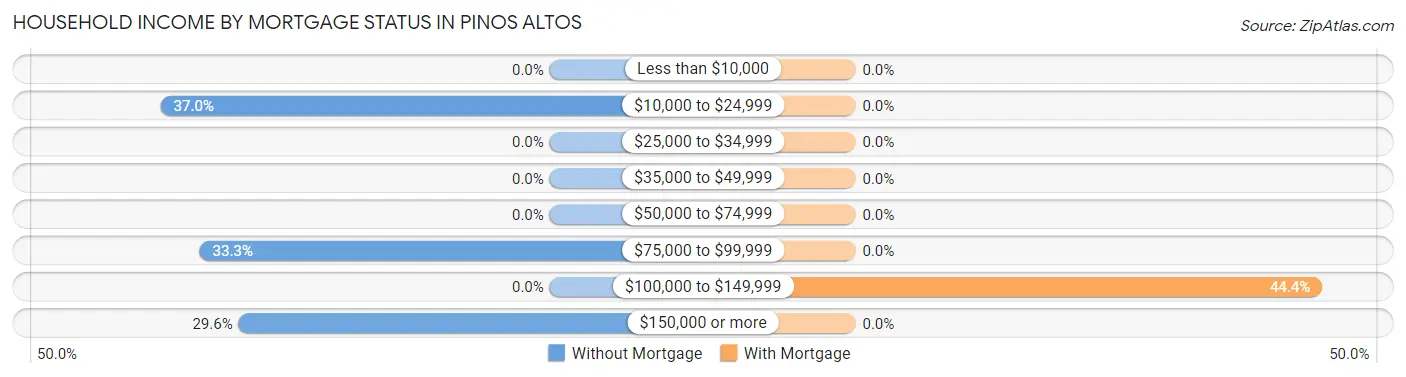
| Household Income | Without Mortgage | With Mortgage |
| Less than $10,000 | 0 (0.0%) | 0 (0.0%) |
| $10,000 to $24,999 | 10 (37.0%) | 0 (0.0%) |
| $25,000 to $34,999 | 0 (0.0%) | 0 (0.0%) |
| $35,000 to $49,999 | 0 (0.0%) | 0 (0.0%) |
| $50,000 to $74,999 | 0 (0.0%) | 0 (0.0%) |
| $75,000 to $99,999 | 9 (33.3%) | 0 (0.0%) |
| $100,000 to $149,999 | 0 (0.0%) | 8 (44.4%) |
| $150,000 or more | 8 (29.6%) | 0 (0.0%) |
| Total | 27 (100.0%) | 18 (100.0%) |
Property Value to Household Income Ratio in Pinos Altos
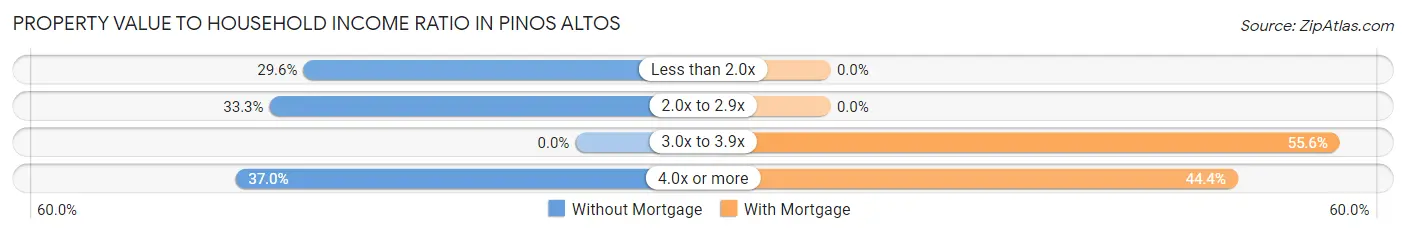
| Value-to-Income Ratio | Without Mortgage | With Mortgage |
| Less than 2.0x | 8 (29.6%) | 0 (0.0%) |
| 2.0x to 2.9x | 9 (33.3%) | 0 (0.0%) |
| 3.0x to 3.9x | 0 (0.0%) | 10 (55.6%) |
| 4.0x or more | 10 (37.0%) | 8 (44.4%) |
| Total | 27 (100.0%) | 18 (100.0%) |
Real Estate Taxes by Mortgage Status in Pinos Altos
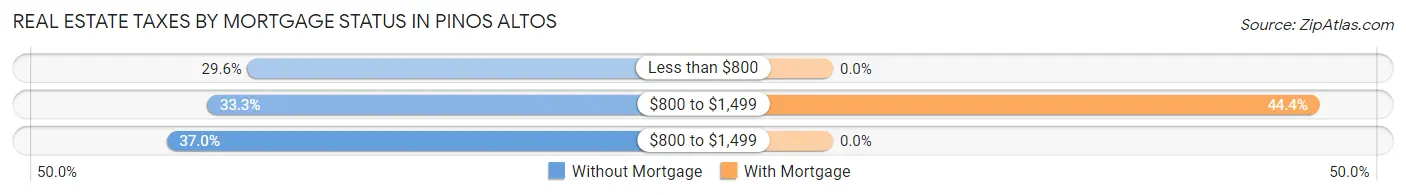
| Property Taxes | Without Mortgage | With Mortgage |
| Less than $800 | 8 (29.6%) | 0 (0.0%) |
| $800 to $1,499 | 9 (33.3%) | 8 (44.4%) |
| $800 to $1,499 | 10 (37.0%) | 0 (0.0%) |
| Total | 27 (100.0%) | 18 (100.0%) |
Health & Disability in Pinos Altos
Health Insurance Coverage by Age in Pinos Altos
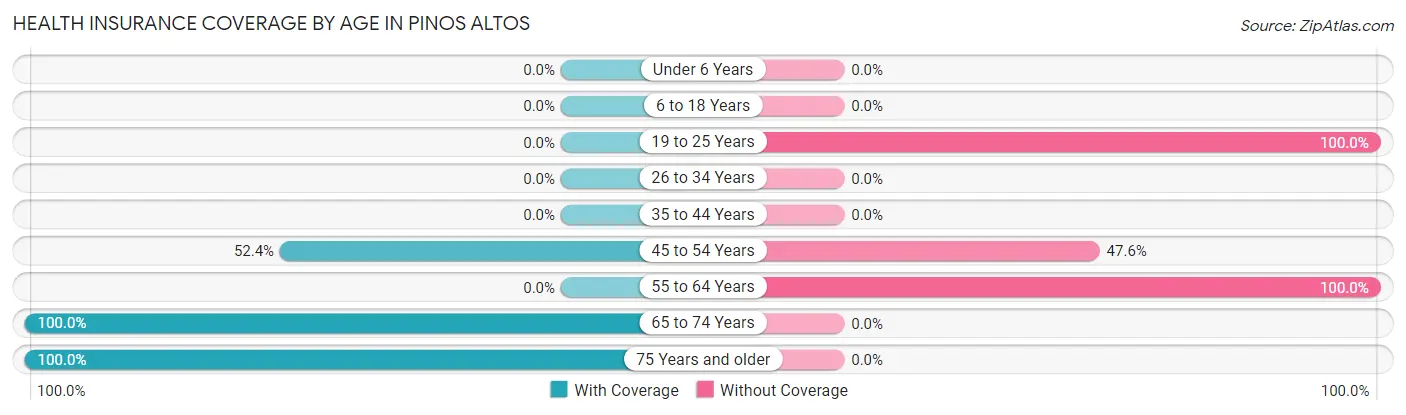
| Age Bracket | With Coverage | Without Coverage |
| Under 6 Years | 0 (0.0%) | 0 (0.0%) |
| 6 to 18 Years | 0 (0.0%) | 0 (0.0%) |
| 19 to 25 Years | 0 (0.0%) | 41 (100.0%) |
| 26 to 34 Years | 0 (0.0%) | 0 (0.0%) |
| 35 to 44 Years | 0 (0.0%) | 0 (0.0%) |
| 45 to 54 Years | 11 (52.4%) | 10 (47.6%) |
| 55 to 64 Years | 0 (0.0%) | 33 (100.0%) |
| 65 to 74 Years | 18 (100.0%) | 0 (0.0%) |
| 75 Years and older | 72 (100.0%) | 0 (0.0%) |
| Total | 101 (54.6%) | 84 (45.4%) |
Health Insurance Coverage by Citizenship Status in Pinos Altos
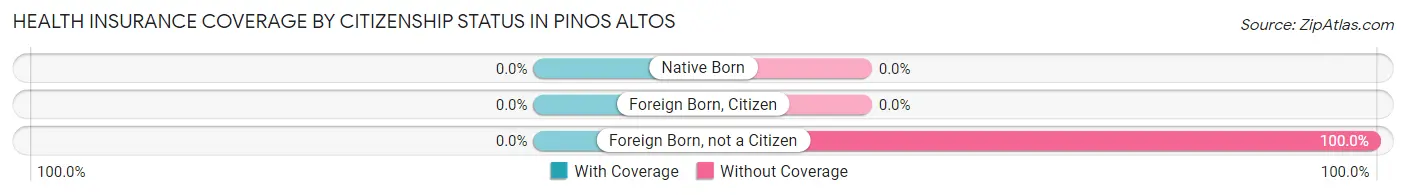
| Citizenship Status | With Coverage | Without Coverage |
| Native Born | 0 (0.0%) | 0 (0.0%) |
| Foreign Born, Citizen | 0 (0.0%) | 0 (0.0%) |
| Foreign Born, not a Citizen | 0 (0.0%) | 41 (100.0%) |
Health Insurance Coverage by Household Income in Pinos Altos
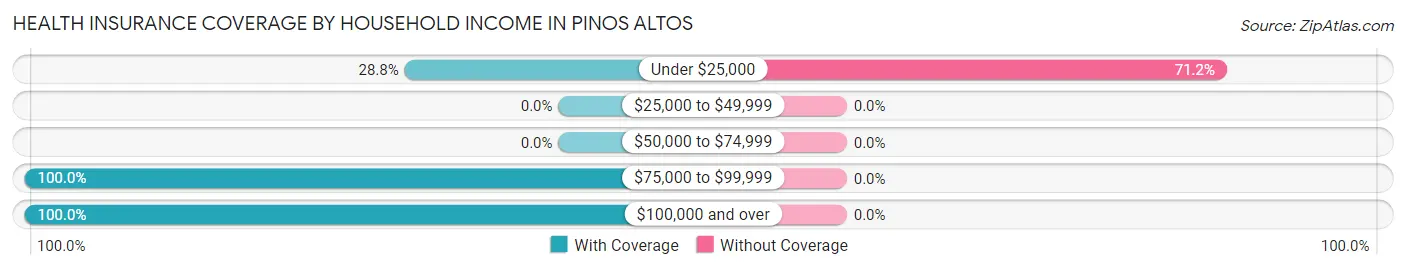
| Household Income | With Coverage | Without Coverage |
| Under $25,000 | 34 (28.8%) | 84 (71.2%) |
| $25,000 to $49,999 | 0 (0.0%) | 0 (0.0%) |
| $50,000 to $74,999 | 0 (0.0%) | 0 (0.0%) |
| $75,000 to $99,999 | 25 (100.0%) | 0 (0.0%) |
| $100,000 and over | 42 (100.0%) | 0 (0.0%) |
Public vs Private Health Insurance Coverage by Age in Pinos Altos
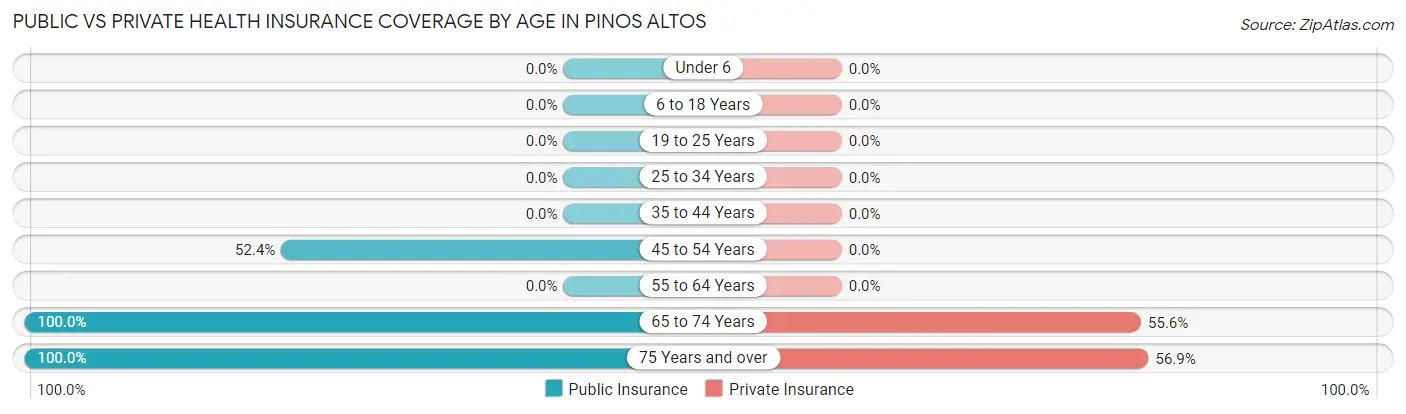
| Age Bracket | Public Insurance | Private Insurance |
| Under 6 | 0 (0.0%) | 0 (0.0%) |
| 6 to 18 Years | 0 (0.0%) | 0 (0.0%) |
| 19 to 25 Years | 0 (0.0%) | 0 (0.0%) |
| 25 to 34 Years | 0 (0.0%) | 0 (0.0%) |
| 35 to 44 Years | 0 (0.0%) | 0 (0.0%) |
| 45 to 54 Years | 11 (52.4%) | 0 (0.0%) |
| 55 to 64 Years | 0 (0.0%) | 0 (0.0%) |
| 65 to 74 Years | 18 (100.0%) | 10 (55.6%) |
| 75 Years and over | 72 (100.0%) | 41 (56.9%) |
| Total | 101 (54.6%) | 51 (27.6%) |
Disability Status by Sex by Age in Pinos Altos
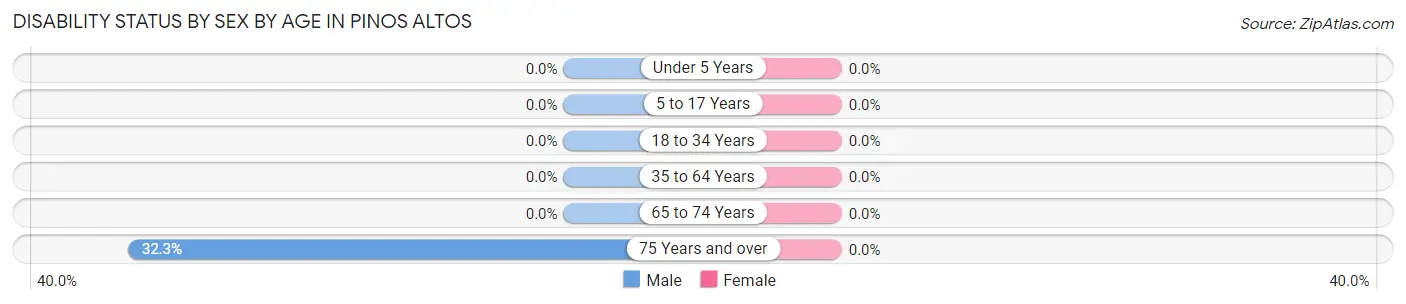
| Age Bracket | Male | Female |
| Under 5 Years | 0 (0.0%) | 0 (0.0%) |
| 5 to 17 Years | 0 (0.0%) | 0 (0.0%) |
| 18 to 34 Years | 0 (0.0%) | 0 (0.0%) |
| 35 to 64 Years | 0 (0.0%) | 0 (0.0%) |
| 65 to 74 Years | 0 (0.0%) | 0 (0.0%) |
| 75 Years and over | 10 (32.3%) | 0 (0.0%) |
Disability Class by Sex by Age in Pinos Altos
Disability Class: Hearing Difficulty
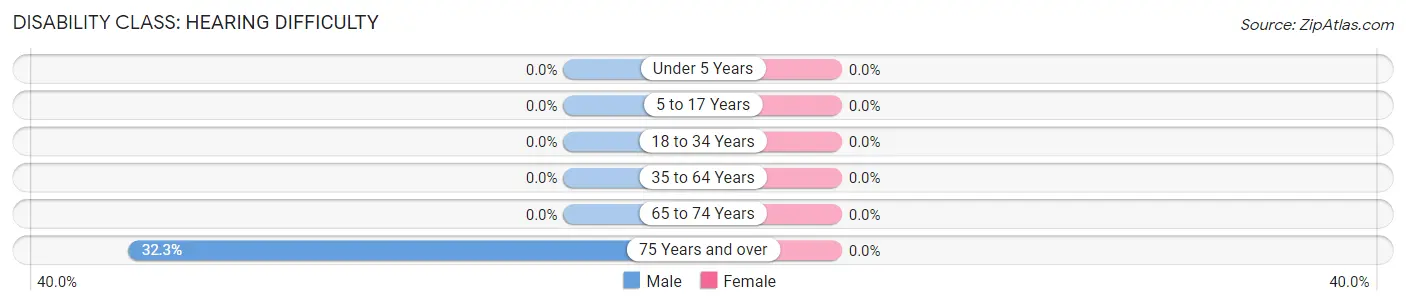
| Age Bracket | Male | Female |
| Under 5 Years | 0 (0.0%) | 0 (0.0%) |
| 5 to 17 Years | 0 (0.0%) | 0 (0.0%) |
| 18 to 34 Years | 0 (0.0%) | 0 (0.0%) |
| 35 to 64 Years | 0 (0.0%) | 0 (0.0%) |
| 65 to 74 Years | 0 (0.0%) | 0 (0.0%) |
| 75 Years and over | 10 (32.3%) | 0 (0.0%) |
Disability Class: Vision Difficulty
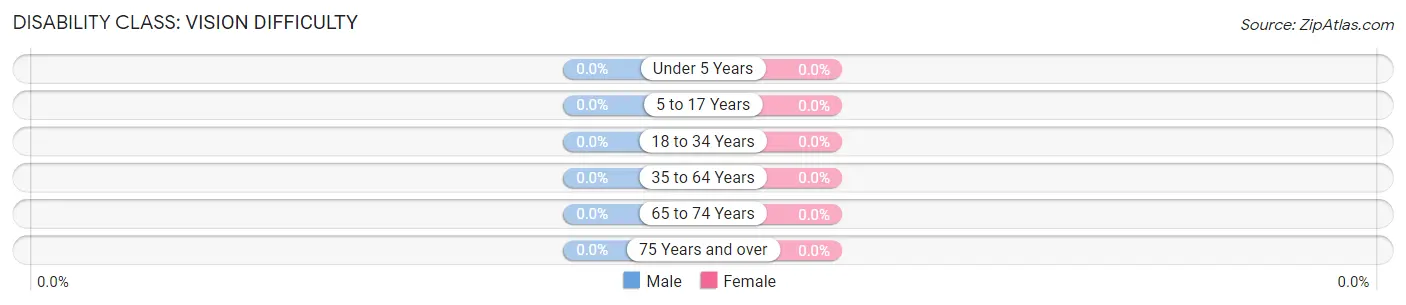
| Age Bracket | Male | Female |
| Under 5 Years | 0 (0.0%) | 0 (0.0%) |
| 5 to 17 Years | 0 (0.0%) | 0 (0.0%) |
| 18 to 34 Years | 0 (0.0%) | 0 (0.0%) |
| 35 to 64 Years | 0 (0.0%) | 0 (0.0%) |
| 65 to 74 Years | 0 (0.0%) | 0 (0.0%) |
| 75 Years and over | 0 (0.0%) | 0 (0.0%) |
Disability Class: Cognitive Difficulty
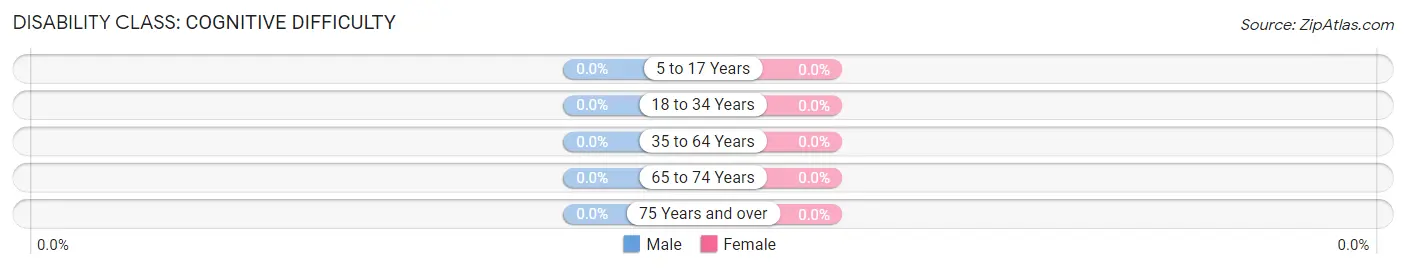
| Age Bracket | Male | Female |
| 5 to 17 Years | 0 (0.0%) | 0 (0.0%) |
| 18 to 34 Years | 0 (0.0%) | 0 (0.0%) |
| 35 to 64 Years | 0 (0.0%) | 0 (0.0%) |
| 65 to 74 Years | 0 (0.0%) | 0 (0.0%) |
| 75 Years and over | 0 (0.0%) | 0 (0.0%) |
Disability Class: Ambulatory Difficulty
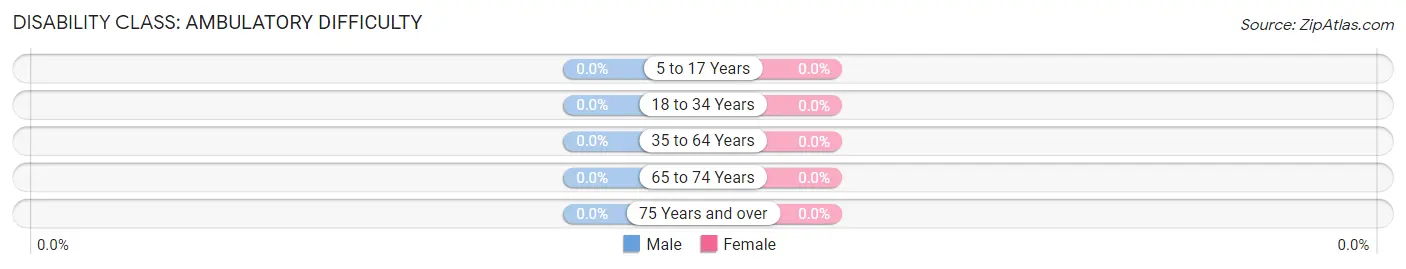
| Age Bracket | Male | Female |
| 5 to 17 Years | 0 (0.0%) | 0 (0.0%) |
| 18 to 34 Years | 0 (0.0%) | 0 (0.0%) |
| 35 to 64 Years | 0 (0.0%) | 0 (0.0%) |
| 65 to 74 Years | 0 (0.0%) | 0 (0.0%) |
| 75 Years and over | 0 (0.0%) | 0 (0.0%) |
Disability Class: Self-Care Difficulty
| Age Bracket | Male | Female |
| 5 to 17 Years | 0 (0.0%) | 0 (0.0%) |
| 18 to 34 Years | 0 (0.0%) | 0 (0.0%) |
| 35 to 64 Years | 0 (0.0%) | 0 (0.0%) |
| 65 to 74 Years | 0 (0.0%) | 0 (0.0%) |
| 75 Years and over | 0 (0.0%) | 0 (0.0%) |
Technology Access in Pinos Altos
Computing Device Access in Pinos Altos
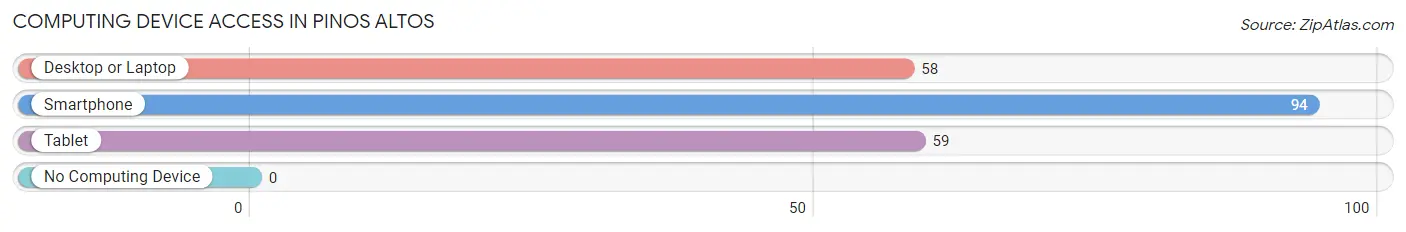
| Device Type | # Households | % Households |
| Desktop or Laptop | 58 | 56.9% |
| Smartphone | 94 | 92.2% |
| Tablet | 59 | 57.8% |
| No Computing Device | 0 | 0.0% |
| Total | 102 | 100.0% |
Internet Access in Pinos Altos
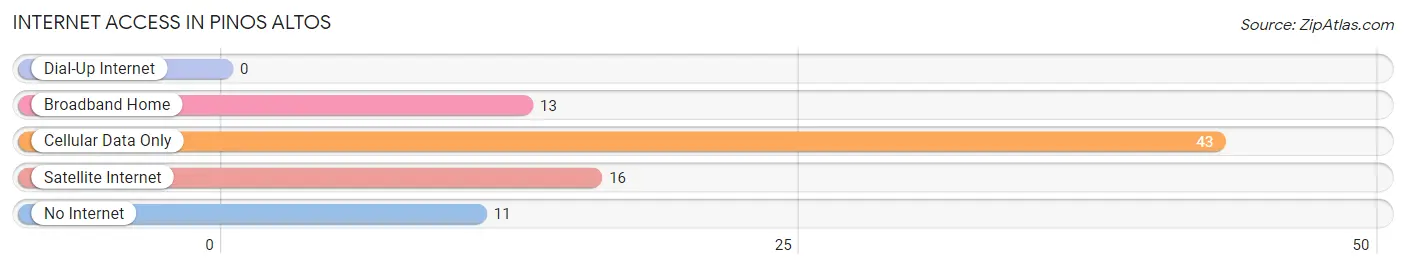
| Internet Type | # Households | % Households |
| Dial-Up Internet | 0 | 0.0% |
| Broadband Home | 13 | 12.8% |
| Cellular Data Only | 43 | 42.2% |
| Satellite Internet | 16 | 15.7% |
| No Internet | 11 | 10.8% |
| Total | 102 | 100.0% |
Pinos Altos Summary
Pinos Altos, New Mexico is a small unincorporated community located in Grant County, New Mexico. It is situated in the foothills of the Gila National Forest, approximately 20 miles north of Silver City. The town was founded in the late 1800s and has a population of approximately 500 people.
History
Pinos Altos was founded in the late 1800s by miners who were searching for gold in the nearby hills. The town was originally called “Pinos Altos”, which means “high pines” in Spanish. The town was named after the tall pines that grew in the area. The town was a popular destination for miners and prospectors, and it quickly grew into a bustling mining town.
In the early 1900s, Pinos Altos was a major center for gold mining. The town was home to several large gold mines, including the Pinos Altos Mine, which was one of the largest gold mines in the area. The town also had several saloons, hotels, and stores.
In the late 1940s, the gold mines began to decline and the town’s population began to dwindle. In the 1950s, the town was almost abandoned. However, in the 1960s, the town began to experience a resurgence as a tourist destination. The town was featured in several movies and television shows, and it became a popular destination for tourists.
Geography
Pinos Altos is located in the foothills of the Gila National Forest, approximately 20 miles north of Silver City. The town is situated at an elevation of 6,000 feet, and it is surrounded by mountains and forests. The town is located in a semi-arid climate, with hot summers and cold winters.
The town is located near several natural attractions, including the Gila Cliff Dwellings National Monument, the Gila National Forest, and the Gila Wilderness. The town is also located near several popular recreational areas, including the Gila River, the San Francisco River, and the San Francisco Peaks.
Economy
The economy of Pinos Altos is largely based on tourism. The town is a popular destination for tourists, and it is home to several restaurants, hotels, and shops. The town is also home to several art galleries and museums, which attract visitors from all over the world.
The town is also home to several small businesses, including a grocery store, a hardware store, and a gas station. The town is also home to several small farms, which produce a variety of fruits and vegetables.
Demographics
As of the 2010 census, the population of Pinos Altos was 498. The town is predominantly white, with approximately 90% of the population being white. The town also has a small Hispanic population, with approximately 8% of the population being Hispanic. The town also has a small Native American population, with approximately 2% of the population being Native American.
The median household income in Pinos Altos is $37,500, and the median home value is $150,000. The town has a high rate of homeownership, with approximately 75% of the population owning their own homes. The town also has a high rate of educational attainment, with approximately 90% of the population having a high school diploma or higher.
Common Questions
What is Per Capita Income in Pinos Altos?
Per Capita income in Pinos Altos is $27,598.
What is Inequality or Gini Index in Pinos Altos?
Inequality or Gini Index in Pinos Altos is 0.64.
What is the Total Population of Pinos Altos?
Total Population of Pinos Altos is 185.
What is the Total Male Population of Pinos Altos?
Total Male Population of Pinos Altos is 101.
What is the Total Female Population of Pinos Altos?
Total Female Population of Pinos Altos is 84.
What is the Ratio of Males per 100 Females in Pinos Altos?
There are 120.24 Males per 100 Females in Pinos Altos.
What is the Ratio of Females per 100 Males in Pinos Altos?
There are 83.17 Females per 100 Males in Pinos Altos.
What is the Median Population Age in Pinos Altos?
Median Population Age in Pinos Altos is 55.9 Years.
What is the Average Family Size in Pinos Altos
Average Family Size in Pinos Altos is 3.1 People.
What is the Average Household Size in Pinos Altos
Average Household Size in Pinos Altos is 1.8 People.
How Large is the Labor Force in Pinos Altos?
There are 29 People in the Labor Forcein in Pinos Altos.
What is the Percentage of People in the Labor Force in Pinos Altos?
15.7% of People are in the Labor Force in Pinos Altos.
What is the Unemployment Rate in Pinos Altos?
Unemployment Rate in Pinos Altos is 37.9%.