Pinehill, NM Map & Demographics
Pinehill Map
Pinehill Overview
$22,206
PER CAPITA INCOME
$27,500
AVG FAMILY INCOME
$41,250
AVG HOUSEHOLD INCOME
0.5%
WAGE / INCOME GAP [ % ]
99.5¢/ $1
WAGE / INCOME GAP [ $ ]
0.53
INEQUALITY / GINI INDEX
391
TOTAL POPULATION
152
MALE POPULATION
239
FEMALE POPULATION
63.60
MALES / 100 FEMALES
157.24
FEMALES / 100 MALES
28.9
MEDIAN AGE
3.6
AVG FAMILY SIZE
2.6
AVG HOUSEHOLD SIZE
147
LABOR FORCE [ PEOPLE ]
51.6%
PERCENT IN LABOR FORCE
16.3%
UNEMPLOYMENT RATE
Pinehill Zip Codes
Pinehill Area Codes
Income in Pinehill
Income Overview in Pinehill
Per Capita Income in Pinehill is $22,206, while median incomes of families and households are $27,500 and $41,250 respectively.
| Characteristic | Number | Measure |
| Per Capita Income | 391 | $22,206 |
| Median Family Income | 92 | $27,500 |
| Mean Family Income | 92 | $61,528 |
| Median Household Income | 148 | $41,250 |
| Mean Household Income | 148 | $52,186 |
| Income Deficit | 92 | $0 |
| Wage / Income Gap (%) | 391 | 0.52% |
| Wage / Income Gap ($) | 391 | 99.48¢ per $1 |
| Gini / Inequality Index | 391 | 0.53 |
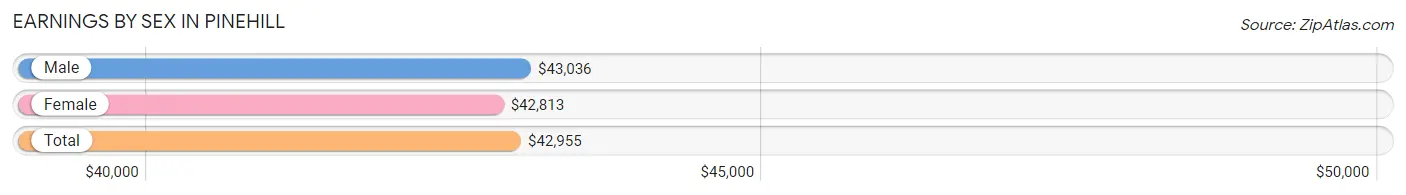
Earnings by Sex in Pinehill
Average Earnings in Pinehill are $42,955, $43,036 for men and $42,813 for women, a difference of 0.5%.
| Sex | Number | Average Earnings |
| Male | 65 (39.6%) | $43,036 |
| Female | 99 (60.4%) | $42,813 |
| Total | 164 (100.0%) | $42,955 |
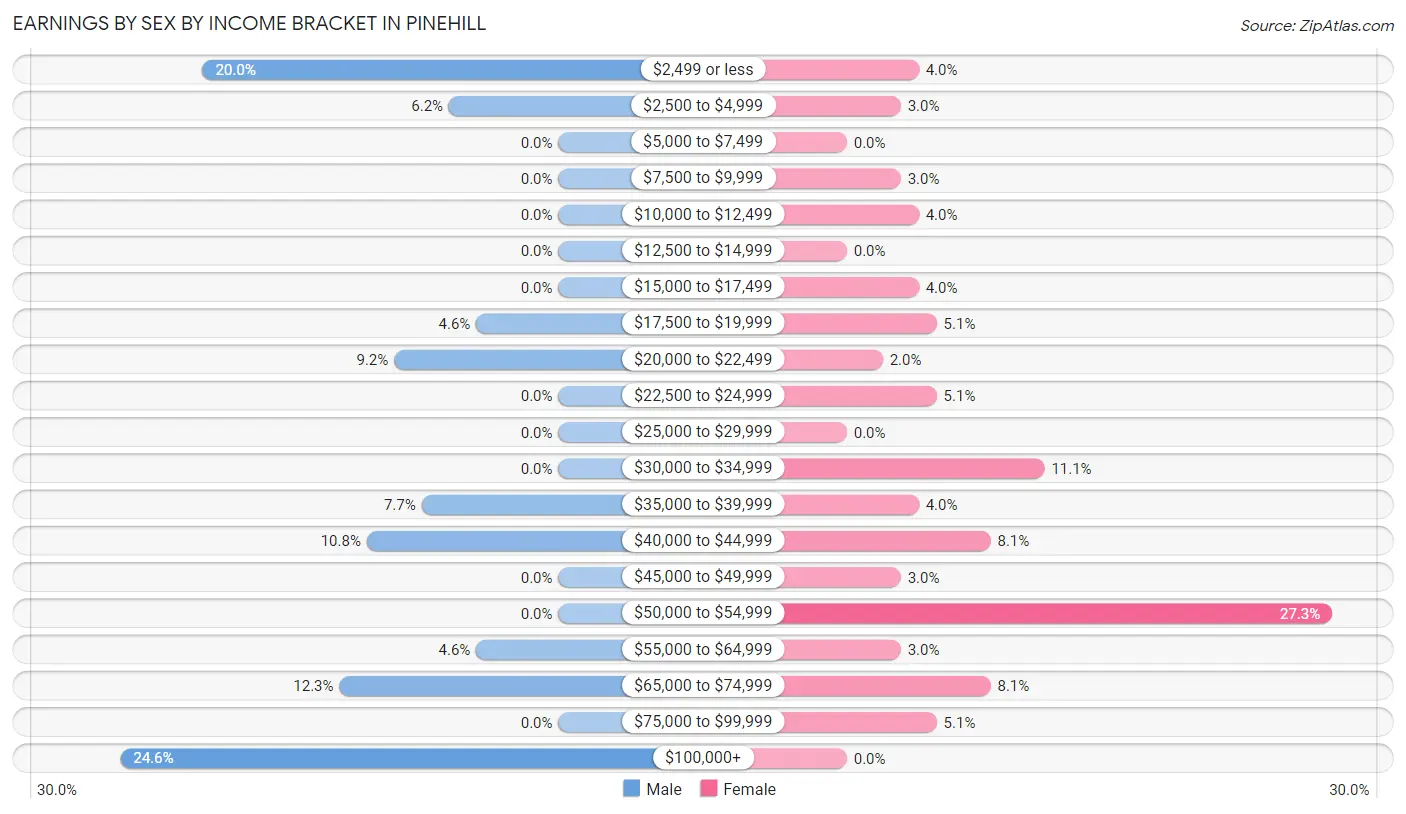
Earnings by Sex by Income Bracket in Pinehill
The most common earnings brackets in Pinehill are $100,000+ for men (16 | 24.6%) and $50,000 to $54,999 for women (27 | 27.3%).
| Income | Male | Female |
| $2,499 or less | 13 (20.0%) | 4 (4.0%) |
| $2,500 to $4,999 | 4 (6.1%) | 3 (3.0%) |
| $5,000 to $7,499 | 0 (0.0%) | 0 (0.0%) |
| $7,500 to $9,999 | 0 (0.0%) | 3 (3.0%) |
| $10,000 to $12,499 | 0 (0.0%) | 4 (4.0%) |
| $12,500 to $14,999 | 0 (0.0%) | 0 (0.0%) |
| $15,000 to $17,499 | 0 (0.0%) | 4 (4.0%) |
| $17,500 to $19,999 | 3 (4.6%) | 5 (5.1%) |
| $20,000 to $22,499 | 6 (9.2%) | 2 (2.0%) |
| $22,500 to $24,999 | 0 (0.0%) | 5 (5.1%) |
| $25,000 to $29,999 | 0 (0.0%) | 0 (0.0%) |
| $30,000 to $34,999 | 0 (0.0%) | 11 (11.1%) |
| $35,000 to $39,999 | 5 (7.7%) | 4 (4.0%) |
| $40,000 to $44,999 | 7 (10.8%) | 8 (8.1%) |
| $45,000 to $49,999 | 0 (0.0%) | 3 (3.0%) |
| $50,000 to $54,999 | 0 (0.0%) | 27 (27.3%) |
| $55,000 to $64,999 | 3 (4.6%) | 3 (3.0%) |
| $65,000 to $74,999 | 8 (12.3%) | 8 (8.1%) |
| $75,000 to $99,999 | 0 (0.0%) | 5 (5.1%) |
| $100,000+ | 16 (24.6%) | 0 (0.0%) |
| Total | 65 (100.0%) | 99 (100.0%) |
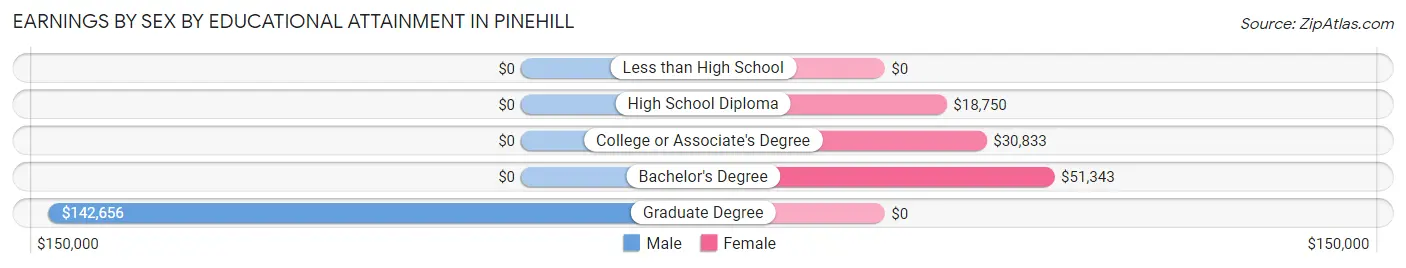
Earnings by Sex by Educational Attainment in Pinehill
Average earnings in Pinehill are $43,036 for men and $44,063 for women, a difference of 2.3%. Men with an educational attainment of graduate degree enjoy the highest average annual earnings of $142,656, while those with graduate degree education earn the least with $142,656. Women with an educational attainment of bachelor's degree earn the most with the average annual earnings of $51,343, while those with high school diploma education have the smallest earnings of $18,750.
| Educational Attainment | Male Income | Female Income |
| Less than High School | - | - |
| High School Diploma | - | - |
| College or Associate's Degree | - | - |
| Bachelor's Degree | - | - |
| Graduate Degree | $142,656 | $0 |
| Total | $43,036 | $44,063 |
Family Income in Pinehill
Family Income Brackets in Pinehill
According to the Pinehill family income data, there are 19 families falling into the $10,000 to $14,999 income range, which is the most common income bracket and makes up 20.6% of all families. Conversely, the $75,000 to $99,999 income bracket is the least frequent group with only 4 families (4.3%) belonging to this category.
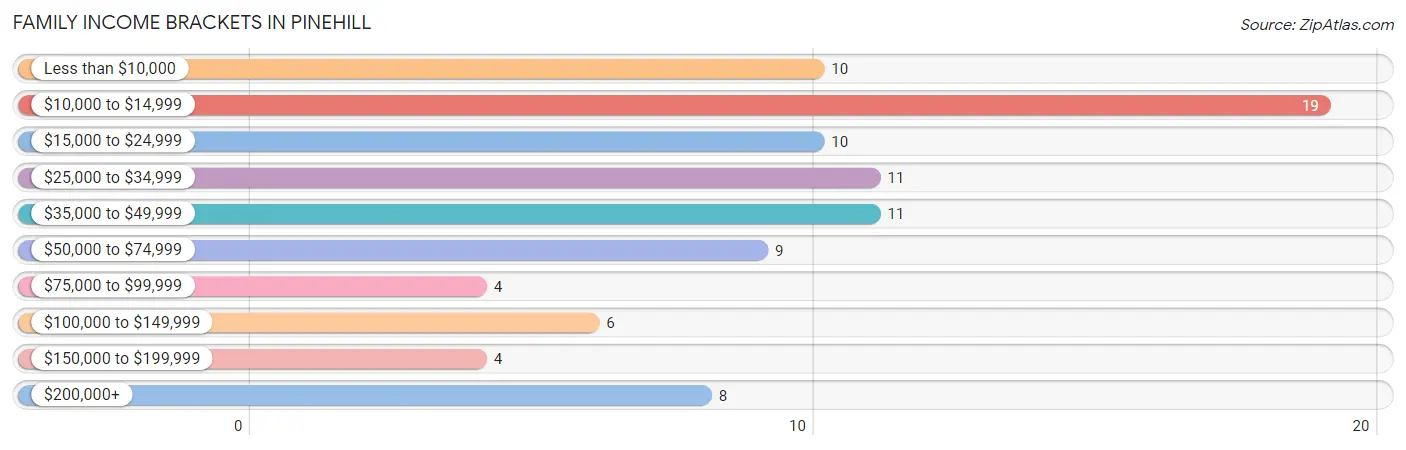
| Income Bracket | # Families | % Families |
| Less than $10,000 | 10 | 10.9% |
| $10,000 to $14,999 | 19 | 20.7% |
| $15,000 to $24,999 | 10 | 10.9% |
| $25,000 to $34,999 | 11 | 12.0% |
| $35,000 to $49,999 | 11 | 12.0% |
| $50,000 to $74,999 | 9 | 9.8% |
| $75,000 to $99,999 | 4 | 4.3% |
| $100,000 to $149,999 | 6 | 6.5% |
| $150,000 to $199,999 | 4 | 4.3% |
| $200,000+ | 8 | 8.7% |
Family Income by Famaliy Size in Pinehill
3-person families (19 | 20.6%) account for the highest median family income in Pinehill with $42,679 per family, while 2-person families (37 | 40.2%) have the highest median income of $20,782 per family member.
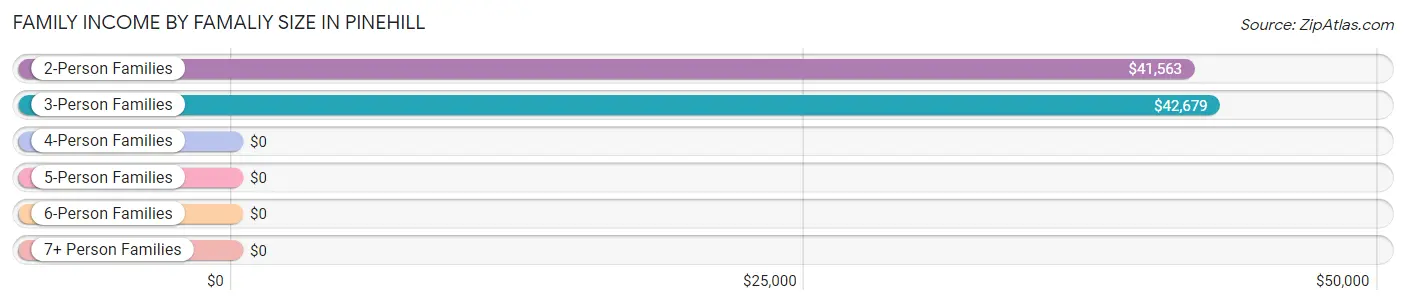
| Income Bracket | # Families | Median Income |
| 2-Person Families | 37 (40.2%) | $41,563 |
| 3-Person Families | 19 (20.6%) | $42,679 |
| 4-Person Families | 18 (19.6%) | $0 |
| 5-Person Families | 9 (9.8%) | $0 |
| 6-Person Families | 9 (9.8%) | $0 |
| 7+ Person Families | 0 (0.0%) | $0 |
| Total | 92 (100.0%) | $27,500 |
Family Income by Number of Earners in Pinehill
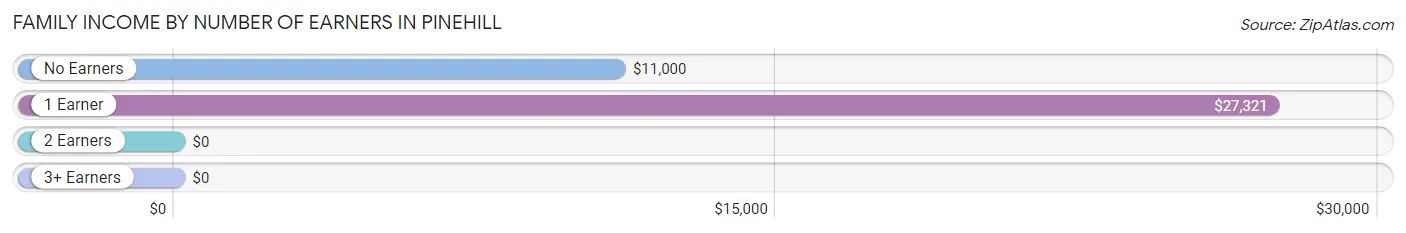
| Number of Earners | # Families | Median Income |
| No Earners | 18 (19.6%) | $11,000 |
| 1 Earner | 41 (44.6%) | $27,321 |
| 2 Earners | 33 (35.9%) | $0 |
| 3+ Earners | 0 (0.0%) | $0 |
| Total | 92 (100.0%) | $27,500 |
Household Income in Pinehill
Household Income Brackets in Pinehill
With 36 households falling in the category, the $50,000 to $74,999 income range is the most frequent in Pinehill, accounting for 24.3% of all households. In contrast, only 4 households (2.7%) fall into the $75,000 to $99,999 income bracket, making it the least populous group.
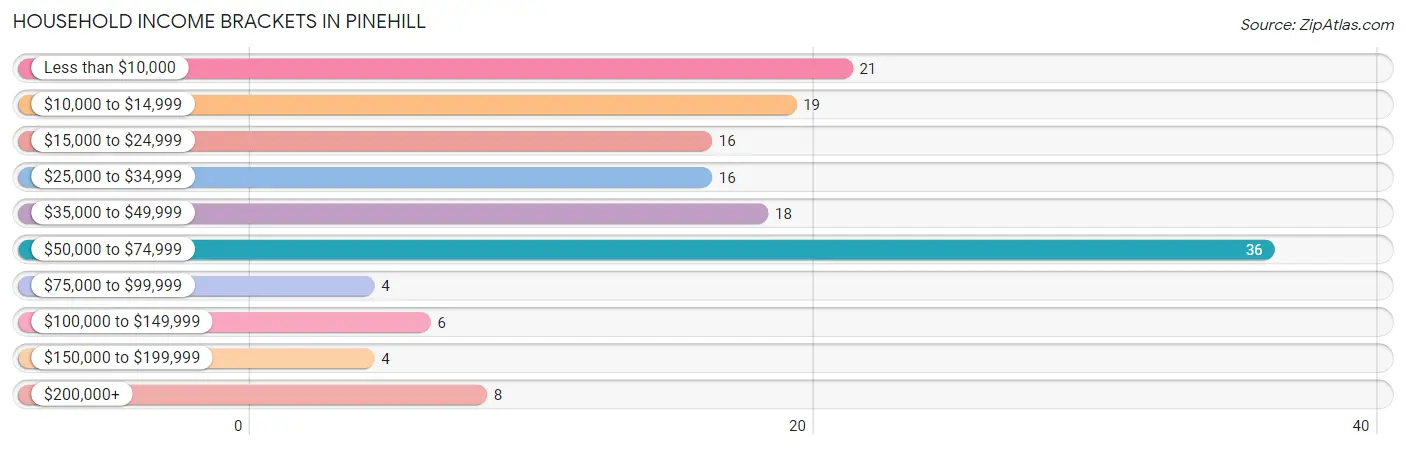
| Income Bracket | # Households | % Households |
| Less than $10,000 | 21 | 14.2% |
| $10,000 to $14,999 | 19 | 12.8% |
| $15,000 to $24,999 | 16 | 10.8% |
| $25,000 to $34,999 | 16 | 10.8% |
| $35,000 to $49,999 | 18 | 12.2% |
| $50,000 to $74,999 | 36 | 24.3% |
| $75,000 to $99,999 | 4 | 2.7% |
| $100,000 to $149,999 | 6 | 4.1% |
| $150,000 to $199,999 | 4 | 2.7% |
| $200,000+ | 8 | 5.4% |
Household Income by Householder Age in Pinehill
The median household income in Pinehill is $41,250, with the highest median household income of $51,065 found in the 25 to 44 years age bracket for the primary householder. A total of 59 households (39.9%) fall into this category.
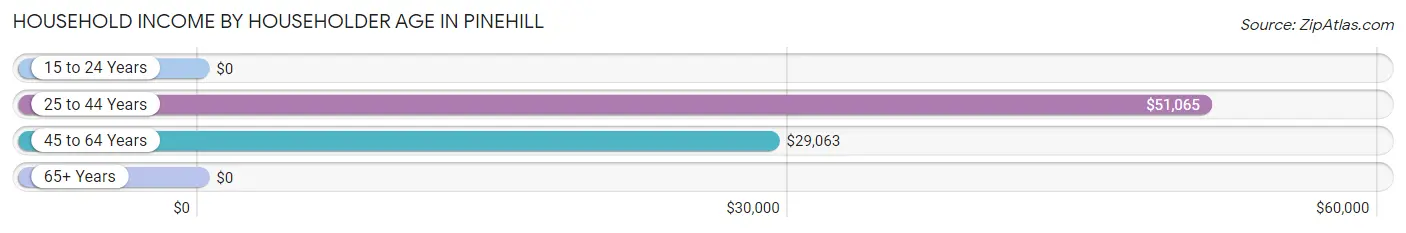
| Income Bracket | # Households | Median Income |
| 15 to 24 Years | 0 (0.0%) | $0 |
| 25 to 44 Years | 59 (39.9%) | $51,065 |
| 45 to 64 Years | 65 (43.9%) | $29,063 |
| 65+ Years | 24 (16.2%) | $0 |
| Total | 148 (100.0%) | $41,250 |
Poverty in Pinehill
Income Below Poverty by Sex and Age in Pinehill
With 51.3% poverty level for males and 43.9% for females among the residents of Pinehill, under 5 year old males and 18 to 24 year old females are the most vulnerable to poverty, with 17 males (100.0%) and 14 females (100.0%) in their respective age groups living below the poverty level.
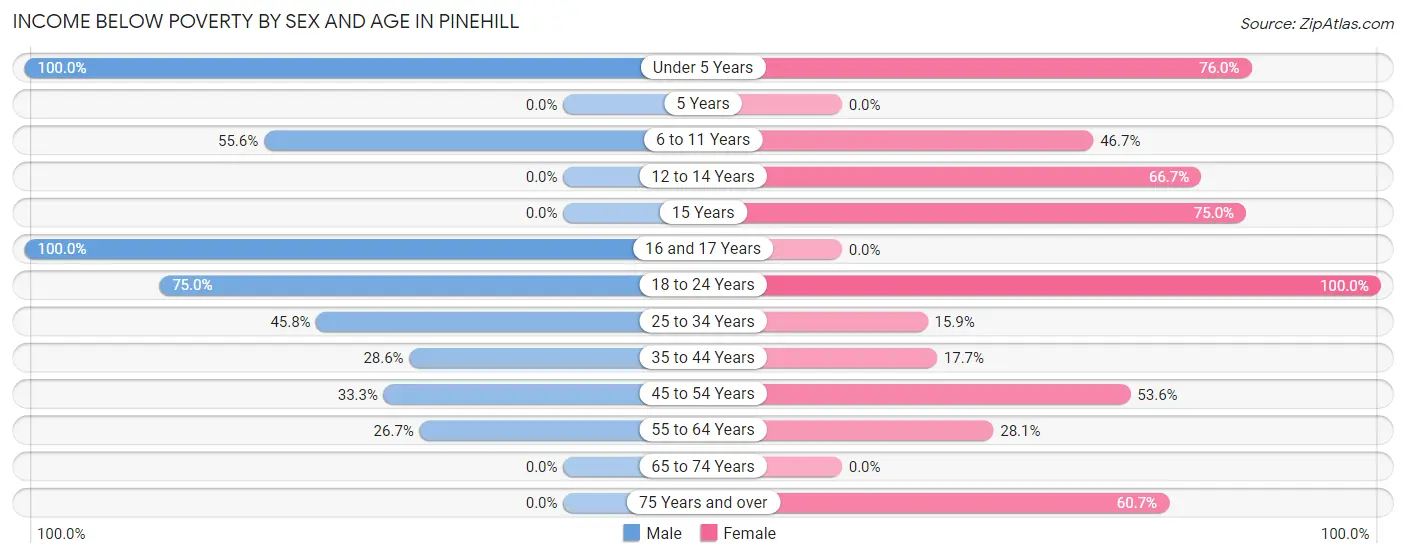
| Age Bracket | Male | Female |
| Under 5 Years | 17 (100.0%) | 19 (76.0%) |
| 5 Years | 0 (0.0%) | 0 (0.0%) |
| 6 to 11 Years | 10 (55.6%) | 7 (46.7%) |
| 12 to 14 Years | 0 (0.0%) | 8 (66.7%) |
| 15 Years | 0 (0.0%) | 6 (75.0%) |
| 16 and 17 Years | 10 (100.0%) | 0 (0.0%) |
| 18 to 24 Years | 12 (75.0%) | 14 (100.0%) |
| 25 to 34 Years | 11 (45.8%) | 7 (15.9%) |
| 35 to 44 Years | 6 (28.6%) | 3 (17.6%) |
| 45 to 54 Years | 8 (33.3%) | 15 (53.6%) |
| 55 to 64 Years | 4 (26.7%) | 9 (28.1%) |
| 65 to 74 Years | 0 (0.0%) | 0 (0.0%) |
| 75 Years and over | 0 (0.0%) | 17 (60.7%) |
| Total | 78 (51.3%) | 105 (43.9%) |
Income Above Poverty by Sex and Age in Pinehill
According to the poverty statistics in Pinehill, males aged 5 years and females aged 5 years are the age groups that are most secure financially, with 100.0% of males and 100.0% of females in these age groups living above the poverty line.
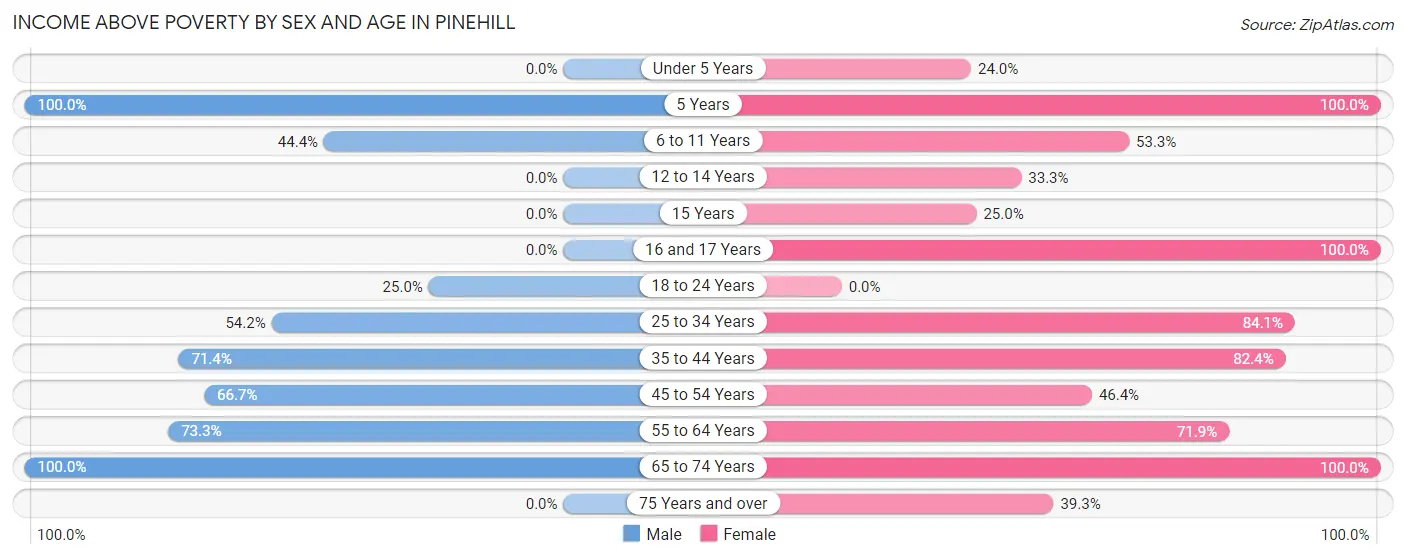
| Age Bracket | Male | Female |
| Under 5 Years | 0 (0.0%) | 6 (24.0%) |
| 5 Years | 4 (100.0%) | 7 (100.0%) |
| 6 to 11 Years | 8 (44.4%) | 8 (53.3%) |
| 12 to 14 Years | 0 (0.0%) | 4 (33.3%) |
| 15 Years | 0 (0.0%) | 2 (25.0%) |
| 16 and 17 Years | 0 (0.0%) | 3 (100.0%) |
| 18 to 24 Years | 4 (25.0%) | 0 (0.0%) |
| 25 to 34 Years | 13 (54.2%) | 37 (84.1%) |
| 35 to 44 Years | 15 (71.4%) | 14 (82.4%) |
| 45 to 54 Years | 16 (66.7%) | 13 (46.4%) |
| 55 to 64 Years | 11 (73.3%) | 23 (71.9%) |
| 65 to 74 Years | 3 (100.0%) | 6 (100.0%) |
| 75 Years and over | 0 (0.0%) | 11 (39.3%) |
| Total | 74 (48.7%) | 134 (56.1%) |
Income Below Poverty Among Married-Couple Families in Pinehill
The poverty statistics for married-couple families in Pinehill show that 24.4% or 10 of the total 41 families live below the poverty line. Families with 1 or 2 children have the highest poverty rate of 41.7%, comprising of 5 families. On the other hand, families with 3 or 4 children have the lowest poverty rate of 0.0%, which includes 0 families.
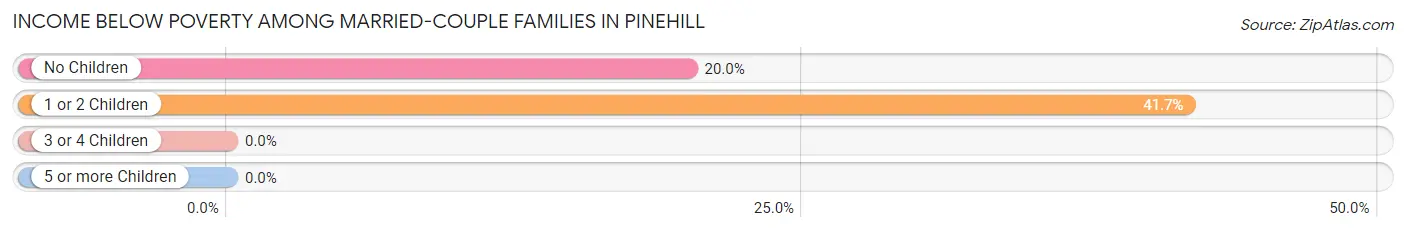
| Children | Above Poverty | Below Poverty |
| No Children | 20 (80.0%) | 5 (20.0%) |
| 1 or 2 Children | 7 (58.3%) | 5 (41.7%) |
| 3 or 4 Children | 4 (100.0%) | 0 (0.0%) |
| 5 or more Children | 0 (0.0%) | 0 (0.0%) |
| Total | 31 (75.6%) | 10 (24.4%) |
Income Below Poverty Among Single-Parent Households in Pinehill
According to the poverty data in Pinehill, 100.0% or 3 single-father households and 50.0% or 24 single-mother households are living below the poverty line. Among single-father households, those with no children have the highest poverty rate, with 3 households (100.0%) experiencing poverty. Likewise, among single-mother households, those with 3 or 4 children have the highest poverty rate, with 9 households (100.0%) falling below the poverty line.
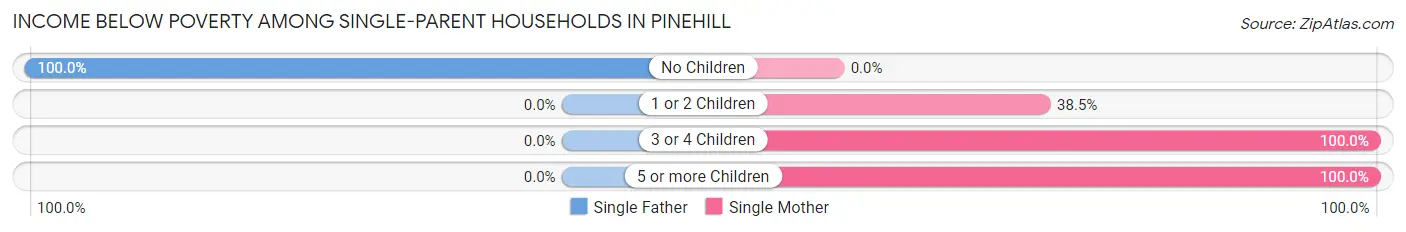
| Children | Single Father | Single Mother |
| No Children | 3 (100.0%) | 0 (0.0%) |
| 1 or 2 Children | 0 (0.0%) | 10 (38.5%) |
| 3 or 4 Children | 0 (0.0%) | 9 (100.0%) |
| 5 or more Children | 0 (0.0%) | 5 (100.0%) |
| Total | 3 (100.0%) | 24 (50.0%) |
Income Below Poverty Among Married-Couple vs Single-Parent Households in Pinehill
The poverty data for Pinehill shows that 10 of the married-couple family households (24.4%) and 27 of the single-parent households (52.9%) are living below the poverty level. Within the married-couple family households, those with 1 or 2 children have the highest poverty rate, with 5 households (41.7%) falling below the poverty line. Among the single-parent households, those with 3 or 4 children have the highest poverty rate, with 9 household (100.0%) living below poverty.
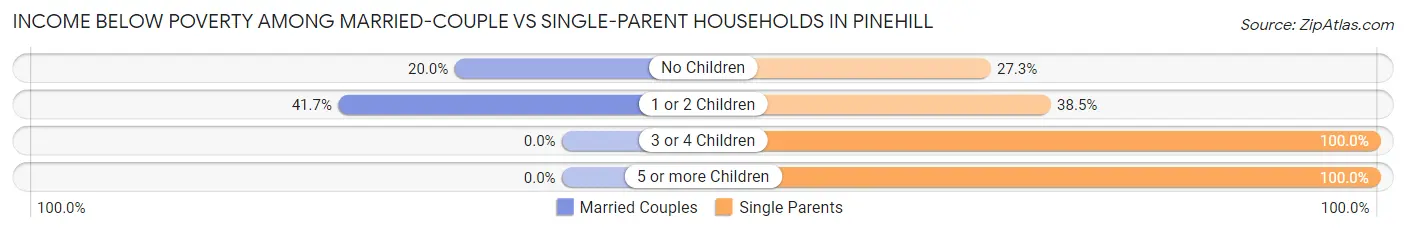
| Children | Married-Couple Families | Single-Parent Households |
| No Children | 5 (20.0%) | 3 (27.3%) |
| 1 or 2 Children | 5 (41.7%) | 10 (38.5%) |
| 3 or 4 Children | 0 (0.0%) | 9 (100.0%) |
| 5 or more Children | 0 (0.0%) | 5 (100.0%) |
| Total | 10 (24.4%) | 27 (52.9%) |
Race in Pinehill
The most populous races in Pinehill are Native / Alaskan (374 | 95.7%), Asian (13 | 3.3%), and White / Caucasian (4 | 1.0%).
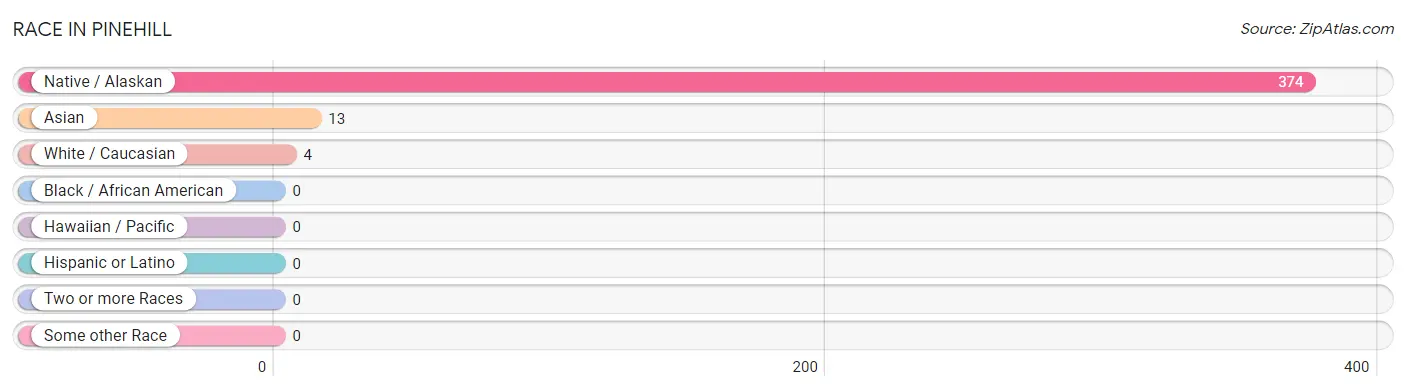
| Race | # Population | % Population |
| Asian | 13 | 3.3% |
| Black / African American | 0 | 0.0% |
| Hawaiian / Pacific | 0 | 0.0% |
| Hispanic or Latino | 0 | 0.0% |
| Native / Alaskan | 374 | 95.7% |
| White / Caucasian | 4 | 1.0% |
| Two or more Races | 0 | 0.0% |
| Some other Race | 0 | 0.0% |
| Total | 391 | 100.0% |
Ancestry in Pinehill
The most populous ancestries reported in Pinehill are Navajo (374 | 95.7%), Apache (19 | 4.9%), Korean (8 | 2.1%), Bhutanese (5 | 1.3%), and German (4 | 1.0%), together accounting for 104.9% of all Pinehill residents.
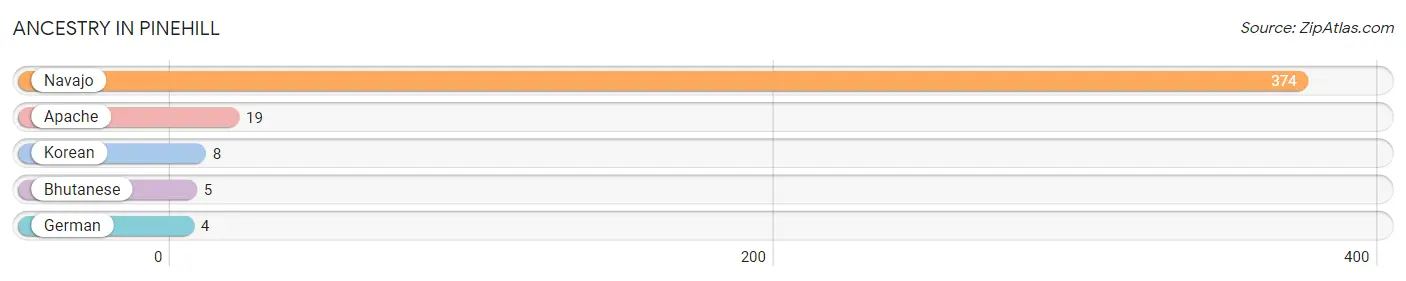
| Ancestry | # Population | % Population |
| Apache | 19 | 4.9% |
| Bhutanese | 5 | 1.3% |
| German | 4 | 1.0% |
| Korean | 8 | 2.1% |
| Navajo | 374 | 95.7% | View All 5 Rows |
Immigrants in Pinehill
The most numerous immigrant groups reported in Pinehill came from Asia (13 | 3.3%), Philippines (8 | 2.1%), South Eastern Asia (8 | 2.1%), Eastern Asia (5 | 1.3%), and Japan (5 | 1.3%), together accounting for 10.0% of all Pinehill residents.
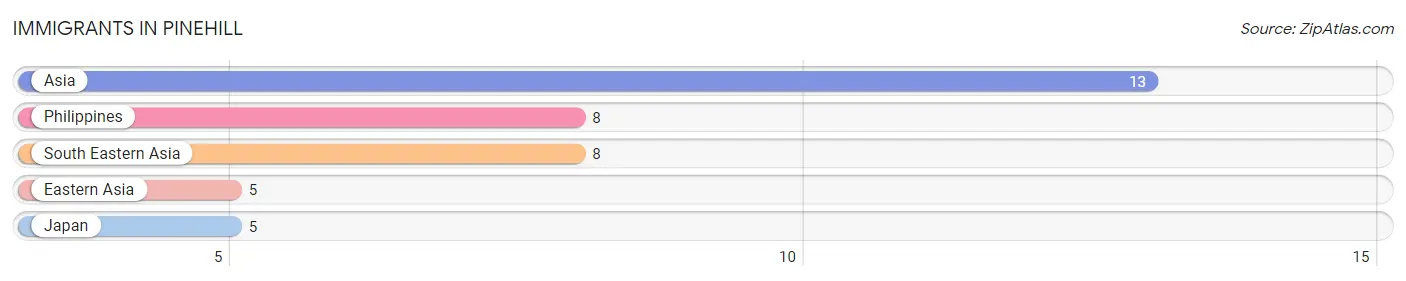
| Immigration Origin | # Population | % Population |
| Asia | 13 | 3.3% |
| Eastern Asia | 5 | 1.3% |
| Japan | 5 | 1.3% |
| Philippines | 8 | 2.1% |
| South Eastern Asia | 8 | 2.1% | View All 5 Rows |
Sex and Age in Pinehill
Sex and Age in Pinehill
The most populous age groups in Pinehill are 15 to 19 Years (26 | 17.1%) for men and 25 to 29 Years (39 | 16.3%) for women.
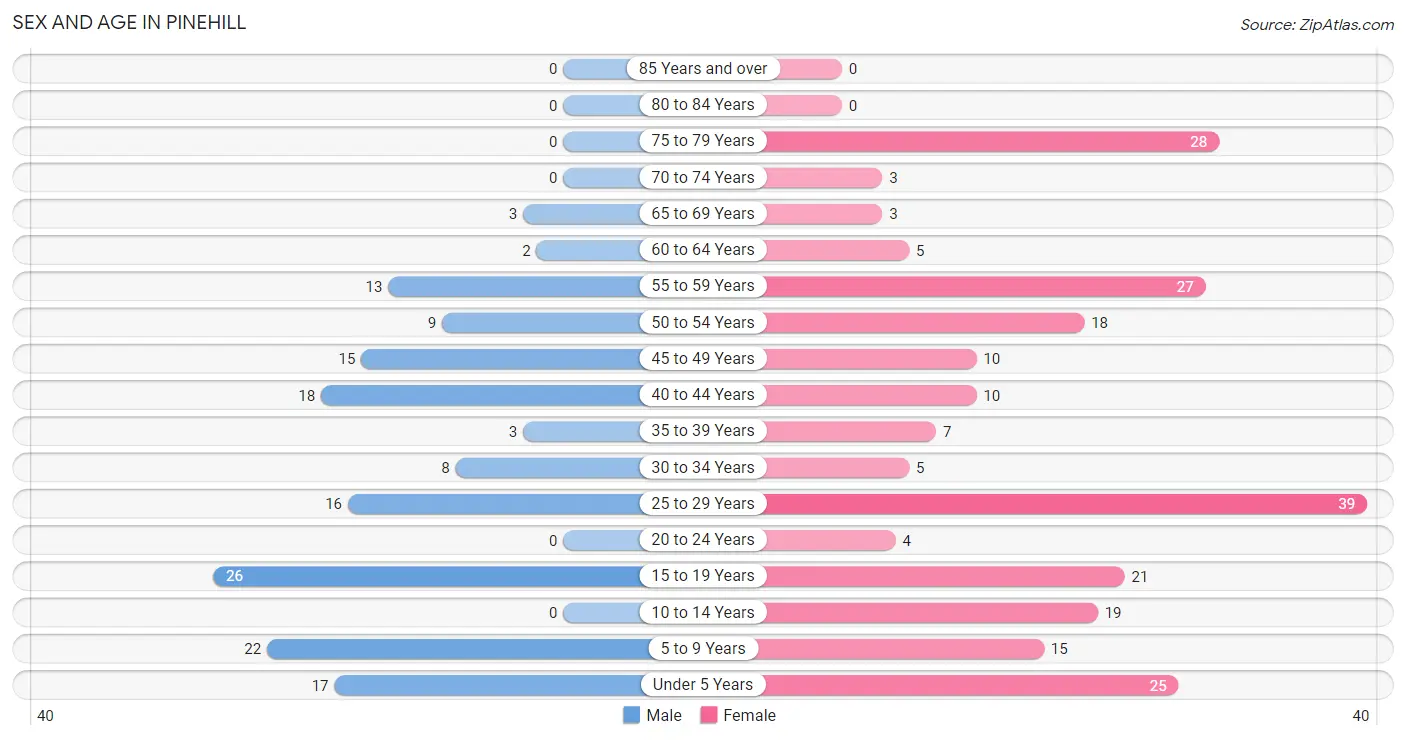
| Age Bracket | Male | Female |
| Under 5 Years | 17 (11.2%) | 25 (10.5%) |
| 5 to 9 Years | 22 (14.5%) | 15 (6.3%) |
| 10 to 14 Years | 0 (0.0%) | 19 (8.0%) |
| 15 to 19 Years | 26 (17.1%) | 21 (8.8%) |
| 20 to 24 Years | 0 (0.0%) | 4 (1.7%) |
| 25 to 29 Years | 16 (10.5%) | 39 (16.3%) |
| 30 to 34 Years | 8 (5.3%) | 5 (2.1%) |
| 35 to 39 Years | 3 (2.0%) | 7 (2.9%) |
| 40 to 44 Years | 18 (11.8%) | 10 (4.2%) |
| 45 to 49 Years | 15 (9.9%) | 10 (4.2%) |
| 50 to 54 Years | 9 (5.9%) | 18 (7.5%) |
| 55 to 59 Years | 13 (8.6%) | 27 (11.3%) |
| 60 to 64 Years | 2 (1.3%) | 5 (2.1%) |
| 65 to 69 Years | 3 (2.0%) | 3 (1.3%) |
| 70 to 74 Years | 0 (0.0%) | 3 (1.3%) |
| 75 to 79 Years | 0 (0.0%) | 28 (11.7%) |
| 80 to 84 Years | 0 (0.0%) | 0 (0.0%) |
| 85 Years and over | 0 (0.0%) | 0 (0.0%) |
| Total | 152 (100.0%) | 239 (100.0%) |
Families and Households in Pinehill
Median Family Size in Pinehill
The median family size in Pinehill is 3.57 persons per family, with single male/father families (3 | 3.3%) accounting for the largest median family size of 4.33 persons per family. On the other hand, married-couple families (41 | 44.6%) represent the smallest median family size with 2.83 persons per family.
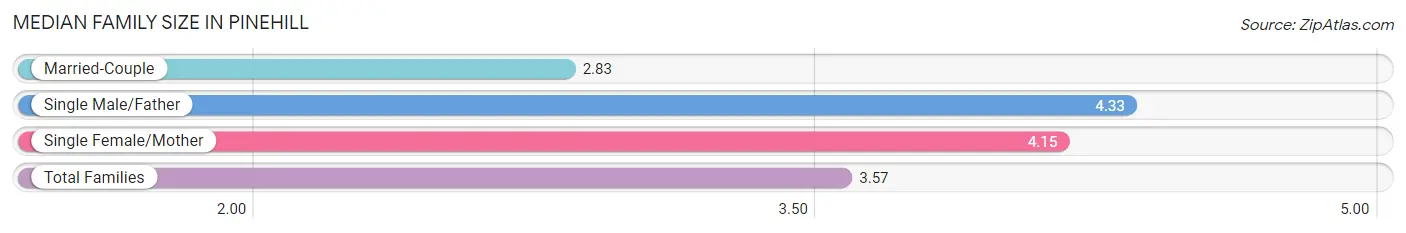
| Family Type | # Families | Family Size |
| Married-Couple | 41 (44.6%) | 2.83 |
| Single Male/Father | 3 (3.3%) | 4.33 |
| Single Female/Mother | 48 (52.2%) | 4.15 |
| Total Families | 92 (100.0%) | 3.57 |
Median Household Size in Pinehill
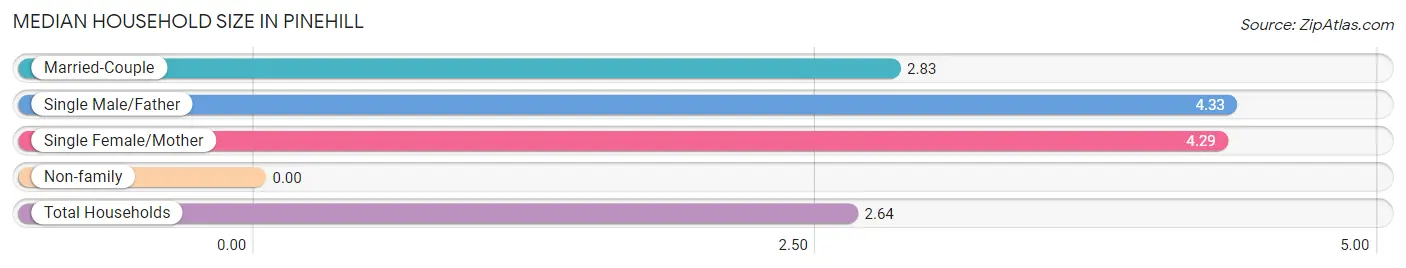
| Household Type | # Households | Household Size |
| Married-Couple | 41 (27.7%) | 2.83 |
| Single Male/Father | 3 (2.0%) | 4.33 |
| Single Female/Mother | 48 (32.4%) | 4.29 |
| Non-family | 56 (37.8%) | - |
| Total Households | 148 (100.0%) | 2.64 |
Household Size by Marriage Status in Pinehill
Out of a total of 148 households in Pinehill, 92 (62.2%) are family households, while 56 (37.8%) are nonfamily households. The most numerous type of family households are 2-person households, comprising 31, and the most common type of nonfamily households are 1-person households, comprising 56.
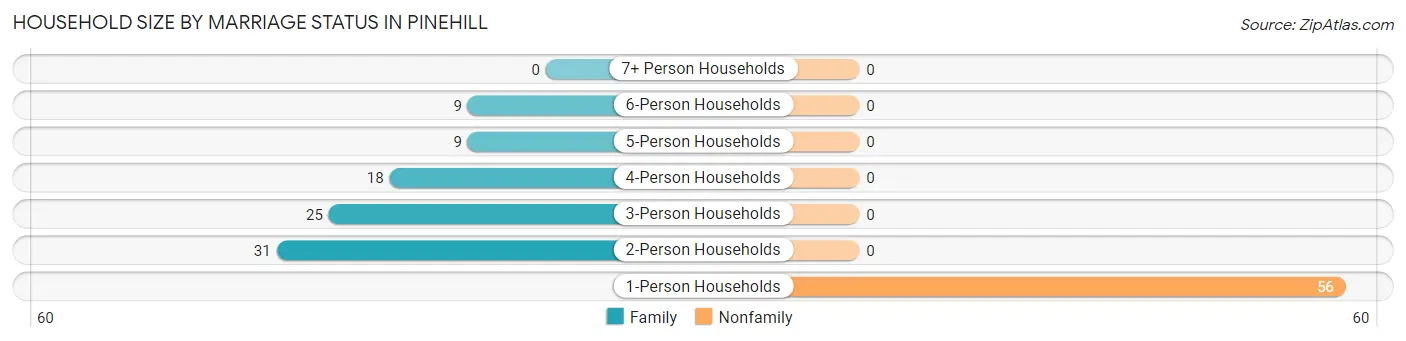
| Household Size | Family Households | Nonfamily Households |
| 1-Person Households | - | 56 (37.8%) |
| 2-Person Households | 31 (20.9%) | 0 (0.0%) |
| 3-Person Households | 25 (16.9%) | 0 (0.0%) |
| 4-Person Households | 18 (12.2%) | 0 (0.0%) |
| 5-Person Households | 9 (6.1%) | 0 (0.0%) |
| 6-Person Households | 9 (6.1%) | 0 (0.0%) |
| 7+ Person Households | 0 (0.0%) | 0 (0.0%) |
| Total | 92 (62.2%) | 56 (37.8%) |
Female Fertility in Pinehill
Fertility by Age in Pinehill
Average fertility rate in Pinehill is 20.0 births per 1,000 women. Women in the age bracket of 20 to 34 years have the highest fertility rate with 42.0 births per 1,000 women. Women in the age bracket of 20 to 34 years acount for 100.0% of all women with births.
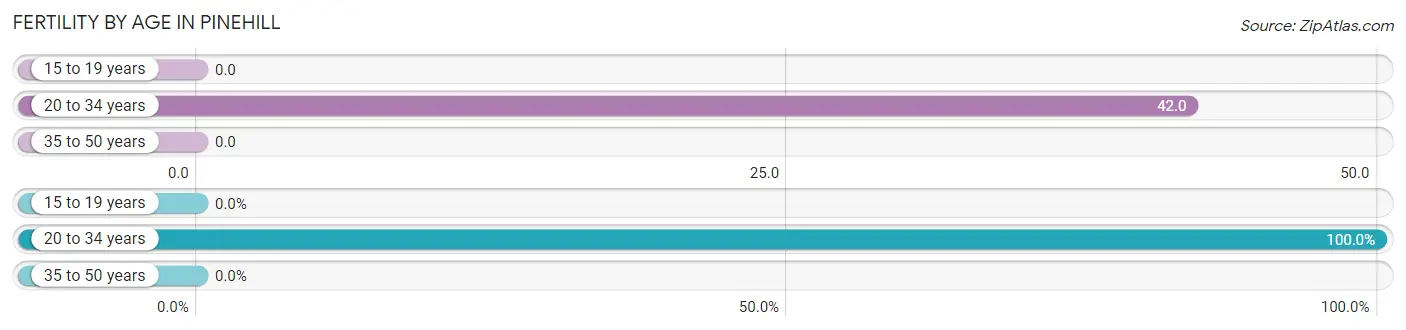
| Age Bracket | Women with Births | Births / 1,000 Women |
| 15 to 19 years | 0 (0.0%) | 0.0 |
| 20 to 34 years | 2 (100.0%) | 42.0 |
| 35 to 50 years | 0 (0.0%) | 0.0 |
| Total | 2 (100.0%) | 20.0 |
Fertility by Age by Marriage Status in Pinehill
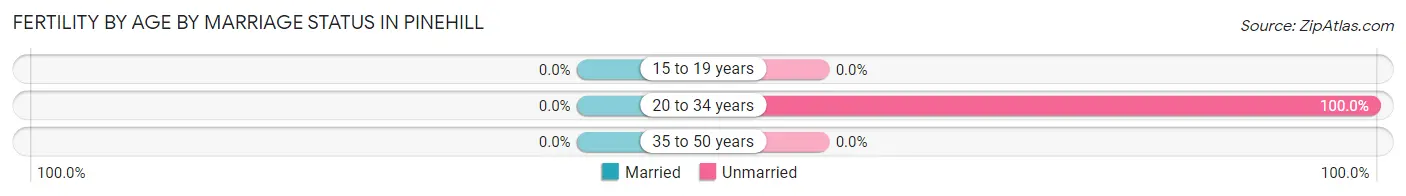
| Age Bracket | Married | Unmarried |
| 15 to 19 years | 0 (0.0%) | 0 (0.0%) |
| 20 to 34 years | 0 (0.0%) | 2 (100.0%) |
| 35 to 50 years | 0 (0.0%) | 0 (0.0%) |
| Total | 0 (0.0%) | 2 (100.0%) |
Fertility by Education in Pinehill
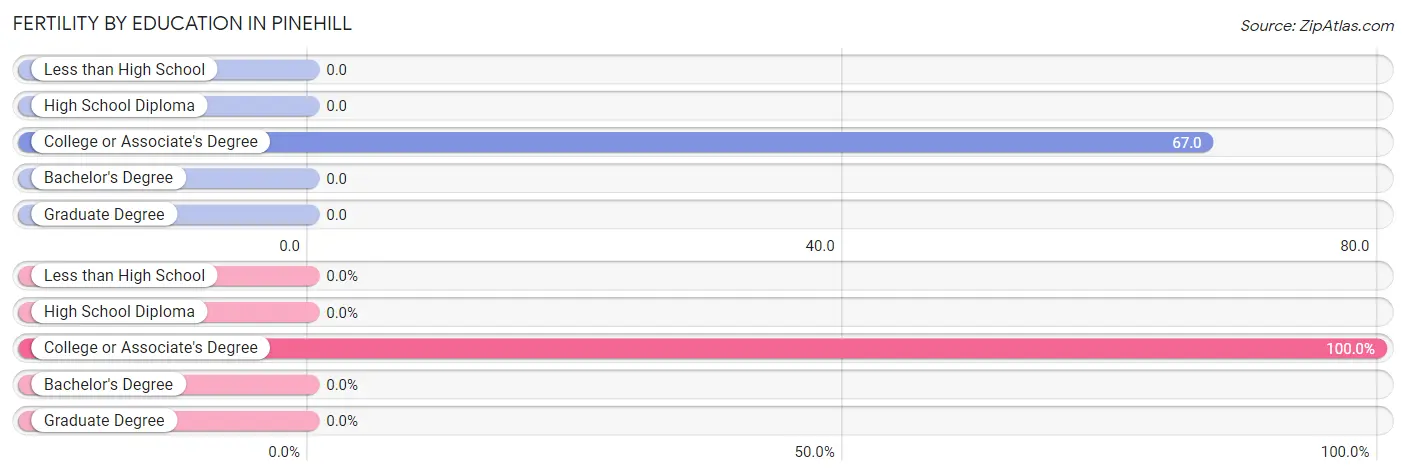
| Educational Attainment | Women with Births | Births / 1,000 Women |
| Less than High School | 0 (0.0%) | 0.0 |
| High School Diploma | 0 (0.0%) | 0.0 |
| College or Associate's Degree | 2 (100.0%) | 67.0 |
| Bachelor's Degree | 0 (0.0%) | 0.0 |
| Graduate Degree | 0 (0.0%) | 0.0 |
| Total | 2 (100.0%) | 20.0 |
Fertility by Education by Marriage Status in Pinehill
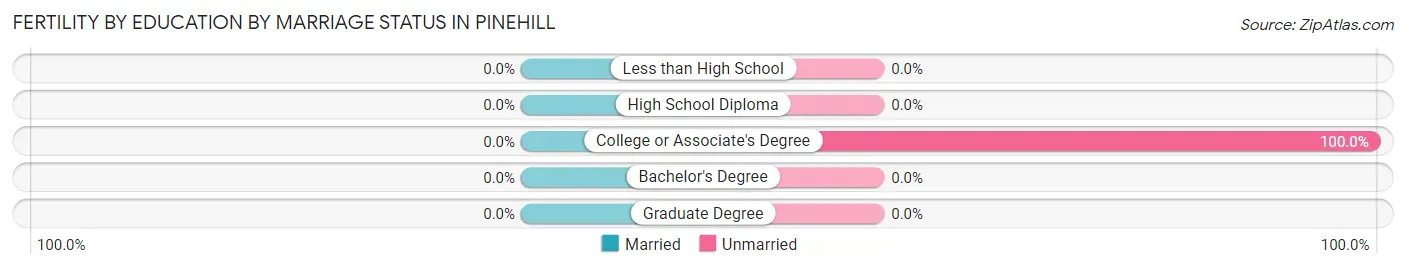
| Educational Attainment | Married | Unmarried |
| Less than High School | 0 (0.0%) | 0 (0.0%) |
| High School Diploma | 0 (0.0%) | 0 (0.0%) |
| College or Associate's Degree | 0 (0.0%) | 2 (100.0%) |
| Bachelor's Degree | 0 (0.0%) | 0 (0.0%) |
| Graduate Degree | 0 (0.0%) | 0 (0.0%) |
| Total | 0 (0.0%) | 2 (100.0%) |
Employment Characteristics in Pinehill
Employment by Class of Employer in Pinehill
Among the 120 employed individuals in Pinehill, local government employees (56 | 46.7%), federal government employees (28 | 23.3%), and state government employees (13 | 10.8%) make up the most common classes of employment.
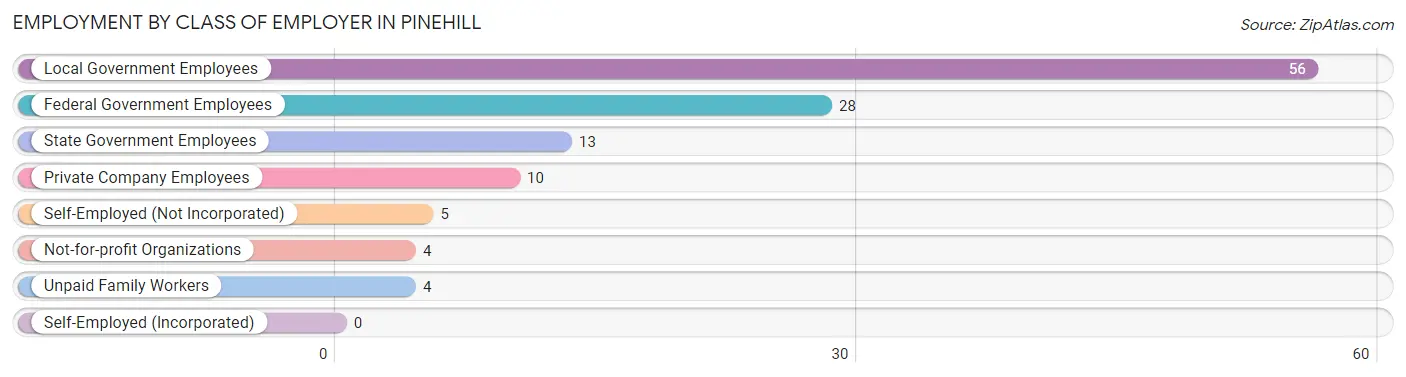
| Employer Class | # Employees | % Employees |
| Private Company Employees | 10 | 8.3% |
| Self-Employed (Incorporated) | 0 | 0.0% |
| Self-Employed (Not Incorporated) | 5 | 4.2% |
| Not-for-profit Organizations | 4 | 3.3% |
| Local Government Employees | 56 | 46.7% |
| State Government Employees | 13 | 10.8% |
| Federal Government Employees | 28 | 23.3% |
| Unpaid Family Workers | 4 | 3.3% |
| Total | 120 | 100.0% |
Employment Status by Age in Pinehill
According to the labor force statistics for Pinehill, out of the total population over 16 years of age (285), 51.6% or 147 individuals are in the labor force, with 16.3% or 24 of them unemployed. The age group with the highest labor force participation rate is 20 to 24 years, with 100.0% or 4 individuals in the labor force. Within the labor force, the 65 to 74 years age range has the highest percentage of unemployed individuals, with 50.0% or 3 of them being unemployed.
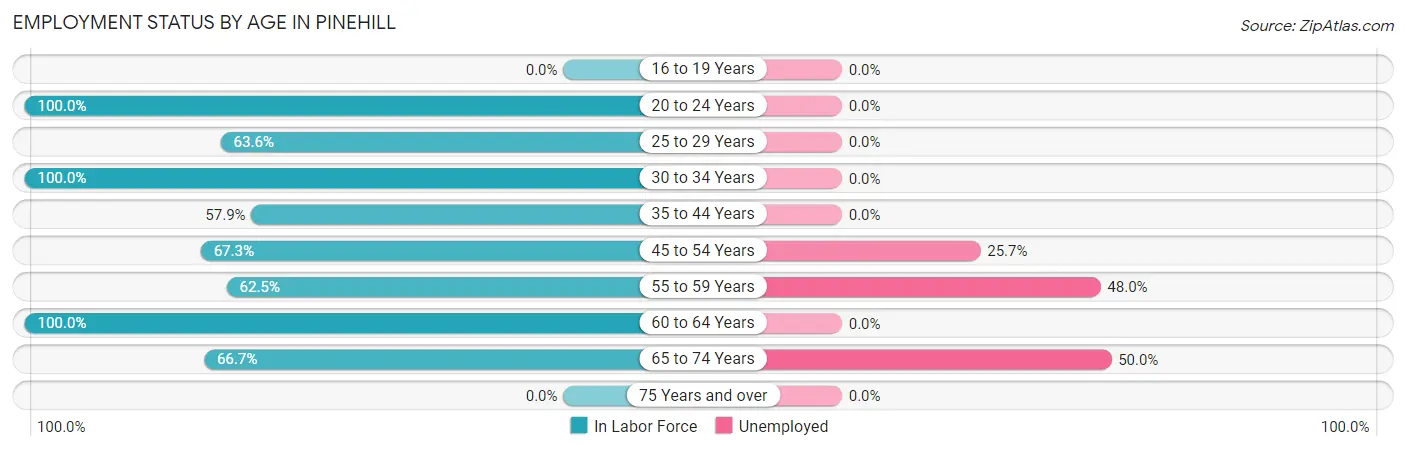
| Age Bracket | In Labor Force | Unemployed |
| 16 to 19 Years | 0 (0.0%) | 0 (0.0%) |
| 20 to 24 Years | 4 (100.0%) | 0 (0.0%) |
| 25 to 29 Years | 35 (63.6%) | 0 (0.0%) |
| 30 to 34 Years | 13 (100.0%) | 0 (0.0%) |
| 35 to 44 Years | 22 (57.9%) | 0 (0.0%) |
| 45 to 54 Years | 35 (67.3%) | 9 (25.7%) |
| 55 to 59 Years | 25 (62.5%) | 12 (48.0%) |
| 60 to 64 Years | 7 (100.0%) | 0 (0.0%) |
| 65 to 74 Years | 6 (66.7%) | 3 (50.0%) |
| 75 Years and over | 0 (0.0%) | 0 (0.0%) |
| Total | 147 (51.6%) | 24 (16.3%) |
Employment Status by Educational Attainment in Pinehill
According to labor force statistics for Pinehill, 66.8% of individuals (137) out of the total population between 25 and 64 years of age (205) are in the labor force, with 15.3% or 21 of them being unemployed. The group with the highest labor force participation rate are those with the educational attainment of bachelor's degree or higher, with 96.9% or 62 individuals in the labor force. Within the labor force, individuals with less than high school education have the highest percentage of unemployment, with 70.0% or 14 of them being unemployed.
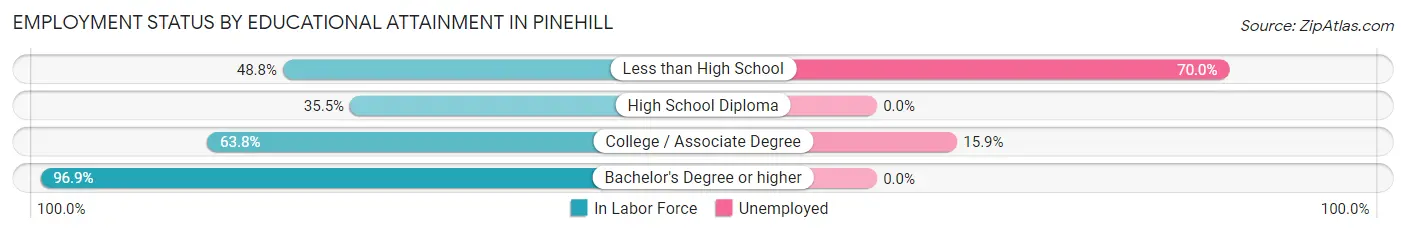
| Educational Attainment | In Labor Force | Unemployed |
| Less than High School | 20 (48.8%) | 29 (70.0%) |
| High School Diploma | 11 (35.5%) | 0 (0.0%) |
| College / Associate Degree | 44 (63.8%) | 11 (15.9%) |
| Bachelor's Degree or higher | 62 (96.9%) | 0 (0.0%) |
| Total | 137 (66.8%) | 31 (15.3%) |
Employment Occupations by Sex in Pinehill
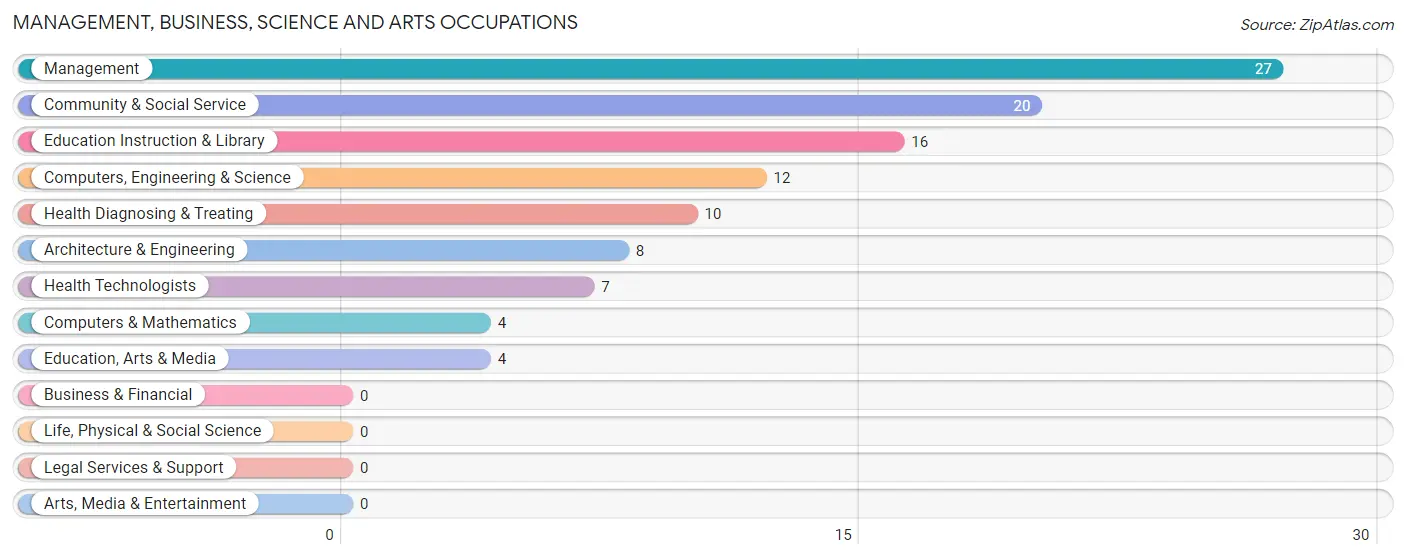
Management, Business, Science and Arts Occupations
The most common Management, Business, Science and Arts occupations in Pinehill are Management (27 | 22.0%), Community & Social Service (20 | 16.3%), Education Instruction & Library (16 | 13.0%), Computers, Engineering & Science (12 | 9.8%), and Health Diagnosing & Treating (10 | 8.1%).
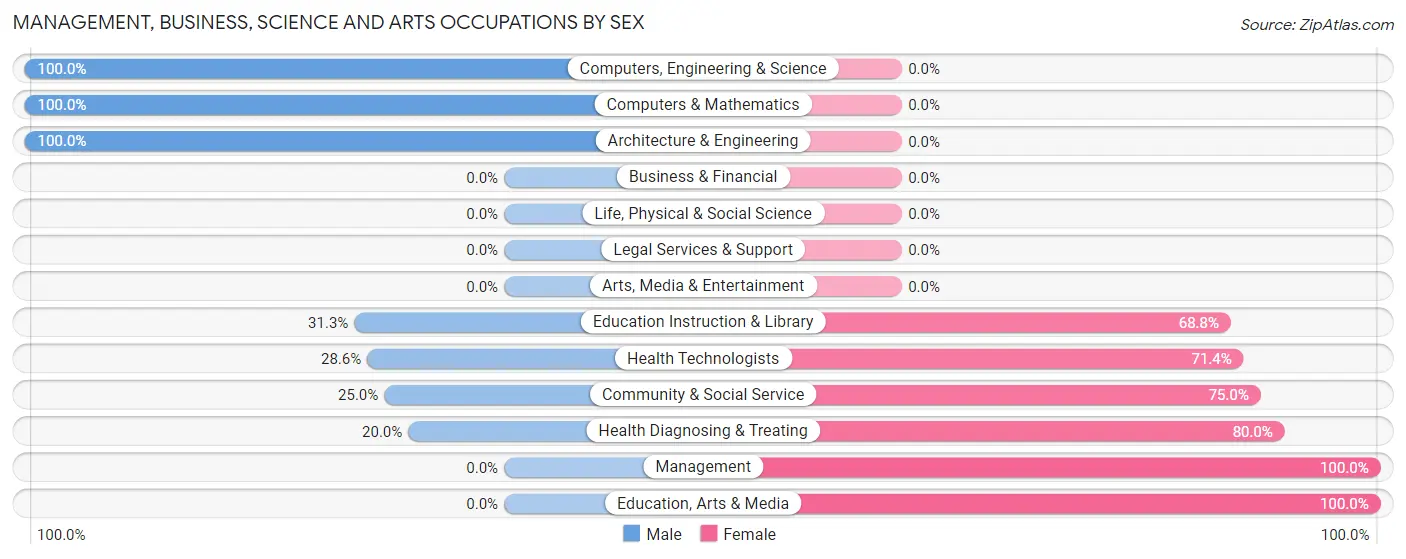
Management, Business, Science and Arts Occupations by Sex
Within the Management, Business, Science and Arts occupations in Pinehill, the most male-oriented occupations are Computers, Engineering & Science (100.0%), Computers & Mathematics (100.0%), and Architecture & Engineering (100.0%), while the most female-oriented occupations are Management (100.0%), Education, Arts & Media (100.0%), and Health Diagnosing & Treating (80.0%).
| Occupation | Male | Female |
| Management | 0 (0.0%) | 27 (100.0%) |
| Business & Financial | 0 (0.0%) | 0 (0.0%) |
| Computers, Engineering & Science | 12 (100.0%) | 0 (0.0%) |
| Computers & Mathematics | 4 (100.0%) | 0 (0.0%) |
| Architecture & Engineering | 8 (100.0%) | 0 (0.0%) |
| Life, Physical & Social Science | 0 (0.0%) | 0 (0.0%) |
| Community & Social Service | 5 (25.0%) | 15 (75.0%) |
| Education, Arts & Media | 0 (0.0%) | 4 (100.0%) |
| Legal Services & Support | 0 (0.0%) | 0 (0.0%) |
| Education Instruction & Library | 5 (31.2%) | 11 (68.8%) |
| Arts, Media & Entertainment | 0 (0.0%) | 0 (0.0%) |
| Health Diagnosing & Treating | 2 (20.0%) | 8 (80.0%) |
| Health Technologists | 2 (28.6%) | 5 (71.4%) |
| Total (Category) | 19 (27.5%) | 50 (72.5%) |
| Total (Overall) | 38 (30.9%) | 85 (69.1%) |
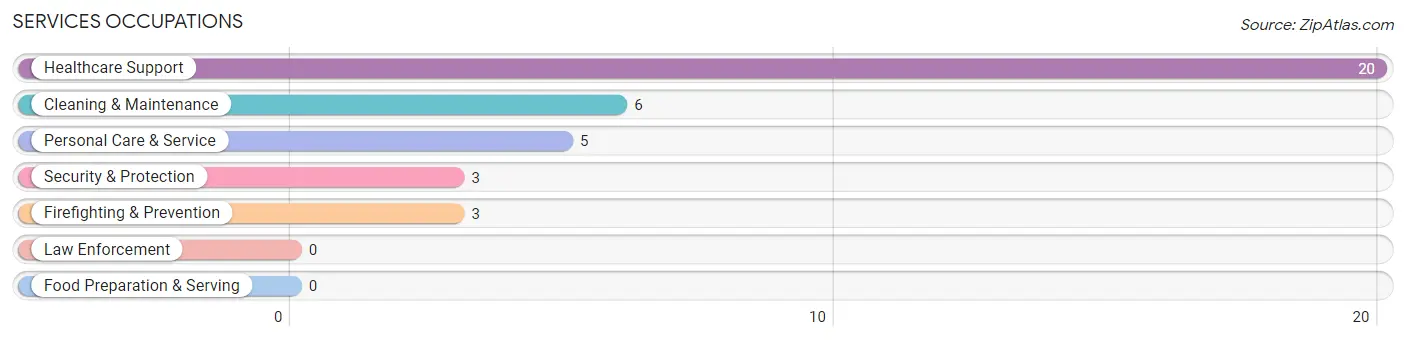
Services Occupations
The most common Services occupations in Pinehill are Healthcare Support (20 | 16.3%), Cleaning & Maintenance (6 | 4.9%), Personal Care & Service (5 | 4.1%), Security & Protection (3 | 2.4%), and Firefighting & Prevention (3 | 2.4%).
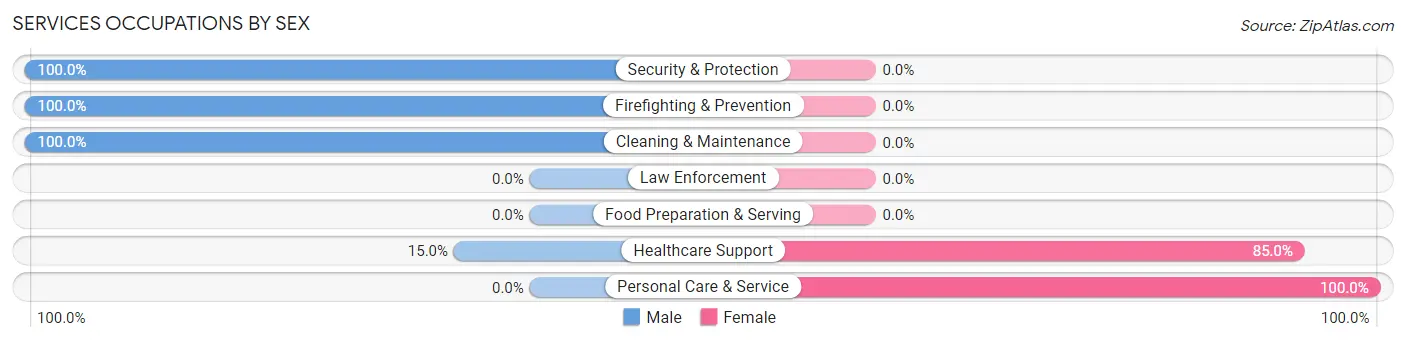
Services Occupations by Sex
Within the Services occupations in Pinehill, the most male-oriented occupations are Security & Protection (100.0%), Firefighting & Prevention (100.0%), and Cleaning & Maintenance (100.0%), while the most female-oriented occupations are Personal Care & Service (100.0%), and Healthcare Support (85.0%).
| Occupation | Male | Female |
| Healthcare Support | 3 (15.0%) | 17 (85.0%) |
| Security & Protection | 3 (100.0%) | 0 (0.0%) |
| Firefighting & Prevention | 3 (100.0%) | 0 (0.0%) |
| Law Enforcement | 0 (0.0%) | 0 (0.0%) |
| Food Preparation & Serving | 0 (0.0%) | 0 (0.0%) |
| Cleaning & Maintenance | 6 (100.0%) | 0 (0.0%) |
| Personal Care & Service | 0 (0.0%) | 5 (100.0%) |
| Total (Category) | 12 (35.3%) | 22 (64.7%) |
| Total (Overall) | 38 (30.9%) | 85 (69.1%) |
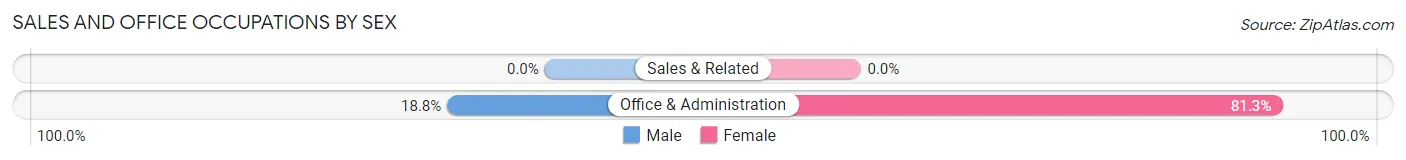
Sales and Office Occupations
The most common Sales and Office occupations in Pinehill are , and Office & Administration (16 | 13.0%).

Sales and Office Occupations by Sex
| Occupation | Male | Female |
| Sales & Related | 0 (0.0%) | 0 (0.0%) |
| Office & Administration | 3 (18.8%) | 13 (81.2%) |
| Total (Category) | 3 (18.8%) | 13 (81.2%) |
| Total (Overall) | 38 (30.9%) | 85 (69.1%) |
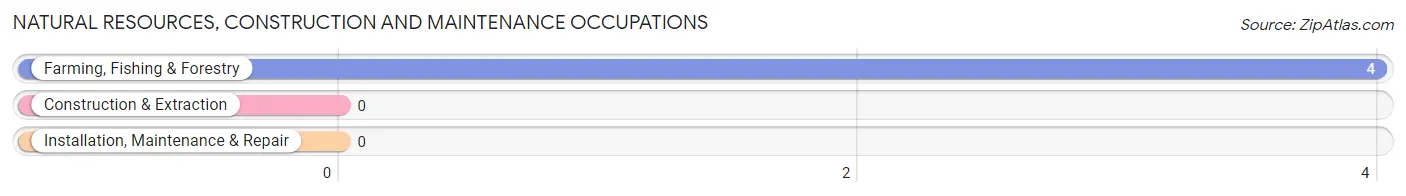
Natural Resources, Construction and Maintenance Occupations
The most common Natural Resources, Construction and Maintenance occupations in Pinehill are , and Farming, Fishing & Forestry (4 | 3.3%).
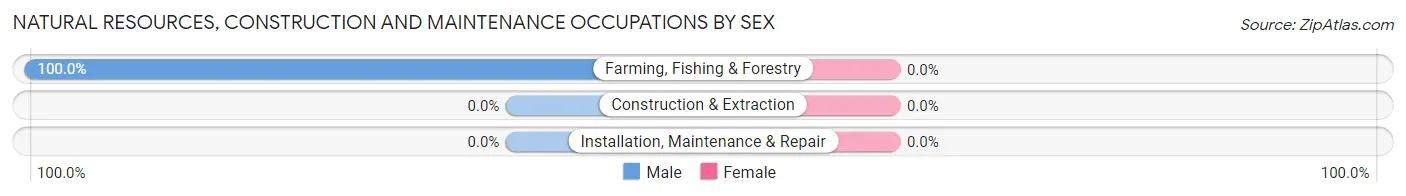
Natural Resources, Construction and Maintenance Occupations by Sex
| Occupation | Male | Female |
| Farming, Fishing & Forestry | 4 (100.0%) | 0 (0.0%) |
| Construction & Extraction | 0 (0.0%) | 0 (0.0%) |
| Installation, Maintenance & Repair | 0 (0.0%) | 0 (0.0%) |
| Total (Category) | 4 (100.0%) | 0 (0.0%) |
| Total (Overall) | 38 (30.9%) | 85 (69.1%) |
Production, Transportation and Moving Occupations
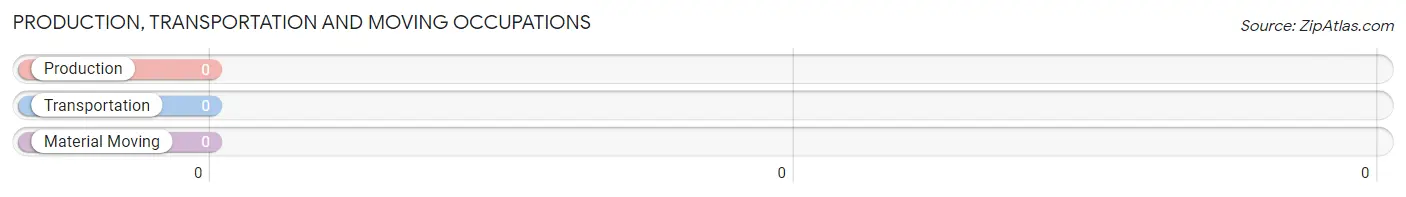
Production, Transportation and Moving Occupations by Sex
| Occupation | Male | Female |
| Production | 0 (0.0%) | 0 (0.0%) |
| Transportation | 0 (0.0%) | 0 (0.0%) |
| Material Moving | 0 (0.0%) | 0 (0.0%) |
| Total (Category) | 0 (0.0%) | 0 (0.0%) |
| Total (Overall) | 38 (30.9%) | 85 (69.1%) |
Employment Industries by Sex in Pinehill
Employment Industries in Pinehill
The major employment industries in Pinehill include Health Care & Social Assistance (48 | 39.0%), Educational Services (39 | 31.7%), Public Administration (15 | 12.2%), Professional & Scientific (8 | 6.5%), and Agriculture, Fishing & Hunting (4 | 3.3%).
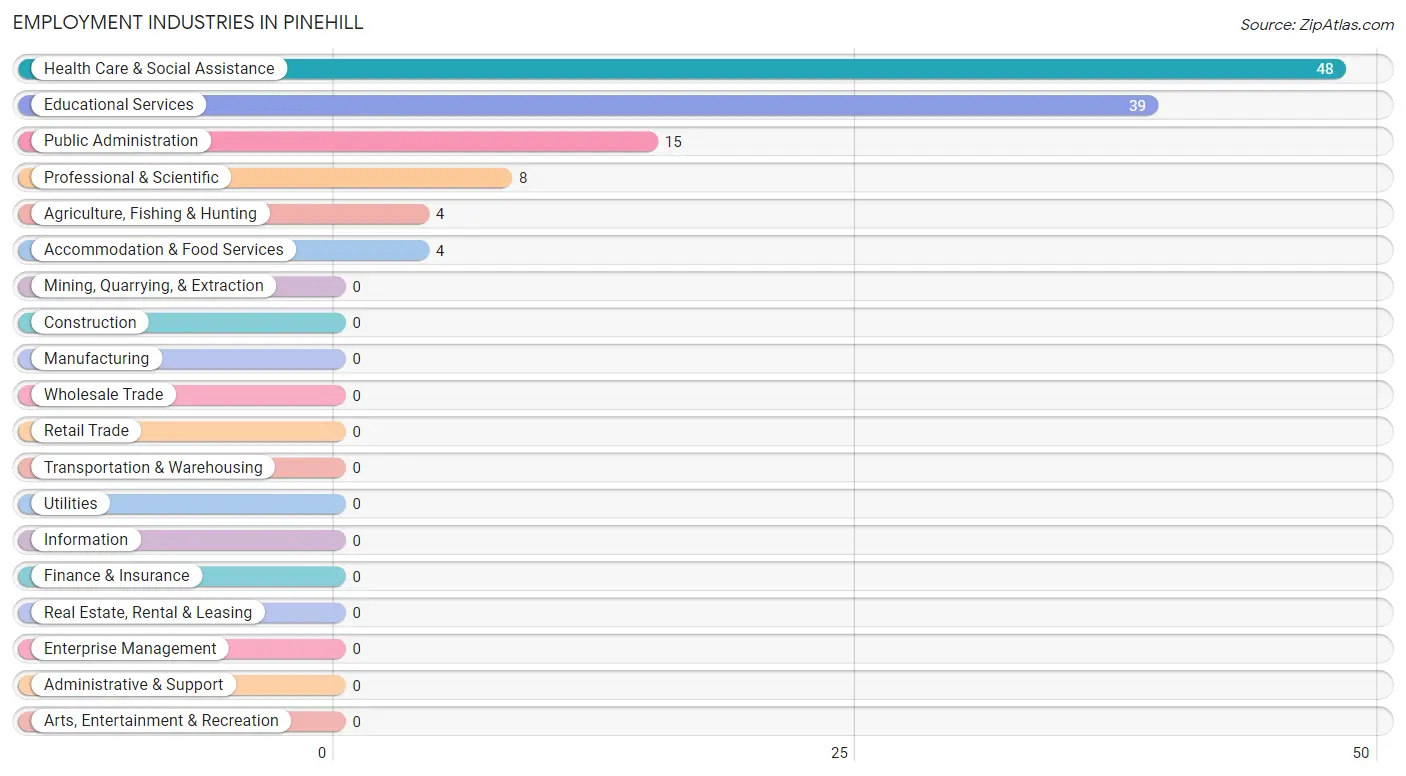
Employment Industries by Sex in Pinehill
The Pinehill industries that see more men than women are Agriculture, Fishing & Hunting (100.0%), Professional & Scientific (100.0%), and Educational Services (46.2%), whereas the industries that tend to have a higher number of women are Accommodation & Food Services (100.0%), Health Care & Social Assistance (89.6%), and Public Administration (80.0%).

| Industry | Male | Female |
| Agriculture, Fishing & Hunting | 4 (100.0%) | 0 (0.0%) |
| Mining, Quarrying, & Extraction | 0 (0.0%) | 0 (0.0%) |
| Construction | 0 (0.0%) | 0 (0.0%) |
| Manufacturing | 0 (0.0%) | 0 (0.0%) |
| Wholesale Trade | 0 (0.0%) | 0 (0.0%) |
| Retail Trade | 0 (0.0%) | 0 (0.0%) |
| Transportation & Warehousing | 0 (0.0%) | 0 (0.0%) |
| Utilities | 0 (0.0%) | 0 (0.0%) |
| Information | 0 (0.0%) | 0 (0.0%) |
| Finance & Insurance | 0 (0.0%) | 0 (0.0%) |
| Real Estate, Rental & Leasing | 0 (0.0%) | 0 (0.0%) |
| Professional & Scientific | 8 (100.0%) | 0 (0.0%) |
| Enterprise Management | 0 (0.0%) | 0 (0.0%) |
| Administrative & Support | 0 (0.0%) | 0 (0.0%) |
| Educational Services | 18 (46.2%) | 21 (53.8%) |
| Health Care & Social Assistance | 5 (10.4%) | 43 (89.6%) |
| Arts, Entertainment & Recreation | 0 (0.0%) | 0 (0.0%) |
| Accommodation & Food Services | 0 (0.0%) | 4 (100.0%) |
| Public Administration | 3 (20.0%) | 12 (80.0%) |
| Total | 38 (30.9%) | 85 (69.1%) |
Education in Pinehill
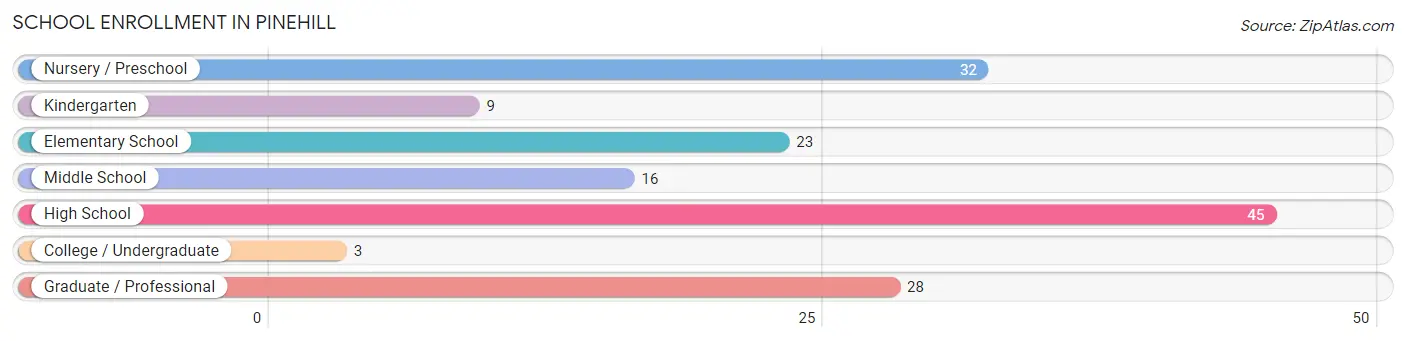
School Enrollment in Pinehill
The most common levels of schooling among the 156 students in Pinehill are high school (45 | 28.8%), nursery / preschool (32 | 20.5%), and graduate / professional (28 | 17.9%).
| School Level | # Students | % Students |
| Nursery / Preschool | 32 | 20.5% |
| Kindergarten | 9 | 5.8% |
| Elementary School | 23 | 14.7% |
| Middle School | 16 | 10.3% |
| High School | 45 | 28.8% |
| College / Undergraduate | 3 | 1.9% |
| Graduate / Professional | 28 | 17.9% |
| Total | 156 | 100.0% |
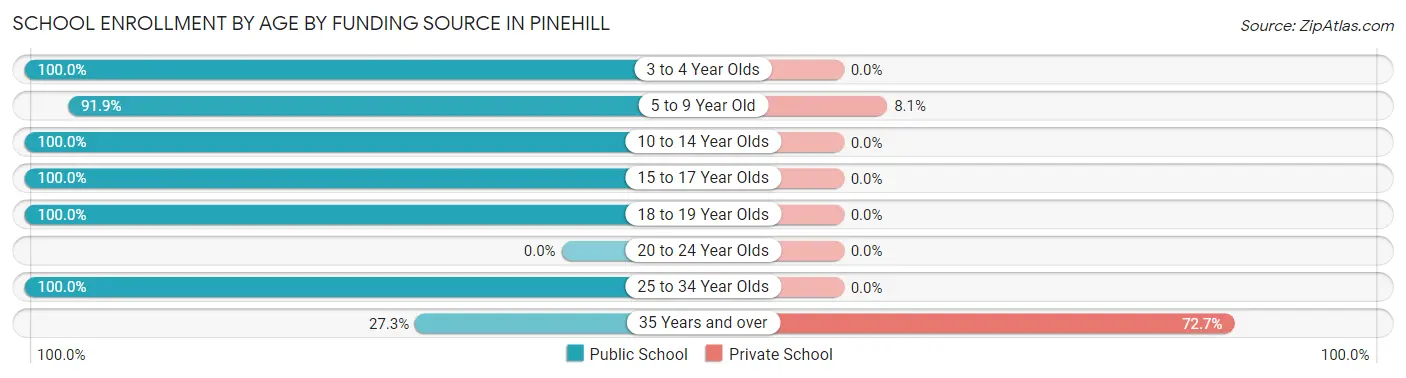
School Enrollment by Age by Funding Source in Pinehill
Out of a total of 156 students who are enrolled in schools in Pinehill, 11 (7.1%) attend a private institution, while the remaining 145 (92.9%) are enrolled in public schools. The age group of 35 years and over has the highest likelihood of being enrolled in private schools, with 8 (72.7% in the age bracket) enrolled. Conversely, the age group of 3 to 4 year olds has the lowest likelihood of being enrolled in a private school, with 24 (100.0% in the age bracket) attending a public institution.
| Age Bracket | Public School | Private School |
| 3 to 4 Year Olds | 24 (100.0%) | 0 (0.0%) |
| 5 to 9 Year Old | 34 (91.9%) | 3 (8.1%) |
| 10 to 14 Year Olds | 19 (100.0%) | 0 (0.0%) |
| 15 to 17 Year Olds | 21 (100.0%) | 0 (0.0%) |
| 18 to 19 Year Olds | 21 (100.0%) | 0 (0.0%) |
| 20 to 24 Year Olds | 0 (0.0%) | 0 (0.0%) |
| 25 to 34 Year Olds | 23 (100.0%) | 0 (0.0%) |
| 35 Years and over | 3 (27.3%) | 8 (72.7%) |
| Total | 145 (92.9%) | 11 (7.1%) |
Educational Attainment by Field of Study in Pinehill
Psychology (28 | 41.2%), education (12 | 17.6%), literature & languages (8 | 11.8%), business (6 | 8.8%), and science & technology (4 | 5.9%) are the most common fields of study among 68 individuals in Pinehill who have obtained a bachelor's degree or higher.
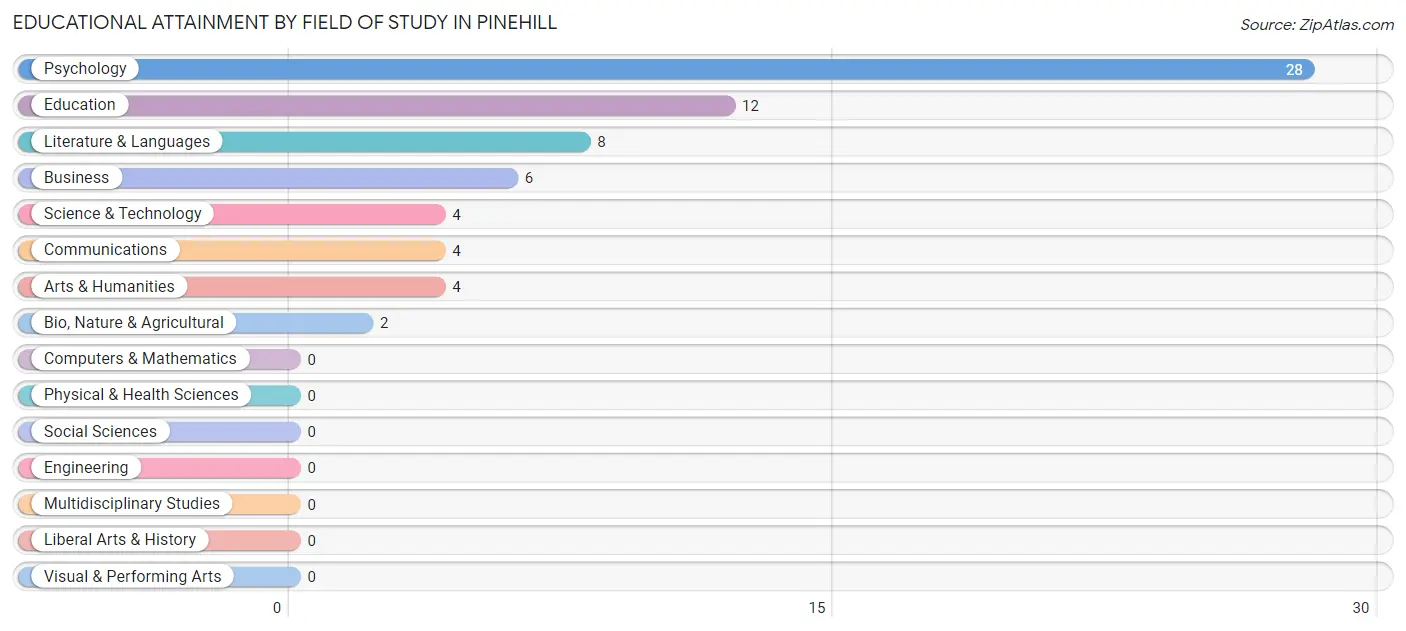
| Field of Study | # Graduates | % Graduates |
| Computers & Mathematics | 0 | 0.0% |
| Bio, Nature & Agricultural | 2 | 2.9% |
| Physical & Health Sciences | 0 | 0.0% |
| Psychology | 28 | 41.2% |
| Social Sciences | 0 | 0.0% |
| Engineering | 0 | 0.0% |
| Multidisciplinary Studies | 0 | 0.0% |
| Science & Technology | 4 | 5.9% |
| Business | 6 | 8.8% |
| Education | 12 | 17.6% |
| Literature & Languages | 8 | 11.8% |
| Liberal Arts & History | 0 | 0.0% |
| Visual & Performing Arts | 0 | 0.0% |
| Communications | 4 | 5.9% |
| Arts & Humanities | 4 | 5.9% |
| Total | 68 | 100.0% |
Transportation & Commute in Pinehill
Vehicle Availability by Sex in Pinehill
The most prevalent vehicle ownership categories in Pinehill are males with 2 vehicles (23, accounting for 60.5%) and females with 2 vehicles (31, making up 28.1%).
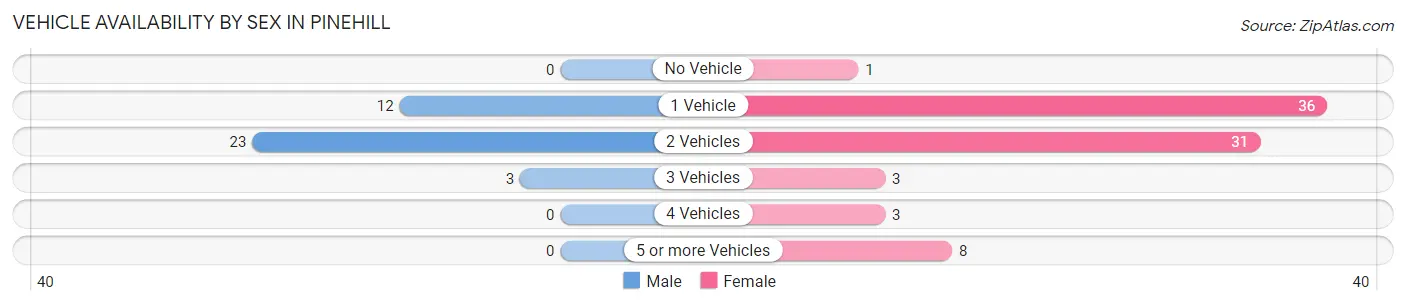
| Vehicles Available | Male | Female |
| No Vehicle | 0 (0.0%) | 1 (1.2%) |
| 1 Vehicle | 12 (31.6%) | 36 (43.9%) |
| 2 Vehicles | 23 (60.5%) | 31 (37.8%) |
| 3 Vehicles | 3 (7.9%) | 3 (3.7%) |
| 4 Vehicles | 0 (0.0%) | 3 (3.7%) |
| 5 or more Vehicles | 0 (0.0%) | 8 (9.8%) |
| Total | 38 (100.0%) | 82 (100.0%) |
Commute Time in Pinehill
The most frequently occuring commute durations in Pinehill are 15 to 19 minutes (39 commuters, 34.5%), 5 to 9 minutes (35 commuters, 31.0%), and 10 to 14 minutes (25 commuters, 22.1%).
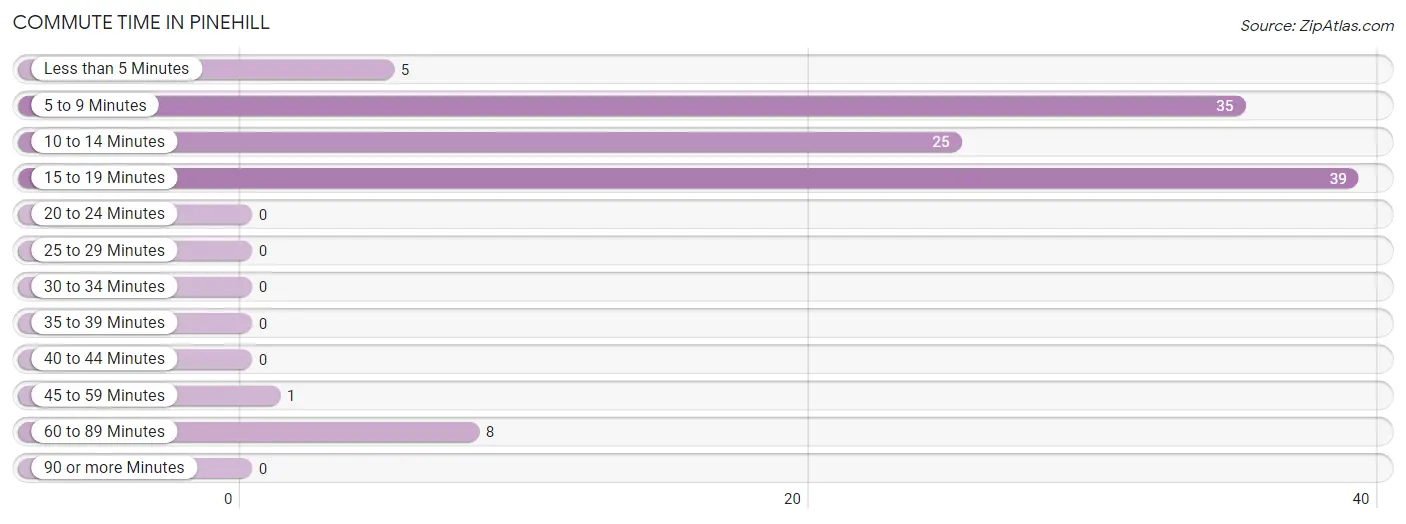
| Commute Time | # Commuters | % Commuters |
| Less than 5 Minutes | 5 | 4.4% |
| 5 to 9 Minutes | 35 | 31.0% |
| 10 to 14 Minutes | 25 | 22.1% |
| 15 to 19 Minutes | 39 | 34.5% |
| 20 to 24 Minutes | 0 | 0.0% |
| 25 to 29 Minutes | 0 | 0.0% |
| 30 to 34 Minutes | 0 | 0.0% |
| 35 to 39 Minutes | 0 | 0.0% |
| 40 to 44 Minutes | 0 | 0.0% |
| 45 to 59 Minutes | 1 | 0.9% |
| 60 to 89 Minutes | 8 | 7.1% |
| 90 or more Minutes | 0 | 0.0% |
Commute Time by Sex in Pinehill
The most common commute times in Pinehill are 10 to 14 minutes (13 commuters, 41.9%) for males and 15 to 19 minutes (39 commuters, 47.6%) for females.
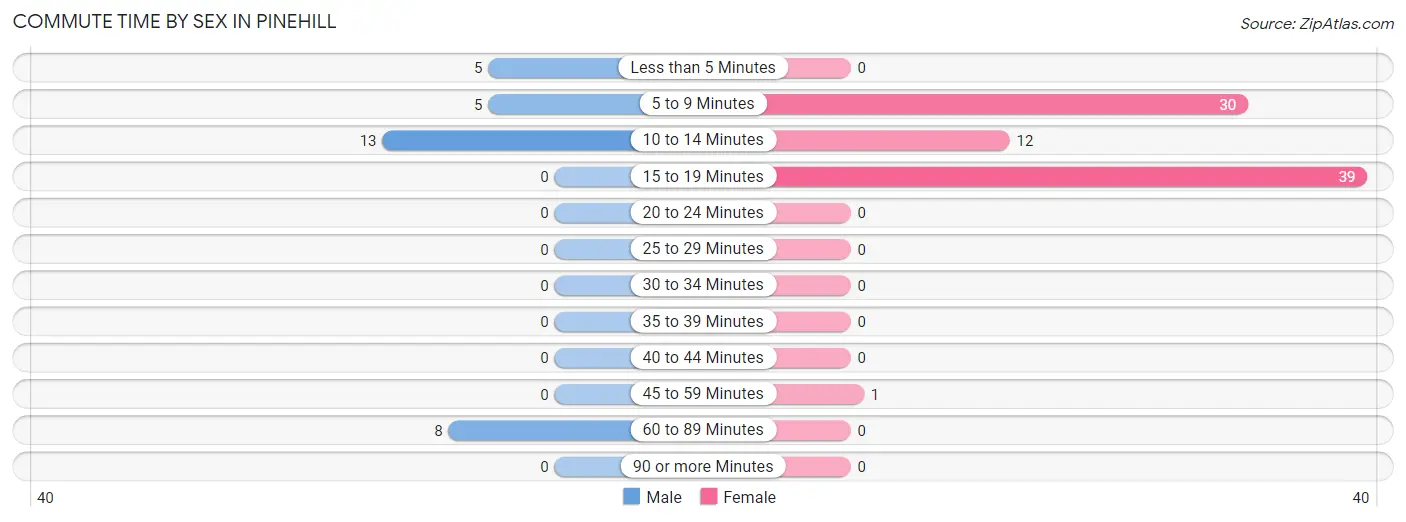
| Commute Time | Male | Female |
| Less than 5 Minutes | 5 (16.1%) | 0 (0.0%) |
| 5 to 9 Minutes | 5 (16.1%) | 30 (36.6%) |
| 10 to 14 Minutes | 13 (41.9%) | 12 (14.6%) |
| 15 to 19 Minutes | 0 (0.0%) | 39 (47.6%) |
| 20 to 24 Minutes | 0 (0.0%) | 0 (0.0%) |
| 25 to 29 Minutes | 0 (0.0%) | 0 (0.0%) |
| 30 to 34 Minutes | 0 (0.0%) | 0 (0.0%) |
| 35 to 39 Minutes | 0 (0.0%) | 0 (0.0%) |
| 40 to 44 Minutes | 0 (0.0%) | 0 (0.0%) |
| 45 to 59 Minutes | 0 (0.0%) | 1 (1.2%) |
| 60 to 89 Minutes | 8 (25.8%) | 0 (0.0%) |
| 90 or more Minutes | 0 (0.0%) | 0 (0.0%) |
Time of Departure to Work by Sex in Pinehill
The most frequent times of departure to work in Pinehill are 7:30 AM to 7:59 AM (16, 51.6%) for males and 7:30 AM to 7:59 AM (38, 46.3%) for females.
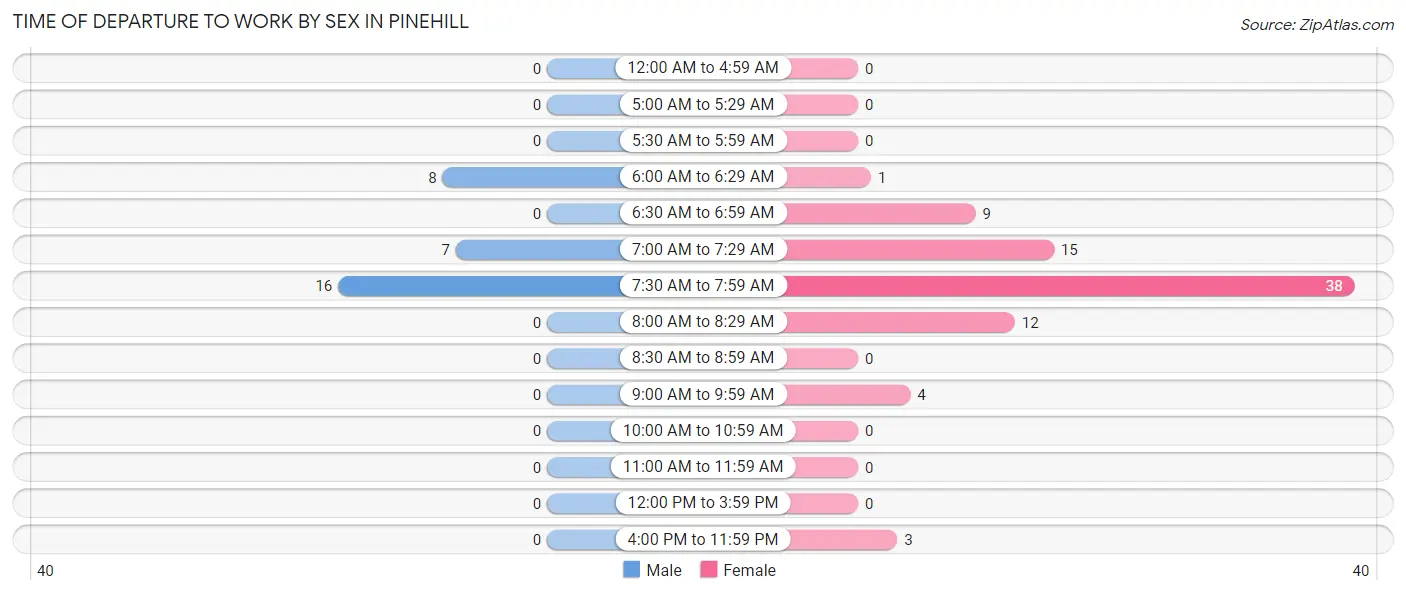
| Time of Departure | Male | Female |
| 12:00 AM to 4:59 AM | 0 (0.0%) | 0 (0.0%) |
| 5:00 AM to 5:29 AM | 0 (0.0%) | 0 (0.0%) |
| 5:30 AM to 5:59 AM | 0 (0.0%) | 0 (0.0%) |
| 6:00 AM to 6:29 AM | 8 (25.8%) | 1 (1.2%) |
| 6:30 AM to 6:59 AM | 0 (0.0%) | 9 (11.0%) |
| 7:00 AM to 7:29 AM | 7 (22.6%) | 15 (18.3%) |
| 7:30 AM to 7:59 AM | 16 (51.6%) | 38 (46.3%) |
| 8:00 AM to 8:29 AM | 0 (0.0%) | 12 (14.6%) |
| 8:30 AM to 8:59 AM | 0 (0.0%) | 0 (0.0%) |
| 9:00 AM to 9:59 AM | 0 (0.0%) | 4 (4.9%) |
| 10:00 AM to 10:59 AM | 0 (0.0%) | 0 (0.0%) |
| 11:00 AM to 11:59 AM | 0 (0.0%) | 0 (0.0%) |
| 12:00 PM to 3:59 PM | 0 (0.0%) | 0 (0.0%) |
| 4:00 PM to 11:59 PM | 0 (0.0%) | 3 (3.7%) |
| Total | 31 (100.0%) | 82 (100.0%) |
Housing Occupancy in Pinehill
Occupancy by Ownership in Pinehill
Of the total 148 dwellings in Pinehill, owner-occupied units account for 26 (17.6%), while renter-occupied units make up 122 (82.4%).
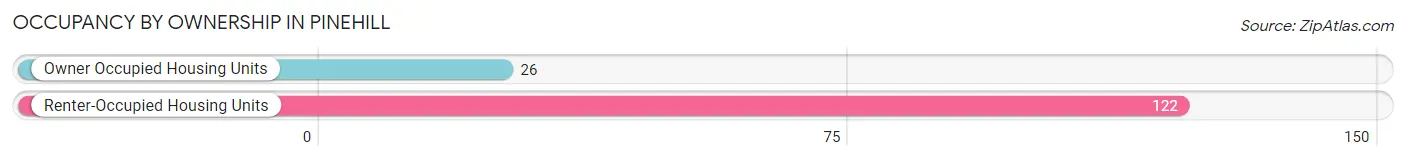
| Occupancy | # Housing Units | % Housing Units |
| Owner Occupied Housing Units | 26 | 17.6% |
| Renter-Occupied Housing Units | 122 | 82.4% |
| Total Occupied Housing Units | 148 | 100.0% |
Occupancy by Household Size in Pinehill
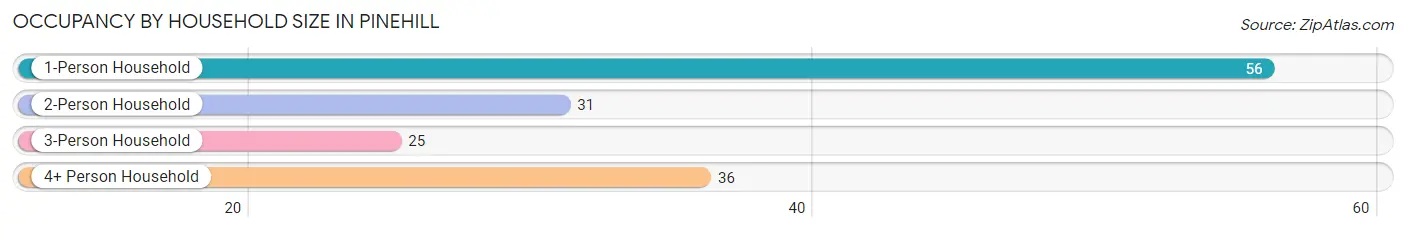
| Household Size | # Housing Units | % Housing Units |
| 1-Person Household | 56 | 37.8% |
| 2-Person Household | 31 | 20.9% |
| 3-Person Household | 25 | 16.9% |
| 4+ Person Household | 36 | 24.3% |
| Total Housing Units | 148 | 100.0% |
Occupancy by Ownership by Household Size in Pinehill
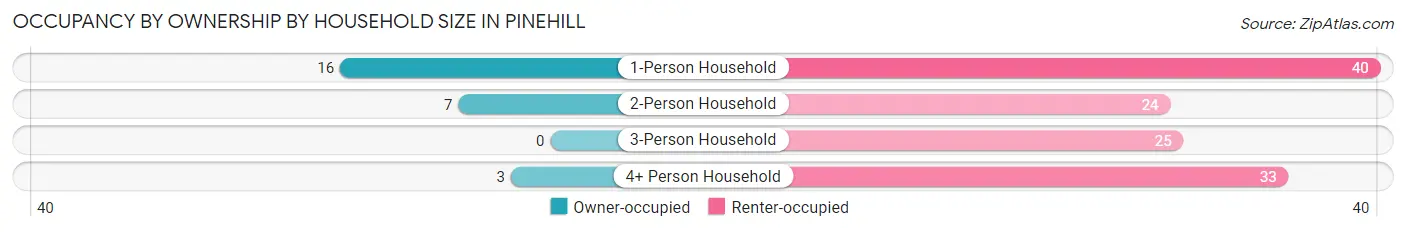
| Household Size | Owner-occupied | Renter-occupied |
| 1-Person Household | 16 (28.6%) | 40 (71.4%) |
| 2-Person Household | 7 (22.6%) | 24 (77.4%) |
| 3-Person Household | 0 (0.0%) | 25 (100.0%) |
| 4+ Person Household | 3 (8.3%) | 33 (91.7%) |
| Total Housing Units | 26 (17.6%) | 122 (82.4%) |
Occupancy by Educational Attainment in Pinehill
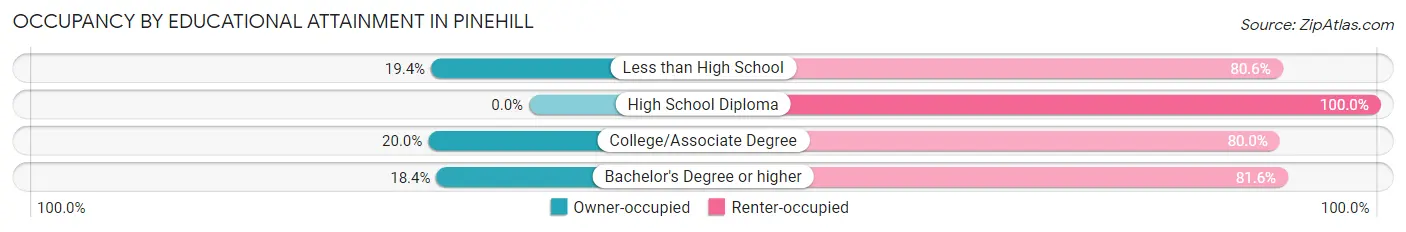
| Household Size | Owner-occupied | Renter-occupied |
| Less than High School | 7 (19.4%) | 29 (80.6%) |
| High School Diploma | 0 (0.0%) | 13 (100.0%) |
| College/Associate Degree | 10 (20.0%) | 40 (80.0%) |
| Bachelor's Degree or higher | 9 (18.4%) | 40 (81.6%) |
Occupancy by Age of Householder in Pinehill
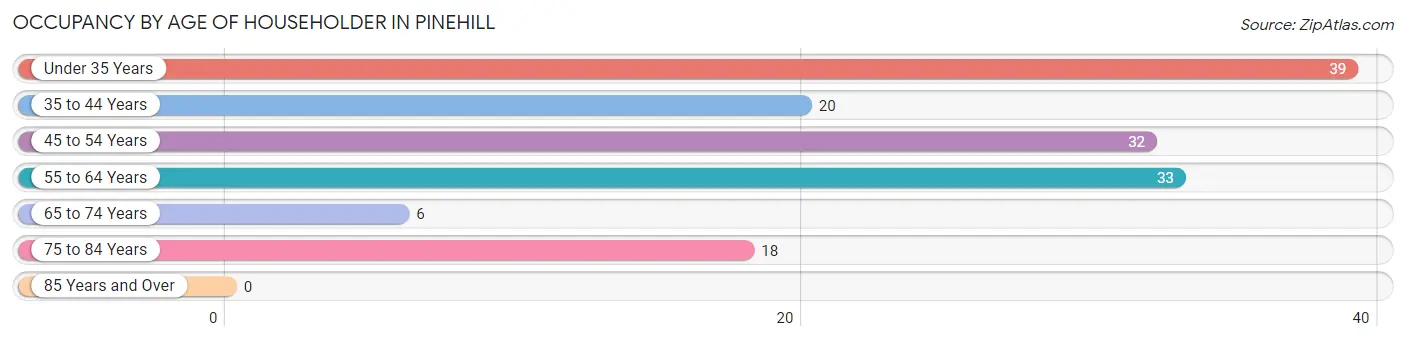
| Age Bracket | # Households | % Households |
| Under 35 Years | 39 | 26.4% |
| 35 to 44 Years | 20 | 13.5% |
| 45 to 54 Years | 32 | 21.6% |
| 55 to 64 Years | 33 | 22.3% |
| 65 to 74 Years | 6 | 4.1% |
| 75 to 84 Years | 18 | 12.2% |
| 85 Years and Over | 0 | 0.0% |
| Total | 148 | 100.0% |
Housing Finances in Pinehill
Median Income by Occupancy in Pinehill
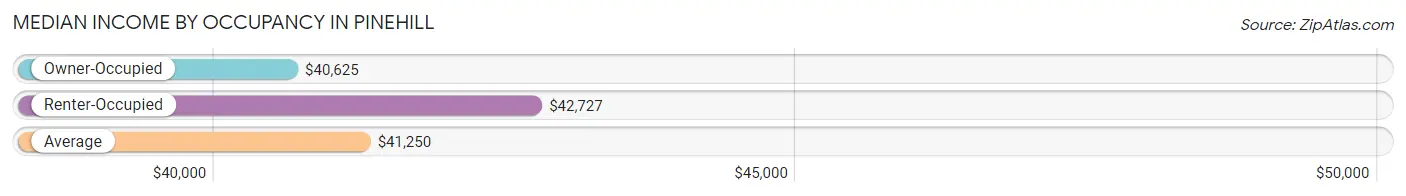
| Occupancy Type | # Households | Median Income |
| Owner-Occupied | 26 (17.6%) | $40,625 |
| Renter-Occupied | 122 (82.4%) | $42,727 |
| Average | 148 (100.0%) | $41,250 |
Occupancy by Householder Income Bracket in Pinehill
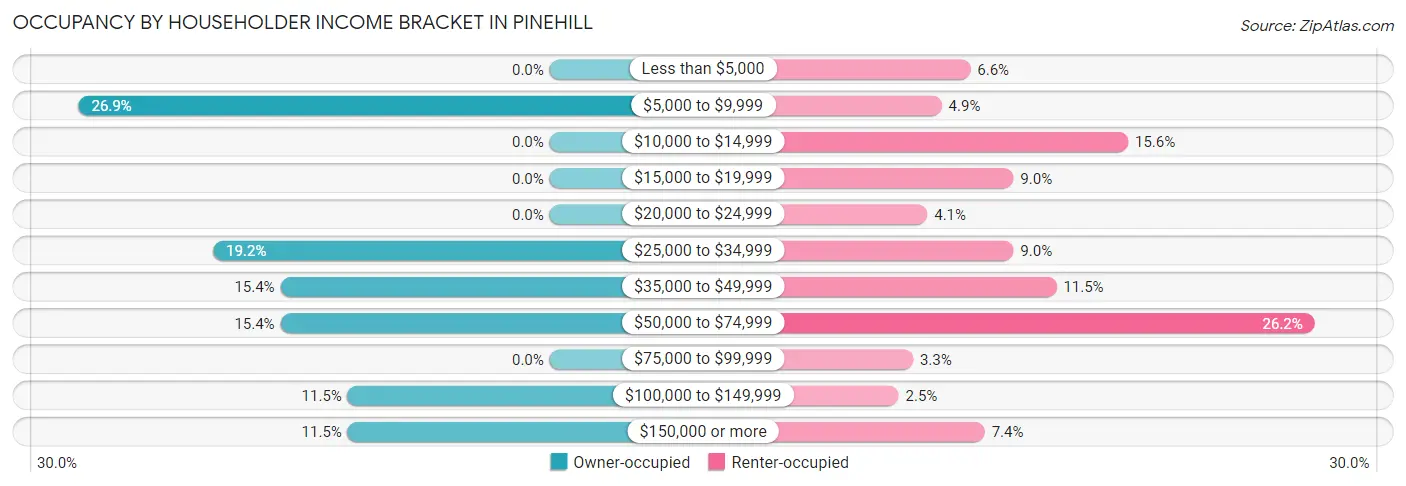
| Income Bracket | Owner-occupied | Renter-occupied |
| Less than $5,000 | 0 (0.0%) | 8 (6.6%) |
| $5,000 to $9,999 | 7 (26.9%) | 6 (4.9%) |
| $10,000 to $14,999 | 0 (0.0%) | 19 (15.6%) |
| $15,000 to $19,999 | 0 (0.0%) | 11 (9.0%) |
| $20,000 to $24,999 | 0 (0.0%) | 5 (4.1%) |
| $25,000 to $34,999 | 5 (19.2%) | 11 (9.0%) |
| $35,000 to $49,999 | 4 (15.4%) | 14 (11.5%) |
| $50,000 to $74,999 | 4 (15.4%) | 32 (26.2%) |
| $75,000 to $99,999 | 0 (0.0%) | 4 (3.3%) |
| $100,000 to $149,999 | 3 (11.5%) | 3 (2.5%) |
| $150,000 or more | 3 (11.5%) | 9 (7.4%) |
| Total | 26 (100.0%) | 122 (100.0%) |
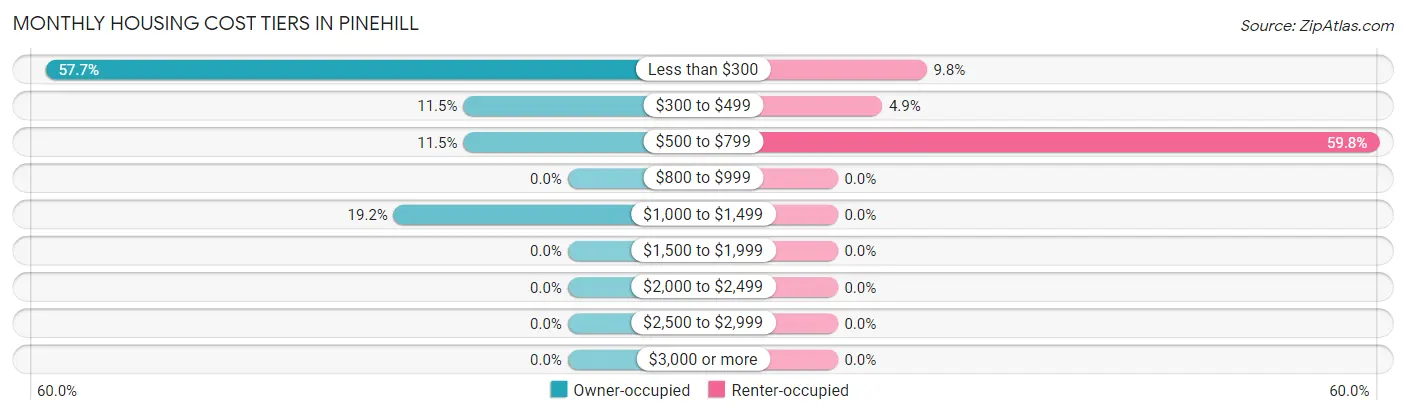
Monthly Housing Cost Tiers in Pinehill
| Monthly Cost | Owner-occupied | Renter-occupied |
| Less than $300 | 15 (57.7%) | 12 (9.8%) |
| $300 to $499 | 3 (11.5%) | 6 (4.9%) |
| $500 to $799 | 3 (11.5%) | 73 (59.8%) |
| $800 to $999 | 0 (0.0%) | 0 (0.0%) |
| $1,000 to $1,499 | 5 (19.2%) | 0 (0.0%) |
| $1,500 to $1,999 | 0 (0.0%) | 0 (0.0%) |
| $2,000 to $2,499 | 0 (0.0%) | 0 (0.0%) |
| $2,500 to $2,999 | 0 (0.0%) | 0 (0.0%) |
| $3,000 or more | 0 (0.0%) | 0 (0.0%) |
| Total | 26 (100.0%) | 122 (100.0%) |
Physical Housing Characteristics in Pinehill
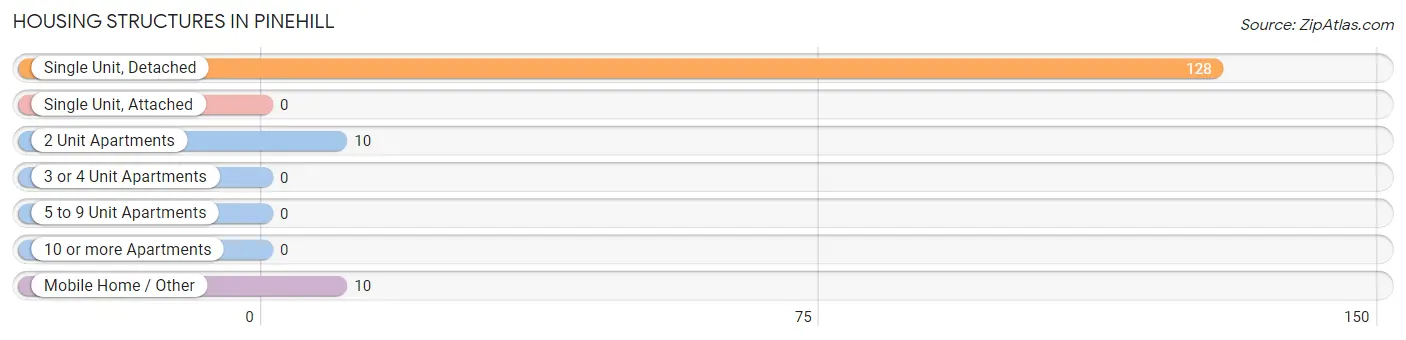
Housing Structures in Pinehill
| Structure Type | # Housing Units | % Housing Units |
| Single Unit, Detached | 128 | 86.5% |
| Single Unit, Attached | 0 | 0.0% |
| 2 Unit Apartments | 10 | 6.8% |
| 3 or 4 Unit Apartments | 0 | 0.0% |
| 5 to 9 Unit Apartments | 0 | 0.0% |
| 10 or more Apartments | 0 | 0.0% |
| Mobile Home / Other | 10 | 6.8% |
| Total | 148 | 100.0% |
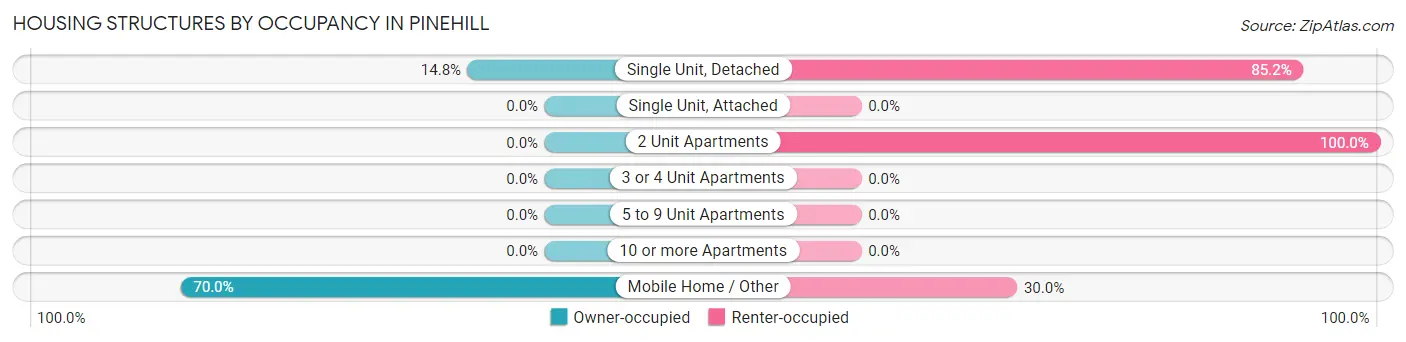
Housing Structures by Occupancy in Pinehill
| Structure Type | Owner-occupied | Renter-occupied |
| Single Unit, Detached | 19 (14.8%) | 109 (85.2%) |
| Single Unit, Attached | 0 (0.0%) | 0 (0.0%) |
| 2 Unit Apartments | 0 (0.0%) | 10 (100.0%) |
| 3 or 4 Unit Apartments | 0 (0.0%) | 0 (0.0%) |
| 5 to 9 Unit Apartments | 0 (0.0%) | 0 (0.0%) |
| 10 or more Apartments | 0 (0.0%) | 0 (0.0%) |
| Mobile Home / Other | 7 (70.0%) | 3 (30.0%) |
| Total | 26 (17.6%) | 122 (82.4%) |
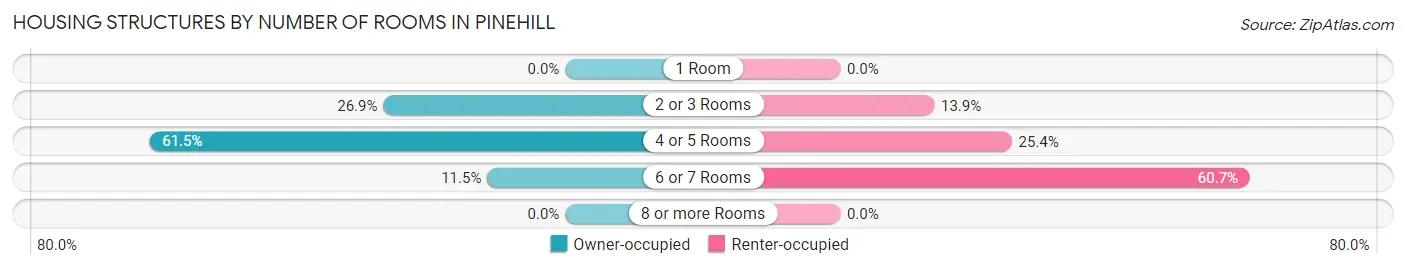
Housing Structures by Number of Rooms in Pinehill
| Number of Rooms | Owner-occupied | Renter-occupied |
| 1 Room | 0 (0.0%) | 0 (0.0%) |
| 2 or 3 Rooms | 7 (26.9%) | 17 (13.9%) |
| 4 or 5 Rooms | 16 (61.5%) | 31 (25.4%) |
| 6 or 7 Rooms | 3 (11.5%) | 74 (60.7%) |
| 8 or more Rooms | 0 (0.0%) | 0 (0.0%) |
| Total | 26 (100.0%) | 122 (100.0%) |
Housing Structure by Heating Type in Pinehill
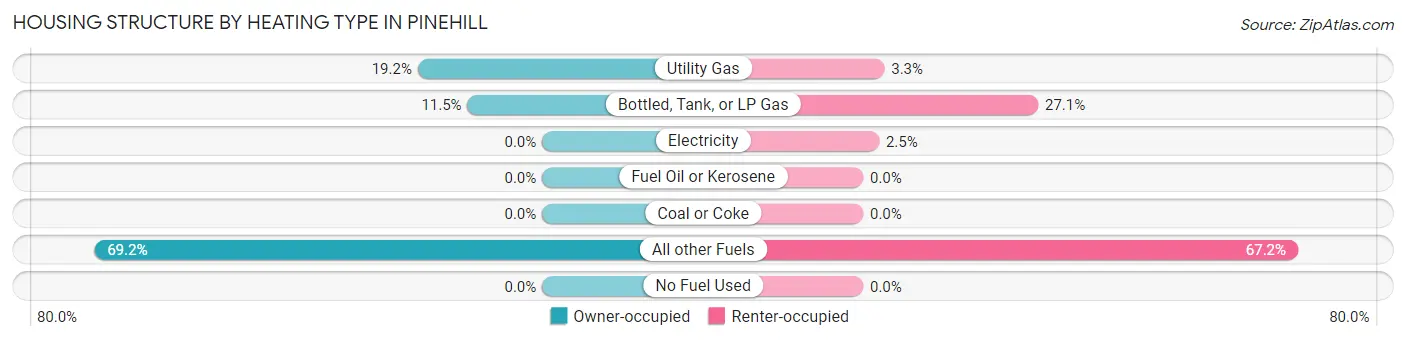
| Heating Type | Owner-occupied | Renter-occupied |
| Utility Gas | 5 (19.2%) | 4 (3.3%) |
| Bottled, Tank, or LP Gas | 3 (11.5%) | 33 (27.1%) |
| Electricity | 0 (0.0%) | 3 (2.5%) |
| Fuel Oil or Kerosene | 0 (0.0%) | 0 (0.0%) |
| Coal or Coke | 0 (0.0%) | 0 (0.0%) |
| All other Fuels | 18 (69.2%) | 82 (67.2%) |
| No Fuel Used | 0 (0.0%) | 0 (0.0%) |
| Total | 26 (100.0%) | 122 (100.0%) |
Household Vehicle Usage in Pinehill
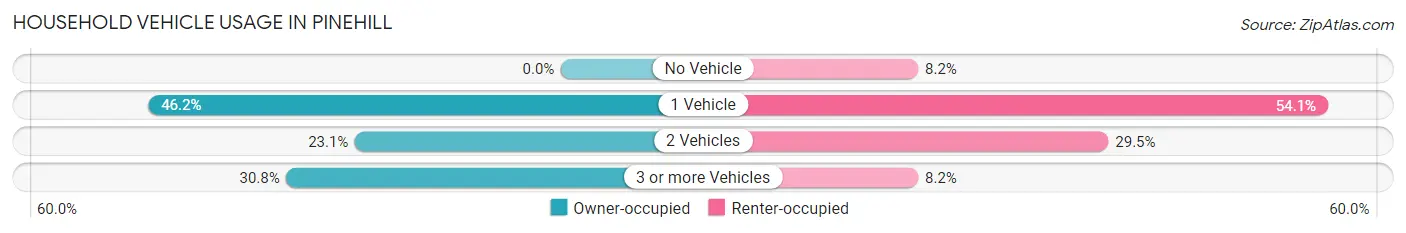
| Vehicles per Household | Owner-occupied | Renter-occupied |
| No Vehicle | 0 (0.0%) | 10 (8.2%) |
| 1 Vehicle | 12 (46.2%) | 66 (54.1%) |
| 2 Vehicles | 6 (23.1%) | 36 (29.5%) |
| 3 or more Vehicles | 8 (30.8%) | 10 (8.2%) |
| Total | 26 (100.0%) | 122 (100.0%) |
Real Estate & Mortgages in Pinehill
Real Estate and Mortgage Overview in Pinehill
| Characteristic | Without Mortgage | With Mortgage |
| Housing Units | 18 | 8 |
| Median Property Value | - | - |
| Median Household Income | - | - |
| Monthly Housing Costs | $141 | $0 |
| Real Estate Taxes | - | - |
Property Value by Mortgage Status in Pinehill
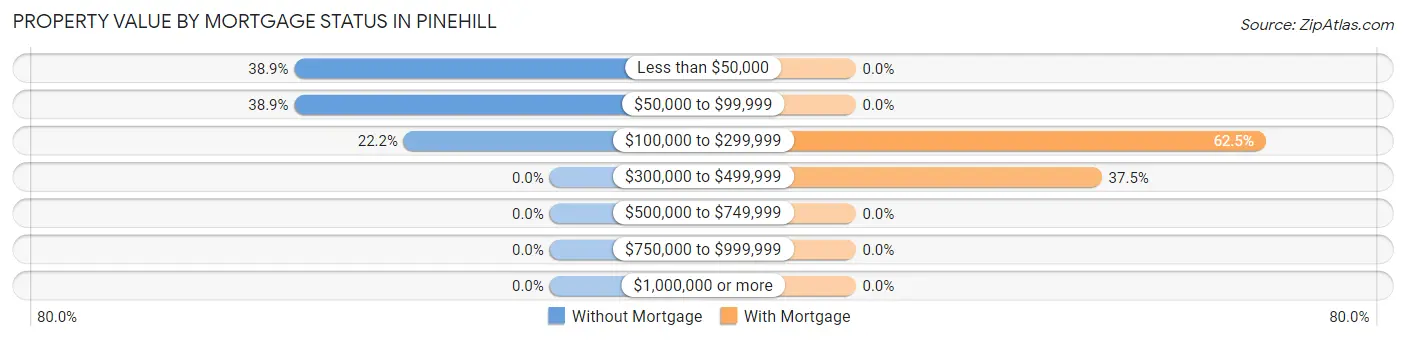
| Property Value | Without Mortgage | With Mortgage |
| Less than $50,000 | 7 (38.9%) | 0 (0.0%) |
| $50,000 to $99,999 | 7 (38.9%) | 0 (0.0%) |
| $100,000 to $299,999 | 4 (22.2%) | 5 (62.5%) |
| $300,000 to $499,999 | 0 (0.0%) | 3 (37.5%) |
| $500,000 to $749,999 | 0 (0.0%) | 0 (0.0%) |
| $750,000 to $999,999 | 0 (0.0%) | 0 (0.0%) |
| $1,000,000 or more | 0 (0.0%) | 0 (0.0%) |
| Total | 18 (100.0%) | 8 (100.0%) |
Household Income by Mortgage Status in Pinehill
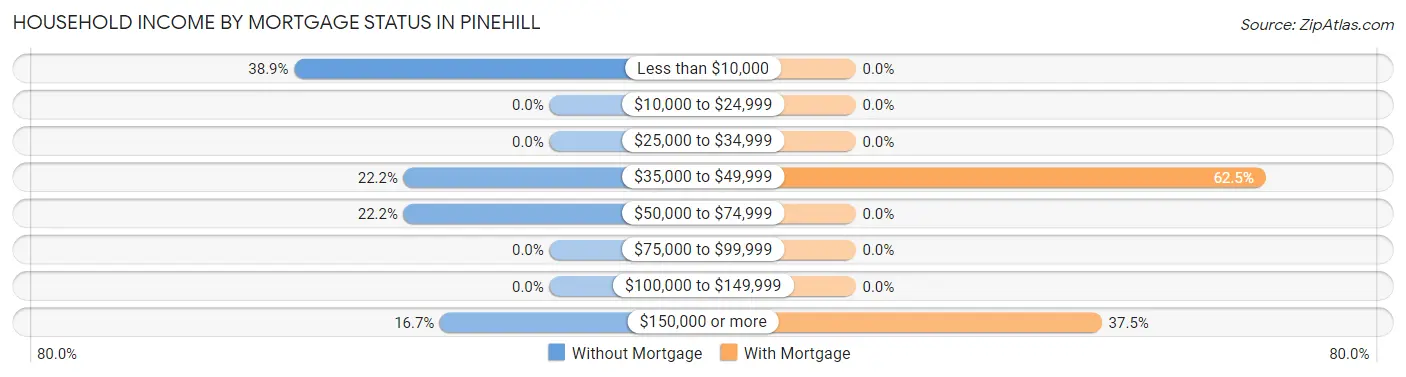
| Household Income | Without Mortgage | With Mortgage |
| Less than $10,000 | 7 (38.9%) | 0 (0.0%) |
| $10,000 to $24,999 | 0 (0.0%) | 0 (0.0%) |
| $25,000 to $34,999 | 0 (0.0%) | 0 (0.0%) |
| $35,000 to $49,999 | 4 (22.2%) | 5 (62.5%) |
| $50,000 to $74,999 | 4 (22.2%) | 0 (0.0%) |
| $75,000 to $99,999 | 0 (0.0%) | 0 (0.0%) |
| $100,000 to $149,999 | 0 (0.0%) | 0 (0.0%) |
| $150,000 or more | 3 (16.7%) | 3 (37.5%) |
| Total | 18 (100.0%) | 8 (100.0%) |
Property Value to Household Income Ratio in Pinehill
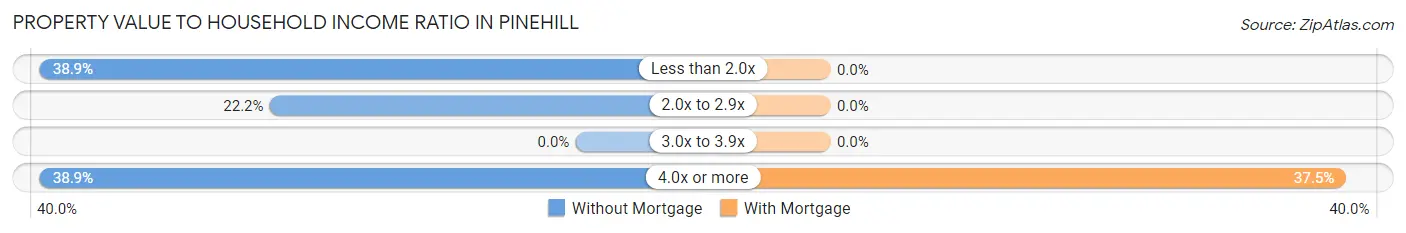
| Value-to-Income Ratio | Without Mortgage | With Mortgage |
| Less than 2.0x | 7 (38.9%) | 0 (0.0%) |
| 2.0x to 2.9x | 4 (22.2%) | 0 (0.0%) |
| 3.0x to 3.9x | 0 (0.0%) | 0 (0.0%) |
| 4.0x or more | 7 (38.9%) | 3 (37.5%) |
| Total | 18 (100.0%) | 8 (100.0%) |
Real Estate Taxes by Mortgage Status in Pinehill
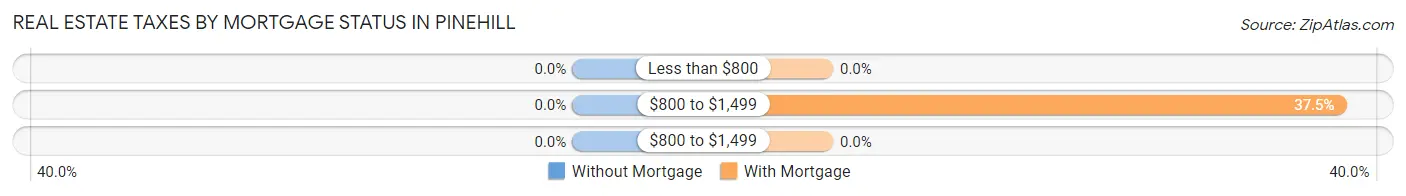
| Property Taxes | Without Mortgage | With Mortgage |
| Less than $800 | 0 (0.0%) | 0 (0.0%) |
| $800 to $1,499 | 0 (0.0%) | 3 (37.5%) |
| $800 to $1,499 | 0 (0.0%) | 0 (0.0%) |
| Total | 18 (100.0%) | 8 (100.0%) |
Health & Disability in Pinehill
Health Insurance Coverage by Age in Pinehill
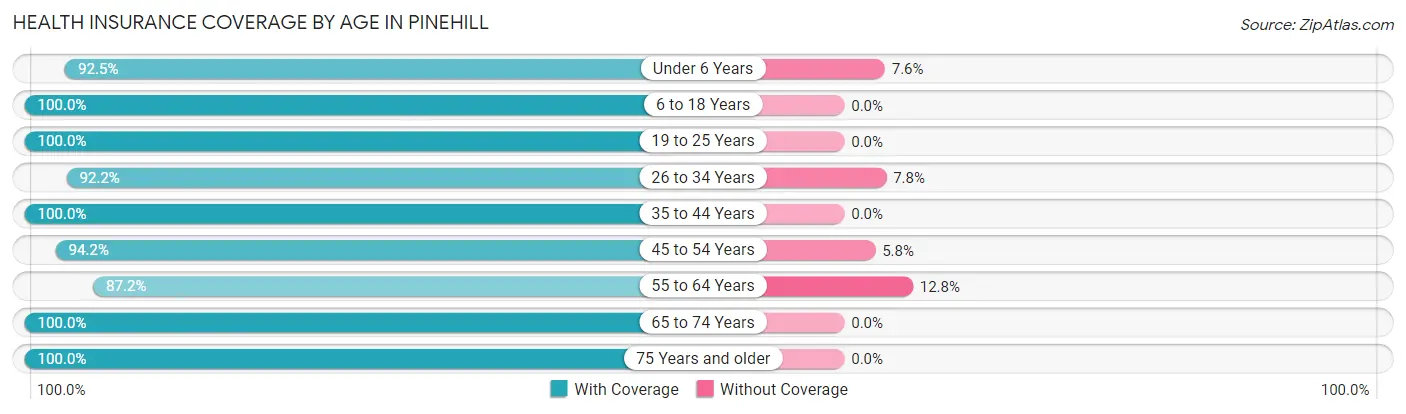
| Age Bracket | With Coverage | Without Coverage |
| Under 6 Years | 49 (92.4%) | 4 (7.5%) |
| 6 to 18 Years | 92 (100.0%) | 0 (0.0%) |
| 19 to 25 Years | 8 (100.0%) | 0 (0.0%) |
| 26 to 34 Years | 59 (92.2%) | 5 (7.8%) |
| 35 to 44 Years | 38 (100.0%) | 0 (0.0%) |
| 45 to 54 Years | 49 (94.2%) | 3 (5.8%) |
| 55 to 64 Years | 41 (87.2%) | 6 (12.8%) |
| 65 to 74 Years | 9 (100.0%) | 0 (0.0%) |
| 75 Years and older | 28 (100.0%) | 0 (0.0%) |
| Total | 373 (95.4%) | 18 (4.6%) |
Health Insurance Coverage by Citizenship Status in Pinehill
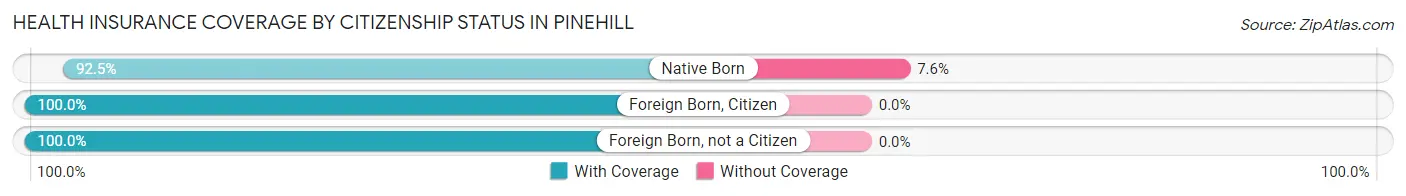
| Citizenship Status | With Coverage | Without Coverage |
| Native Born | 49 (92.4%) | 4 (7.5%) |
| Foreign Born, Citizen | 92 (100.0%) | 0 (0.0%) |
| Foreign Born, not a Citizen | 8 (100.0%) | 0 (0.0%) |
Health Insurance Coverage by Household Income in Pinehill
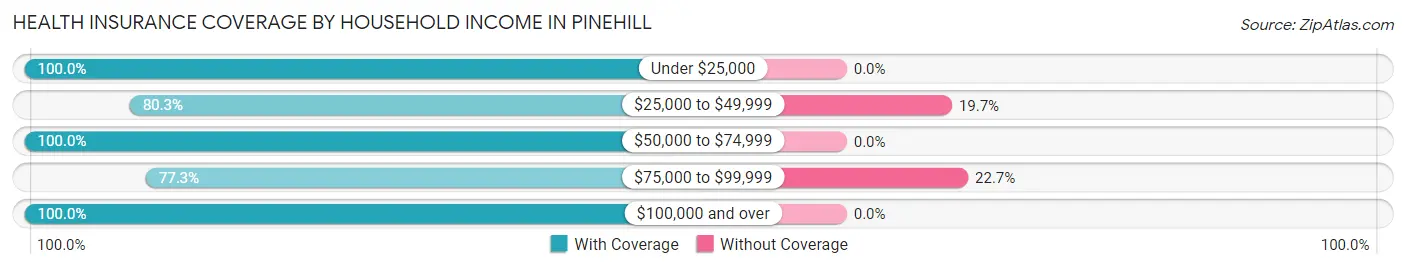
| Household Income | With Coverage | Without Coverage |
| Under $25,000 | 194 (100.0%) | 0 (0.0%) |
| $25,000 to $49,999 | 53 (80.3%) | 13 (19.7%) |
| $50,000 to $74,999 | 55 (100.0%) | 0 (0.0%) |
| $75,000 to $99,999 | 17 (77.3%) | 5 (22.7%) |
| $100,000 and over | 54 (100.0%) | 0 (0.0%) |
Public vs Private Health Insurance Coverage by Age in Pinehill
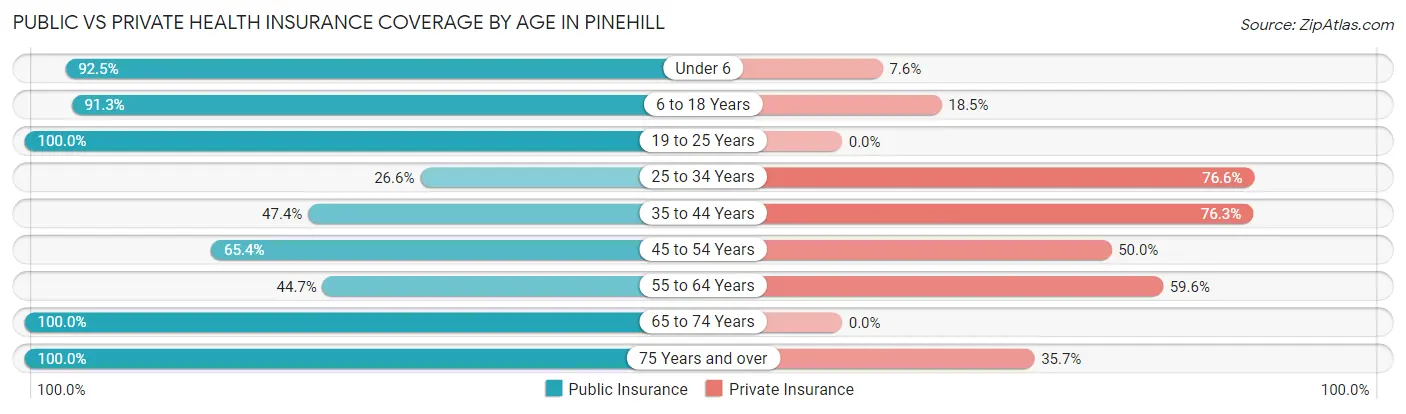
| Age Bracket | Public Insurance | Private Insurance |
| Under 6 | 49 (92.4%) | 4 (7.5%) |
| 6 to 18 Years | 84 (91.3%) | 17 (18.5%) |
| 19 to 25 Years | 8 (100.0%) | 0 (0.0%) |
| 25 to 34 Years | 17 (26.6%) | 49 (76.6%) |
| 35 to 44 Years | 18 (47.4%) | 29 (76.3%) |
| 45 to 54 Years | 34 (65.4%) | 26 (50.0%) |
| 55 to 64 Years | 21 (44.7%) | 28 (59.6%) |
| 65 to 74 Years | 9 (100.0%) | 0 (0.0%) |
| 75 Years and over | 28 (100.0%) | 10 (35.7%) |
| Total | 268 (68.5%) | 163 (41.7%) |
Disability Status by Sex by Age in Pinehill
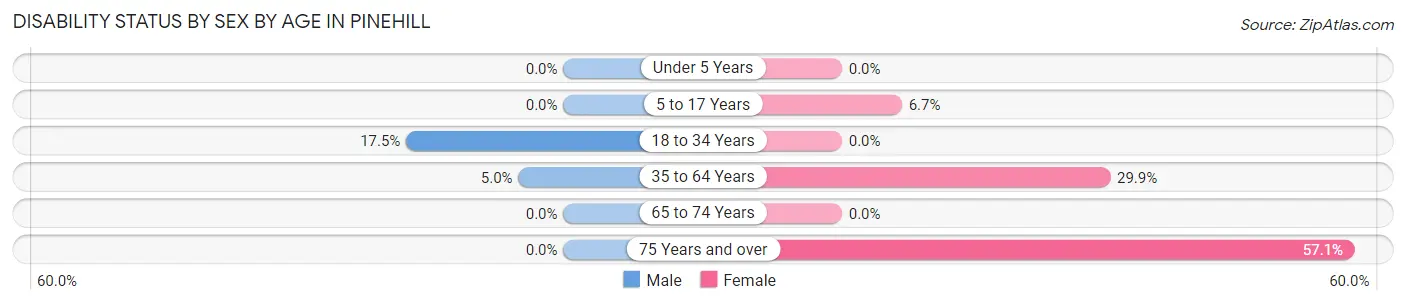
| Age Bracket | Male | Female |
| Under 5 Years | 0 (0.0%) | 0 (0.0%) |
| 5 to 17 Years | 0 (0.0%) | 3 (6.7%) |
| 18 to 34 Years | 7 (17.5%) | 0 (0.0%) |
| 35 to 64 Years | 3 (5.0%) | 23 (29.9%) |
| 65 to 74 Years | 0 (0.0%) | 0 (0.0%) |
| 75 Years and over | 0 (0.0%) | 16 (57.1%) |
Disability Class by Sex by Age in Pinehill
Disability Class: Hearing Difficulty
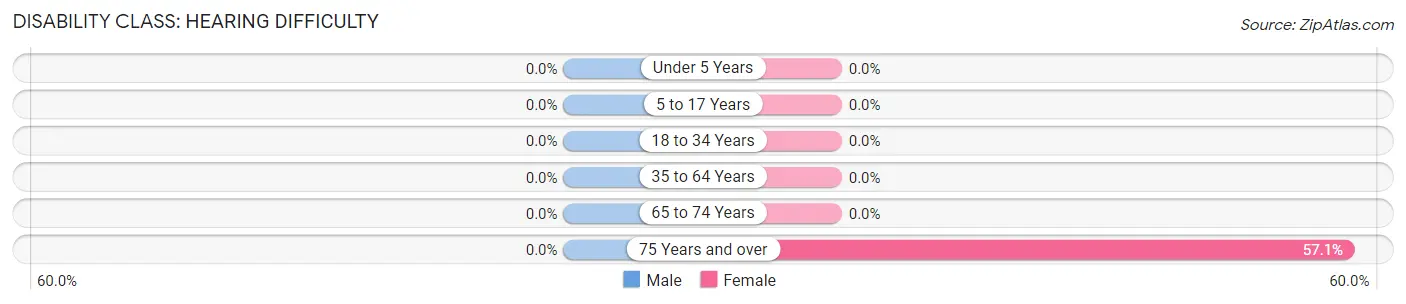
| Age Bracket | Male | Female |
| Under 5 Years | 0 (0.0%) | 0 (0.0%) |
| 5 to 17 Years | 0 (0.0%) | 0 (0.0%) |
| 18 to 34 Years | 0 (0.0%) | 0 (0.0%) |
| 35 to 64 Years | 0 (0.0%) | 0 (0.0%) |
| 65 to 74 Years | 0 (0.0%) | 0 (0.0%) |
| 75 Years and over | 0 (0.0%) | 16 (57.1%) |
Disability Class: Vision Difficulty
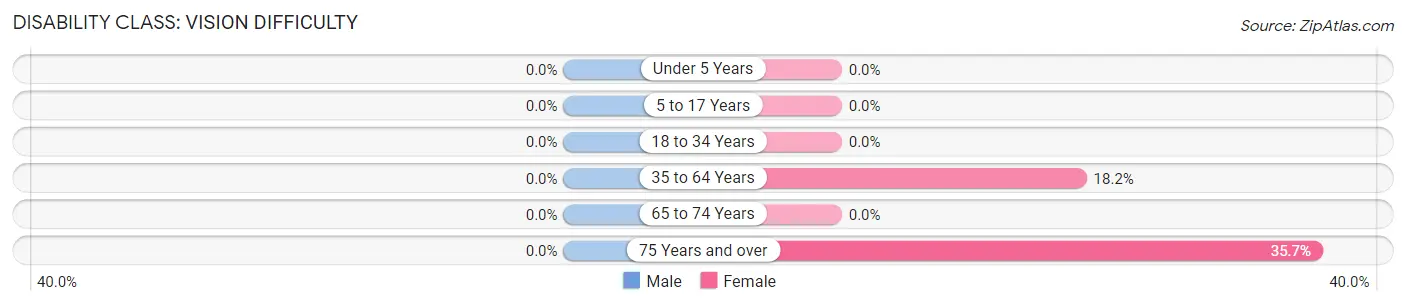
| Age Bracket | Male | Female |
| Under 5 Years | 0 (0.0%) | 0 (0.0%) |
| 5 to 17 Years | 0 (0.0%) | 0 (0.0%) |
| 18 to 34 Years | 0 (0.0%) | 0 (0.0%) |
| 35 to 64 Years | 0 (0.0%) | 14 (18.2%) |
| 65 to 74 Years | 0 (0.0%) | 0 (0.0%) |
| 75 Years and over | 0 (0.0%) | 10 (35.7%) |
Disability Class: Cognitive Difficulty
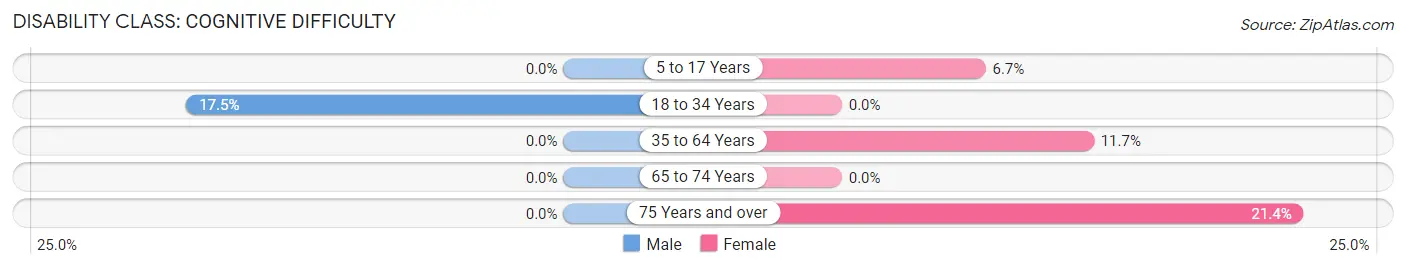
| Age Bracket | Male | Female |
| 5 to 17 Years | 0 (0.0%) | 3 (6.7%) |
| 18 to 34 Years | 7 (17.5%) | 0 (0.0%) |
| 35 to 64 Years | 0 (0.0%) | 9 (11.7%) |
| 65 to 74 Years | 0 (0.0%) | 0 (0.0%) |
| 75 Years and over | 0 (0.0%) | 6 (21.4%) |
Disability Class: Ambulatory Difficulty
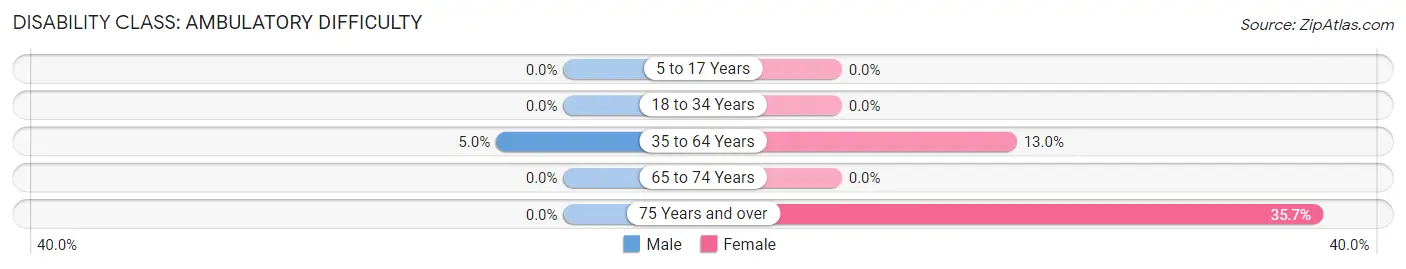
| Age Bracket | Male | Female |
| 5 to 17 Years | 0 (0.0%) | 0 (0.0%) |
| 18 to 34 Years | 0 (0.0%) | 0 (0.0%) |
| 35 to 64 Years | 3 (5.0%) | 10 (13.0%) |
| 65 to 74 Years | 0 (0.0%) | 0 (0.0%) |
| 75 Years and over | 0 (0.0%) | 10 (35.7%) |
Disability Class: Self-Care Difficulty
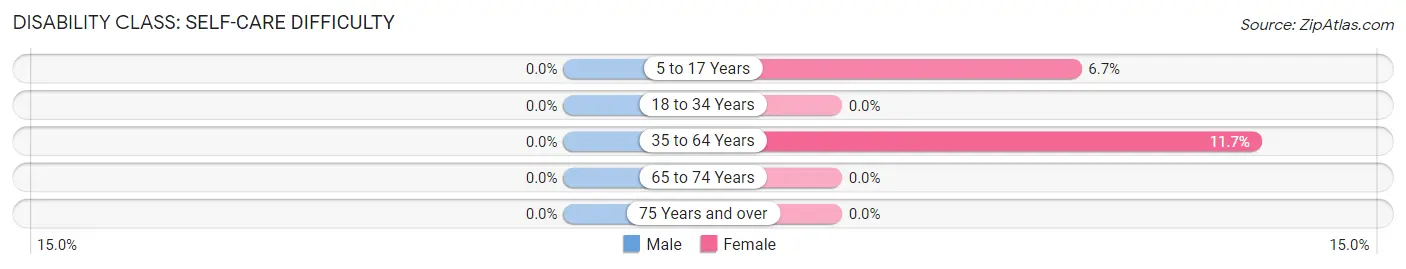
| Age Bracket | Male | Female |
| 5 to 17 Years | 0 (0.0%) | 3 (6.7%) |
| 18 to 34 Years | 0 (0.0%) | 0 (0.0%) |
| 35 to 64 Years | 0 (0.0%) | 9 (11.7%) |
| 65 to 74 Years | 0 (0.0%) | 0 (0.0%) |
| 75 Years and over | 0 (0.0%) | 0 (0.0%) |
Technology Access in Pinehill
Computing Device Access in Pinehill
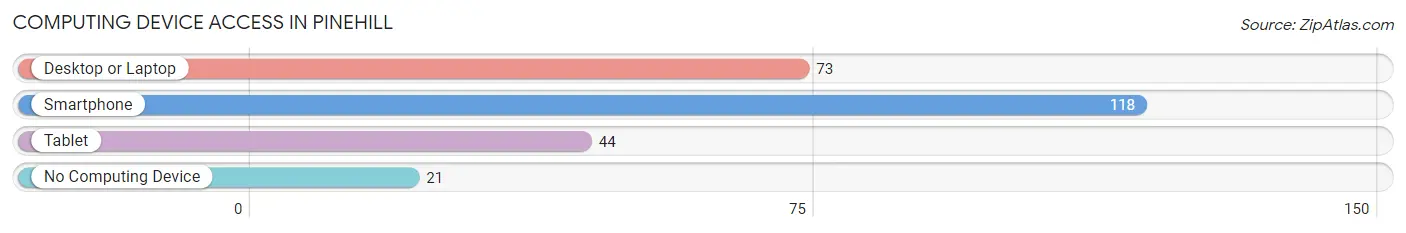
| Device Type | # Households | % Households |
| Desktop or Laptop | 73 | 49.3% |
| Smartphone | 118 | 79.7% |
| Tablet | 44 | 29.7% |
| No Computing Device | 21 | 14.2% |
| Total | 148 | 100.0% |
Internet Access in Pinehill
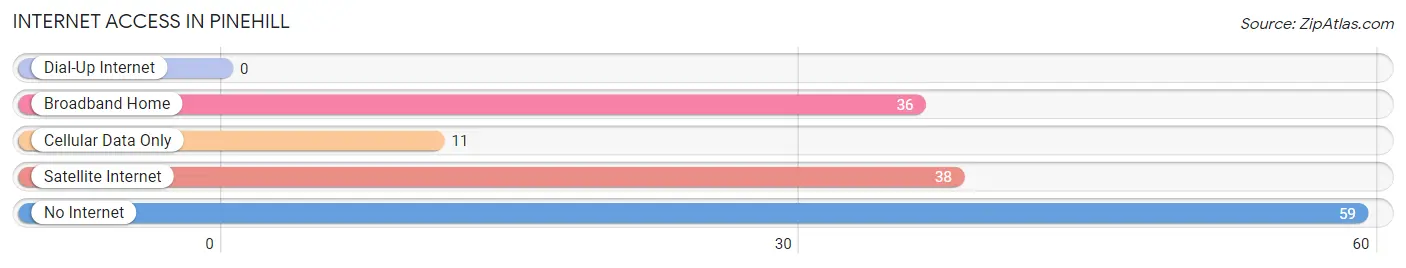
| Internet Type | # Households | % Households |
| Dial-Up Internet | 0 | 0.0% |
| Broadband Home | 36 | 24.3% |
| Cellular Data Only | 11 | 7.4% |
| Satellite Internet | 38 | 25.7% |
| No Internet | 59 | 39.9% |
| Total | 148 | 100.0% |
Pinehill Summary
Pinehill is a small unincorporated community located in McKinley County, New Mexico. It is situated in the Navajo Nation, approximately 25 miles east of Gallup. The population of Pinehill was estimated to be 1,845 in 2019.
History
Pinehill was established in the late 1800s as a trading post for the Navajo people. The trading post was owned by a man named John Pine, who was a trader from the East Coast. He was known for trading with the Navajo people for their wool and other goods. The trading post was eventually sold to a man named John Hill, who renamed the post Pinehill.
The area around Pinehill was originally inhabited by the Navajo people, who had been living in the area for centuries. The Navajo people were forced to move to the area in the late 1800s as part of the Long Walk of the Navajo. The Long Walk was a forced relocation of the Navajo people from their ancestral lands in Arizona and New Mexico to a reservation in eastern New Mexico.
Geography
Pinehill is located in the northwestern part of McKinley County, New Mexico. It is situated in the Navajo Nation, approximately 25 miles east of Gallup. The area around Pinehill is mostly flat, with some rolling hills. The elevation of Pinehill is approximately 5,800 feet above sea level.
The climate in Pinehill is semi-arid, with hot summers and cold winters. The average annual temperature is approximately 55 degrees Fahrenheit. The average annual precipitation is approximately 10 inches.
Economy
The economy of Pinehill is largely based on agriculture and tourism. The area is home to several farms, which produce a variety of crops, including corn, wheat, and hay. The area is also home to several tourist attractions, including the Navajo Nation Museum and the Navajo National Monument.
The area is also home to several businesses, including a gas station, a grocery store, and a restaurant. The area is also home to several schools, including Pinehill Elementary School and Pinehill High School.
Demographics
The population of Pinehill was estimated to be 1,845 in 2019. The population is primarily Native American, with the majority of the population being Navajo. The median household income in Pinehill is approximately $30,000. The median age in Pinehill is approximately 30 years old. The unemployment rate in Pinehill is approximately 10%.
Common Questions
What is Per Capita Income in Pinehill?
Per Capita income in Pinehill is $22,206.
What is the Median Family Income in Pinehill?
Median Family Income in Pinehill is $27,500.
What is the Median Household income in Pinehill?
Median Household Income in Pinehill is $41,250.
What is Income or Wage Gap in Pinehill?
Income or Wage Gap in Pinehill is 0.5%.
Women in Pinehill earn 99.5 cents for every dollar earned by a man.
What is Inequality or Gini Index in Pinehill?
Inequality or Gini Index in Pinehill is 0.53.
What is the Total Population of Pinehill?
Total Population of Pinehill is 391.
What is the Total Male Population of Pinehill?
Total Male Population of Pinehill is 152.
What is the Total Female Population of Pinehill?
Total Female Population of Pinehill is 239.
What is the Ratio of Males per 100 Females in Pinehill?
There are 63.60 Males per 100 Females in Pinehill.
What is the Ratio of Females per 100 Males in Pinehill?
There are 157.24 Females per 100 Males in Pinehill.
What is the Median Population Age in Pinehill?
Median Population Age in Pinehill is 28.9 Years.
What is the Average Family Size in Pinehill
Average Family Size in Pinehill is 3.6 People.
What is the Average Household Size in Pinehill
Average Household Size in Pinehill is 2.6 People.
How Large is the Labor Force in Pinehill?
There are 147 People in the Labor Forcein in Pinehill.
What is the Percentage of People in the Labor Force in Pinehill?
51.6% of People are in the Labor Force in Pinehill.
What is the Unemployment Rate in Pinehill?
Unemployment Rate in Pinehill is 16.3%.