Peralta, NM Map & Demographics
Peralta Map
Peralta Overview
$53,092
PER CAPITA INCOME
$79,028
AVG FAMILY INCOME
$57,711
AVG HOUSEHOLD INCOME
12.2%
WAGE / INCOME GAP [ % ]
87.8¢/ $1
WAGE / INCOME GAP [ $ ]
0.54
INEQUALITY / GINI INDEX
3,379
TOTAL POPULATION
1,778
MALE POPULATION
1,601
FEMALE POPULATION
111.06
MALES / 100 FEMALES
90.04
FEMALES / 100 MALES
39.2
MEDIAN AGE
3.2
AVG FAMILY SIZE
2.5
AVG HOUSEHOLD SIZE
1,575
LABOR FORCE [ PEOPLE ]
59.7%
PERCENT IN LABOR FORCE
11.3%
UNEMPLOYMENT RATE
Peralta Zip Codes
Peralta Area Codes
Income in Peralta
Income Overview in Peralta
Per Capita Income in Peralta is $53,092, while median incomes of families and households are $79,028 and $57,711 respectively.
| Characteristic | Number | Measure |
| Per Capita Income | 3,379 | $53,092 |
| Median Family Income | 867 | $79,028 |
| Mean Family Income | 867 | $126,153 |
| Median Household Income | 1,374 | $57,711 |
| Mean Household Income | 1,374 | $96,246 |
| Income Deficit | 867 | $0 |
| Wage / Income Gap (%) | 3,379 | 12.20% |
| Wage / Income Gap ($) | 3,379 | 87.80¢ per $1 |
| Gini / Inequality Index | 3,379 | 0.54 |
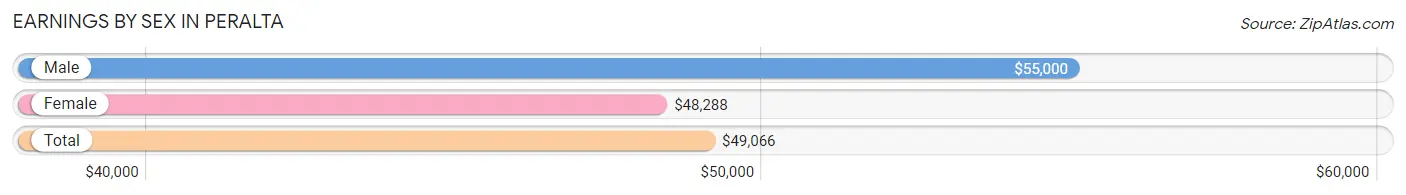
Earnings by Sex in Peralta
Average Earnings in Peralta are $49,066, $55,000 for men and $48,288 for women, a difference of 12.2%.
| Sex | Number | Average Earnings |
| Male | 816 (50.8%) | $55,000 |
| Female | 791 (49.2%) | $48,288 |
| Total | 1,607 (100.0%) | $49,066 |
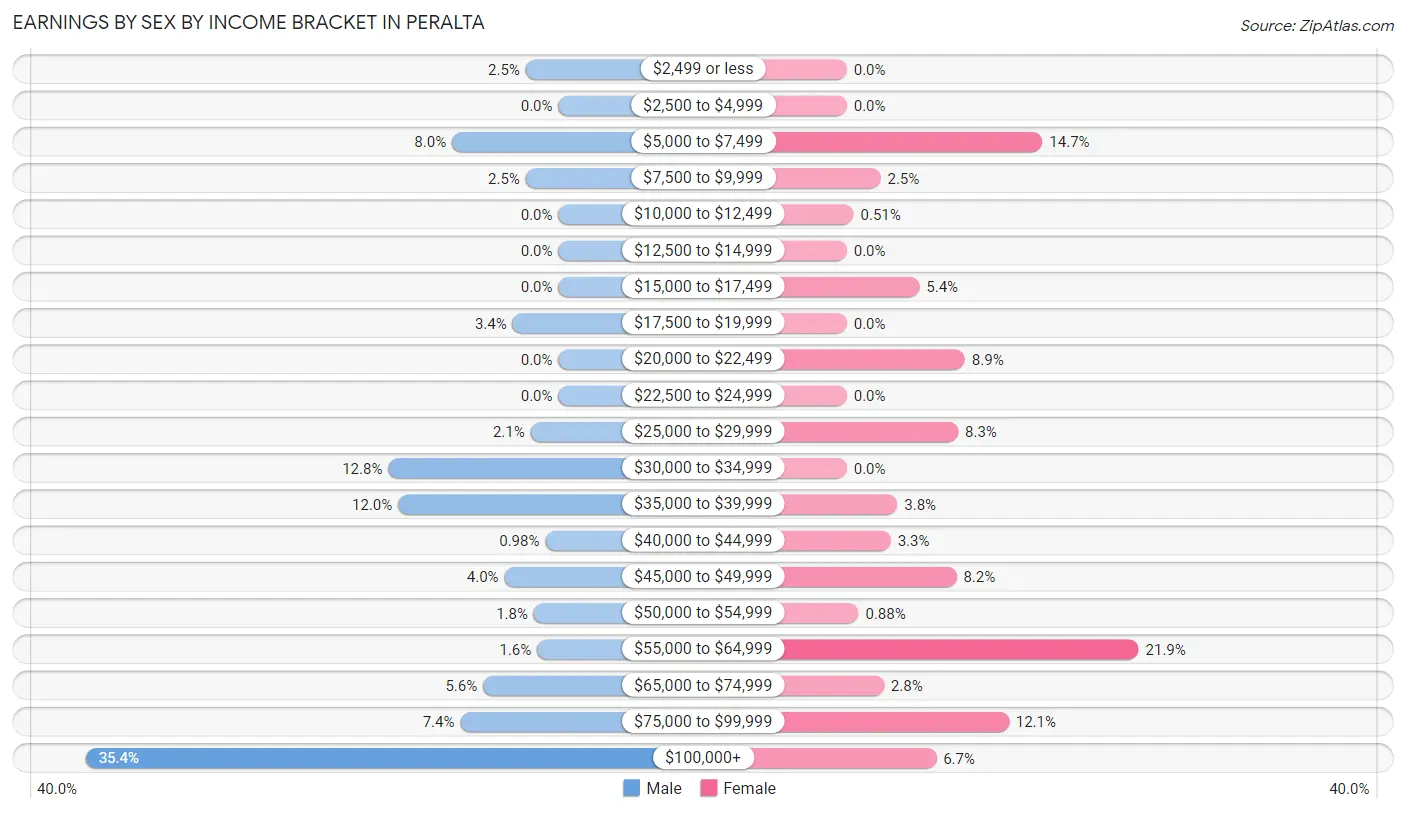
Earnings by Sex by Income Bracket in Peralta
The most common earnings brackets in Peralta are $100,000+ for men (289 | 35.4%) and $55,000 to $64,999 for women (173 | 21.9%).
| Income | Male | Female |
| $2,499 or less | 20 (2.5%) | 0 (0.0%) |
| $2,500 to $4,999 | 0 (0.0%) | 0 (0.0%) |
| $5,000 to $7,499 | 65 (8.0%) | 116 (14.7%) |
| $7,500 to $9,999 | 20 (2.5%) | 20 (2.5%) |
| $10,000 to $12,499 | 0 (0.0%) | 4 (0.5%) |
| $12,500 to $14,999 | 0 (0.0%) | 0 (0.0%) |
| $15,000 to $17,499 | 0 (0.0%) | 43 (5.4%) |
| $17,500 to $19,999 | 28 (3.4%) | 0 (0.0%) |
| $20,000 to $22,499 | 0 (0.0%) | 70 (8.8%) |
| $22,500 to $24,999 | 0 (0.0%) | 0 (0.0%) |
| $25,000 to $29,999 | 17 (2.1%) | 66 (8.3%) |
| $30,000 to $34,999 | 104 (12.8%) | 0 (0.0%) |
| $35,000 to $39,999 | 98 (12.0%) | 30 (3.8%) |
| $40,000 to $44,999 | 8 (1.0%) | 26 (3.3%) |
| $45,000 to $49,999 | 33 (4.0%) | 65 (8.2%) |
| $50,000 to $54,999 | 15 (1.8%) | 7 (0.9%) |
| $55,000 to $64,999 | 13 (1.6%) | 173 (21.9%) |
| $65,000 to $74,999 | 46 (5.6%) | 22 (2.8%) |
| $75,000 to $99,999 | 60 (7.3%) | 96 (12.1%) |
| $100,000+ | 289 (35.4%) | 53 (6.7%) |
| Total | 816 (100.0%) | 791 (100.0%) |
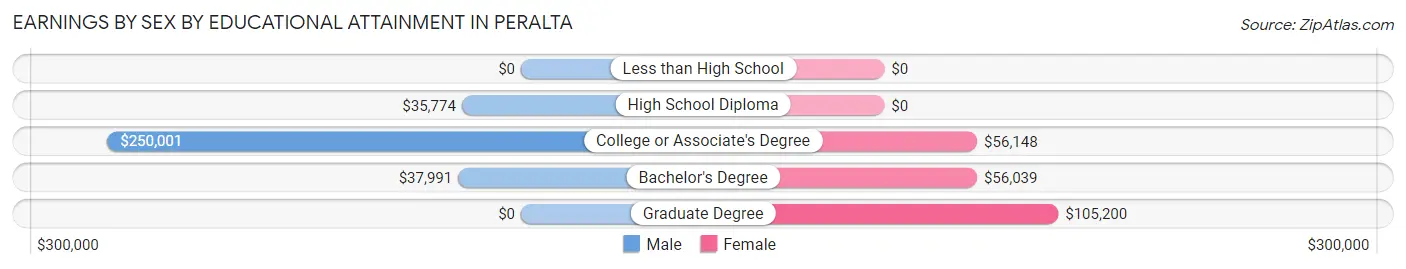
Earnings by Sex by Educational Attainment in Peralta
Average earnings in Peralta are $70,074 for men and $55,099 for women, a difference of 21.4%. Men with an educational attainment of college or associate's degree enjoy the highest average annual earnings of $250,001, while those with high school diploma education earn the least with $35,774. Women with an educational attainment of graduate degree earn the most with the average annual earnings of $105,200, while those with bachelor's degree education have the smallest earnings of $56,039.
| Educational Attainment | Male Income | Female Income |
| Less than High School | - | - |
| High School Diploma | $35,774 | $0 |
| College or Associate's Degree | $250,001 | $56,148 |
| Bachelor's Degree | $37,991 | $56,039 |
| Graduate Degree | - | - |
| Total | $70,074 | $55,099 |
Family Income in Peralta
Family Income Brackets in Peralta
According to the Peralta family income data, there are 187 families falling into the $50,000 to $74,999 income range, which is the most common income bracket and makes up 21.6% of all families.
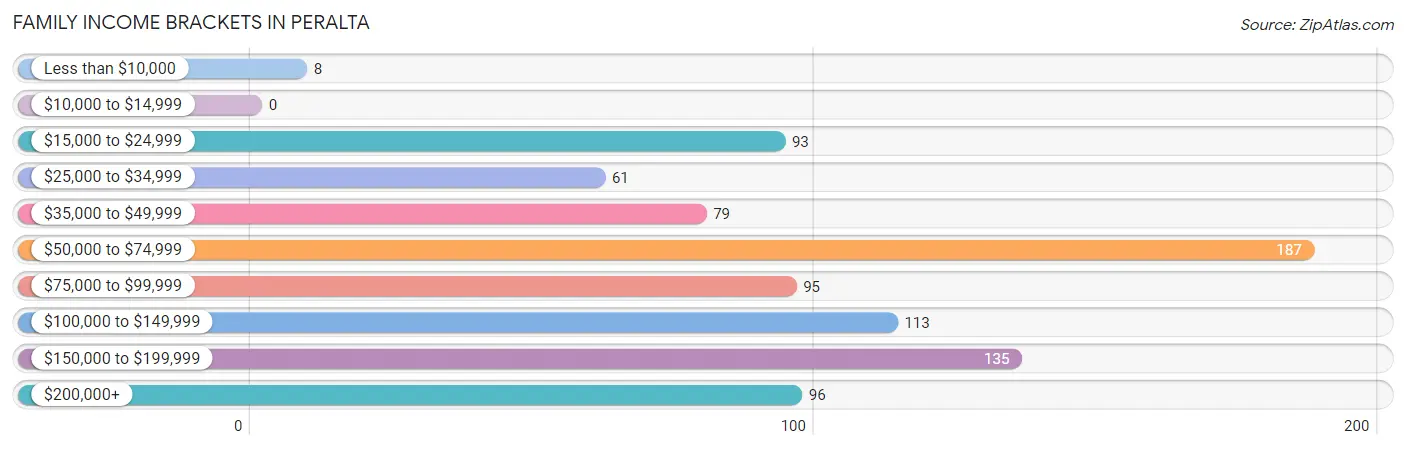
| Income Bracket | # Families | % Families |
| Less than $10,000 | 8 | 0.9% |
| $10,000 to $14,999 | 0 | 0.0% |
| $15,000 to $24,999 | 93 | 10.7% |
| $25,000 to $34,999 | 61 | 7.0% |
| $35,000 to $49,999 | 79 | 9.1% |
| $50,000 to $74,999 | 187 | 21.6% |
| $75,000 to $99,999 | 95 | 11.0% |
| $100,000 to $149,999 | 113 | 13.0% |
| $150,000 to $199,999 | 135 | 15.6% |
| $200,000+ | 96 | 11.1% |
Family Income by Famaliy Size in Peralta
2-person families (496 | 57.2%) account for the highest median family income in Peralta with $72,963 per family, while 2-person families (496 | 57.2%) have the highest median income of $36,482 per family member.
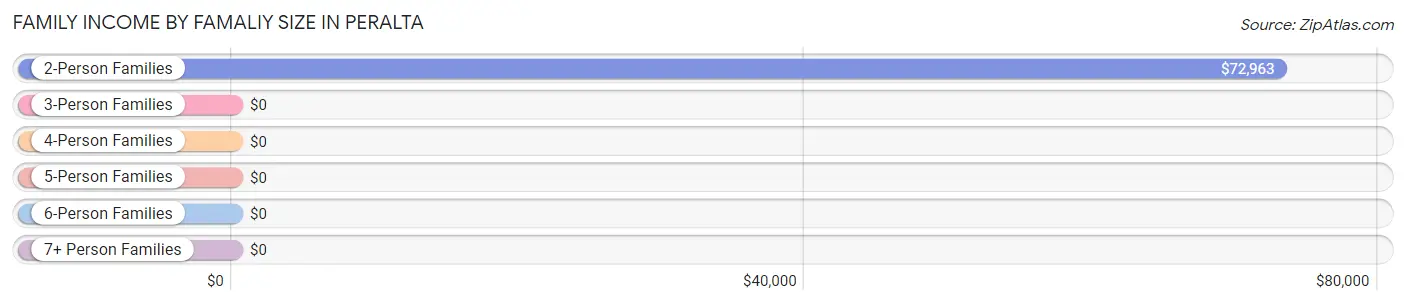
| Income Bracket | # Families | Median Income |
| 2-Person Families | 496 (57.2%) | $72,963 |
| 3-Person Families | 168 (19.4%) | $0 |
| 4-Person Families | 141 (16.3%) | $0 |
| 5-Person Families | 4 (0.5%) | $0 |
| 6-Person Families | 57 (6.6%) | $0 |
| 7+ Person Families | 1 (0.1%) | $0 |
| Total | 867 (100.0%) | $79,028 |
Family Income by Number of Earners in Peralta
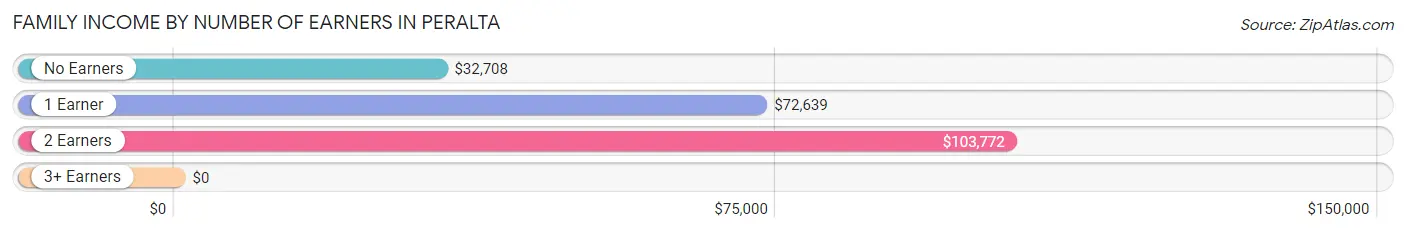
| Number of Earners | # Families | Median Income |
| No Earners | 63 (7.3%) | $32,708 |
| 1 Earner | 507 (58.5%) | $72,639 |
| 2 Earners | 279 (32.2%) | $103,772 |
| 3+ Earners | 18 (2.1%) | $0 |
| Total | 867 (100.0%) | $79,028 |
Household Income in Peralta
Household Income Brackets in Peralta
With 218 households falling in the category, the $35,000 to $49,999 income range is the most frequent in Peralta, accounting for 15.9% of all households. In contrast, only 76 households (5.5%) fall into the less than $10,000 income bracket, making it the least populous group.
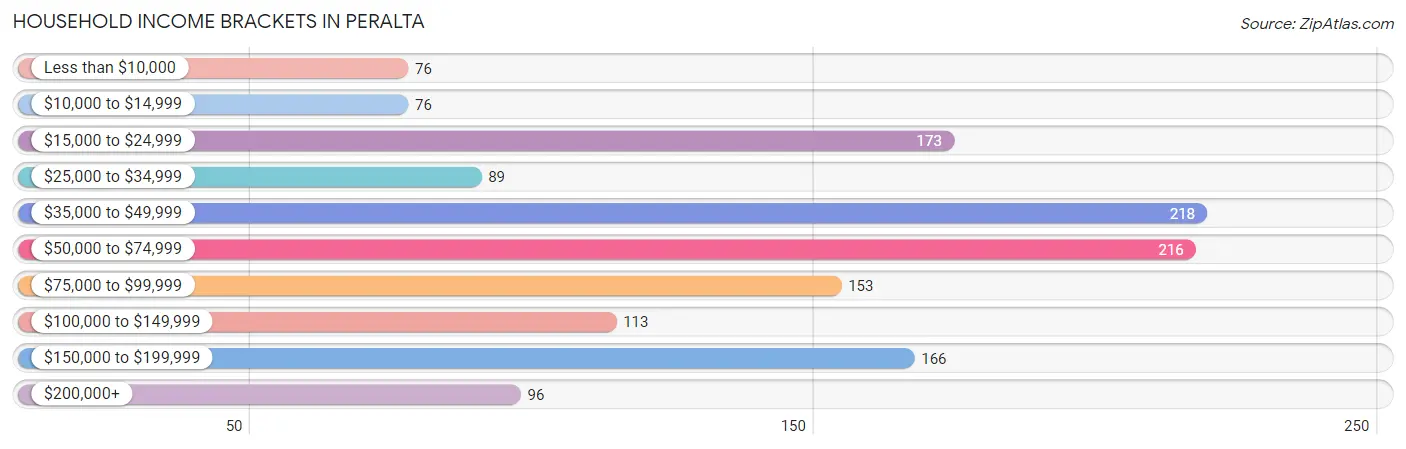
| Income Bracket | # Households | % Households |
| Less than $10,000 | 76 | 5.5% |
| $10,000 to $14,999 | 76 | 5.5% |
| $15,000 to $24,999 | 173 | 12.6% |
| $25,000 to $34,999 | 89 | 6.5% |
| $35,000 to $49,999 | 218 | 15.9% |
| $50,000 to $74,999 | 216 | 15.7% |
| $75,000 to $99,999 | 153 | 11.1% |
| $100,000 to $149,999 | 113 | 8.2% |
| $150,000 to $199,999 | 166 | 12.1% |
| $200,000+ | 96 | 7.0% |
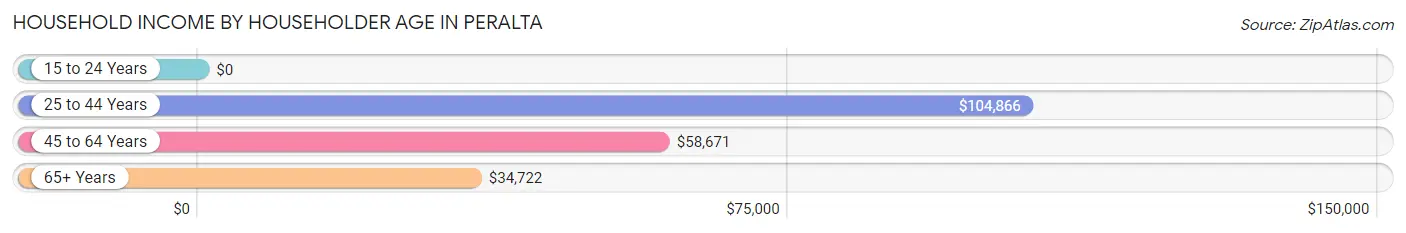
Household Income by Householder Age in Peralta
The median household income in Peralta is $57,711, with the highest median household income of $104,866 found in the 25 to 44 years age bracket for the primary householder. A total of 284 households (20.7%) fall into this category.
| Income Bracket | # Households | Median Income |
| 15 to 24 Years | 0 (0.0%) | $0 |
| 25 to 44 Years | 284 (20.7%) | $104,866 |
| 45 to 64 Years | 774 (56.3%) | $58,671 |
| 65+ Years | 316 (23.0%) | $34,722 |
| Total | 1,374 (100.0%) | $57,711 |
Poverty in Peralta
Income Below Poverty by Sex and Age in Peralta
With 14.1% poverty level for males and 13.9% for females among the residents of Peralta, 16 and 17 year old males and 75 year old and over females are the most vulnerable to poverty, with 57 males (54.8%) and 80 females (51.9%) in their respective age groups living below the poverty level.
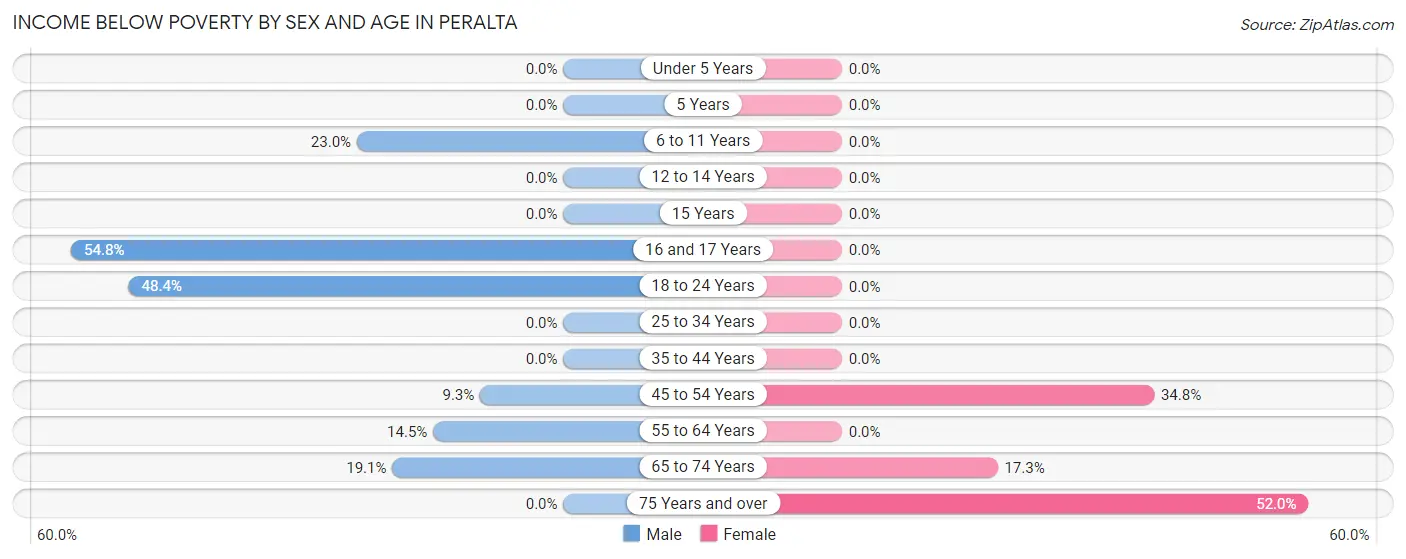
| Age Bracket | Male | Female |
| Under 5 Years | 0 (0.0%) | 0 (0.0%) |
| 5 Years | 0 (0.0%) | 0 (0.0%) |
| 6 to 11 Years | 63 (23.0%) | 0 (0.0%) |
| 12 to 14 Years | 0 (0.0%) | 0 (0.0%) |
| 15 Years | 0 (0.0%) | 0 (0.0%) |
| 16 and 17 Years | 57 (54.8%) | 0 (0.0%) |
| 18 to 24 Years | 61 (48.4%) | 0 (0.0%) |
| 25 to 34 Years | 0 (0.0%) | 0 (0.0%) |
| 35 to 44 Years | 0 (0.0%) | 0 (0.0%) |
| 45 to 54 Years | 14 (9.3%) | 113 (34.8%) |
| 55 to 64 Years | 48 (14.5%) | 0 (0.0%) |
| 65 to 74 Years | 8 (19.1%) | 30 (17.3%) |
| 75 Years and over | 0 (0.0%) | 80 (51.9%) |
| Total | 251 (14.1%) | 223 (13.9%) |
Income Above Poverty by Sex and Age in Peralta
According to the poverty statistics in Peralta, males aged under 5 years and females aged under 5 years are the age groups that are most secure financially, with 100.0% of males and 100.0% of females in these age groups living above the poverty line.
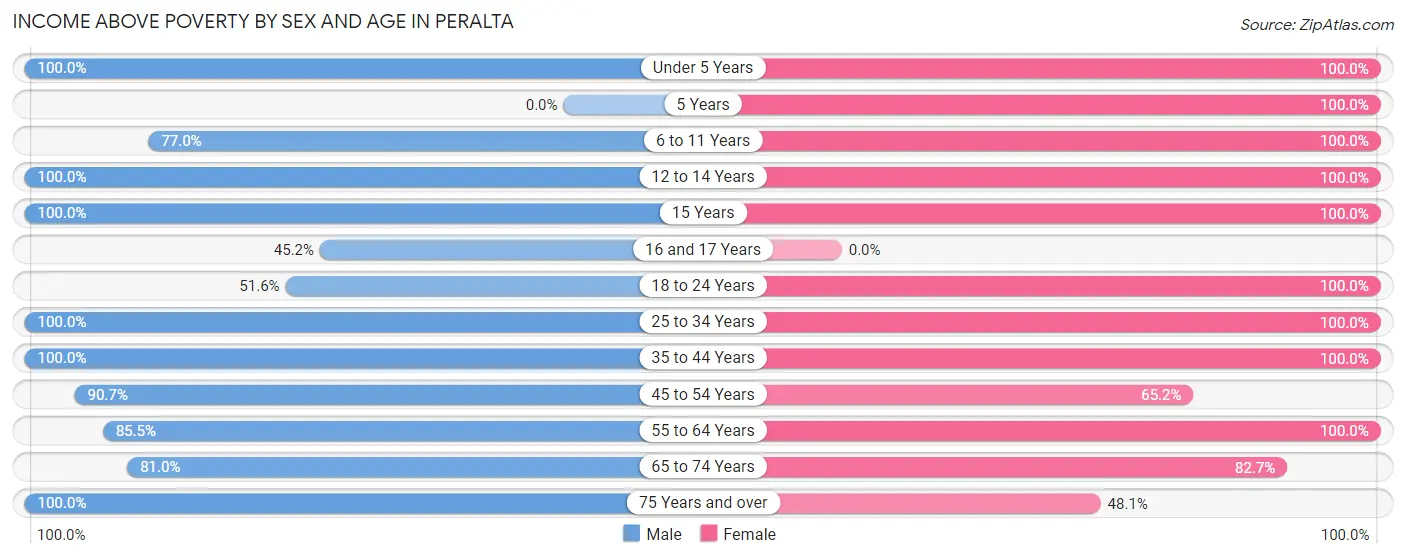
| Age Bracket | Male | Female |
| Under 5 Years | 69 (100.0%) | 77 (100.0%) |
| 5 Years | 0 (0.0%) | 35 (100.0%) |
| 6 to 11 Years | 211 (77.0%) | 130 (100.0%) |
| 12 to 14 Years | 64 (100.0%) | 10 (100.0%) |
| 15 Years | 68 (100.0%) | 13 (100.0%) |
| 16 and 17 Years | 47 (45.2%) | 0 (0.0%) |
| 18 to 24 Years | 65 (51.6%) | 193 (100.0%) |
| 25 to 34 Years | 123 (100.0%) | 176 (100.0%) |
| 35 to 44 Years | 284 (100.0%) | 150 (100.0%) |
| 45 to 54 Years | 137 (90.7%) | 212 (65.2%) |
| 55 to 64 Years | 283 (85.5%) | 165 (100.0%) |
| 65 to 74 Years | 34 (80.9%) | 143 (82.7%) |
| 75 Years and over | 142 (100.0%) | 74 (48.0%) |
| Total | 1,527 (85.9%) | 1,378 (86.1%) |
Income Below Poverty Among Married-Couple Families in Peralta
The poverty statistics for married-couple families in Peralta show that 1.3% or 8 of the total 639 families live below the poverty line. Families with no children have the highest poverty rate of 2.1%, comprising of 8 families. On the other hand, families with 1 or 2 children have the lowest poverty rate of 0.0%, which includes 0 families.
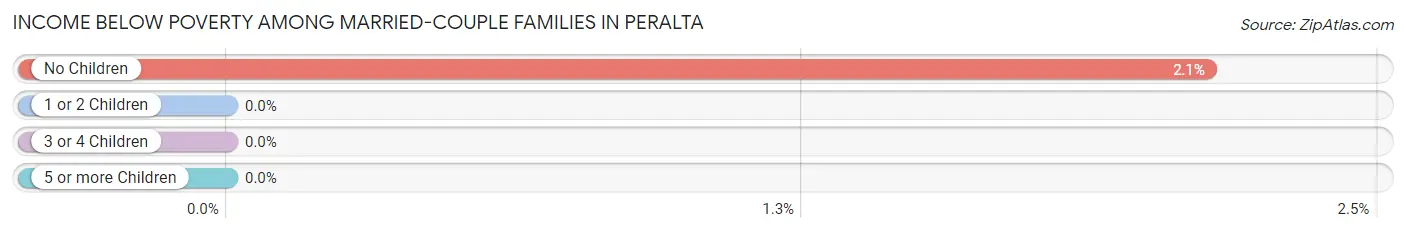
| Children | Above Poverty | Below Poverty |
| No Children | 367 (97.9%) | 8 (2.1%) |
| 1 or 2 Children | 210 (100.0%) | 0 (0.0%) |
| 3 or 4 Children | 53 (100.0%) | 0 (0.0%) |
| 5 or more Children | 1 (100.0%) | 0 (0.0%) |
| Total | 631 (98.8%) | 8 (1.3%) |
Income Below Poverty Among Single-Parent Households in Peralta
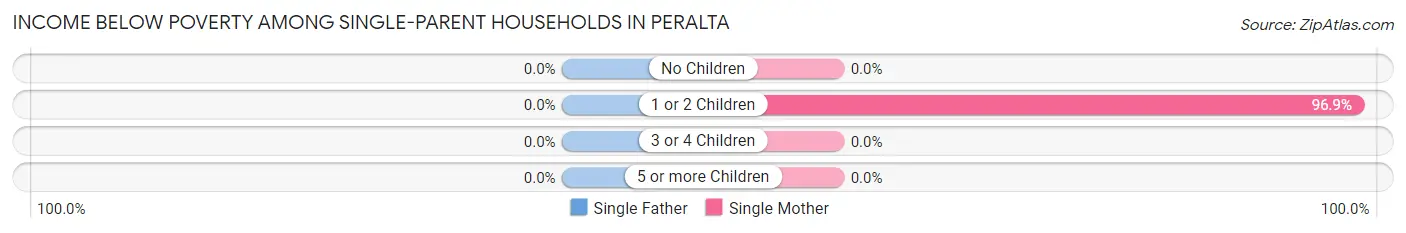
| Children | Single Father | Single Mother |
| No Children | 0 (0.0%) | 0 (0.0%) |
| 1 or 2 Children | 0 (0.0%) | 93 (96.9%) |
| 3 or 4 Children | 0 (0.0%) | 0 (0.0%) |
| 5 or more Children | 0 (0.0%) | 0 (0.0%) |
| Total | 0 (0.0%) | 93 (49.7%) |
Income Below Poverty Among Married-Couple vs Single-Parent Households in Peralta
The poverty data for Peralta shows that 8 of the married-couple family households (1.3%) and 93 of the single-parent households (40.8%) are living below the poverty level. Within the married-couple family households, those with no children have the highest poverty rate, with 8 households (2.1%) falling below the poverty line. Among the single-parent households, those with 1 or 2 children have the highest poverty rate, with 93 household (85.3%) living below poverty.
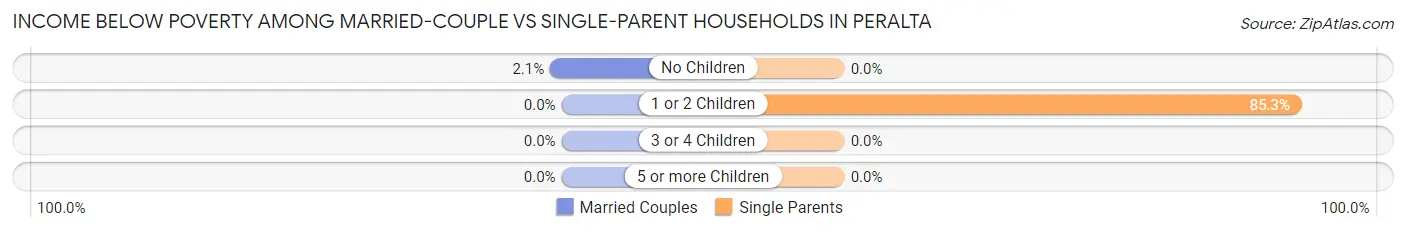
| Children | Married-Couple Families | Single-Parent Households |
| No Children | 8 (2.1%) | 0 (0.0%) |
| 1 or 2 Children | 0 (0.0%) | 93 (85.3%) |
| 3 or 4 Children | 0 (0.0%) | 0 (0.0%) |
| 5 or more Children | 0 (0.0%) | 0 (0.0%) |
| Total | 8 (1.3%) | 93 (40.8%) |
Race in Peralta
The most populous races in Peralta are White / Caucasian (2,227 | 65.9%), Hispanic or Latino (2,027 | 60.0%), and Some other Race (536 | 15.9%).
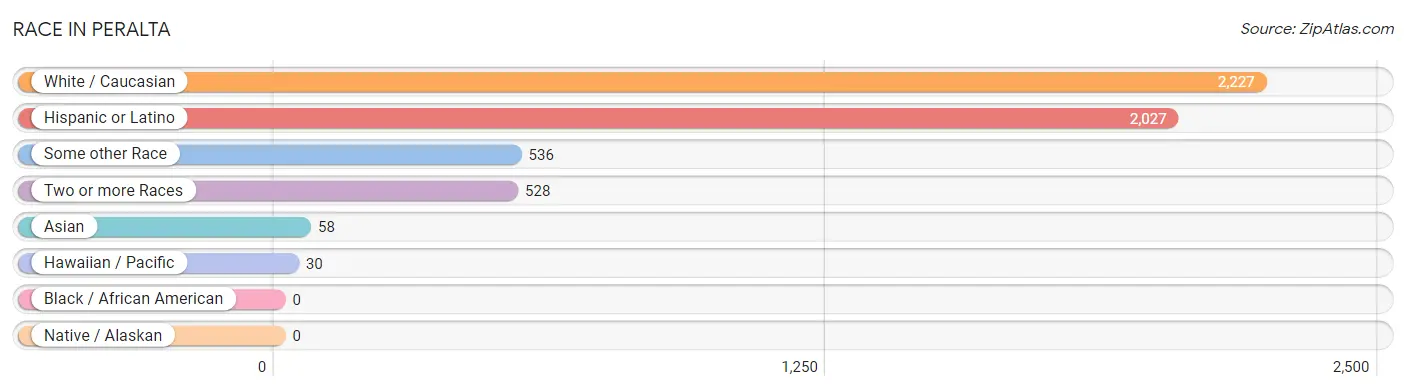
| Race | # Population | % Population |
| Asian | 58 | 1.7% |
| Black / African American | 0 | 0.0% |
| Hawaiian / Pacific | 30 | 0.9% |
| Hispanic or Latino | 2,027 | 60.0% |
| Native / Alaskan | 0 | 0.0% |
| White / Caucasian | 2,227 | 65.9% |
| Two or more Races | 528 | 15.6% |
| Some other Race | 536 | 15.9% |
| Total | 3,379 | 100.0% |
Ancestry in Peralta
The most populous ancestries reported in Peralta are Mexican (1,151 | 34.1%), Spanish (303 | 9.0%), Irish (271 | 8.0%), American (253 | 7.5%), and German (193 | 5.7%), together accounting for 64.2% of all Peralta residents.
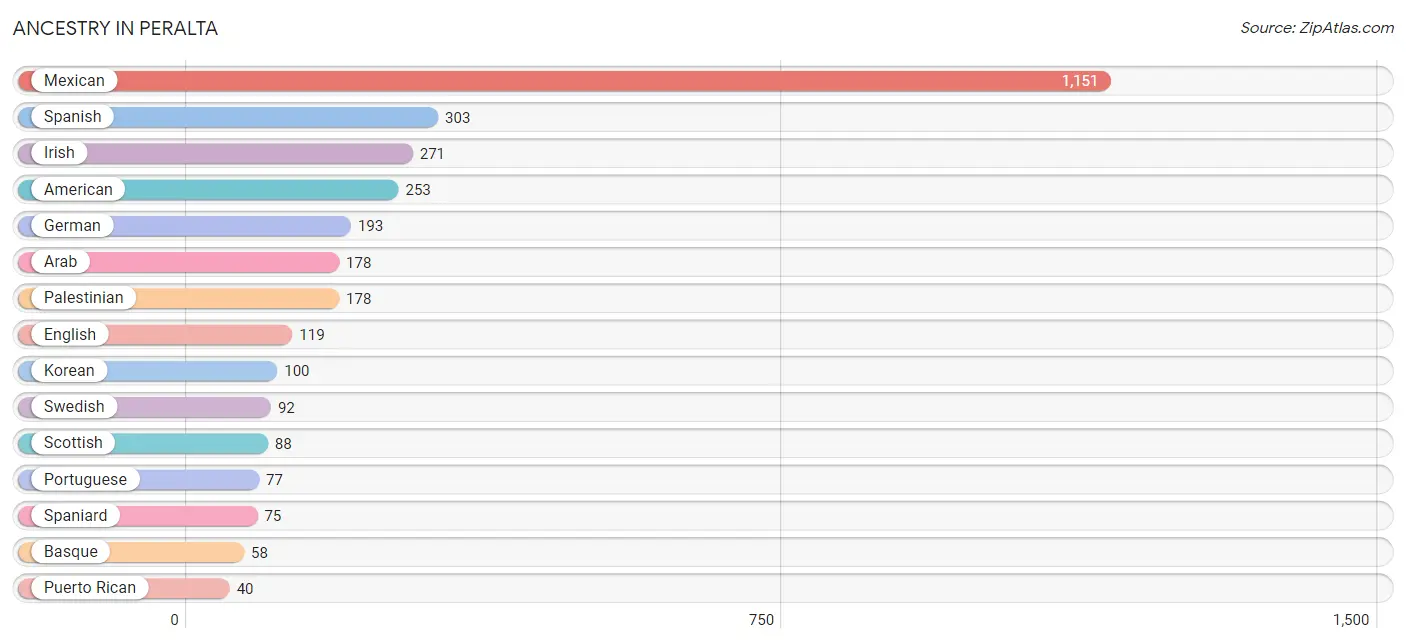
| Ancestry | # Population | % Population |
| American | 253 | 7.5% |
| Arab | 178 | 5.3% |
| Basque | 58 | 1.7% |
| Central American | 26 | 0.8% |
| English | 119 | 3.5% |
| European | 28 | 0.8% |
| German | 193 | 5.7% |
| Guamanian / Chamorro | 30 | 0.9% |
| Irish | 271 | 8.0% |
| Italian | 22 | 0.6% |
| Korean | 100 | 3.0% |
| Mexican | 1,151 | 34.1% |
| Palestinian | 178 | 5.3% |
| Portuguese | 77 | 2.3% |
| Puerto Rican | 40 | 1.2% |
| Salvadoran | 26 | 0.8% |
| Scotch-Irish | 22 | 0.6% |
| Scottish | 88 | 2.6% |
| Spaniard | 75 | 2.2% |
| Spanish | 303 | 9.0% |
| Spanish American | 16 | 0.5% |
| Swedish | 92 | 2.7% | View All 22 Rows |
Immigrants in Peralta
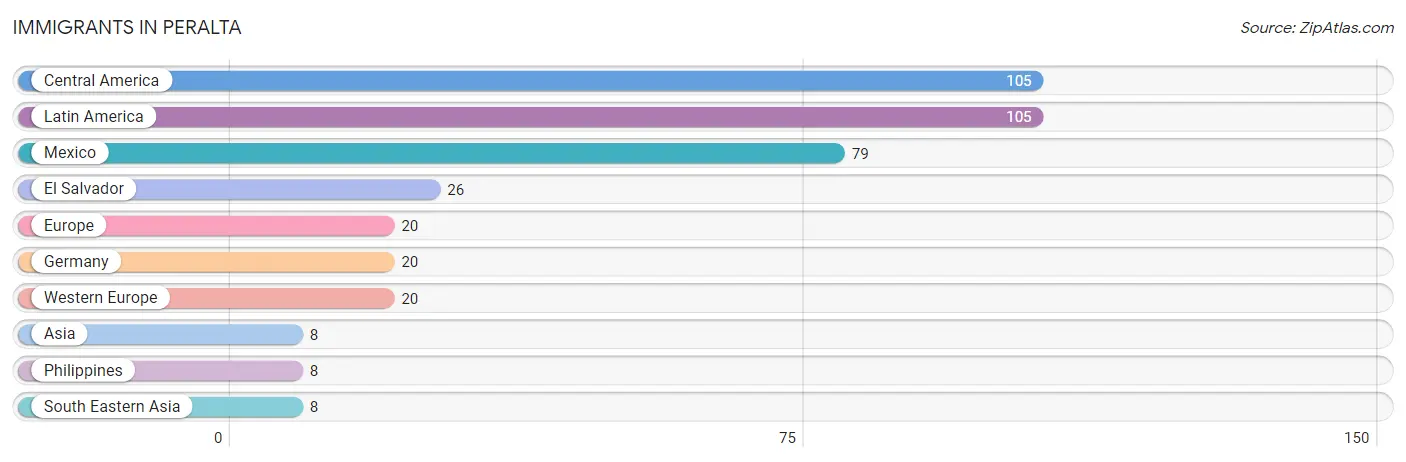
The most numerous immigrant groups reported in Peralta came from Central America (105 | 3.1%), Latin America (105 | 3.1%), Mexico (79 | 2.3%), El Salvador (26 | 0.8%), and Europe (20 | 0.6%), together accounting for 9.9% of all Peralta residents.
| Immigration Origin | # Population | % Population |
| Asia | 8 | 0.2% |
| Central America | 105 | 3.1% |
| El Salvador | 26 | 0.8% |
| Europe | 20 | 0.6% |
| Germany | 20 | 0.6% |
| Latin America | 105 | 3.1% |
| Mexico | 79 | 2.3% |
| Philippines | 8 | 0.2% |
| South Eastern Asia | 8 | 0.2% |
| Western Europe | 20 | 0.6% | View All 10 Rows |
Sex and Age in Peralta
Sex and Age in Peralta
The most populous age groups in Peralta are 5 to 9 Years (270 | 15.2%) for men and 60 to 64 Years (165 | 10.3%) for women.
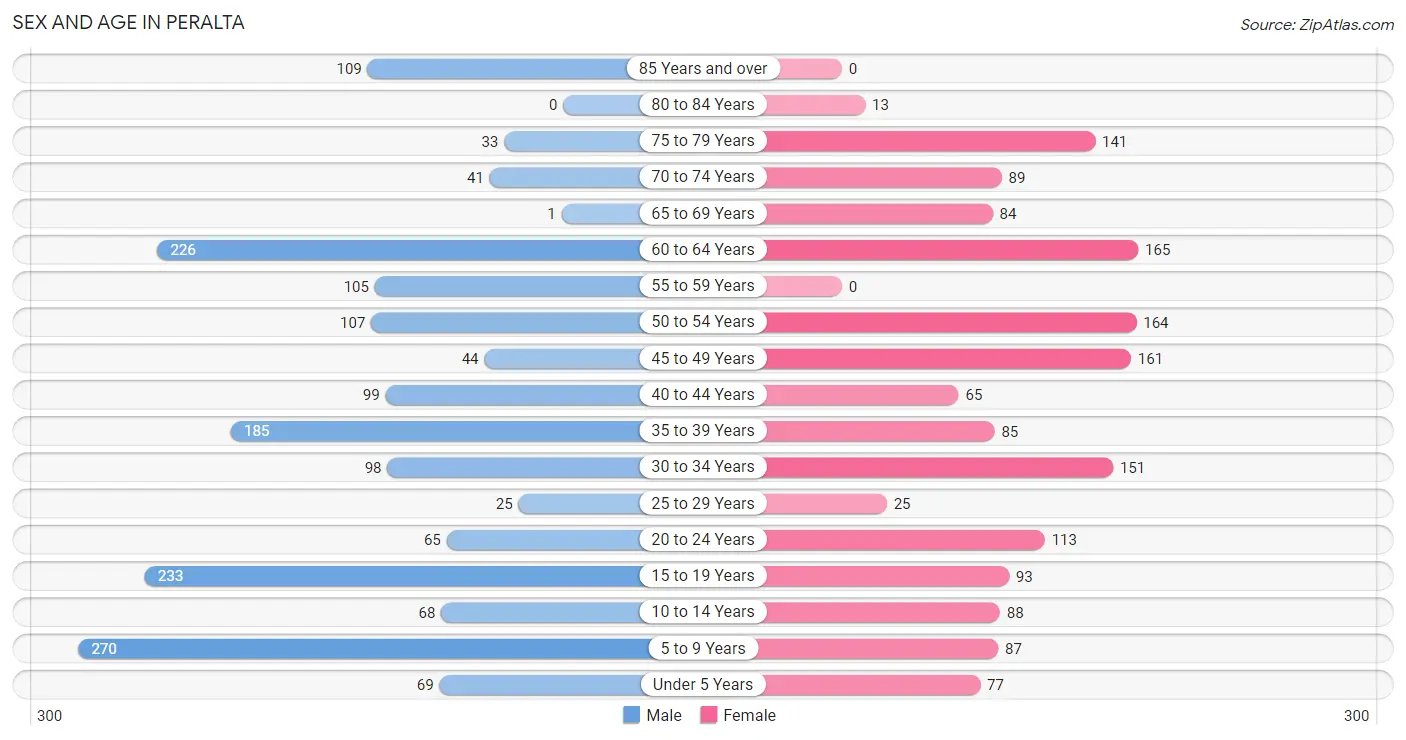
| Age Bracket | Male | Female |
| Under 5 Years | 69 (3.9%) | 77 (4.8%) |
| 5 to 9 Years | 270 (15.2%) | 87 (5.4%) |
| 10 to 14 Years | 68 (3.8%) | 88 (5.5%) |
| 15 to 19 Years | 233 (13.1%) | 93 (5.8%) |
| 20 to 24 Years | 65 (3.7%) | 113 (7.1%) |
| 25 to 29 Years | 25 (1.4%) | 25 (1.6%) |
| 30 to 34 Years | 98 (5.5%) | 151 (9.4%) |
| 35 to 39 Years | 185 (10.4%) | 85 (5.3%) |
| 40 to 44 Years | 99 (5.6%) | 65 (4.1%) |
| 45 to 49 Years | 44 (2.5%) | 161 (10.1%) |
| 50 to 54 Years | 107 (6.0%) | 164 (10.2%) |
| 55 to 59 Years | 105 (5.9%) | 0 (0.0%) |
| 60 to 64 Years | 226 (12.7%) | 165 (10.3%) |
| 65 to 69 Years | 1 (0.1%) | 84 (5.2%) |
| 70 to 74 Years | 41 (2.3%) | 89 (5.6%) |
| 75 to 79 Years | 33 (1.9%) | 141 (8.8%) |
| 80 to 84 Years | 0 (0.0%) | 13 (0.8%) |
| 85 Years and over | 109 (6.1%) | 0 (0.0%) |
| Total | 1,778 (100.0%) | 1,601 (100.0%) |
Families and Households in Peralta
Median Family Size in Peralta
The median family size in Peralta is 3.18 persons per family, with single male/father families (41 | 4.7%) accounting for the largest median family size of 4.95 persons per family. On the other hand, single female/mother families (187 | 21.6%) represent the smallest median family size with 2.65 persons per family.
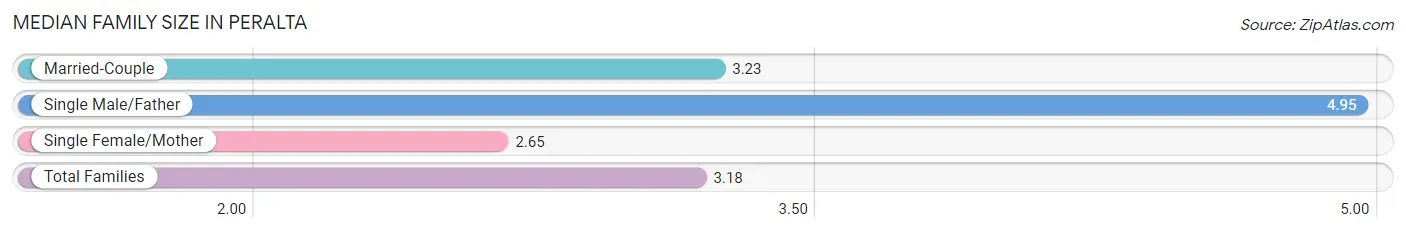
| Family Type | # Families | Family Size |
| Married-Couple | 639 (73.7%) | 3.23 |
| Single Male/Father | 41 (4.7%) | 4.95 |
| Single Female/Mother | 187 (21.6%) | 2.65 |
| Total Families | 867 (100.0%) | 3.18 |
Median Household Size in Peralta
The median household size in Peralta is 2.46 persons per household, with single male/father households (41 | 3.0%) accounting for the largest median household size of 4.95 persons per household. non-family households (507 | 36.9%) represent the smallest median household size with 1.22 persons per household.
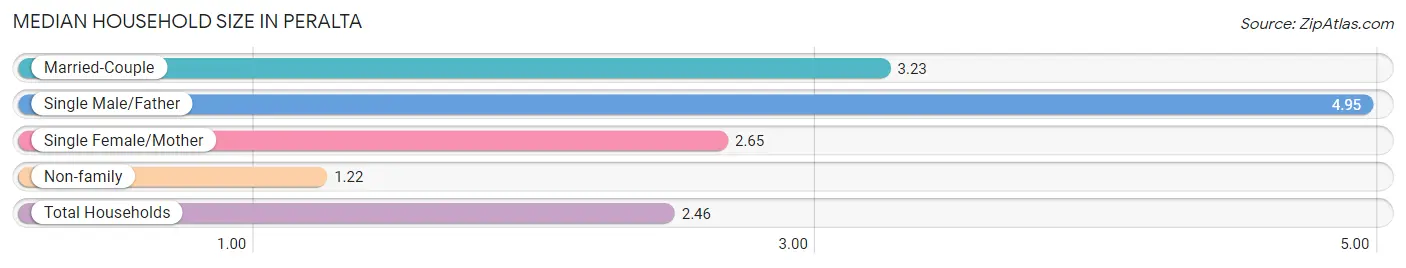
| Household Type | # Households | Household Size |
| Married-Couple | 639 (46.5%) | 3.23 |
| Single Male/Father | 41 (3.0%) | 4.95 |
| Single Female/Mother | 187 (13.6%) | 2.65 |
| Non-family | 507 (36.9%) | 1.22 |
| Total Households | 1,374 (100.0%) | 2.46 |
Household Size by Marriage Status in Peralta
Out of a total of 1,374 households in Peralta, 867 (63.1%) are family households, while 507 (36.9%) are nonfamily households. The most numerous type of family households are 2-person households, comprising 496, and the most common type of nonfamily households are 1-person households, comprising 476.
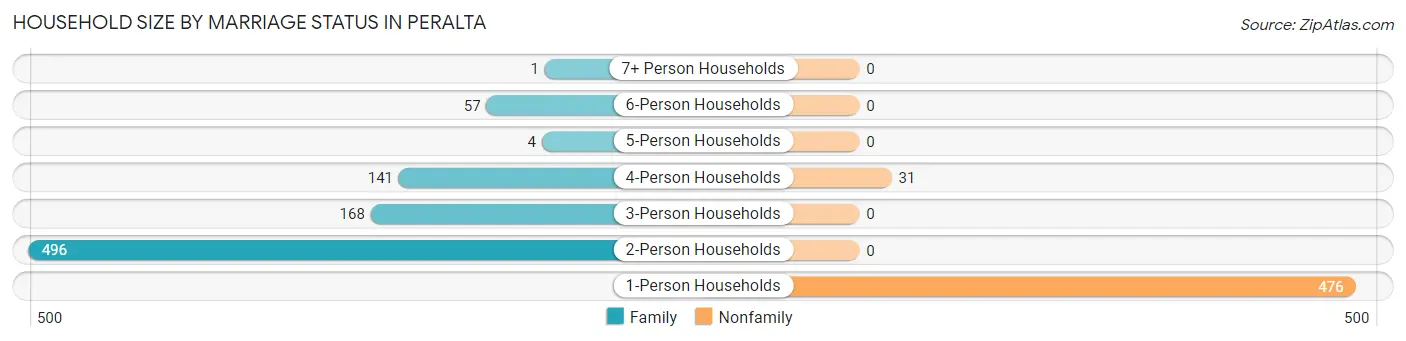
| Household Size | Family Households | Nonfamily Households |
| 1-Person Households | - | 476 (34.6%) |
| 2-Person Households | 496 (36.1%) | 0 (0.0%) |
| 3-Person Households | 168 (12.2%) | 0 (0.0%) |
| 4-Person Households | 141 (10.3%) | 31 (2.3%) |
| 5-Person Households | 4 (0.3%) | 0 (0.0%) |
| 6-Person Households | 57 (4.2%) | 0 (0.0%) |
| 7+ Person Households | 1 (0.1%) | 0 (0.0%) |
| Total | 867 (63.1%) | 507 (36.9%) |
Female Fertility in Peralta
Fertility by Age in Peralta
| Age Bracket | Women with Births | Births / 1,000 Women |
| 15 to 19 years | 0 (0.0%) | 0.0 |
| 20 to 34 years | 0 (0.0%) | 0.0 |
| 35 to 50 years | 0 (0.0%) | 0.0 |
| Total | 0 (0.0%) | 0.0 |
Fertility by Age by Marriage Status in Peralta
| Age Bracket | Married | Unmarried |
| 15 to 19 years | 0 (0.0%) | 0 (0.0%) |
| 20 to 34 years | 0 (0.0%) | 0 (0.0%) |
| 35 to 50 years | 0 (0.0%) | 0 (0.0%) |
| Total | 0 (0.0%) | 0 (0.0%) |
Fertility by Education in Peralta
| Educational Attainment | Women with Births | Births / 1,000 Women |
| Less than High School | 0 (0.0%) | 0.0 |
| High School Diploma | 0 (0.0%) | 0.0 |
| College or Associate's Degree | 0 (0.0%) | 0.0 |
| Bachelor's Degree | 0 (0.0%) | 0.0 |
| Graduate Degree | 0 (0.0%) | 0.0 |
| Total | 0 (0.0%) | 0.0 |
Fertility by Education by Marriage Status in Peralta
| Educational Attainment | Married | Unmarried |
| Less than High School | 0 (0.0%) | 0 (0.0%) |
| High School Diploma | 0 (0.0%) | 0 (0.0%) |
| College or Associate's Degree | 0 (0.0%) | 0 (0.0%) |
| Bachelor's Degree | 0 (0.0%) | 0 (0.0%) |
| Graduate Degree | 0 (0.0%) | 0 (0.0%) |
| Total | 0 (0.0%) | 0 (0.0%) |
Employment Characteristics in Peralta
Employment by Class of Employer in Peralta
Among the 1,397 employed individuals in Peralta, private company employees (892 | 63.8%), not-for-profit organizations (132 | 9.5%), and federal government employees (129 | 9.2%) make up the most common classes of employment.
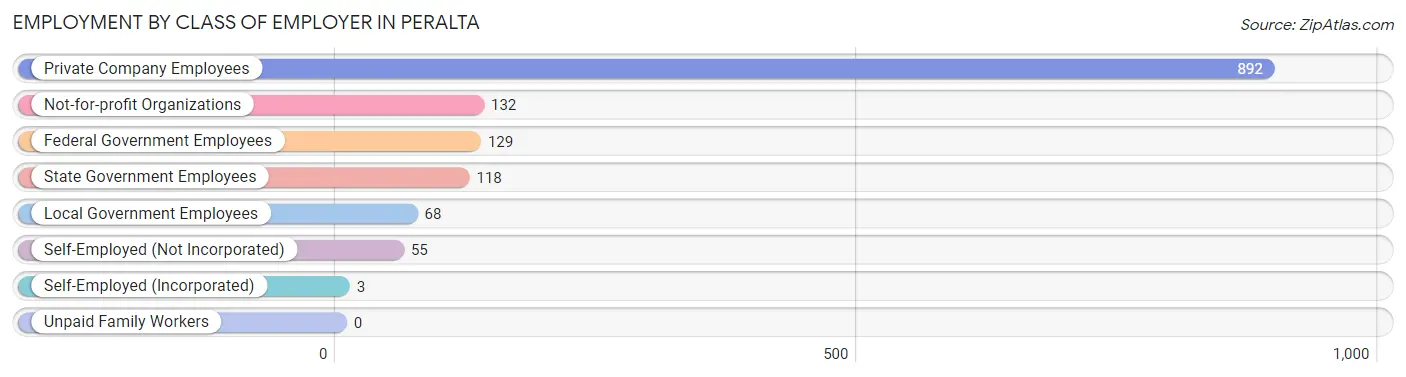
| Employer Class | # Employees | % Employees |
| Private Company Employees | 892 | 63.8% |
| Self-Employed (Incorporated) | 3 | 0.2% |
| Self-Employed (Not Incorporated) | 55 | 3.9% |
| Not-for-profit Organizations | 132 | 9.5% |
| Local Government Employees | 68 | 4.9% |
| State Government Employees | 118 | 8.5% |
| Federal Government Employees | 129 | 9.2% |
| Unpaid Family Workers | 0 | 0.0% |
| Total | 1,397 | 100.0% |
Employment Status by Age in Peralta
According to the labor force statistics for Peralta, out of the total population over 16 years of age (2,639), 59.7% or 1,575 individuals are in the labor force, with 11.3% or 178 of them unemployed. The age group with the highest labor force participation rate is 20 to 24 years, with 100.0% or 178 individuals in the labor force. Within the labor force, the 16 to 19 years age range has the highest percentage of unemployed individuals, with 100.0% or 57 of them being unemployed.
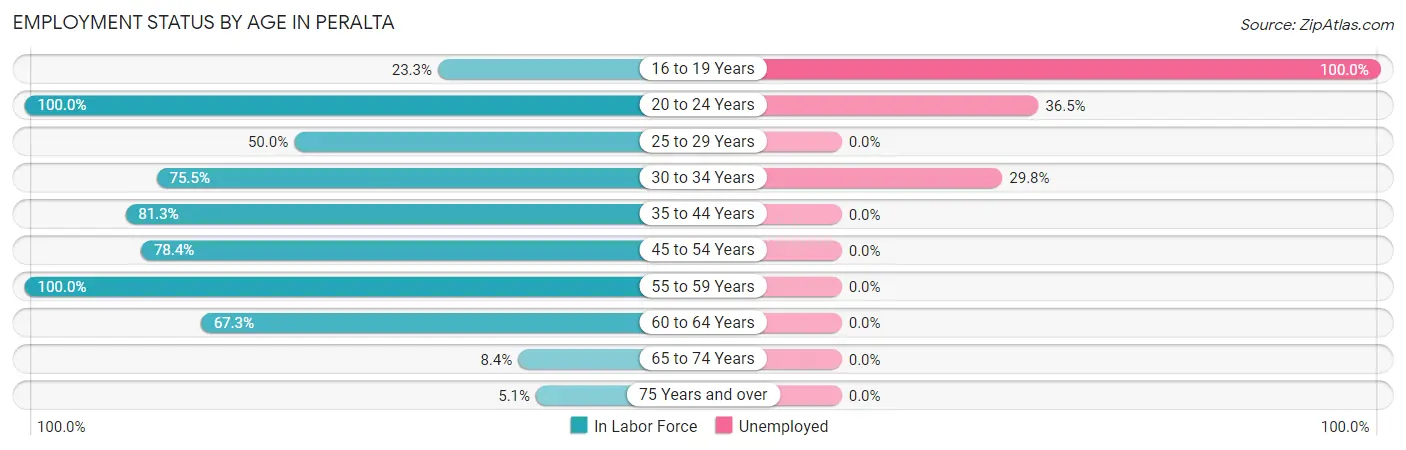
| Age Bracket | In Labor Force | Unemployed |
| 16 to 19 Years | 57 (23.3%) | 57 (100.0%) |
| 20 to 24 Years | 178 (100.0%) | 65 (36.5%) |
| 25 to 29 Years | 25 (50.0%) | 0 (0.0%) |
| 30 to 34 Years | 188 (75.5%) | 56 (29.8%) |
| 35 to 44 Years | 353 (81.3%) | 0 (0.0%) |
| 45 to 54 Years | 373 (78.4%) | 0 (0.0%) |
| 55 to 59 Years | 105 (100.0%) | 0 (0.0%) |
| 60 to 64 Years | 263 (67.3%) | 0 (0.0%) |
| 65 to 74 Years | 18 (8.4%) | 0 (0.0%) |
| 75 Years and over | 15 (5.1%) | 0 (0.0%) |
| Total | 1,575 (59.7%) | 178 (11.3%) |
Employment Status by Educational Attainment in Peralta
According to labor force statistics for Peralta, 76.7% of individuals (1,308) out of the total population between 25 and 64 years of age (1,705) are in the labor force, with 4.3% or 56 of them being unemployed. The group with the highest labor force participation rate are those with the educational attainment of college / associate degree, with 81.4% or 507 individuals in the labor force. Within the labor force, individuals with bachelor's degree or higher education have the highest percentage of unemployment, with 13.0% or 56 of them being unemployed.
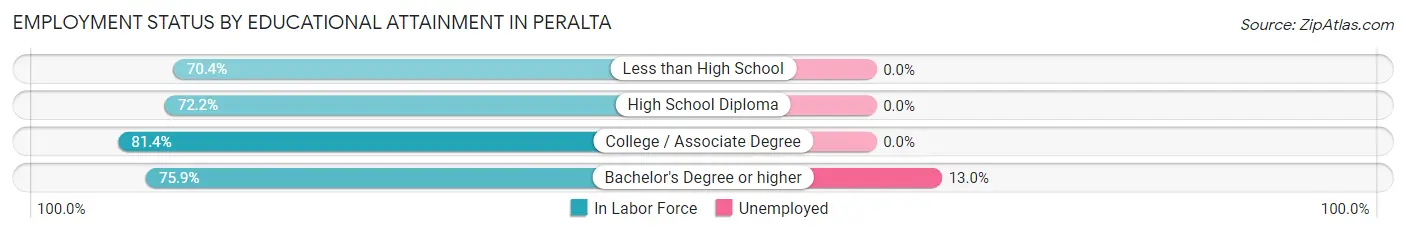
| Educational Attainment | In Labor Force | Unemployed |
| Less than High School | 88 (70.4%) | 0 (0.0%) |
| High School Diploma | 280 (72.2%) | 0 (0.0%) |
| College / Associate Degree | 507 (81.4%) | 0 (0.0%) |
| Bachelor's Degree or higher | 432 (75.9%) | 74 (13.0%) |
| Total | 1,308 (76.7%) | 73 (4.3%) |
Employment Occupations by Sex in Peralta
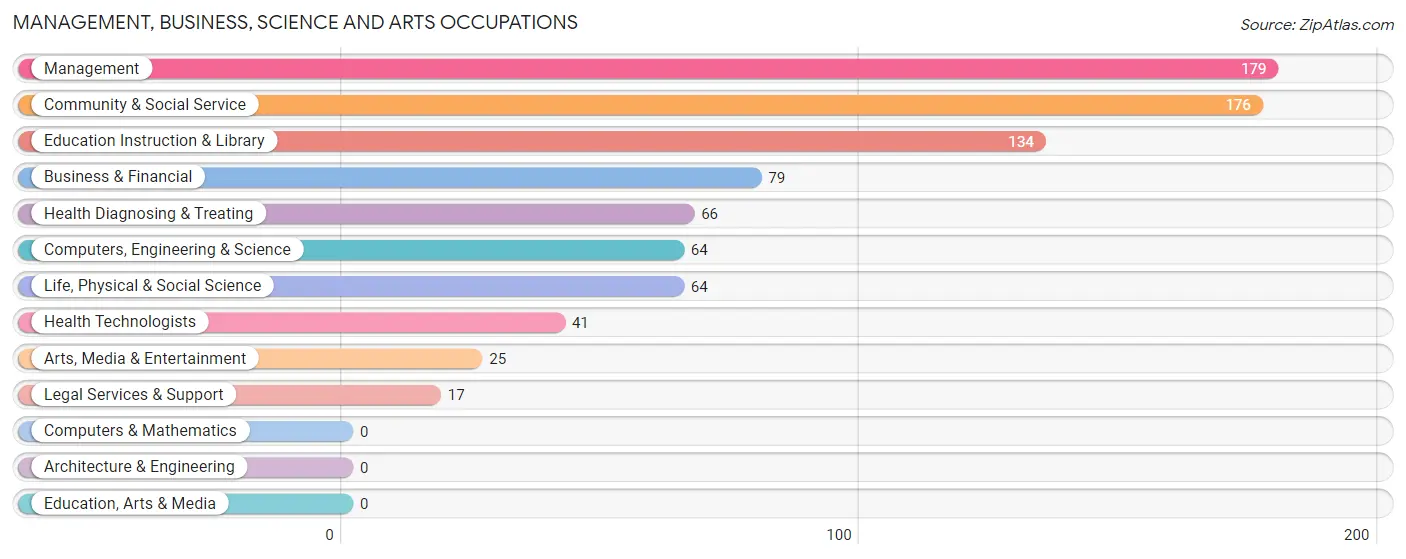
Management, Business, Science and Arts Occupations
The most common Management, Business, Science and Arts occupations in Peralta are Management (179 | 12.8%), Community & Social Service (176 | 12.6%), Education Instruction & Library (134 | 9.6%), Business & Financial (79 | 5.7%), and Health Diagnosing & Treating (66 | 4.7%).
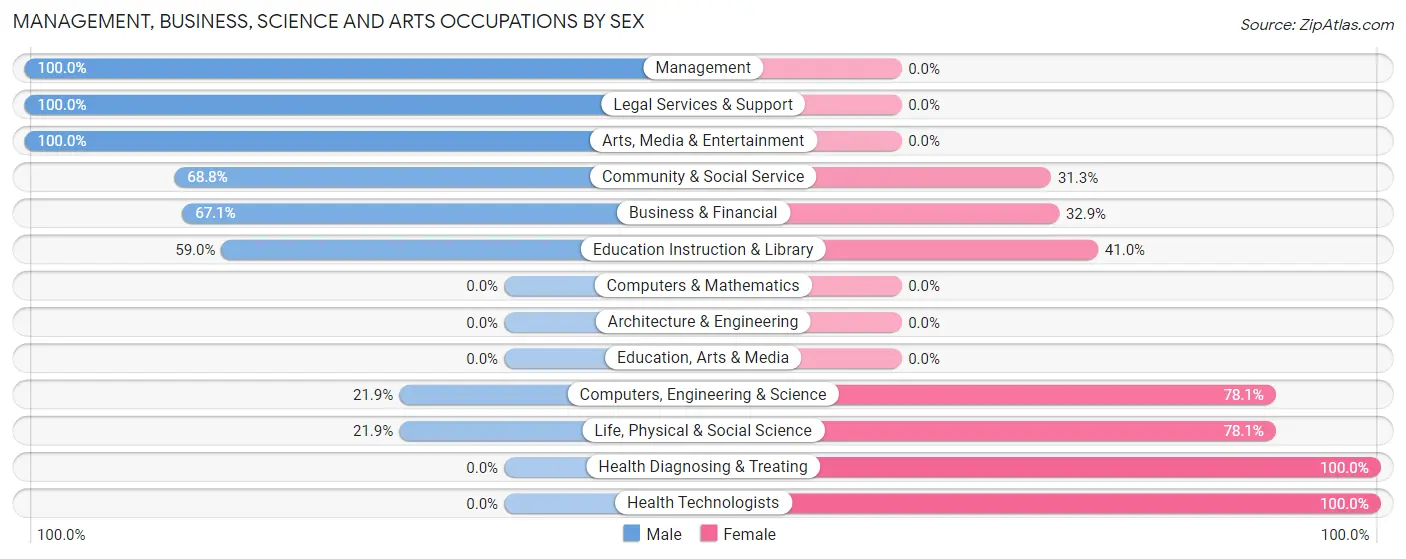
Management, Business, Science and Arts Occupations by Sex
Within the Management, Business, Science and Arts occupations in Peralta, the most male-oriented occupations are Management (100.0%), Legal Services & Support (100.0%), and Arts, Media & Entertainment (100.0%), while the most female-oriented occupations are Health Diagnosing & Treating (100.0%), Health Technologists (100.0%), and Computers, Engineering & Science (78.1%).
| Occupation | Male | Female |
| Management | 179 (100.0%) | 0 (0.0%) |
| Business & Financial | 53 (67.1%) | 26 (32.9%) |
| Computers, Engineering & Science | 14 (21.9%) | 50 (78.1%) |
| Computers & Mathematics | 0 (0.0%) | 0 (0.0%) |
| Architecture & Engineering | 0 (0.0%) | 0 (0.0%) |
| Life, Physical & Social Science | 14 (21.9%) | 50 (78.1%) |
| Community & Social Service | 121 (68.8%) | 55 (31.2%) |
| Education, Arts & Media | 0 (0.0%) | 0 (0.0%) |
| Legal Services & Support | 17 (100.0%) | 0 (0.0%) |
| Education Instruction & Library | 79 (59.0%) | 55 (41.0%) |
| Arts, Media & Entertainment | 25 (100.0%) | 0 (0.0%) |
| Health Diagnosing & Treating | 0 (0.0%) | 66 (100.0%) |
| Health Technologists | 0 (0.0%) | 41 (100.0%) |
| Total (Category) | 367 (65.1%) | 197 (34.9%) |
| Total (Overall) | 647 (46.3%) | 750 (53.7%) |
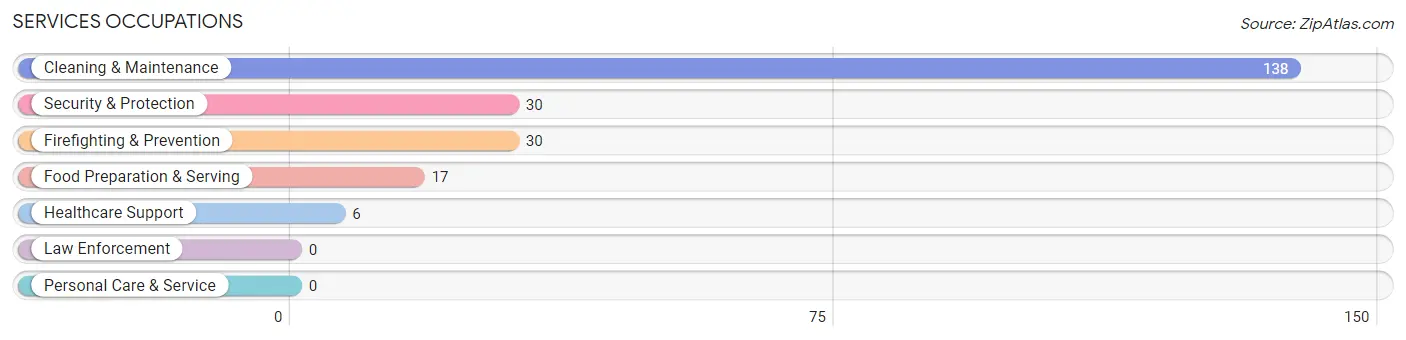
Services Occupations
The most common Services occupations in Peralta are Cleaning & Maintenance (138 | 9.9%), Security & Protection (30 | 2.1%), Firefighting & Prevention (30 | 2.1%), Food Preparation & Serving (17 | 1.2%), and Healthcare Support (6 | 0.4%).
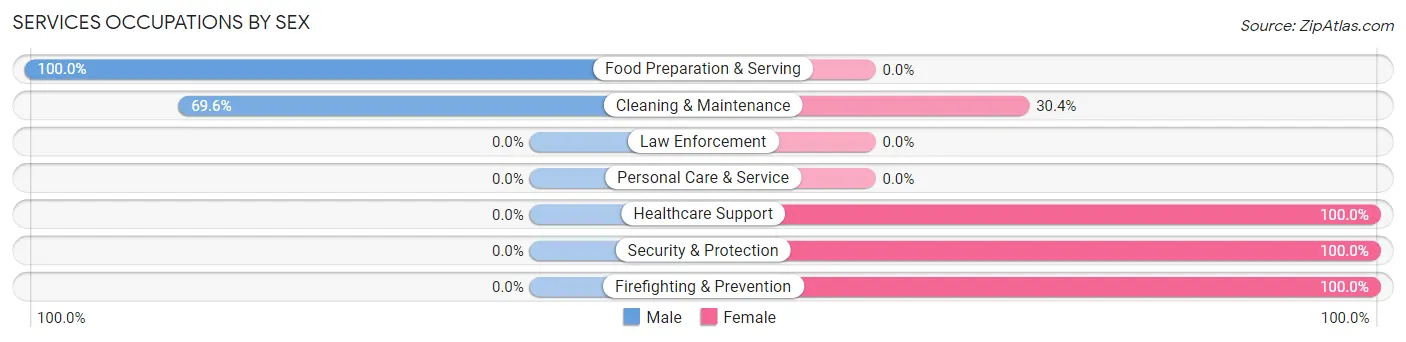
Services Occupations by Sex
Within the Services occupations in Peralta, the most male-oriented occupations are Food Preparation & Serving (100.0%), and Cleaning & Maintenance (69.6%), while the most female-oriented occupations are Healthcare Support (100.0%), Security & Protection (100.0%), and Firefighting & Prevention (100.0%).
| Occupation | Male | Female |
| Healthcare Support | 0 (0.0%) | 6 (100.0%) |
| Security & Protection | 0 (0.0%) | 30 (100.0%) |
| Firefighting & Prevention | 0 (0.0%) | 30 (100.0%) |
| Law Enforcement | 0 (0.0%) | 0 (0.0%) |
| Food Preparation & Serving | 17 (100.0%) | 0 (0.0%) |
| Cleaning & Maintenance | 96 (69.6%) | 42 (30.4%) |
| Personal Care & Service | 0 (0.0%) | 0 (0.0%) |
| Total (Category) | 113 (59.2%) | 78 (40.8%) |
| Total (Overall) | 647 (46.3%) | 750 (53.7%) |
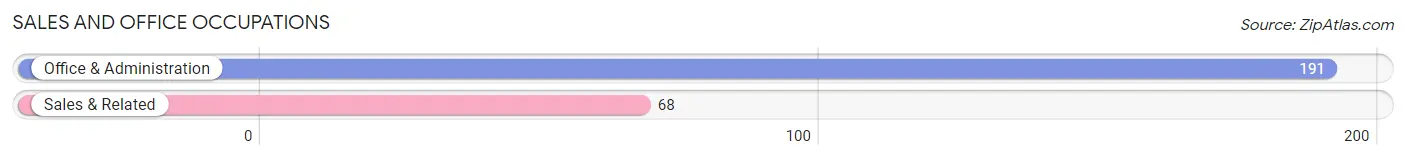
Sales and Office Occupations
The most common Sales and Office occupations in Peralta are Office & Administration (191 | 13.7%), and Sales & Related (68 | 4.9%).
Sales and Office Occupations by Sex
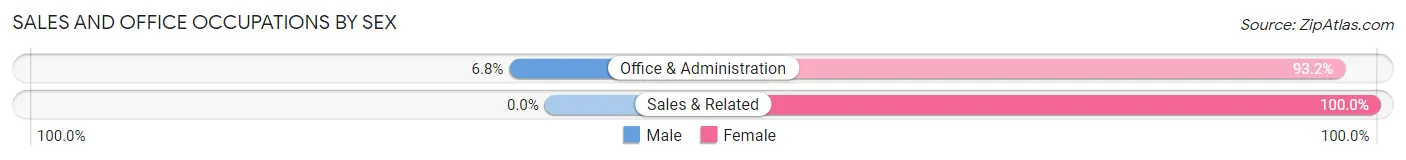
| Occupation | Male | Female |
| Sales & Related | 0 (0.0%) | 68 (100.0%) |
| Office & Administration | 13 (6.8%) | 178 (93.2%) |
| Total (Category) | 13 (5.0%) | 246 (95.0%) |
| Total (Overall) | 647 (46.3%) | 750 (53.7%) |
Natural Resources, Construction and Maintenance Occupations
The most common Natural Resources, Construction and Maintenance occupations in Peralta are Farming, Fishing & Forestry (77 | 5.5%), Installation, Maintenance & Repair (55 | 3.9%), and Construction & Extraction (44 | 3.2%).
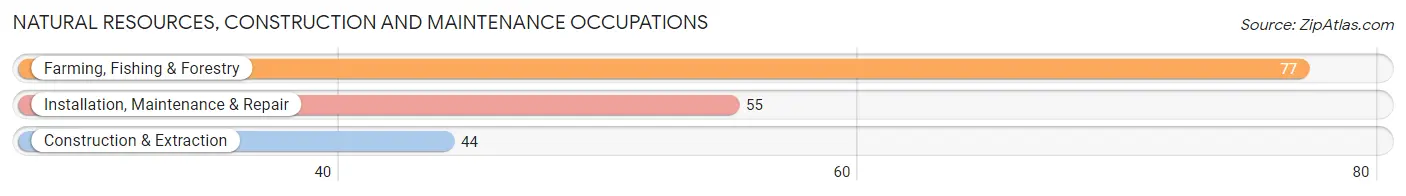
Natural Resources, Construction and Maintenance Occupations by Sex
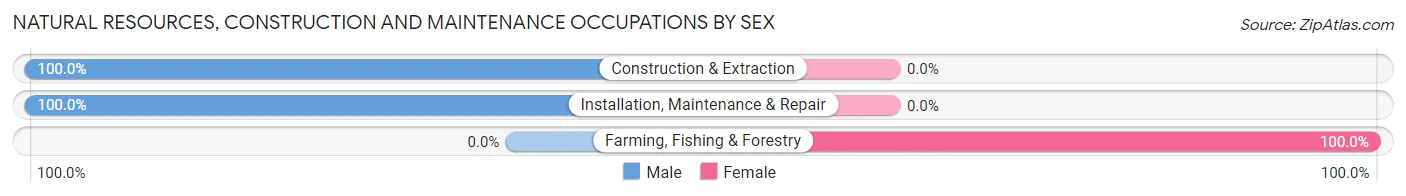
| Occupation | Male | Female |
| Farming, Fishing & Forestry | 0 (0.0%) | 77 (100.0%) |
| Construction & Extraction | 44 (100.0%) | 0 (0.0%) |
| Installation, Maintenance & Repair | 55 (100.0%) | 0 (0.0%) |
| Total (Category) | 99 (56.2%) | 77 (43.8%) |
| Total (Overall) | 647 (46.3%) | 750 (53.7%) |
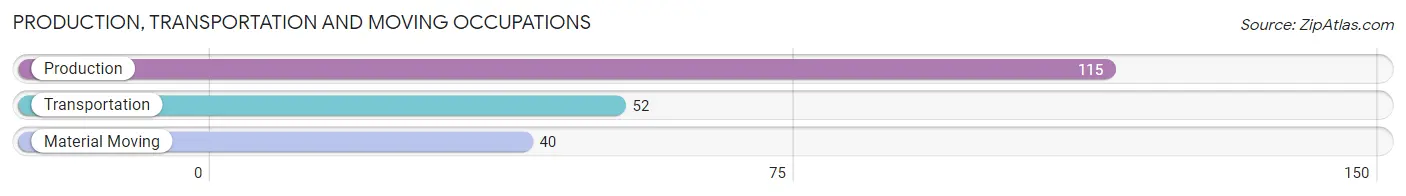
Production, Transportation and Moving Occupations
The most common Production, Transportation and Moving occupations in Peralta are Production (115 | 8.2%), Transportation (52 | 3.7%), and Material Moving (40 | 2.9%).
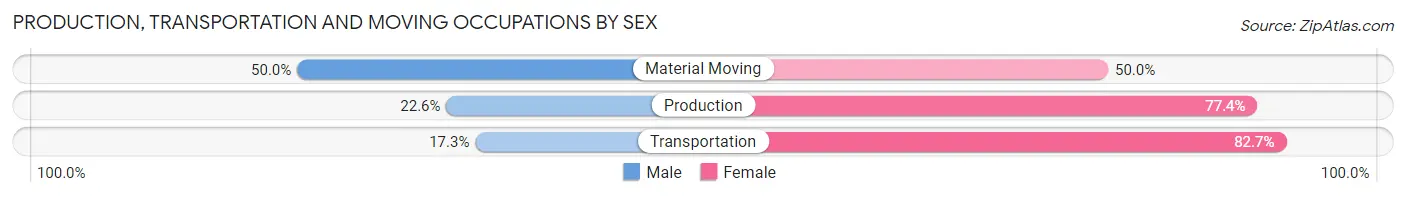
Production, Transportation and Moving Occupations by Sex
| Occupation | Male | Female |
| Production | 26 (22.6%) | 89 (77.4%) |
| Transportation | 9 (17.3%) | 43 (82.7%) |
| Material Moving | 20 (50.0%) | 20 (50.0%) |
| Total (Category) | 55 (26.6%) | 152 (73.4%) |
| Total (Overall) | 647 (46.3%) | 750 (53.7%) |
Employment Industries by Sex in Peralta
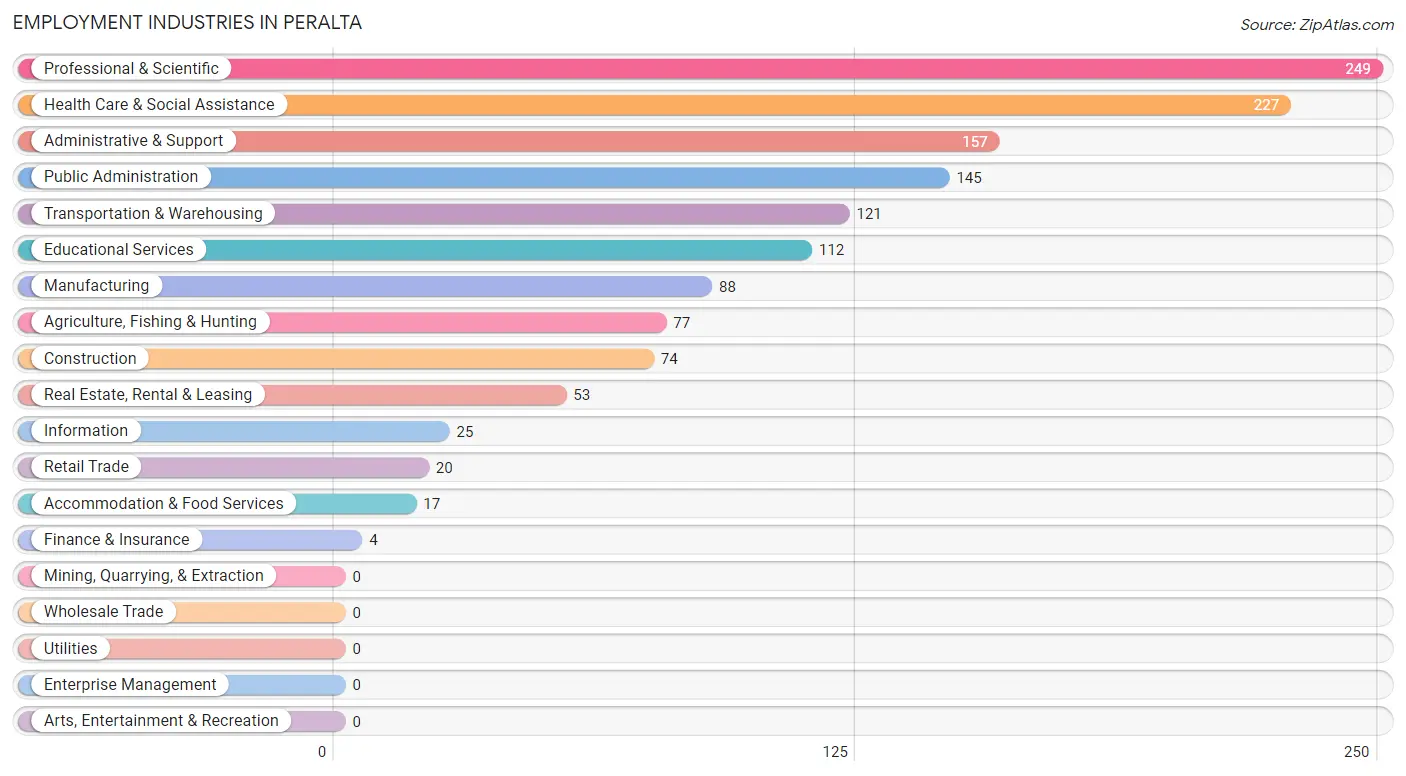
Employment Industries in Peralta
The major employment industries in Peralta include Professional & Scientific (249 | 17.8%), Health Care & Social Assistance (227 | 16.3%), Administrative & Support (157 | 11.2%), Public Administration (145 | 10.4%), and Transportation & Warehousing (121 | 8.7%).
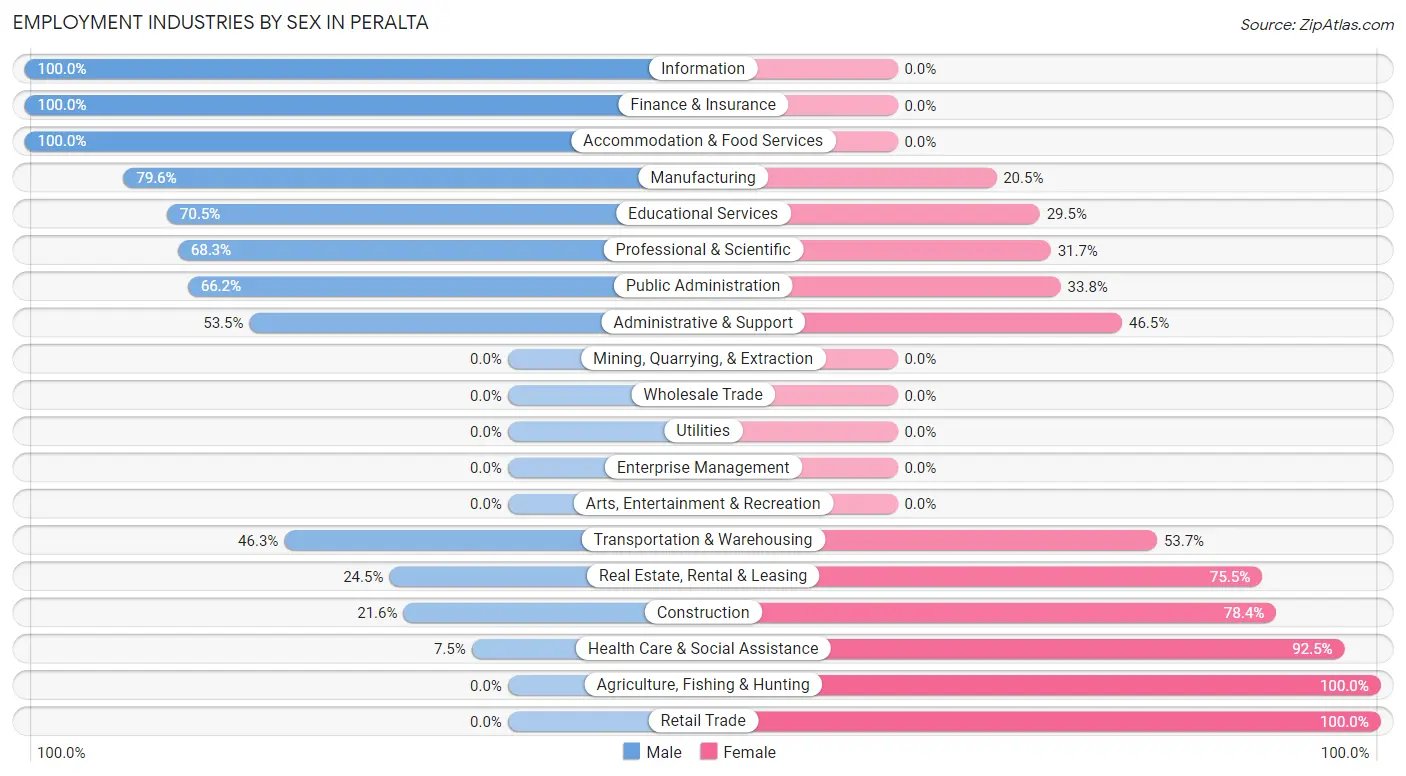
Employment Industries by Sex in Peralta
The Peralta industries that see more men than women are Information (100.0%), Finance & Insurance (100.0%), and Accommodation & Food Services (100.0%), whereas the industries that tend to have a higher number of women are Agriculture, Fishing & Hunting (100.0%), Retail Trade (100.0%), and Health Care & Social Assistance (92.5%).
| Industry | Male | Female |
| Agriculture, Fishing & Hunting | 0 (0.0%) | 77 (100.0%) |
| Mining, Quarrying, & Extraction | 0 (0.0%) | 0 (0.0%) |
| Construction | 16 (21.6%) | 58 (78.4%) |
| Manufacturing | 70 (79.5%) | 18 (20.4%) |
| Wholesale Trade | 0 (0.0%) | 0 (0.0%) |
| Retail Trade | 0 (0.0%) | 20 (100.0%) |
| Transportation & Warehousing | 56 (46.3%) | 65 (53.7%) |
| Utilities | 0 (0.0%) | 0 (0.0%) |
| Information | 25 (100.0%) | 0 (0.0%) |
| Finance & Insurance | 4 (100.0%) | 0 (0.0%) |
| Real Estate, Rental & Leasing | 13 (24.5%) | 40 (75.5%) |
| Professional & Scientific | 170 (68.3%) | 79 (31.7%) |
| Enterprise Management | 0 (0.0%) | 0 (0.0%) |
| Administrative & Support | 84 (53.5%) | 73 (46.5%) |
| Educational Services | 79 (70.5%) | 33 (29.5%) |
| Health Care & Social Assistance | 17 (7.5%) | 210 (92.5%) |
| Arts, Entertainment & Recreation | 0 (0.0%) | 0 (0.0%) |
| Accommodation & Food Services | 17 (100.0%) | 0 (0.0%) |
| Public Administration | 96 (66.2%) | 49 (33.8%) |
| Total | 647 (46.3%) | 750 (53.7%) |
Education in Peralta
School Enrollment in Peralta
The most common levels of schooling among the 834 students in Peralta are elementary school (270 | 32.4%), high school (218 | 26.1%), and middle school (146 | 17.5%).
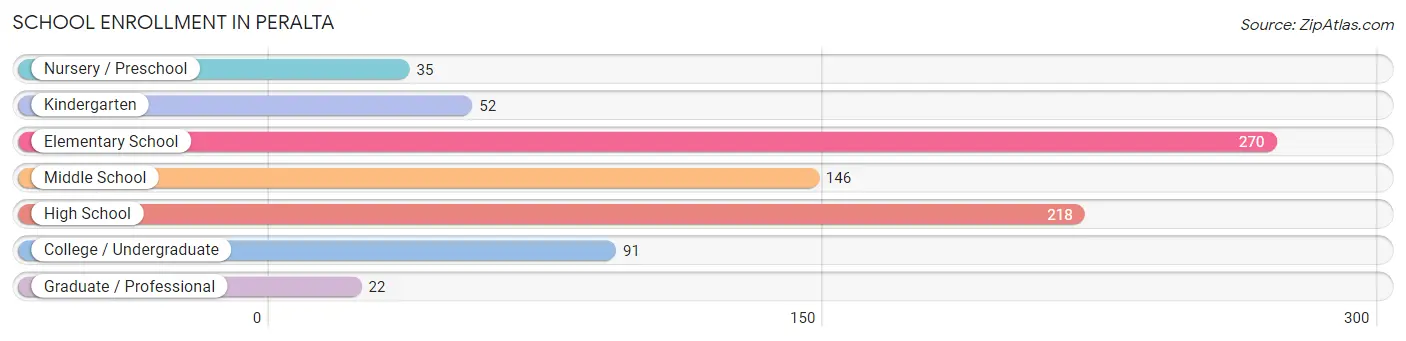
| School Level | # Students | % Students |
| Nursery / Preschool | 35 | 4.2% |
| Kindergarten | 52 | 6.2% |
| Elementary School | 270 | 32.4% |
| Middle School | 146 | 17.5% |
| High School | 218 | 26.1% |
| College / Undergraduate | 91 | 10.9% |
| Graduate / Professional | 22 | 2.6% |
| Total | 834 | 100.0% |
School Enrollment by Age by Funding Source in Peralta
Out of a total of 834 students who are enrolled in schools in Peralta, 41 (4.9%) attend a private institution, while the remaining 793 (95.1%) are enrolled in public schools. The age group of 15 to 17 year olds has the highest likelihood of being enrolled in private schools, with 23 (18.0% in the age bracket) enrolled. Conversely, the age group of 10 to 14 year olds has the lowest likelihood of being enrolled in a private school, with 156 (100.0% in the age bracket) attending a public institution.
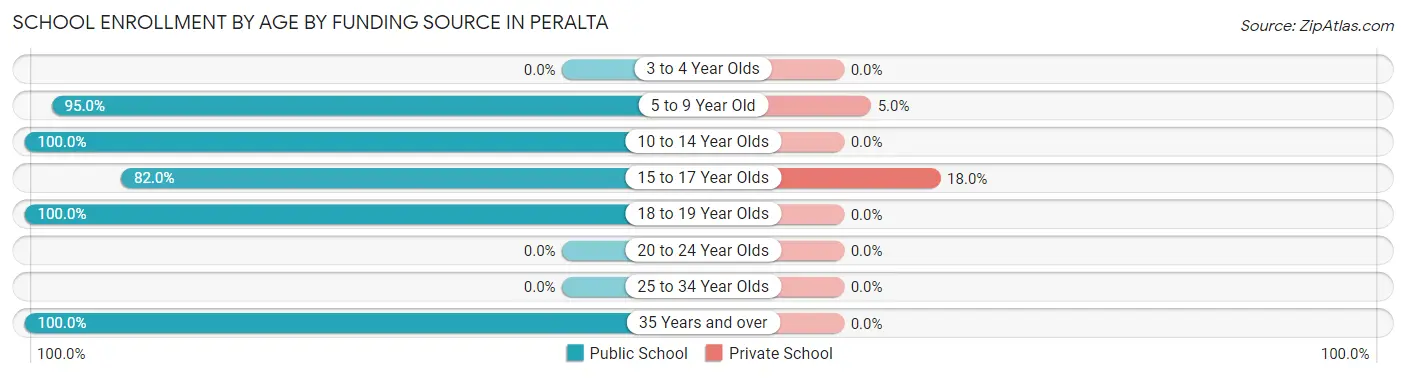
| Age Bracket | Public School | Private School |
| 3 to 4 Year Olds | 0 (0.0%) | 0 (0.0%) |
| 5 to 9 Year Old | 339 (95.0%) | 18 (5.0%) |
| 10 to 14 Year Olds | 156 (100.0%) | 0 (0.0%) |
| 15 to 17 Year Olds | 105 (82.0%) | 23 (18.0%) |
| 18 to 19 Year Olds | 80 (100.0%) | 0 (0.0%) |
| 20 to 24 Year Olds | 0 (0.0%) | 0 (0.0%) |
| 25 to 34 Year Olds | 0 (0.0%) | 0 (0.0%) |
| 35 Years and over | 113 (100.0%) | 0 (0.0%) |
| Total | 793 (95.1%) | 41 (4.9%) |
Educational Attainment by Field of Study in Peralta
Business (148 | 21.6%), social sciences (120 | 17.5%), bio, nature & agricultural (77 | 11.3%), education (73 | 10.7%), and visual & performing arts (73 | 10.7%) are the most common fields of study among 684 individuals in Peralta who have obtained a bachelor's degree or higher.
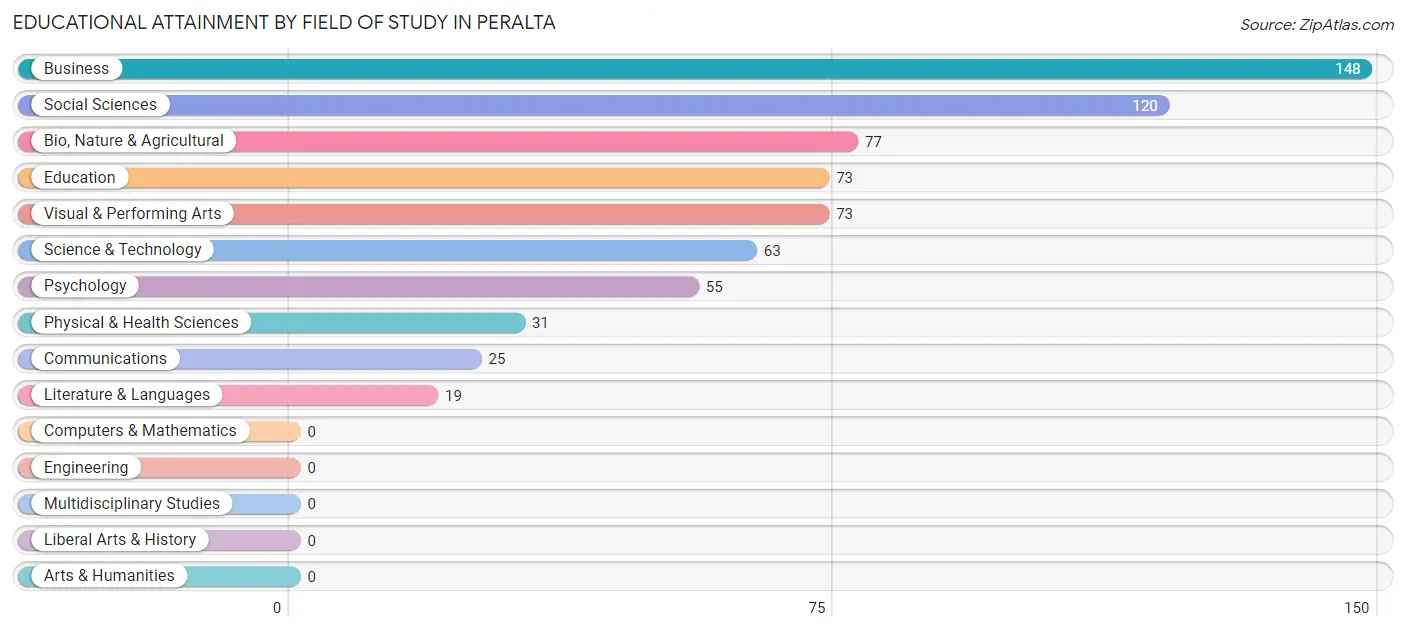
| Field of Study | # Graduates | % Graduates |
| Computers & Mathematics | 0 | 0.0% |
| Bio, Nature & Agricultural | 77 | 11.3% |
| Physical & Health Sciences | 31 | 4.5% |
| Psychology | 55 | 8.0% |
| Social Sciences | 120 | 17.5% |
| Engineering | 0 | 0.0% |
| Multidisciplinary Studies | 0 | 0.0% |
| Science & Technology | 63 | 9.2% |
| Business | 148 | 21.6% |
| Education | 73 | 10.7% |
| Literature & Languages | 19 | 2.8% |
| Liberal Arts & History | 0 | 0.0% |
| Visual & Performing Arts | 73 | 10.7% |
| Communications | 25 | 3.6% |
| Arts & Humanities | 0 | 0.0% |
| Total | 684 | 100.0% |
Transportation & Commute in Peralta
Vehicle Availability by Sex in Peralta
The most prevalent vehicle ownership categories in Peralta are males with 2 vehicles (217, accounting for 33.5%) and females with 2 vehicles (220, making up 28.9%).
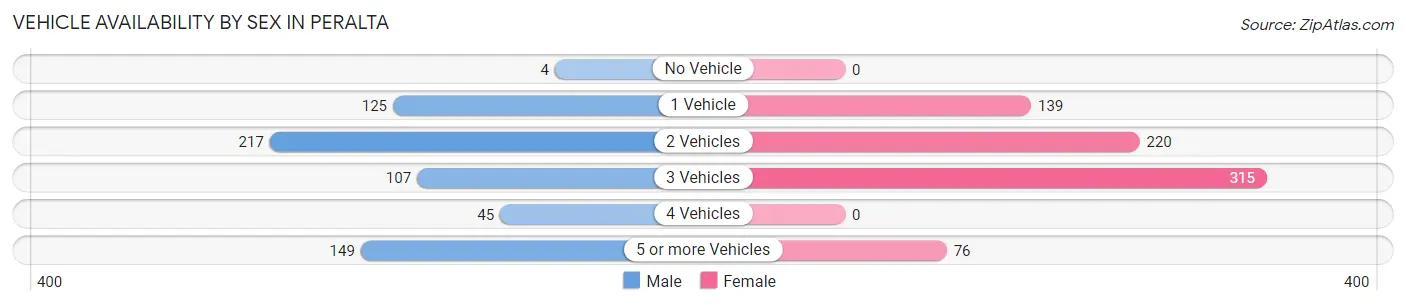
| Vehicles Available | Male | Female |
| No Vehicle | 4 (0.6%) | 0 (0.0%) |
| 1 Vehicle | 125 (19.3%) | 139 (18.5%) |
| 2 Vehicles | 217 (33.5%) | 220 (29.3%) |
| 3 Vehicles | 107 (16.5%) | 315 (42.0%) |
| 4 Vehicles | 45 (7.0%) | 0 (0.0%) |
| 5 or more Vehicles | 149 (23.0%) | 76 (10.1%) |
| Total | 647 (100.0%) | 750 (100.0%) |
Commute Time in Peralta
The most frequently occuring commute durations in Peralta are 45 to 59 minutes (438 commuters, 31.5%), 30 to 34 minutes (370 commuters, 26.6%), and 15 to 19 minutes (211 commuters, 15.2%).
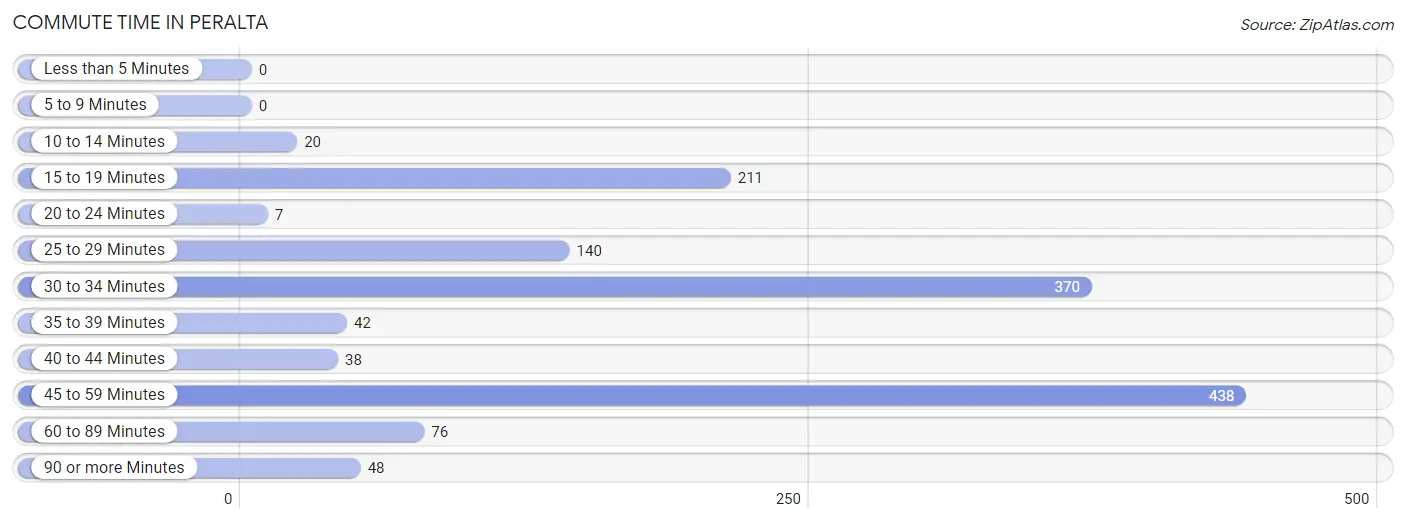
| Commute Time | # Commuters | % Commuters |
| Less than 5 Minutes | 0 | 0.0% |
| 5 to 9 Minutes | 0 | 0.0% |
| 10 to 14 Minutes | 20 | 1.4% |
| 15 to 19 Minutes | 211 | 15.2% |
| 20 to 24 Minutes | 7 | 0.5% |
| 25 to 29 Minutes | 140 | 10.1% |
| 30 to 34 Minutes | 370 | 26.6% |
| 35 to 39 Minutes | 42 | 3.0% |
| 40 to 44 Minutes | 38 | 2.7% |
| 45 to 59 Minutes | 438 | 31.5% |
| 60 to 89 Minutes | 76 | 5.5% |
| 90 or more Minutes | 48 | 3.5% |
Commute Time by Sex in Peralta
The most common commute times in Peralta are 45 to 59 minutes (240 commuters, 37.1%) for males and 45 to 59 minutes (198 commuters, 26.7%) for females.
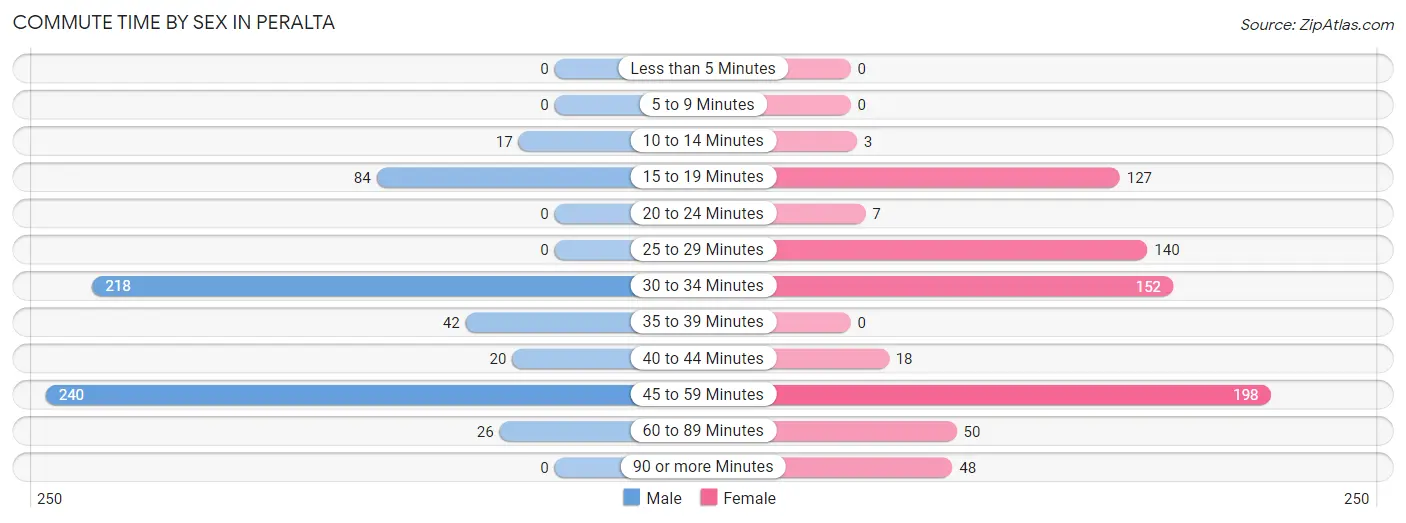
| Commute Time | Male | Female |
| Less than 5 Minutes | 0 (0.0%) | 0 (0.0%) |
| 5 to 9 Minutes | 0 (0.0%) | 0 (0.0%) |
| 10 to 14 Minutes | 17 (2.6%) | 3 (0.4%) |
| 15 to 19 Minutes | 84 (13.0%) | 127 (17.1%) |
| 20 to 24 Minutes | 0 (0.0%) | 7 (0.9%) |
| 25 to 29 Minutes | 0 (0.0%) | 140 (18.8%) |
| 30 to 34 Minutes | 218 (33.7%) | 152 (20.5%) |
| 35 to 39 Minutes | 42 (6.5%) | 0 (0.0%) |
| 40 to 44 Minutes | 20 (3.1%) | 18 (2.4%) |
| 45 to 59 Minutes | 240 (37.1%) | 198 (26.7%) |
| 60 to 89 Minutes | 26 (4.0%) | 50 (6.7%) |
| 90 or more Minutes | 0 (0.0%) | 48 (6.5%) |
Time of Departure to Work by Sex in Peralta
The most frequent times of departure to work in Peralta are 7:00 AM to 7:29 AM (198, 30.6%) for males and 7:00 AM to 7:29 AM (145, 19.5%) for females.
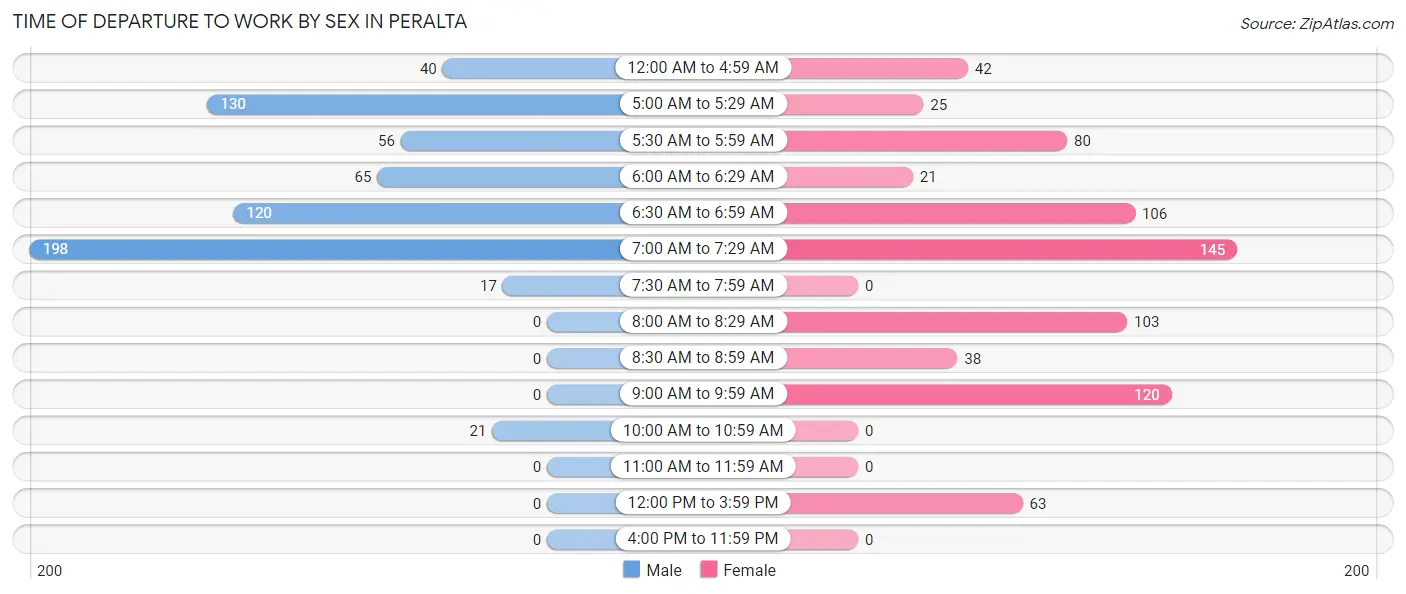
| Time of Departure | Male | Female |
| 12:00 AM to 4:59 AM | 40 (6.2%) | 42 (5.7%) |
| 5:00 AM to 5:29 AM | 130 (20.1%) | 25 (3.4%) |
| 5:30 AM to 5:59 AM | 56 (8.7%) | 80 (10.8%) |
| 6:00 AM to 6:29 AM | 65 (10.1%) | 21 (2.8%) |
| 6:30 AM to 6:59 AM | 120 (18.5%) | 106 (14.3%) |
| 7:00 AM to 7:29 AM | 198 (30.6%) | 145 (19.5%) |
| 7:30 AM to 7:59 AM | 17 (2.6%) | 0 (0.0%) |
| 8:00 AM to 8:29 AM | 0 (0.0%) | 103 (13.9%) |
| 8:30 AM to 8:59 AM | 0 (0.0%) | 38 (5.1%) |
| 9:00 AM to 9:59 AM | 0 (0.0%) | 120 (16.2%) |
| 10:00 AM to 10:59 AM | 21 (3.3%) | 0 (0.0%) |
| 11:00 AM to 11:59 AM | 0 (0.0%) | 0 (0.0%) |
| 12:00 PM to 3:59 PM | 0 (0.0%) | 63 (8.5%) |
| 4:00 PM to 11:59 PM | 0 (0.0%) | 0 (0.0%) |
| Total | 647 (100.0%) | 743 (100.0%) |
Housing Occupancy in Peralta
Occupancy by Ownership in Peralta
Of the total 1,374 dwellings in Peralta, owner-occupied units account for 1,108 (80.6%), while renter-occupied units make up 266 (19.4%).
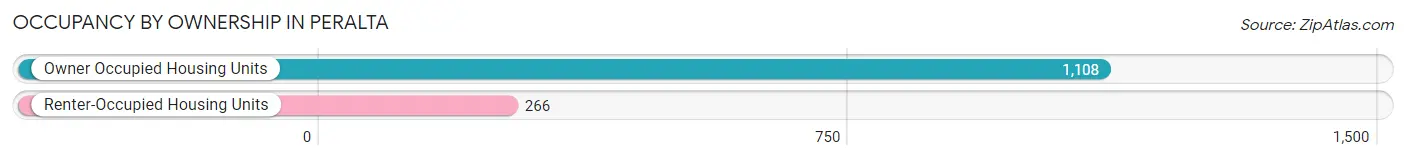
| Occupancy | # Housing Units | % Housing Units |
| Owner Occupied Housing Units | 1,108 | 80.6% |
| Renter-Occupied Housing Units | 266 | 19.4% |
| Total Occupied Housing Units | 1,374 | 100.0% |
Occupancy by Household Size in Peralta
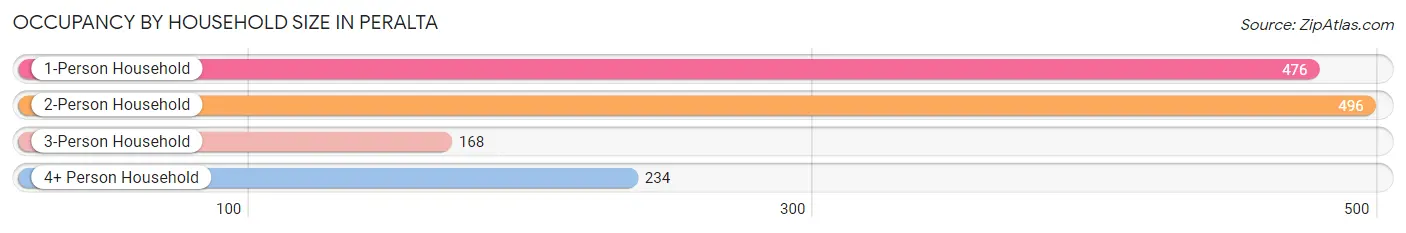
| Household Size | # Housing Units | % Housing Units |
| 1-Person Household | 476 | 34.6% |
| 2-Person Household | 496 | 36.1% |
| 3-Person Household | 168 | 12.2% |
| 4+ Person Household | 234 | 17.0% |
| Total Housing Units | 1,374 | 100.0% |
Occupancy by Ownership by Household Size in Peralta
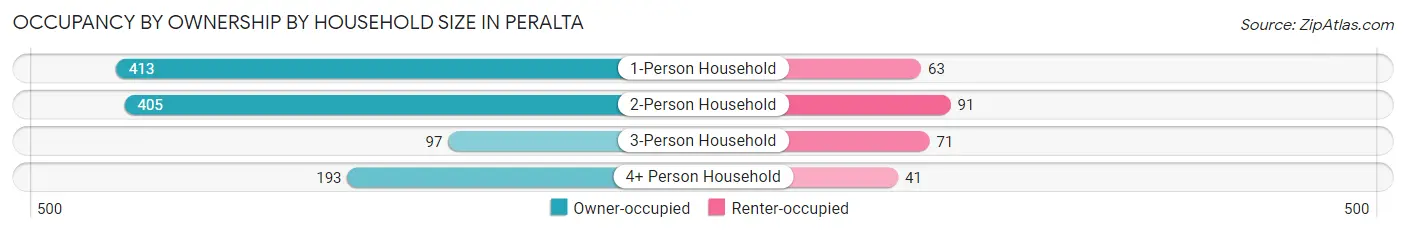
| Household Size | Owner-occupied | Renter-occupied |
| 1-Person Household | 413 (86.8%) | 63 (13.2%) |
| 2-Person Household | 405 (81.7%) | 91 (18.3%) |
| 3-Person Household | 97 (57.7%) | 71 (42.3%) |
| 4+ Person Household | 193 (82.5%) | 41 (17.5%) |
| Total Housing Units | 1,108 (80.6%) | 266 (19.4%) |
Occupancy by Educational Attainment in Peralta
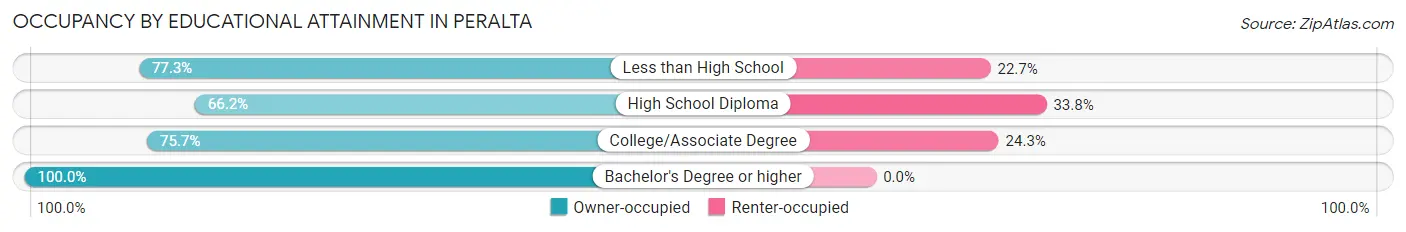
| Household Size | Owner-occupied | Renter-occupied |
| Less than High School | 242 (77.3%) | 71 (22.7%) |
| High School Diploma | 200 (66.2%) | 102 (33.8%) |
| College/Associate Degree | 290 (75.7%) | 93 (24.3%) |
| Bachelor's Degree or higher | 376 (100.0%) | 0 (0.0%) |
Occupancy by Age of Householder in Peralta
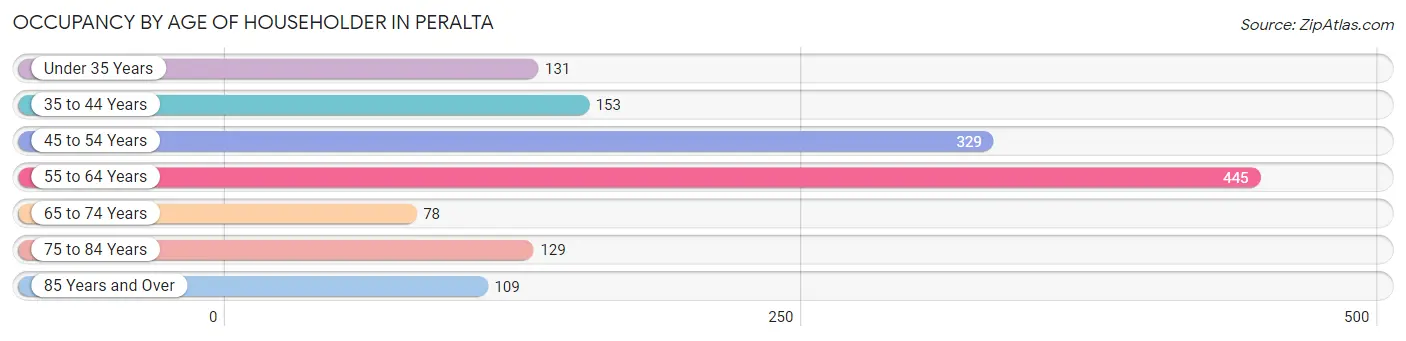
| Age Bracket | # Households | % Households |
| Under 35 Years | 131 | 9.5% |
| 35 to 44 Years | 153 | 11.1% |
| 45 to 54 Years | 329 | 23.9% |
| 55 to 64 Years | 445 | 32.4% |
| 65 to 74 Years | 78 | 5.7% |
| 75 to 84 Years | 129 | 9.4% |
| 85 Years and Over | 109 | 7.9% |
| Total | 1,374 | 100.0% |
Housing Finances in Peralta
Median Income by Occupancy in Peralta
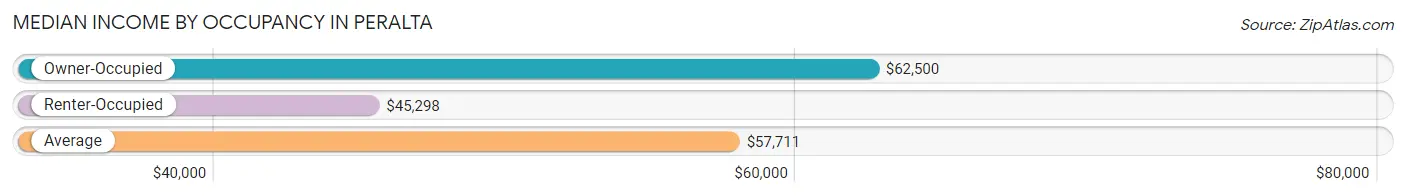
| Occupancy Type | # Households | Median Income |
| Owner-Occupied | 1,108 (80.6%) | $62,500 |
| Renter-Occupied | 266 (19.4%) | $45,298 |
| Average | 1,374 (100.0%) | $57,711 |
Occupancy by Householder Income Bracket in Peralta
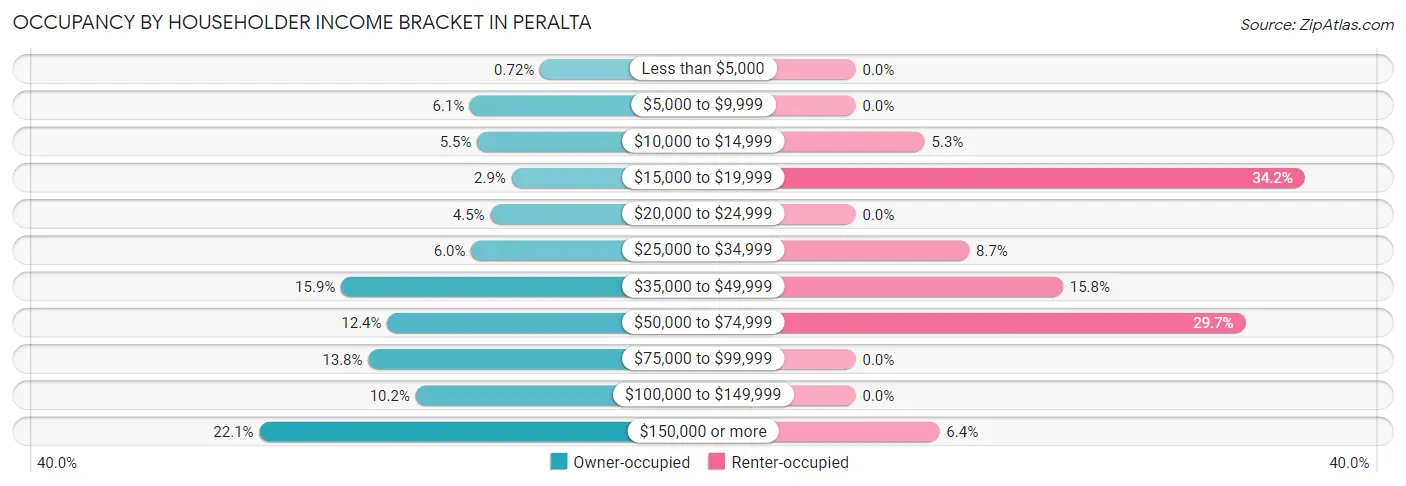
| Income Bracket | Owner-occupied | Renter-occupied |
| Less than $5,000 | 8 (0.7%) | 0 (0.0%) |
| $5,000 to $9,999 | 67 (6.0%) | 0 (0.0%) |
| $10,000 to $14,999 | 61 (5.5%) | 14 (5.3%) |
| $15,000 to $19,999 | 32 (2.9%) | 91 (34.2%) |
| $20,000 to $24,999 | 50 (4.5%) | 0 (0.0%) |
| $25,000 to $34,999 | 66 (6.0%) | 23 (8.6%) |
| $35,000 to $49,999 | 176 (15.9%) | 42 (15.8%) |
| $50,000 to $74,999 | 137 (12.4%) | 79 (29.7%) |
| $75,000 to $99,999 | 153 (13.8%) | 0 (0.0%) |
| $100,000 to $149,999 | 113 (10.2%) | 0 (0.0%) |
| $150,000 or more | 245 (22.1%) | 17 (6.4%) |
| Total | 1,108 (100.0%) | 266 (100.0%) |
Monthly Housing Cost Tiers in Peralta
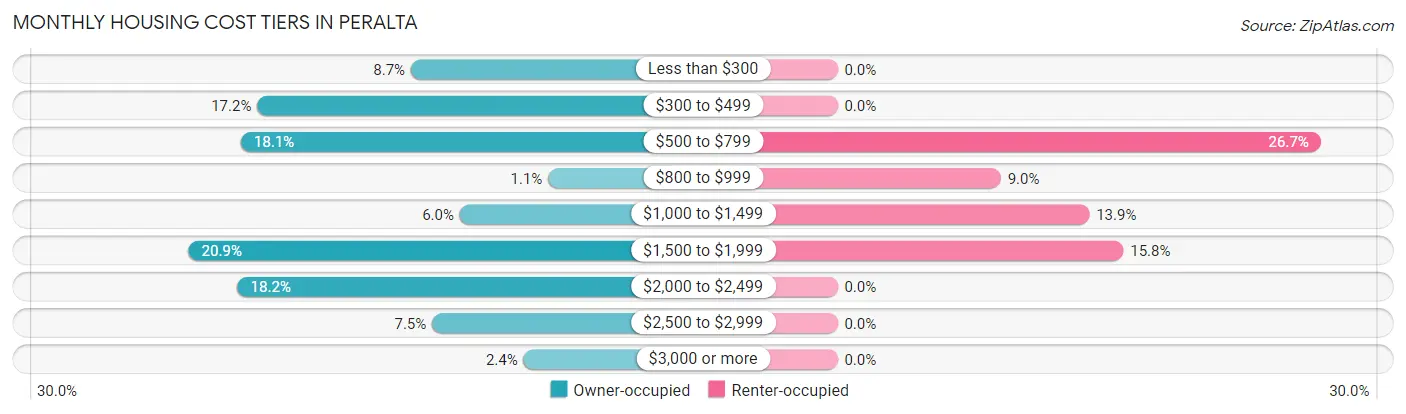
| Monthly Cost | Owner-occupied | Renter-occupied |
| Less than $300 | 96 (8.7%) | 0 (0.0%) |
| $300 to $499 | 190 (17.2%) | 0 (0.0%) |
| $500 to $799 | 200 (18.0%) | 71 (26.7%) |
| $800 to $999 | 12 (1.1%) | 24 (9.0%) |
| $1,000 to $1,499 | 66 (6.0%) | 37 (13.9%) |
| $1,500 to $1,999 | 232 (20.9%) | 42 (15.8%) |
| $2,000 to $2,499 | 202 (18.2%) | 0 (0.0%) |
| $2,500 to $2,999 | 83 (7.5%) | 0 (0.0%) |
| $3,000 or more | 27 (2.4%) | 0 (0.0%) |
| Total | 1,108 (100.0%) | 266 (100.0%) |
Physical Housing Characteristics in Peralta
Housing Structures in Peralta
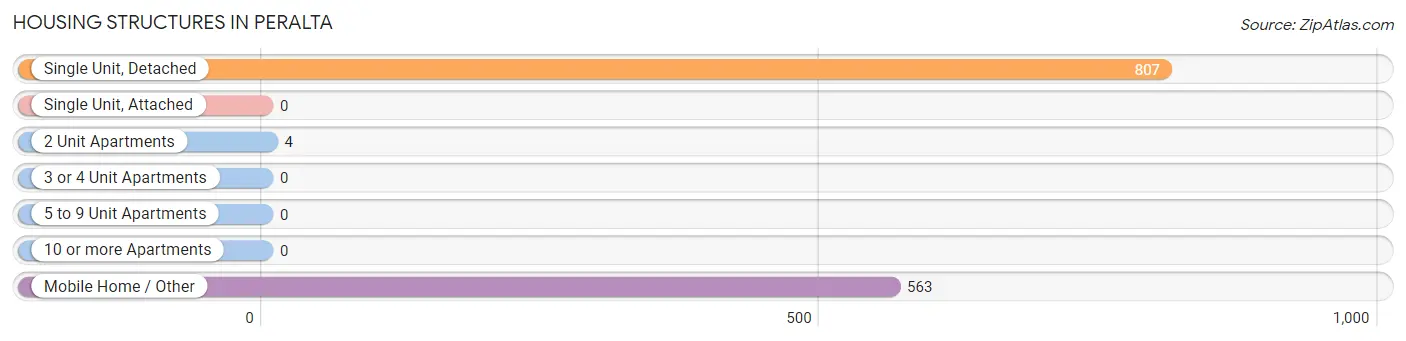
| Structure Type | # Housing Units | % Housing Units |
| Single Unit, Detached | 807 | 58.7% |
| Single Unit, Attached | 0 | 0.0% |
| 2 Unit Apartments | 4 | 0.3% |
| 3 or 4 Unit Apartments | 0 | 0.0% |
| 5 to 9 Unit Apartments | 0 | 0.0% |
| 10 or more Apartments | 0 | 0.0% |
| Mobile Home / Other | 563 | 41.0% |
| Total | 1,374 | 100.0% |
Housing Structures by Occupancy in Peralta
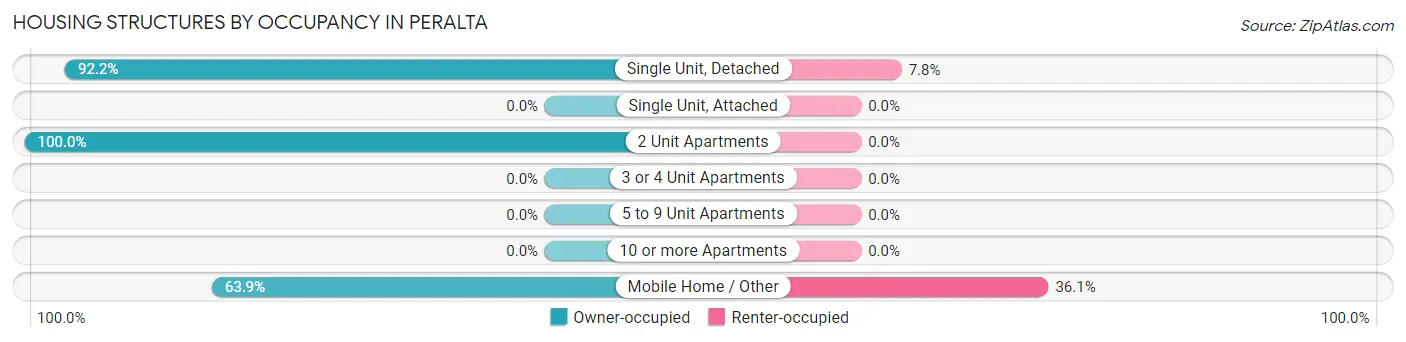
| Structure Type | Owner-occupied | Renter-occupied |
| Single Unit, Detached | 744 (92.2%) | 63 (7.8%) |
| Single Unit, Attached | 0 (0.0%) | 0 (0.0%) |
| 2 Unit Apartments | 4 (100.0%) | 0 (0.0%) |
| 3 or 4 Unit Apartments | 0 (0.0%) | 0 (0.0%) |
| 5 to 9 Unit Apartments | 0 (0.0%) | 0 (0.0%) |
| 10 or more Apartments | 0 (0.0%) | 0 (0.0%) |
| Mobile Home / Other | 360 (63.9%) | 203 (36.1%) |
| Total | 1,108 (80.6%) | 266 (19.4%) |
Housing Structures by Number of Rooms in Peralta
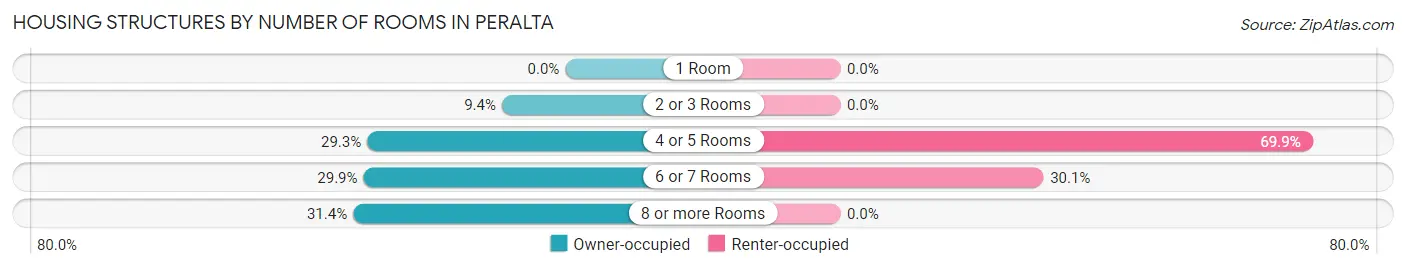
| Number of Rooms | Owner-occupied | Renter-occupied |
| 1 Room | 0 (0.0%) | 0 (0.0%) |
| 2 or 3 Rooms | 104 (9.4%) | 0 (0.0%) |
| 4 or 5 Rooms | 325 (29.3%) | 186 (69.9%) |
| 6 or 7 Rooms | 331 (29.9%) | 80 (30.1%) |
| 8 or more Rooms | 348 (31.4%) | 0 (0.0%) |
| Total | 1,108 (100.0%) | 266 (100.0%) |
Housing Structure by Heating Type in Peralta
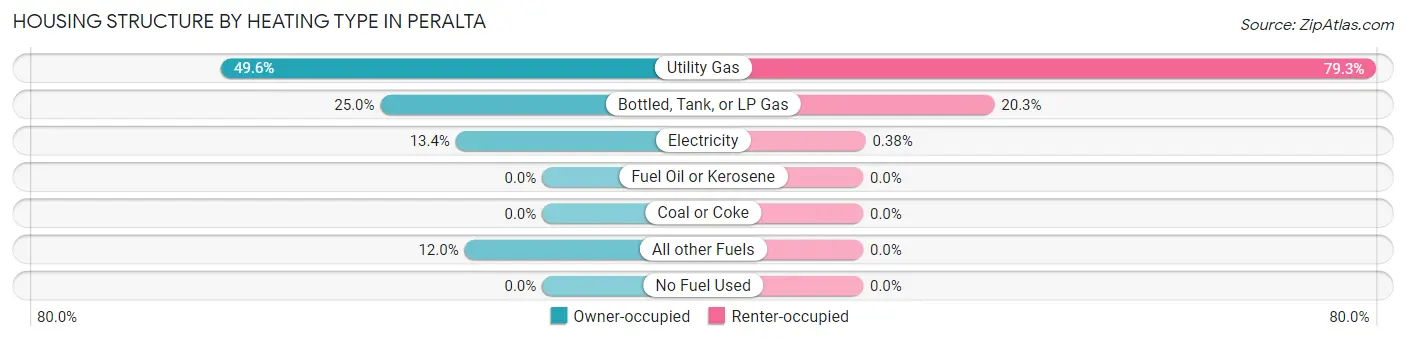
| Heating Type | Owner-occupied | Renter-occupied |
| Utility Gas | 550 (49.6%) | 211 (79.3%) |
| Bottled, Tank, or LP Gas | 277 (25.0%) | 54 (20.3%) |
| Electricity | 148 (13.4%) | 1 (0.4%) |
| Fuel Oil or Kerosene | 0 (0.0%) | 0 (0.0%) |
| Coal or Coke | 0 (0.0%) | 0 (0.0%) |
| All other Fuels | 133 (12.0%) | 0 (0.0%) |
| No Fuel Used | 0 (0.0%) | 0 (0.0%) |
| Total | 1,108 (100.0%) | 266 (100.0%) |
Household Vehicle Usage in Peralta
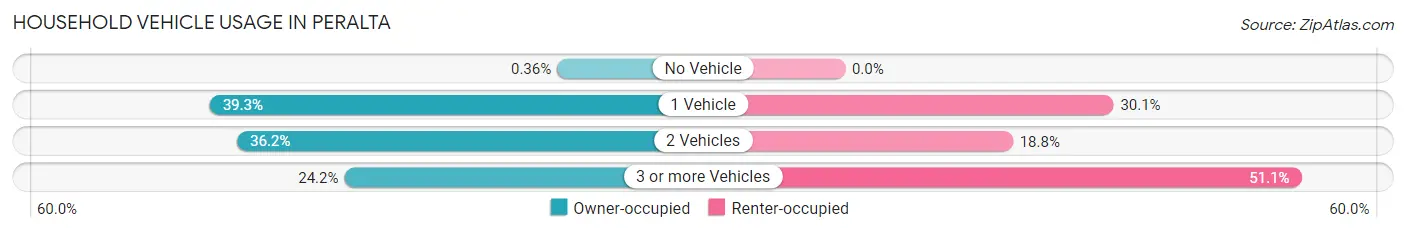
| Vehicles per Household | Owner-occupied | Renter-occupied |
| No Vehicle | 4 (0.4%) | 0 (0.0%) |
| 1 Vehicle | 435 (39.3%) | 80 (30.1%) |
| 2 Vehicles | 401 (36.2%) | 50 (18.8%) |
| 3 or more Vehicles | 268 (24.2%) | 136 (51.1%) |
| Total | 1,108 (100.0%) | 266 (100.0%) |
Real Estate & Mortgages in Peralta
Real Estate and Mortgage Overview in Peralta
| Characteristic | Without Mortgage | With Mortgage |
| Housing Units | 399 | 709 |
| Median Property Value | $224,400 | $279,500 |
| Median Household Income | $37,961 | $238 |
| Monthly Housing Costs | $425 | $27 |
| Real Estate Taxes | $1,276 | $39 |
Property Value by Mortgage Status in Peralta
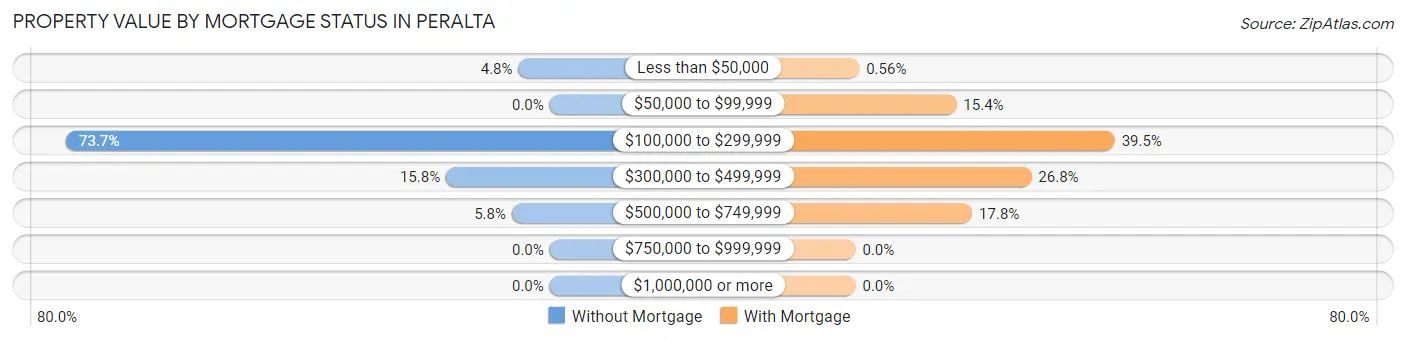
| Property Value | Without Mortgage | With Mortgage |
| Less than $50,000 | 19 (4.8%) | 4 (0.6%) |
| $50,000 to $99,999 | 0 (0.0%) | 109 (15.4%) |
| $100,000 to $299,999 | 294 (73.7%) | 280 (39.5%) |
| $300,000 to $499,999 | 63 (15.8%) | 190 (26.8%) |
| $500,000 to $749,999 | 23 (5.8%) | 126 (17.8%) |
| $750,000 to $999,999 | 0 (0.0%) | 0 (0.0%) |
| $1,000,000 or more | 0 (0.0%) | 0 (0.0%) |
| Total | 399 (100.0%) | 709 (100.0%) |
Household Income by Mortgage Status in Peralta
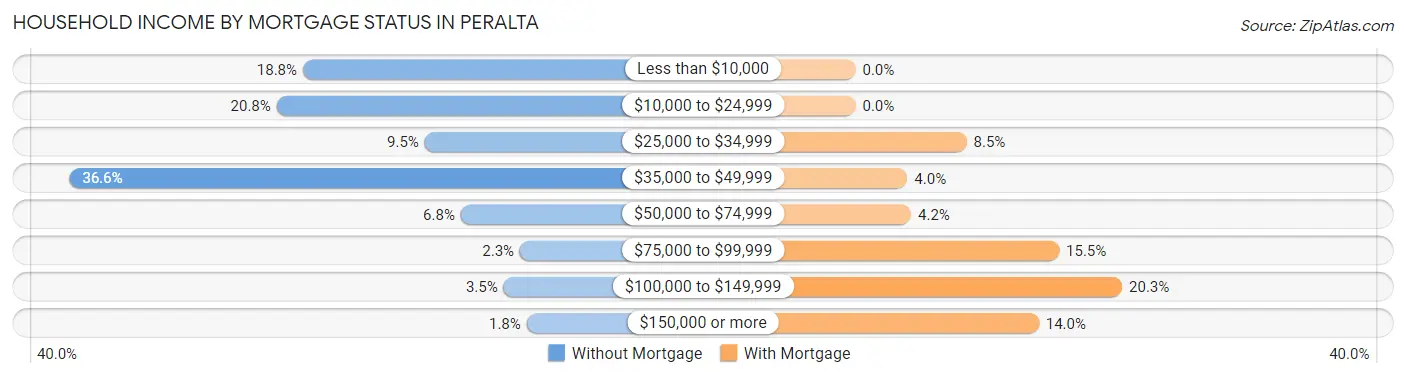
| Household Income | Without Mortgage | With Mortgage |
| Less than $10,000 | 75 (18.8%) | 0 (0.0%) |
| $10,000 to $24,999 | 83 (20.8%) | 0 (0.0%) |
| $25,000 to $34,999 | 38 (9.5%) | 60 (8.5%) |
| $35,000 to $49,999 | 146 (36.6%) | 28 (4.0%) |
| $50,000 to $74,999 | 27 (6.8%) | 30 (4.2%) |
| $75,000 to $99,999 | 9 (2.3%) | 110 (15.5%) |
| $100,000 to $149,999 | 14 (3.5%) | 144 (20.3%) |
| $150,000 or more | 7 (1.8%) | 99 (14.0%) |
| Total | 399 (100.0%) | 709 (100.0%) |
Property Value to Household Income Ratio in Peralta
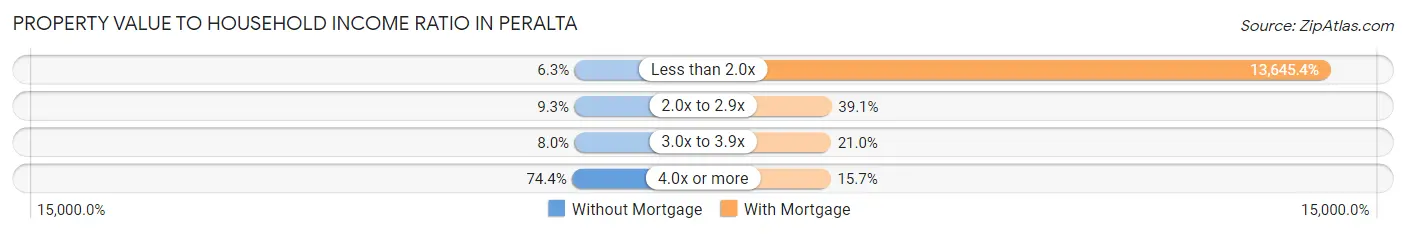
| Value-to-Income Ratio | Without Mortgage | With Mortgage |
| Less than 2.0x | 25 (6.3%) | 96,746 (13,645.4%) |
| 2.0x to 2.9x | 37 (9.3%) | 277 (39.1%) |
| 3.0x to 3.9x | 32 (8.0%) | 149 (21.0%) |
| 4.0x or more | 297 (74.4%) | 111 (15.7%) |
| Total | 399 (100.0%) | 709 (100.0%) |
Real Estate Taxes by Mortgage Status in Peralta
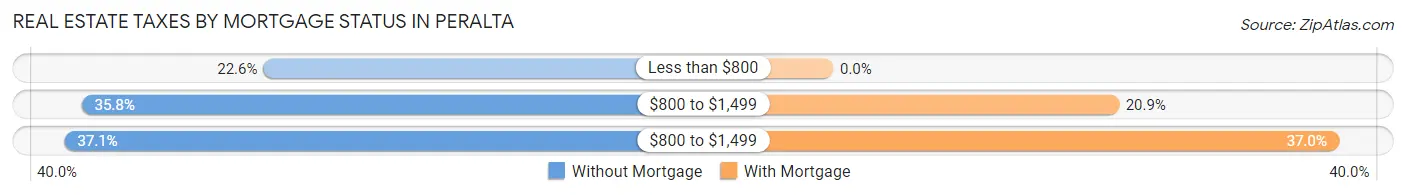
| Property Taxes | Without Mortgage | With Mortgage |
| Less than $800 | 90 (22.6%) | 0 (0.0%) |
| $800 to $1,499 | 143 (35.8%) | 148 (20.9%) |
| $800 to $1,499 | 148 (37.1%) | 262 (36.9%) |
| Total | 399 (100.0%) | 709 (100.0%) |
Health & Disability in Peralta
Health Insurance Coverage by Age in Peralta
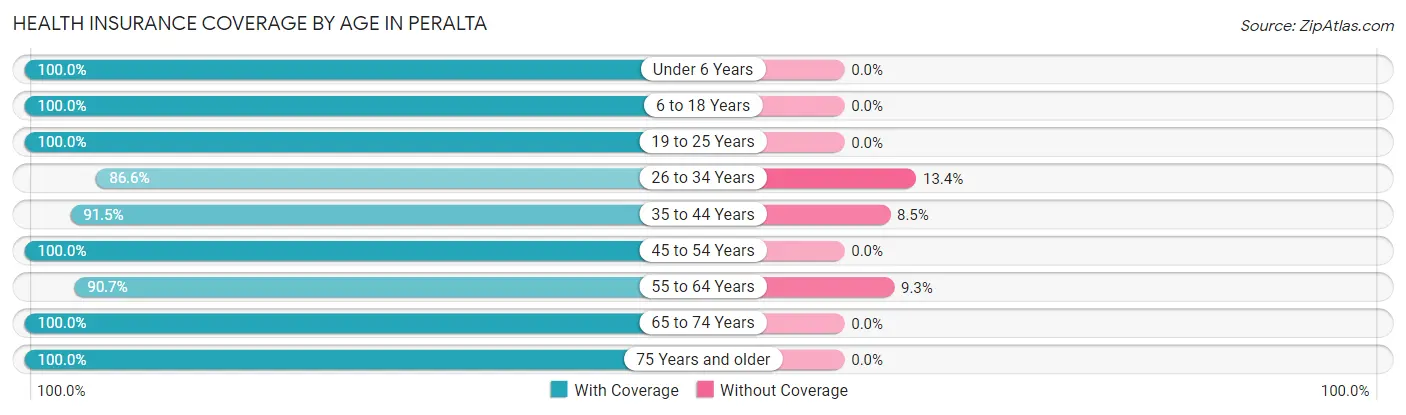
| Age Bracket | With Coverage | Without Coverage |
| Under 6 Years | 181 (100.0%) | 0 (0.0%) |
| 6 to 18 Years | 804 (100.0%) | 0 (0.0%) |
| 19 to 25 Years | 178 (100.0%) | 0 (0.0%) |
| 26 to 34 Years | 259 (86.6%) | 40 (13.4%) |
| 35 to 44 Years | 397 (91.5%) | 37 (8.5%) |
| 45 to 54 Years | 476 (100.0%) | 0 (0.0%) |
| 55 to 64 Years | 450 (90.7%) | 46 (9.3%) |
| 65 to 74 Years | 215 (100.0%) | 0 (0.0%) |
| 75 Years and older | 296 (100.0%) | 0 (0.0%) |
| Total | 3,256 (96.4%) | 123 (3.6%) |
Health Insurance Coverage by Citizenship Status in Peralta
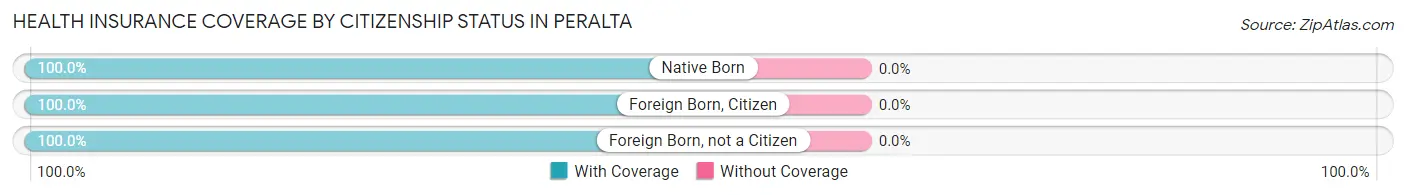
| Citizenship Status | With Coverage | Without Coverage |
| Native Born | 181 (100.0%) | 0 (0.0%) |
| Foreign Born, Citizen | 804 (100.0%) | 0 (0.0%) |
| Foreign Born, not a Citizen | 178 (100.0%) | 0 (0.0%) |
Health Insurance Coverage by Household Income in Peralta
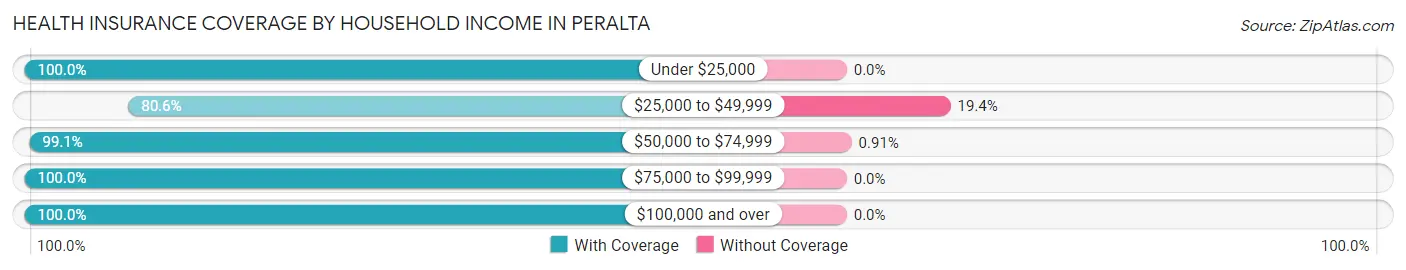
| Household Income | With Coverage | Without Coverage |
| Under $25,000 | 512 (100.0%) | 0 (0.0%) |
| $25,000 to $49,999 | 493 (80.6%) | 119 (19.4%) |
| $50,000 to $74,999 | 434 (99.1%) | 4 (0.9%) |
| $75,000 to $99,999 | 270 (100.0%) | 0 (0.0%) |
| $100,000 and over | 1,547 (100.0%) | 0 (0.0%) |
Public vs Private Health Insurance Coverage by Age in Peralta
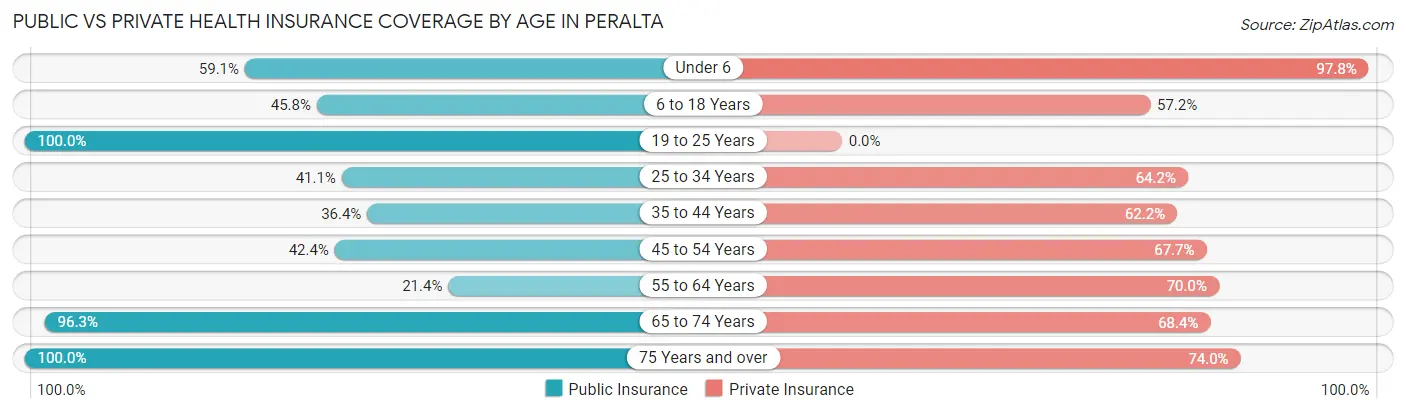
| Age Bracket | Public Insurance | Private Insurance |
| Under 6 | 107 (59.1%) | 177 (97.8%) |
| 6 to 18 Years | 368 (45.8%) | 460 (57.2%) |
| 19 to 25 Years | 178 (100.0%) | 0 (0.0%) |
| 25 to 34 Years | 123 (41.1%) | 192 (64.2%) |
| 35 to 44 Years | 158 (36.4%) | 270 (62.2%) |
| 45 to 54 Years | 202 (42.4%) | 322 (67.6%) |
| 55 to 64 Years | 106 (21.4%) | 347 (70.0%) |
| 65 to 74 Years | 207 (96.3%) | 147 (68.4%) |
| 75 Years and over | 296 (100.0%) | 219 (74.0%) |
| Total | 1,745 (51.6%) | 2,134 (63.1%) |
Disability Status by Sex by Age in Peralta
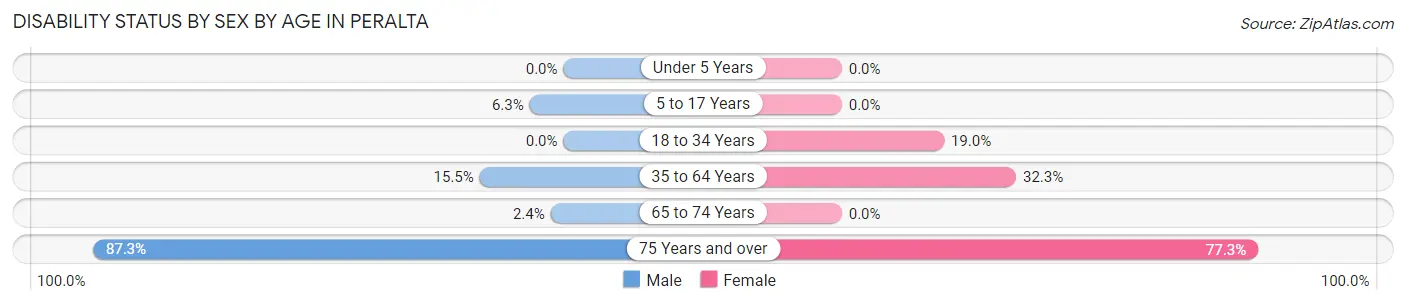
| Age Bracket | Male | Female |
| Under 5 Years | 0 (0.0%) | 0 (0.0%) |
| 5 to 17 Years | 32 (6.3%) | 0 (0.0%) |
| 18 to 34 Years | 0 (0.0%) | 70 (19.0%) |
| 35 to 64 Years | 119 (15.5%) | 207 (32.3%) |
| 65 to 74 Years | 1 (2.4%) | 0 (0.0%) |
| 75 Years and over | 124 (87.3%) | 119 (77.3%) |
Disability Class by Sex by Age in Peralta
Disability Class: Hearing Difficulty
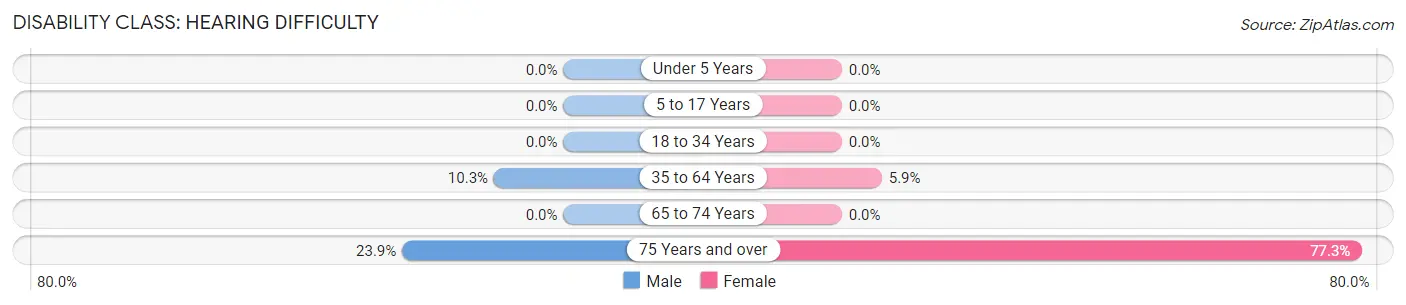
| Age Bracket | Male | Female |
| Under 5 Years | 0 (0.0%) | 0 (0.0%) |
| 5 to 17 Years | 0 (0.0%) | 0 (0.0%) |
| 18 to 34 Years | 0 (0.0%) | 0 (0.0%) |
| 35 to 64 Years | 79 (10.3%) | 38 (5.9%) |
| 65 to 74 Years | 0 (0.0%) | 0 (0.0%) |
| 75 Years and over | 34 (23.9%) | 119 (77.3%) |
Disability Class: Vision Difficulty
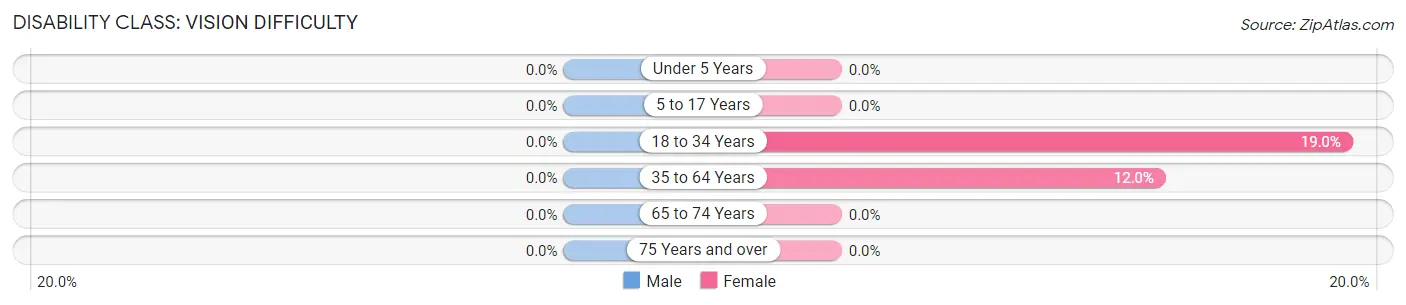
| Age Bracket | Male | Female |
| Under 5 Years | 0 (0.0%) | 0 (0.0%) |
| 5 to 17 Years | 0 (0.0%) | 0 (0.0%) |
| 18 to 34 Years | 0 (0.0%) | 70 (19.0%) |
| 35 to 64 Years | 0 (0.0%) | 77 (12.0%) |
| 65 to 74 Years | 0 (0.0%) | 0 (0.0%) |
| 75 Years and over | 0 (0.0%) | 0 (0.0%) |
Disability Class: Cognitive Difficulty
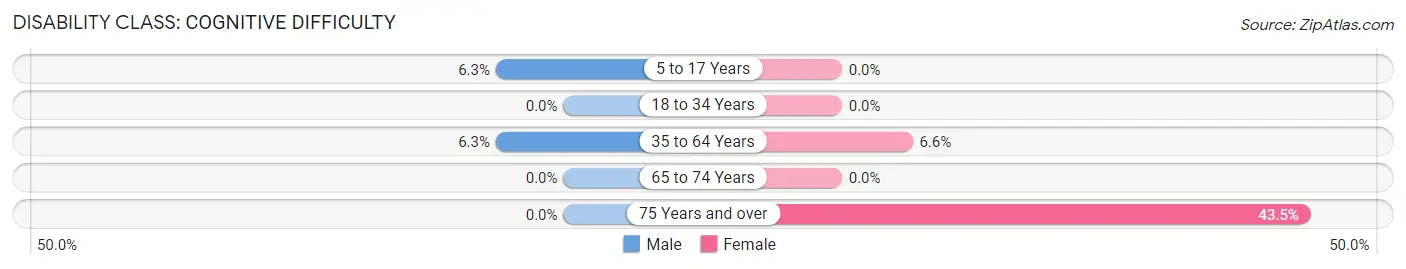
| Age Bracket | Male | Female |
| 5 to 17 Years | 32 (6.3%) | 0 (0.0%) |
| 18 to 34 Years | 0 (0.0%) | 0 (0.0%) |
| 35 to 64 Years | 48 (6.3%) | 42 (6.6%) |
| 65 to 74 Years | 0 (0.0%) | 0 (0.0%) |
| 75 Years and over | 0 (0.0%) | 67 (43.5%) |
Disability Class: Ambulatory Difficulty
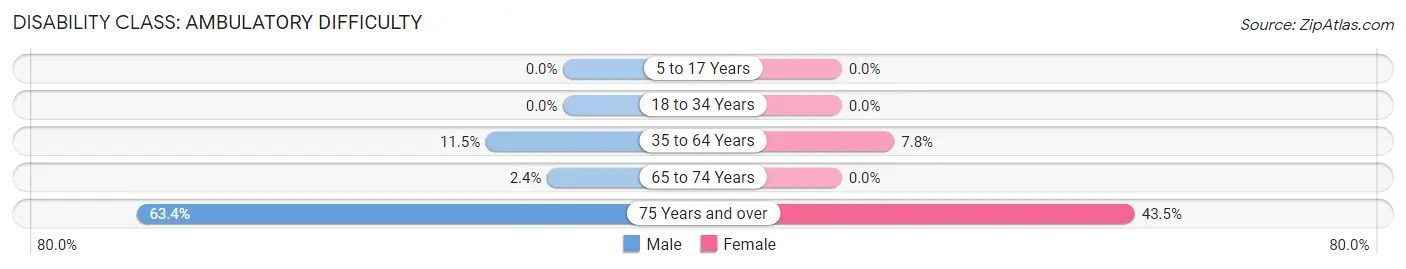
| Age Bracket | Male | Female |
| 5 to 17 Years | 0 (0.0%) | 0 (0.0%) |
| 18 to 34 Years | 0 (0.0%) | 0 (0.0%) |
| 35 to 64 Years | 88 (11.5%) | 50 (7.8%) |
| 65 to 74 Years | 1 (2.4%) | 0 (0.0%) |
| 75 Years and over | 90 (63.4%) | 67 (43.5%) |
Disability Class: Self-Care Difficulty
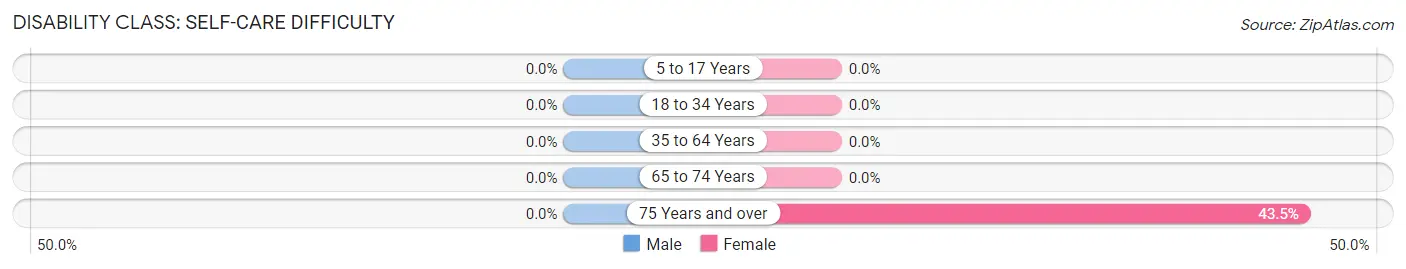
| Age Bracket | Male | Female |
| 5 to 17 Years | 0 (0.0%) | 0 (0.0%) |
| 18 to 34 Years | 0 (0.0%) | 0 (0.0%) |
| 35 to 64 Years | 0 (0.0%) | 0 (0.0%) |
| 65 to 74 Years | 0 (0.0%) | 0 (0.0%) |
| 75 Years and over | 0 (0.0%) | 67 (43.5%) |
Technology Access in Peralta
Computing Device Access in Peralta
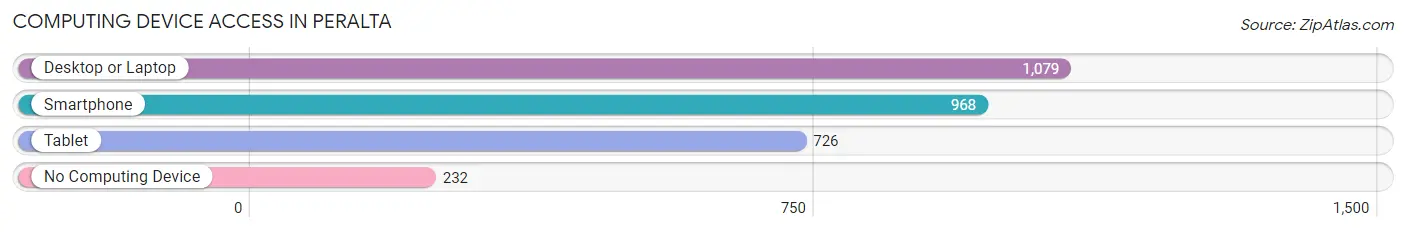
| Device Type | # Households | % Households |
| Desktop or Laptop | 1,079 | 78.5% |
| Smartphone | 968 | 70.5% |
| Tablet | 726 | 52.8% |
| No Computing Device | 232 | 16.9% |
| Total | 1,374 | 100.0% |
Internet Access in Peralta
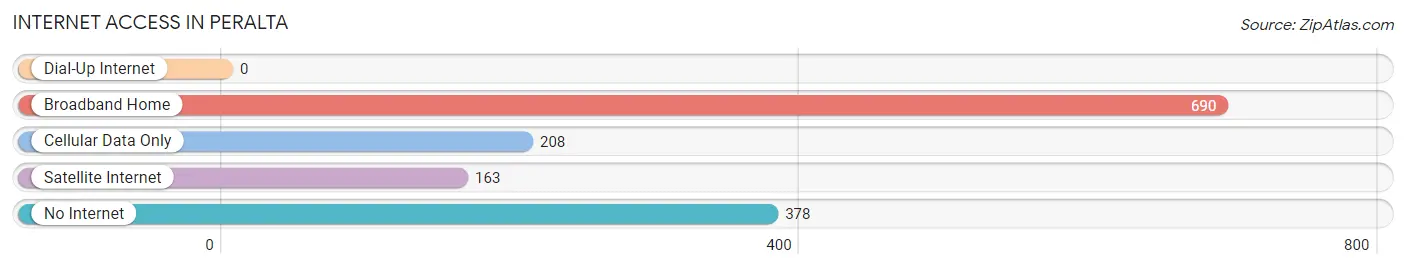
| Internet Type | # Households | % Households |
| Dial-Up Internet | 0 | 0.0% |
| Broadband Home | 690 | 50.2% |
| Cellular Data Only | 208 | 15.1% |
| Satellite Internet | 163 | 11.9% |
| No Internet | 378 | 27.5% |
| Total | 1,374 | 100.0% |
Peralta Summary
Peralta, New Mexico is a small town located in the South Valley of Bernalillo County, New Mexico. It is situated about 15 miles south of Albuquerque and is part of the Albuquerque Metropolitan Statistical Area. The town has a population of approximately 4,000 people and is known for its rural atmosphere and small-town charm.
History
Peralta was founded in 1881 by a group of settlers from the nearby town of Los Lunas. The settlers were looking for a place to settle and farm, and they chose the area because of its fertile soil and abundant water supply. The town was named after the Peralta family, who were among the first settlers.
The town grew slowly but steadily over the years, and by the early 1900s, it had become a thriving agricultural community. The town was home to several small businesses, including a general store, a blacksmith shop, and a post office.
In the 1950s, the town began to experience a period of growth and development. The population increased, and new businesses opened, including a grocery store, a bank, and a movie theater. The town also saw the construction of a new school and a library.
Geography
Peralta is located in the South Valley of Bernalillo County, New Mexico. The town is situated at an elevation of 4,890 feet above sea level and is surrounded by the Manzano Mountains to the east and the Sandia Mountains to the west. The town is located in a semi-arid climate, with hot summers and mild winters.
The town is located along the Rio Grande River, which provides a source of irrigation for the local farms and ranches. The town is also located near the Isleta Pueblo, which is a Native American reservation.
Economy
The economy of Peralta is largely based on agriculture. The town is home to several farms and ranches, which produce a variety of crops, including alfalfa, corn, and wheat. The town is also home to several small businesses, including a grocery store, a bank, and a movie theater.
Demographics
As of the 2010 census, the population of Peralta was 4,039. The racial makeup of the town was 73.3% White, 0.7% African American, 1.2% Native American, 0.3% Asian, 0.1% Pacific Islander, 21.2% from other races, and 3.4% from two or more races. Hispanic or Latino of any race were 44.2% of the population.
The median household income in Peralta was $37,917, and the median family income was $41,917. The per capita income was $17,917. About 17.2% of families and 20.2% of the population were below the poverty line, including 28.2% of those under age 18 and 10.2% of those age 65 or over.
Peralta is a small town with a rich history and a unique culture. The town is home to a diverse population and is known for its rural atmosphere and small-town charm. The town is also home to several small businesses and farms, which provide a source of income for the local economy.
Common Questions
What is Per Capita Income in Peralta?
Per Capita income in Peralta is $53,092.
What is the Median Family Income in Peralta?
Median Family Income in Peralta is $79,028.
What is the Median Household income in Peralta?
Median Household Income in Peralta is $57,711.
What is Income or Wage Gap in Peralta?
Income or Wage Gap in Peralta is 12.2%.
Women in Peralta earn 87.8 cents for every dollar earned by a man.
What is Inequality or Gini Index in Peralta?
Inequality or Gini Index in Peralta is 0.54.
What is the Total Population of Peralta?
Total Population of Peralta is 3,379.
What is the Total Male Population of Peralta?
Total Male Population of Peralta is 1,778.
What is the Total Female Population of Peralta?
Total Female Population of Peralta is 1,601.
What is the Ratio of Males per 100 Females in Peralta?
There are 111.06 Males per 100 Females in Peralta.
What is the Ratio of Females per 100 Males in Peralta?
There are 90.04 Females per 100 Males in Peralta.
What is the Median Population Age in Peralta?
Median Population Age in Peralta is 39.2 Years.
What is the Average Family Size in Peralta
Average Family Size in Peralta is 3.2 People.
What is the Average Household Size in Peralta
Average Household Size in Peralta is 2.5 People.
How Large is the Labor Force in Peralta?
There are 1,575 People in the Labor Forcein in Peralta.
What is the Percentage of People in the Labor Force in Peralta?
59.7% of People are in the Labor Force in Peralta.
What is the Unemployment Rate in Peralta?
Unemployment Rate in Peralta is 11.3%.