Penasco, NM Map & Demographics
Penasco Overview
$23,881
PER CAPITA INCOME
$44,886
AVG FAMILY INCOME
$31,429
AVG HOUSEHOLD INCOME
20.2%
WAGE / INCOME GAP [ % ]
79.8¢/ $1
WAGE / INCOME GAP [ $ ]
$9,438
FAMILY INCOME DEFICIT
0.55
INEQUALITY / GINI INDEX
708
TOTAL POPULATION
431
MALE POPULATION
277
FEMALE POPULATION
155.60
MALES / 100 FEMALES
64.27
FEMALES / 100 MALES
40.2
MEDIAN AGE
3.8
AVG FAMILY SIZE
2.7
AVG HOUSEHOLD SIZE
268
LABOR FORCE [ PEOPLE ]
47.9%
PERCENT IN LABOR FORCE
5.6%
UNEMPLOYMENT RATE
Penasco Zip Codes
Income in Penasco
Income Overview in Penasco
Per Capita Income in Penasco is $23,881, while median incomes of families and households are $44,886 and $31,429 respectively.
| Characteristic | Number | Measure |
| Per Capita Income | 708 | $23,881 |
| Median Family Income | 147 | $44,886 |
| Mean Family Income | 147 | $58,953 |
| Median Household Income | 258 | $31,429 |
| Mean Household Income | 258 | $58,270 |
| Income Deficit | 147 | $9,438 |
| Wage / Income Gap (%) | 708 | 20.21% |
| Wage / Income Gap ($) | 708 | 79.79¢ per $1 |
| Gini / Inequality Index | 708 | 0.55 |
Earnings by Sex in Penasco
Average Earnings in Penasco are $23,125, $19,615 for men and $24,583 for women, a difference of 20.2%.
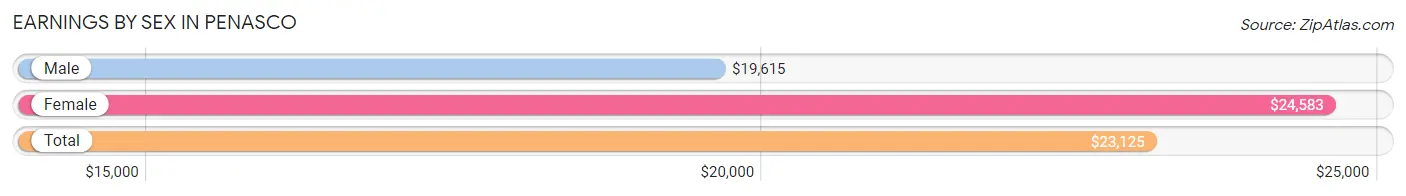
| Sex | Number | Average Earnings |
| Male | 176 (64.9%) | $19,615 |
| Female | 95 (35.1%) | $24,583 |
| Total | 271 (100.0%) | $23,125 |
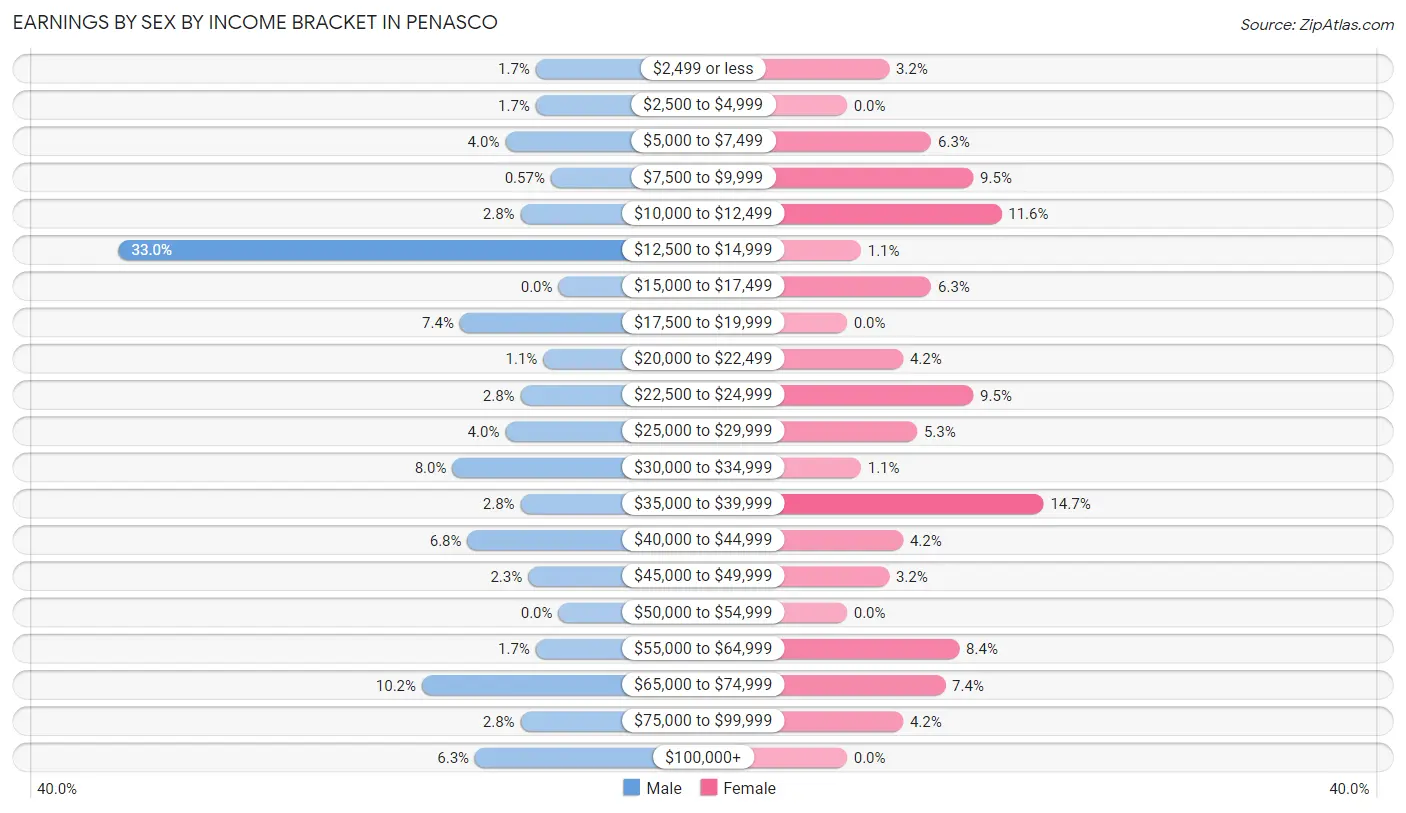
Earnings by Sex by Income Bracket in Penasco
The most common earnings brackets in Penasco are $12,500 to $14,999 for men (58 | 33.0%) and $35,000 to $39,999 for women (14 | 14.7%).
| Income | Male | Female |
| $2,499 or less | 3 (1.7%) | 3 (3.2%) |
| $2,500 to $4,999 | 3 (1.7%) | 0 (0.0%) |
| $5,000 to $7,499 | 7 (4.0%) | 6 (6.3%) |
| $7,500 to $9,999 | 1 (0.6%) | 9 (9.5%) |
| $10,000 to $12,499 | 5 (2.8%) | 11 (11.6%) |
| $12,500 to $14,999 | 58 (33.0%) | 1 (1.1%) |
| $15,000 to $17,499 | 0 (0.0%) | 6 (6.3%) |
| $17,500 to $19,999 | 13 (7.4%) | 0 (0.0%) |
| $20,000 to $22,499 | 2 (1.1%) | 4 (4.2%) |
| $22,500 to $24,999 | 5 (2.8%) | 9 (9.5%) |
| $25,000 to $29,999 | 7 (4.0%) | 5 (5.3%) |
| $30,000 to $34,999 | 14 (8.0%) | 1 (1.1%) |
| $35,000 to $39,999 | 5 (2.8%) | 14 (14.7%) |
| $40,000 to $44,999 | 12 (6.8%) | 4 (4.2%) |
| $45,000 to $49,999 | 4 (2.3%) | 3 (3.2%) |
| $50,000 to $54,999 | 0 (0.0%) | 0 (0.0%) |
| $55,000 to $64,999 | 3 (1.7%) | 8 (8.4%) |
| $65,000 to $74,999 | 18 (10.2%) | 7 (7.4%) |
| $75,000 to $99,999 | 5 (2.8%) | 4 (4.2%) |
| $100,000+ | 11 (6.2%) | 0 (0.0%) |
| Total | 176 (100.0%) | 95 (100.0%) |
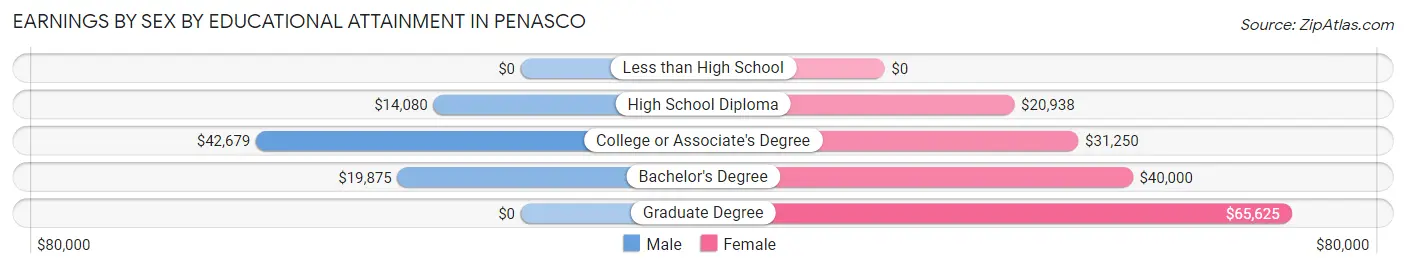
Earnings by Sex by Educational Attainment in Penasco
Average earnings in Penasco are $19,423 for men and $26,500 for women, a difference of 26.7%. Men with an educational attainment of college or associate's degree enjoy the highest average annual earnings of $42,679, while those with high school diploma education earn the least with $14,080. Women with an educational attainment of graduate degree earn the most with the average annual earnings of $65,625, while those with high school diploma education have the smallest earnings of $20,938.
| Educational Attainment | Male Income | Female Income |
| Less than High School | - | - |
| High School Diploma | $14,080 | $20,938 |
| College or Associate's Degree | $42,679 | $31,250 |
| Bachelor's Degree | $19,875 | $40,000 |
| Graduate Degree | - | - |
| Total | $19,423 | $26,500 |
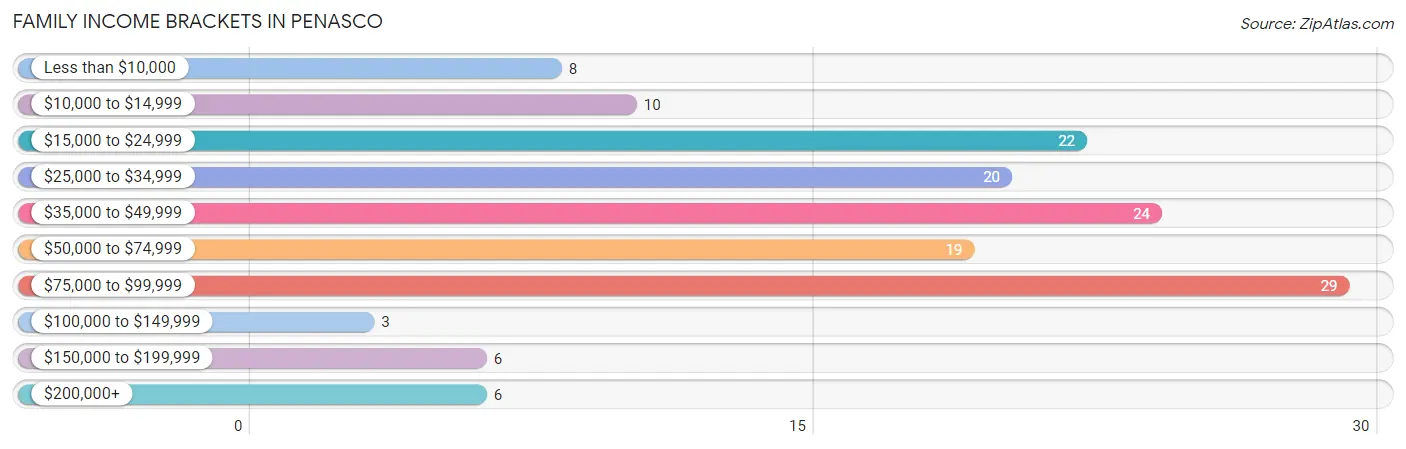
Family Income in Penasco
Family Income Brackets in Penasco
According to the Penasco family income data, there are 29 families falling into the $75,000 to $99,999 income range, which is the most common income bracket and makes up 19.7% of all families. Conversely, the $100,000 to $149,999 income bracket is the least frequent group with only 3 families (2.0%) belonging to this category.
| Income Bracket | # Families | % Families |
| Less than $10,000 | 8 | 5.4% |
| $10,000 to $14,999 | 10 | 6.8% |
| $15,000 to $24,999 | 22 | 15.0% |
| $25,000 to $34,999 | 20 | 13.6% |
| $35,000 to $49,999 | 24 | 16.3% |
| $50,000 to $74,999 | 19 | 12.9% |
| $75,000 to $99,999 | 29 | 19.7% |
| $100,000 to $149,999 | 3 | 2.0% |
| $150,000 to $199,999 | 6 | 4.1% |
| $200,000+ | 6 | 4.1% |
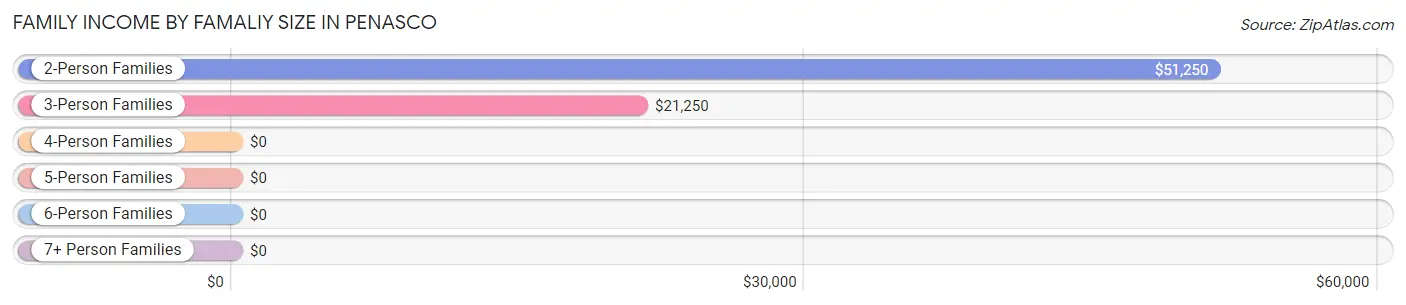
Family Income by Famaliy Size in Penasco
2-person families (94 | 63.9%) account for the highest median family income in Penasco with $51,250 per family, while 2-person families (94 | 63.9%) have the highest median income of $25,625 per family member.
| Income Bracket | # Families | Median Income |
| 2-Person Families | 94 (63.9%) | $51,250 |
| 3-Person Families | 28 (19.1%) | $21,250 |
| 4-Person Families | 11 (7.5%) | $0 |
| 5-Person Families | 13 (8.8%) | $0 |
| 6-Person Families | 1 (0.7%) | $0 |
| 7+ Person Families | 0 (0.0%) | $0 |
| Total | 147 (100.0%) | $44,886 |
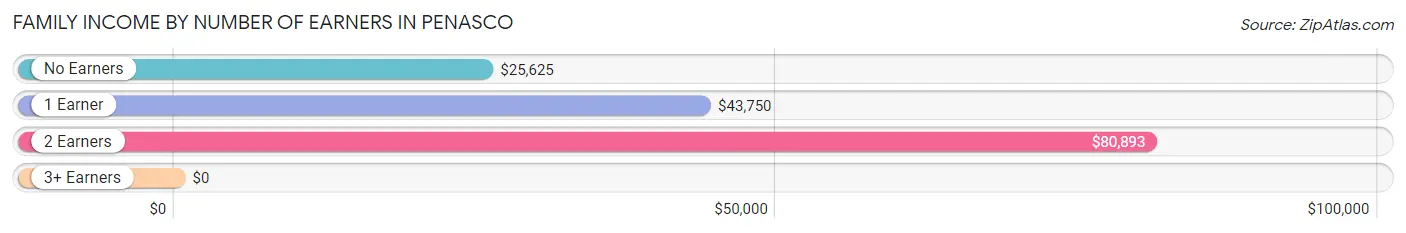
Family Income by Number of Earners in Penasco
| Number of Earners | # Families | Median Income |
| No Earners | 49 (33.3%) | $25,625 |
| 1 Earner | 59 (40.1%) | $43,750 |
| 2 Earners | 37 (25.2%) | $80,893 |
| 3+ Earners | 2 (1.4%) | $0 |
| Total | 147 (100.0%) | $44,886 |
Household Income in Penasco
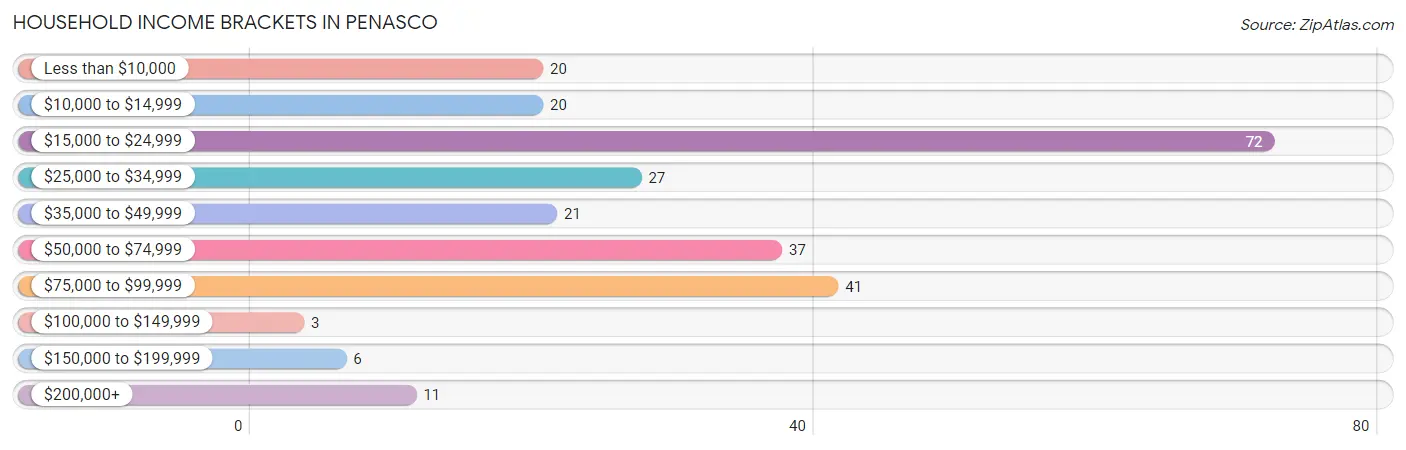
Household Income Brackets in Penasco
With 72 households falling in the category, the $15,000 to $24,999 income range is the most frequent in Penasco, accounting for 27.9% of all households. In contrast, only 3 households (1.2%) fall into the $100,000 to $149,999 income bracket, making it the least populous group.
| Income Bracket | # Households | % Households |
| Less than $10,000 | 20 | 7.8% |
| $10,000 to $14,999 | 20 | 7.8% |
| $15,000 to $24,999 | 72 | 27.9% |
| $25,000 to $34,999 | 27 | 10.5% |
| $35,000 to $49,999 | 21 | 8.1% |
| $50,000 to $74,999 | 37 | 14.3% |
| $75,000 to $99,999 | 41 | 15.9% |
| $100,000 to $149,999 | 3 | 1.2% |
| $150,000 to $199,999 | 6 | 2.3% |
| $200,000+ | 11 | 4.3% |
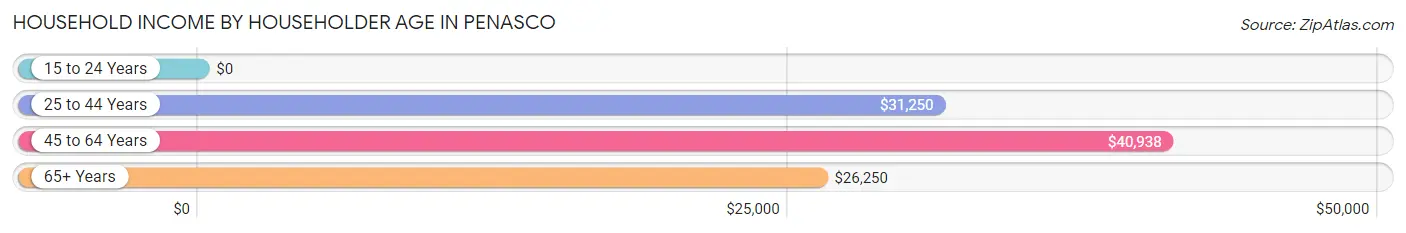
Household Income by Householder Age in Penasco
The median household income in Penasco is $31,429, with the highest median household income of $40,938 found in the 45 to 64 years age bracket for the primary householder. A total of 97 households (37.6%) fall into this category. Meanwhile, the 15 to 24 years age bracket for the primary householder has the lowest median household income of $0, with 1 households (0.4%) in this group.
| Income Bracket | # Households | Median Income |
| 15 to 24 Years | 1 (0.4%) | $0 |
| 25 to 44 Years | 66 (25.6%) | $31,250 |
| 45 to 64 Years | 97 (37.6%) | $40,938 |
| 65+ Years | 94 (36.4%) | $26,250 |
| Total | 258 (100.0%) | $31,429 |
Poverty in Penasco
Income Below Poverty by Sex and Age in Penasco
With 29.9% poverty level for males and 30.3% for females among the residents of Penasco, 5 year old males and 15 year old females are the most vulnerable to poverty, with 7 males (100.0%) and 1 females (100.0%) in their respective age groups living below the poverty level.
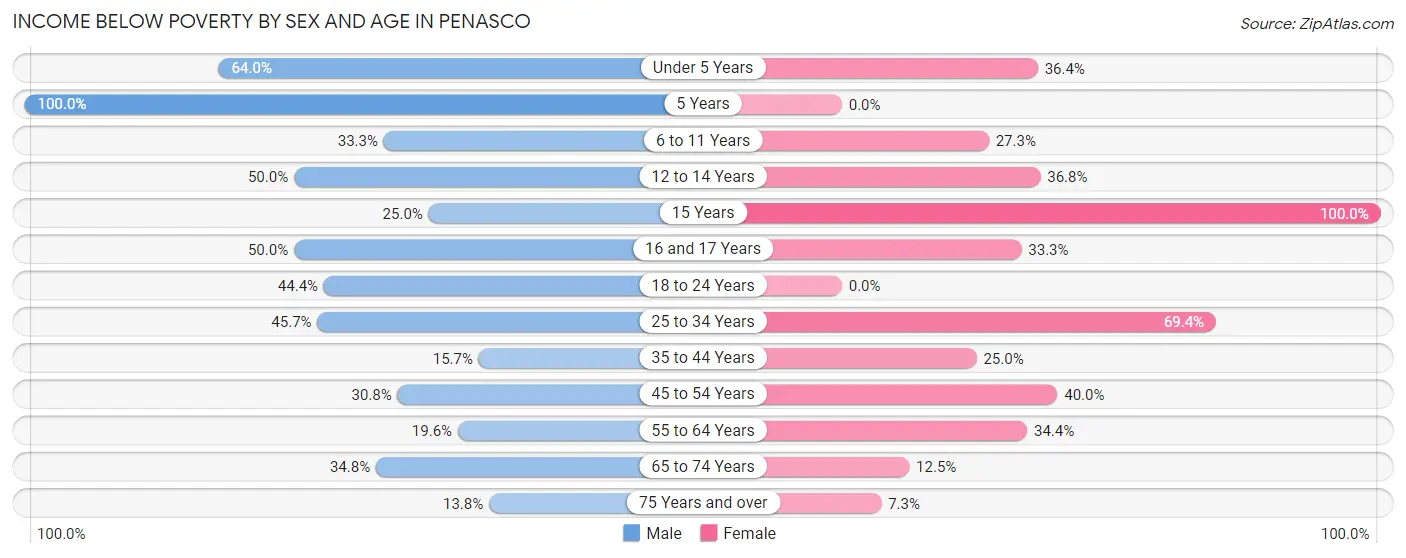
| Age Bracket | Male | Female |
| Under 5 Years | 16 (64.0%) | 4 (36.4%) |
| 5 Years | 7 (100.0%) | 0 (0.0%) |
| 6 to 11 Years | 15 (33.3%) | 6 (27.3%) |
| 12 to 14 Years | 4 (50.0%) | 7 (36.8%) |
| 15 Years | 2 (25.0%) | 1 (100.0%) |
| 16 and 17 Years | 3 (50.0%) | 1 (33.3%) |
| 18 to 24 Years | 8 (44.4%) | 0 (0.0%) |
| 25 to 34 Years | 21 (45.7%) | 25 (69.4%) |
| 35 to 44 Years | 16 (15.7%) | 11 (25.0%) |
| 45 to 54 Years | 12 (30.8%) | 12 (40.0%) |
| 55 to 64 Years | 9 (19.6%) | 11 (34.4%) |
| 65 to 74 Years | 8 (34.8%) | 3 (12.5%) |
| 75 Years and over | 8 (13.8%) | 3 (7.3%) |
| Total | 129 (29.9%) | 84 (30.3%) |
Income Above Poverty by Sex and Age in Penasco
According to the poverty statistics in Penasco, males aged 75 years and over and females aged 5 years are the age groups that are most secure financially, with 86.2% of males and 100.0% of females in these age groups living above the poverty line.
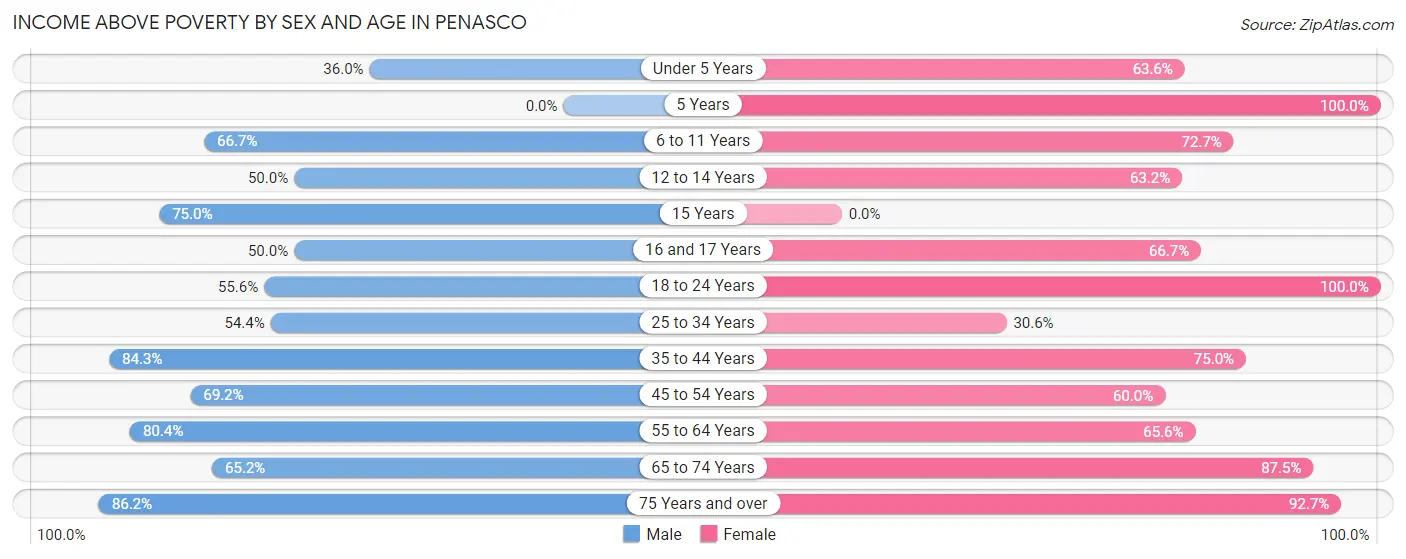
| Age Bracket | Male | Female |
| Under 5 Years | 9 (36.0%) | 7 (63.6%) |
| 5 Years | 0 (0.0%) | 3 (100.0%) |
| 6 to 11 Years | 30 (66.7%) | 16 (72.7%) |
| 12 to 14 Years | 4 (50.0%) | 12 (63.2%) |
| 15 Years | 6 (75.0%) | 0 (0.0%) |
| 16 and 17 Years | 3 (50.0%) | 2 (66.7%) |
| 18 to 24 Years | 10 (55.6%) | 11 (100.0%) |
| 25 to 34 Years | 25 (54.3%) | 11 (30.6%) |
| 35 to 44 Years | 86 (84.3%) | 33 (75.0%) |
| 45 to 54 Years | 27 (69.2%) | 18 (60.0%) |
| 55 to 64 Years | 37 (80.4%) | 21 (65.6%) |
| 65 to 74 Years | 15 (65.2%) | 21 (87.5%) |
| 75 Years and over | 50 (86.2%) | 38 (92.7%) |
| Total | 302 (70.1%) | 193 (69.7%) |
Income Below Poverty Among Married-Couple Families in Penasco
The poverty statistics for married-couple families in Penasco show that 14.5% or 11 of the total 76 families live below the poverty line. Families with 1 or 2 children have the highest poverty rate of 75.0%, comprising of 3 families. On the other hand, families with 3 or 4 children have the lowest poverty rate of 0.0%, which includes 0 families.
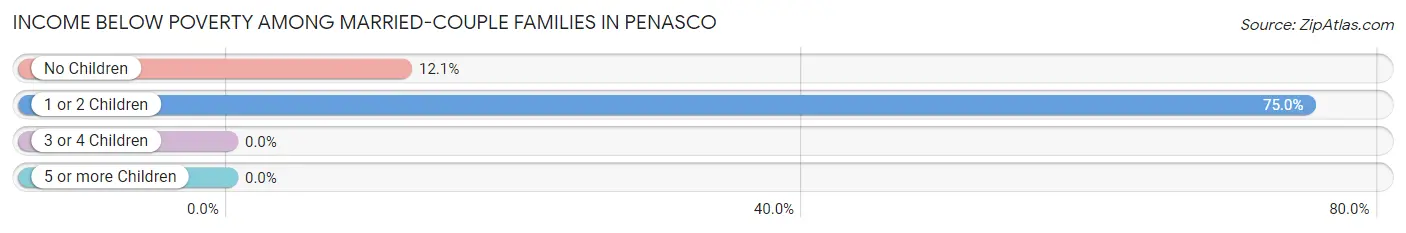
| Children | Above Poverty | Below Poverty |
| No Children | 58 (87.9%) | 8 (12.1%) |
| 1 or 2 Children | 1 (25.0%) | 3 (75.0%) |
| 3 or 4 Children | 6 (100.0%) | 0 (0.0%) |
| 5 or more Children | 0 (0.0%) | 0 (0.0%) |
| Total | 65 (85.5%) | 11 (14.5%) |
Income Below Poverty Among Single-Parent Households in Penasco
According to the poverty data in Penasco, 39.4% or 13 single-father households and 47.4% or 18 single-mother households are living below the poverty line. Among single-father households, those with 3 or 4 children have the highest poverty rate, with 6 households (66.7%) experiencing poverty. Likewise, among single-mother households, those with 1 or 2 children have the highest poverty rate, with 15 households (65.2%) falling below the poverty line.
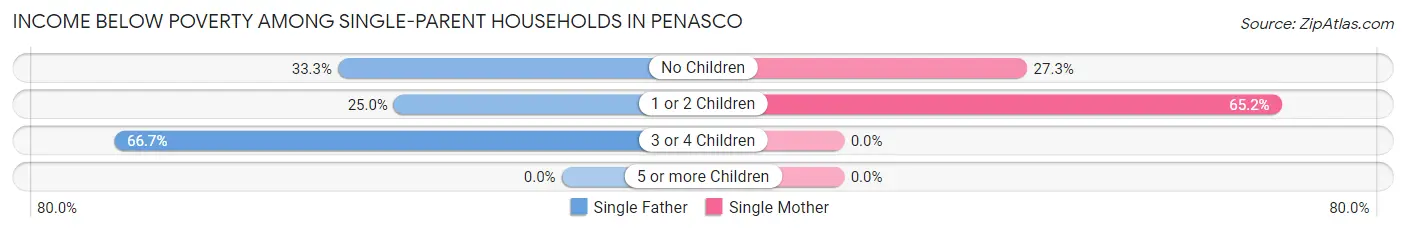
| Children | Single Father | Single Mother |
| No Children | 4 (33.3%) | 3 (27.3%) |
| 1 or 2 Children | 3 (25.0%) | 15 (65.2%) |
| 3 or 4 Children | 6 (66.7%) | 0 (0.0%) |
| 5 or more Children | 0 (0.0%) | 0 (0.0%) |
| Total | 13 (39.4%) | 18 (47.4%) |
Income Below Poverty Among Married-Couple vs Single-Parent Households in Penasco
The poverty data for Penasco shows that 11 of the married-couple family households (14.5%) and 31 of the single-parent households (43.7%) are living below the poverty level. Within the married-couple family households, those with 1 or 2 children have the highest poverty rate, with 3 households (75.0%) falling below the poverty line. Among the single-parent households, those with 1 or 2 children have the highest poverty rate, with 18 household (51.4%) living below poverty.
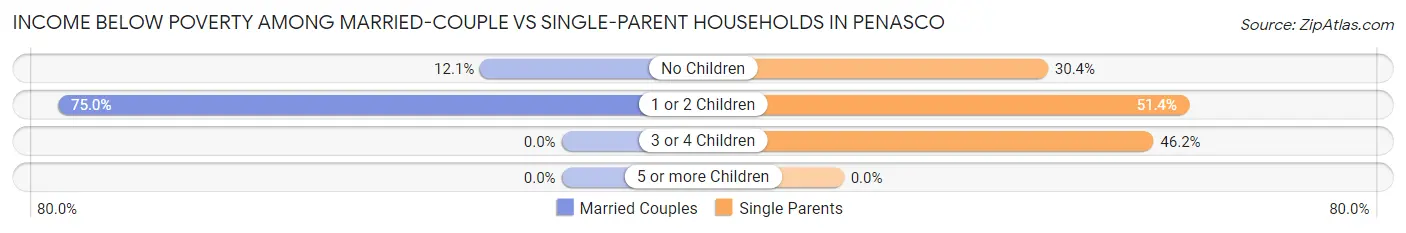
| Children | Married-Couple Families | Single-Parent Households |
| No Children | 8 (12.1%) | 7 (30.4%) |
| 1 or 2 Children | 3 (75.0%) | 18 (51.4%) |
| 3 or 4 Children | 0 (0.0%) | 6 (46.2%) |
| 5 or more Children | 0 (0.0%) | 0 (0.0%) |
| Total | 11 (14.5%) | 31 (43.7%) |
Race in Penasco
The most populous races in Penasco are Hispanic or Latino (629 | 88.8%), Two or more Races (356 | 50.3%), and White / Caucasian (320 | 45.2%).
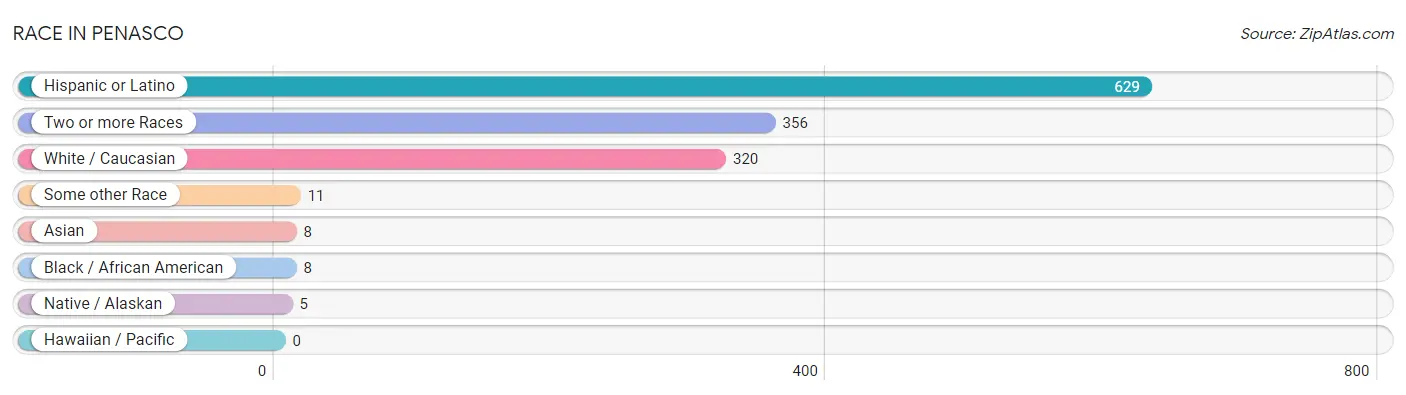
| Race | # Population | % Population |
| Asian | 8 | 1.1% |
| Black / African American | 8 | 1.1% |
| Hawaiian / Pacific | 0 | 0.0% |
| Hispanic or Latino | 629 | 88.8% |
| Native / Alaskan | 5 | 0.7% |
| White / Caucasian | 320 | 45.2% |
| Two or more Races | 356 | 50.3% |
| Some other Race | 11 | 1.5% |
| Total | 708 | 100.0% |
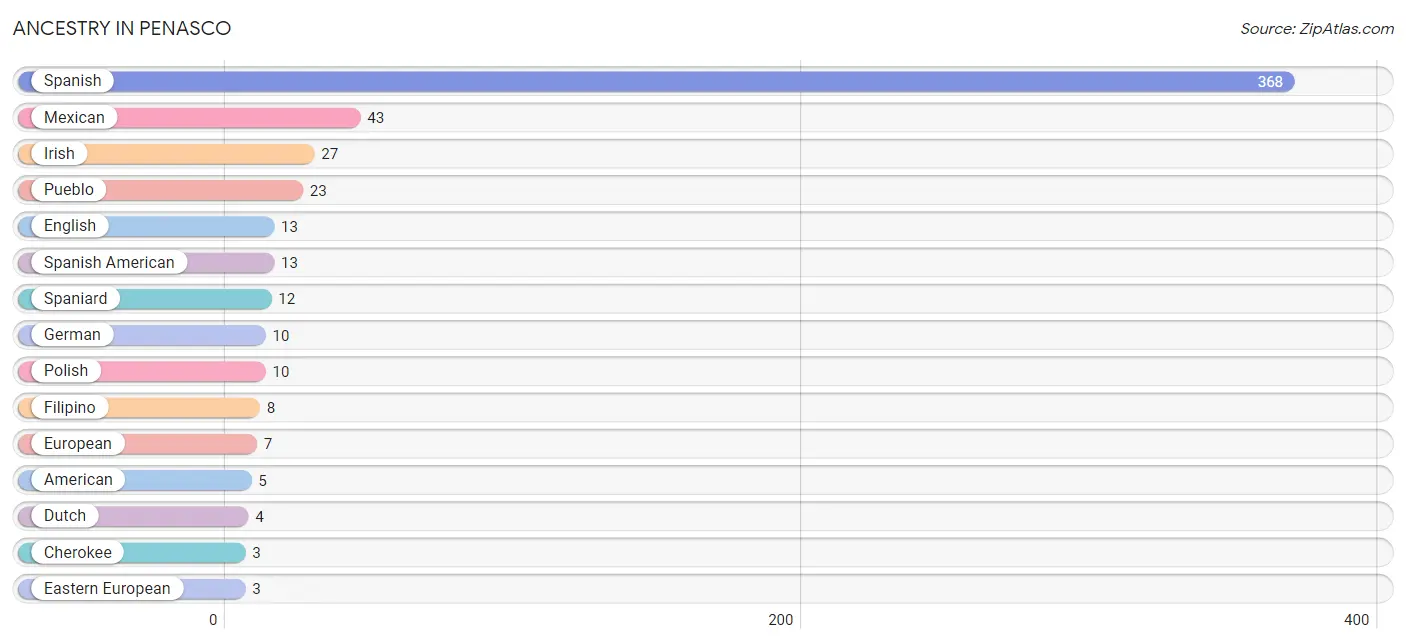
Ancestry in Penasco
The most populous ancestries reported in Penasco are Spanish (368 | 52.0%), Mexican (43 | 6.1%), Irish (27 | 3.8%), Pueblo (23 | 3.3%), and English (13 | 1.8%), together accounting for 66.9% of all Penasco residents.
| Ancestry | # Population | % Population |
| African | 2 | 0.3% |
| Aleut | 1 | 0.1% |
| American | 5 | 0.7% |
| British | 2 | 0.3% |
| Central American | 1 | 0.1% |
| Cherokee | 3 | 0.4% |
| Danish | 2 | 0.3% |
| Dutch | 4 | 0.6% |
| Eastern European | 3 | 0.4% |
| English | 13 | 1.8% |
| European | 7 | 1.0% |
| Filipino | 8 | 1.1% |
| Finnish | 1 | 0.1% |
| French | 3 | 0.4% |
| German | 10 | 1.4% |
| Irish | 27 | 3.8% |
| Italian | 3 | 0.4% |
| Korean | 3 | 0.4% |
| Mexican | 43 | 6.1% |
| Navajo | 3 | 0.4% |
| Nicaraguan | 1 | 0.1% |
| Norwegian | 1 | 0.1% |
| Pima | 2 | 0.3% |
| Polish | 10 | 1.4% |
| Pueblo | 23 | 3.3% |
| Scandinavian | 1 | 0.1% |
| Scotch-Irish | 1 | 0.1% |
| Spaniard | 12 | 1.7% |
| Spanish | 368 | 52.0% |
| Spanish American | 13 | 1.8% |
| Subsaharan African | 2 | 0.3% |
| Swedish | 1 | 0.1% | View All 32 Rows |
Immigrants in Penasco
The most numerous immigrant groups reported in Penasco came from Central America (2 | 0.3%), Europe (2 | 0.3%), Germany (2 | 0.3%), Latin America (2 | 0.3%), and Mexico (2 | 0.3%), together accounting for 1.4% of all Penasco residents.
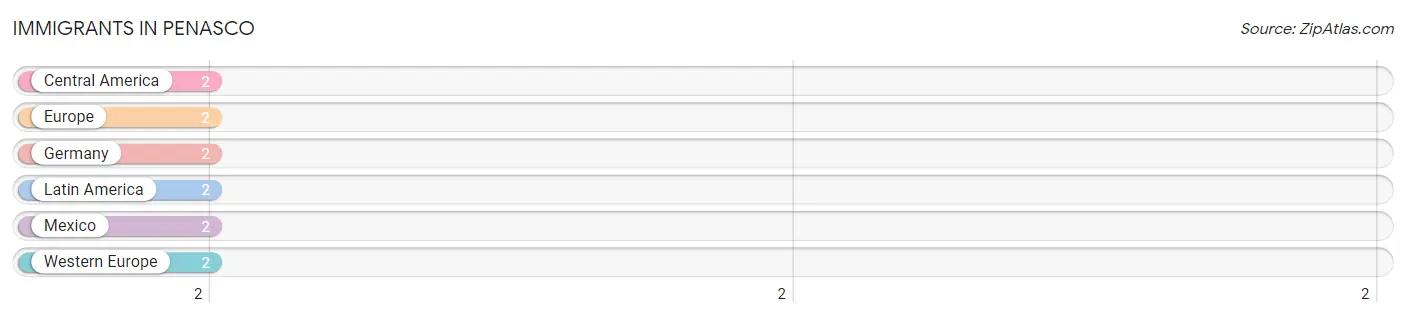
| Immigration Origin | # Population | % Population |
| Central America | 2 | 0.3% |
| Europe | 2 | 0.3% |
| Germany | 2 | 0.3% |
| Latin America | 2 | 0.3% |
| Mexico | 2 | 0.3% |
| Western Europe | 2 | 0.3% | View All 6 Rows |
Sex and Age in Penasco
Sex and Age in Penasco
The most populous age groups in Penasco are 35 to 39 Years (67 | 15.5%) for men and 25 to 29 Years (30 | 10.8%) for women.
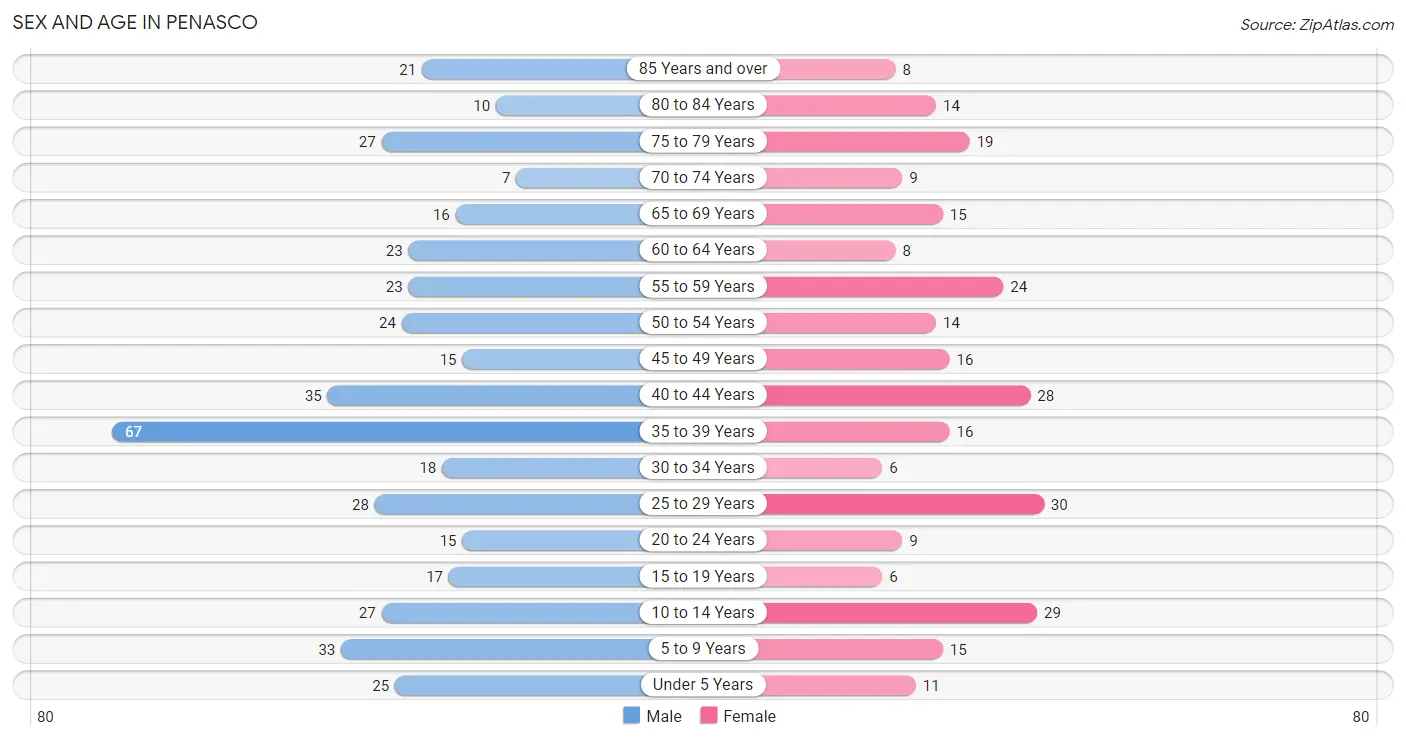
| Age Bracket | Male | Female |
| Under 5 Years | 25 (5.8%) | 11 (4.0%) |
| 5 to 9 Years | 33 (7.7%) | 15 (5.4%) |
| 10 to 14 Years | 27 (6.3%) | 29 (10.5%) |
| 15 to 19 Years | 17 (3.9%) | 6 (2.2%) |
| 20 to 24 Years | 15 (3.5%) | 9 (3.3%) |
| 25 to 29 Years | 28 (6.5%) | 30 (10.8%) |
| 30 to 34 Years | 18 (4.2%) | 6 (2.2%) |
| 35 to 39 Years | 67 (15.5%) | 16 (5.8%) |
| 40 to 44 Years | 35 (8.1%) | 28 (10.1%) |
| 45 to 49 Years | 15 (3.5%) | 16 (5.8%) |
| 50 to 54 Years | 24 (5.6%) | 14 (5.1%) |
| 55 to 59 Years | 23 (5.3%) | 24 (8.7%) |
| 60 to 64 Years | 23 (5.3%) | 8 (2.9%) |
| 65 to 69 Years | 16 (3.7%) | 15 (5.4%) |
| 70 to 74 Years | 7 (1.6%) | 9 (3.3%) |
| 75 to 79 Years | 27 (6.3%) | 19 (6.9%) |
| 80 to 84 Years | 10 (2.3%) | 14 (5.1%) |
| 85 Years and over | 21 (4.9%) | 8 (2.9%) |
| Total | 431 (100.0%) | 277 (100.0%) |
Families and Households in Penasco
Median Family Size in Penasco
The median family size in Penasco is 3.83 persons per family, with married-couple families (76 | 51.7%) accounting for the largest median family size of 4.07 persons per family. On the other hand, single female/mother families (38 | 25.9%) represent the smallest median family size with 3.24 persons per family.
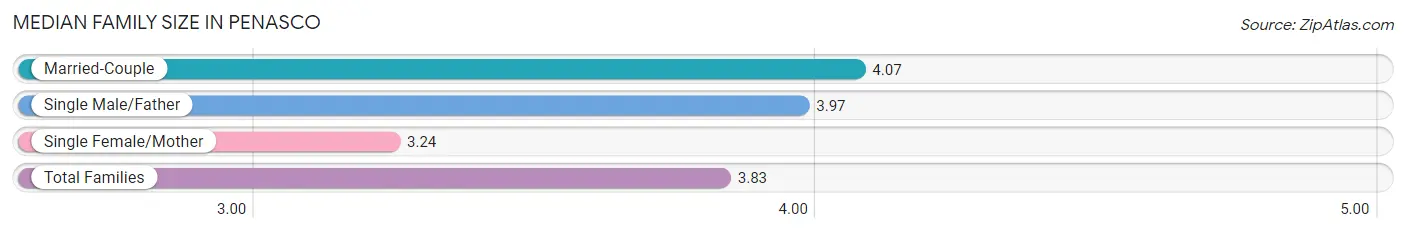
| Family Type | # Families | Family Size |
| Married-Couple | 76 (51.7%) | 4.07 |
| Single Male/Father | 33 (22.5%) | 3.97 |
| Single Female/Mother | 38 (25.9%) | 3.24 |
| Total Families | 147 (100.0%) | 3.83 |
Median Household Size in Penasco
The median household size in Penasco is 2.74 persons per household, with single male/father households (33 | 12.8%) accounting for the largest median household size of 4.61 persons per household. non-family households (111 | 43.0%) represent the smallest median household size with 1.09 persons per household.
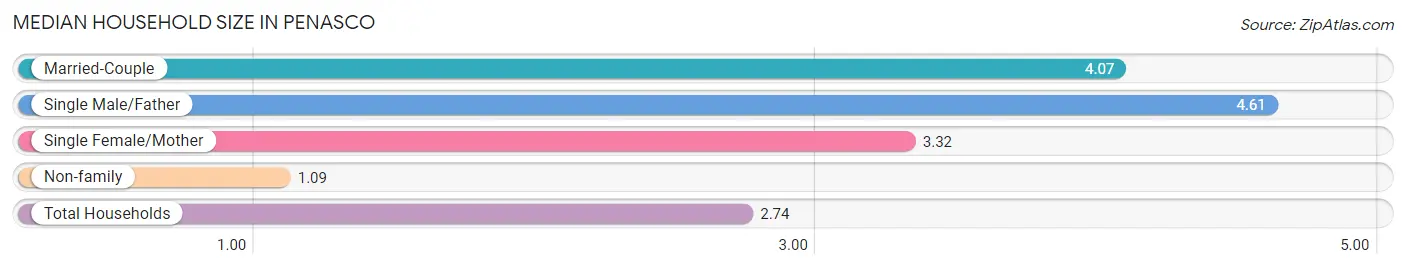
| Household Type | # Households | Household Size |
| Married-Couple | 76 (29.5%) | 4.07 |
| Single Male/Father | 33 (12.8%) | 4.61 |
| Single Female/Mother | 38 (14.7%) | 3.32 |
| Non-family | 111 (43.0%) | 1.09 |
| Total Households | 258 (100.0%) | 2.74 |
Household Size by Marriage Status in Penasco
Out of a total of 258 households in Penasco, 147 (57.0%) are family households, while 111 (43.0%) are nonfamily households. The most numerous type of family households are 2-person households, comprising 83, and the most common type of nonfamily households are 1-person households, comprising 102.
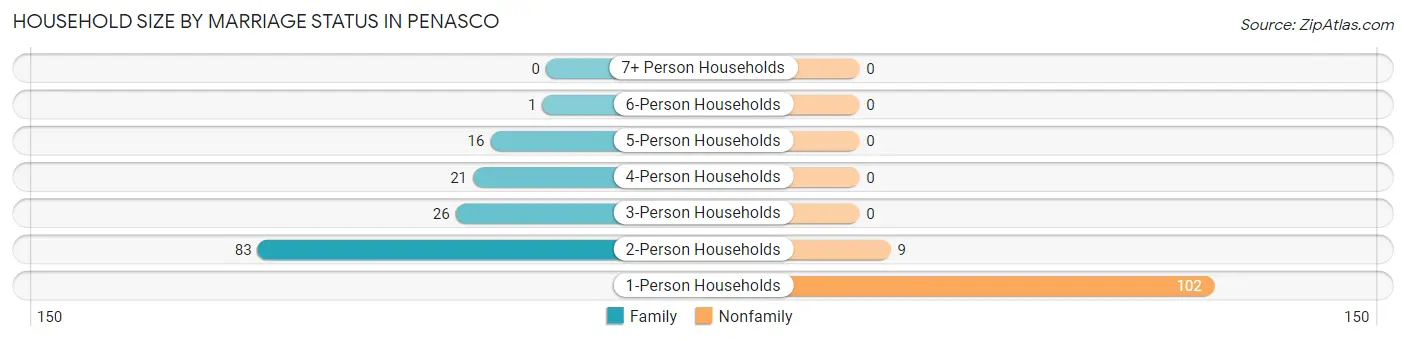
| Household Size | Family Households | Nonfamily Households |
| 1-Person Households | - | 102 (39.5%) |
| 2-Person Households | 83 (32.2%) | 9 (3.5%) |
| 3-Person Households | 26 (10.1%) | 0 (0.0%) |
| 4-Person Households | 21 (8.1%) | 0 (0.0%) |
| 5-Person Households | 16 (6.2%) | 0 (0.0%) |
| 6-Person Households | 1 (0.4%) | 0 (0.0%) |
| 7+ Person Households | 0 (0.0%) | 0 (0.0%) |
| Total | 147 (57.0%) | 111 (43.0%) |
Female Fertility in Penasco
Fertility by Age in Penasco
Average fertility rate in Penasco is 35.0 births per 1,000 women. Women in the age bracket of 20 to 34 years have the highest fertility rate with 89.0 births per 1,000 women. Women in the age bracket of 20 to 34 years acount for 100.0% of all women with births.
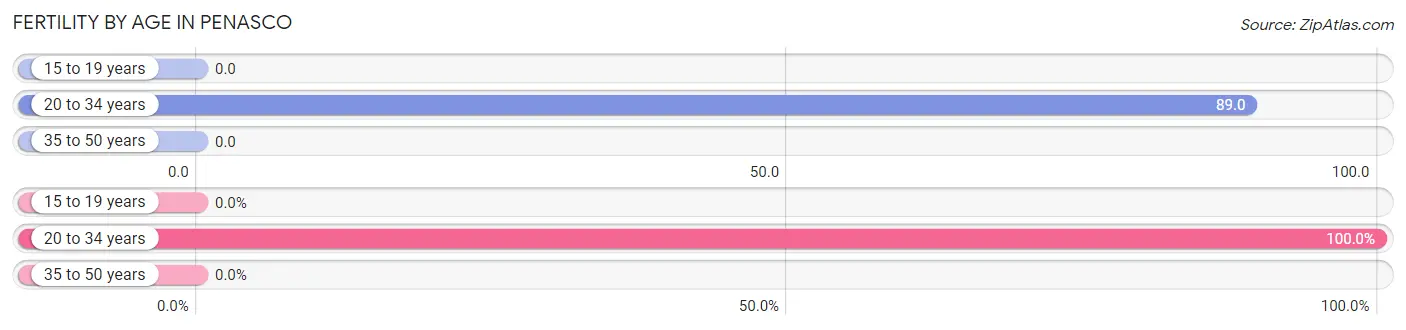
| Age Bracket | Women with Births | Births / 1,000 Women |
| 15 to 19 years | 0 (0.0%) | 0.0 |
| 20 to 34 years | 4 (100.0%) | 89.0 |
| 35 to 50 years | 0 (0.0%) | 0.0 |
| Total | 4 (100.0%) | 35.0 |
Fertility by Age by Marriage Status in Penasco
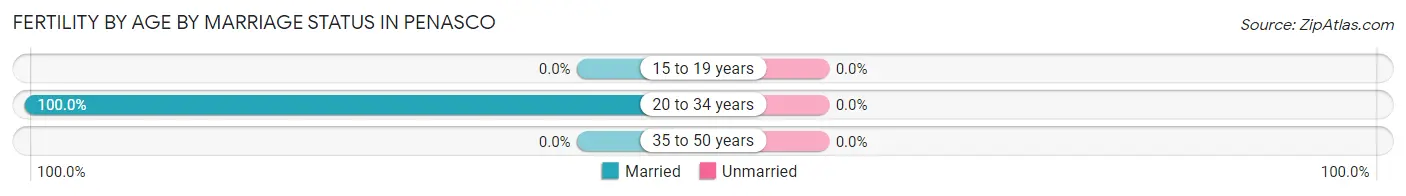
| Age Bracket | Married | Unmarried |
| 15 to 19 years | 0 (0.0%) | 0 (0.0%) |
| 20 to 34 years | 4 (100.0%) | 0 (0.0%) |
| 35 to 50 years | 0 (0.0%) | 0 (0.0%) |
| Total | 4 (100.0%) | 0 (0.0%) |
Fertility by Education in Penasco
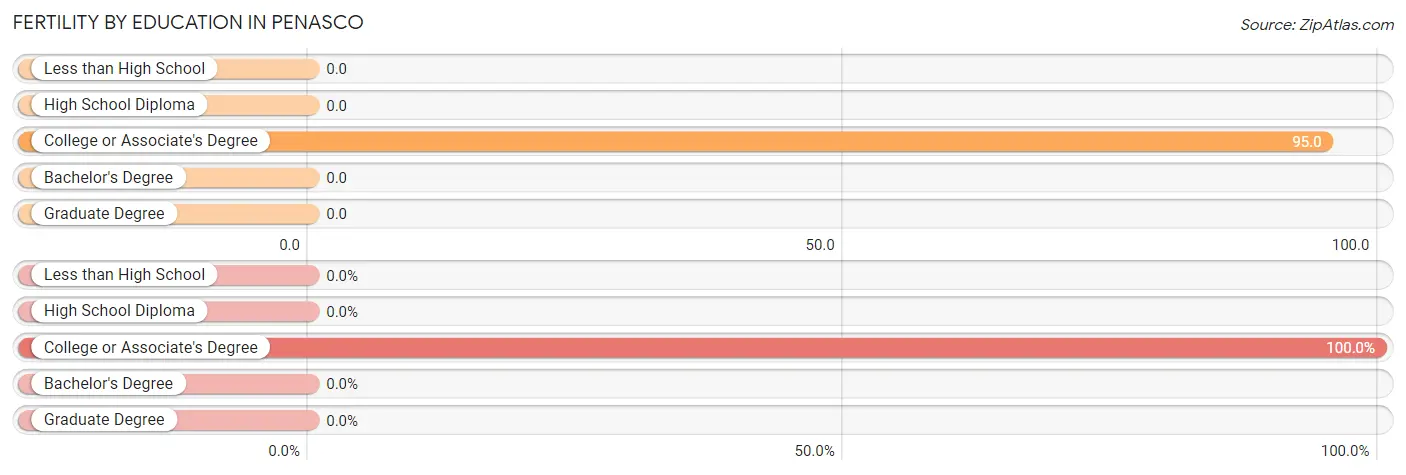
| Educational Attainment | Women with Births | Births / 1,000 Women |
| Less than High School | 0 (0.0%) | 0.0 |
| High School Diploma | 0 (0.0%) | 0.0 |
| College or Associate's Degree | 4 (100.0%) | 95.0 |
| Bachelor's Degree | 0 (0.0%) | 0.0 |
| Graduate Degree | 0 (0.0%) | 0.0 |
| Total | 4 (100.0%) | 35.0 |
Fertility by Education by Marriage Status in Penasco
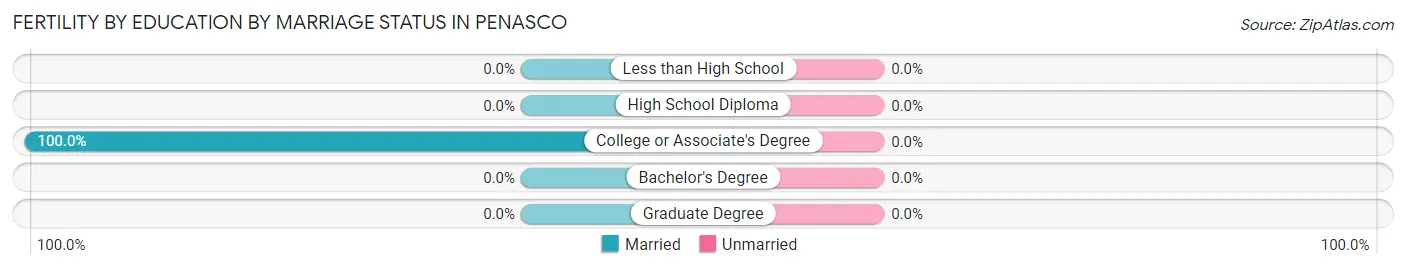
| Educational Attainment | Married | Unmarried |
| Less than High School | 0 (0.0%) | 0 (0.0%) |
| High School Diploma | 0 (0.0%) | 0 (0.0%) |
| College or Associate's Degree | 4 (100.0%) | 0 (0.0%) |
| Bachelor's Degree | 0 (0.0%) | 0 (0.0%) |
| Graduate Degree | 0 (0.0%) | 0 (0.0%) |
| Total | 4 (100.0%) | 0 (0.0%) |
Employment Characteristics in Penasco
Employment by Class of Employer in Penasco
Among the 253 employed individuals in Penasco, self-employed (not incorporated) (89 | 35.2%), private company employees (73 | 28.8%), and state government employees (26 | 10.3%) make up the most common classes of employment.
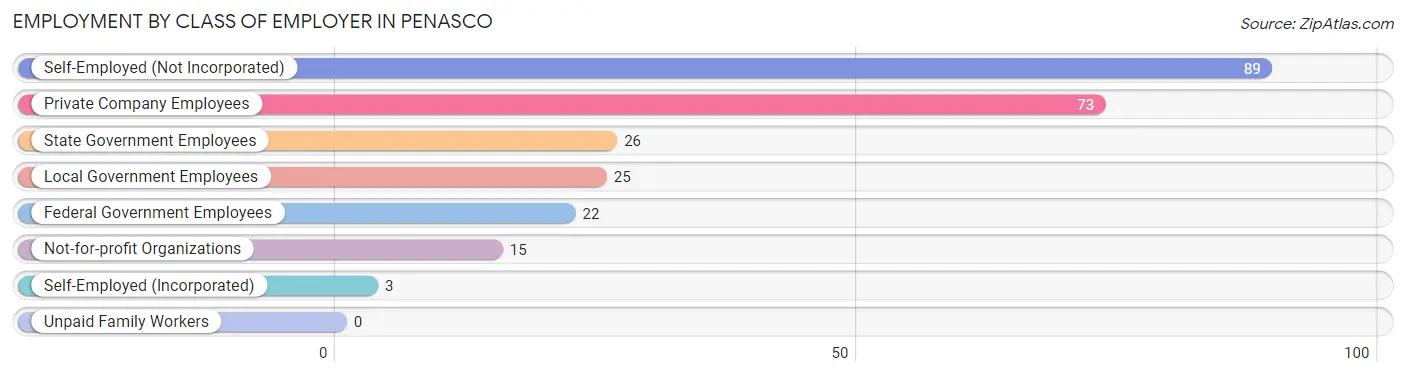
| Employer Class | # Employees | % Employees |
| Private Company Employees | 73 | 28.8% |
| Self-Employed (Incorporated) | 3 | 1.2% |
| Self-Employed (Not Incorporated) | 89 | 35.2% |
| Not-for-profit Organizations | 15 | 5.9% |
| Local Government Employees | 25 | 9.9% |
| State Government Employees | 26 | 10.3% |
| Federal Government Employees | 22 | 8.7% |
| Unpaid Family Workers | 0 | 0.0% |
| Total | 253 | 100.0% |
Employment Status by Age in Penasco
According to the labor force statistics for Penasco, out of the total population over 16 years of age (559), 47.9% or 268 individuals are in the labor force, with 5.6% or 15 of them unemployed. The age group with the highest labor force participation rate is 35 to 44 years, with 73.3% or 107 individuals in the labor force. Within the labor force, the 30 to 34 years age range has the highest percentage of unemployed individuals, with 11.8% or 2 of them being unemployed.
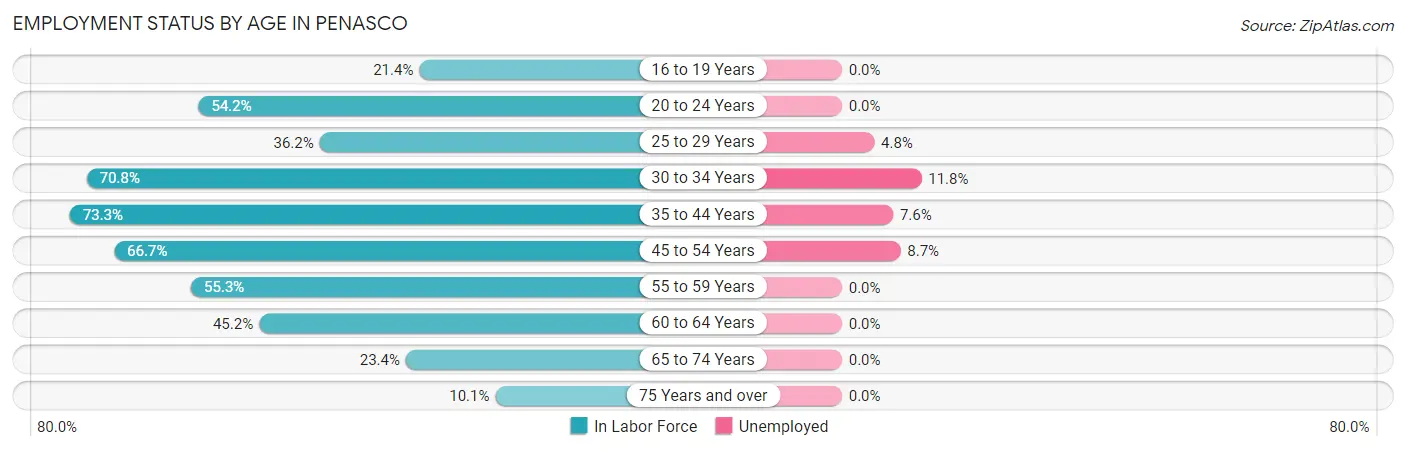
| Age Bracket | In Labor Force | Unemployed |
| 16 to 19 Years | 3 (21.4%) | 0 (0.0%) |
| 20 to 24 Years | 13 (54.2%) | 0 (0.0%) |
| 25 to 29 Years | 21 (36.2%) | 1 (4.8%) |
| 30 to 34 Years | 17 (70.8%) | 2 (11.8%) |
| 35 to 44 Years | 107 (73.3%) | 8 (7.6%) |
| 45 to 54 Years | 46 (66.7%) | 4 (8.7%) |
| 55 to 59 Years | 26 (55.3%) | 0 (0.0%) |
| 60 to 64 Years | 14 (45.2%) | 0 (0.0%) |
| 65 to 74 Years | 11 (23.4%) | 0 (0.0%) |
| 75 Years and over | 10 (10.1%) | 0 (0.0%) |
| Total | 268 (47.9%) | 15 (5.6%) |
Employment Status by Educational Attainment in Penasco
According to labor force statistics for Penasco, 61.6% of individuals (231) out of the total population between 25 and 64 years of age (375) are in the labor force, with 6.6% or 15 of them being unemployed. The group with the highest labor force participation rate are those with the educational attainment of bachelor's degree or higher, with 73.5% or 36 individuals in the labor force. Within the labor force, individuals with college / associate degree education have the highest percentage of unemployment, with 11.1% or 9 of them being unemployed.
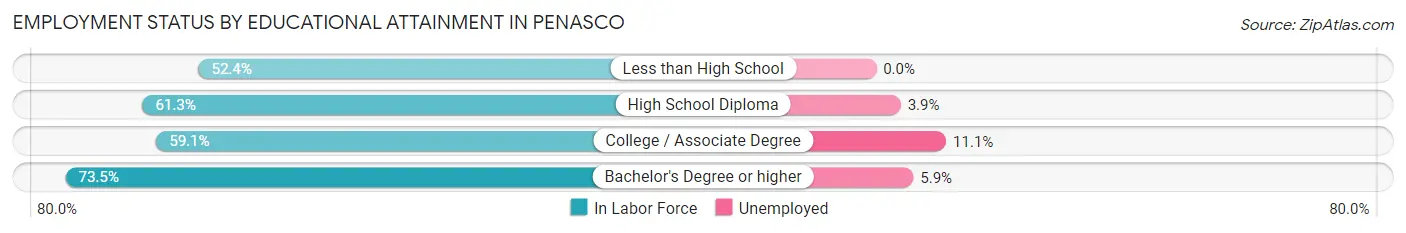
| Educational Attainment | In Labor Force | Unemployed |
| Less than High School | 11 (52.4%) | 0 (0.0%) |
| High School Diploma | 103 (61.3%) | 7 (3.9%) |
| College / Associate Degree | 81 (59.1%) | 15 (11.1%) |
| Bachelor's Degree or higher | 36 (73.5%) | 3 (5.9%) |
| Total | 231 (61.6%) | 25 (6.6%) |
Employment Occupations by Sex in Penasco
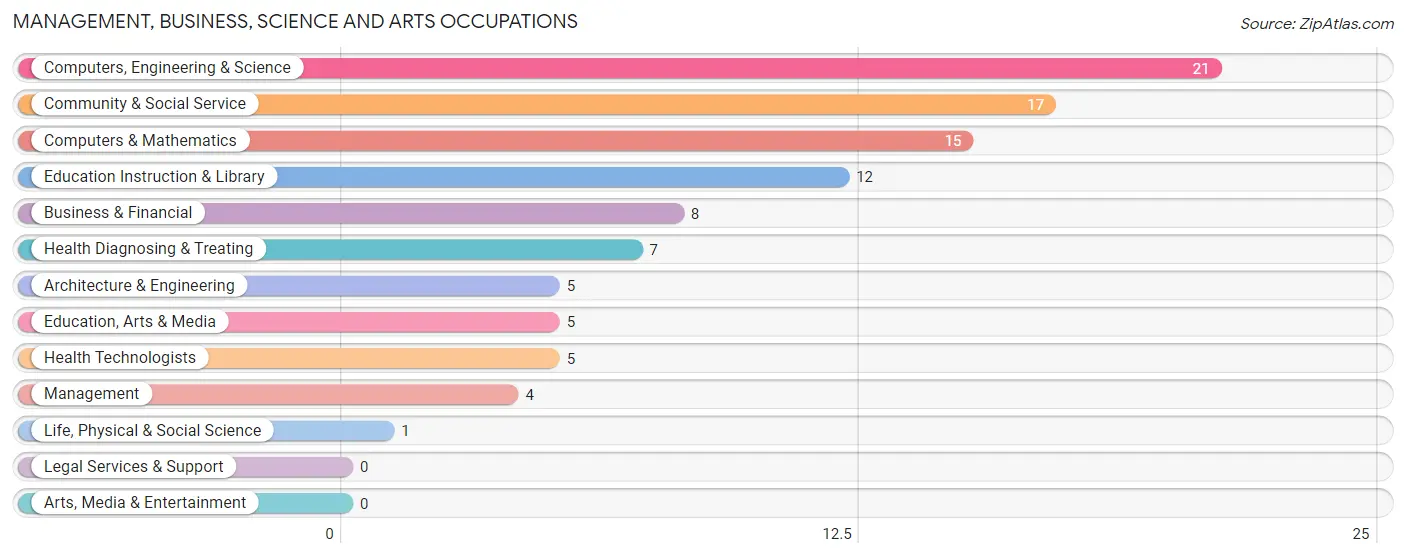
Management, Business, Science and Arts Occupations
The most common Management, Business, Science and Arts occupations in Penasco are Computers, Engineering & Science (21 | 8.4%), Community & Social Service (17 | 6.8%), Computers & Mathematics (15 | 6.0%), Education Instruction & Library (12 | 4.8%), and Business & Financial (8 | 3.2%).
Management, Business, Science and Arts Occupations by Sex
Within the Management, Business, Science and Arts occupations in Penasco, the most male-oriented occupations are Business & Financial (100.0%), Architecture & Engineering (100.0%), and Life, Physical & Social Science (100.0%), while the most female-oriented occupations are Management (75.0%), Education Instruction & Library (75.0%), and Community & Social Service (70.6%).
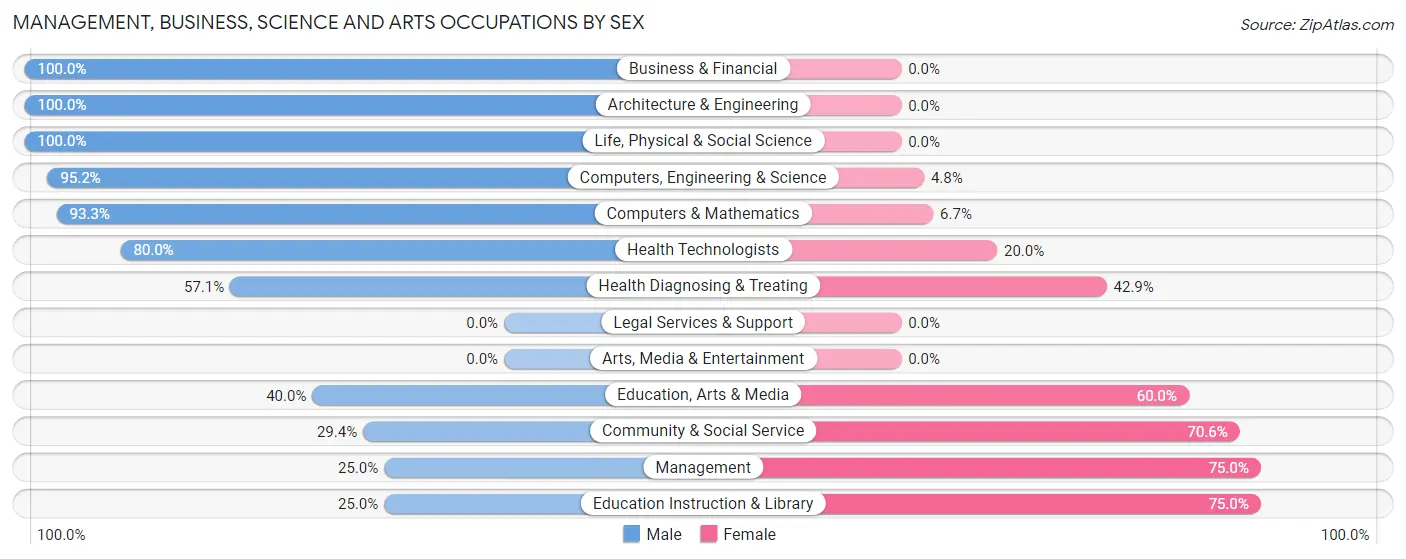
| Occupation | Male | Female |
| Management | 1 (25.0%) | 3 (75.0%) |
| Business & Financial | 8 (100.0%) | 0 (0.0%) |
| Computers, Engineering & Science | 20 (95.2%) | 1 (4.8%) |
| Computers & Mathematics | 14 (93.3%) | 1 (6.7%) |
| Architecture & Engineering | 5 (100.0%) | 0 (0.0%) |
| Life, Physical & Social Science | 1 (100.0%) | 0 (0.0%) |
| Community & Social Service | 5 (29.4%) | 12 (70.6%) |
| Education, Arts & Media | 2 (40.0%) | 3 (60.0%) |
| Legal Services & Support | 0 (0.0%) | 0 (0.0%) |
| Education Instruction & Library | 3 (25.0%) | 9 (75.0%) |
| Arts, Media & Entertainment | 0 (0.0%) | 0 (0.0%) |
| Health Diagnosing & Treating | 4 (57.1%) | 3 (42.9%) |
| Health Technologists | 4 (80.0%) | 1 (20.0%) |
| Total (Category) | 38 (66.7%) | 19 (33.3%) |
| Total (Overall) | 167 (66.5%) | 84 (33.5%) |
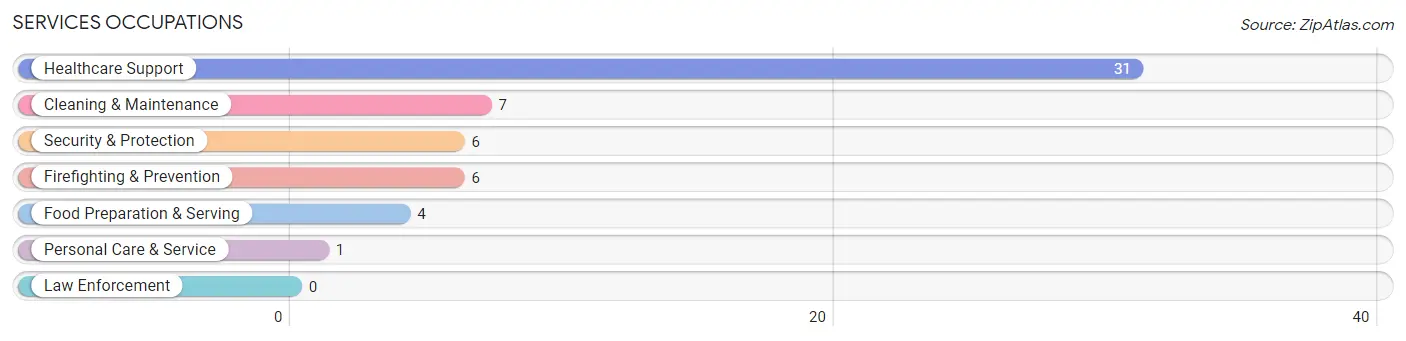
Services Occupations
The most common Services occupations in Penasco are Healthcare Support (31 | 12.3%), Cleaning & Maintenance (7 | 2.8%), Security & Protection (6 | 2.4%), Firefighting & Prevention (6 | 2.4%), and Food Preparation & Serving (4 | 1.6%).
Services Occupations by Sex
Within the Services occupations in Penasco, the most male-oriented occupations are Security & Protection (100.0%), Firefighting & Prevention (100.0%), and Personal Care & Service (100.0%), while the most female-oriented occupations are Healthcare Support (74.2%), Cleaning & Maintenance (71.4%), and Food Preparation & Serving (25.0%).
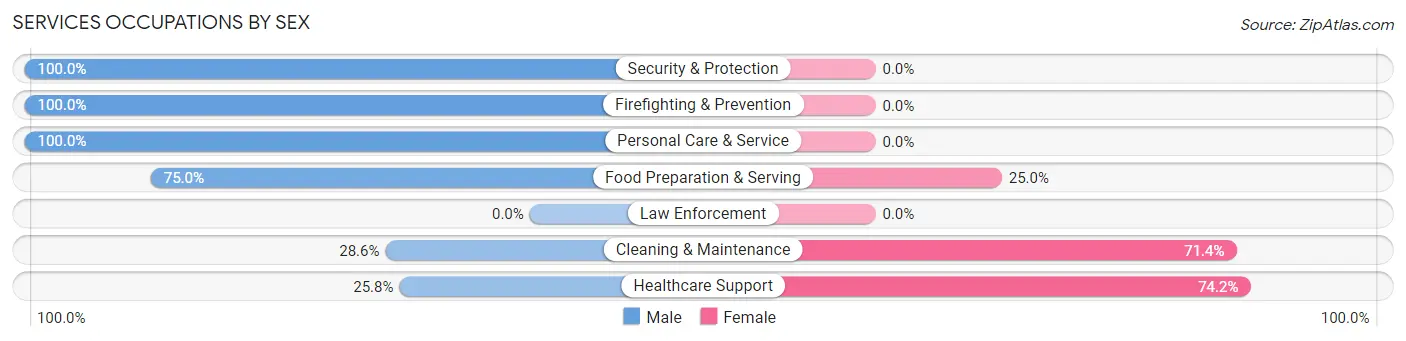
| Occupation | Male | Female |
| Healthcare Support | 8 (25.8%) | 23 (74.2%) |
| Security & Protection | 6 (100.0%) | 0 (0.0%) |
| Firefighting & Prevention | 6 (100.0%) | 0 (0.0%) |
| Law Enforcement | 0 (0.0%) | 0 (0.0%) |
| Food Preparation & Serving | 3 (75.0%) | 1 (25.0%) |
| Cleaning & Maintenance | 2 (28.6%) | 5 (71.4%) |
| Personal Care & Service | 1 (100.0%) | 0 (0.0%) |
| Total (Category) | 20 (40.8%) | 29 (59.2%) |
| Total (Overall) | 167 (66.5%) | 84 (33.5%) |
Sales and Office Occupations
The most common Sales and Office occupations in Penasco are Office & Administration (28 | 11.2%), and Sales & Related (24 | 9.6%).

Sales and Office Occupations by Sex

| Occupation | Male | Female |
| Sales & Related | 14 (58.3%) | 10 (41.7%) |
| Office & Administration | 3 (10.7%) | 25 (89.3%) |
| Total (Category) | 17 (32.7%) | 35 (67.3%) |
| Total (Overall) | 167 (66.5%) | 84 (33.5%) |
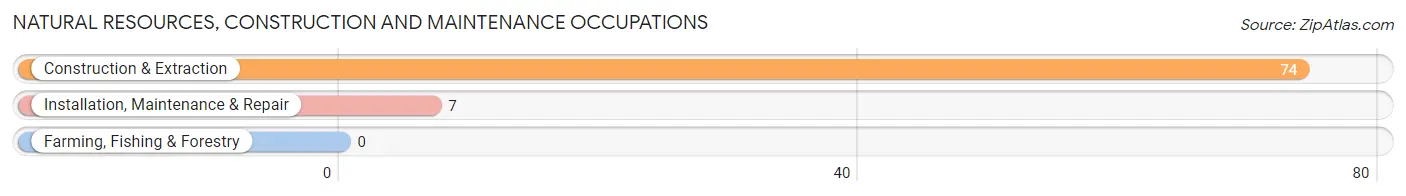
Natural Resources, Construction and Maintenance Occupations
The most common Natural Resources, Construction and Maintenance occupations in Penasco are Construction & Extraction (74 | 29.5%), and Installation, Maintenance & Repair (7 | 2.8%).
Natural Resources, Construction and Maintenance Occupations by Sex
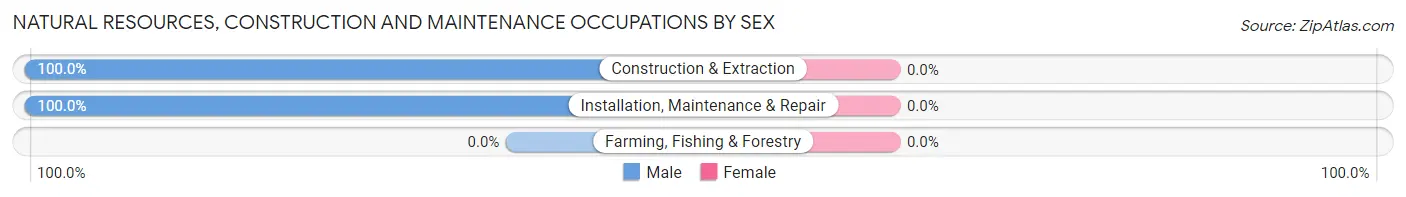
| Occupation | Male | Female |
| Farming, Fishing & Forestry | 0 (0.0%) | 0 (0.0%) |
| Construction & Extraction | 74 (100.0%) | 0 (0.0%) |
| Installation, Maintenance & Repair | 7 (100.0%) | 0 (0.0%) |
| Total (Category) | 81 (100.0%) | 0 (0.0%) |
| Total (Overall) | 167 (66.5%) | 84 (33.5%) |
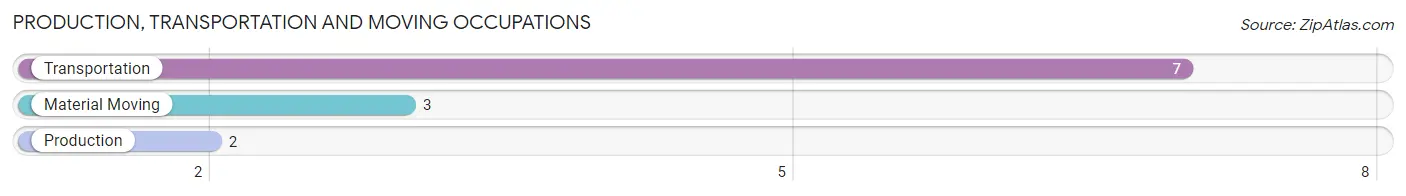
Production, Transportation and Moving Occupations
The most common Production, Transportation and Moving occupations in Penasco are Transportation (7 | 2.8%), Material Moving (3 | 1.2%), and Production (2 | 0.8%).
Production, Transportation and Moving Occupations by Sex
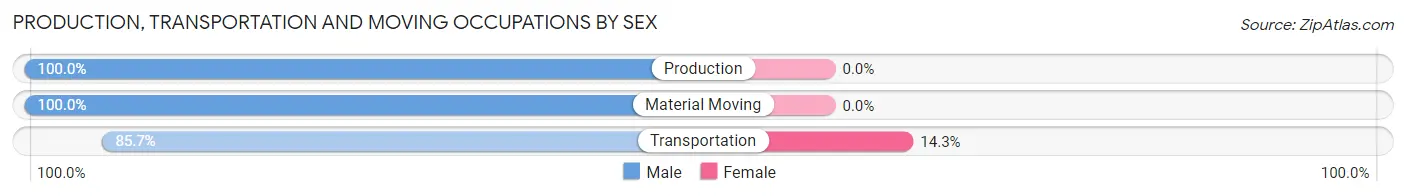
| Occupation | Male | Female |
| Production | 2 (100.0%) | 0 (0.0%) |
| Transportation | 6 (85.7%) | 1 (14.3%) |
| Material Moving | 3 (100.0%) | 0 (0.0%) |
| Total (Category) | 11 (91.7%) | 1 (8.3%) |
| Total (Overall) | 167 (66.5%) | 84 (33.5%) |
Employment Industries by Sex in Penasco
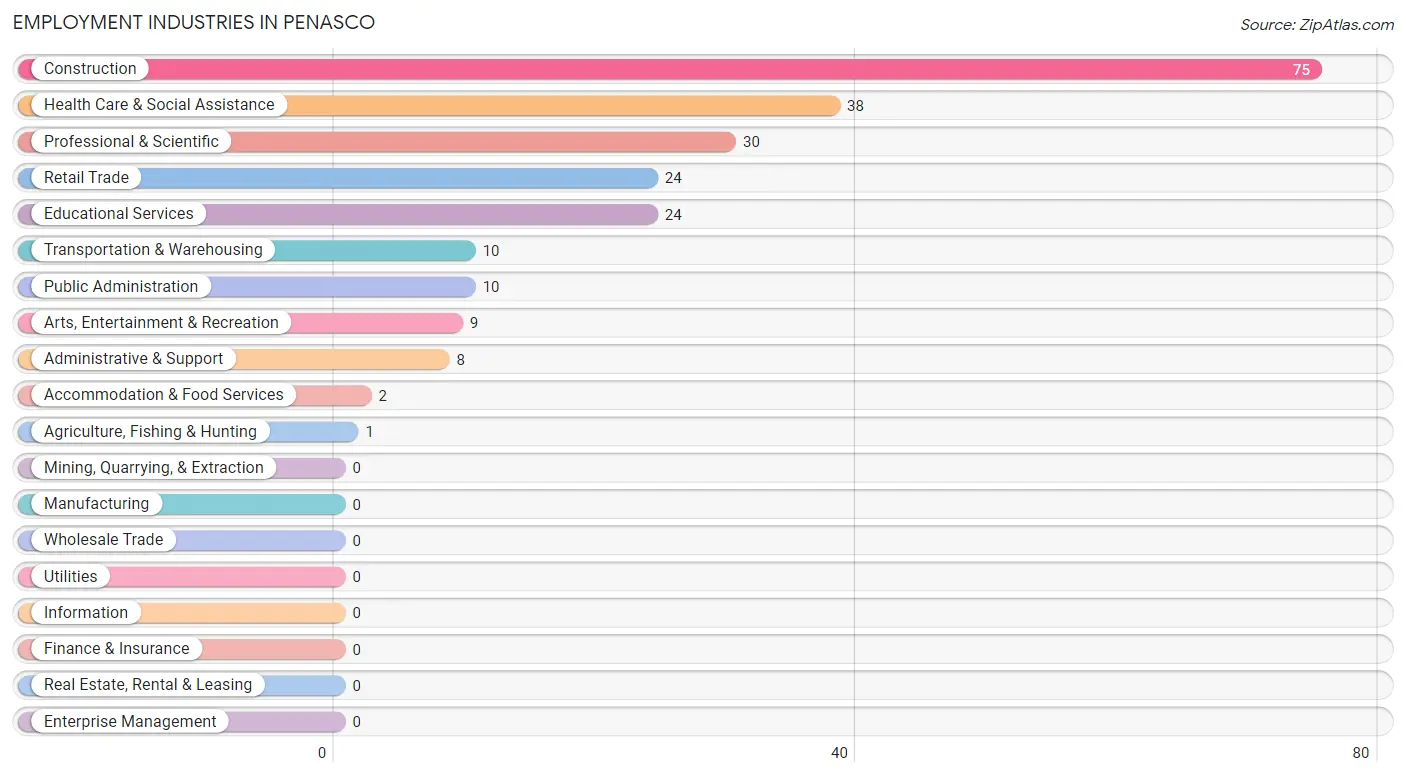
Employment Industries in Penasco
The major employment industries in Penasco include Construction (75 | 29.9%), Health Care & Social Assistance (38 | 15.1%), Professional & Scientific (30 | 11.9%), Retail Trade (24 | 9.6%), and Educational Services (24 | 9.6%).
Employment Industries by Sex in Penasco
The Penasco industries that see more men than women are Agriculture, Fishing & Hunting (100.0%), Construction (100.0%), and Arts, Entertainment & Recreation (100.0%), whereas the industries that tend to have a higher number of women are Administrative & Support (87.5%), Health Care & Social Assistance (76.3%), and Educational Services (62.5%).
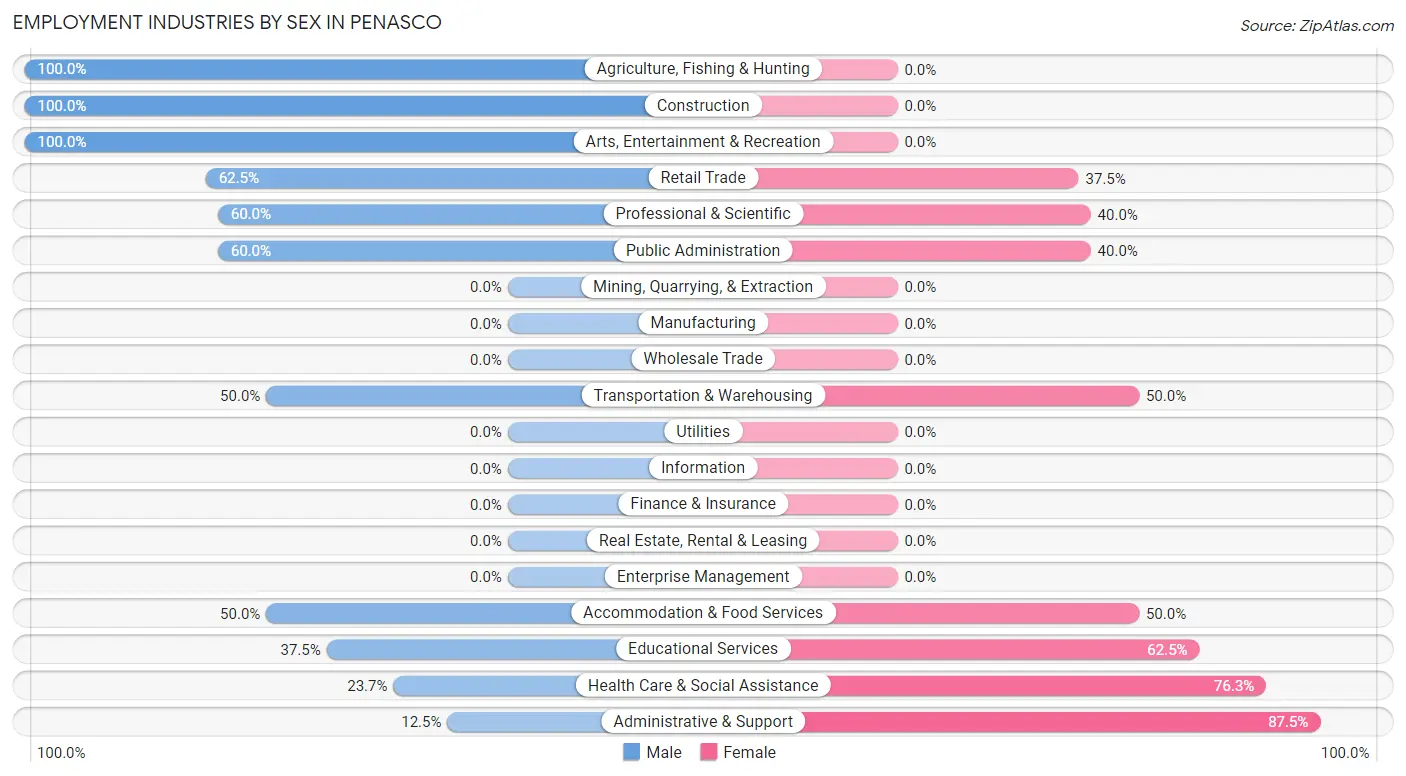
| Industry | Male | Female |
| Agriculture, Fishing & Hunting | 1 (100.0%) | 0 (0.0%) |
| Mining, Quarrying, & Extraction | 0 (0.0%) | 0 (0.0%) |
| Construction | 75 (100.0%) | 0 (0.0%) |
| Manufacturing | 0 (0.0%) | 0 (0.0%) |
| Wholesale Trade | 0 (0.0%) | 0 (0.0%) |
| Retail Trade | 15 (62.5%) | 9 (37.5%) |
| Transportation & Warehousing | 5 (50.0%) | 5 (50.0%) |
| Utilities | 0 (0.0%) | 0 (0.0%) |
| Information | 0 (0.0%) | 0 (0.0%) |
| Finance & Insurance | 0 (0.0%) | 0 (0.0%) |
| Real Estate, Rental & Leasing | 0 (0.0%) | 0 (0.0%) |
| Professional & Scientific | 18 (60.0%) | 12 (40.0%) |
| Enterprise Management | 0 (0.0%) | 0 (0.0%) |
| Administrative & Support | 1 (12.5%) | 7 (87.5%) |
| Educational Services | 9 (37.5%) | 15 (62.5%) |
| Health Care & Social Assistance | 9 (23.7%) | 29 (76.3%) |
| Arts, Entertainment & Recreation | 9 (100.0%) | 0 (0.0%) |
| Accommodation & Food Services | 1 (50.0%) | 1 (50.0%) |
| Public Administration | 6 (60.0%) | 4 (40.0%) |
| Total | 167 (66.5%) | 84 (33.5%) |
Education in Penasco
School Enrollment in Penasco
The most common levels of schooling among the 157 students in Penasco are middle school (50 | 31.9%), elementary school (41 | 26.1%), and high school (19 | 12.1%).
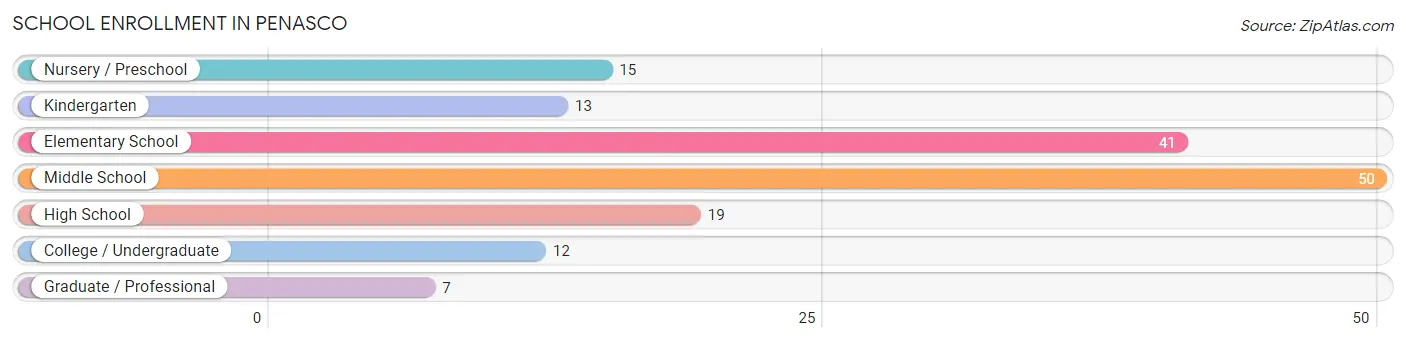
| School Level | # Students | % Students |
| Nursery / Preschool | 15 | 9.6% |
| Kindergarten | 13 | 8.3% |
| Elementary School | 41 | 26.1% |
| Middle School | 50 | 31.9% |
| High School | 19 | 12.1% |
| College / Undergraduate | 12 | 7.6% |
| Graduate / Professional | 7 | 4.5% |
| Total | 157 | 100.0% |
School Enrollment by Age by Funding Source in Penasco
Out of a total of 157 students who are enrolled in schools in Penasco, 5 (3.2%) attend a private institution, while the remaining 152 (96.8%) are enrolled in public schools. The age group of 35 years and over has the highest likelihood of being enrolled in private schools, with 3 (100.0% in the age bracket) enrolled. Conversely, the age group of 3 to 4 year olds has the lowest likelihood of being enrolled in a private school, with 15 (100.0% in the age bracket) attending a public institution.
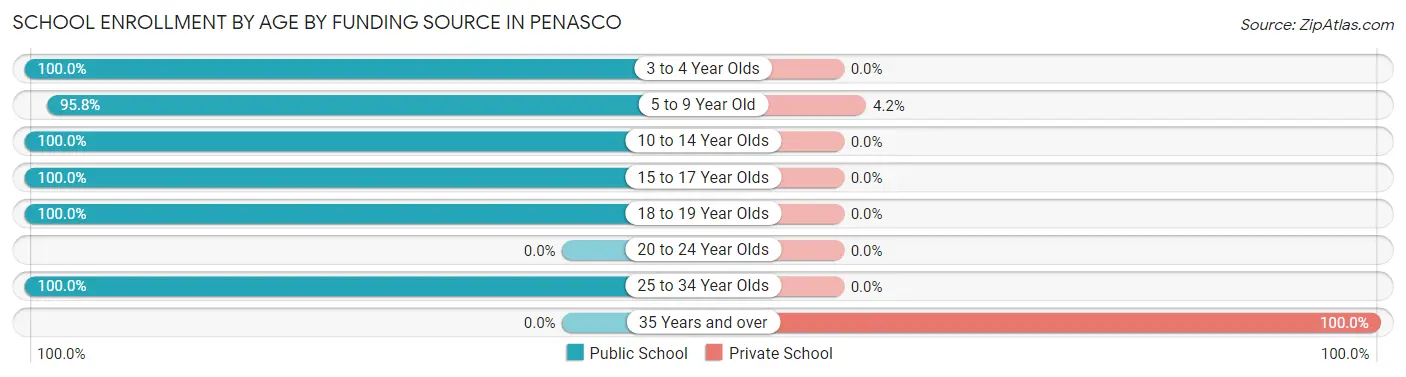
| Age Bracket | Public School | Private School |
| 3 to 4 Year Olds | 15 (100.0%) | 0 (0.0%) |
| 5 to 9 Year Old | 46 (95.8%) | 2 (4.2%) |
| 10 to 14 Year Olds | 56 (100.0%) | 0 (0.0%) |
| 15 to 17 Year Olds | 16 (100.0%) | 0 (0.0%) |
| 18 to 19 Year Olds | 5 (100.0%) | 0 (0.0%) |
| 20 to 24 Year Olds | 0 (0.0%) | 0 (0.0%) |
| 25 to 34 Year Olds | 14 (100.0%) | 0 (0.0%) |
| 35 Years and over | 0 (0.0%) | 3 (100.0%) |
| Total | 152 (96.8%) | 5 (3.2%) |
Educational Attainment by Field of Study in Penasco
Business (16 | 22.5%), education (15 | 21.1%), engineering (7 | 9.9%), science & technology (7 | 9.9%), and social sciences (6 | 8.5%) are the most common fields of study among 71 individuals in Penasco who have obtained a bachelor's degree or higher.
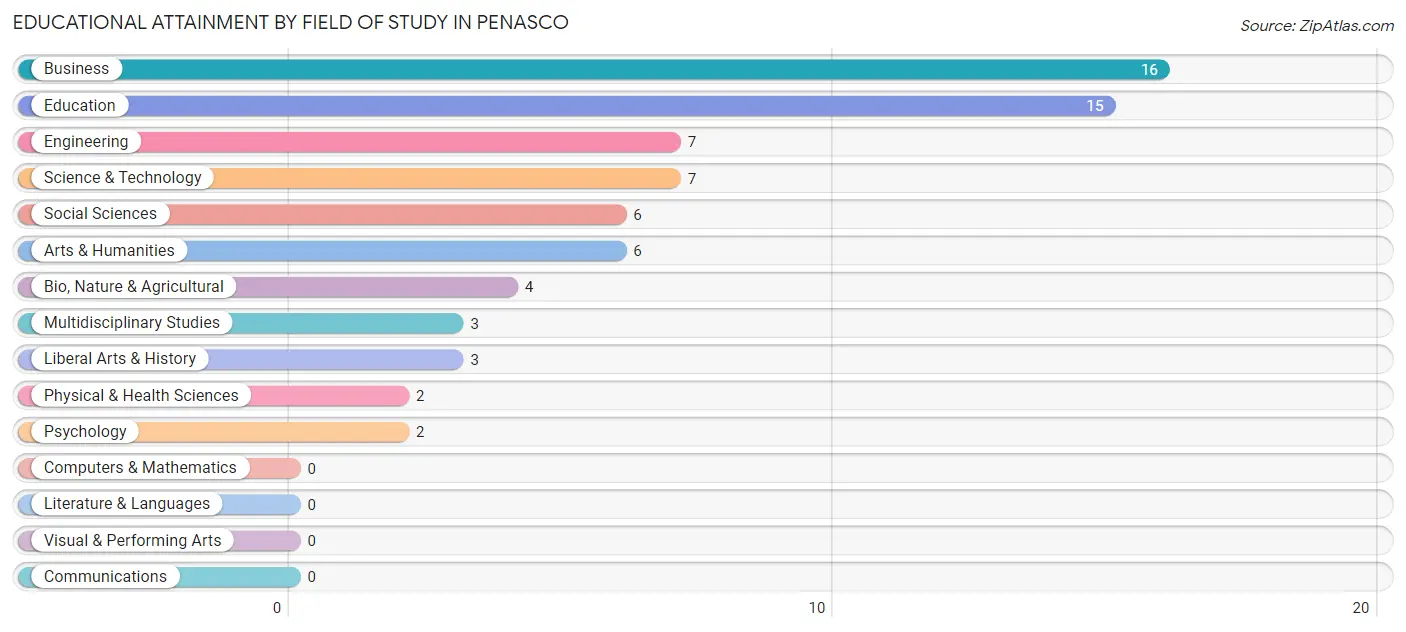
| Field of Study | # Graduates | % Graduates |
| Computers & Mathematics | 0 | 0.0% |
| Bio, Nature & Agricultural | 4 | 5.6% |
| Physical & Health Sciences | 2 | 2.8% |
| Psychology | 2 | 2.8% |
| Social Sciences | 6 | 8.5% |
| Engineering | 7 | 9.9% |
| Multidisciplinary Studies | 3 | 4.2% |
| Science & Technology | 7 | 9.9% |
| Business | 16 | 22.5% |
| Education | 15 | 21.1% |
| Literature & Languages | 0 | 0.0% |
| Liberal Arts & History | 3 | 4.2% |
| Visual & Performing Arts | 0 | 0.0% |
| Communications | 0 | 0.0% |
| Arts & Humanities | 6 | 8.5% |
| Total | 71 | 100.0% |
Transportation & Commute in Penasco
Vehicle Availability by Sex in Penasco
The most prevalent vehicle ownership categories in Penasco are males with 2 vehicles (85, accounting for 50.9%) and females with 2 vehicles (44, making up 98.8%).
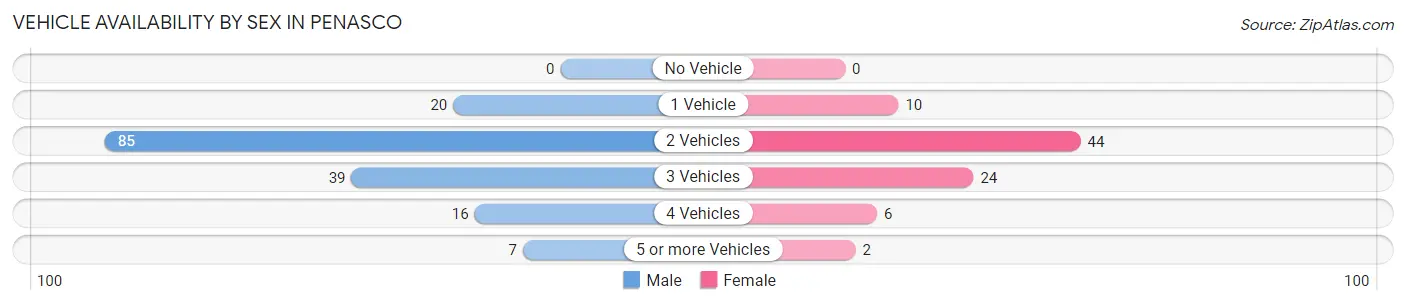
| Vehicles Available | Male | Female |
| No Vehicle | 0 (0.0%) | 0 (0.0%) |
| 1 Vehicle | 20 (12.0%) | 10 (11.6%) |
| 2 Vehicles | 85 (50.9%) | 44 (51.2%) |
| 3 Vehicles | 39 (23.4%) | 24 (27.9%) |
| 4 Vehicles | 16 (9.6%) | 6 (7.0%) |
| 5 or more Vehicles | 7 (4.2%) | 2 (2.3%) |
| Total | 167 (100.0%) | 86 (100.0%) |
Commute Time in Penasco
The most frequently occuring commute durations in Penasco are 5 to 9 minutes (68 commuters, 32.5%), 10 to 14 minutes (27 commuters, 12.9%), and 60 to 89 minutes (24 commuters, 11.5%).
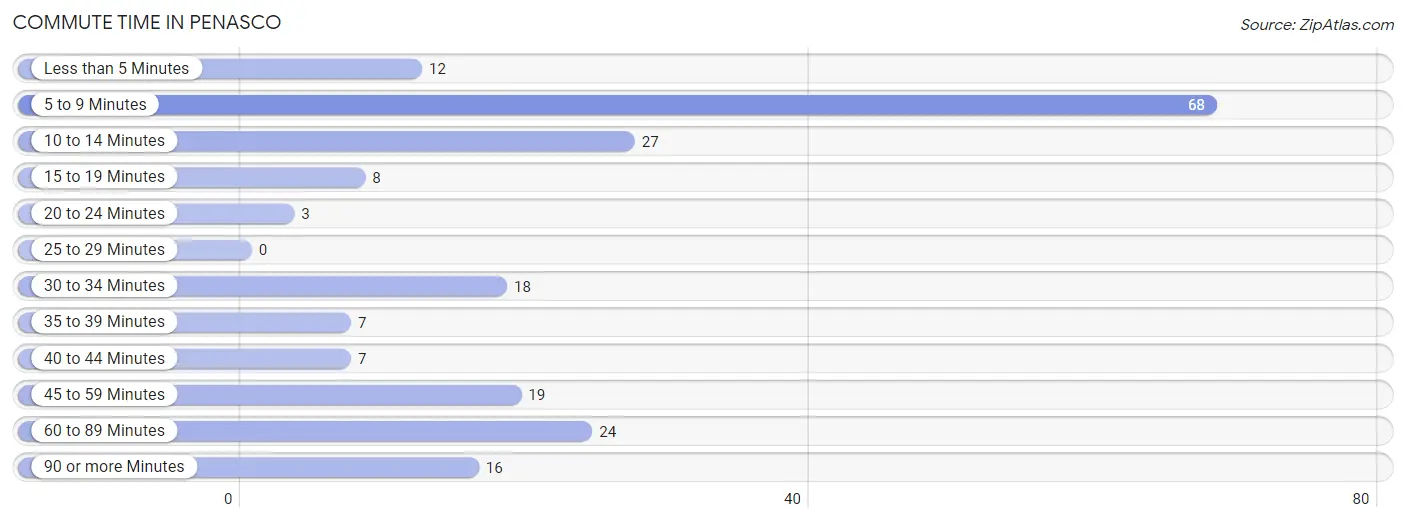
| Commute Time | # Commuters | % Commuters |
| Less than 5 Minutes | 12 | 5.7% |
| 5 to 9 Minutes | 68 | 32.5% |
| 10 to 14 Minutes | 27 | 12.9% |
| 15 to 19 Minutes | 8 | 3.8% |
| 20 to 24 Minutes | 3 | 1.4% |
| 25 to 29 Minutes | 0 | 0.0% |
| 30 to 34 Minutes | 18 | 8.6% |
| 35 to 39 Minutes | 7 | 3.4% |
| 40 to 44 Minutes | 7 | 3.4% |
| 45 to 59 Minutes | 19 | 9.1% |
| 60 to 89 Minutes | 24 | 11.5% |
| 90 or more Minutes | 16 | 7.7% |
Commute Time by Sex in Penasco
The most common commute times in Penasco are 5 to 9 minutes (56 commuters, 40.9%) for males and 10 to 14 minutes (21 commuters, 29.2%) for females.
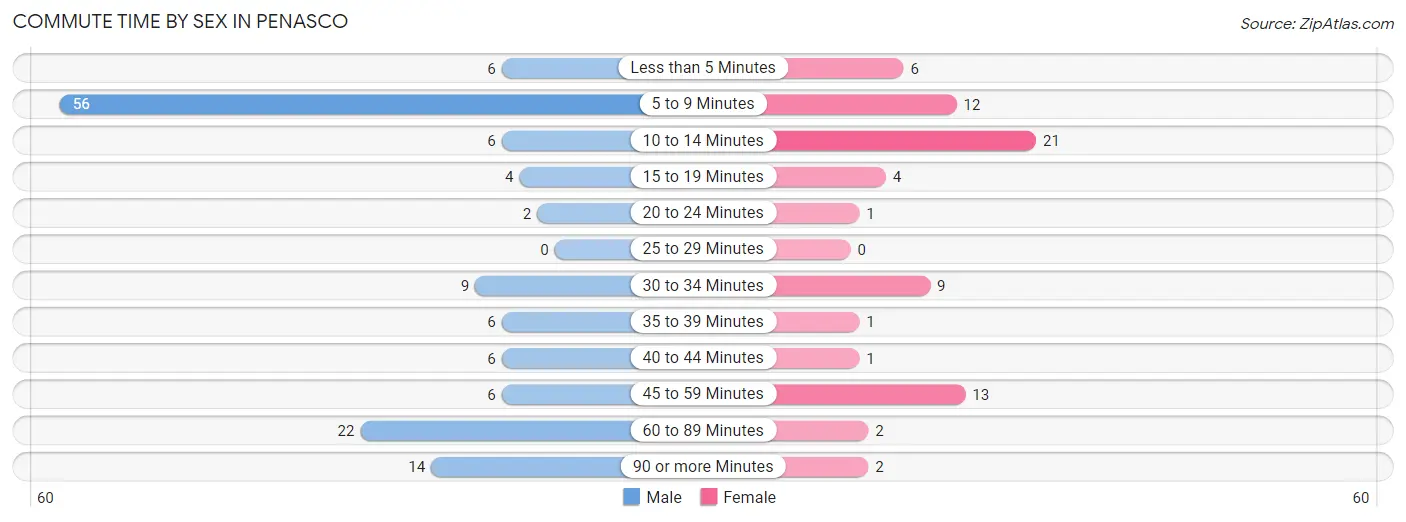
| Commute Time | Male | Female |
| Less than 5 Minutes | 6 (4.4%) | 6 (8.3%) |
| 5 to 9 Minutes | 56 (40.9%) | 12 (16.7%) |
| 10 to 14 Minutes | 6 (4.4%) | 21 (29.2%) |
| 15 to 19 Minutes | 4 (2.9%) | 4 (5.6%) |
| 20 to 24 Minutes | 2 (1.5%) | 1 (1.4%) |
| 25 to 29 Minutes | 0 (0.0%) | 0 (0.0%) |
| 30 to 34 Minutes | 9 (6.6%) | 9 (12.5%) |
| 35 to 39 Minutes | 6 (4.4%) | 1 (1.4%) |
| 40 to 44 Minutes | 6 (4.4%) | 1 (1.4%) |
| 45 to 59 Minutes | 6 (4.4%) | 13 (18.1%) |
| 60 to 89 Minutes | 22 (16.1%) | 2 (2.8%) |
| 90 or more Minutes | 14 (10.2%) | 2 (2.8%) |
Time of Departure to Work by Sex in Penasco
The most frequent times of departure to work in Penasco are 10:00 AM to 10:59 AM (63, 46.0%) for males and 7:00 AM to 7:29 AM (28, 38.9%) for females.
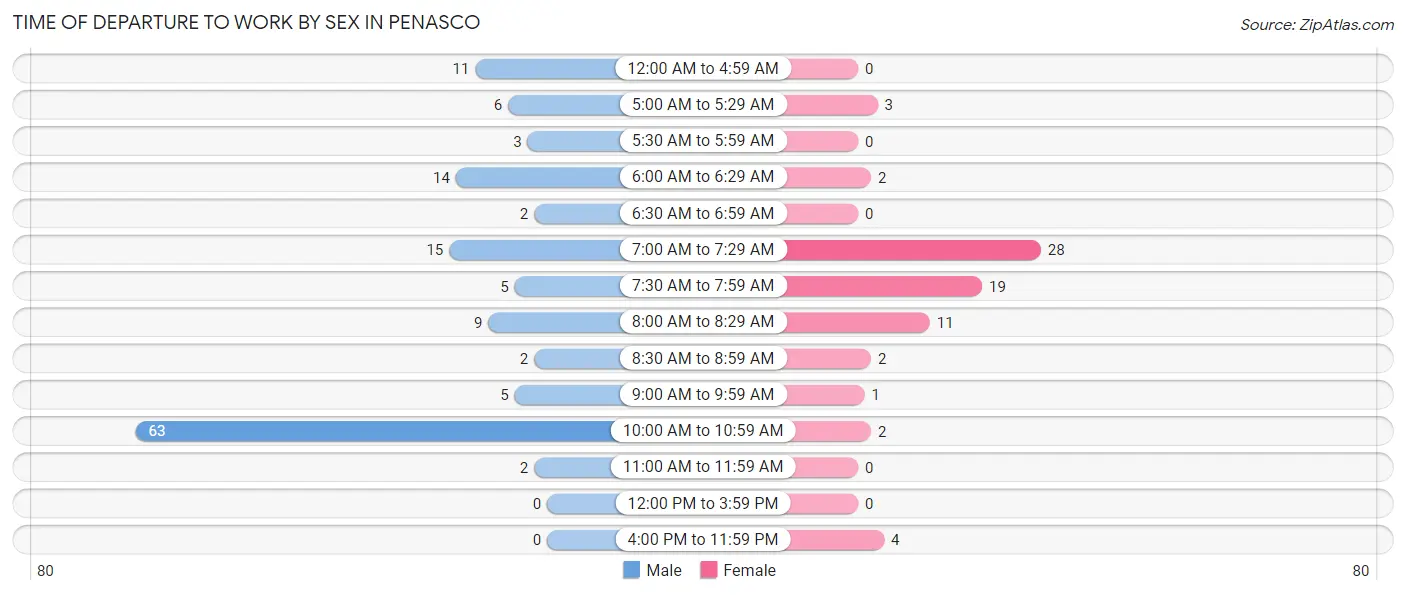
| Time of Departure | Male | Female |
| 12:00 AM to 4:59 AM | 11 (8.0%) | 0 (0.0%) |
| 5:00 AM to 5:29 AM | 6 (4.4%) | 3 (4.2%) |
| 5:30 AM to 5:59 AM | 3 (2.2%) | 0 (0.0%) |
| 6:00 AM to 6:29 AM | 14 (10.2%) | 2 (2.8%) |
| 6:30 AM to 6:59 AM | 2 (1.5%) | 0 (0.0%) |
| 7:00 AM to 7:29 AM | 15 (11.0%) | 28 (38.9%) |
| 7:30 AM to 7:59 AM | 5 (3.6%) | 19 (26.4%) |
| 8:00 AM to 8:29 AM | 9 (6.6%) | 11 (15.3%) |
| 8:30 AM to 8:59 AM | 2 (1.5%) | 2 (2.8%) |
| 9:00 AM to 9:59 AM | 5 (3.6%) | 1 (1.4%) |
| 10:00 AM to 10:59 AM | 63 (46.0%) | 2 (2.8%) |
| 11:00 AM to 11:59 AM | 2 (1.5%) | 0 (0.0%) |
| 12:00 PM to 3:59 PM | 0 (0.0%) | 0 (0.0%) |
| 4:00 PM to 11:59 PM | 0 (0.0%) | 4 (5.6%) |
| Total | 137 (100.0%) | 72 (100.0%) |
Housing Occupancy in Penasco
Occupancy by Ownership in Penasco
Of the total 258 dwellings in Penasco, owner-occupied units account for 178 (69.0%), while renter-occupied units make up 80 (31.0%).
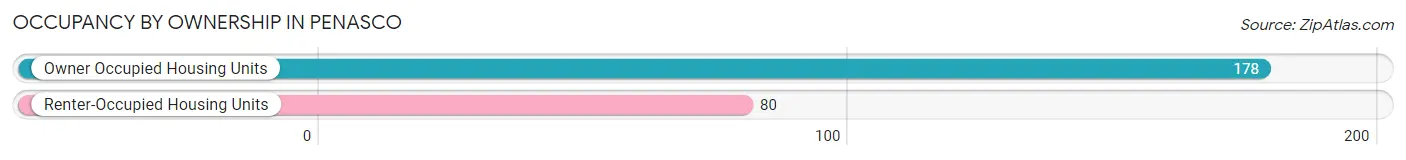
| Occupancy | # Housing Units | % Housing Units |
| Owner Occupied Housing Units | 178 | 69.0% |
| Renter-Occupied Housing Units | 80 | 31.0% |
| Total Occupied Housing Units | 258 | 100.0% |
Occupancy by Household Size in Penasco
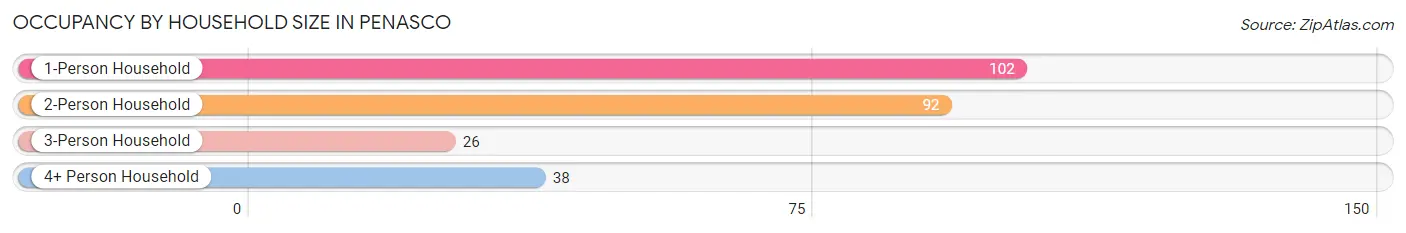
| Household Size | # Housing Units | % Housing Units |
| 1-Person Household | 102 | 39.5% |
| 2-Person Household | 92 | 35.7% |
| 3-Person Household | 26 | 10.1% |
| 4+ Person Household | 38 | 14.7% |
| Total Housing Units | 258 | 100.0% |
Occupancy by Ownership by Household Size in Penasco
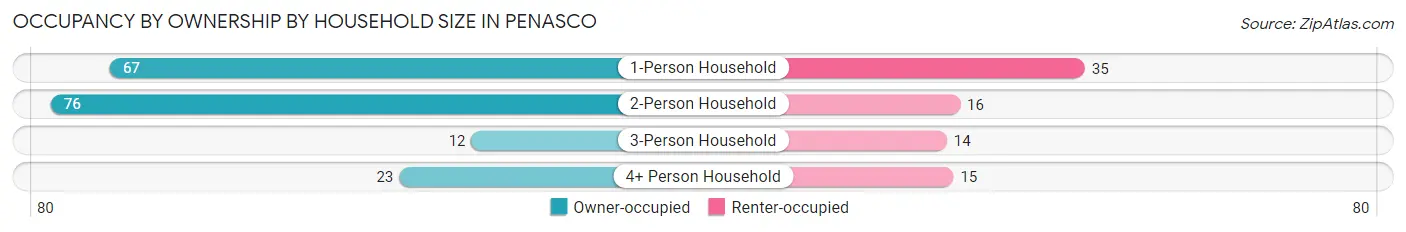
| Household Size | Owner-occupied | Renter-occupied |
| 1-Person Household | 67 (65.7%) | 35 (34.3%) |
| 2-Person Household | 76 (82.6%) | 16 (17.4%) |
| 3-Person Household | 12 (46.2%) | 14 (53.8%) |
| 4+ Person Household | 23 (60.5%) | 15 (39.5%) |
| Total Housing Units | 178 (69.0%) | 80 (31.0%) |
Occupancy by Educational Attainment in Penasco
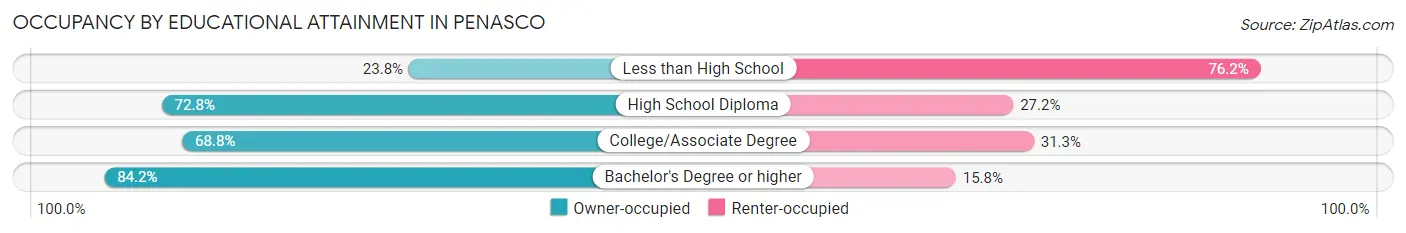
| Household Size | Owner-occupied | Renter-occupied |
| Less than High School | 5 (23.8%) | 16 (76.2%) |
| High School Diploma | 75 (72.8%) | 28 (27.2%) |
| College/Associate Degree | 66 (68.8%) | 30 (31.2%) |
| Bachelor's Degree or higher | 32 (84.2%) | 6 (15.8%) |
Occupancy by Age of Householder in Penasco
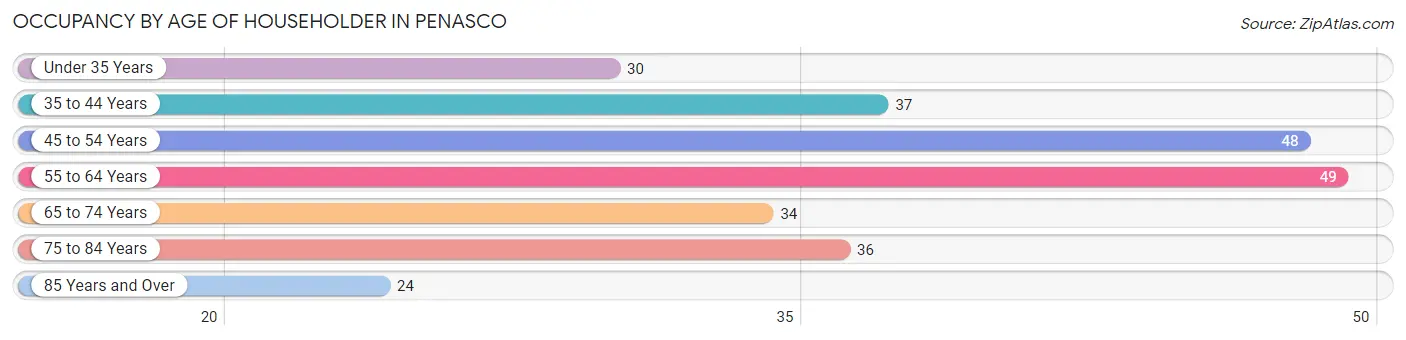
| Age Bracket | # Households | % Households |
| Under 35 Years | 30 | 11.6% |
| 35 to 44 Years | 37 | 14.3% |
| 45 to 54 Years | 48 | 18.6% |
| 55 to 64 Years | 49 | 19.0% |
| 65 to 74 Years | 34 | 13.2% |
| 75 to 84 Years | 36 | 14.0% |
| 85 Years and Over | 24 | 9.3% |
| Total | 258 | 100.0% |
Housing Finances in Penasco
Median Income by Occupancy in Penasco
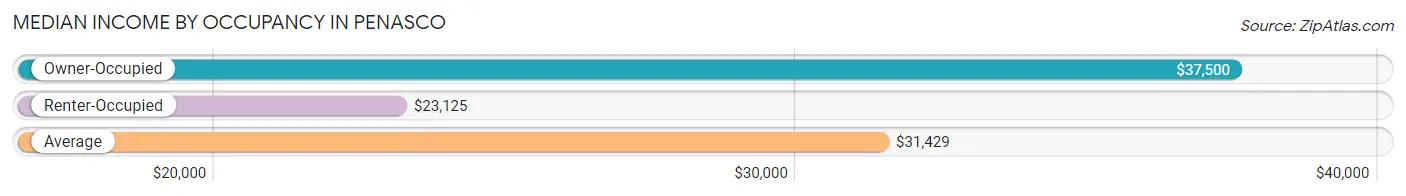
| Occupancy Type | # Households | Median Income |
| Owner-Occupied | 178 (69.0%) | $37,500 |
| Renter-Occupied | 80 (31.0%) | $23,125 |
| Average | 258 (100.0%) | $31,429 |
Occupancy by Householder Income Bracket in Penasco
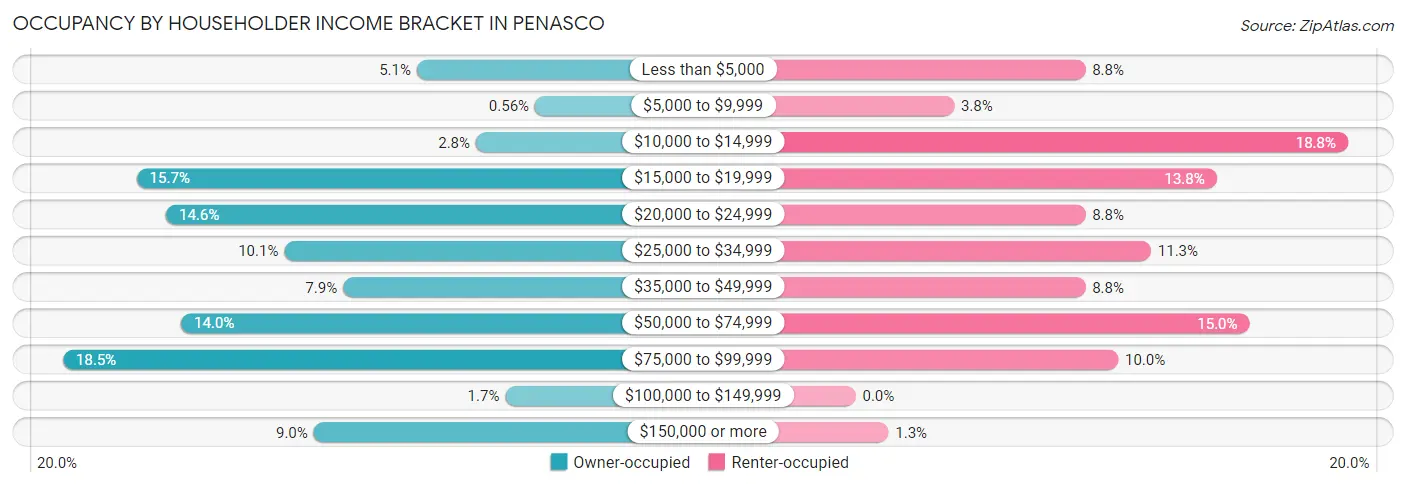
| Income Bracket | Owner-occupied | Renter-occupied |
| Less than $5,000 | 9 (5.1%) | 7 (8.7%) |
| $5,000 to $9,999 | 1 (0.6%) | 3 (3.7%) |
| $10,000 to $14,999 | 5 (2.8%) | 15 (18.8%) |
| $15,000 to $19,999 | 28 (15.7%) | 11 (13.8%) |
| $20,000 to $24,999 | 26 (14.6%) | 7 (8.7%) |
| $25,000 to $34,999 | 18 (10.1%) | 9 (11.3%) |
| $35,000 to $49,999 | 14 (7.9%) | 7 (8.7%) |
| $50,000 to $74,999 | 25 (14.0%) | 12 (15.0%) |
| $75,000 to $99,999 | 33 (18.5%) | 8 (10.0%) |
| $100,000 to $149,999 | 3 (1.7%) | 0 (0.0%) |
| $150,000 or more | 16 (9.0%) | 1 (1.3%) |
| Total | 178 (100.0%) | 80 (100.0%) |
Monthly Housing Cost Tiers in Penasco
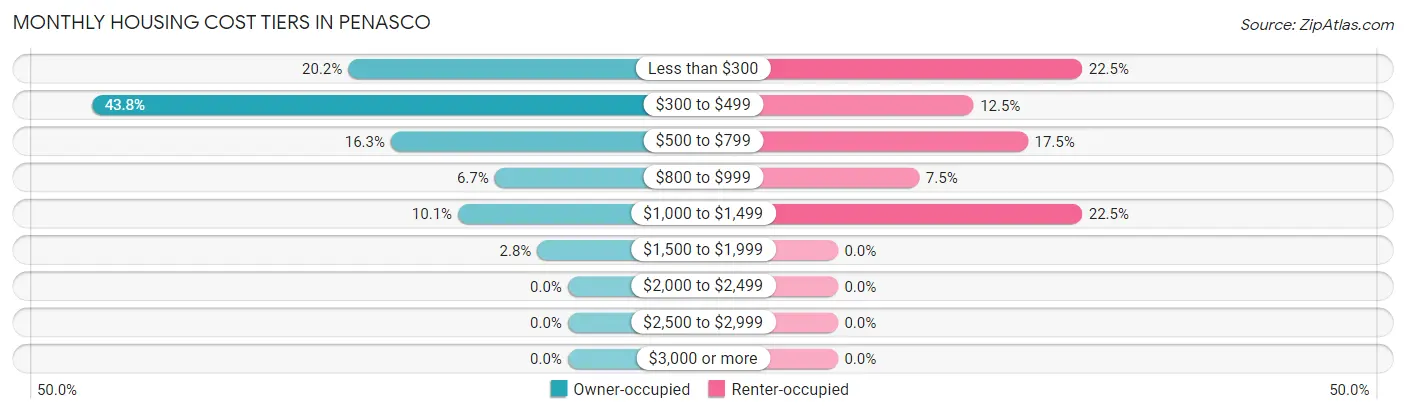
| Monthly Cost | Owner-occupied | Renter-occupied |
| Less than $300 | 36 (20.2%) | 18 (22.5%) |
| $300 to $499 | 78 (43.8%) | 10 (12.5%) |
| $500 to $799 | 29 (16.3%) | 14 (17.5%) |
| $800 to $999 | 12 (6.7%) | 6 (7.5%) |
| $1,000 to $1,499 | 18 (10.1%) | 18 (22.5%) |
| $1,500 to $1,999 | 5 (2.8%) | 0 (0.0%) |
| $2,000 to $2,499 | 0 (0.0%) | 0 (0.0%) |
| $2,500 to $2,999 | 0 (0.0%) | 0 (0.0%) |
| $3,000 or more | 0 (0.0%) | 0 (0.0%) |
| Total | 178 (100.0%) | 80 (100.0%) |
Physical Housing Characteristics in Penasco
Housing Structures in Penasco
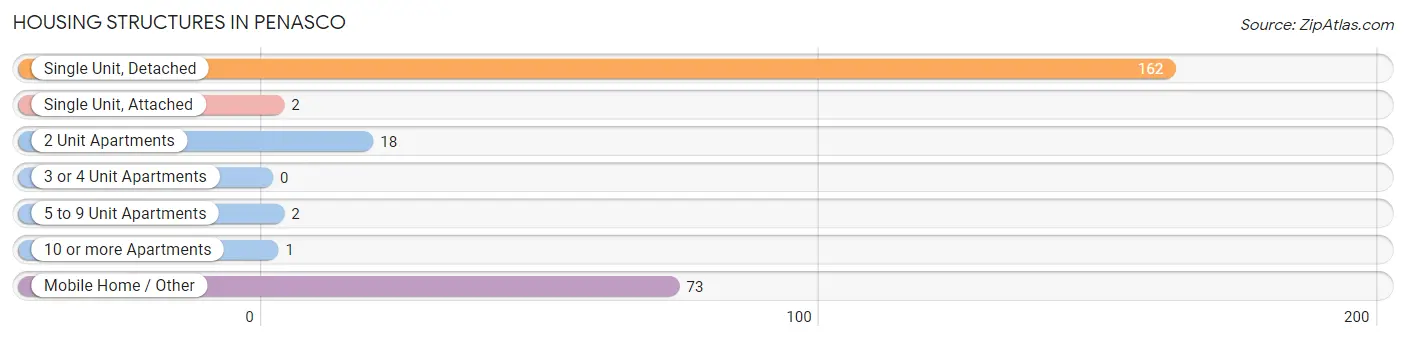
| Structure Type | # Housing Units | % Housing Units |
| Single Unit, Detached | 162 | 62.8% |
| Single Unit, Attached | 2 | 0.8% |
| 2 Unit Apartments | 18 | 7.0% |
| 3 or 4 Unit Apartments | 0 | 0.0% |
| 5 to 9 Unit Apartments | 2 | 0.8% |
| 10 or more Apartments | 1 | 0.4% |
| Mobile Home / Other | 73 | 28.3% |
| Total | 258 | 100.0% |
Housing Structures by Occupancy in Penasco
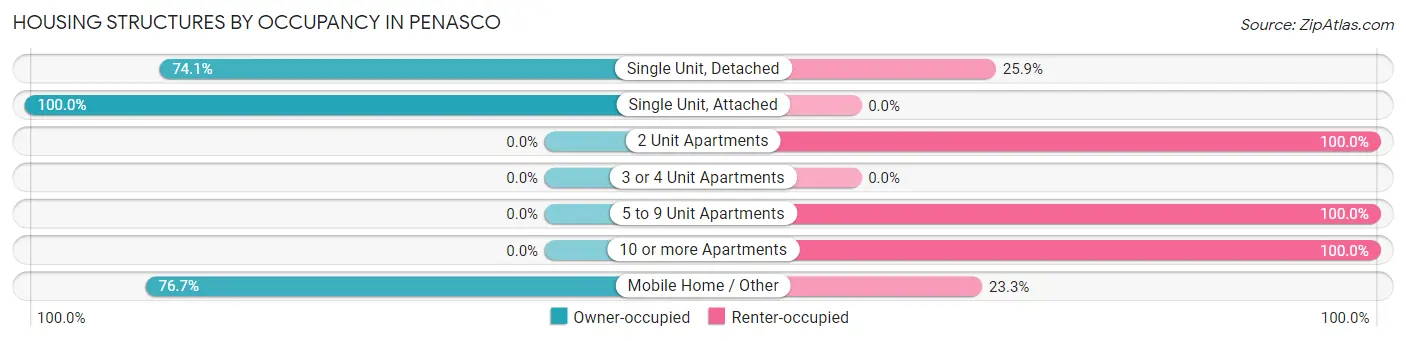
| Structure Type | Owner-occupied | Renter-occupied |
| Single Unit, Detached | 120 (74.1%) | 42 (25.9%) |
| Single Unit, Attached | 2 (100.0%) | 0 (0.0%) |
| 2 Unit Apartments | 0 (0.0%) | 18 (100.0%) |
| 3 or 4 Unit Apartments | 0 (0.0%) | 0 (0.0%) |
| 5 to 9 Unit Apartments | 0 (0.0%) | 2 (100.0%) |
| 10 or more Apartments | 0 (0.0%) | 1 (100.0%) |
| Mobile Home / Other | 56 (76.7%) | 17 (23.3%) |
| Total | 178 (69.0%) | 80 (31.0%) |
Housing Structures by Number of Rooms in Penasco
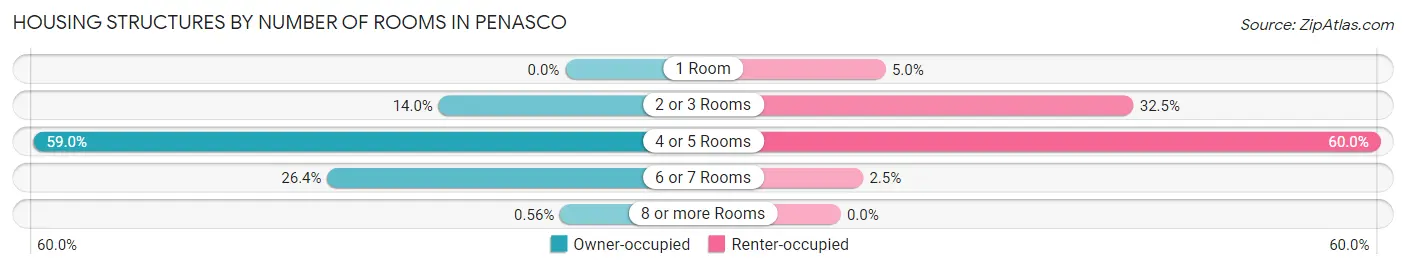
| Number of Rooms | Owner-occupied | Renter-occupied |
| 1 Room | 0 (0.0%) | 4 (5.0%) |
| 2 or 3 Rooms | 25 (14.0%) | 26 (32.5%) |
| 4 or 5 Rooms | 105 (59.0%) | 48 (60.0%) |
| 6 or 7 Rooms | 47 (26.4%) | 2 (2.5%) |
| 8 or more Rooms | 1 (0.6%) | 0 (0.0%) |
| Total | 178 (100.0%) | 80 (100.0%) |
Housing Structure by Heating Type in Penasco
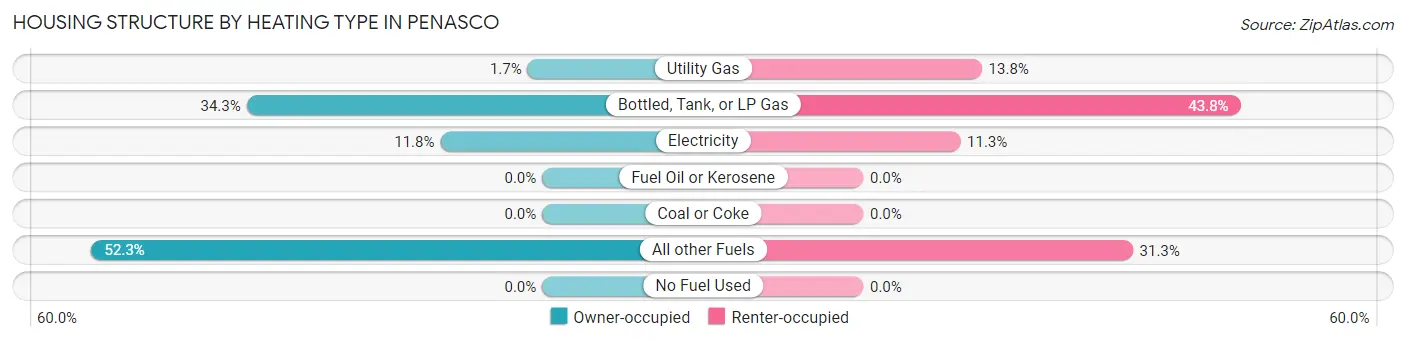
| Heating Type | Owner-occupied | Renter-occupied |
| Utility Gas | 3 (1.7%) | 11 (13.8%) |
| Bottled, Tank, or LP Gas | 61 (34.3%) | 35 (43.8%) |
| Electricity | 21 (11.8%) | 9 (11.3%) |
| Fuel Oil or Kerosene | 0 (0.0%) | 0 (0.0%) |
| Coal or Coke | 0 (0.0%) | 0 (0.0%) |
| All other Fuels | 93 (52.2%) | 25 (31.2%) |
| No Fuel Used | 0 (0.0%) | 0 (0.0%) |
| Total | 178 (100.0%) | 80 (100.0%) |
Household Vehicle Usage in Penasco
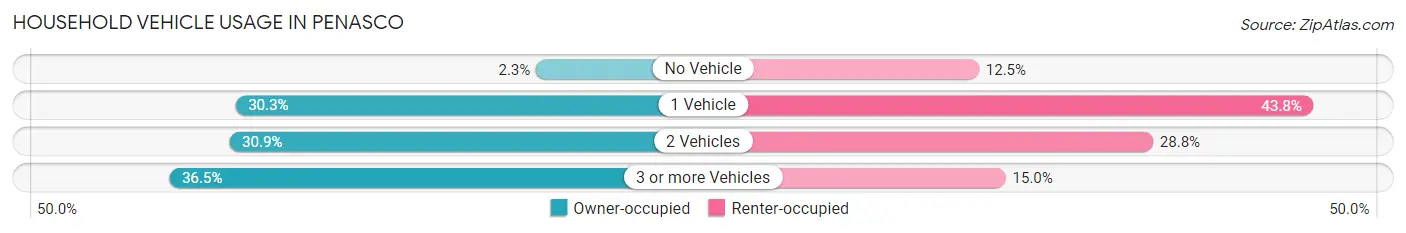
| Vehicles per Household | Owner-occupied | Renter-occupied |
| No Vehicle | 4 (2.2%) | 10 (12.5%) |
| 1 Vehicle | 54 (30.3%) | 35 (43.8%) |
| 2 Vehicles | 55 (30.9%) | 23 (28.7%) |
| 3 or more Vehicles | 65 (36.5%) | 12 (15.0%) |
| Total | 178 (100.0%) | 80 (100.0%) |
Real Estate & Mortgages in Penasco
Real Estate and Mortgage Overview in Penasco
| Characteristic | Without Mortgage | With Mortgage |
| Housing Units | 143 | 35 |
| Median Property Value | $210,600 | $0 |
| Median Household Income | $32,813 | $0 |
| Monthly Housing Costs | $394 | $0 |
| Real Estate Taxes | $518 | $0 |
Property Value by Mortgage Status in Penasco
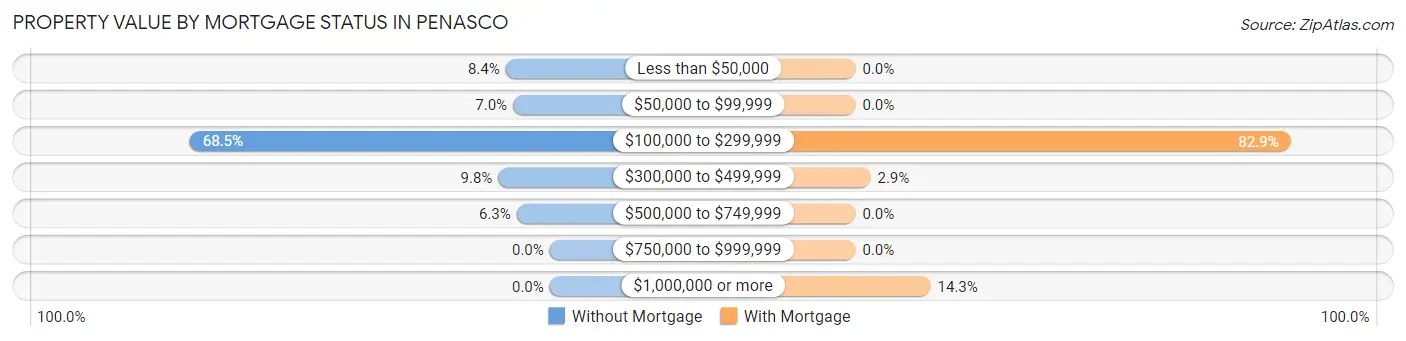
| Property Value | Without Mortgage | With Mortgage |
| Less than $50,000 | 12 (8.4%) | 0 (0.0%) |
| $50,000 to $99,999 | 10 (7.0%) | 0 (0.0%) |
| $100,000 to $299,999 | 98 (68.5%) | 29 (82.9%) |
| $300,000 to $499,999 | 14 (9.8%) | 1 (2.9%) |
| $500,000 to $749,999 | 9 (6.3%) | 0 (0.0%) |
| $750,000 to $999,999 | 0 (0.0%) | 0 (0.0%) |
| $1,000,000 or more | 0 (0.0%) | 5 (14.3%) |
| Total | 143 (100.0%) | 35 (100.0%) |
Household Income by Mortgage Status in Penasco
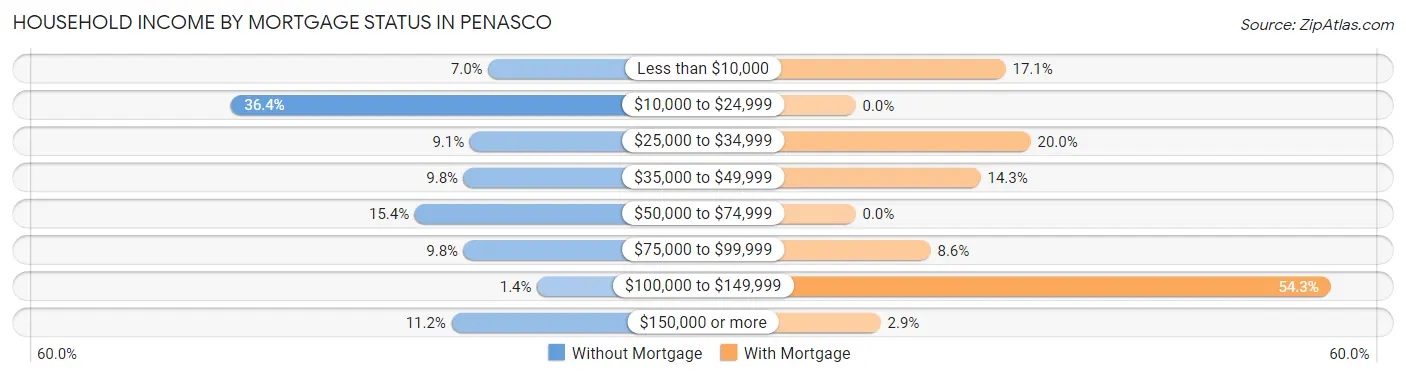
| Household Income | Without Mortgage | With Mortgage |
| Less than $10,000 | 10 (7.0%) | 6 (17.1%) |
| $10,000 to $24,999 | 52 (36.4%) | 0 (0.0%) |
| $25,000 to $34,999 | 13 (9.1%) | 7 (20.0%) |
| $35,000 to $49,999 | 14 (9.8%) | 5 (14.3%) |
| $50,000 to $74,999 | 22 (15.4%) | 0 (0.0%) |
| $75,000 to $99,999 | 14 (9.8%) | 3 (8.6%) |
| $100,000 to $149,999 | 2 (1.4%) | 19 (54.3%) |
| $150,000 or more | 16 (11.2%) | 1 (2.9%) |
| Total | 143 (100.0%) | 35 (100.0%) |
Property Value to Household Income Ratio in Penasco
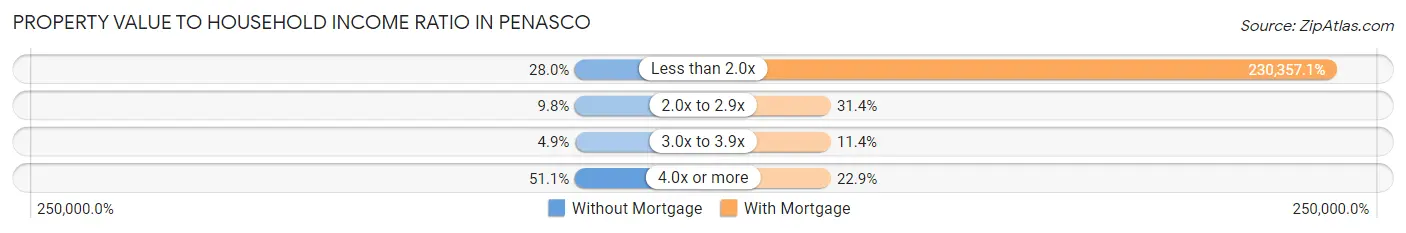
| Value-to-Income Ratio | Without Mortgage | With Mortgage |
| Less than 2.0x | 40 (28.0%) | 80,625 (230,357.1%) |
| 2.0x to 2.9x | 14 (9.8%) | 11 (31.4%) |
| 3.0x to 3.9x | 7 (4.9%) | 4 (11.4%) |
| 4.0x or more | 73 (51.0%) | 8 (22.9%) |
| Total | 143 (100.0%) | 35 (100.0%) |
Real Estate Taxes by Mortgage Status in Penasco
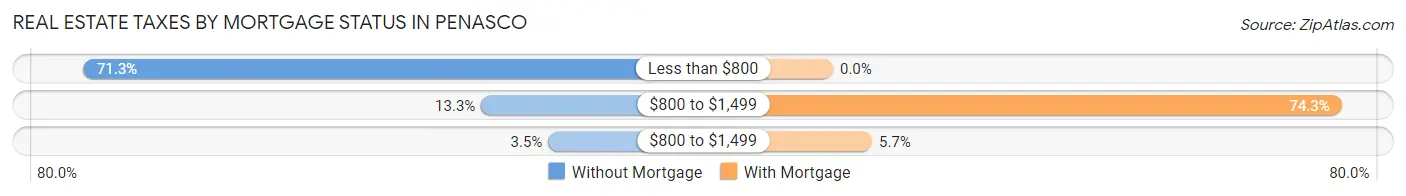
| Property Taxes | Without Mortgage | With Mortgage |
| Less than $800 | 102 (71.3%) | 0 (0.0%) |
| $800 to $1,499 | 19 (13.3%) | 26 (74.3%) |
| $800 to $1,499 | 5 (3.5%) | 2 (5.7%) |
| Total | 143 (100.0%) | 35 (100.0%) |
Health & Disability in Penasco
Health Insurance Coverage by Age in Penasco
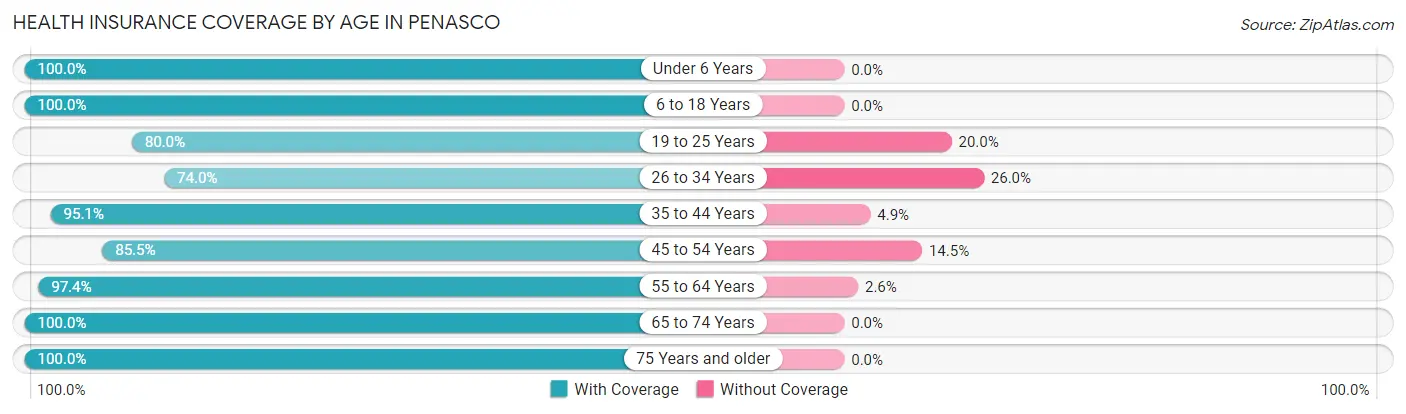
| Age Bracket | With Coverage | Without Coverage |
| Under 6 Years | 46 (100.0%) | 0 (0.0%) |
| 6 to 18 Years | 115 (100.0%) | 0 (0.0%) |
| 19 to 25 Years | 28 (80.0%) | 7 (20.0%) |
| 26 to 34 Years | 54 (74.0%) | 19 (26.0%) |
| 35 to 44 Years | 137 (95.1%) | 7 (4.9%) |
| 45 to 54 Years | 59 (85.5%) | 10 (14.5%) |
| 55 to 64 Years | 76 (97.4%) | 2 (2.6%) |
| 65 to 74 Years | 47 (100.0%) | 0 (0.0%) |
| 75 Years and older | 99 (100.0%) | 0 (0.0%) |
| Total | 661 (93.6%) | 45 (6.4%) |
Health Insurance Coverage by Citizenship Status in Penasco
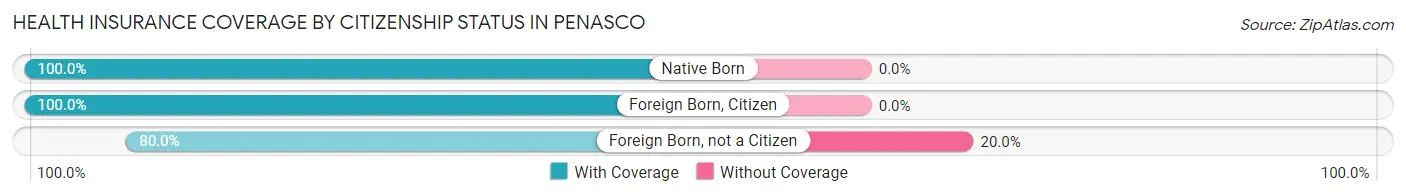
| Citizenship Status | With Coverage | Without Coverage |
| Native Born | 46 (100.0%) | 0 (0.0%) |
| Foreign Born, Citizen | 115 (100.0%) | 0 (0.0%) |
| Foreign Born, not a Citizen | 28 (80.0%) | 7 (20.0%) |
Health Insurance Coverage by Household Income in Penasco
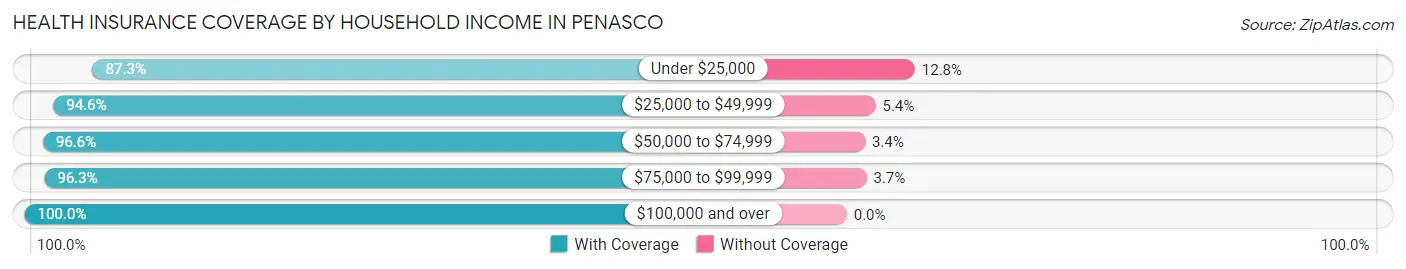
| Household Income | With Coverage | Without Coverage |
| Under $25,000 | 178 (87.3%) | 26 (12.8%) |
| $25,000 to $49,999 | 158 (94.6%) | 9 (5.4%) |
| $50,000 to $74,999 | 85 (96.6%) | 3 (3.4%) |
| $75,000 to $99,999 | 182 (96.3%) | 7 (3.7%) |
| $100,000 and over | 58 (100.0%) | 0 (0.0%) |
Public vs Private Health Insurance Coverage by Age in Penasco
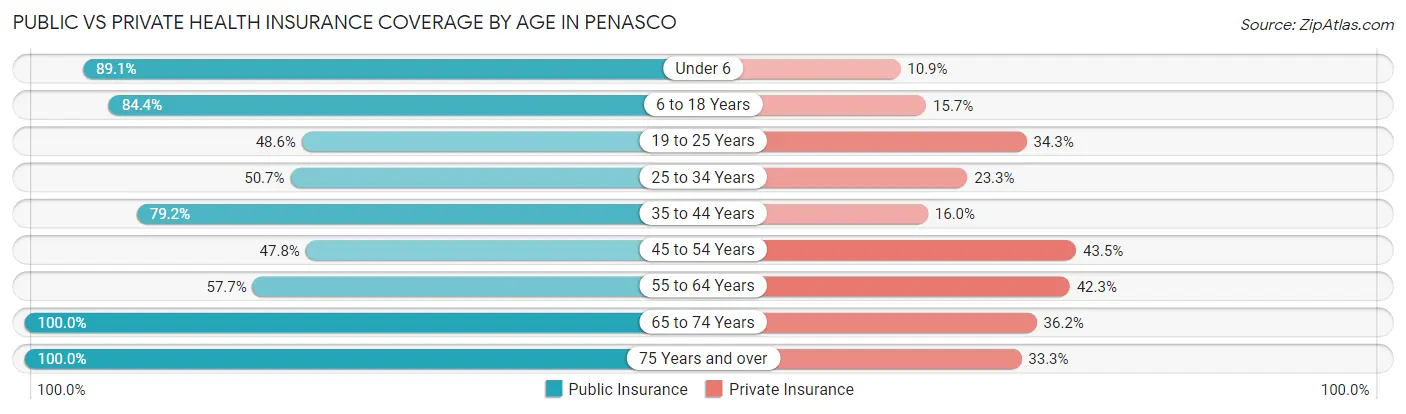
| Age Bracket | Public Insurance | Private Insurance |
| Under 6 | 41 (89.1%) | 5 (10.9%) |
| 6 to 18 Years | 97 (84.4%) | 18 (15.7%) |
| 19 to 25 Years | 17 (48.6%) | 12 (34.3%) |
| 25 to 34 Years | 37 (50.7%) | 17 (23.3%) |
| 35 to 44 Years | 114 (79.2%) | 23 (16.0%) |
| 45 to 54 Years | 33 (47.8%) | 30 (43.5%) |
| 55 to 64 Years | 45 (57.7%) | 33 (42.3%) |
| 65 to 74 Years | 47 (100.0%) | 17 (36.2%) |
| 75 Years and over | 99 (100.0%) | 33 (33.3%) |
| Total | 530 (75.1%) | 188 (26.6%) |
Disability Status by Sex by Age in Penasco
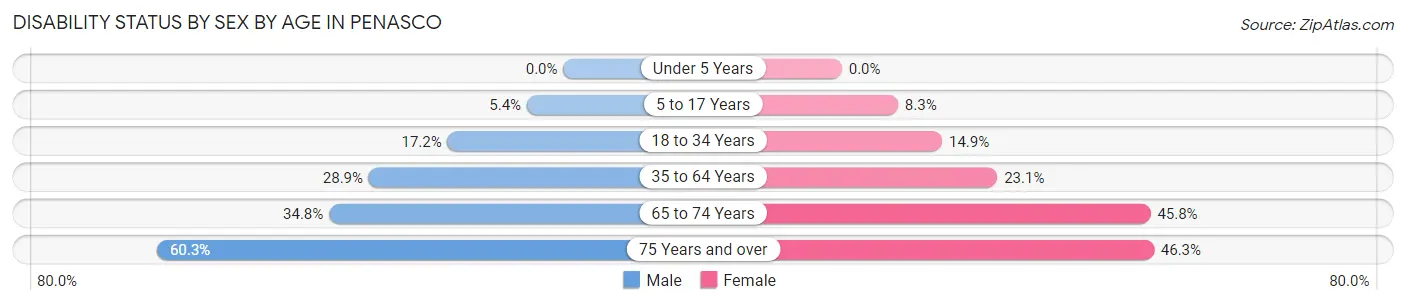
| Age Bracket | Male | Female |
| Under 5 Years | 0 (0.0%) | 0 (0.0%) |
| 5 to 17 Years | 4 (5.4%) | 4 (8.3%) |
| 18 to 34 Years | 11 (17.2%) | 7 (14.9%) |
| 35 to 64 Years | 54 (28.9%) | 24 (23.1%) |
| 65 to 74 Years | 8 (34.8%) | 11 (45.8%) |
| 75 Years and over | 35 (60.3%) | 19 (46.3%) |
Disability Class by Sex by Age in Penasco
Disability Class: Hearing Difficulty
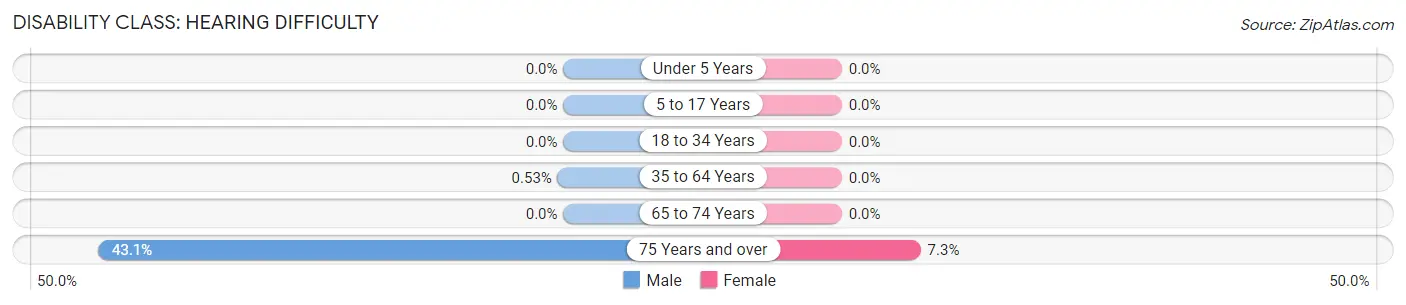
| Age Bracket | Male | Female |
| Under 5 Years | 0 (0.0%) | 0 (0.0%) |
| 5 to 17 Years | 0 (0.0%) | 0 (0.0%) |
| 18 to 34 Years | 0 (0.0%) | 0 (0.0%) |
| 35 to 64 Years | 1 (0.5%) | 0 (0.0%) |
| 65 to 74 Years | 0 (0.0%) | 0 (0.0%) |
| 75 Years and over | 25 (43.1%) | 3 (7.3%) |
Disability Class: Vision Difficulty
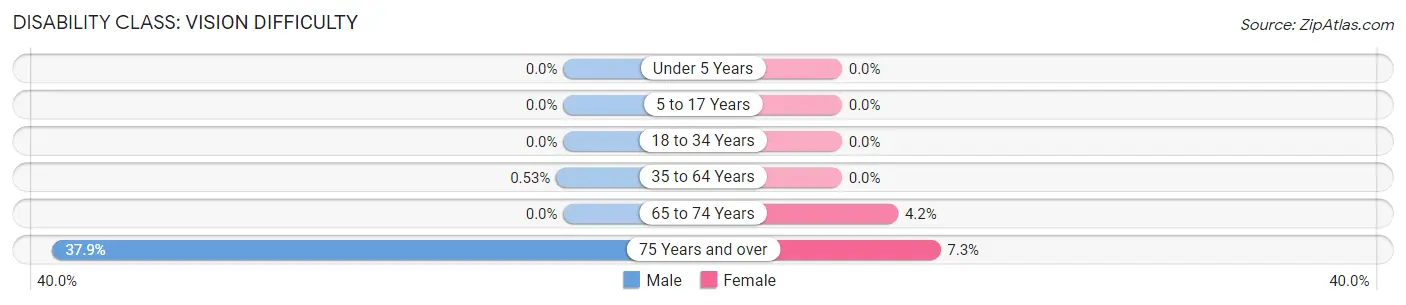
| Age Bracket | Male | Female |
| Under 5 Years | 0 (0.0%) | 0 (0.0%) |
| 5 to 17 Years | 0 (0.0%) | 0 (0.0%) |
| 18 to 34 Years | 0 (0.0%) | 0 (0.0%) |
| 35 to 64 Years | 1 (0.5%) | 0 (0.0%) |
| 65 to 74 Years | 0 (0.0%) | 1 (4.2%) |
| 75 Years and over | 22 (37.9%) | 3 (7.3%) |
Disability Class: Cognitive Difficulty
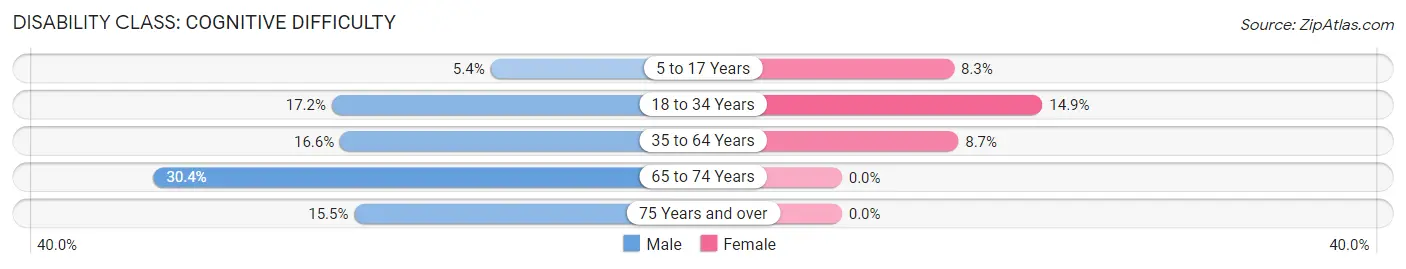
| Age Bracket | Male | Female |
| 5 to 17 Years | 4 (5.4%) | 4 (8.3%) |
| 18 to 34 Years | 11 (17.2%) | 7 (14.9%) |
| 35 to 64 Years | 31 (16.6%) | 9 (8.6%) |
| 65 to 74 Years | 7 (30.4%) | 0 (0.0%) |
| 75 Years and over | 9 (15.5%) | 0 (0.0%) |
Disability Class: Ambulatory Difficulty
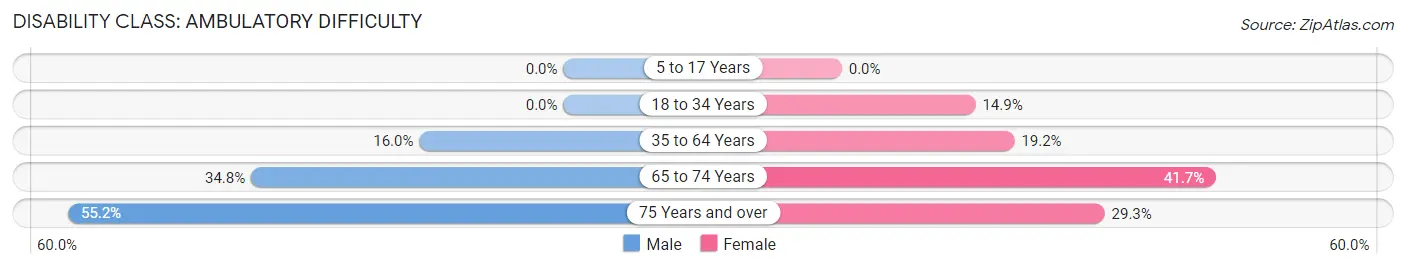
| Age Bracket | Male | Female |
| 5 to 17 Years | 0 (0.0%) | 0 (0.0%) |
| 18 to 34 Years | 0 (0.0%) | 7 (14.9%) |
| 35 to 64 Years | 30 (16.0%) | 20 (19.2%) |
| 65 to 74 Years | 8 (34.8%) | 10 (41.7%) |
| 75 Years and over | 32 (55.2%) | 12 (29.3%) |
Disability Class: Self-Care Difficulty
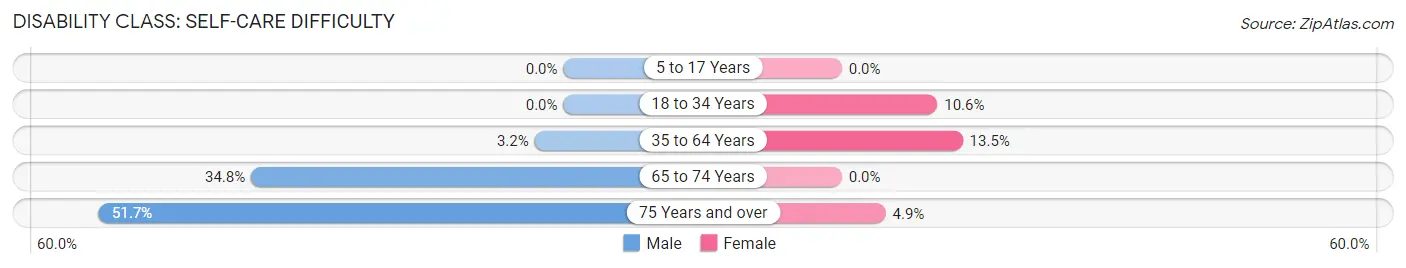
| Age Bracket | Male | Female |
| 5 to 17 Years | 0 (0.0%) | 0 (0.0%) |
| 18 to 34 Years | 0 (0.0%) | 5 (10.6%) |
| 35 to 64 Years | 6 (3.2%) | 14 (13.5%) |
| 65 to 74 Years | 8 (34.8%) | 0 (0.0%) |
| 75 Years and over | 30 (51.7%) | 2 (4.9%) |
Technology Access in Penasco
Computing Device Access in Penasco
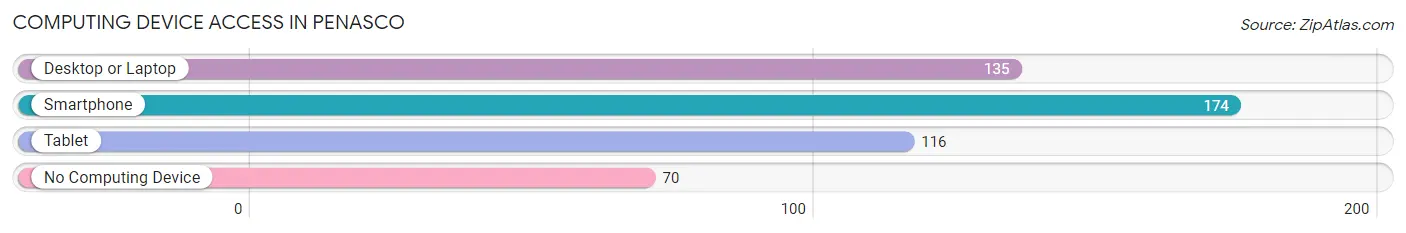
| Device Type | # Households | % Households |
| Desktop or Laptop | 135 | 52.3% |
| Smartphone | 174 | 67.4% |
| Tablet | 116 | 45.0% |
| No Computing Device | 70 | 27.1% |
| Total | 258 | 100.0% |
Internet Access in Penasco
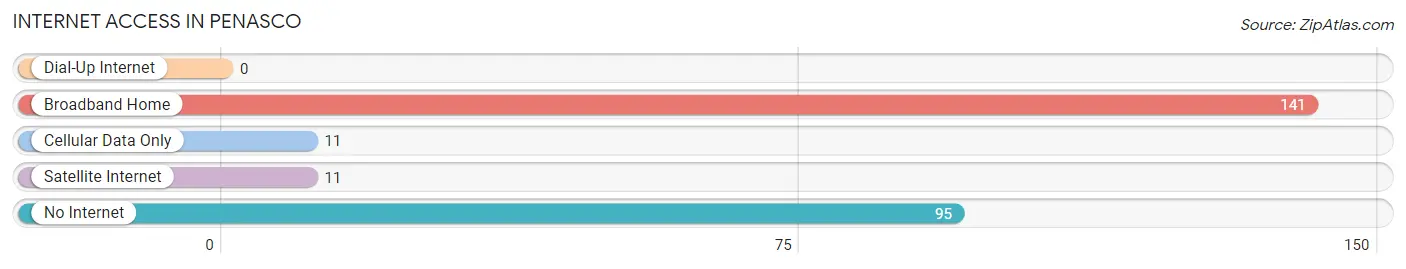
| Internet Type | # Households | % Households |
| Dial-Up Internet | 0 | 0.0% |
| Broadband Home | 141 | 54.6% |
| Cellular Data Only | 11 | 4.3% |
| Satellite Internet | 11 | 4.3% |
| No Internet | 95 | 36.8% |
| Total | 258 | 100.0% |
Penasco Summary
Penasco, New Mexico is a small unincorporated community located in Taos County, New Mexico. It is situated in the Sangre de Cristo Mountains, approximately 25 miles south of Taos. The population of Penasco was estimated to be around 1,000 in 2020.
History
Penasco was originally inhabited by the Taos Indians, who were part of the Pueblo people. The area was first explored by Spanish settlers in the late 1700s. The first permanent settlement in the area was established in 1845 by a group of Mexican settlers. The settlement was named Penasco, which means “rocky point” in Spanish.
The area was part of the Taos Land Grant, which was granted to the Taos Indians in 1848. The grant was later sold to the United States government in 1854. The area was then opened up to homesteaders, and the population of Penasco began to grow.
In the late 1800s, Penasco became a popular tourist destination due to its scenic beauty and proximity to Taos. The town was also known for its art galleries, which featured works by local artists.
Geography
Penasco is located in the Sangre de Cristo Mountains, approximately 25 miles south of Taos. The town is situated at an elevation of 6,400 feet above sea level. The area is characterized by rolling hills, pine forests, and open meadows.
The climate in Penasco is semi-arid, with hot summers and cold winters. The average annual temperature is around 50 degrees Fahrenheit. The average annual precipitation is around 12 inches.
Economy
The economy of Penasco is largely based on tourism. The town is a popular destination for outdoor activities such as hiking, camping, fishing, and hunting. The area is also known for its art galleries, which feature works by local artists.
The town is also home to several small businesses, including restaurants, shops, and lodging. The local economy is also supported by the nearby Taos Ski Valley, which is a popular ski resort.
Demographics
The population of Penasco was estimated to be around 1,000 in 2020. The majority of the population is of Hispanic or Latino descent. The median household income is around $30,000. The median age is around 40 years old.
Conclusion
Penasco, New Mexico is a small unincorporated community located in Taos County, New Mexico. It is situated in the Sangre de Cristo Mountains, approximately 25 miles south of Taos. The population of Penasco was estimated to be around 1,000 in 2020. The economy of Penasco is largely based on tourism, and the majority of the population is of Hispanic or Latino descent. The median household income is around $30,000 and the median age is around 40 years old.
Common Questions
What is Per Capita Income in Penasco?
Per Capita income in Penasco is $23,881.
What is the Median Family Income in Penasco?
Median Family Income in Penasco is $44,886.
What is the Median Household income in Penasco?
Median Household Income in Penasco is $31,429.
What is Income or Wage Gap in Penasco?
Income or Wage Gap in Penasco is 20.2%.
Women in Penasco earn 79.8 cents for every dollar earned by a man.
What is Family Income Deficit in Penasco?
Family Income Deficit in Penasco is $9,438.
Families that are below poverty line in Penasco earn $9,438 less on average than the poverty threshold level.
What is Inequality or Gini Index in Penasco?
Inequality or Gini Index in Penasco is 0.55.
What is the Total Population of Penasco?
Total Population of Penasco is 708.
What is the Total Male Population of Penasco?
Total Male Population of Penasco is 431.
What is the Total Female Population of Penasco?
Total Female Population of Penasco is 277.
What is the Ratio of Males per 100 Females in Penasco?
There are 155.60 Males per 100 Females in Penasco.
What is the Ratio of Females per 100 Males in Penasco?
There are 64.27 Females per 100 Males in Penasco.
What is the Median Population Age in Penasco?
Median Population Age in Penasco is 40.2 Years.
What is the Average Family Size in Penasco
Average Family Size in Penasco is 3.8 People.
What is the Average Household Size in Penasco
Average Household Size in Penasco is 2.7 People.
How Large is the Labor Force in Penasco?
There are 268 People in the Labor Forcein in Penasco.
What is the Percentage of People in the Labor Force in Penasco?
47.9% of People are in the Labor Force in Penasco.
What is the Unemployment Rate in Penasco?
Unemployment Rate in Penasco is 5.6%.