Pecos, NM Map & Demographics
Pecos Map
Pecos Overview
$28,524
PER CAPITA INCOME
$45,739
AVG FAMILY INCOME
$42,105
AVG HOUSEHOLD INCOME
4.8%
WAGE / INCOME GAP [ % ]
95.2¢/ $1
WAGE / INCOME GAP [ $ ]
$5,722
FAMILY INCOME DEFICIT
0.50
INEQUALITY / GINI INDEX
885
TOTAL POPULATION
444
MALE POPULATION
441
FEMALE POPULATION
100.68
MALES / 100 FEMALES
99.32
FEMALES / 100 MALES
53.3
MEDIAN AGE
2.9
AVG FAMILY SIZE
2.3
AVG HOUSEHOLD SIZE
378
LABOR FORCE [ PEOPLE ]
52.2%
PERCENT IN LABOR FORCE
2.9%
UNEMPLOYMENT RATE
Pecos Zip Codes
Pecos Area Codes
Income in Pecos
Income Overview in Pecos
Per Capita Income in Pecos is $28,524, while median incomes of families and households are $45,739 and $42,105 respectively.
| Characteristic | Number | Measure |
| Per Capita Income | 885 | $28,524 |
| Median Family Income | 257 | $45,739 |
| Mean Family Income | 257 | $77,189 |
| Median Household Income | 386 | $42,105 |
| Mean Household Income | 386 | $64,212 |
| Income Deficit | 257 | $5,722 |
| Wage / Income Gap (%) | 885 | 4.80% |
| Wage / Income Gap ($) | 885 | 95.20¢ per $1 |
| Gini / Inequality Index | 885 | 0.50 |
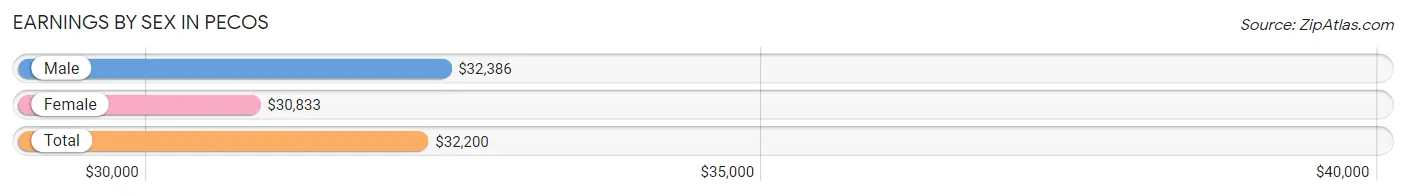
Earnings by Sex in Pecos
Average Earnings in Pecos are $32,200, $32,386 for men and $30,833 for women, a difference of 4.8%.
| Sex | Number | Average Earnings |
| Male | 212 (52.7%) | $32,386 |
| Female | 190 (47.3%) | $30,833 |
| Total | 402 (100.0%) | $32,200 |
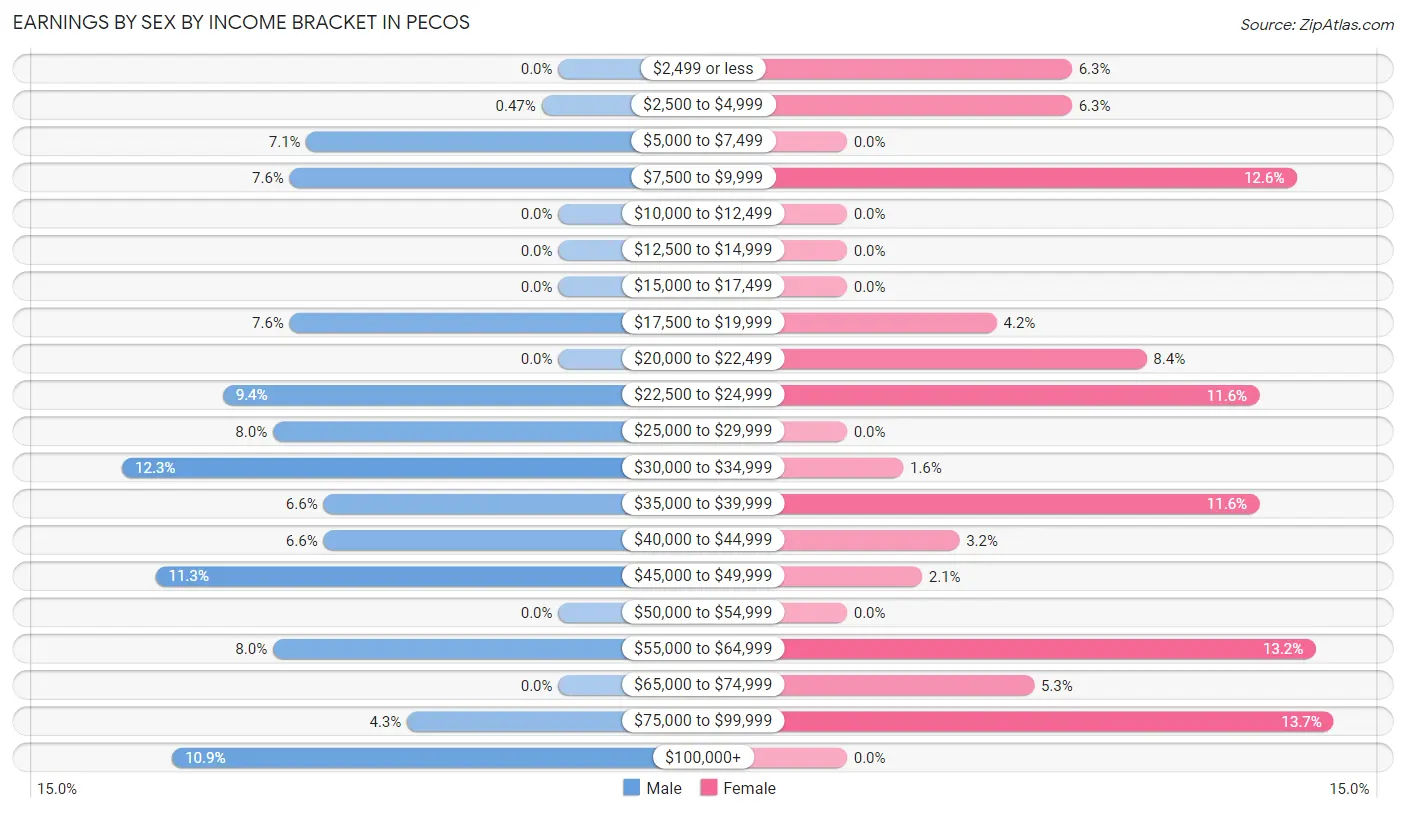
Earnings by Sex by Income Bracket in Pecos
The most common earnings brackets in Pecos are $30,000 to $34,999 for men (26 | 12.3%) and $75,000 to $99,999 for women (26 | 13.7%).
| Income | Male | Female |
| $2,499 or less | 0 (0.0%) | 12 (6.3%) |
| $2,500 to $4,999 | 1 (0.5%) | 12 (6.3%) |
| $5,000 to $7,499 | 15 (7.1%) | 0 (0.0%) |
| $7,500 to $9,999 | 16 (7.5%) | 24 (12.6%) |
| $10,000 to $12,499 | 0 (0.0%) | 0 (0.0%) |
| $12,500 to $14,999 | 0 (0.0%) | 0 (0.0%) |
| $15,000 to $17,499 | 0 (0.0%) | 0 (0.0%) |
| $17,500 to $19,999 | 16 (7.5%) | 8 (4.2%) |
| $20,000 to $22,499 | 0 (0.0%) | 16 (8.4%) |
| $22,500 to $24,999 | 20 (9.4%) | 22 (11.6%) |
| $25,000 to $29,999 | 17 (8.0%) | 0 (0.0%) |
| $30,000 to $34,999 | 26 (12.3%) | 3 (1.6%) |
| $35,000 to $39,999 | 14 (6.6%) | 22 (11.6%) |
| $40,000 to $44,999 | 14 (6.6%) | 6 (3.2%) |
| $45,000 to $49,999 | 24 (11.3%) | 4 (2.1%) |
| $50,000 to $54,999 | 0 (0.0%) | 0 (0.0%) |
| $55,000 to $64,999 | 17 (8.0%) | 25 (13.2%) |
| $65,000 to $74,999 | 0 (0.0%) | 10 (5.3%) |
| $75,000 to $99,999 | 9 (4.3%) | 26 (13.7%) |
| $100,000+ | 23 (10.8%) | 0 (0.0%) |
| Total | 212 (100.0%) | 190 (100.0%) |
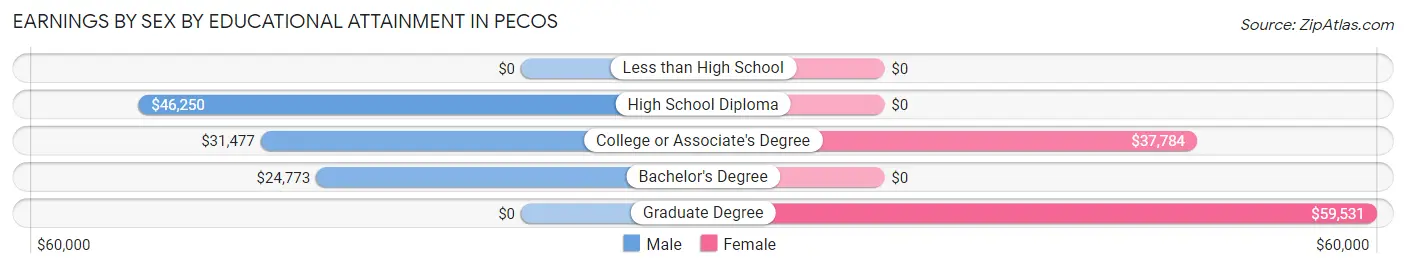
Earnings by Sex by Educational Attainment in Pecos
Average earnings in Pecos are $35,000 for men and $30,833 for women, a difference of 11.9%. Men with an educational attainment of high school diploma enjoy the highest average annual earnings of $46,250, while those with bachelor's degree education earn the least with $24,773. Women with an educational attainment of graduate degree earn the most with the average annual earnings of $59,531, while those with college or associate's degree education have the smallest earnings of $37,784.
| Educational Attainment | Male Income | Female Income |
| Less than High School | - | - |
| High School Diploma | $46,250 | $0 |
| College or Associate's Degree | $31,477 | $37,784 |
| Bachelor's Degree | $24,773 | $0 |
| Graduate Degree | - | - |
| Total | $35,000 | $30,833 |
Family Income in Pecos
Family Income Brackets in Pecos
According to the Pecos family income data, there are 76 families falling into the $35,000 to $49,999 income range, which is the most common income bracket and makes up 29.6% of all families.
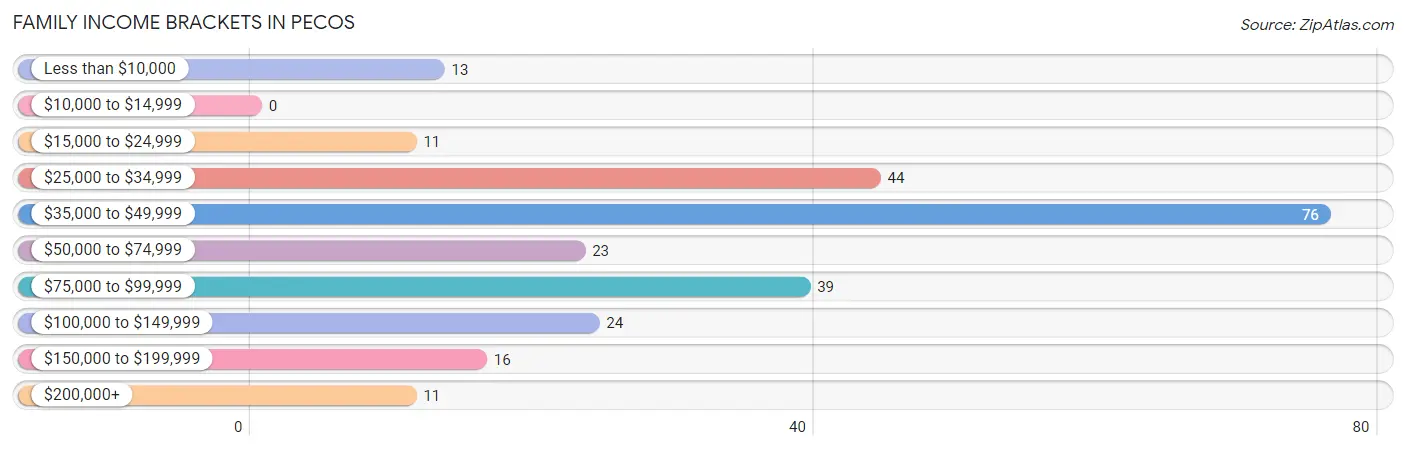
| Income Bracket | # Families | % Families |
| Less than $10,000 | 13 | 5.1% |
| $10,000 to $14,999 | 0 | 0.0% |
| $15,000 to $24,999 | 11 | 4.3% |
| $25,000 to $34,999 | 44 | 17.1% |
| $35,000 to $49,999 | 76 | 29.6% |
| $50,000 to $74,999 | 23 | 8.9% |
| $75,000 to $99,999 | 39 | 15.2% |
| $100,000 to $149,999 | 24 | 9.3% |
| $150,000 to $199,999 | 16 | 6.2% |
| $200,000+ | 11 | 4.3% |
Family Income by Famaliy Size in Pecos
2-person families (135 | 52.5%) account for the highest median family income in Pecos with $47,396 per family, while 2-person families (135 | 52.5%) have the highest median income of $23,698 per family member.
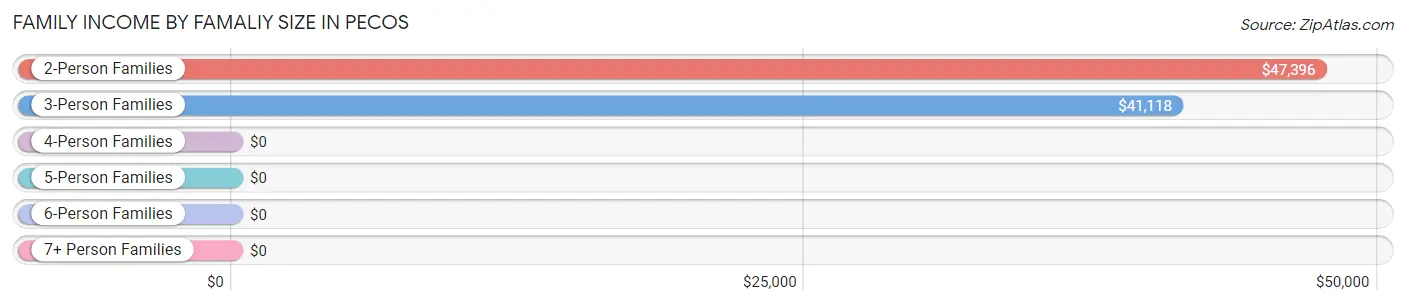
| Income Bracket | # Families | Median Income |
| 2-Person Families | 135 (52.5%) | $47,396 |
| 3-Person Families | 87 (33.9%) | $41,118 |
| 4-Person Families | 26 (10.1%) | $0 |
| 5-Person Families | 9 (3.5%) | $0 |
| 6-Person Families | 0 (0.0%) | $0 |
| 7+ Person Families | 0 (0.0%) | $0 |
| Total | 257 (100.0%) | $45,739 |
Family Income by Number of Earners in Pecos
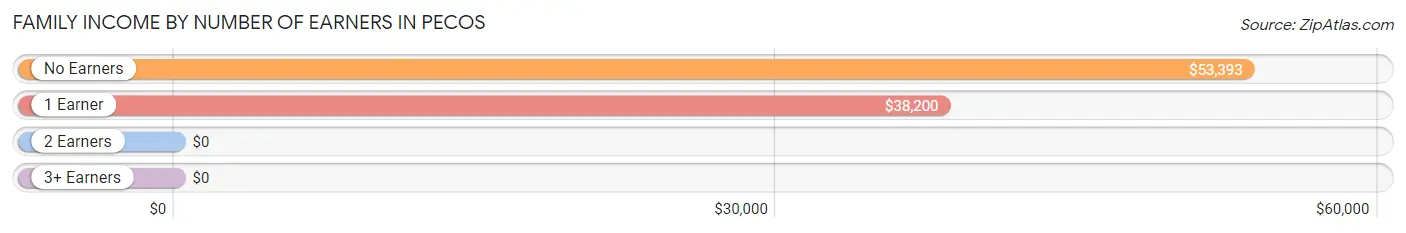
| Number of Earners | # Families | Median Income |
| No Earners | 65 (25.3%) | $53,393 |
| 1 Earner | 86 (33.5%) | $38,200 |
| 2 Earners | 91 (35.4%) | $0 |
| 3+ Earners | 15 (5.8%) | $0 |
| Total | 257 (100.0%) | $45,739 |
Household Income in Pecos
Household Income Brackets in Pecos
With 92 households falling in the category, the $35,000 to $49,999 income range is the most frequent in Pecos, accounting for 23.8% of all households. In contrast, only 11 households (2.9%) fall into the $200,000+ income bracket, making it the least populous group.
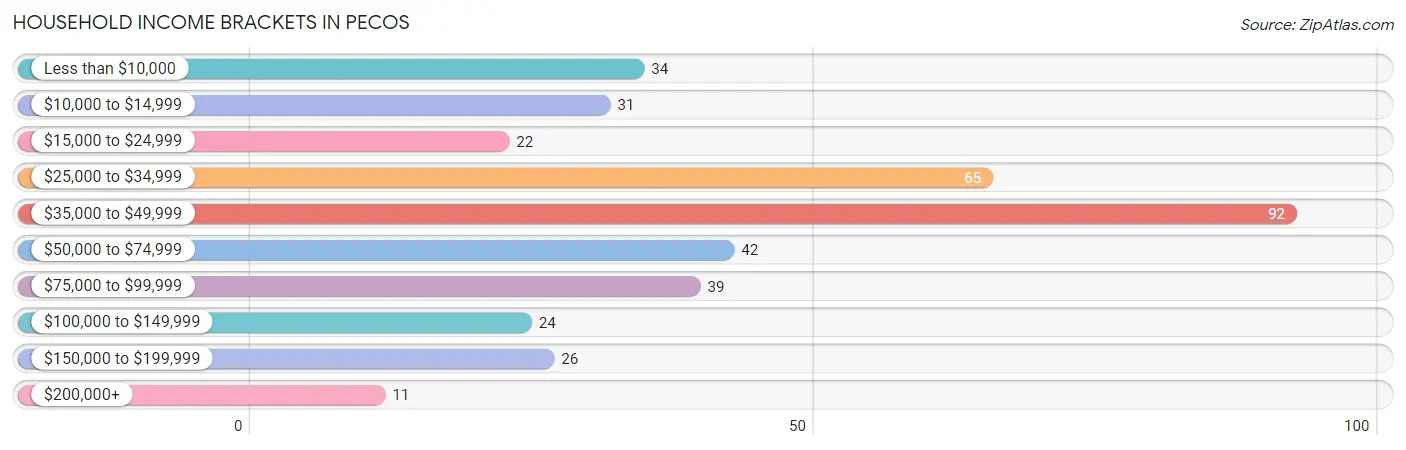
| Income Bracket | # Households | % Households |
| Less than $10,000 | 34 | 8.8% |
| $10,000 to $14,999 | 31 | 8.0% |
| $15,000 to $24,999 | 22 | 5.7% |
| $25,000 to $34,999 | 65 | 16.8% |
| $35,000 to $49,999 | 92 | 23.8% |
| $50,000 to $74,999 | 42 | 10.9% |
| $75,000 to $99,999 | 39 | 10.1% |
| $100,000 to $149,999 | 24 | 6.2% |
| $150,000 to $199,999 | 26 | 6.7% |
| $200,000+ | 11 | 2.8% |
Household Income by Householder Age in Pecos
The median household income in Pecos is $42,105, with the highest median household income of $43,971 found in the 45 to 64 years age bracket for the primary householder. A total of 166 households (43.0%) fall into this category.
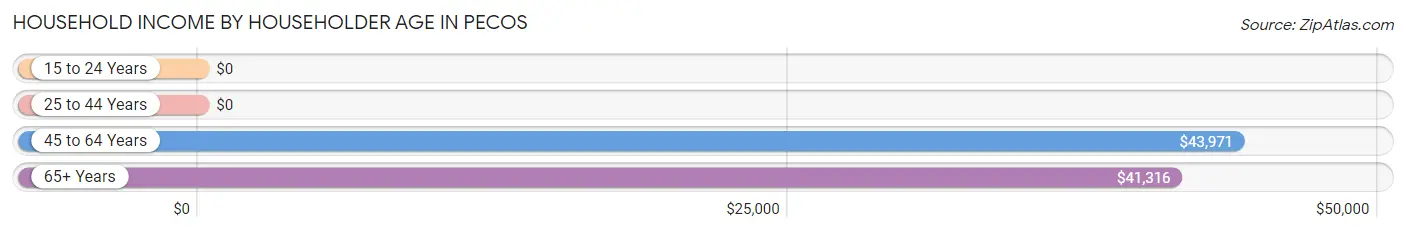
| Income Bracket | # Households | Median Income |
| 15 to 24 Years | 0 (0.0%) | $0 |
| 25 to 44 Years | 70 (18.1%) | $0 |
| 45 to 64 Years | 166 (43.0%) | $43,971 |
| 65+ Years | 150 (38.9%) | $41,316 |
| Total | 386 (100.0%) | $42,105 |
Poverty in Pecos
Income Below Poverty by Sex and Age in Pecos
With 18.2% poverty level for males and 15.7% for females among the residents of Pecos, under 5 year old males and 65 to 74 year old females are the most vulnerable to poverty, with 12 males (66.7%) and 22 females (40.7%) in their respective age groups living below the poverty level.
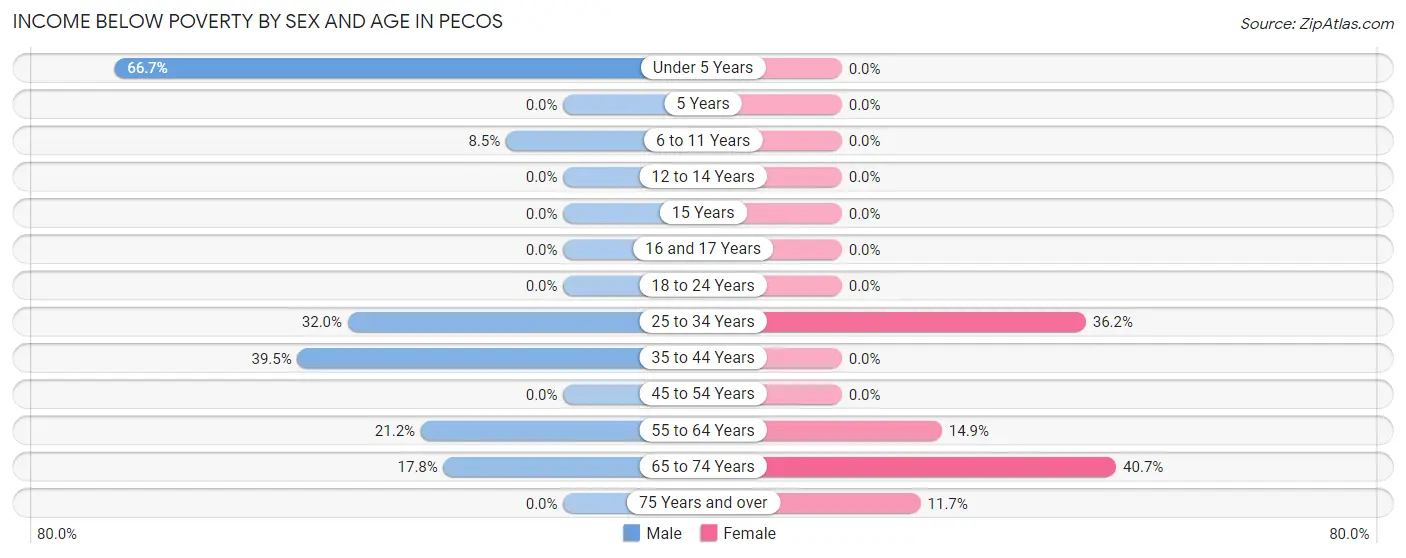
| Age Bracket | Male | Female |
| Under 5 Years | 12 (66.7%) | 0 (0.0%) |
| 5 Years | 0 (0.0%) | 0 (0.0%) |
| 6 to 11 Years | 8 (8.5%) | 0 (0.0%) |
| 12 to 14 Years | 0 (0.0%) | 0 (0.0%) |
| 15 Years | 0 (0.0%) | 0 (0.0%) |
| 16 and 17 Years | 0 (0.0%) | 0 (0.0%) |
| 18 to 24 Years | 0 (0.0%) | 0 (0.0%) |
| 25 to 34 Years | 16 (32.0%) | 25 (36.2%) |
| 35 to 44 Years | 15 (39.5%) | 0 (0.0%) |
| 45 to 54 Years | 0 (0.0%) | 0 (0.0%) |
| 55 to 64 Years | 22 (21.1%) | 11 (14.9%) |
| 65 to 74 Years | 8 (17.8%) | 22 (40.7%) |
| 75 Years and over | 0 (0.0%) | 11 (11.7%) |
| Total | 81 (18.2%) | 69 (15.7%) |
Income Above Poverty by Sex and Age in Pecos
According to the poverty statistics in Pecos, males aged 16 and 17 years and females aged 5 years are the age groups that are most secure financially, with 100.0% of males and 100.0% of females in these age groups living above the poverty line.
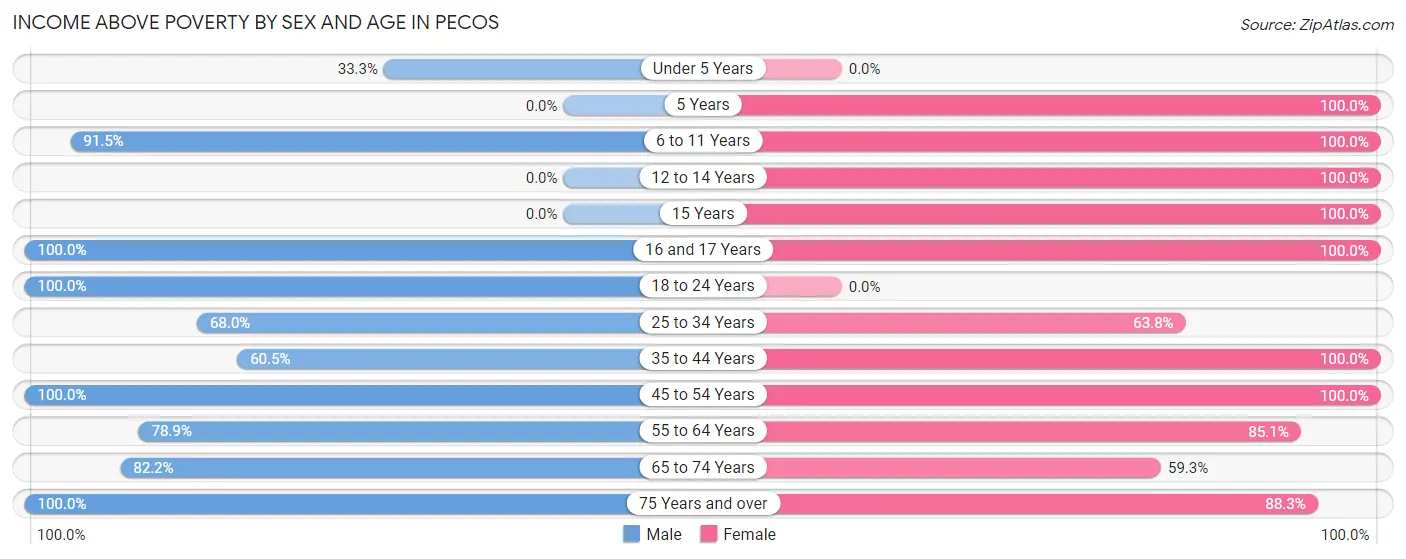
| Age Bracket | Male | Female |
| Under 5 Years | 6 (33.3%) | 0 (0.0%) |
| 5 Years | 0 (0.0%) | 12 (100.0%) |
| 6 to 11 Years | 86 (91.5%) | 25 (100.0%) |
| 12 to 14 Years | 0 (0.0%) | 5 (100.0%) |
| 15 Years | 0 (0.0%) | 7 (100.0%) |
| 16 and 17 Years | 1 (100.0%) | 6 (100.0%) |
| 18 to 24 Years | 23 (100.0%) | 0 (0.0%) |
| 25 to 34 Years | 34 (68.0%) | 44 (63.8%) |
| 35 to 44 Years | 23 (60.5%) | 11 (100.0%) |
| 45 to 54 Years | 23 (100.0%) | 84 (100.0%) |
| 55 to 64 Years | 82 (78.8%) | 63 (85.1%) |
| 65 to 74 Years | 37 (82.2%) | 32 (59.3%) |
| 75 Years and over | 48 (100.0%) | 83 (88.3%) |
| Total | 363 (81.8%) | 372 (84.4%) |
Income Below Poverty Among Married-Couple Families in Pecos
The poverty statistics for married-couple families in Pecos show that 16.3% or 36 of the total 221 families live below the poverty line. Families with 1 or 2 children have the highest poverty rate of 23.1%, comprising of 12 families. On the other hand, families with no children have the lowest poverty rate of 14.2%, which includes 24 families.
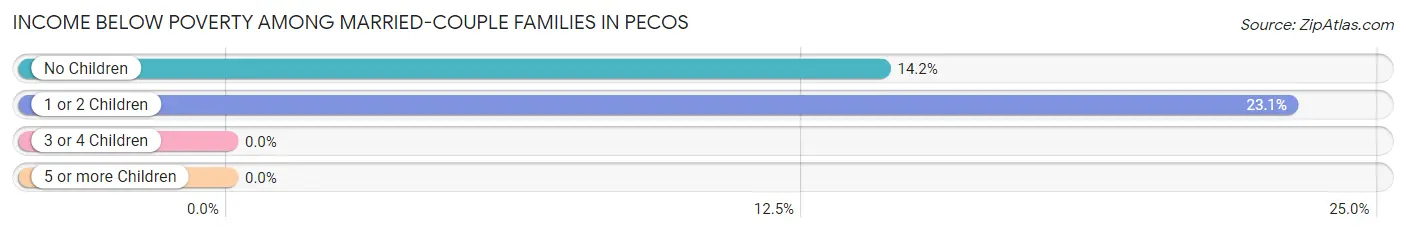
| Children | Above Poverty | Below Poverty |
| No Children | 145 (85.8%) | 24 (14.2%) |
| 1 or 2 Children | 40 (76.9%) | 12 (23.1%) |
| 3 or 4 Children | 0 (0.0%) | 0 (0.0%) |
| 5 or more Children | 0 (0.0%) | 0 (0.0%) |
| Total | 185 (83.7%) | 36 (16.3%) |
Income Below Poverty Among Single-Parent Households in Pecos
| Children | Single Father | Single Mother |
| No Children | 0 (0.0%) | 0 (0.0%) |
| 1 or 2 Children | 0 (0.0%) | 0 (0.0%) |
| 3 or 4 Children | 0 (0.0%) | 0 (0.0%) |
| 5 or more Children | 0 (0.0%) | 0 (0.0%) |
| Total | 0 (0.0%) | 0 (0.0%) |
Income Below Poverty Among Married-Couple vs Single-Parent Households in Pecos
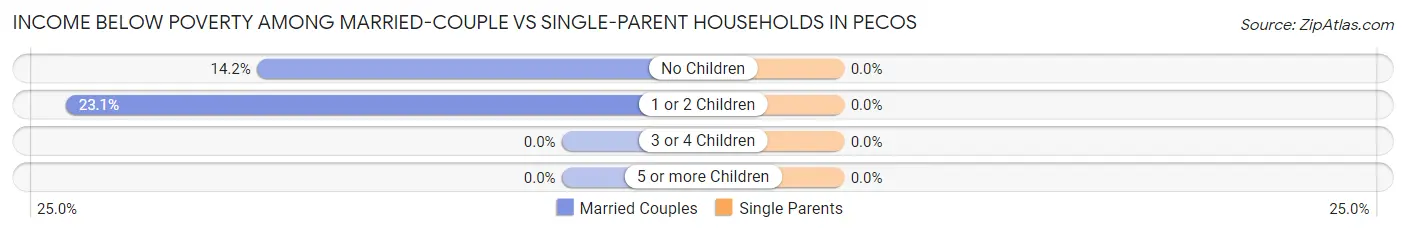
| Children | Married-Couple Families | Single-Parent Households |
| No Children | 24 (14.2%) | 0 (0.0%) |
| 1 or 2 Children | 12 (23.1%) | 0 (0.0%) |
| 3 or 4 Children | 0 (0.0%) | 0 (0.0%) |
| 5 or more Children | 0 (0.0%) | 0 (0.0%) |
| Total | 36 (16.3%) | 0 (0.0%) |
Race in Pecos
The most populous races in Pecos are Hispanic or Latino (752 | 85.0%), White / Caucasian (436 | 49.3%), and Some other Race (234 | 26.4%).
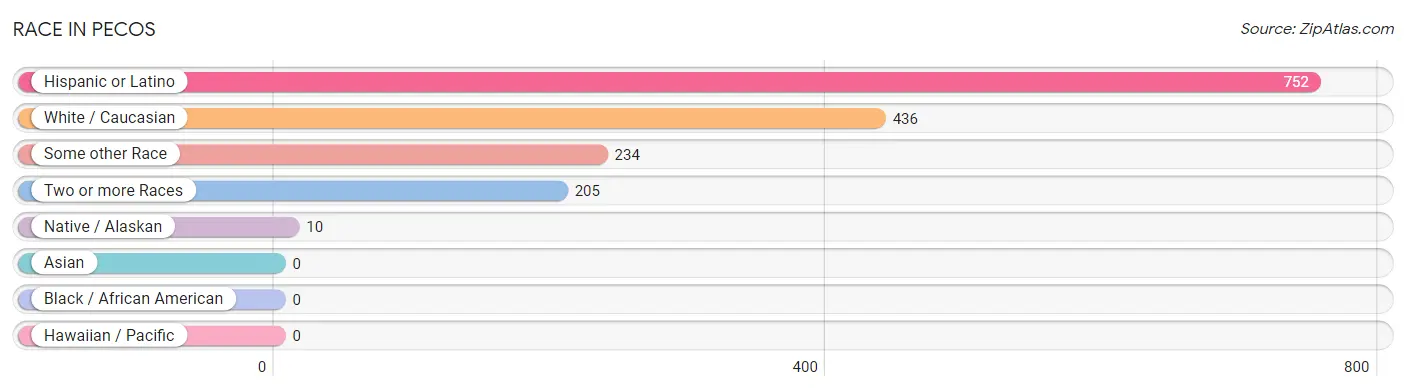
| Race | # Population | % Population |
| Asian | 0 | 0.0% |
| Black / African American | 0 | 0.0% |
| Hawaiian / Pacific | 0 | 0.0% |
| Hispanic or Latino | 752 | 85.0% |
| Native / Alaskan | 10 | 1.1% |
| White / Caucasian | 436 | 49.3% |
| Two or more Races | 205 | 23.2% |
| Some other Race | 234 | 26.4% |
| Total | 885 | 100.0% |
Ancestry in Pecos
The most populous ancestries reported in Pecos are Spanish (182 | 20.6%), Mexican (161 | 18.2%), Spaniard (72 | 8.1%), American (38 | 4.3%), and Italian (29 | 3.3%), together accounting for 54.5% of all Pecos residents.
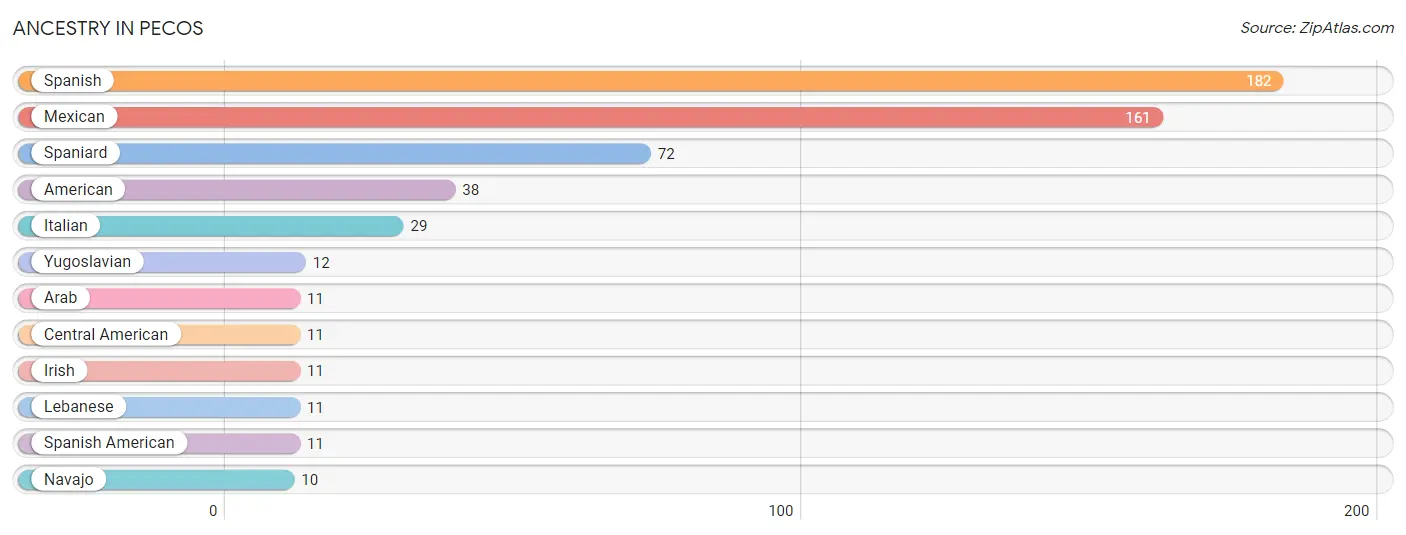
| Ancestry | # Population | % Population |
| American | 38 | 4.3% |
| Arab | 11 | 1.2% |
| Central American | 11 | 1.2% |
| Irish | 11 | 1.2% |
| Italian | 29 | 3.3% |
| Lebanese | 11 | 1.2% |
| Mexican | 161 | 18.2% |
| Navajo | 10 | 1.1% |
| Spaniard | 72 | 8.1% |
| Spanish | 182 | 20.6% |
| Spanish American | 11 | 1.2% |
| Yugoslavian | 12 | 1.4% | View All 12 Rows |
Immigrants in Pecos
The most numerous immigrant groups reported in Pecos came from Central America (72 | 8.1%), Latin America (72 | 8.1%), and Mexico (72 | 8.1%), together accounting for 24.4% of all Pecos residents.
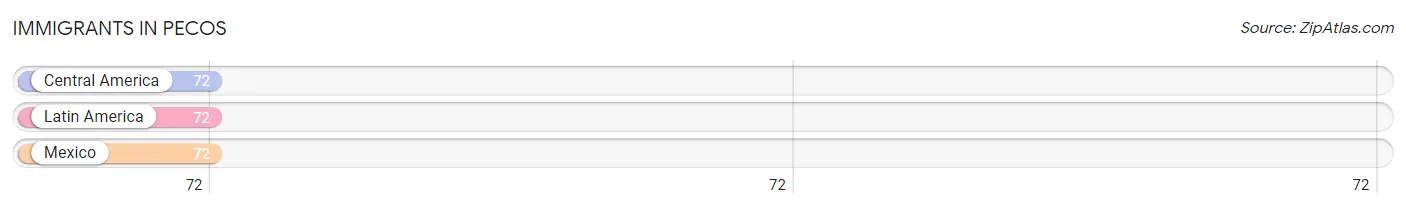
| Immigration Origin | # Population | % Population |
| Central America | 72 | 8.1% |
| Latin America | 72 | 8.1% |
| Mexico | 72 | 8.1% | View All 3 Rows |
Sex and Age in Pecos
Sex and Age in Pecos
The most populous age groups in Pecos are 5 to 9 Years (82 | 18.5%) for men and 65 to 69 Years (54 | 12.2%) for women.
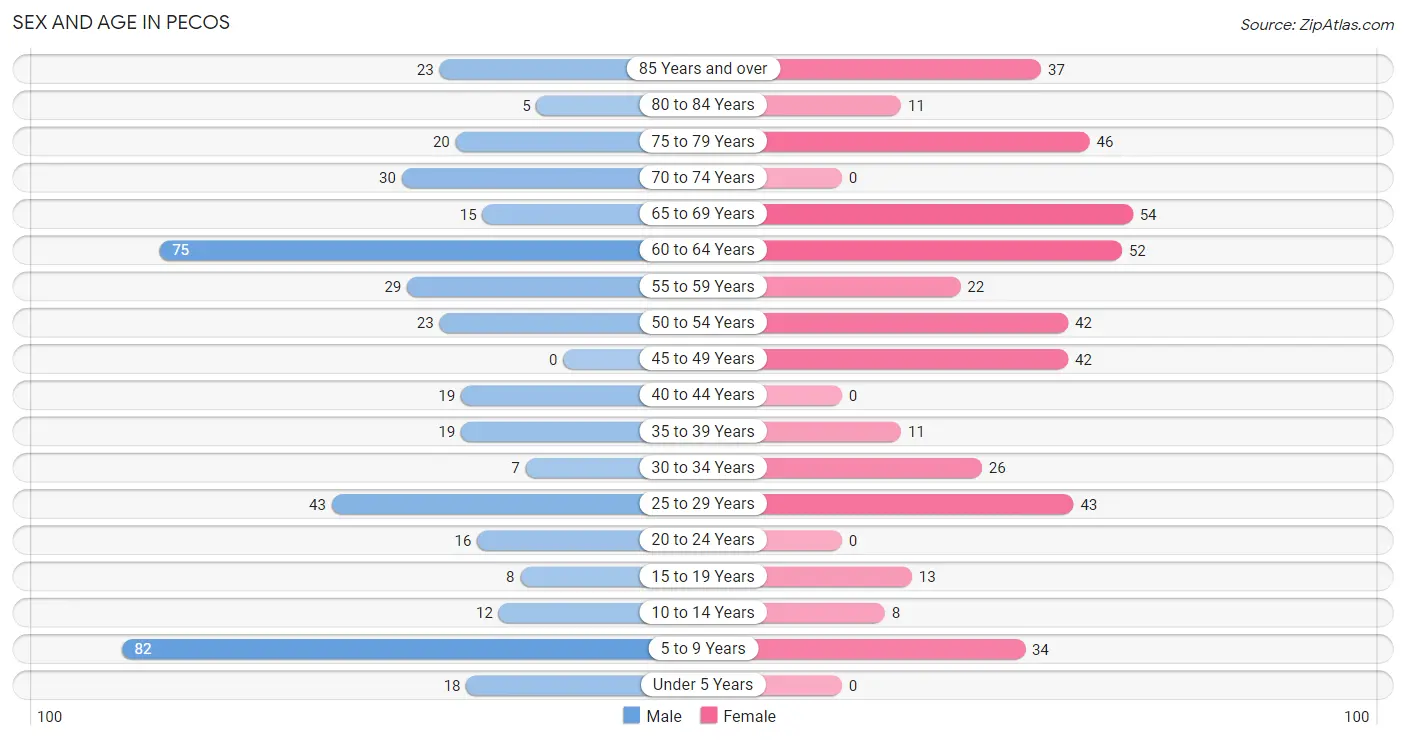
| Age Bracket | Male | Female |
| Under 5 Years | 18 (4.1%) | 0 (0.0%) |
| 5 to 9 Years | 82 (18.5%) | 34 (7.7%) |
| 10 to 14 Years | 12 (2.7%) | 8 (1.8%) |
| 15 to 19 Years | 8 (1.8%) | 13 (2.9%) |
| 20 to 24 Years | 16 (3.6%) | 0 (0.0%) |
| 25 to 29 Years | 43 (9.7%) | 43 (9.8%) |
| 30 to 34 Years | 7 (1.6%) | 26 (5.9%) |
| 35 to 39 Years | 19 (4.3%) | 11 (2.5%) |
| 40 to 44 Years | 19 (4.3%) | 0 (0.0%) |
| 45 to 49 Years | 0 (0.0%) | 42 (9.5%) |
| 50 to 54 Years | 23 (5.2%) | 42 (9.5%) |
| 55 to 59 Years | 29 (6.5%) | 22 (5.0%) |
| 60 to 64 Years | 75 (16.9%) | 52 (11.8%) |
| 65 to 69 Years | 15 (3.4%) | 54 (12.2%) |
| 70 to 74 Years | 30 (6.8%) | 0 (0.0%) |
| 75 to 79 Years | 20 (4.5%) | 46 (10.4%) |
| 80 to 84 Years | 5 (1.1%) | 11 (2.5%) |
| 85 Years and over | 23 (5.2%) | 37 (8.4%) |
| Total | 444 (100.0%) | 441 (100.0%) |
Families and Households in Pecos
Median Family Size in Pecos
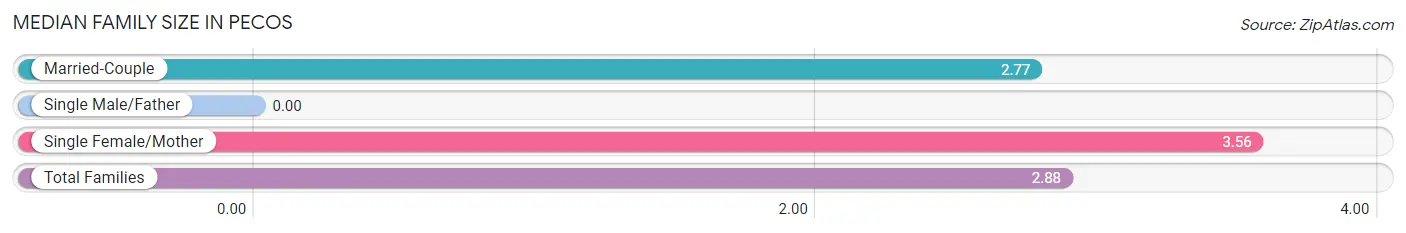
| Family Type | # Families | Family Size |
| Married-Couple | 221 (86.0%) | 2.77 |
| Single Male/Father | 0 (0.0%) | - |
| Single Female/Mother | 36 (14.0%) | 3.56 |
| Total Families | 257 (100.0%) | 2.88 |
Median Household Size in Pecos
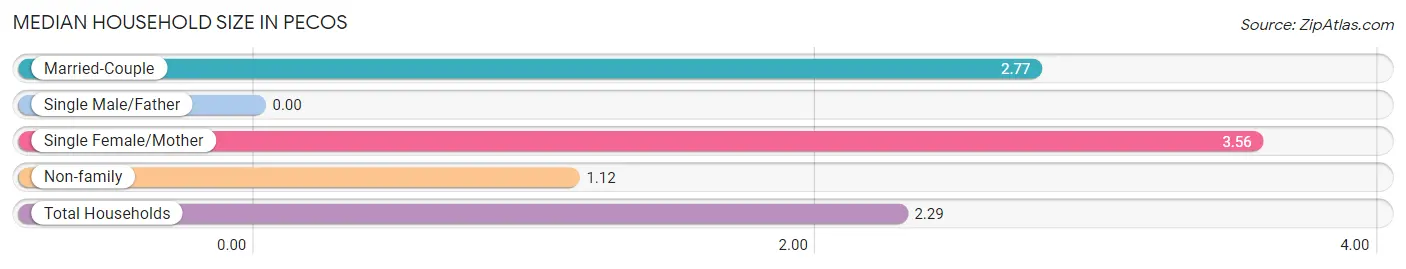
| Household Type | # Households | Household Size |
| Married-Couple | 221 (57.3%) | 2.77 |
| Single Male/Father | 0 (0.0%) | - |
| Single Female/Mother | 36 (9.3%) | 3.56 |
| Non-family | 129 (33.4%) | 1.12 |
| Total Households | 386 (100.0%) | 2.29 |
Household Size by Marriage Status in Pecos
Out of a total of 386 households in Pecos, 257 (66.6%) are family households, while 129 (33.4%) are nonfamily households. The most numerous type of family households are 2-person households, comprising 135, and the most common type of nonfamily households are 1-person households, comprising 110.
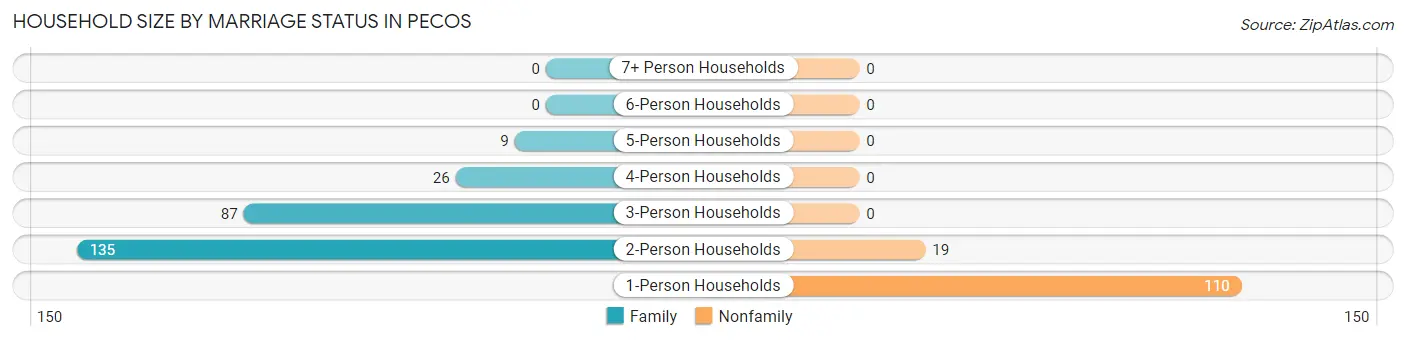
| Household Size | Family Households | Nonfamily Households |
| 1-Person Households | - | 110 (28.5%) |
| 2-Person Households | 135 (35.0%) | 19 (4.9%) |
| 3-Person Households | 87 (22.5%) | 0 (0.0%) |
| 4-Person Households | 26 (6.7%) | 0 (0.0%) |
| 5-Person Households | 9 (2.3%) | 0 (0.0%) |
| 6-Person Households | 0 (0.0%) | 0 (0.0%) |
| 7+ Person Households | 0 (0.0%) | 0 (0.0%) |
| Total | 257 (66.6%) | 129 (33.4%) |
Female Fertility in Pecos
Fertility by Age in Pecos
| Age Bracket | Women with Births | Births / 1,000 Women |
| 15 to 19 years | 0 (0.0%) | 0.0 |
| 20 to 34 years | 0 (0.0%) | 0.0 |
| 35 to 50 years | 0 (0.0%) | 0.0 |
| Total | 0 (0.0%) | 0.0 |
Fertility by Age by Marriage Status in Pecos
| Age Bracket | Married | Unmarried |
| 15 to 19 years | 0 (0.0%) | 0 (0.0%) |
| 20 to 34 years | 0 (0.0%) | 0 (0.0%) |
| 35 to 50 years | 0 (0.0%) | 0 (0.0%) |
| Total | 0 (0.0%) | 0 (0.0%) |
Fertility by Education in Pecos
| Educational Attainment | Women with Births | Births / 1,000 Women |
| Less than High School | 0 (0.0%) | 0.0 |
| High School Diploma | 0 (0.0%) | 0.0 |
| College or Associate's Degree | 0 (0.0%) | 0.0 |
| Bachelor's Degree | 0 (0.0%) | 0.0 |
| Graduate Degree | 0 (0.0%) | 0.0 |
| Total | 0 (0.0%) | 0.0 |
Fertility by Education by Marriage Status in Pecos
| Educational Attainment | Married | Unmarried |
| Less than High School | 0 (0.0%) | 0 (0.0%) |
| High School Diploma | 0 (0.0%) | 0 (0.0%) |
| College or Associate's Degree | 0 (0.0%) | 0 (0.0%) |
| Bachelor's Degree | 0 (0.0%) | 0 (0.0%) |
| Graduate Degree | 0 (0.0%) | 0 (0.0%) |
| Total | 0 (0.0%) | 0 (0.0%) |
Employment Characteristics in Pecos
Employment by Class of Employer in Pecos
Among the 355 employed individuals in Pecos, private company employees (135 | 38.0%), state government employees (73 | 20.6%), and self-employed (not incorporated) (36 | 10.1%) make up the most common classes of employment.
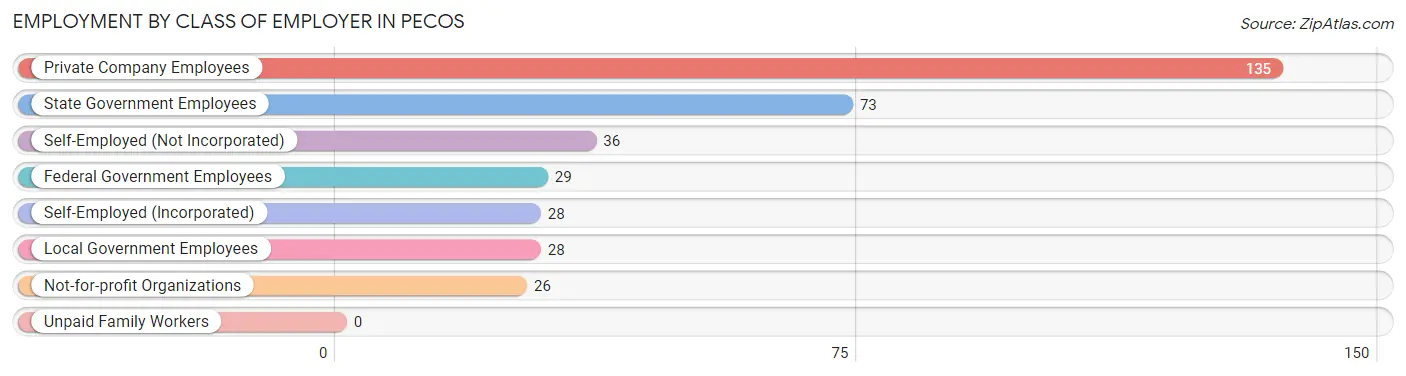
| Employer Class | # Employees | % Employees |
| Private Company Employees | 135 | 38.0% |
| Self-Employed (Incorporated) | 28 | 7.9% |
| Self-Employed (Not Incorporated) | 36 | 10.1% |
| Not-for-profit Organizations | 26 | 7.3% |
| Local Government Employees | 28 | 7.9% |
| State Government Employees | 73 | 20.6% |
| Federal Government Employees | 29 | 8.2% |
| Unpaid Family Workers | 0 | 0.0% |
| Total | 355 | 100.0% |
Employment Status by Age in Pecos
According to the labor force statistics for Pecos, out of the total population over 16 years of age (724), 52.2% or 378 individuals are in the labor force, with 2.9% or 11 of them unemployed. The age group with the highest labor force participation rate is 20 to 24 years, with 100.0% or 16 individuals in the labor force. Within the labor force, the 35 to 44 years age range has the highest percentage of unemployed individuals, with 22.4% or 11 of them being unemployed.
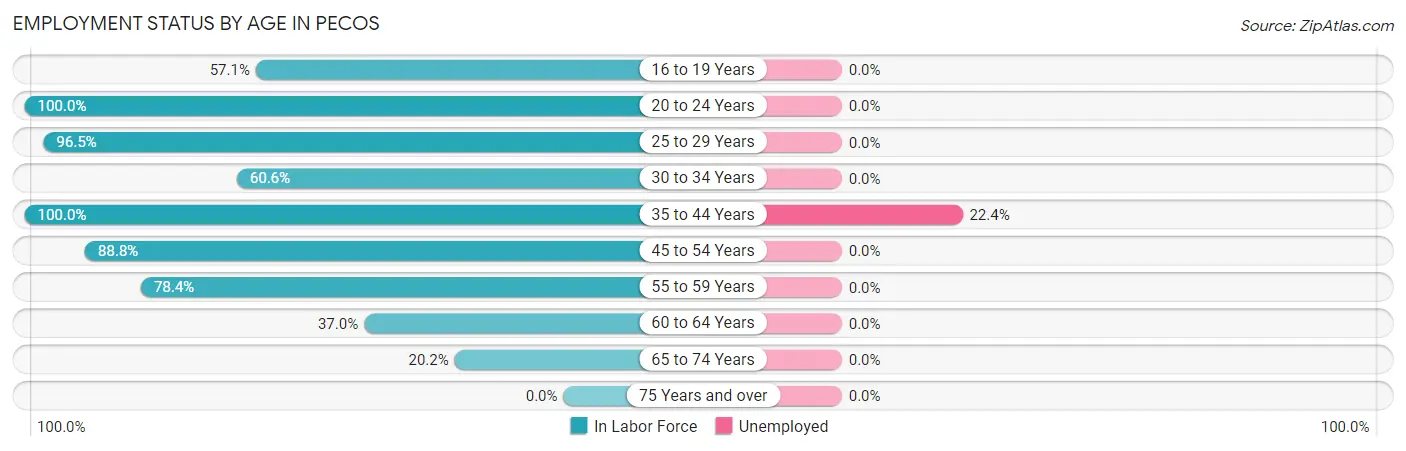
| Age Bracket | In Labor Force | Unemployed |
| 16 to 19 Years | 8 (57.1%) | 0 (0.0%) |
| 20 to 24 Years | 16 (100.0%) | 0 (0.0%) |
| 25 to 29 Years | 83 (96.5%) | 0 (0.0%) |
| 30 to 34 Years | 20 (60.6%) | 0 (0.0%) |
| 35 to 44 Years | 49 (100.0%) | 11 (22.4%) |
| 45 to 54 Years | 95 (88.8%) | 0 (0.0%) |
| 55 to 59 Years | 40 (78.4%) | 0 (0.0%) |
| 60 to 64 Years | 47 (37.0%) | 0 (0.0%) |
| 65 to 74 Years | 20 (20.2%) | 0 (0.0%) |
| 75 Years and over | 0 (0.0%) | 0 (0.0%) |
| Total | 378 (52.2%) | 11 (2.9%) |
Employment Status by Educational Attainment in Pecos
According to labor force statistics for Pecos, 73.7% of individuals (334) out of the total population between 25 and 64 years of age (453) are in the labor force, with 3.3% or 11 of them being unemployed. The group with the highest labor force participation rate are those with the educational attainment of college / associate degree, with 89.2% or 181 individuals in the labor force. Within the labor force, individuals with college / associate degree education have the highest percentage of unemployment, with 6.1% or 11 of them being unemployed.
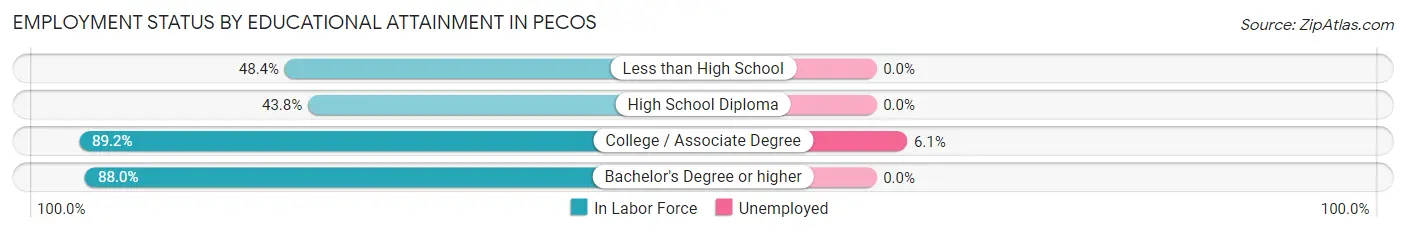
| Educational Attainment | In Labor Force | Unemployed |
| Less than High School | 30 (48.4%) | 0 (0.0%) |
| High School Diploma | 42 (43.8%) | 0 (0.0%) |
| College / Associate Degree | 181 (89.2%) | 12 (6.1%) |
| Bachelor's Degree or higher | 81 (88.0%) | 0 (0.0%) |
| Total | 334 (73.7%) | 15 (3.3%) |
Employment Occupations by Sex in Pecos
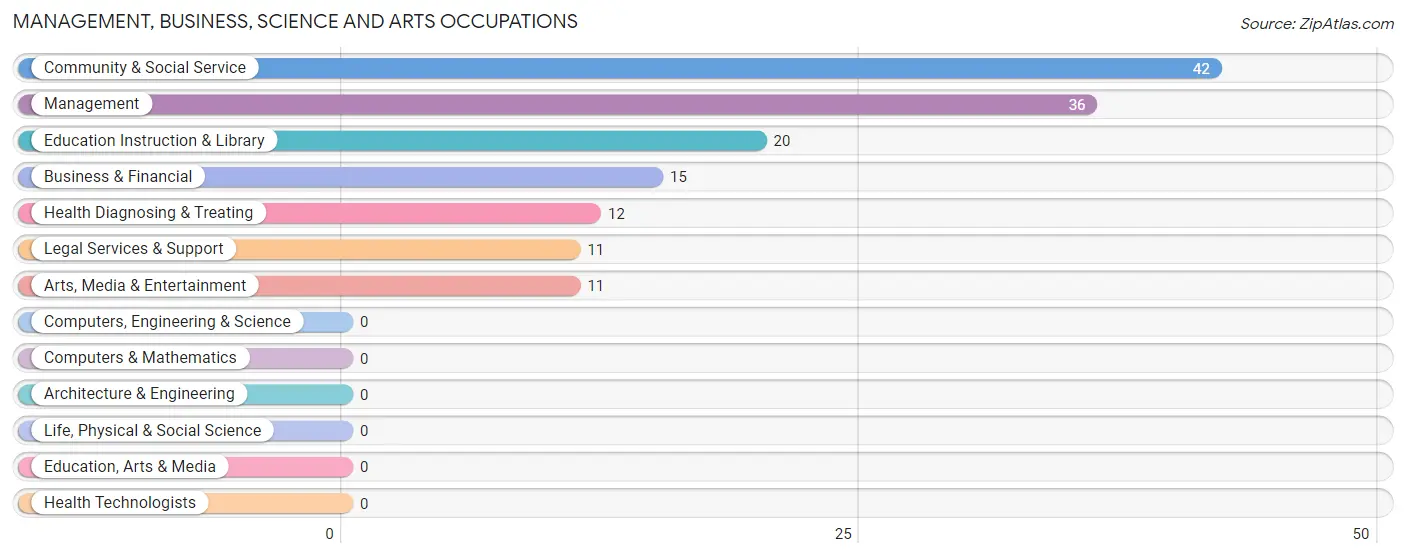
Management, Business, Science and Arts Occupations
The most common Management, Business, Science and Arts occupations in Pecos are Community & Social Service (42 | 11.4%), Management (36 | 9.8%), Education Instruction & Library (20 | 5.4%), Business & Financial (15 | 4.1%), and Health Diagnosing & Treating (12 | 3.3%).
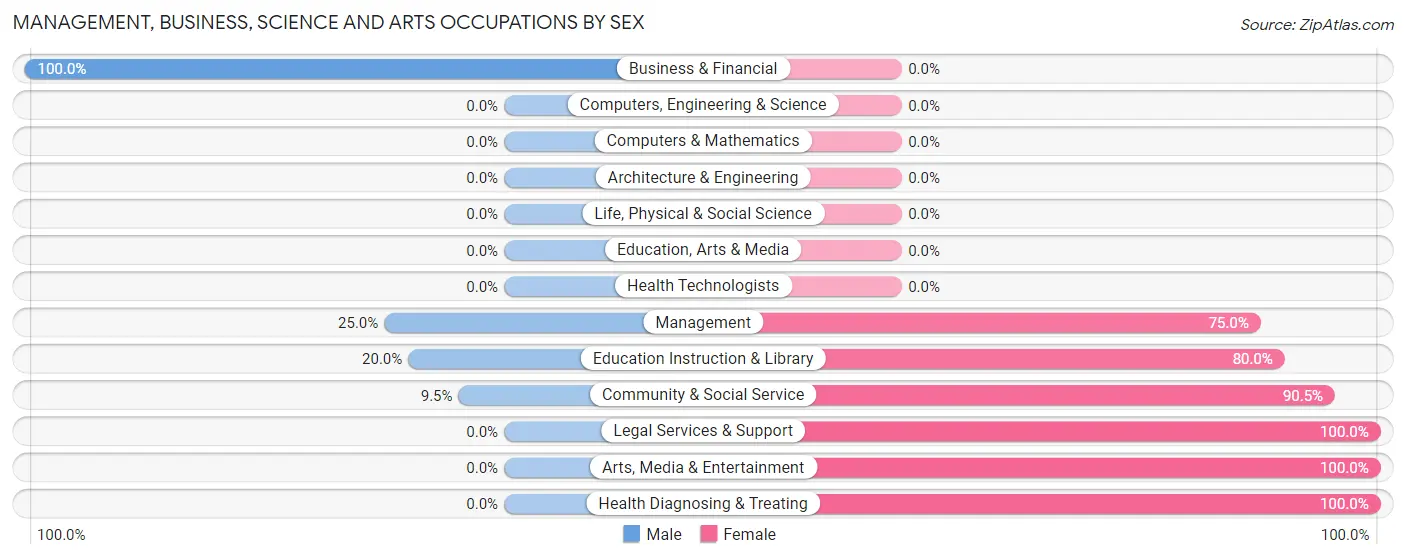
Management, Business, Science and Arts Occupations by Sex
Within the Management, Business, Science and Arts occupations in Pecos, the most male-oriented occupations are Business & Financial (100.0%), Management (25.0%), and Education Instruction & Library (20.0%), while the most female-oriented occupations are Legal Services & Support (100.0%), Arts, Media & Entertainment (100.0%), and Health Diagnosing & Treating (100.0%).
| Occupation | Male | Female |
| Management | 9 (25.0%) | 27 (75.0%) |
| Business & Financial | 15 (100.0%) | 0 (0.0%) |
| Computers, Engineering & Science | 0 (0.0%) | 0 (0.0%) |
| Computers & Mathematics | 0 (0.0%) | 0 (0.0%) |
| Architecture & Engineering | 0 (0.0%) | 0 (0.0%) |
| Life, Physical & Social Science | 0 (0.0%) | 0 (0.0%) |
| Community & Social Service | 4 (9.5%) | 38 (90.5%) |
| Education, Arts & Media | 0 (0.0%) | 0 (0.0%) |
| Legal Services & Support | 0 (0.0%) | 11 (100.0%) |
| Education Instruction & Library | 4 (20.0%) | 16 (80.0%) |
| Arts, Media & Entertainment | 0 (0.0%) | 11 (100.0%) |
| Health Diagnosing & Treating | 0 (0.0%) | 12 (100.0%) |
| Health Technologists | 0 (0.0%) | 0 (0.0%) |
| Total (Category) | 28 (26.7%) | 77 (73.3%) |
| Total (Overall) | 212 (57.8%) | 155 (42.2%) |
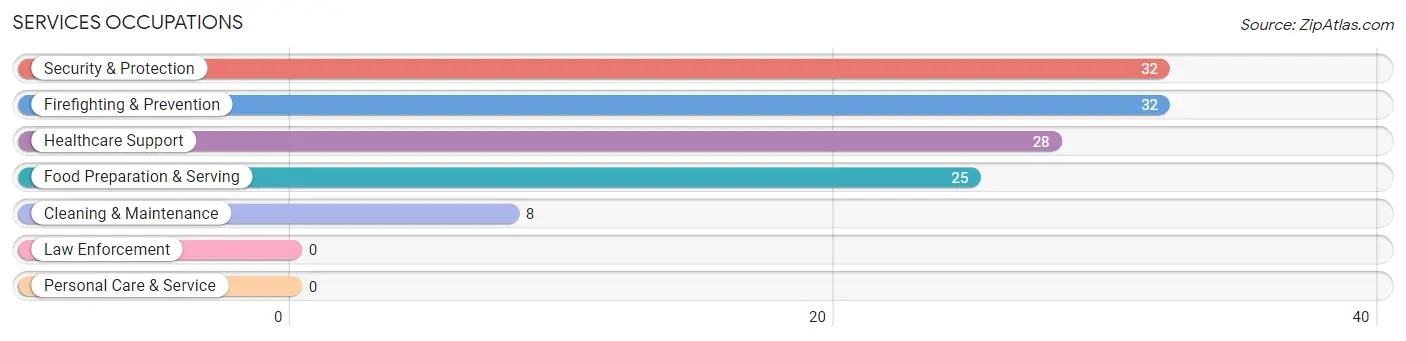
Services Occupations
The most common Services occupations in Pecos are Security & Protection (32 | 8.7%), Firefighting & Prevention (32 | 8.7%), Healthcare Support (28 | 7.6%), Food Preparation & Serving (25 | 6.8%), and Cleaning & Maintenance (8 | 2.2%).
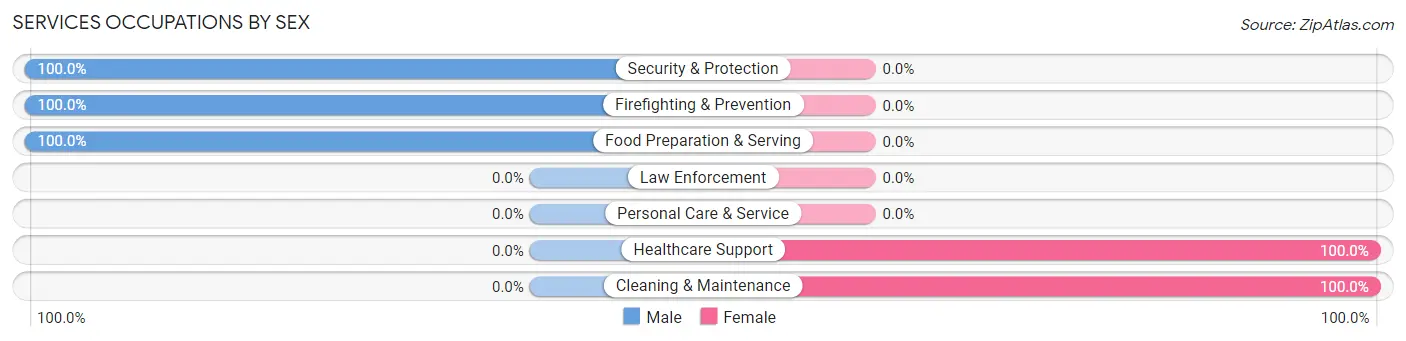
Services Occupations by Sex
Within the Services occupations in Pecos, the most male-oriented occupations are Security & Protection (100.0%), Firefighting & Prevention (100.0%), and Food Preparation & Serving (100.0%), while the most female-oriented occupations are Healthcare Support (100.0%), and Cleaning & Maintenance (100.0%).
| Occupation | Male | Female |
| Healthcare Support | 0 (0.0%) | 28 (100.0%) |
| Security & Protection | 32 (100.0%) | 0 (0.0%) |
| Firefighting & Prevention | 32 (100.0%) | 0 (0.0%) |
| Law Enforcement | 0 (0.0%) | 0 (0.0%) |
| Food Preparation & Serving | 25 (100.0%) | 0 (0.0%) |
| Cleaning & Maintenance | 0 (0.0%) | 8 (100.0%) |
| Personal Care & Service | 0 (0.0%) | 0 (0.0%) |
| Total (Category) | 57 (61.3%) | 36 (38.7%) |
| Total (Overall) | 212 (57.8%) | 155 (42.2%) |
Sales and Office Occupations
The most common Sales and Office occupations in Pecos are Office & Administration (46 | 12.5%), and Sales & Related (29 | 7.9%).

Sales and Office Occupations by Sex

| Occupation | Male | Female |
| Sales & Related | 26 (89.7%) | 3 (10.3%) |
| Office & Administration | 7 (15.2%) | 39 (84.8%) |
| Total (Category) | 33 (44.0%) | 42 (56.0%) |
| Total (Overall) | 212 (57.8%) | 155 (42.2%) |
Natural Resources, Construction and Maintenance Occupations
The most common Natural Resources, Construction and Maintenance occupations in Pecos are Installation, Maintenance & Repair (40 | 10.9%), and Construction & Extraction (19 | 5.2%).
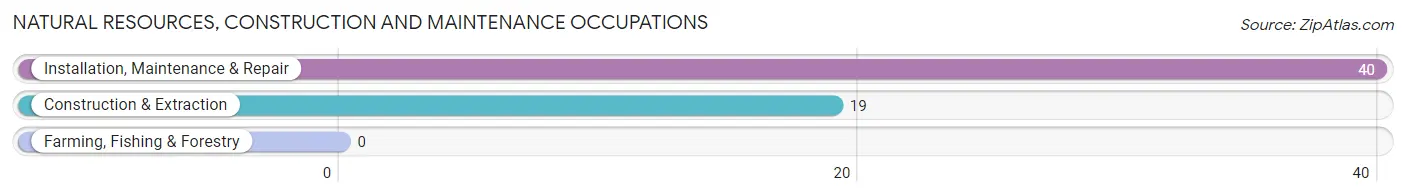
Natural Resources, Construction and Maintenance Occupations by Sex
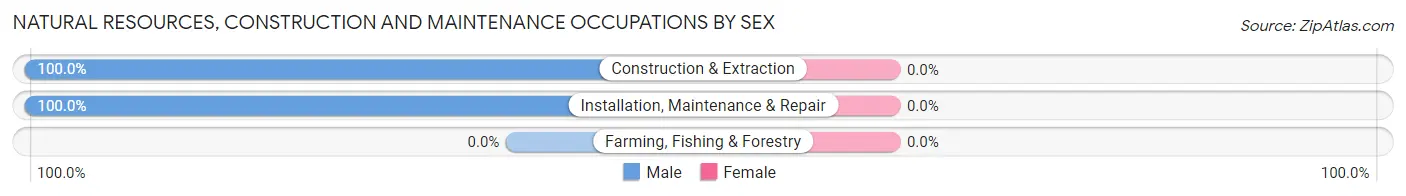
| Occupation | Male | Female |
| Farming, Fishing & Forestry | 0 (0.0%) | 0 (0.0%) |
| Construction & Extraction | 19 (100.0%) | 0 (0.0%) |
| Installation, Maintenance & Repair | 40 (100.0%) | 0 (0.0%) |
| Total (Category) | 59 (100.0%) | 0 (0.0%) |
| Total (Overall) | 212 (57.8%) | 155 (42.2%) |
Production, Transportation and Moving Occupations
The most common Production, Transportation and Moving occupations in Pecos are Material Moving (23 | 6.3%), and Production (12 | 3.3%).
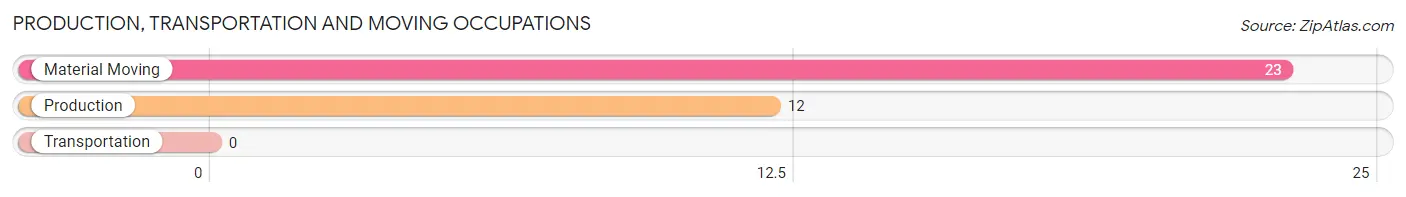
Production, Transportation and Moving Occupations by Sex
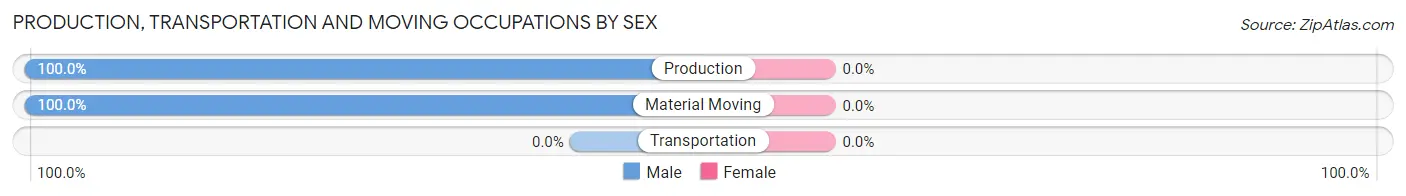
| Occupation | Male | Female |
| Production | 12 (100.0%) | 0 (0.0%) |
| Transportation | 0 (0.0%) | 0 (0.0%) |
| Material Moving | 23 (100.0%) | 0 (0.0%) |
| Total (Category) | 35 (100.0%) | 0 (0.0%) |
| Total (Overall) | 212 (57.8%) | 155 (42.2%) |
Employment Industries by Sex in Pecos
Employment Industries in Pecos
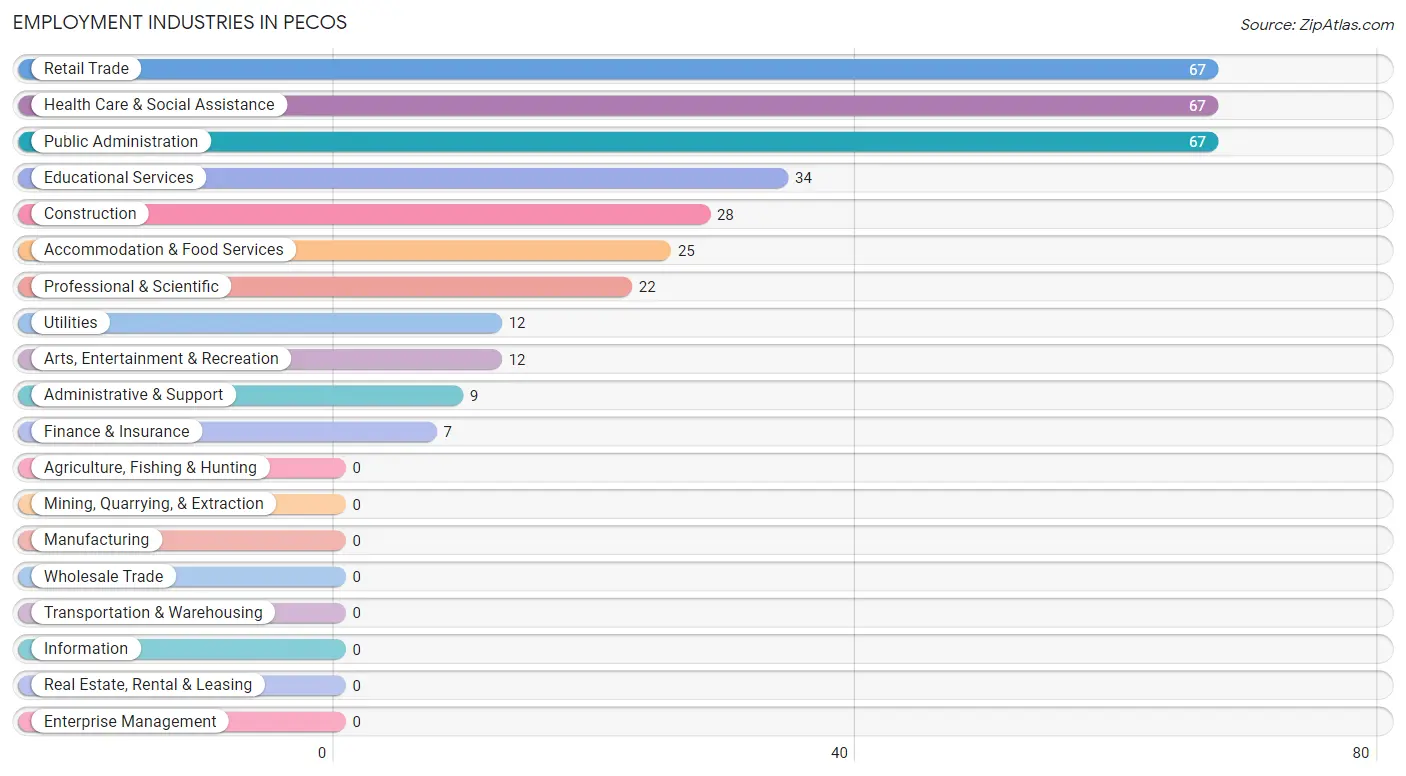
The major employment industries in Pecos include Retail Trade (67 | 18.3%), Health Care & Social Assistance (67 | 18.3%), Public Administration (67 | 18.3%), Educational Services (34 | 9.3%), and Construction (28 | 7.6%).
Employment Industries by Sex in Pecos
The Pecos industries that see more men than women are Construction (100.0%), Utilities (100.0%), and Finance & Insurance (100.0%), whereas the industries that tend to have a higher number of women are Administrative & Support (100.0%), Health Care & Social Assistance (100.0%), and Educational Services (58.8%).
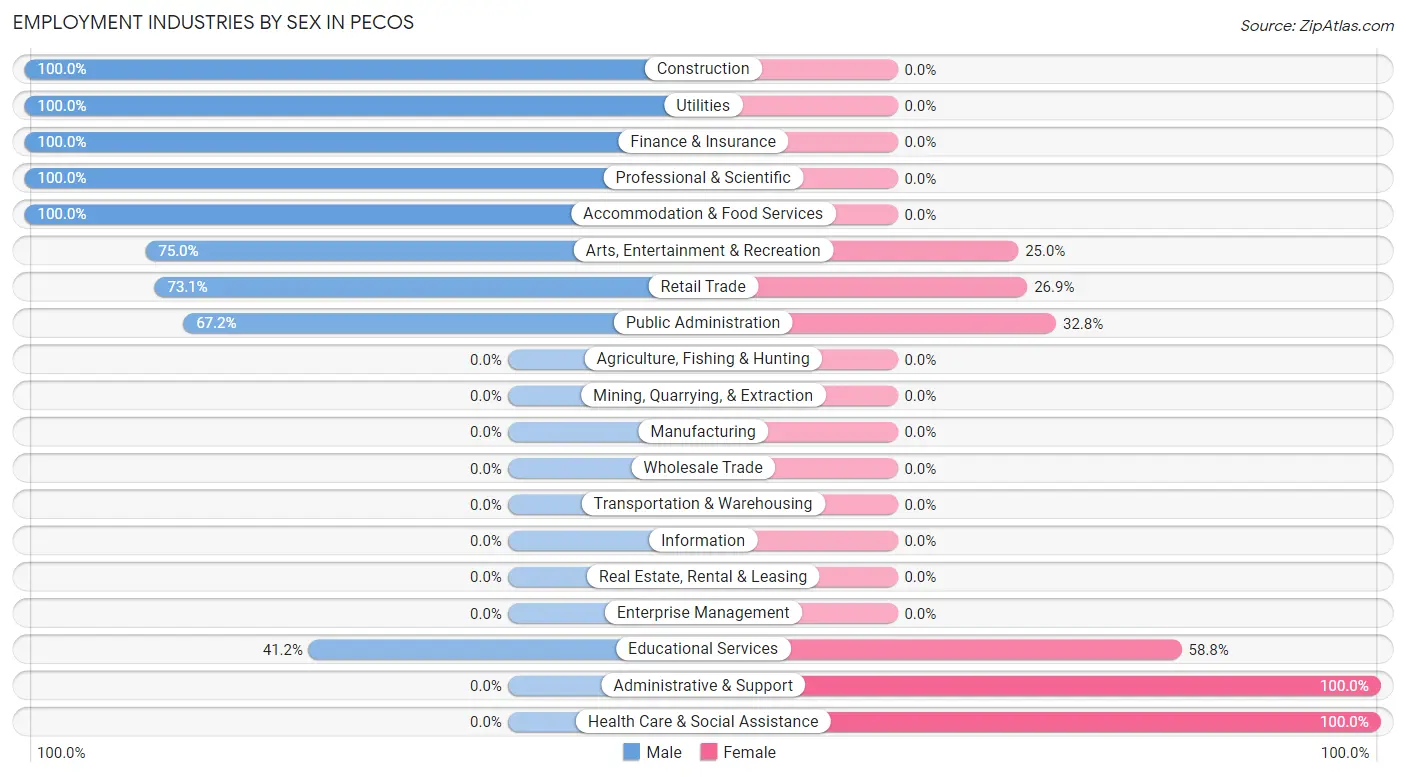
| Industry | Male | Female |
| Agriculture, Fishing & Hunting | 0 (0.0%) | 0 (0.0%) |
| Mining, Quarrying, & Extraction | 0 (0.0%) | 0 (0.0%) |
| Construction | 28 (100.0%) | 0 (0.0%) |
| Manufacturing | 0 (0.0%) | 0 (0.0%) |
| Wholesale Trade | 0 (0.0%) | 0 (0.0%) |
| Retail Trade | 49 (73.1%) | 18 (26.9%) |
| Transportation & Warehousing | 0 (0.0%) | 0 (0.0%) |
| Utilities | 12 (100.0%) | 0 (0.0%) |
| Information | 0 (0.0%) | 0 (0.0%) |
| Finance & Insurance | 7 (100.0%) | 0 (0.0%) |
| Real Estate, Rental & Leasing | 0 (0.0%) | 0 (0.0%) |
| Professional & Scientific | 22 (100.0%) | 0 (0.0%) |
| Enterprise Management | 0 (0.0%) | 0 (0.0%) |
| Administrative & Support | 0 (0.0%) | 9 (100.0%) |
| Educational Services | 14 (41.2%) | 20 (58.8%) |
| Health Care & Social Assistance | 0 (0.0%) | 67 (100.0%) |
| Arts, Entertainment & Recreation | 9 (75.0%) | 3 (25.0%) |
| Accommodation & Food Services | 25 (100.0%) | 0 (0.0%) |
| Public Administration | 45 (67.2%) | 22 (32.8%) |
| Total | 212 (57.8%) | 155 (42.2%) |
Education in Pecos
School Enrollment in Pecos
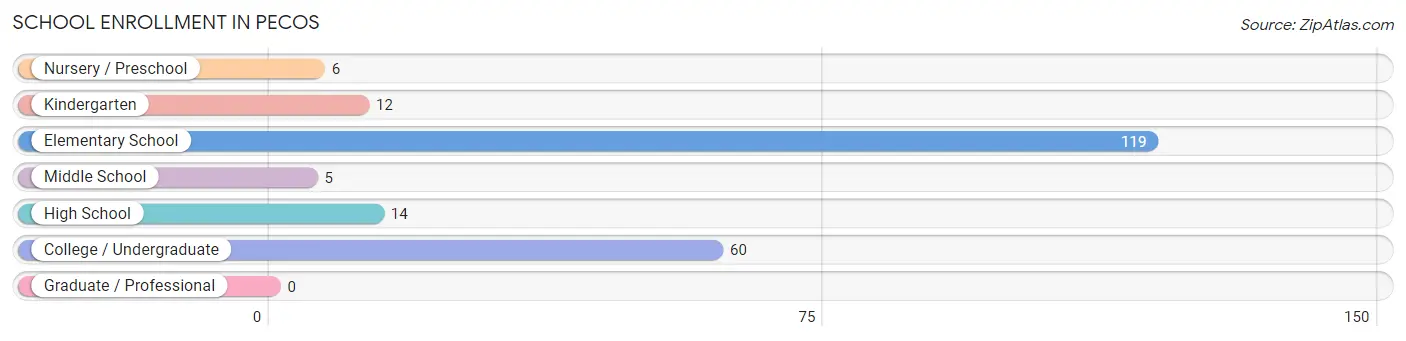
The most common levels of schooling among the 216 students in Pecos are elementary school (119 | 55.1%), college / undergraduate (60 | 27.8%), and high school (14 | 6.5%).
| School Level | # Students | % Students |
| Nursery / Preschool | 6 | 2.8% |
| Kindergarten | 12 | 5.6% |
| Elementary School | 119 | 55.1% |
| Middle School | 5 | 2.3% |
| High School | 14 | 6.5% |
| College / Undergraduate | 60 | 27.8% |
| Graduate / Professional | 0 | 0.0% |
| Total | 216 | 100.0% |
School Enrollment by Age by Funding Source in Pecos
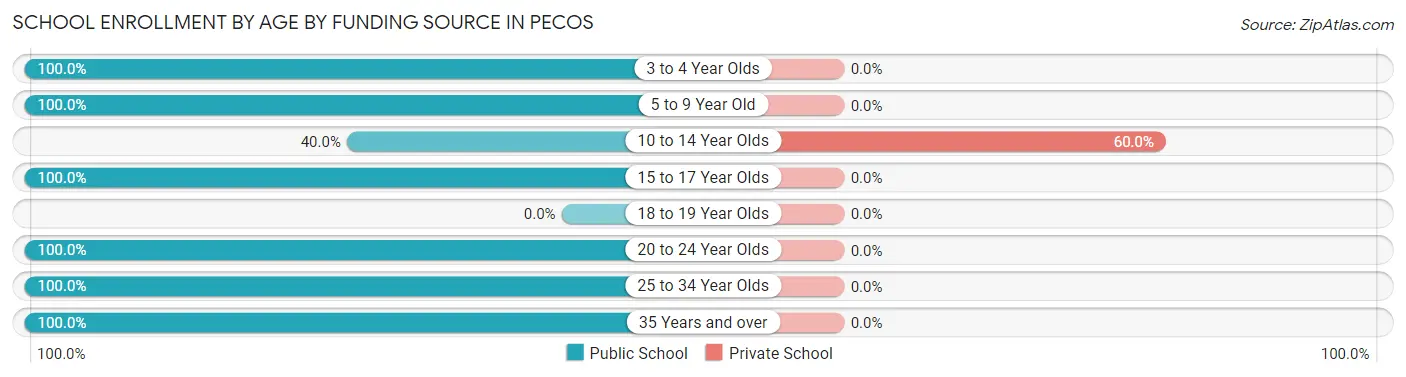
Out of a total of 216 students who are enrolled in schools in Pecos, 12 (5.6%) attend a private institution, while the remaining 204 (94.4%) are enrolled in public schools. The age group of 10 to 14 year olds has the highest likelihood of being enrolled in private schools, with 12 (60.0% in the age bracket) enrolled. Conversely, the age group of 3 to 4 year olds has the lowest likelihood of being enrolled in a private school, with 6 (100.0% in the age bracket) attending a public institution.
| Age Bracket | Public School | Private School |
| 3 to 4 Year Olds | 6 (100.0%) | 0 (0.0%) |
| 5 to 9 Year Old | 116 (100.0%) | 0 (0.0%) |
| 10 to 14 Year Olds | 8 (40.0%) | 12 (60.0%) |
| 15 to 17 Year Olds | 14 (100.0%) | 0 (0.0%) |
| 18 to 19 Year Olds | 0 (0.0%) | 0 (0.0%) |
| 20 to 24 Year Olds | 16 (100.0%) | 0 (0.0%) |
| 25 to 34 Year Olds | 17 (100.0%) | 0 (0.0%) |
| 35 Years and over | 27 (100.0%) | 0 (0.0%) |
| Total | 204 (94.4%) | 12 (5.6%) |
Educational Attainment by Field of Study in Pecos
Business (26 | 22.6%), visual & performing arts (23 | 20.0%), education (20 | 17.4%), arts & humanities (20 | 17.4%), and social sciences (15 | 13.0%) are the most common fields of study among 115 individuals in Pecos who have obtained a bachelor's degree or higher.
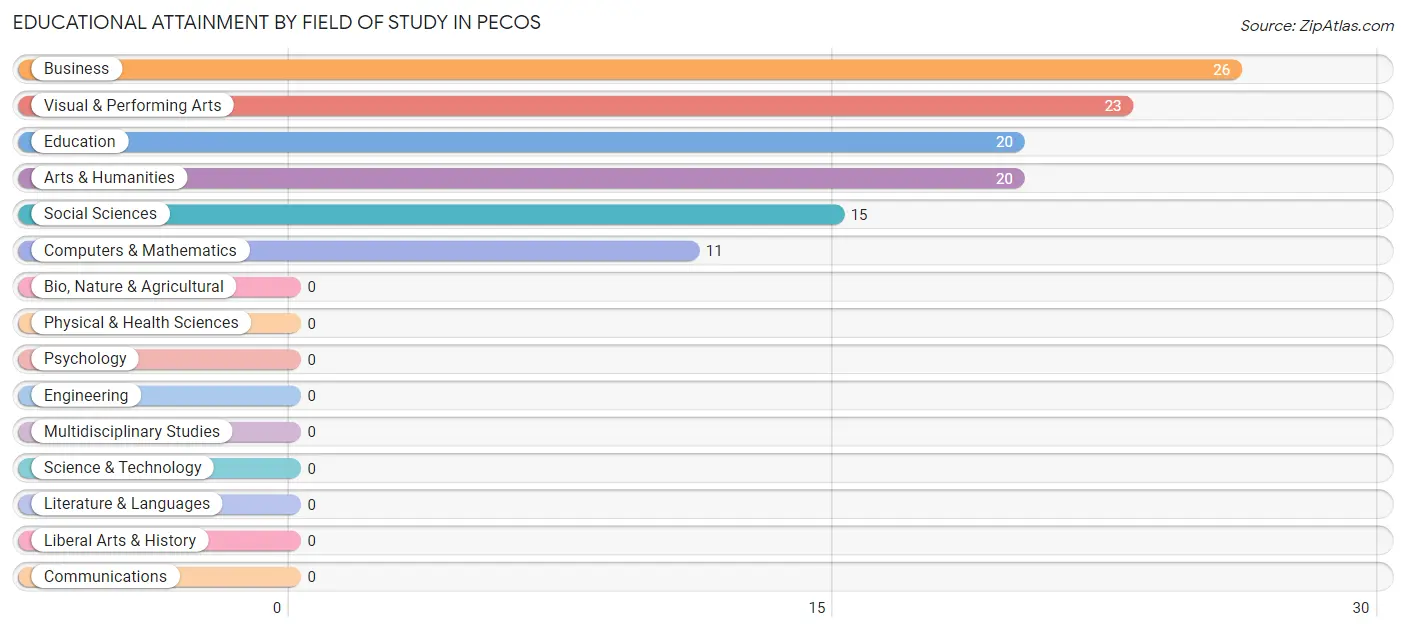
| Field of Study | # Graduates | % Graduates |
| Computers & Mathematics | 11 | 9.6% |
| Bio, Nature & Agricultural | 0 | 0.0% |
| Physical & Health Sciences | 0 | 0.0% |
| Psychology | 0 | 0.0% |
| Social Sciences | 15 | 13.0% |
| Engineering | 0 | 0.0% |
| Multidisciplinary Studies | 0 | 0.0% |
| Science & Technology | 0 | 0.0% |
| Business | 26 | 22.6% |
| Education | 20 | 17.4% |
| Literature & Languages | 0 | 0.0% |
| Liberal Arts & History | 0 | 0.0% |
| Visual & Performing Arts | 23 | 20.0% |
| Communications | 0 | 0.0% |
| Arts & Humanities | 20 | 17.4% |
| Total | 115 | 100.0% |
Transportation & Commute in Pecos
Vehicle Availability by Sex in Pecos
The most prevalent vehicle ownership categories in Pecos are males with 3 vehicles (84, accounting for 39.6%) and females with 3 vehicles (38, making up 58.7%).
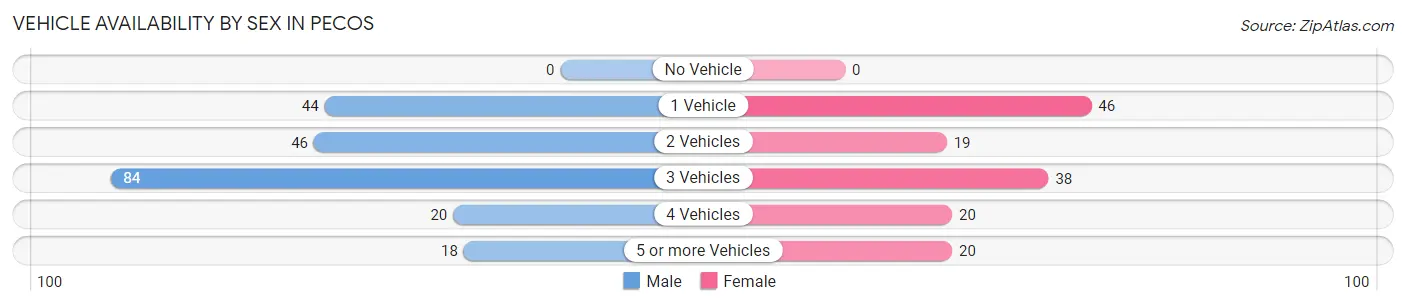
| Vehicles Available | Male | Female |
| No Vehicle | 0 (0.0%) | 0 (0.0%) |
| 1 Vehicle | 44 (20.7%) | 46 (32.2%) |
| 2 Vehicles | 46 (21.7%) | 19 (13.3%) |
| 3 Vehicles | 84 (39.6%) | 38 (26.6%) |
| 4 Vehicles | 20 (9.4%) | 20 (14.0%) |
| 5 or more Vehicles | 18 (8.5%) | 20 (14.0%) |
| Total | 212 (100.0%) | 143 (100.0%) |
Commute Time in Pecos
The most frequently occuring commute durations in Pecos are 45 to 59 minutes (108 commuters, 31.9%), 30 to 34 minutes (94 commuters, 27.7%), and 5 to 9 minutes (48 commuters, 14.2%).
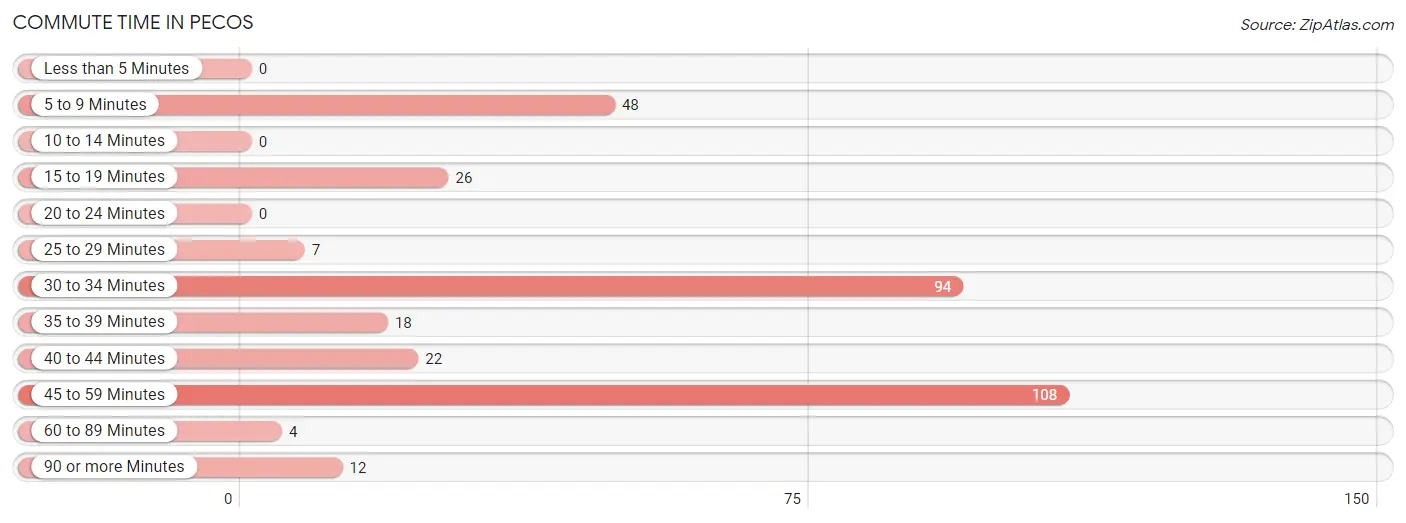
| Commute Time | # Commuters | % Commuters |
| Less than 5 Minutes | 0 | 0.0% |
| 5 to 9 Minutes | 48 | 14.2% |
| 10 to 14 Minutes | 0 | 0.0% |
| 15 to 19 Minutes | 26 | 7.7% |
| 20 to 24 Minutes | 0 | 0.0% |
| 25 to 29 Minutes | 7 | 2.1% |
| 30 to 34 Minutes | 94 | 27.7% |
| 35 to 39 Minutes | 18 | 5.3% |
| 40 to 44 Minutes | 22 | 6.5% |
| 45 to 59 Minutes | 108 | 31.9% |
| 60 to 89 Minutes | 4 | 1.2% |
| 90 or more Minutes | 12 | 3.5% |
Commute Time by Sex in Pecos
The most common commute times in Pecos are 45 to 59 minutes (97 commuters, 46.9%) for males and 30 to 34 minutes (40 commuters, 30.3%) for females.
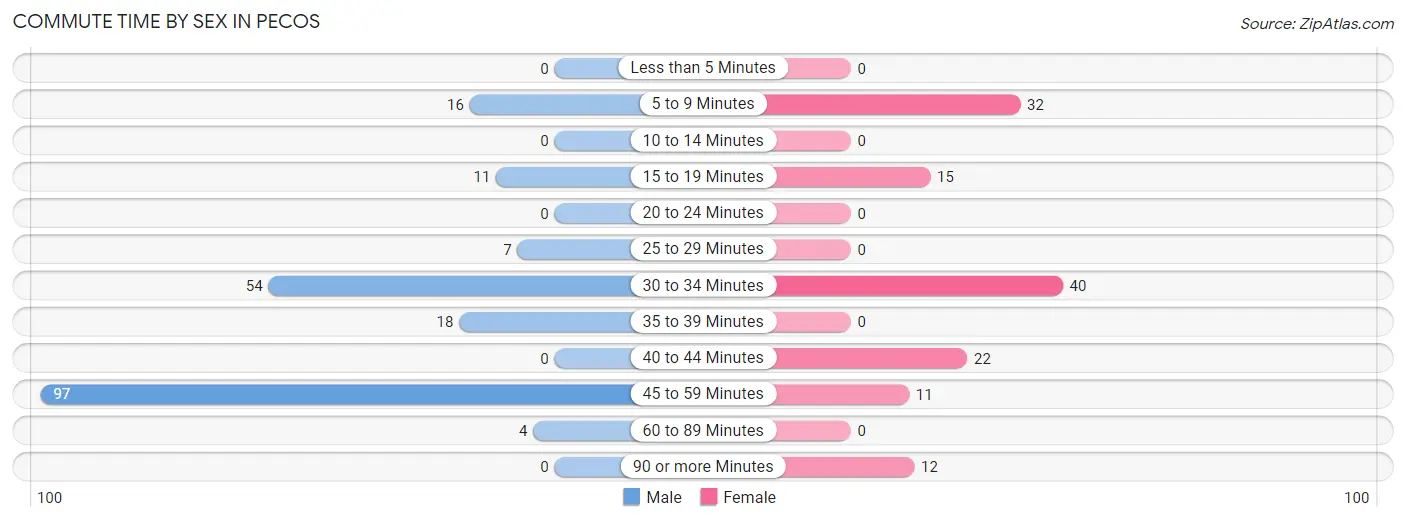
| Commute Time | Male | Female |
| Less than 5 Minutes | 0 (0.0%) | 0 (0.0%) |
| 5 to 9 Minutes | 16 (7.7%) | 32 (24.2%) |
| 10 to 14 Minutes | 0 (0.0%) | 0 (0.0%) |
| 15 to 19 Minutes | 11 (5.3%) | 15 (11.4%) |
| 20 to 24 Minutes | 0 (0.0%) | 0 (0.0%) |
| 25 to 29 Minutes | 7 (3.4%) | 0 (0.0%) |
| 30 to 34 Minutes | 54 (26.1%) | 40 (30.3%) |
| 35 to 39 Minutes | 18 (8.7%) | 0 (0.0%) |
| 40 to 44 Minutes | 0 (0.0%) | 22 (16.7%) |
| 45 to 59 Minutes | 97 (46.9%) | 11 (8.3%) |
| 60 to 89 Minutes | 4 (1.9%) | 0 (0.0%) |
| 90 or more Minutes | 0 (0.0%) | 12 (9.1%) |
Time of Departure to Work by Sex in Pecos
The most frequent times of departure to work in Pecos are 7:00 AM to 7:29 AM (67, 32.4%) for males and 7:30 AM to 7:59 AM (49, 37.1%) for females.
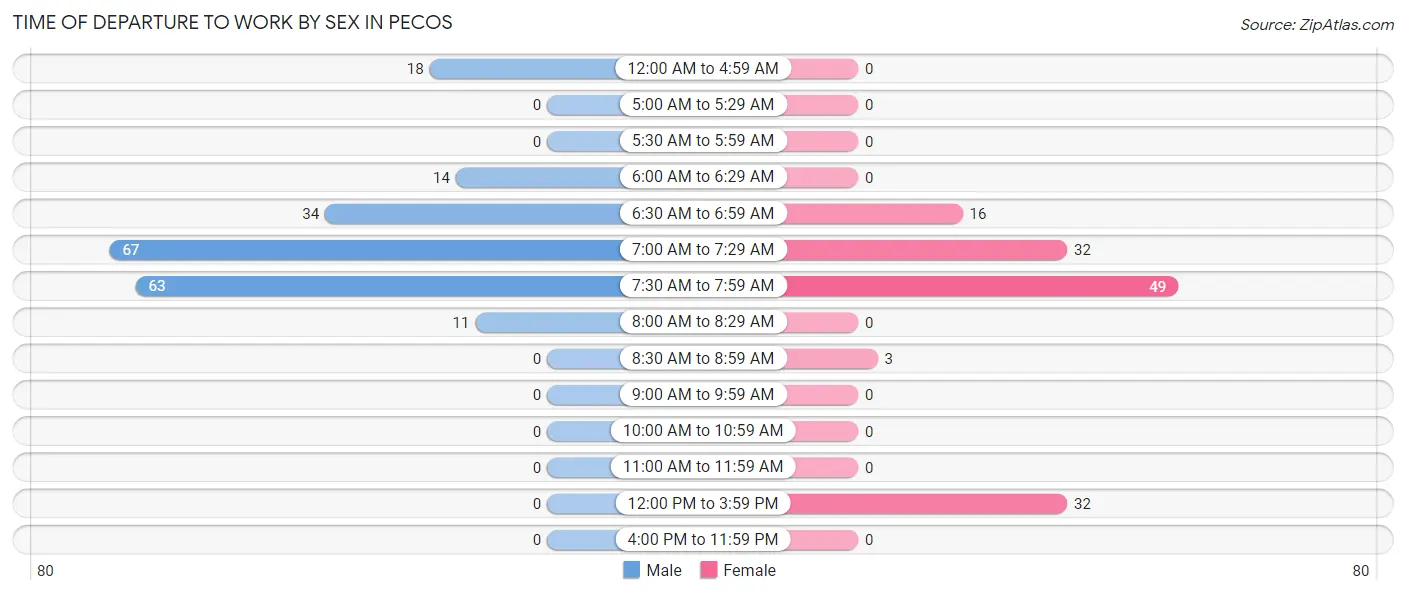
| Time of Departure | Male | Female |
| 12:00 AM to 4:59 AM | 18 (8.7%) | 0 (0.0%) |
| 5:00 AM to 5:29 AM | 0 (0.0%) | 0 (0.0%) |
| 5:30 AM to 5:59 AM | 0 (0.0%) | 0 (0.0%) |
| 6:00 AM to 6:29 AM | 14 (6.8%) | 0 (0.0%) |
| 6:30 AM to 6:59 AM | 34 (16.4%) | 16 (12.1%) |
| 7:00 AM to 7:29 AM | 67 (32.4%) | 32 (24.2%) |
| 7:30 AM to 7:59 AM | 63 (30.4%) | 49 (37.1%) |
| 8:00 AM to 8:29 AM | 11 (5.3%) | 0 (0.0%) |
| 8:30 AM to 8:59 AM | 0 (0.0%) | 3 (2.3%) |
| 9:00 AM to 9:59 AM | 0 (0.0%) | 0 (0.0%) |
| 10:00 AM to 10:59 AM | 0 (0.0%) | 0 (0.0%) |
| 11:00 AM to 11:59 AM | 0 (0.0%) | 0 (0.0%) |
| 12:00 PM to 3:59 PM | 0 (0.0%) | 32 (24.2%) |
| 4:00 PM to 11:59 PM | 0 (0.0%) | 0 (0.0%) |
| Total | 207 (100.0%) | 132 (100.0%) |
Housing Occupancy in Pecos
Occupancy by Ownership in Pecos
Of the total 386 dwellings in Pecos, owner-occupied units account for 275 (71.2%), while renter-occupied units make up 111 (28.8%).
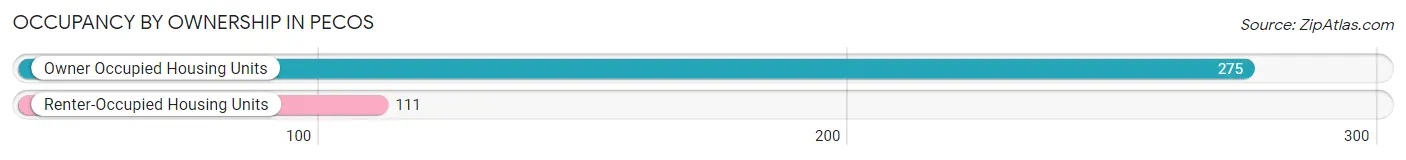
| Occupancy | # Housing Units | % Housing Units |
| Owner Occupied Housing Units | 275 | 71.2% |
| Renter-Occupied Housing Units | 111 | 28.8% |
| Total Occupied Housing Units | 386 | 100.0% |
Occupancy by Household Size in Pecos
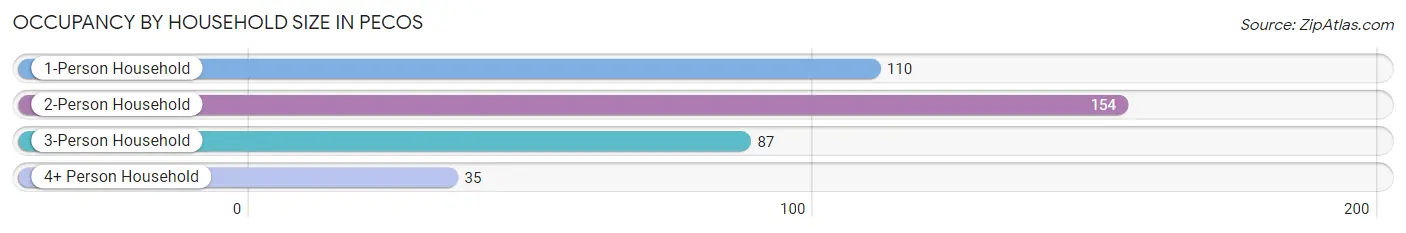
| Household Size | # Housing Units | % Housing Units |
| 1-Person Household | 110 | 28.5% |
| 2-Person Household | 154 | 39.9% |
| 3-Person Household | 87 | 22.5% |
| 4+ Person Household | 35 | 9.1% |
| Total Housing Units | 386 | 100.0% |
Occupancy by Ownership by Household Size in Pecos
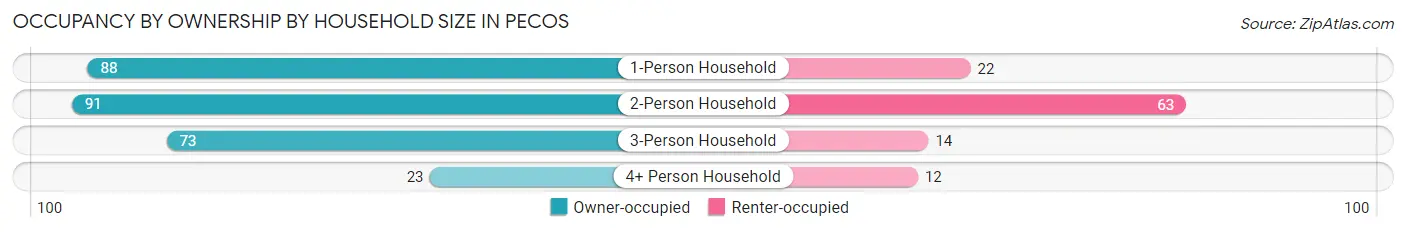
| Household Size | Owner-occupied | Renter-occupied |
| 1-Person Household | 88 (80.0%) | 22 (20.0%) |
| 2-Person Household | 91 (59.1%) | 63 (40.9%) |
| 3-Person Household | 73 (83.9%) | 14 (16.1%) |
| 4+ Person Household | 23 (65.7%) | 12 (34.3%) |
| Total Housing Units | 275 (71.2%) | 111 (28.8%) |
Occupancy by Educational Attainment in Pecos
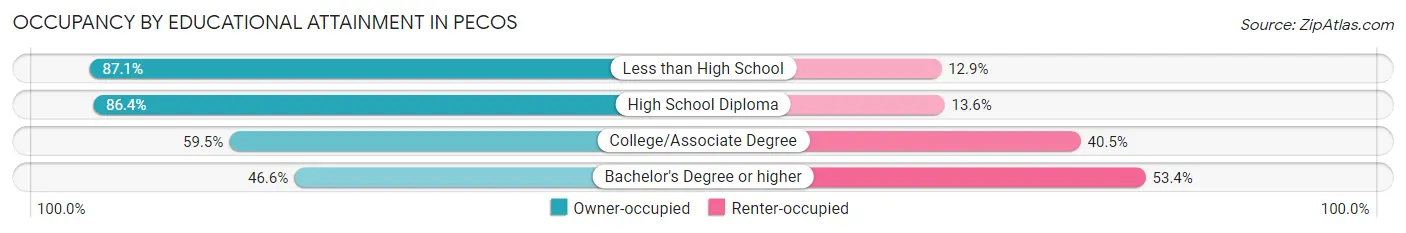
| Household Size | Owner-occupied | Renter-occupied |
| Less than High School | 54 (87.1%) | 8 (12.9%) |
| High School Diploma | 121 (86.4%) | 19 (13.6%) |
| College/Associate Degree | 66 (59.5%) | 45 (40.5%) |
| Bachelor's Degree or higher | 34 (46.6%) | 39 (53.4%) |
Occupancy by Age of Householder in Pecos
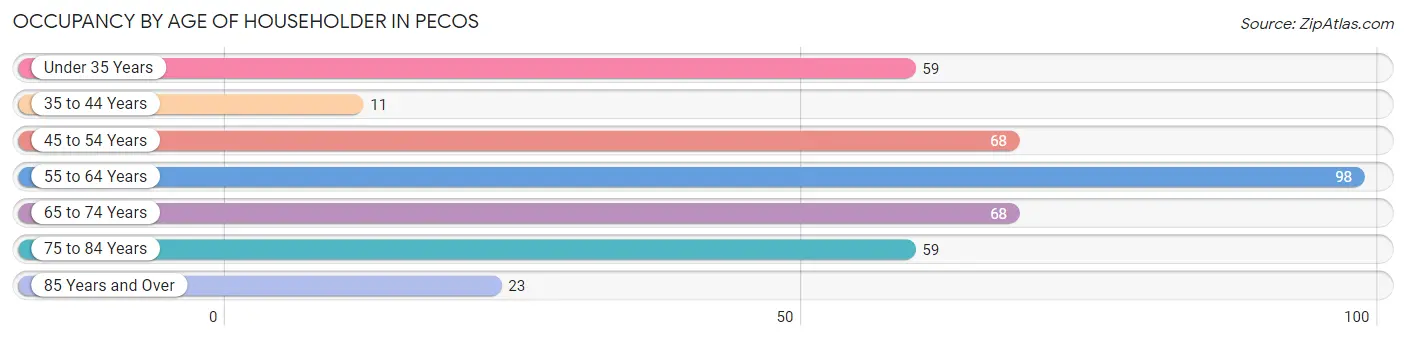
| Age Bracket | # Households | % Households |
| Under 35 Years | 59 | 15.3% |
| 35 to 44 Years | 11 | 2.9% |
| 45 to 54 Years | 68 | 17.6% |
| 55 to 64 Years | 98 | 25.4% |
| 65 to 74 Years | 68 | 17.6% |
| 75 to 84 Years | 59 | 15.3% |
| 85 Years and Over | 23 | 6.0% |
| Total | 386 | 100.0% |
Housing Finances in Pecos
Median Income by Occupancy in Pecos
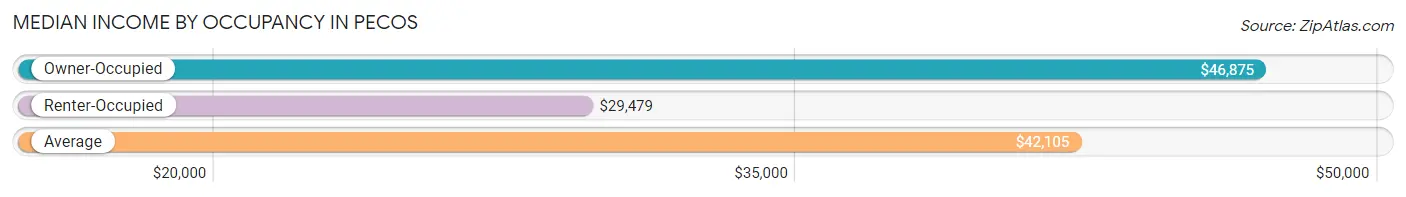
| Occupancy Type | # Households | Median Income |
| Owner-Occupied | 275 (71.2%) | $46,875 |
| Renter-Occupied | 111 (28.8%) | $29,479 |
| Average | 386 (100.0%) | $42,105 |
Occupancy by Householder Income Bracket in Pecos
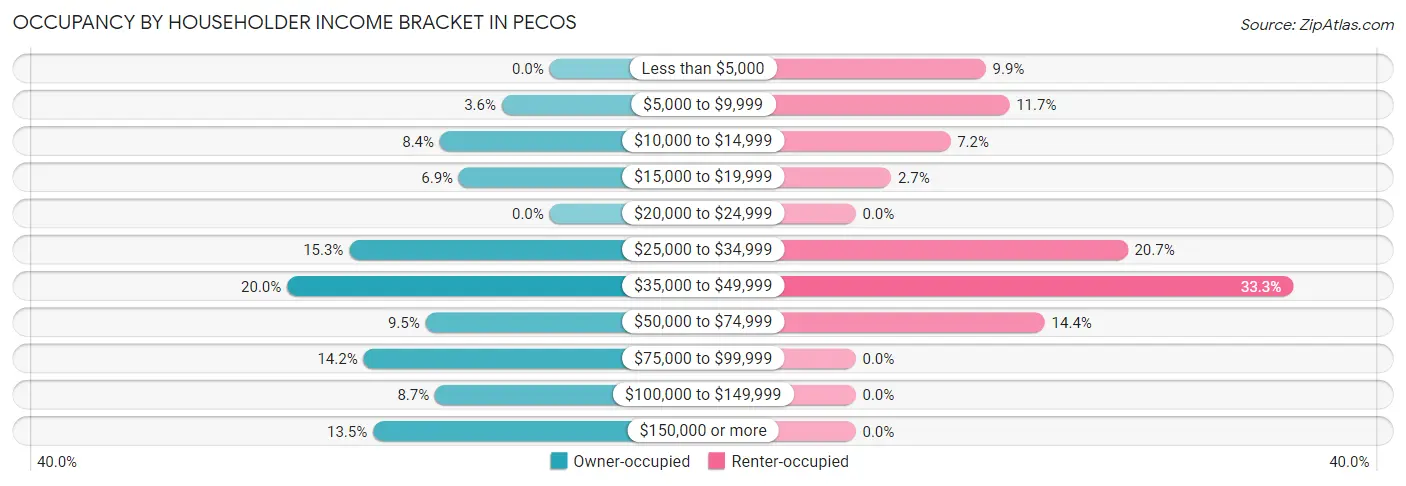
| Income Bracket | Owner-occupied | Renter-occupied |
| Less than $5,000 | 0 (0.0%) | 11 (9.9%) |
| $5,000 to $9,999 | 10 (3.6%) | 13 (11.7%) |
| $10,000 to $14,999 | 23 (8.4%) | 8 (7.2%) |
| $15,000 to $19,999 | 19 (6.9%) | 3 (2.7%) |
| $20,000 to $24,999 | 0 (0.0%) | 0 (0.0%) |
| $25,000 to $34,999 | 42 (15.3%) | 23 (20.7%) |
| $35,000 to $49,999 | 55 (20.0%) | 37 (33.3%) |
| $50,000 to $74,999 | 26 (9.5%) | 16 (14.4%) |
| $75,000 to $99,999 | 39 (14.2%) | 0 (0.0%) |
| $100,000 to $149,999 | 24 (8.7%) | 0 (0.0%) |
| $150,000 or more | 37 (13.5%) | 0 (0.0%) |
| Total | 275 (100.0%) | 111 (100.0%) |
Monthly Housing Cost Tiers in Pecos
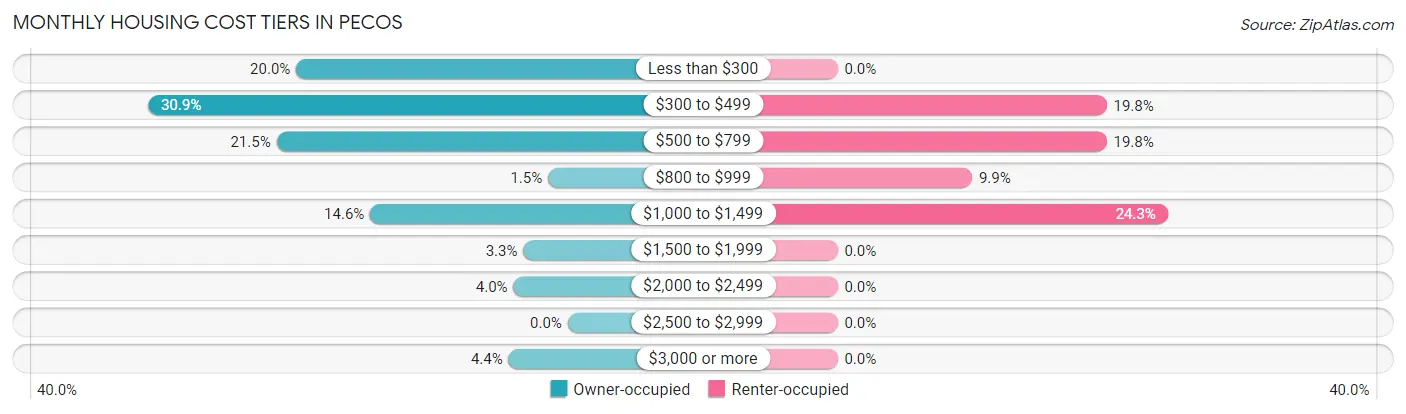
| Monthly Cost | Owner-occupied | Renter-occupied |
| Less than $300 | 55 (20.0%) | 0 (0.0%) |
| $300 to $499 | 85 (30.9%) | 22 (19.8%) |
| $500 to $799 | 59 (21.4%) | 22 (19.8%) |
| $800 to $999 | 4 (1.5%) | 11 (9.9%) |
| $1,000 to $1,499 | 40 (14.5%) | 27 (24.3%) |
| $1,500 to $1,999 | 9 (3.3%) | 0 (0.0%) |
| $2,000 to $2,499 | 11 (4.0%) | 0 (0.0%) |
| $2,500 to $2,999 | 0 (0.0%) | 0 (0.0%) |
| $3,000 or more | 12 (4.4%) | 0 (0.0%) |
| Total | 275 (100.0%) | 111 (100.0%) |
Physical Housing Characteristics in Pecos
Housing Structures in Pecos
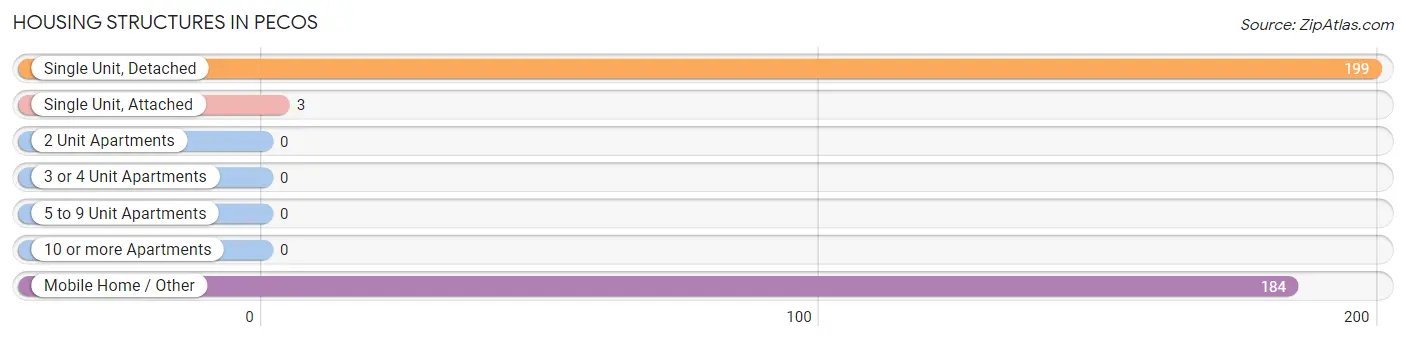
| Structure Type | # Housing Units | % Housing Units |
| Single Unit, Detached | 199 | 51.5% |
| Single Unit, Attached | 3 | 0.8% |
| 2 Unit Apartments | 0 | 0.0% |
| 3 or 4 Unit Apartments | 0 | 0.0% |
| 5 to 9 Unit Apartments | 0 | 0.0% |
| 10 or more Apartments | 0 | 0.0% |
| Mobile Home / Other | 184 | 47.7% |
| Total | 386 | 100.0% |
Housing Structures by Occupancy in Pecos
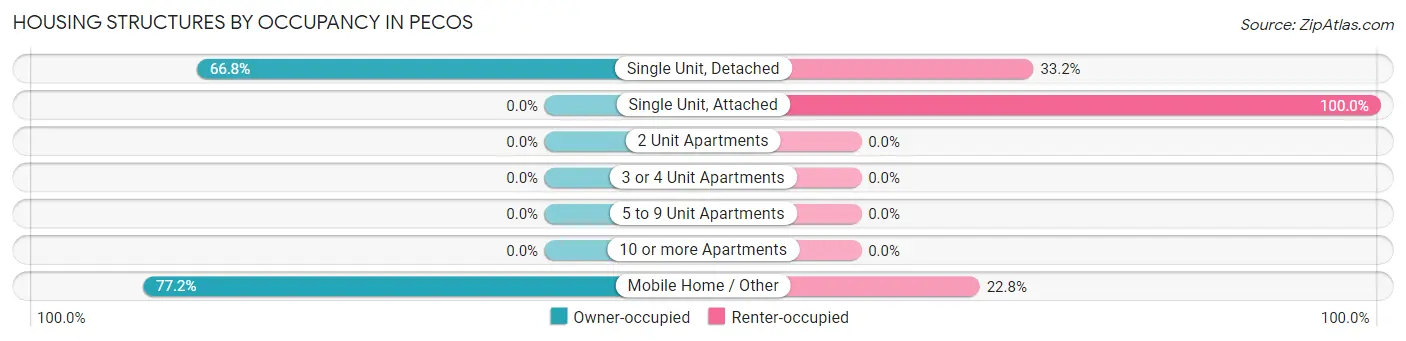
| Structure Type | Owner-occupied | Renter-occupied |
| Single Unit, Detached | 133 (66.8%) | 66 (33.2%) |
| Single Unit, Attached | 0 (0.0%) | 3 (100.0%) |
| 2 Unit Apartments | 0 (0.0%) | 0 (0.0%) |
| 3 or 4 Unit Apartments | 0 (0.0%) | 0 (0.0%) |
| 5 to 9 Unit Apartments | 0 (0.0%) | 0 (0.0%) |
| 10 or more Apartments | 0 (0.0%) | 0 (0.0%) |
| Mobile Home / Other | 142 (77.2%) | 42 (22.8%) |
| Total | 275 (71.2%) | 111 (28.8%) |
Housing Structures by Number of Rooms in Pecos
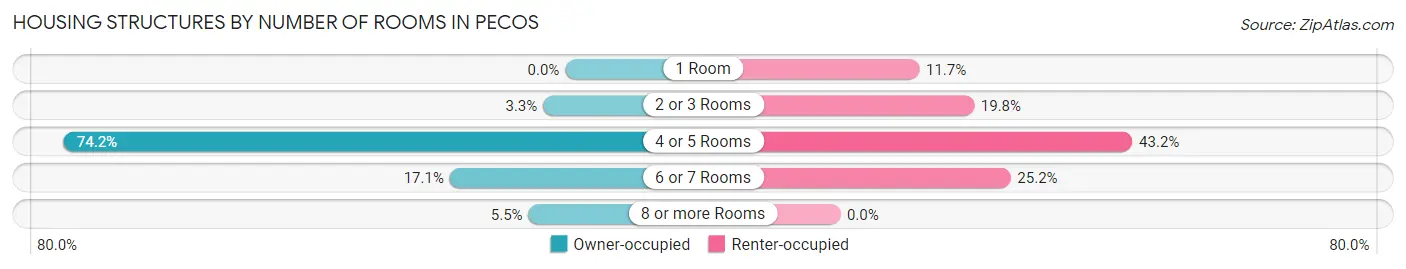
| Number of Rooms | Owner-occupied | Renter-occupied |
| 1 Room | 0 (0.0%) | 13 (11.7%) |
| 2 or 3 Rooms | 9 (3.3%) | 22 (19.8%) |
| 4 or 5 Rooms | 204 (74.2%) | 48 (43.2%) |
| 6 or 7 Rooms | 47 (17.1%) | 28 (25.2%) |
| 8 or more Rooms | 15 (5.4%) | 0 (0.0%) |
| Total | 275 (100.0%) | 111 (100.0%) |
Housing Structure by Heating Type in Pecos
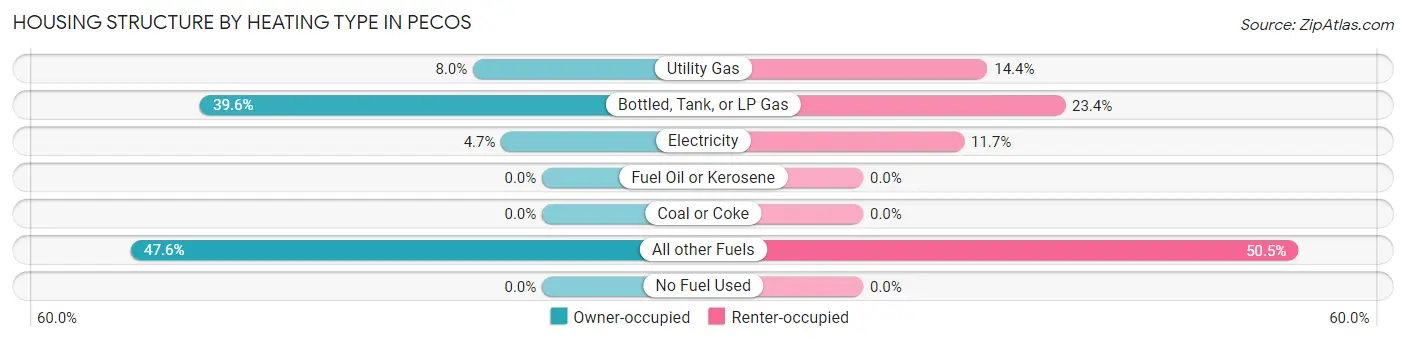
| Heating Type | Owner-occupied | Renter-occupied |
| Utility Gas | 22 (8.0%) | 16 (14.4%) |
| Bottled, Tank, or LP Gas | 109 (39.6%) | 26 (23.4%) |
| Electricity | 13 (4.7%) | 13 (11.7%) |
| Fuel Oil or Kerosene | 0 (0.0%) | 0 (0.0%) |
| Coal or Coke | 0 (0.0%) | 0 (0.0%) |
| All other Fuels | 131 (47.6%) | 56 (50.4%) |
| No Fuel Used | 0 (0.0%) | 0 (0.0%) |
| Total | 275 (100.0%) | 111 (100.0%) |
Household Vehicle Usage in Pecos
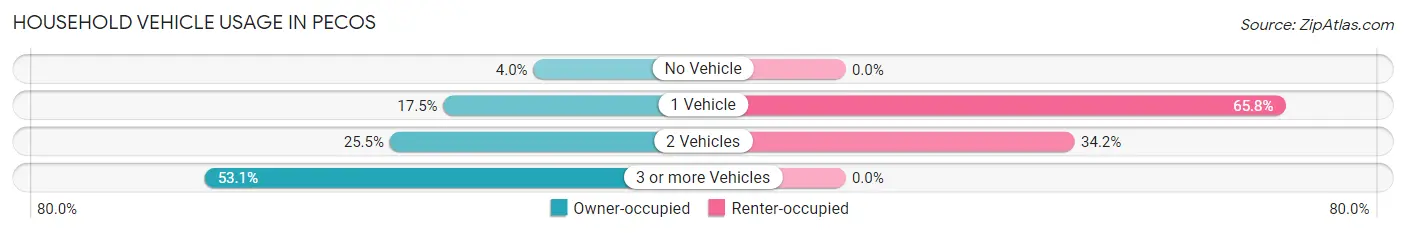
| Vehicles per Household | Owner-occupied | Renter-occupied |
| No Vehicle | 11 (4.0%) | 0 (0.0%) |
| 1 Vehicle | 48 (17.4%) | 73 (65.8%) |
| 2 Vehicles | 70 (25.5%) | 38 (34.2%) |
| 3 or more Vehicles | 146 (53.1%) | 0 (0.0%) |
| Total | 275 (100.0%) | 111 (100.0%) |
Real Estate & Mortgages in Pecos
Real Estate and Mortgage Overview in Pecos
| Characteristic | Without Mortgage | With Mortgage |
| Housing Units | 199 | 76 |
| Median Property Value | $73,900 | $326,700 |
| Median Household Income | $42,303 | $27 |
| Monthly Housing Costs | $424 | $12 |
| Real Estate Taxes | $498 | $0 |
Property Value by Mortgage Status in Pecos
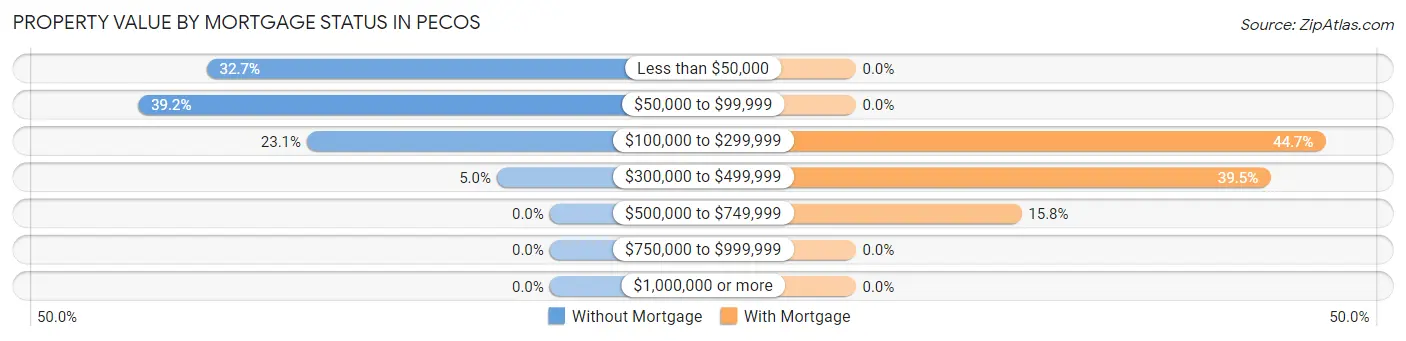
| Property Value | Without Mortgage | With Mortgage |
| Less than $50,000 | 65 (32.7%) | 0 (0.0%) |
| $50,000 to $99,999 | 78 (39.2%) | 0 (0.0%) |
| $100,000 to $299,999 | 46 (23.1%) | 34 (44.7%) |
| $300,000 to $499,999 | 10 (5.0%) | 30 (39.5%) |
| $500,000 to $749,999 | 0 (0.0%) | 12 (15.8%) |
| $750,000 to $999,999 | 0 (0.0%) | 0 (0.0%) |
| $1,000,000 or more | 0 (0.0%) | 0 (0.0%) |
| Total | 199 (100.0%) | 76 (100.0%) |
Household Income by Mortgage Status in Pecos
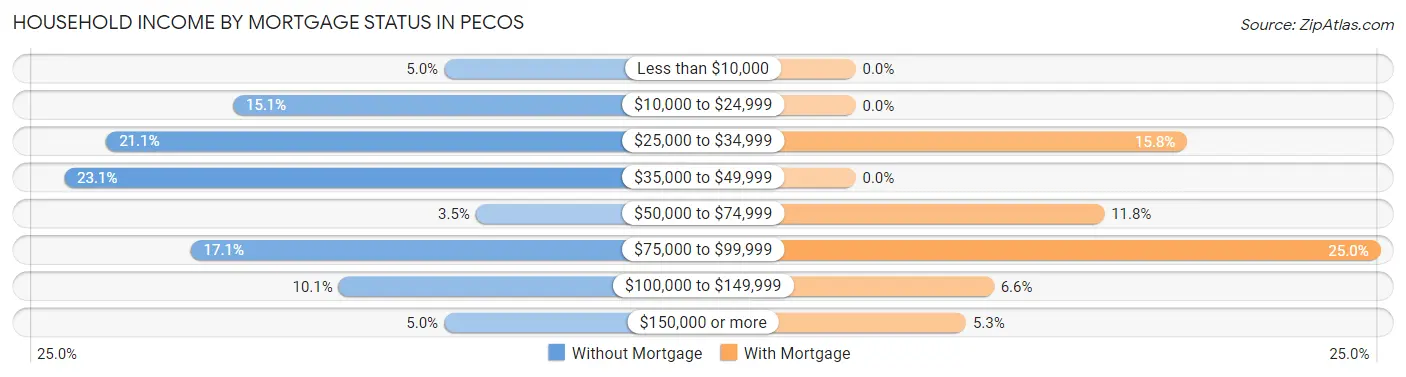
| Household Income | Without Mortgage | With Mortgage |
| Less than $10,000 | 10 (5.0%) | 0 (0.0%) |
| $10,000 to $24,999 | 30 (15.1%) | 0 (0.0%) |
| $25,000 to $34,999 | 42 (21.1%) | 12 (15.8%) |
| $35,000 to $49,999 | 46 (23.1%) | 0 (0.0%) |
| $50,000 to $74,999 | 7 (3.5%) | 9 (11.8%) |
| $75,000 to $99,999 | 34 (17.1%) | 19 (25.0%) |
| $100,000 to $149,999 | 20 (10.1%) | 5 (6.6%) |
| $150,000 or more | 10 (5.0%) | 4 (5.3%) |
| Total | 199 (100.0%) | 76 (100.0%) |
Property Value to Household Income Ratio in Pecos
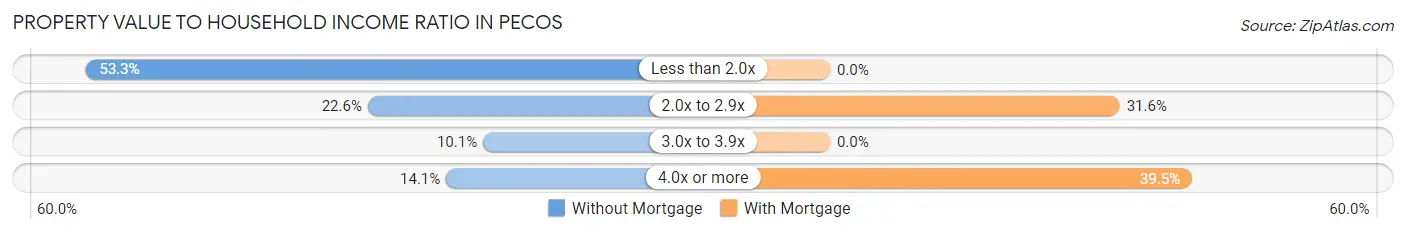
| Value-to-Income Ratio | Without Mortgage | With Mortgage |
| Less than 2.0x | 106 (53.3%) | 0 (0.0%) |
| 2.0x to 2.9x | 45 (22.6%) | 24 (31.6%) |
| 3.0x to 3.9x | 20 (10.1%) | 0 (0.0%) |
| 4.0x or more | 28 (14.1%) | 30 (39.5%) |
| Total | 199 (100.0%) | 76 (100.0%) |
Real Estate Taxes by Mortgage Status in Pecos
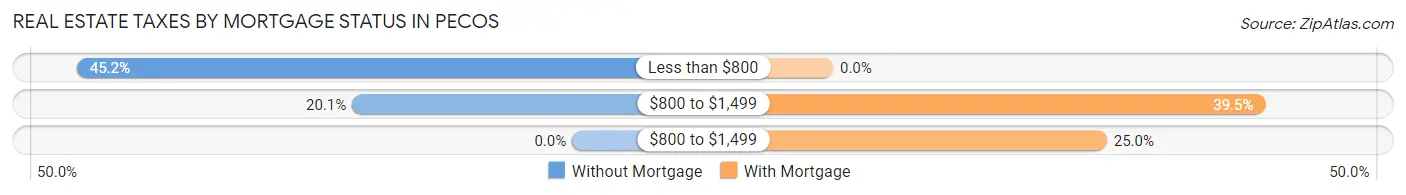
| Property Taxes | Without Mortgage | With Mortgage |
| Less than $800 | 90 (45.2%) | 0 (0.0%) |
| $800 to $1,499 | 40 (20.1%) | 30 (39.5%) |
| $800 to $1,499 | 0 (0.0%) | 19 (25.0%) |
| Total | 199 (100.0%) | 76 (100.0%) |
Health & Disability in Pecos
Health Insurance Coverage by Age in Pecos
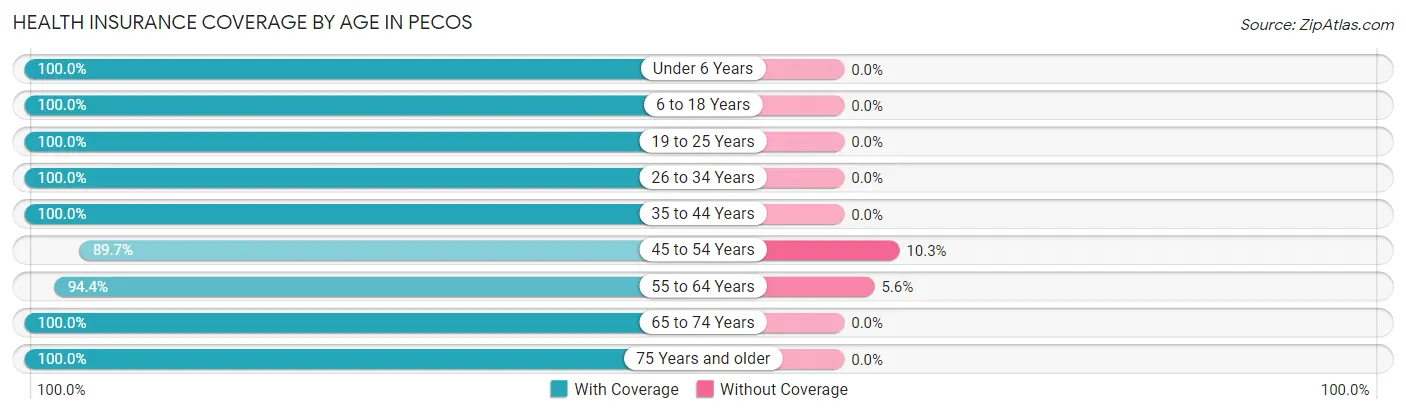
| Age Bracket | With Coverage | Without Coverage |
| Under 6 Years | 30 (100.0%) | 0 (0.0%) |
| 6 to 18 Years | 138 (100.0%) | 0 (0.0%) |
| 19 to 25 Years | 23 (100.0%) | 0 (0.0%) |
| 26 to 34 Years | 119 (100.0%) | 0 (0.0%) |
| 35 to 44 Years | 49 (100.0%) | 0 (0.0%) |
| 45 to 54 Years | 96 (89.7%) | 11 (10.3%) |
| 55 to 64 Years | 168 (94.4%) | 10 (5.6%) |
| 65 to 74 Years | 99 (100.0%) | 0 (0.0%) |
| 75 Years and older | 142 (100.0%) | 0 (0.0%) |
| Total | 864 (97.6%) | 21 (2.4%) |
Health Insurance Coverage by Citizenship Status in Pecos
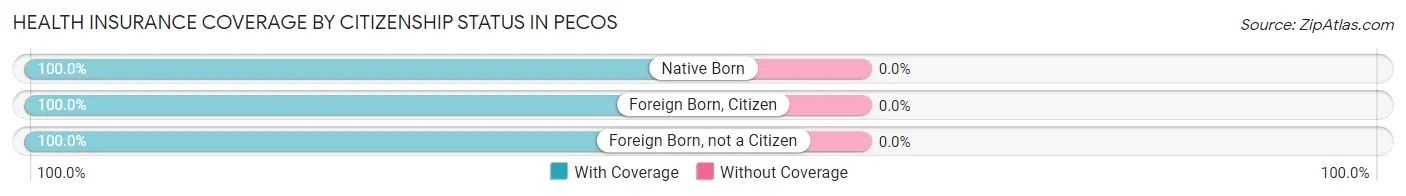
| Citizenship Status | With Coverage | Without Coverage |
| Native Born | 30 (100.0%) | 0 (0.0%) |
| Foreign Born, Citizen | 138 (100.0%) | 0 (0.0%) |
| Foreign Born, not a Citizen | 23 (100.0%) | 0 (0.0%) |
Health Insurance Coverage by Household Income in Pecos
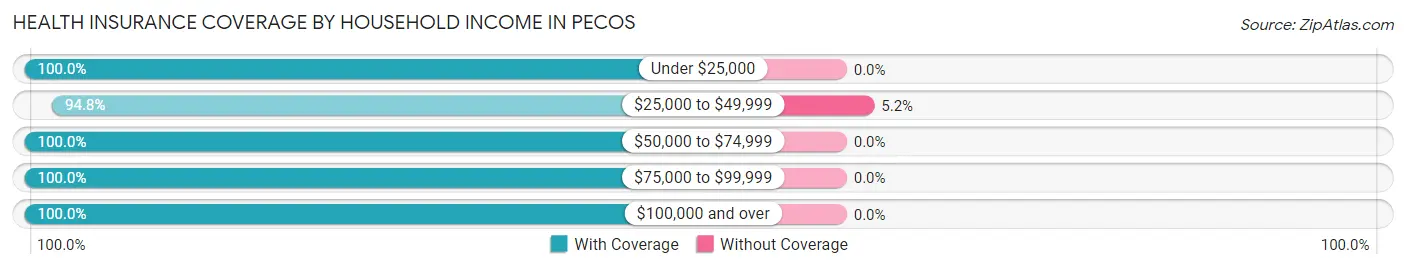
| Household Income | With Coverage | Without Coverage |
| Under $25,000 | 113 (100.0%) | 0 (0.0%) |
| $25,000 to $49,999 | 386 (94.8%) | 21 (5.2%) |
| $50,000 to $74,999 | 74 (100.0%) | 0 (0.0%) |
| $75,000 to $99,999 | 104 (100.0%) | 0 (0.0%) |
| $100,000 and over | 187 (100.0%) | 0 (0.0%) |
Public vs Private Health Insurance Coverage by Age in Pecos
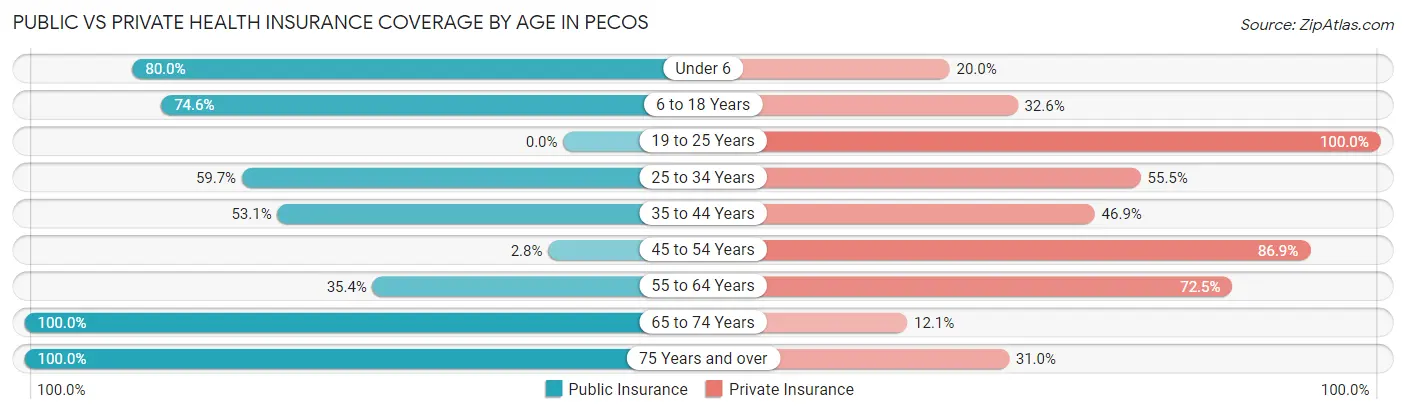
| Age Bracket | Public Insurance | Private Insurance |
| Under 6 | 24 (80.0%) | 6 (20.0%) |
| 6 to 18 Years | 103 (74.6%) | 45 (32.6%) |
| 19 to 25 Years | 0 (0.0%) | 23 (100.0%) |
| 25 to 34 Years | 71 (59.7%) | 66 (55.5%) |
| 35 to 44 Years | 26 (53.1%) | 23 (46.9%) |
| 45 to 54 Years | 3 (2.8%) | 93 (86.9%) |
| 55 to 64 Years | 63 (35.4%) | 129 (72.5%) |
| 65 to 74 Years | 99 (100.0%) | 12 (12.1%) |
| 75 Years and over | 142 (100.0%) | 44 (31.0%) |
| Total | 531 (60.0%) | 441 (49.8%) |
Disability Status by Sex by Age in Pecos
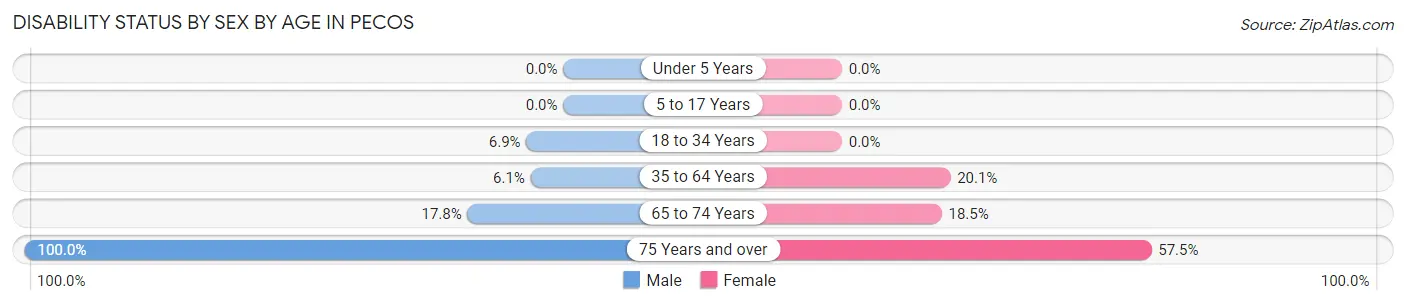
| Age Bracket | Male | Female |
| Under 5 Years | 0 (0.0%) | 0 (0.0%) |
| 5 to 17 Years | 0 (0.0%) | 0 (0.0%) |
| 18 to 34 Years | 5 (6.9%) | 0 (0.0%) |
| 35 to 64 Years | 10 (6.1%) | 34 (20.1%) |
| 65 to 74 Years | 8 (17.8%) | 10 (18.5%) |
| 75 Years and over | 48 (100.0%) | 54 (57.5%) |
Disability Class by Sex by Age in Pecos
Disability Class: Hearing Difficulty
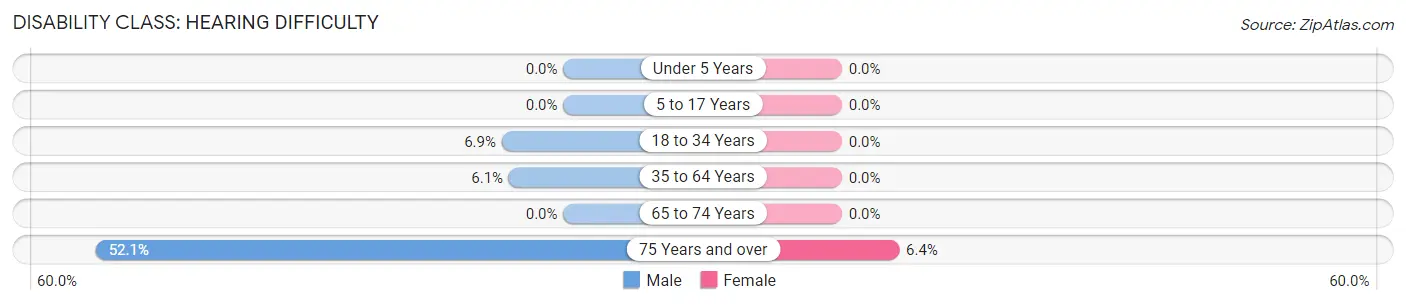
| Age Bracket | Male | Female |
| Under 5 Years | 0 (0.0%) | 0 (0.0%) |
| 5 to 17 Years | 0 (0.0%) | 0 (0.0%) |
| 18 to 34 Years | 5 (6.9%) | 0 (0.0%) |
| 35 to 64 Years | 10 (6.1%) | 0 (0.0%) |
| 65 to 74 Years | 0 (0.0%) | 0 (0.0%) |
| 75 Years and over | 25 (52.1%) | 6 (6.4%) |
Disability Class: Vision Difficulty
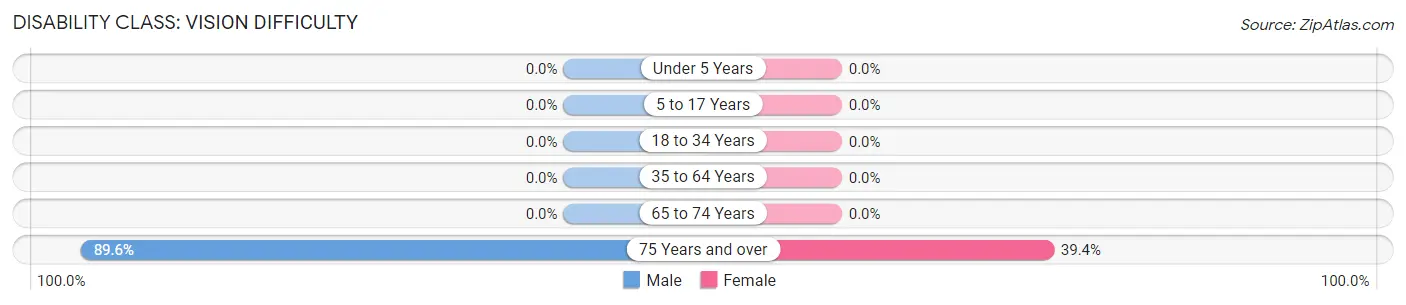
| Age Bracket | Male | Female |
| Under 5 Years | 0 (0.0%) | 0 (0.0%) |
| 5 to 17 Years | 0 (0.0%) | 0 (0.0%) |
| 18 to 34 Years | 0 (0.0%) | 0 (0.0%) |
| 35 to 64 Years | 0 (0.0%) | 0 (0.0%) |
| 65 to 74 Years | 0 (0.0%) | 0 (0.0%) |
| 75 Years and over | 43 (89.6%) | 37 (39.4%) |
Disability Class: Cognitive Difficulty
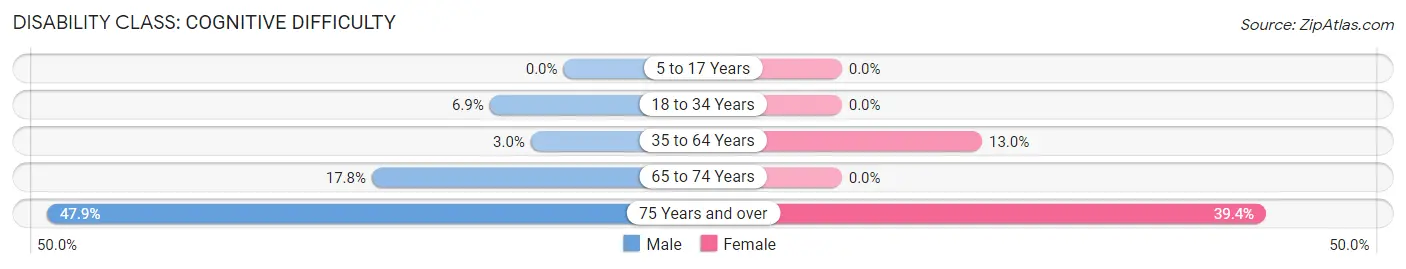
| Age Bracket | Male | Female |
| 5 to 17 Years | 0 (0.0%) | 0 (0.0%) |
| 18 to 34 Years | 5 (6.9%) | 0 (0.0%) |
| 35 to 64 Years | 5 (3.0%) | 22 (13.0%) |
| 65 to 74 Years | 8 (17.8%) | 0 (0.0%) |
| 75 Years and over | 23 (47.9%) | 37 (39.4%) |
Disability Class: Ambulatory Difficulty
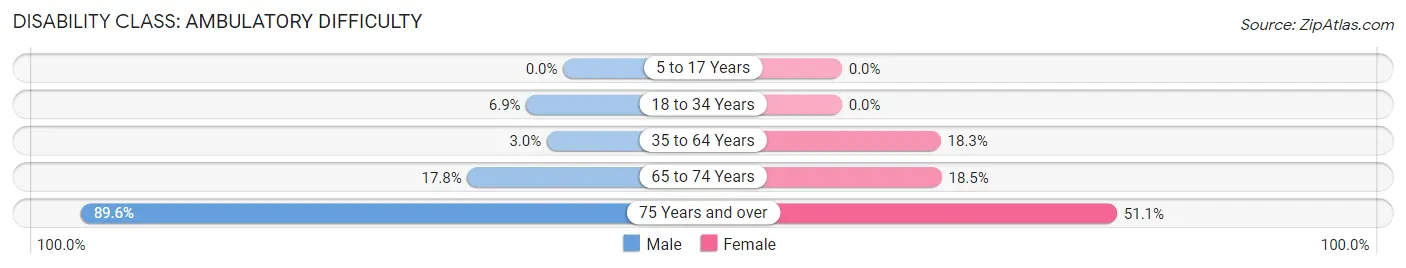
| Age Bracket | Male | Female |
| 5 to 17 Years | 0 (0.0%) | 0 (0.0%) |
| 18 to 34 Years | 5 (6.9%) | 0 (0.0%) |
| 35 to 64 Years | 5 (3.0%) | 31 (18.3%) |
| 65 to 74 Years | 8 (17.8%) | 10 (18.5%) |
| 75 Years and over | 43 (89.6%) | 48 (51.1%) |
Disability Class: Self-Care Difficulty
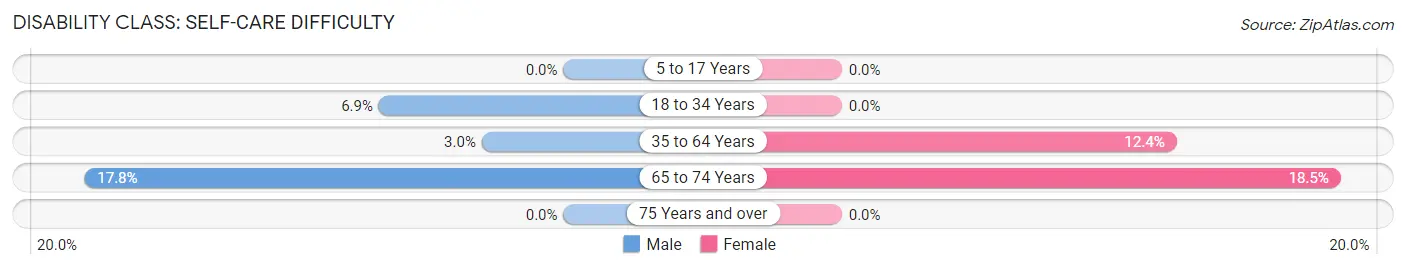
| Age Bracket | Male | Female |
| 5 to 17 Years | 0 (0.0%) | 0 (0.0%) |
| 18 to 34 Years | 5 (6.9%) | 0 (0.0%) |
| 35 to 64 Years | 5 (3.0%) | 21 (12.4%) |
| 65 to 74 Years | 8 (17.8%) | 10 (18.5%) |
| 75 Years and over | 0 (0.0%) | 0 (0.0%) |
Technology Access in Pecos
Computing Device Access in Pecos
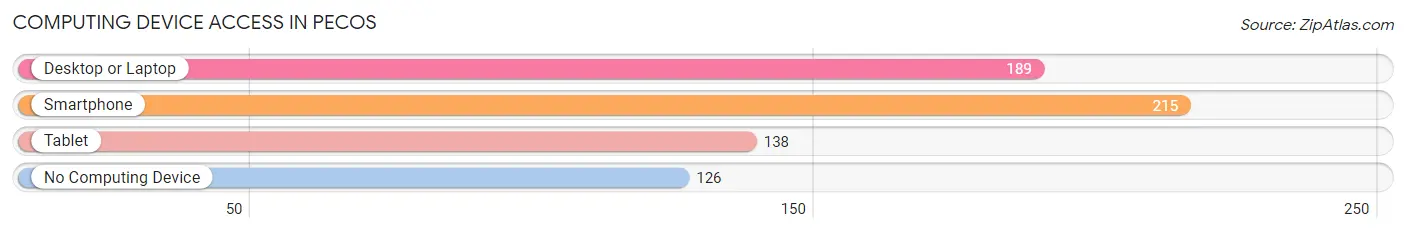
| Device Type | # Households | % Households |
| Desktop or Laptop | 189 | 49.0% |
| Smartphone | 215 | 55.7% |
| Tablet | 138 | 35.7% |
| No Computing Device | 126 | 32.6% |
| Total | 386 | 100.0% |
Internet Access in Pecos
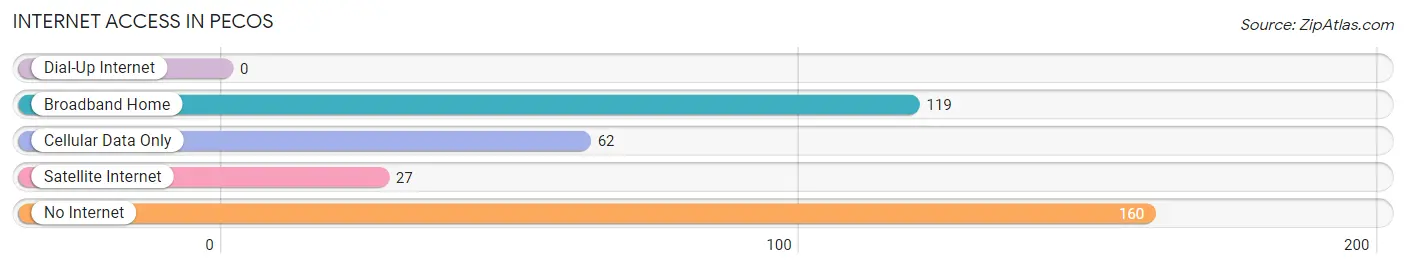
| Internet Type | # Households | % Households |
| Dial-Up Internet | 0 | 0.0% |
| Broadband Home | 119 | 30.8% |
| Cellular Data Only | 62 | 16.1% |
| Satellite Internet | 27 | 7.0% |
| No Internet | 160 | 41.4% |
| Total | 386 | 100.0% |
Pecos Summary
Pecos, New Mexico is a small town located in the southeastern corner of the state, near the Texas border. It is the county seat of Reeves County and is part of the Pecos Valley, a region of the Chihuahuan Desert. The town has a population of approximately 8,000 people and is the largest town in the county.
Geography
Pecos is located in the southeastern corner of New Mexico, near the Texas border. It is situated in the Pecos Valley, a region of the Chihuahuan Desert. The town is surrounded by the Pecos River, which flows from the nearby Guadalupe Mountains. The town is located at an elevation of 3,845 feet above sea level.
The climate in Pecos is semi-arid, with hot summers and mild winters. The average annual temperature is 64°F, with an average high of 90°F in the summer and an average low of 32°F in the winter. The average annual precipitation is 12.5 inches, with most of the rain falling in the summer months.
History
Pecos was founded in 1881 as a railroad town. The town was named after the nearby Pecos River, which was named by Spanish explorers in the 16th century. The town quickly grew as a center for ranching and farming in the area.
In the early 20th century, Pecos became a center for oil production. The town was home to several large oil companies, including the Texas Company (later Texaco) and the Pecos Oil Company. The oil industry brought wealth and prosperity to the town, and by the 1950s, Pecos was one of the wealthiest towns in the state.
In the late 20th century, the oil industry declined and the town’s economy shifted to tourism and agriculture. Today, Pecos is a popular tourist destination, with attractions such as the Pecos National Historical Park and the Pecos River.
Economy
The economy of Pecos is largely based on agriculture and tourism. The town is home to several large farms, which produce a variety of crops, including cotton, alfalfa, and pecans. The town is also home to several tourist attractions, including the Pecos National Historical Park and the Pecos River.
The town is also home to several manufacturing companies, including a plastics factory and a food processing plant. The town is also home to several retail stores, restaurants, and other businesses.
Demographics
As of the 2010 census, the population of Pecos was 8,072. The racial makeup of the town was 75.3% White, 0.7% African American, 0.9% Native American, 0.3% Asian, 0.1% Pacific Islander, 19.7% from other races, and 3.0% from two or more races. Hispanic or Latino of any race were 57.2% of the population.
The median household income in Pecos was $30,938, and the median family income was $35,938. The per capita income was $15,938. About 20.3% of the population was below the poverty line.
Conclusion
Pecos, New Mexico is a small town located in the southeastern corner of the state, near the Texas border. It is the county seat of Reeves County and is part of the Pecos Valley, a region of the Chihuahuan Desert. The town has a population of approximately 8,000 people and is the largest town in the county. The economy of Pecos is largely based on agriculture and tourism, and the town is home to several tourist attractions, including the Pecos National Historical Park and the Pecos River. The racial makeup of the town is mostly White, with a large Hispanic population. The median household income in Pecos is $30,938, and the per capita income is $15,938.
Common Questions
What is Per Capita Income in Pecos?
Per Capita income in Pecos is $28,524.
What is the Median Family Income in Pecos?
Median Family Income in Pecos is $45,739.
What is the Median Household income in Pecos?
Median Household Income in Pecos is $42,105.
What is Income or Wage Gap in Pecos?
Income or Wage Gap in Pecos is 4.8%.
Women in Pecos earn 95.2 cents for every dollar earned by a man.
What is Family Income Deficit in Pecos?
Family Income Deficit in Pecos is $5,722.
Families that are below poverty line in Pecos earn $5,722 less on average than the poverty threshold level.
What is Inequality or Gini Index in Pecos?
Inequality or Gini Index in Pecos is 0.50.
What is the Total Population of Pecos?
Total Population of Pecos is 885.
What is the Total Male Population of Pecos?
Total Male Population of Pecos is 444.
What is the Total Female Population of Pecos?
Total Female Population of Pecos is 441.
What is the Ratio of Males per 100 Females in Pecos?
There are 100.68 Males per 100 Females in Pecos.
What is the Ratio of Females per 100 Males in Pecos?
There are 99.32 Females per 100 Males in Pecos.
What is the Median Population Age in Pecos?
Median Population Age in Pecos is 53.3 Years.
What is the Average Family Size in Pecos
Average Family Size in Pecos is 2.9 People.
What is the Average Household Size in Pecos
Average Household Size in Pecos is 2.3 People.
How Large is the Labor Force in Pecos?
There are 378 People in the Labor Forcein in Pecos.
What is the Percentage of People in the Labor Force in Pecos?
52.2% of People are in the Labor Force in Pecos.
What is the Unemployment Rate in Pecos?
Unemployment Rate in Pecos is 2.9%.