Newcomb, NM Map & Demographics
Newcomb Map
Newcomb Overview
$18,427
PER CAPITA INCOME
$40,000
AVG FAMILY INCOME
$27,375
AVG HOUSEHOLD INCOME
20.1%
WAGE / INCOME GAP [ % ]
79.9¢/ $1
WAGE / INCOME GAP [ $ ]
0.52
INEQUALITY / GINI INDEX
435
TOTAL POPULATION
223
MALE POPULATION
212
FEMALE POPULATION
105.19
MALES / 100 FEMALES
95.07
FEMALES / 100 MALES
41.5
MEDIAN AGE
4.8
AVG FAMILY SIZE
3.1
AVG HOUSEHOLD SIZE
164
LABOR FORCE [ PEOPLE ]
42.2%
PERCENT IN LABOR FORCE
5.5%
UNEMPLOYMENT RATE
Newcomb Zip Codes
Newcomb Area Codes
Income in Newcomb
Income Overview in Newcomb
Per Capita Income in Newcomb is $18,427, while median incomes of families and households are $40,000 and $27,375 respectively.
| Characteristic | Number | Measure |
| Per Capita Income | 435 | $18,427 |
| Median Family Income | 74 | $40,000 |
| Mean Family Income | 74 | $54,523 |
| Median Household Income | 141 | $27,375 |
| Mean Household Income | 141 | $46,484 |
| Income Deficit | 74 | $0 |
| Wage / Income Gap (%) | 435 | 20.07% |
| Wage / Income Gap ($) | 435 | 79.93¢ per $1 |
| Gini / Inequality Index | 435 | 0.52 |
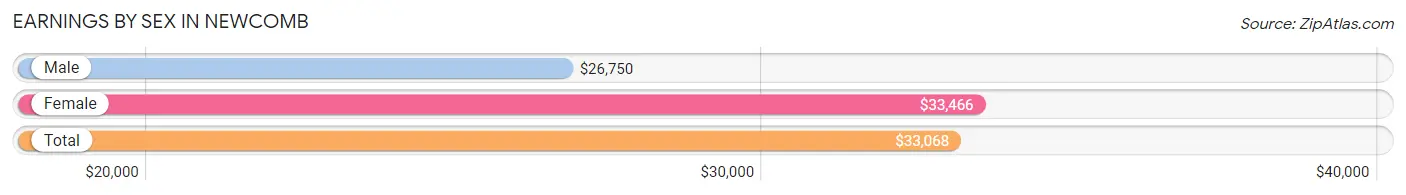
Earnings by Sex in Newcomb
Average Earnings in Newcomb are $33,068, $26,750 for men and $33,466 for women, a difference of 20.1%.
| Sex | Number | Average Earnings |
| Male | 85 (50.6%) | $26,750 |
| Female | 83 (49.4%) | $33,466 |
| Total | 168 (100.0%) | $33,068 |
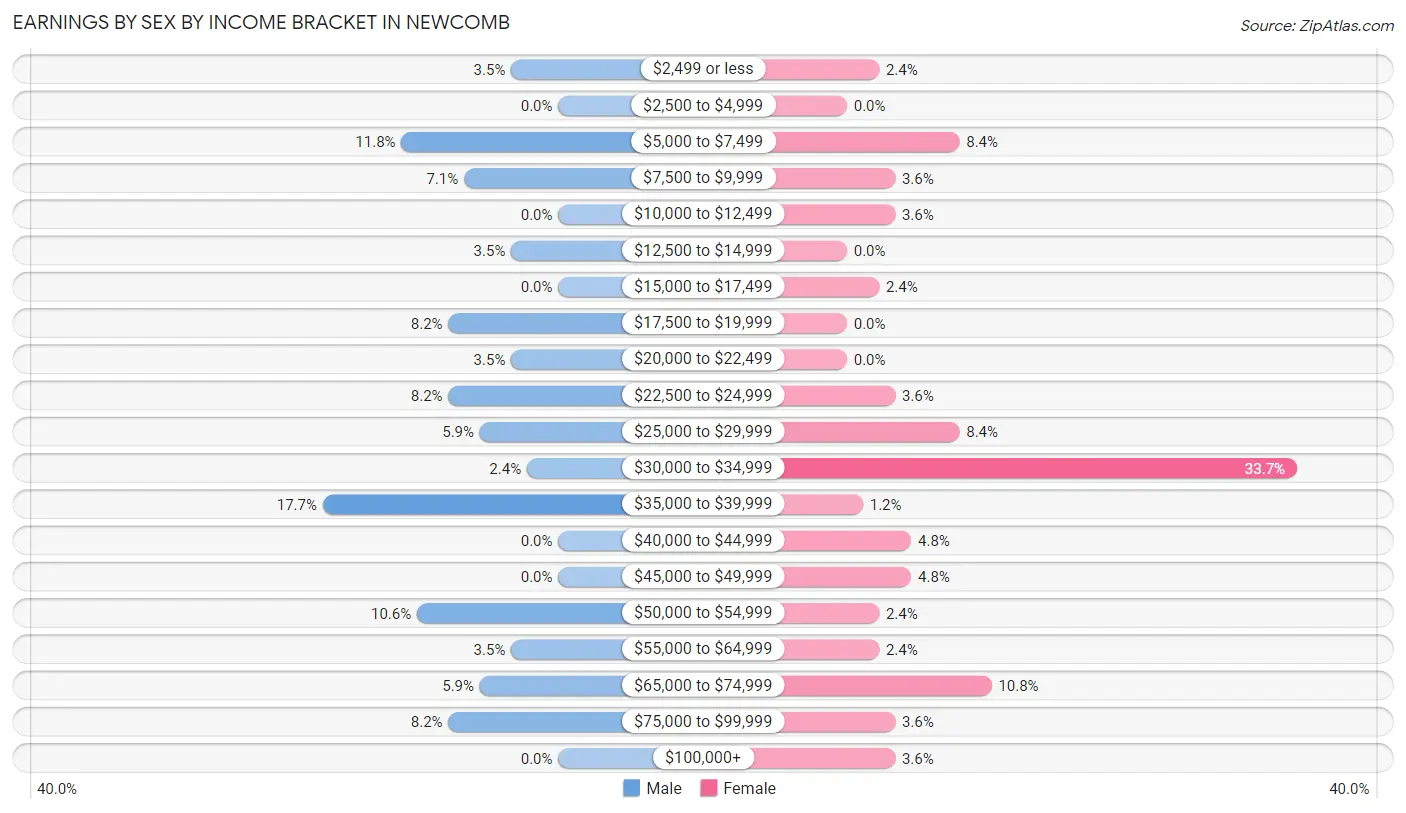
Earnings by Sex by Income Bracket in Newcomb
The most common earnings brackets in Newcomb are $35,000 to $39,999 for men (15 | 17.6%) and $30,000 to $34,999 for women (28 | 33.7%).
| Income | Male | Female |
| $2,499 or less | 3 (3.5%) | 2 (2.4%) |
| $2,500 to $4,999 | 0 (0.0%) | 0 (0.0%) |
| $5,000 to $7,499 | 10 (11.8%) | 7 (8.4%) |
| $7,500 to $9,999 | 6 (7.1%) | 3 (3.6%) |
| $10,000 to $12,499 | 0 (0.0%) | 3 (3.6%) |
| $12,500 to $14,999 | 3 (3.5%) | 0 (0.0%) |
| $15,000 to $17,499 | 0 (0.0%) | 2 (2.4%) |
| $17,500 to $19,999 | 7 (8.2%) | 0 (0.0%) |
| $20,000 to $22,499 | 3 (3.5%) | 0 (0.0%) |
| $22,500 to $24,999 | 7 (8.2%) | 3 (3.6%) |
| $25,000 to $29,999 | 5 (5.9%) | 7 (8.4%) |
| $30,000 to $34,999 | 2 (2.4%) | 28 (33.7%) |
| $35,000 to $39,999 | 15 (17.6%) | 1 (1.2%) |
| $40,000 to $44,999 | 0 (0.0%) | 4 (4.8%) |
| $45,000 to $49,999 | 0 (0.0%) | 4 (4.8%) |
| $50,000 to $54,999 | 9 (10.6%) | 2 (2.4%) |
| $55,000 to $64,999 | 3 (3.5%) | 2 (2.4%) |
| $65,000 to $74,999 | 5 (5.9%) | 9 (10.8%) |
| $75,000 to $99,999 | 7 (8.2%) | 3 (3.6%) |
| $100,000+ | 0 (0.0%) | 3 (3.6%) |
| Total | 85 (100.0%) | 83 (100.0%) |
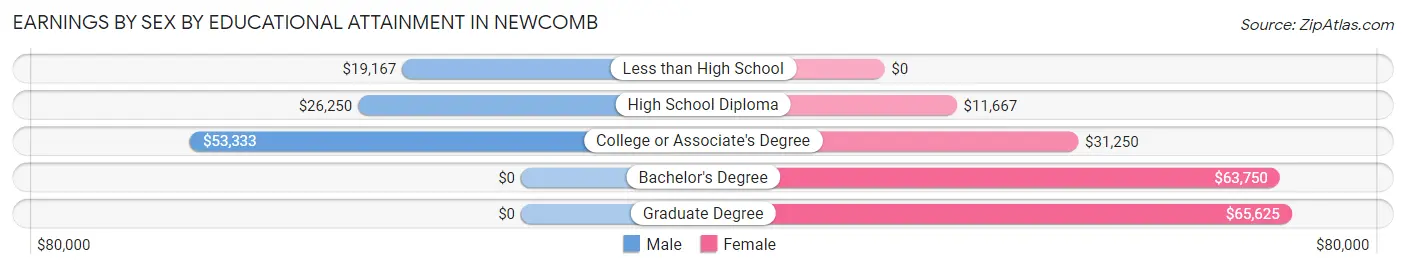
Earnings by Sex by Educational Attainment in Newcomb
Average earnings in Newcomb are $31,875 for men and $33,125 for women, a difference of 3.8%. Men with an educational attainment of college or associate's degree enjoy the highest average annual earnings of $53,333, while those with less than high school education earn the least with $19,167. Women with an educational attainment of graduate degree earn the most with the average annual earnings of $65,625, while those with high school diploma education have the smallest earnings of $11,667.
| Educational Attainment | Male Income | Female Income |
| Less than High School | $19,167 | $0 |
| High School Diploma | $26,250 | $11,667 |
| College or Associate's Degree | $53,333 | $31,250 |
| Bachelor's Degree | - | - |
| Graduate Degree | - | - |
| Total | $31,875 | $33,125 |
Family Income in Newcomb
Family Income Brackets in Newcomb
According to the Newcomb family income data, there are 18 families falling into the $50,000 to $74,999 income range, which is the most common income bracket and makes up 24.3% of all families.
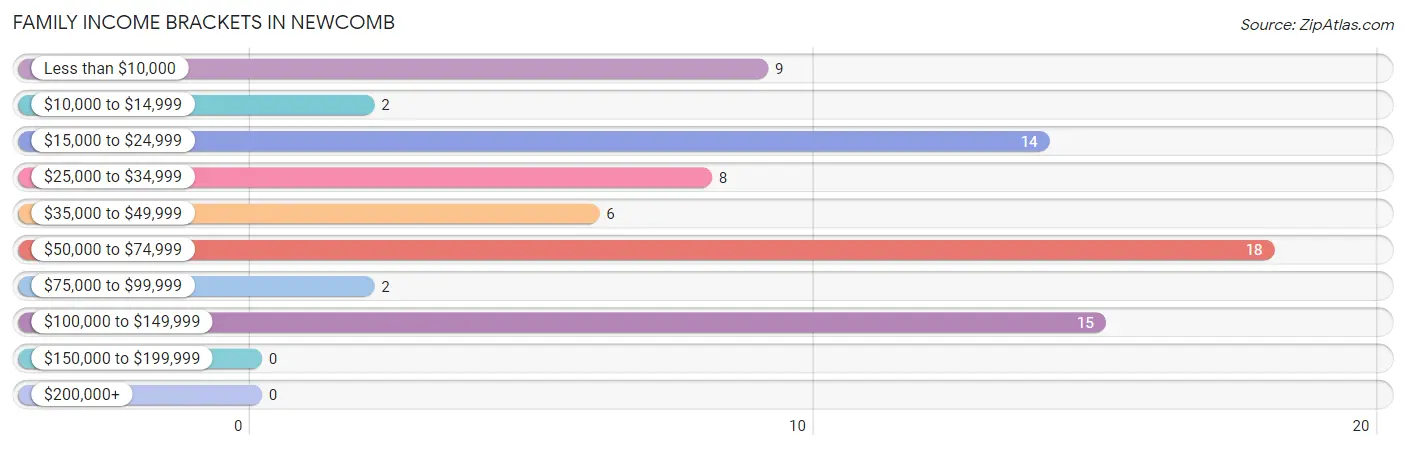
| Income Bracket | # Families | % Families |
| Less than $10,000 | 9 | 12.2% |
| $10,000 to $14,999 | 2 | 2.7% |
| $15,000 to $24,999 | 14 | 18.9% |
| $25,000 to $34,999 | 8 | 10.8% |
| $35,000 to $49,999 | 6 | 8.1% |
| $50,000 to $74,999 | 18 | 24.3% |
| $75,000 to $99,999 | 2 | 2.7% |
| $100,000 to $149,999 | 15 | 20.3% |
| $150,000 to $199,999 | 0 | 0.0% |
| $200,000+ | 0 | 0.0% |
Family Income by Famaliy Size in Newcomb
4-person families (10 | 13.5%) account for the highest median family income in Newcomb with $50,625 per family, while 2-person families (33 | 44.6%) have the highest median income of $14,062 per family member.
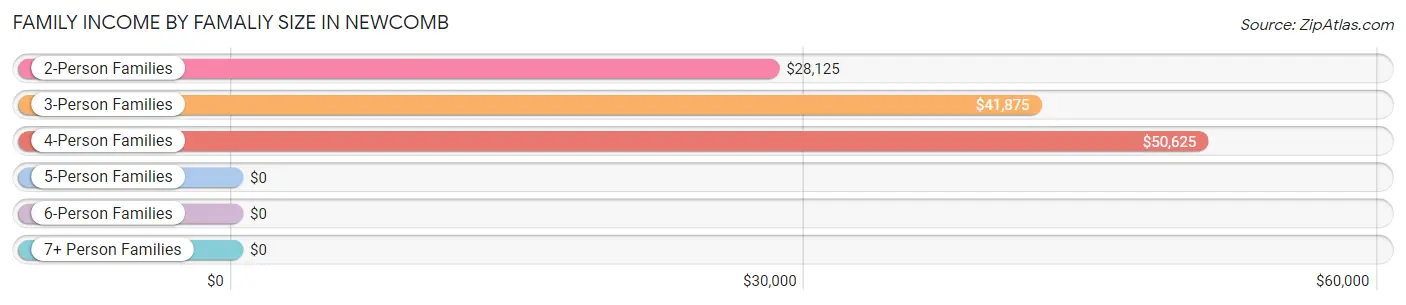
| Income Bracket | # Families | Median Income |
| 2-Person Families | 33 (44.6%) | $28,125 |
| 3-Person Families | 11 (14.9%) | $41,875 |
| 4-Person Families | 10 (13.5%) | $50,625 |
| 5-Person Families | 6 (8.1%) | $0 |
| 6-Person Families | 12 (16.2%) | $0 |
| 7+ Person Families | 2 (2.7%) | $0 |
| Total | 74 (100.0%) | $40,000 |
Family Income by Number of Earners in Newcomb
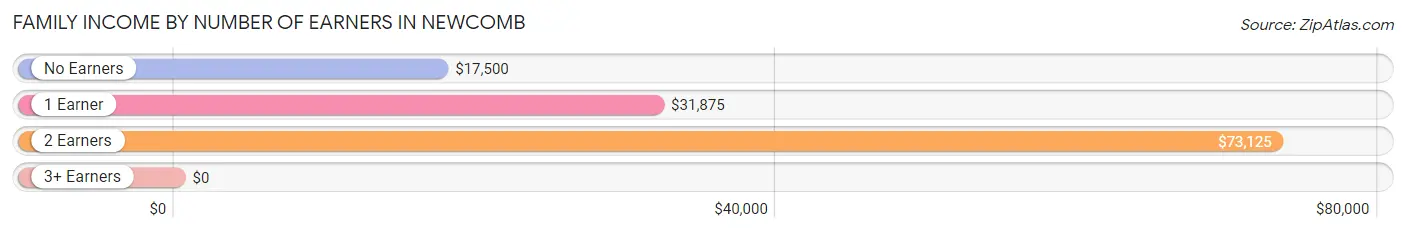
| Number of Earners | # Families | Median Income |
| No Earners | 20 (27.0%) | $17,500 |
| 1 Earner | 29 (39.2%) | $31,875 |
| 2 Earners | 19 (25.7%) | $73,125 |
| 3+ Earners | 6 (8.1%) | $0 |
| Total | 74 (100.0%) | $40,000 |
Household Income in Newcomb
Household Income Brackets in Newcomb
With 35 households falling in the category, the less than $10,000 income range is the most frequent in Newcomb, accounting for 24.8% of all households. In contrast, only 2 households (1.4%) fall into the $150,000 to $199,999 income bracket, making it the least populous group.
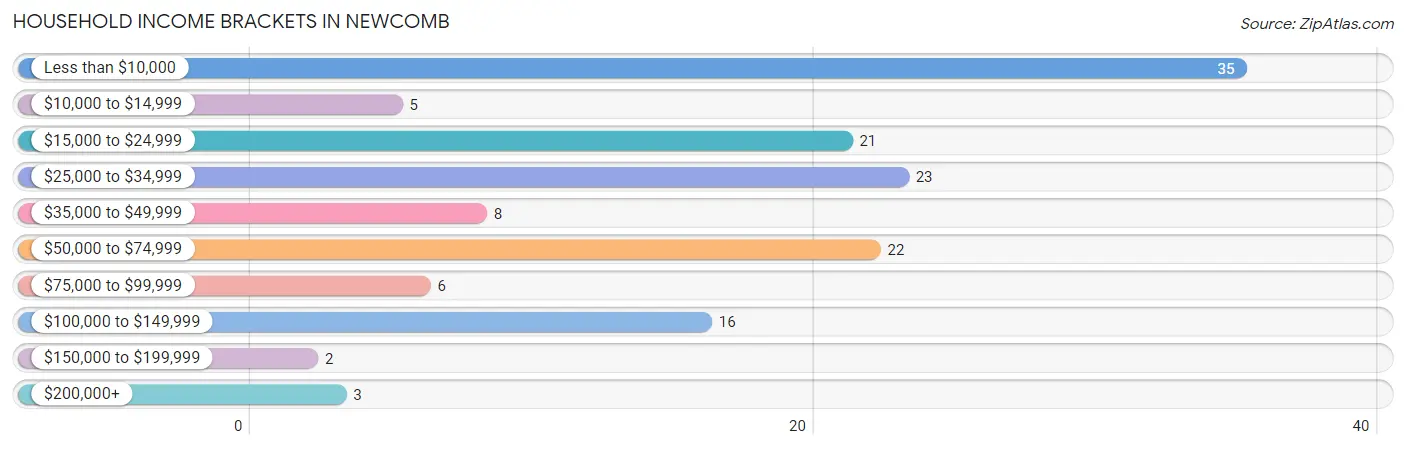
| Income Bracket | # Households | % Households |
| Less than $10,000 | 35 | 24.8% |
| $10,000 to $14,999 | 5 | 3.5% |
| $15,000 to $24,999 | 21 | 14.9% |
| $25,000 to $34,999 | 23 | 16.3% |
| $35,000 to $49,999 | 8 | 5.7% |
| $50,000 to $74,999 | 22 | 15.6% |
| $75,000 to $99,999 | 6 | 4.3% |
| $100,000 to $149,999 | 16 | 11.3% |
| $150,000 to $199,999 | 2 | 1.4% |
| $200,000+ | 3 | 2.1% |
Household Income by Householder Age in Newcomb
The median household income in Newcomb is $27,375, with the highest median household income of $70,417 found in the 25 to 44 years age bracket for the primary householder. A total of 27 households (19.2%) fall into this category. Meanwhile, the 15 to 24 years age bracket for the primary householder has the lowest median household income of $0, with 3 households (2.1%) in this group.
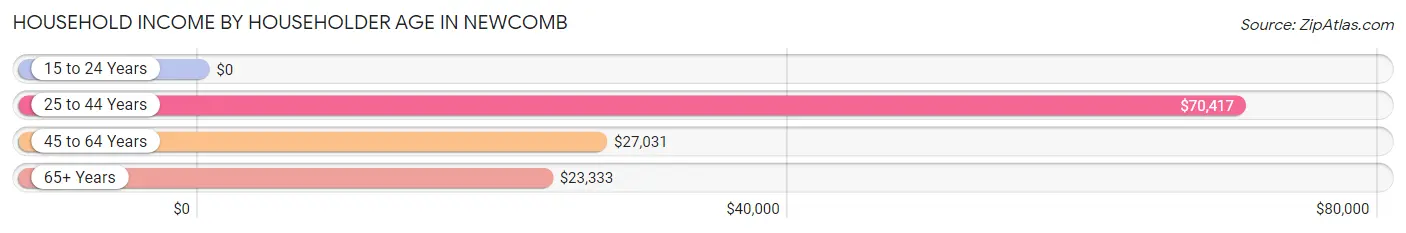
| Income Bracket | # Households | Median Income |
| 15 to 24 Years | 3 (2.1%) | $0 |
| 25 to 44 Years | 27 (19.2%) | $70,417 |
| 45 to 64 Years | 67 (47.5%) | $27,031 |
| 65+ Years | 44 (31.2%) | $23,333 |
| Total | 141 (100.0%) | $27,375 |
Poverty in Newcomb
Income Below Poverty by Sex and Age in Newcomb
With 34.5% poverty level for males and 28.8% for females among the residents of Newcomb, under 5 year old males and 5 year old females are the most vulnerable to poverty, with 2 males (66.7%) and 2 females (100.0%) in their respective age groups living below the poverty level.
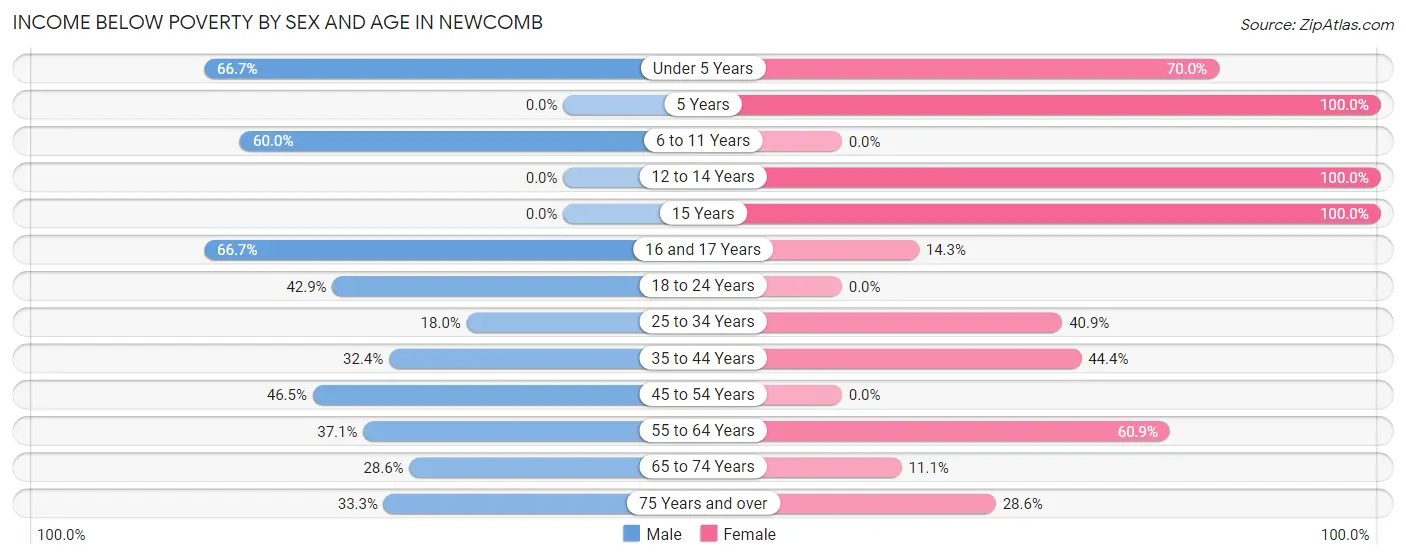
| Age Bracket | Male | Female |
| Under 5 Years | 2 (66.7%) | 7 (70.0%) |
| 5 Years | 0 (0.0%) | 2 (100.0%) |
| 6 to 11 Years | 3 (60.0%) | 0 (0.0%) |
| 12 to 14 Years | 0 (0.0%) | 1 (100.0%) |
| 15 Years | 0 (0.0%) | 7 (100.0%) |
| 16 and 17 Years | 4 (66.7%) | 1 (14.3%) |
| 18 to 24 Years | 9 (42.9%) | 0 (0.0%) |
| 25 to 34 Years | 7 (17.9%) | 9 (40.9%) |
| 35 to 44 Years | 11 (32.4%) | 12 (44.4%) |
| 45 to 54 Years | 20 (46.5%) | 0 (0.0%) |
| 55 to 64 Years | 13 (37.1%) | 14 (60.9%) |
| 65 to 74 Years | 6 (28.6%) | 2 (11.1%) |
| 75 Years and over | 2 (33.3%) | 6 (28.6%) |
| Total | 77 (34.5%) | 61 (28.8%) |
Income Above Poverty by Sex and Age in Newcomb
According to the poverty statistics in Newcomb, males aged 12 to 14 years and females aged 6 to 11 years are the age groups that are most secure financially, with 100.0% of males and 100.0% of females in these age groups living above the poverty line.
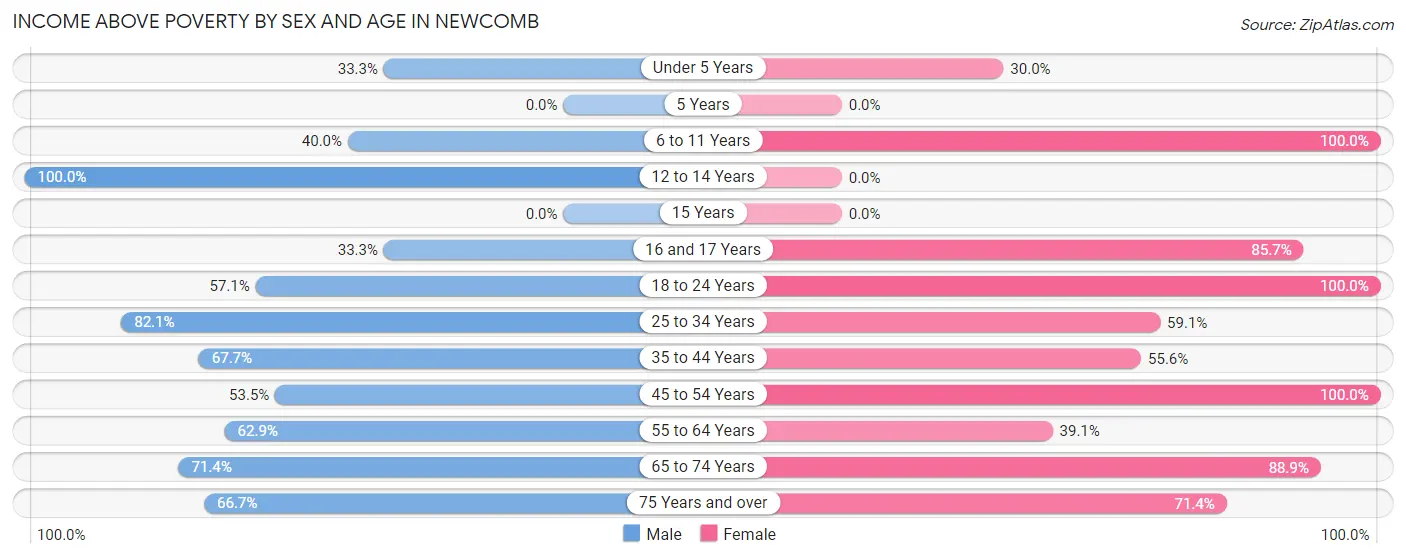
| Age Bracket | Male | Female |
| Under 5 Years | 1 (33.3%) | 3 (30.0%) |
| 5 Years | 0 (0.0%) | 0 (0.0%) |
| 6 to 11 Years | 2 (40.0%) | 8 (100.0%) |
| 12 to 14 Years | 10 (100.0%) | 0 (0.0%) |
| 15 Years | 0 (0.0%) | 0 (0.0%) |
| 16 and 17 Years | 2 (33.3%) | 6 (85.7%) |
| 18 to 24 Years | 12 (57.1%) | 43 (100.0%) |
| 25 to 34 Years | 32 (82.1%) | 13 (59.1%) |
| 35 to 44 Years | 23 (67.6%) | 15 (55.6%) |
| 45 to 54 Years | 23 (53.5%) | 23 (100.0%) |
| 55 to 64 Years | 22 (62.9%) | 9 (39.1%) |
| 65 to 74 Years | 15 (71.4%) | 16 (88.9%) |
| 75 Years and over | 4 (66.7%) | 15 (71.4%) |
| Total | 146 (65.5%) | 151 (71.2%) |
Income Below Poverty Among Married-Couple Families in Newcomb
The poverty statistics for married-couple families in Newcomb show that 13.5% or 5 of the total 37 families live below the poverty line. Families with 1 or 2 children have the highest poverty rate of 25.0%, comprising of 5 families. On the other hand, families with no children have the lowest poverty rate of 0.0%, which includes 0 families.
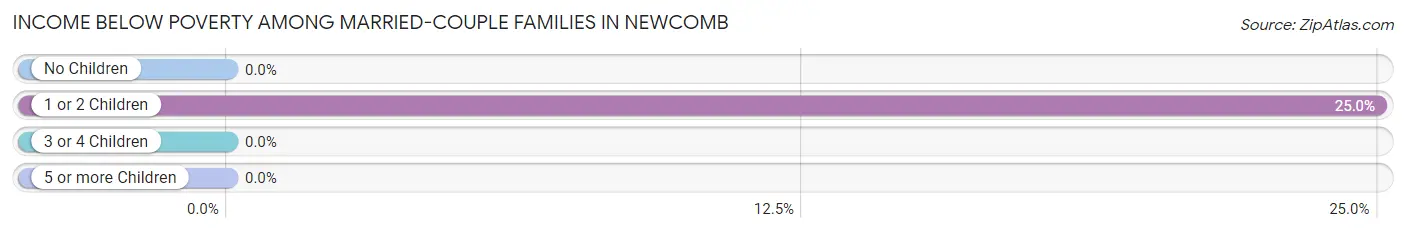
| Children | Above Poverty | Below Poverty |
| No Children | 17 (100.0%) | 0 (0.0%) |
| 1 or 2 Children | 15 (75.0%) | 5 (25.0%) |
| 3 or 4 Children | 0 (0.0%) | 0 (0.0%) |
| 5 or more Children | 0 (0.0%) | 0 (0.0%) |
| Total | 32 (86.5%) | 5 (13.5%) |
Income Below Poverty Among Single-Parent Households in Newcomb
According to the poverty data in Newcomb, 55.6% or 5 single-father households and 50.0% or 14 single-mother households are living below the poverty line. Among single-father households, those with no children have the highest poverty rate, with 5 households (71.4%) experiencing poverty. Likewise, among single-mother households, those with 3 or 4 children have the highest poverty rate, with 2 households (100.0%) falling below the poverty line.
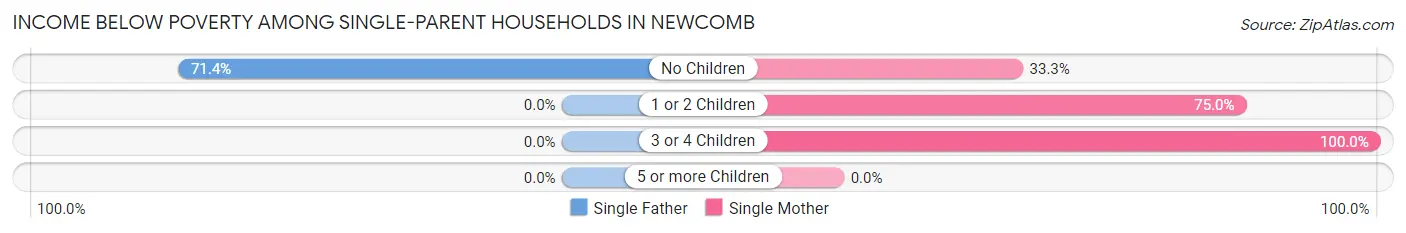
| Children | Single Father | Single Mother |
| No Children | 5 (71.4%) | 6 (33.3%) |
| 1 or 2 Children | 0 (0.0%) | 6 (75.0%) |
| 3 or 4 Children | 0 (0.0%) | 2 (100.0%) |
| 5 or more Children | 0 (0.0%) | 0 (0.0%) |
| Total | 5 (55.6%) | 14 (50.0%) |
Income Below Poverty Among Married-Couple vs Single-Parent Households in Newcomb
The poverty data for Newcomb shows that 5 of the married-couple family households (13.5%) and 19 of the single-parent households (51.3%) are living below the poverty level. Within the married-couple family households, those with 1 or 2 children have the highest poverty rate, with 5 households (25.0%) falling below the poverty line. Among the single-parent households, those with 3 or 4 children have the highest poverty rate, with 2 household (100.0%) living below poverty.
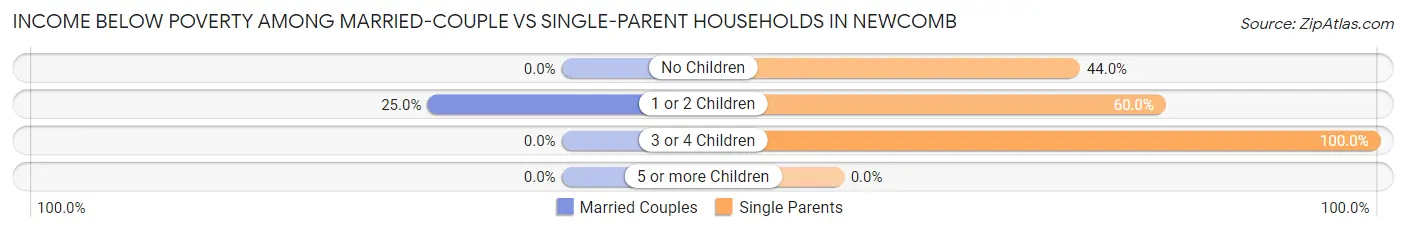
| Children | Married-Couple Families | Single-Parent Households |
| No Children | 0 (0.0%) | 11 (44.0%) |
| 1 or 2 Children | 5 (25.0%) | 6 (60.0%) |
| 3 or 4 Children | 0 (0.0%) | 2 (100.0%) |
| 5 or more Children | 0 (0.0%) | 0 (0.0%) |
| Total | 5 (13.5%) | 19 (51.3%) |
Race in Newcomb
The most populous races in Newcomb are Native / Alaskan (394 | 90.6%), White / Caucasian (20 | 4.6%), and Asian (9 | 2.1%).
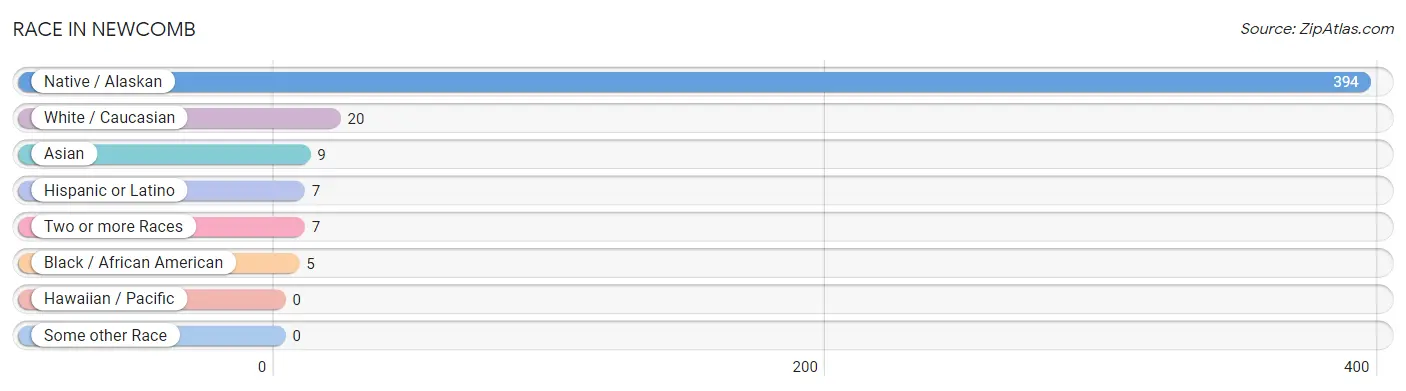
| Race | # Population | % Population |
| Asian | 9 | 2.1% |
| Black / African American | 5 | 1.1% |
| Hawaiian / Pacific | 0 | 0.0% |
| Hispanic or Latino | 7 | 1.6% |
| Native / Alaskan | 394 | 90.6% |
| White / Caucasian | 20 | 4.6% |
| Two or more Races | 7 | 1.6% |
| Some other Race | 0 | 0.0% |
| Total | 435 | 100.0% |
Ancestry in Newcomb
The most populous ancestries reported in Newcomb are Navajo (384 | 88.3%), Korean (9 | 2.1%), Irish (7 | 1.6%), Pueblo (7 | 1.6%), and Mexican (4 | 0.9%), together accounting for 94.5% of all Newcomb residents.
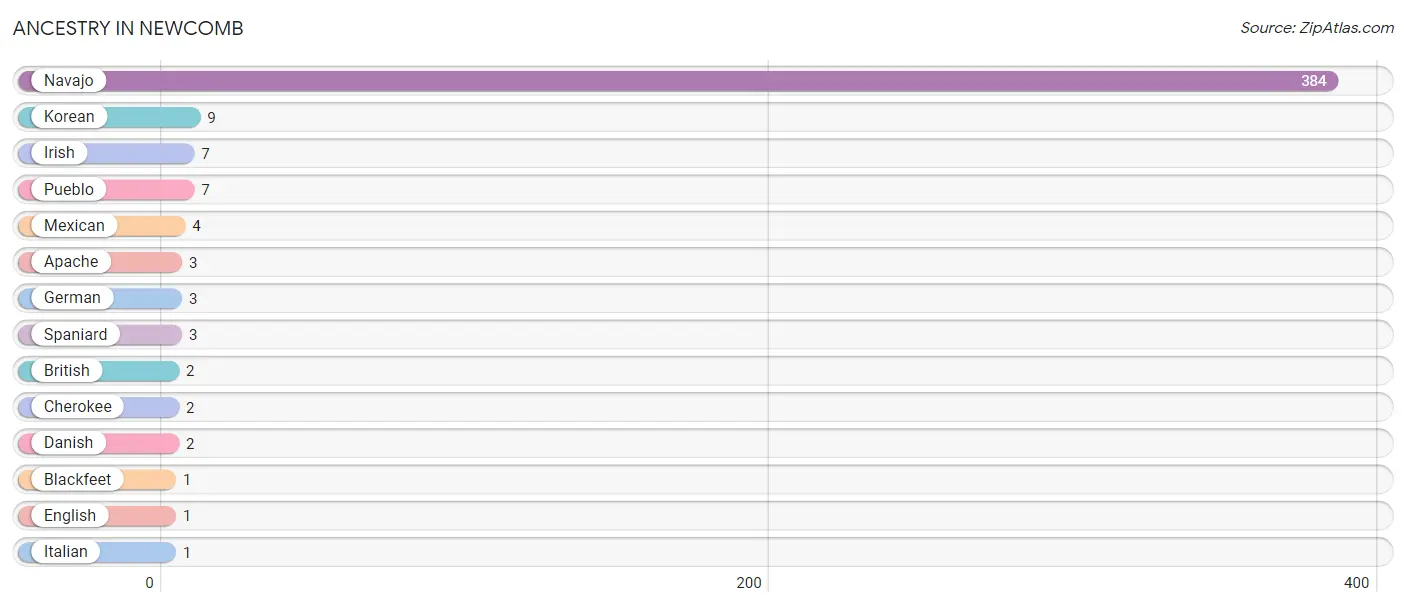
| Ancestry | # Population | % Population |
| Apache | 3 | 0.7% |
| Blackfeet | 1 | 0.2% |
| British | 2 | 0.5% |
| Cherokee | 2 | 0.5% |
| Danish | 2 | 0.5% |
| English | 1 | 0.2% |
| German | 3 | 0.7% |
| Irish | 7 | 1.6% |
| Italian | 1 | 0.2% |
| Korean | 9 | 2.1% |
| Mexican | 4 | 0.9% |
| Navajo | 384 | 88.3% |
| Pueblo | 7 | 1.6% |
| Spaniard | 3 | 0.7% | View All 14 Rows |
Immigrants in Newcomb
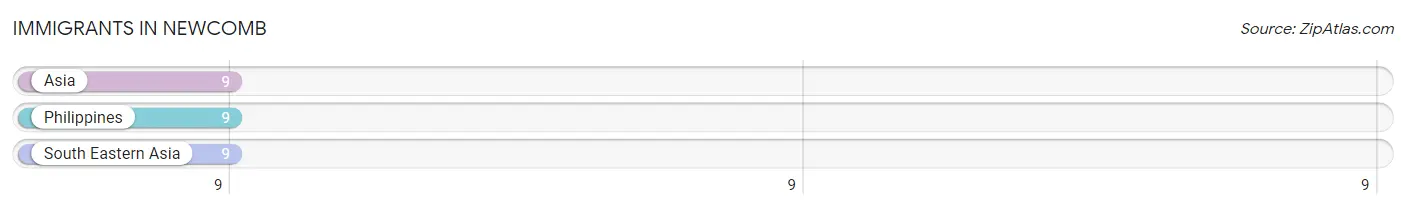
The most numerous immigrant groups reported in Newcomb came from Asia (9 | 2.1%), Philippines (9 | 2.1%), and South Eastern Asia (9 | 2.1%), together accounting for 6.2% of all Newcomb residents.
| Immigration Origin | # Population | % Population |
| Asia | 9 | 2.1% |
| Philippines | 9 | 2.1% |
| South Eastern Asia | 9 | 2.1% | View All 3 Rows |
Sex and Age in Newcomb
Sex and Age in Newcomb
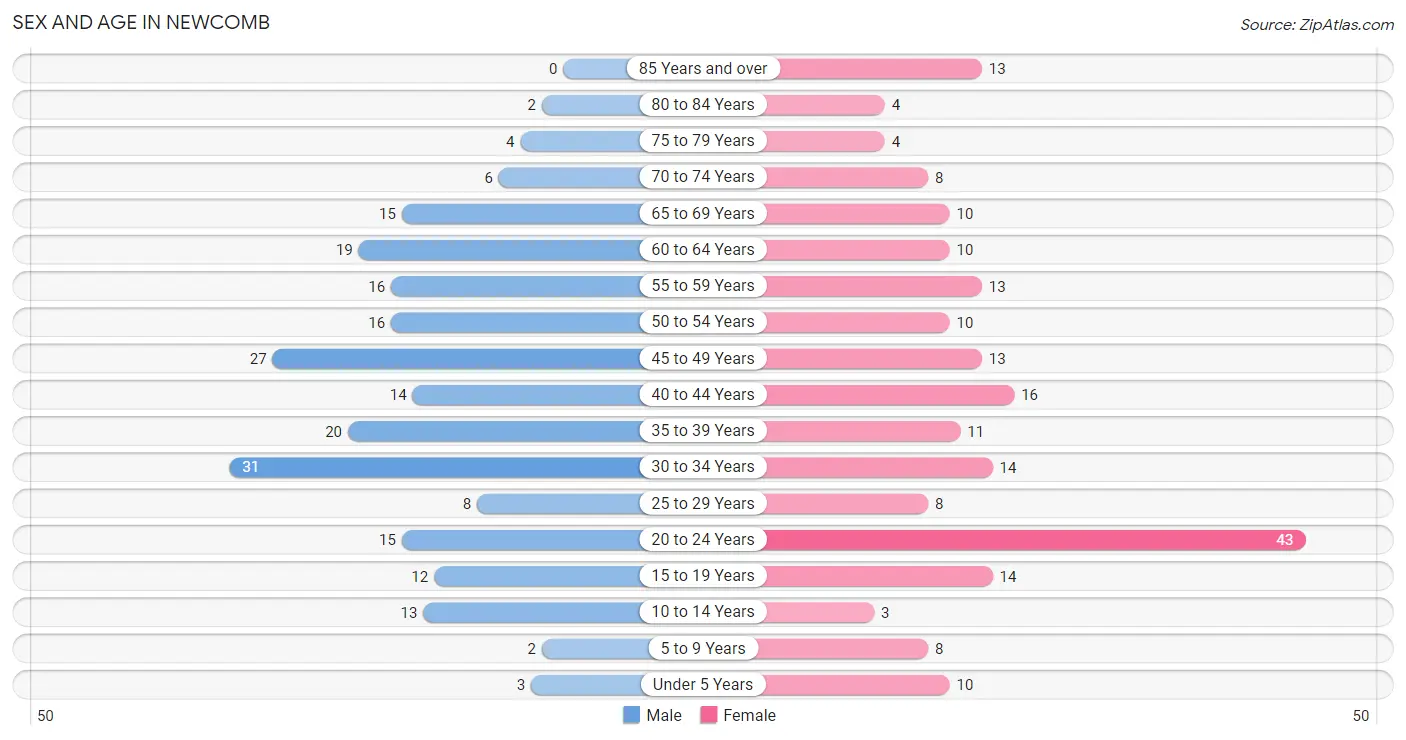
The most populous age groups in Newcomb are 30 to 34 Years (31 | 13.9%) for men and 20 to 24 Years (43 | 20.3%) for women.
| Age Bracket | Male | Female |
| Under 5 Years | 3 (1.3%) | 10 (4.7%) |
| 5 to 9 Years | 2 (0.9%) | 8 (3.8%) |
| 10 to 14 Years | 13 (5.8%) | 3 (1.4%) |
| 15 to 19 Years | 12 (5.4%) | 14 (6.6%) |
| 20 to 24 Years | 15 (6.7%) | 43 (20.3%) |
| 25 to 29 Years | 8 (3.6%) | 8 (3.8%) |
| 30 to 34 Years | 31 (13.9%) | 14 (6.6%) |
| 35 to 39 Years | 20 (9.0%) | 11 (5.2%) |
| 40 to 44 Years | 14 (6.3%) | 16 (7.5%) |
| 45 to 49 Years | 27 (12.1%) | 13 (6.1%) |
| 50 to 54 Years | 16 (7.2%) | 10 (4.7%) |
| 55 to 59 Years | 16 (7.2%) | 13 (6.1%) |
| 60 to 64 Years | 19 (8.5%) | 10 (4.7%) |
| 65 to 69 Years | 15 (6.7%) | 10 (4.7%) |
| 70 to 74 Years | 6 (2.7%) | 8 (3.8%) |
| 75 to 79 Years | 4 (1.8%) | 4 (1.9%) |
| 80 to 84 Years | 2 (0.9%) | 4 (1.9%) |
| 85 Years and over | 0 (0.0%) | 13 (6.1%) |
| Total | 223 (100.0%) | 212 (100.0%) |
Families and Households in Newcomb
Median Family Size in Newcomb
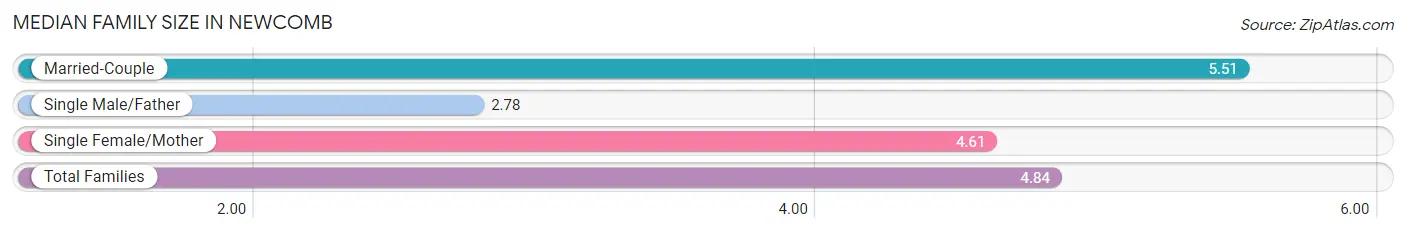
The median family size in Newcomb is 4.84 persons per family, with married-couple families (37 | 50.0%) accounting for the largest median family size of 5.51 persons per family. On the other hand, single male/father families (9 | 12.2%) represent the smallest median family size with 2.78 persons per family.
| Family Type | # Families | Family Size |
| Married-Couple | 37 (50.0%) | 5.51 |
| Single Male/Father | 9 (12.2%) | 2.78 |
| Single Female/Mother | 28 (37.8%) | 4.61 |
| Total Families | 74 (100.0%) | 4.84 |
Median Household Size in Newcomb
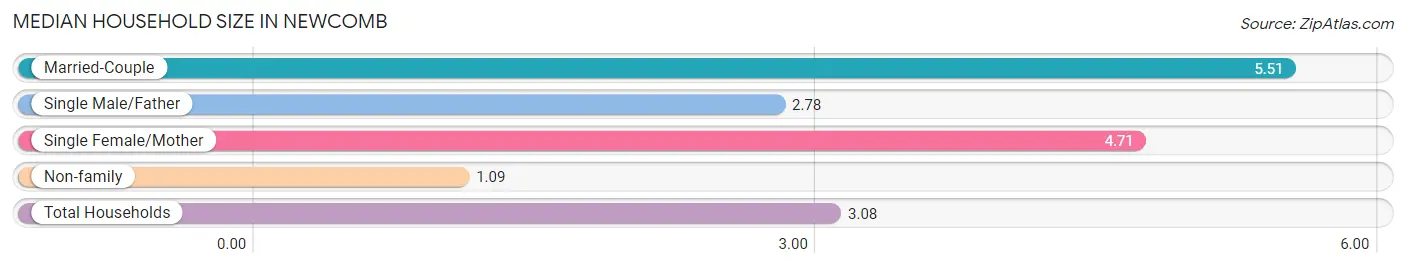
The median household size in Newcomb is 3.08 persons per household, with married-couple households (37 | 26.2%) accounting for the largest median household size of 5.51 persons per household. non-family households (67 | 47.5%) represent the smallest median household size with 1.09 persons per household.
| Household Type | # Households | Household Size |
| Married-Couple | 37 (26.2%) | 5.51 |
| Single Male/Father | 9 (6.4%) | 2.78 |
| Single Female/Mother | 28 (19.9%) | 4.71 |
| Non-family | 67 (47.5%) | 1.09 |
| Total Households | 141 (100.0%) | 3.08 |
Household Size by Marriage Status in Newcomb
Out of a total of 141 households in Newcomb, 74 (52.5%) are family households, while 67 (47.5%) are nonfamily households. The most numerous type of family households are 2-person households, comprising 33, and the most common type of nonfamily households are 1-person households, comprising 62.
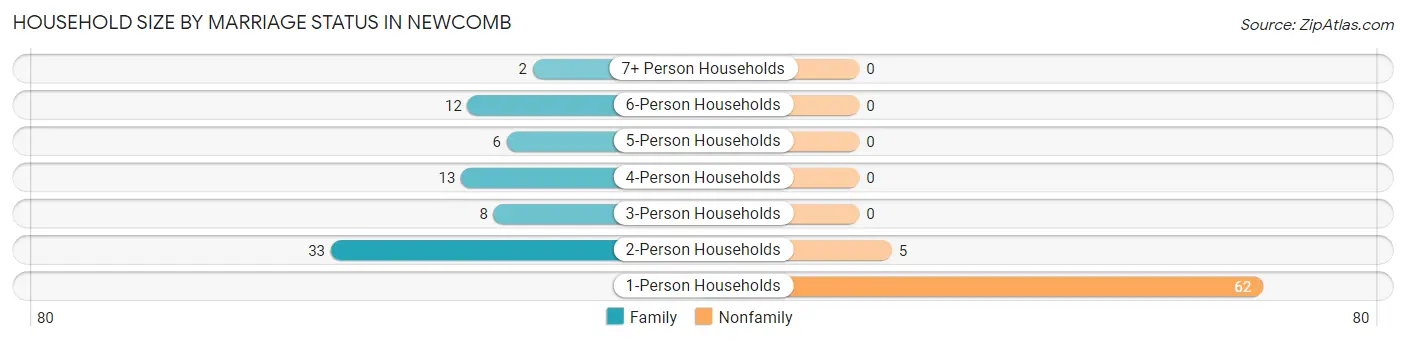
| Household Size | Family Households | Nonfamily Households |
| 1-Person Households | - | 62 (44.0%) |
| 2-Person Households | 33 (23.4%) | 5 (3.5%) |
| 3-Person Households | 8 (5.7%) | 0 (0.0%) |
| 4-Person Households | 13 (9.2%) | 0 (0.0%) |
| 5-Person Households | 6 (4.3%) | 0 (0.0%) |
| 6-Person Households | 12 (8.5%) | 0 (0.0%) |
| 7+ Person Households | 2 (1.4%) | 0 (0.0%) |
| Total | 74 (52.5%) | 67 (47.5%) |
Female Fertility in Newcomb
Fertility by Age in Newcomb
| Age Bracket | Women with Births | Births / 1,000 Women |
| 15 to 19 years | 0 (0.0%) | 0.0 |
| 20 to 34 years | 0 (0.0%) | 0.0 |
| 35 to 50 years | 0 (0.0%) | 0.0 |
| Total | 0 (0.0%) | 0.0 |
Fertility by Age by Marriage Status in Newcomb
| Age Bracket | Married | Unmarried |
| 15 to 19 years | 0 (0.0%) | 0 (0.0%) |
| 20 to 34 years | 0 (0.0%) | 0 (0.0%) |
| 35 to 50 years | 0 (0.0%) | 0 (0.0%) |
| Total | 0 (0.0%) | 0 (0.0%) |
Fertility by Education in Newcomb
| Educational Attainment | Women with Births | Births / 1,000 Women |
| Less than High School | 0 (0.0%) | 0.0 |
| High School Diploma | 0 (0.0%) | 0.0 |
| College or Associate's Degree | 0 (0.0%) | 0.0 |
| Bachelor's Degree | 0 (0.0%) | 0.0 |
| Graduate Degree | 0 (0.0%) | 0.0 |
| Total | 0 (0.0%) | 0.0 |
Fertility by Education by Marriage Status in Newcomb
| Educational Attainment | Married | Unmarried |
| Less than High School | 0 (0.0%) | 0 (0.0%) |
| High School Diploma | 0 (0.0%) | 0 (0.0%) |
| College or Associate's Degree | 0 (0.0%) | 0 (0.0%) |
| Bachelor's Degree | 0 (0.0%) | 0 (0.0%) |
| Graduate Degree | 0 (0.0%) | 0 (0.0%) |
| Total | 0 (0.0%) | 0 (0.0%) |
Employment Characteristics in Newcomb
Employment by Class of Employer in Newcomb
Among the 155 employed individuals in Newcomb, private company employees (94 | 60.7%), state government employees (32 | 20.6%), and local government employees (20 | 12.9%) make up the most common classes of employment.
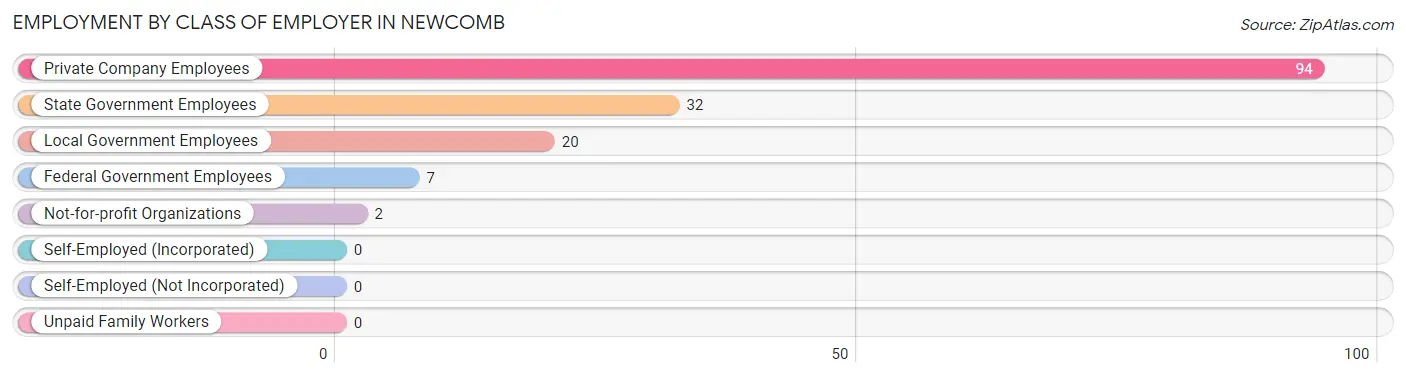
| Employer Class | # Employees | % Employees |
| Private Company Employees | 94 | 60.7% |
| Self-Employed (Incorporated) | 0 | 0.0% |
| Self-Employed (Not Incorporated) | 0 | 0.0% |
| Not-for-profit Organizations | 2 | 1.3% |
| Local Government Employees | 20 | 12.9% |
| State Government Employees | 32 | 20.6% |
| Federal Government Employees | 7 | 4.5% |
| Unpaid Family Workers | 0 | 0.0% |
| Total | 155 | 100.0% |
Employment Status by Age in Newcomb
According to the labor force statistics for Newcomb, out of the total population over 16 years of age (389), 42.2% or 164 individuals are in the labor force, with 5.5% or 9 of them unemployed. The age group with the highest labor force participation rate is 35 to 44 years, with 65.6% or 40 individuals in the labor force. Within the labor force, the 55 to 59 years age range has the highest percentage of unemployed individuals, with 17.6% or 3 of them being unemployed.
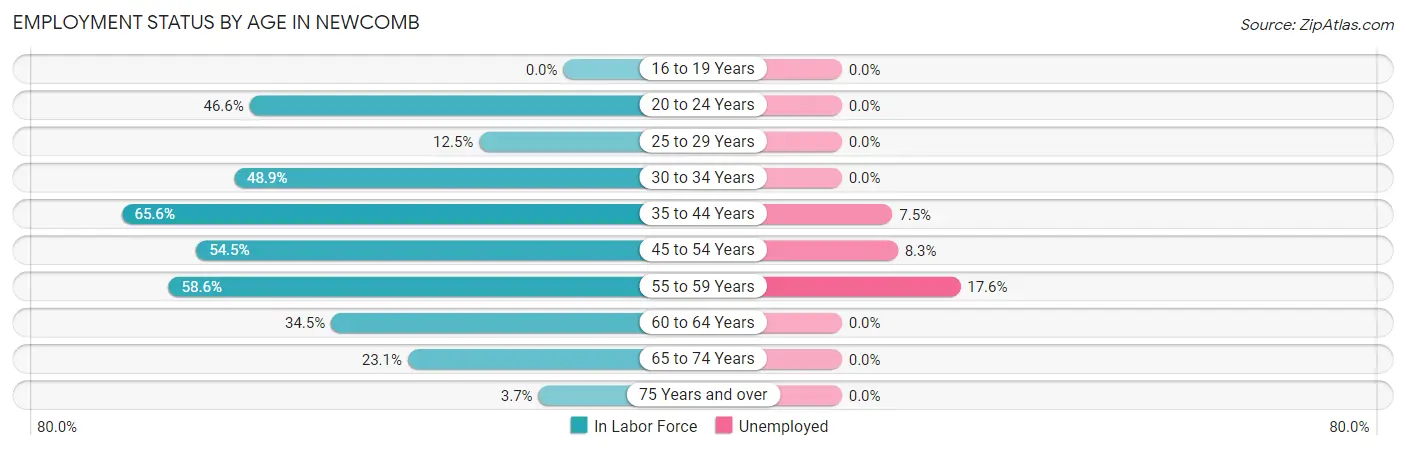
| Age Bracket | In Labor Force | Unemployed |
| 16 to 19 Years | 0 (0.0%) | 0 (0.0%) |
| 20 to 24 Years | 27 (46.6%) | 0 (0.0%) |
| 25 to 29 Years | 2 (12.5%) | 0 (0.0%) |
| 30 to 34 Years | 22 (48.9%) | 0 (0.0%) |
| 35 to 44 Years | 40 (65.6%) | 3 (7.5%) |
| 45 to 54 Years | 36 (54.5%) | 3 (8.3%) |
| 55 to 59 Years | 17 (58.6%) | 3 (17.6%) |
| 60 to 64 Years | 10 (34.5%) | 0 (0.0%) |
| 65 to 74 Years | 9 (23.1%) | 0 (0.0%) |
| 75 Years and over | 1 (3.7%) | 0 (0.0%) |
| Total | 164 (42.2%) | 9 (5.5%) |
Employment Status by Educational Attainment in Newcomb
According to labor force statistics for Newcomb, 51.6% of individuals (127) out of the total population between 25 and 64 years of age (246) are in the labor force, with 7.1% or 9 of them being unemployed. The group with the highest labor force participation rate are those with the educational attainment of bachelor's degree or higher, with 95.8% or 23 individuals in the labor force. Within the labor force, individuals with college / associate degree education have the highest percentage of unemployment, with 15.0% or 6 of them being unemployed.
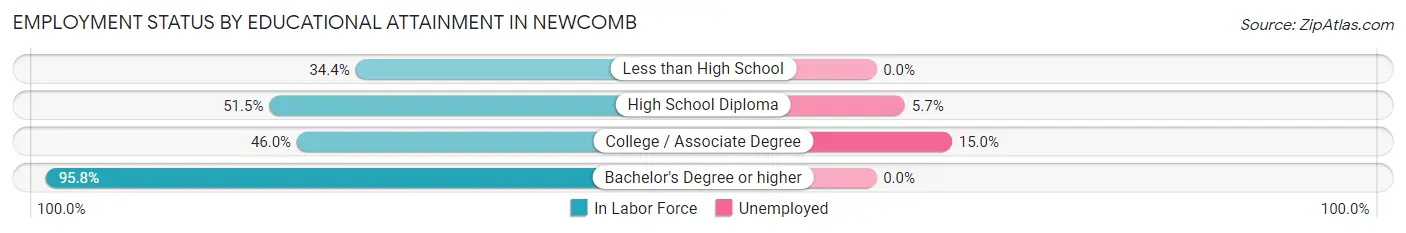
| Educational Attainment | In Labor Force | Unemployed |
| Less than High School | 11 (34.4%) | 0 (0.0%) |
| High School Diploma | 53 (51.5%) | 6 (5.7%) |
| College / Associate Degree | 40 (46.0%) | 13 (15.0%) |
| Bachelor's Degree or higher | 23 (95.8%) | 0 (0.0%) |
| Total | 127 (51.6%) | 17 (7.1%) |
Employment Occupations by Sex in Newcomb
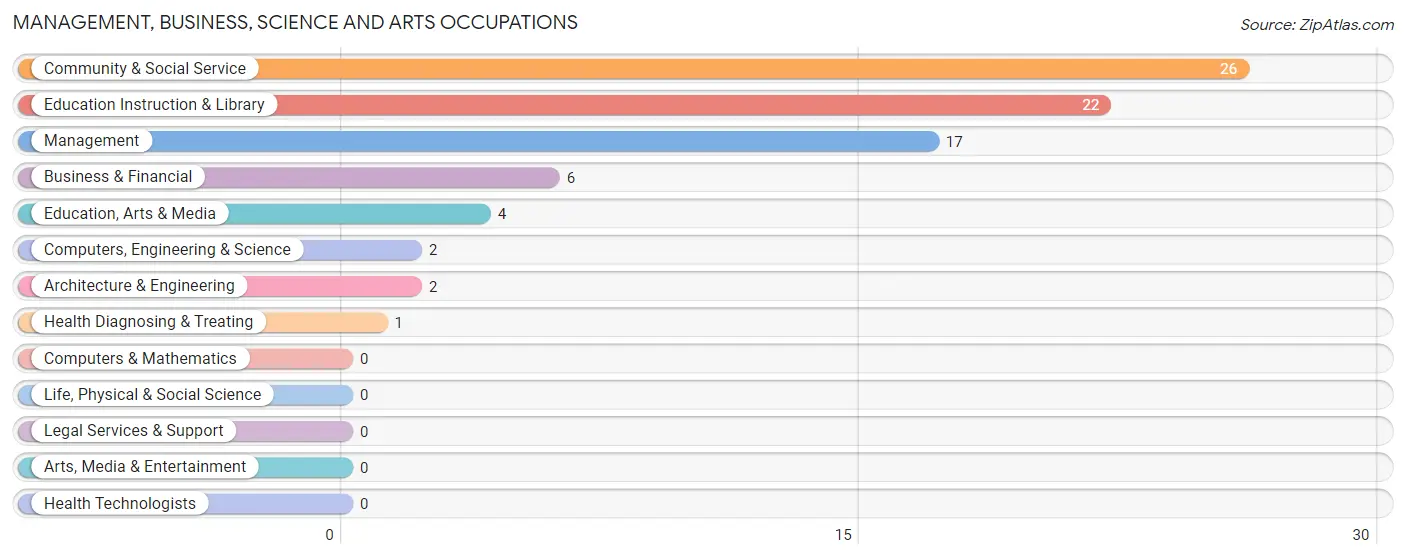
Management, Business, Science and Arts Occupations
The most common Management, Business, Science and Arts occupations in Newcomb are Community & Social Service (26 | 16.8%), Education Instruction & Library (22 | 14.2%), Management (17 | 11.0%), Business & Financial (6 | 3.9%), and Education, Arts & Media (4 | 2.6%).
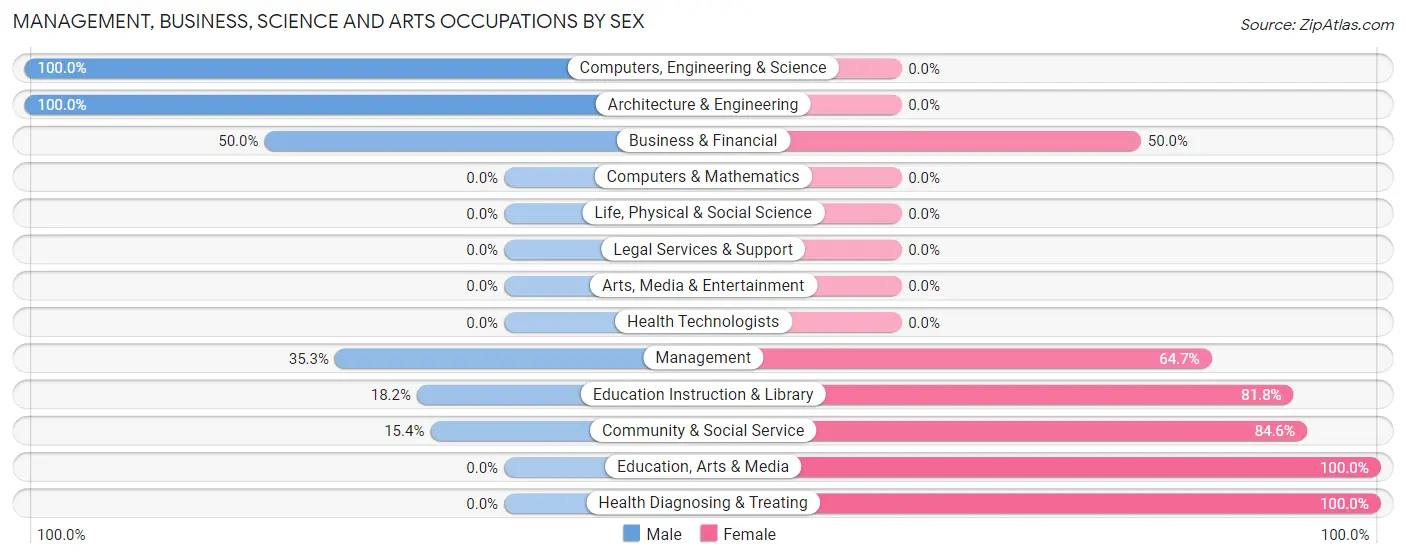
Management, Business, Science and Arts Occupations by Sex
Within the Management, Business, Science and Arts occupations in Newcomb, the most male-oriented occupations are Computers, Engineering & Science (100.0%), Architecture & Engineering (100.0%), and Business & Financial (50.0%), while the most female-oriented occupations are Education, Arts & Media (100.0%), Health Diagnosing & Treating (100.0%), and Community & Social Service (84.6%).
| Occupation | Male | Female |
| Management | 6 (35.3%) | 11 (64.7%) |
| Business & Financial | 3 (50.0%) | 3 (50.0%) |
| Computers, Engineering & Science | 2 (100.0%) | 0 (0.0%) |
| Computers & Mathematics | 0 (0.0%) | 0 (0.0%) |
| Architecture & Engineering | 2 (100.0%) | 0 (0.0%) |
| Life, Physical & Social Science | 0 (0.0%) | 0 (0.0%) |
| Community & Social Service | 4 (15.4%) | 22 (84.6%) |
| Education, Arts & Media | 0 (0.0%) | 4 (100.0%) |
| Legal Services & Support | 0 (0.0%) | 0 (0.0%) |
| Education Instruction & Library | 4 (18.2%) | 18 (81.8%) |
| Arts, Media & Entertainment | 0 (0.0%) | 0 (0.0%) |
| Health Diagnosing & Treating | 0 (0.0%) | 1 (100.0%) |
| Health Technologists | 0 (0.0%) | 0 (0.0%) |
| Total (Category) | 15 (28.8%) | 37 (71.2%) |
| Total (Overall) | 75 (48.4%) | 80 (51.6%) |
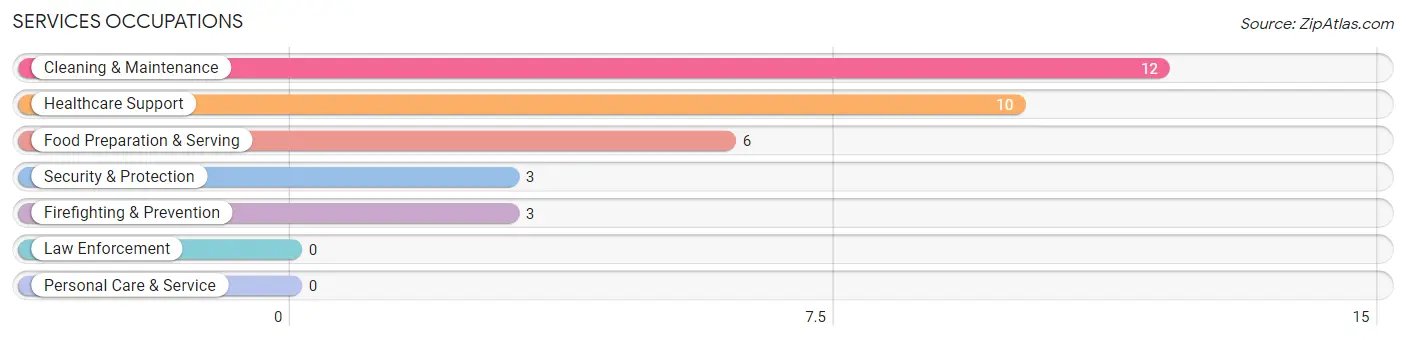
Services Occupations
The most common Services occupations in Newcomb are Cleaning & Maintenance (12 | 7.7%), Healthcare Support (10 | 6.5%), Food Preparation & Serving (6 | 3.9%), Security & Protection (3 | 1.9%), and Firefighting & Prevention (3 | 1.9%).
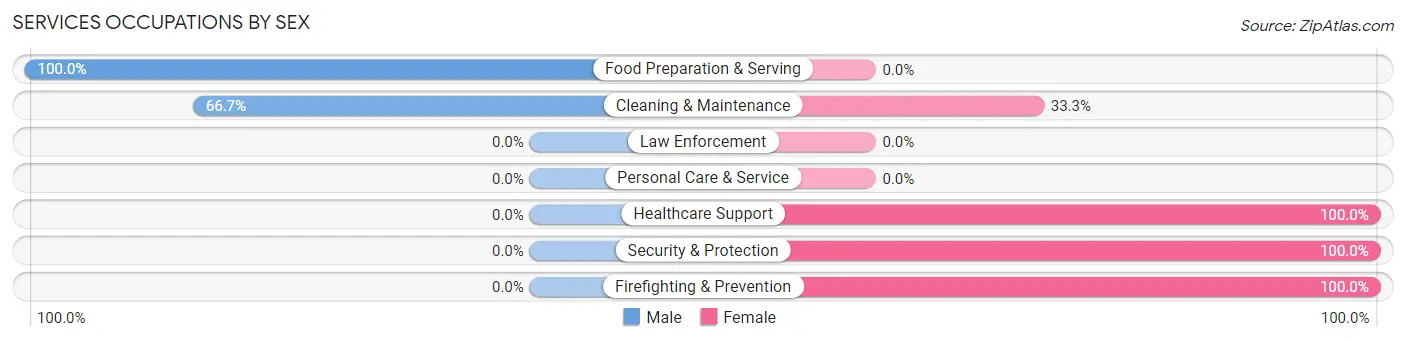
Services Occupations by Sex
Within the Services occupations in Newcomb, the most male-oriented occupations are Food Preparation & Serving (100.0%), and Cleaning & Maintenance (66.7%), while the most female-oriented occupations are Healthcare Support (100.0%), Security & Protection (100.0%), and Firefighting & Prevention (100.0%).
| Occupation | Male | Female |
| Healthcare Support | 0 (0.0%) | 10 (100.0%) |
| Security & Protection | 0 (0.0%) | 3 (100.0%) |
| Firefighting & Prevention | 0 (0.0%) | 3 (100.0%) |
| Law Enforcement | 0 (0.0%) | 0 (0.0%) |
| Food Preparation & Serving | 6 (100.0%) | 0 (0.0%) |
| Cleaning & Maintenance | 8 (66.7%) | 4 (33.3%) |
| Personal Care & Service | 0 (0.0%) | 0 (0.0%) |
| Total (Category) | 14 (45.2%) | 17 (54.8%) |
| Total (Overall) | 75 (48.4%) | 80 (51.6%) |
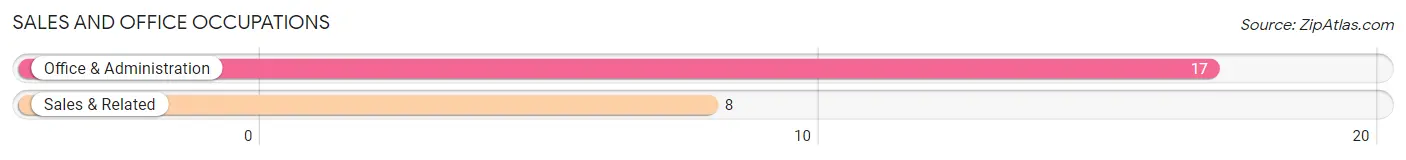
Sales and Office Occupations
The most common Sales and Office occupations in Newcomb are Office & Administration (17 | 11.0%), and Sales & Related (8 | 5.2%).
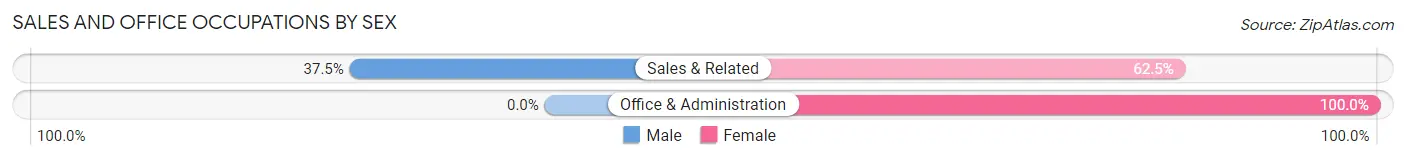
Sales and Office Occupations by Sex
| Occupation | Male | Female |
| Sales & Related | 3 (37.5%) | 5 (62.5%) |
| Office & Administration | 0 (0.0%) | 17 (100.0%) |
| Total (Category) | 3 (12.0%) | 22 (88.0%) |
| Total (Overall) | 75 (48.4%) | 80 (51.6%) |
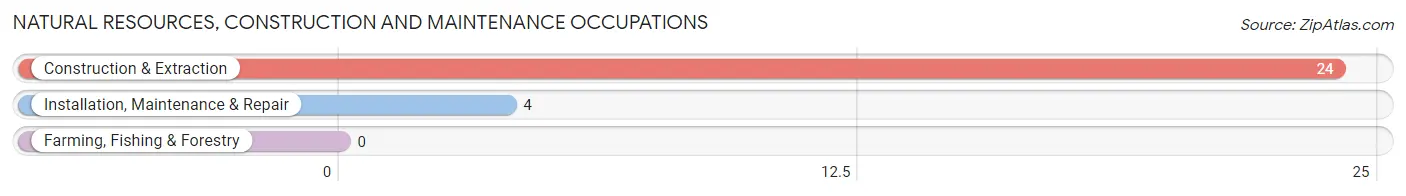
Natural Resources, Construction and Maintenance Occupations
The most common Natural Resources, Construction and Maintenance occupations in Newcomb are Construction & Extraction (24 | 15.5%), and Installation, Maintenance & Repair (4 | 2.6%).
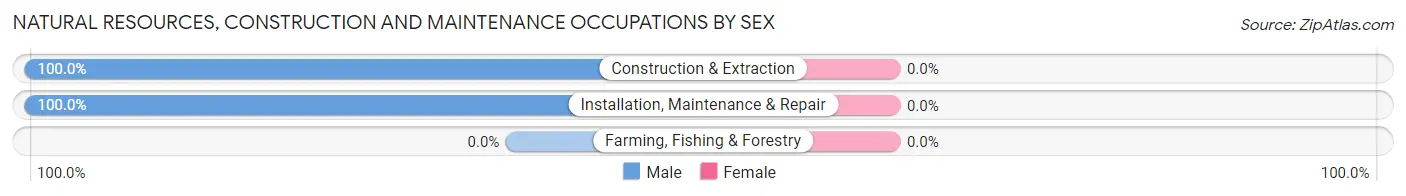
Natural Resources, Construction and Maintenance Occupations by Sex
| Occupation | Male | Female |
| Farming, Fishing & Forestry | 0 (0.0%) | 0 (0.0%) |
| Construction & Extraction | 24 (100.0%) | 0 (0.0%) |
| Installation, Maintenance & Repair | 4 (100.0%) | 0 (0.0%) |
| Total (Category) | 28 (100.0%) | 0 (0.0%) |
| Total (Overall) | 75 (48.4%) | 80 (51.6%) |
Production, Transportation and Moving Occupations
The most common Production, Transportation and Moving occupations in Newcomb are Transportation (8 | 5.2%), Material Moving (7 | 4.5%), and Production (4 | 2.6%).
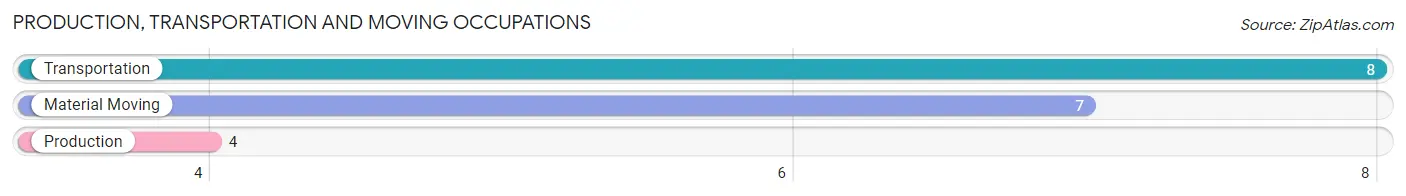
Production, Transportation and Moving Occupations by Sex
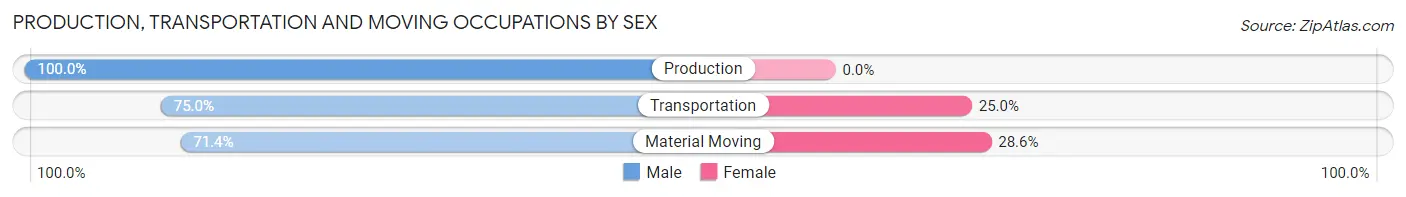
| Occupation | Male | Female |
| Production | 4 (100.0%) | 0 (0.0%) |
| Transportation | 6 (75.0%) | 2 (25.0%) |
| Material Moving | 5 (71.4%) | 2 (28.6%) |
| Total (Category) | 15 (78.9%) | 4 (21.0%) |
| Total (Overall) | 75 (48.4%) | 80 (51.6%) |
Employment Industries by Sex in Newcomb
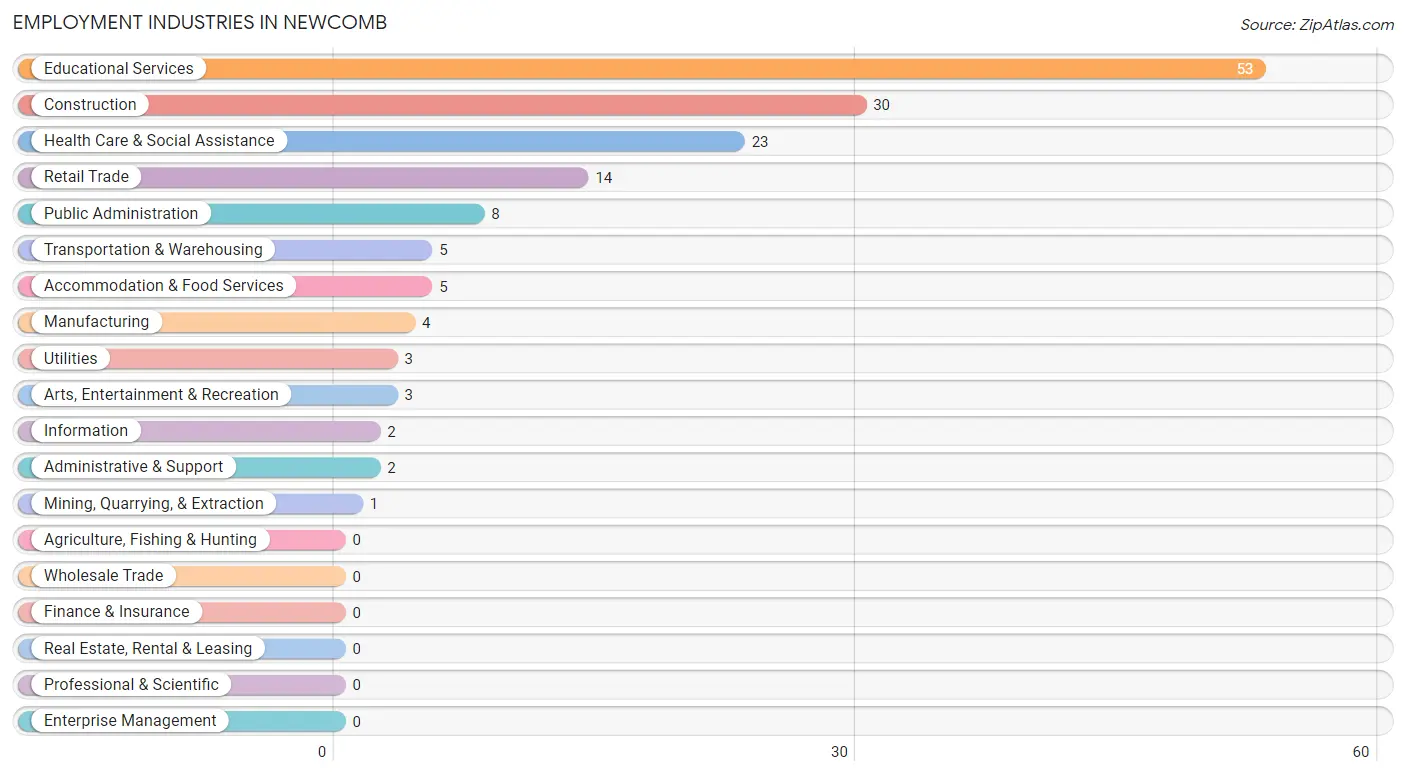
Employment Industries in Newcomb
The major employment industries in Newcomb include Educational Services (53 | 34.2%), Construction (30 | 19.4%), Health Care & Social Assistance (23 | 14.8%), Retail Trade (14 | 9.0%), and Public Administration (8 | 5.2%).
Employment Industries by Sex in Newcomb
The Newcomb industries that see more men than women are Mining, Quarrying, & Extraction (100.0%), Construction (100.0%), and Manufacturing (100.0%), whereas the industries that tend to have a higher number of women are Utilities (100.0%), Administrative & Support (100.0%), and Accommodation & Food Services (100.0%).
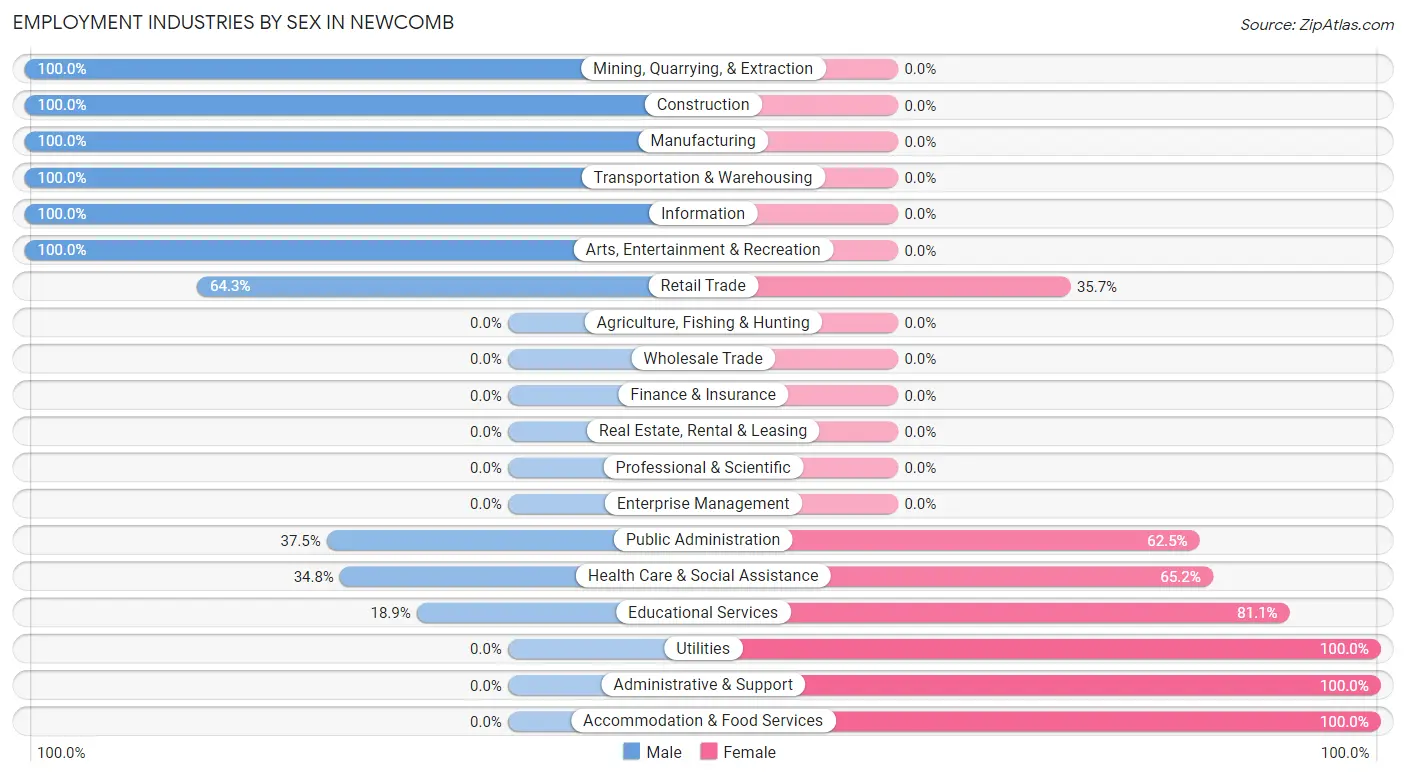
| Industry | Male | Female |
| Agriculture, Fishing & Hunting | 0 (0.0%) | 0 (0.0%) |
| Mining, Quarrying, & Extraction | 1 (100.0%) | 0 (0.0%) |
| Construction | 30 (100.0%) | 0 (0.0%) |
| Manufacturing | 4 (100.0%) | 0 (0.0%) |
| Wholesale Trade | 0 (0.0%) | 0 (0.0%) |
| Retail Trade | 9 (64.3%) | 5 (35.7%) |
| Transportation & Warehousing | 5 (100.0%) | 0 (0.0%) |
| Utilities | 0 (0.0%) | 3 (100.0%) |
| Information | 2 (100.0%) | 0 (0.0%) |
| Finance & Insurance | 0 (0.0%) | 0 (0.0%) |
| Real Estate, Rental & Leasing | 0 (0.0%) | 0 (0.0%) |
| Professional & Scientific | 0 (0.0%) | 0 (0.0%) |
| Enterprise Management | 0 (0.0%) | 0 (0.0%) |
| Administrative & Support | 0 (0.0%) | 2 (100.0%) |
| Educational Services | 10 (18.9%) | 43 (81.1%) |
| Health Care & Social Assistance | 8 (34.8%) | 15 (65.2%) |
| Arts, Entertainment & Recreation | 3 (100.0%) | 0 (0.0%) |
| Accommodation & Food Services | 0 (0.0%) | 5 (100.0%) |
| Public Administration | 3 (37.5%) | 5 (62.5%) |
| Total | 75 (48.4%) | 80 (51.6%) |
Education in Newcomb
School Enrollment in Newcomb
The most common levels of schooling among the 78 students in Newcomb are college / undergraduate (30 | 38.5%), high school (25 | 32.1%), and middle school (11 | 14.1%).
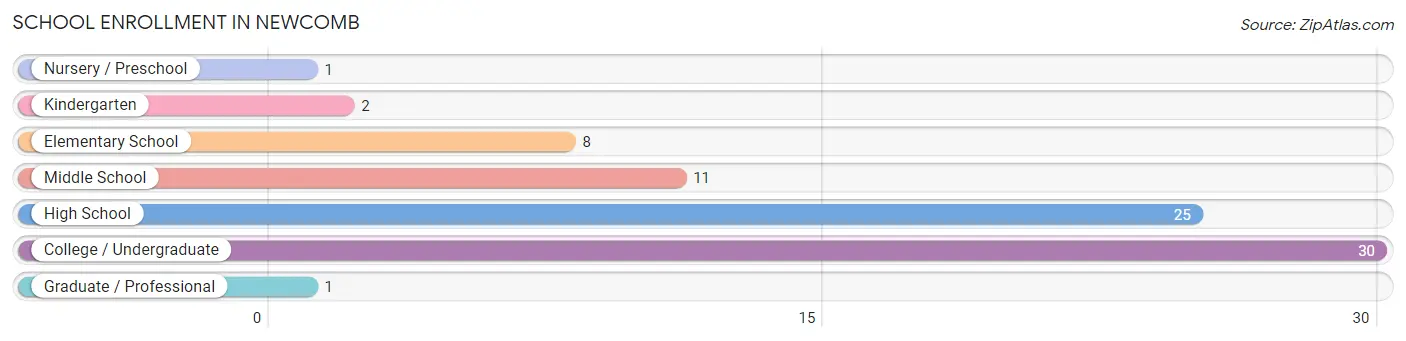
| School Level | # Students | % Students |
| Nursery / Preschool | 1 | 1.3% |
| Kindergarten | 2 | 2.6% |
| Elementary School | 8 | 10.3% |
| Middle School | 11 | 14.1% |
| High School | 25 | 32.1% |
| College / Undergraduate | 30 | 38.5% |
| Graduate / Professional | 1 | 1.3% |
| Total | 78 | 100.0% |
School Enrollment by Age by Funding Source in Newcomb
Out of a total of 78 students who are enrolled in schools in Newcomb, 7 (9.0%) attend a private institution, while the remaining 71 (91.0%) are enrolled in public schools. The age group of 3 to 4 year olds has the highest likelihood of being enrolled in private schools, with 1 (100.0% in the age bracket) enrolled. Conversely, the age group of 5 to 9 year old has the lowest likelihood of being enrolled in a private school, with 10 (100.0% in the age bracket) attending a public institution.
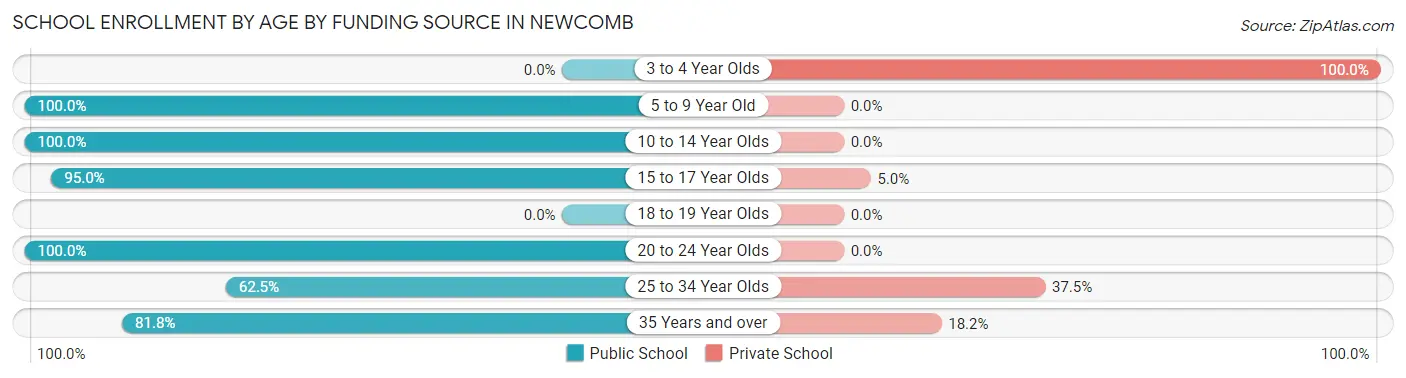
| Age Bracket | Public School | Private School |
| 3 to 4 Year Olds | 0 (0.0%) | 1 (100.0%) |
| 5 to 9 Year Old | 10 (100.0%) | 0 (0.0%) |
| 10 to 14 Year Olds | 16 (100.0%) | 0 (0.0%) |
| 15 to 17 Year Olds | 19 (95.0%) | 1 (5.0%) |
| 18 to 19 Year Olds | 0 (0.0%) | 0 (0.0%) |
| 20 to 24 Year Olds | 12 (100.0%) | 0 (0.0%) |
| 25 to 34 Year Olds | 5 (62.5%) | 3 (37.5%) |
| 35 Years and over | 9 (81.8%) | 2 (18.2%) |
| Total | 71 (91.0%) | 7 (9.0%) |
Educational Attainment by Field of Study in Newcomb
Education (17 | 46.0%), visual & performing arts (7 | 18.9%), science & technology (3 | 8.1%), arts & humanities (3 | 8.1%), and psychology (2 | 5.4%) are the most common fields of study among 37 individuals in Newcomb who have obtained a bachelor's degree or higher.
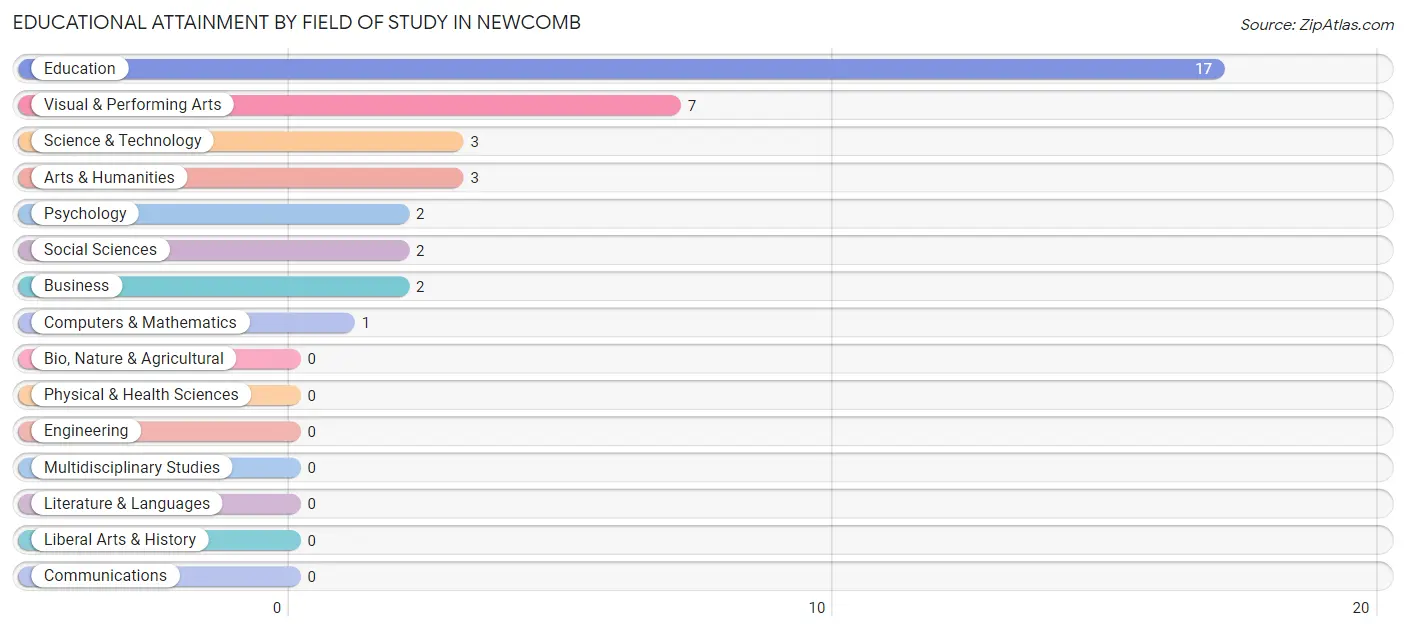
| Field of Study | # Graduates | % Graduates |
| Computers & Mathematics | 1 | 2.7% |
| Bio, Nature & Agricultural | 0 | 0.0% |
| Physical & Health Sciences | 0 | 0.0% |
| Psychology | 2 | 5.4% |
| Social Sciences | 2 | 5.4% |
| Engineering | 0 | 0.0% |
| Multidisciplinary Studies | 0 | 0.0% |
| Science & Technology | 3 | 8.1% |
| Business | 2 | 5.4% |
| Education | 17 | 46.0% |
| Literature & Languages | 0 | 0.0% |
| Liberal Arts & History | 0 | 0.0% |
| Visual & Performing Arts | 7 | 18.9% |
| Communications | 0 | 0.0% |
| Arts & Humanities | 3 | 8.1% |
| Total | 37 | 100.0% |
Transportation & Commute in Newcomb
Vehicle Availability by Sex in Newcomb
The most prevalent vehicle ownership categories in Newcomb are males with 3 vehicles (27, accounting for 36.0%) and females with 3 vehicles (38, making up 33.8%).
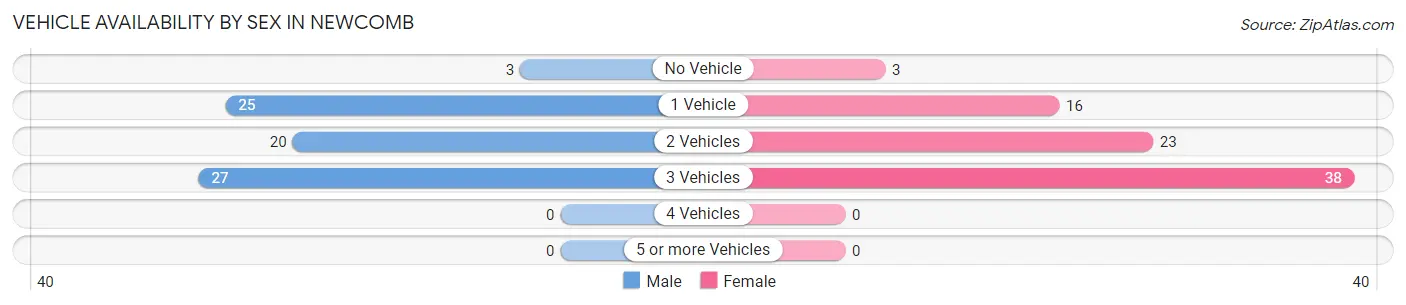
| Vehicles Available | Male | Female |
| No Vehicle | 3 (4.0%) | 3 (3.7%) |
| 1 Vehicle | 25 (33.3%) | 16 (20.0%) |
| 2 Vehicles | 20 (26.7%) | 23 (28.7%) |
| 3 Vehicles | 27 (36.0%) | 38 (47.5%) |
| 4 Vehicles | 0 (0.0%) | 0 (0.0%) |
| 5 or more Vehicles | 0 (0.0%) | 0 (0.0%) |
| Total | 75 (100.0%) | 80 (100.0%) |
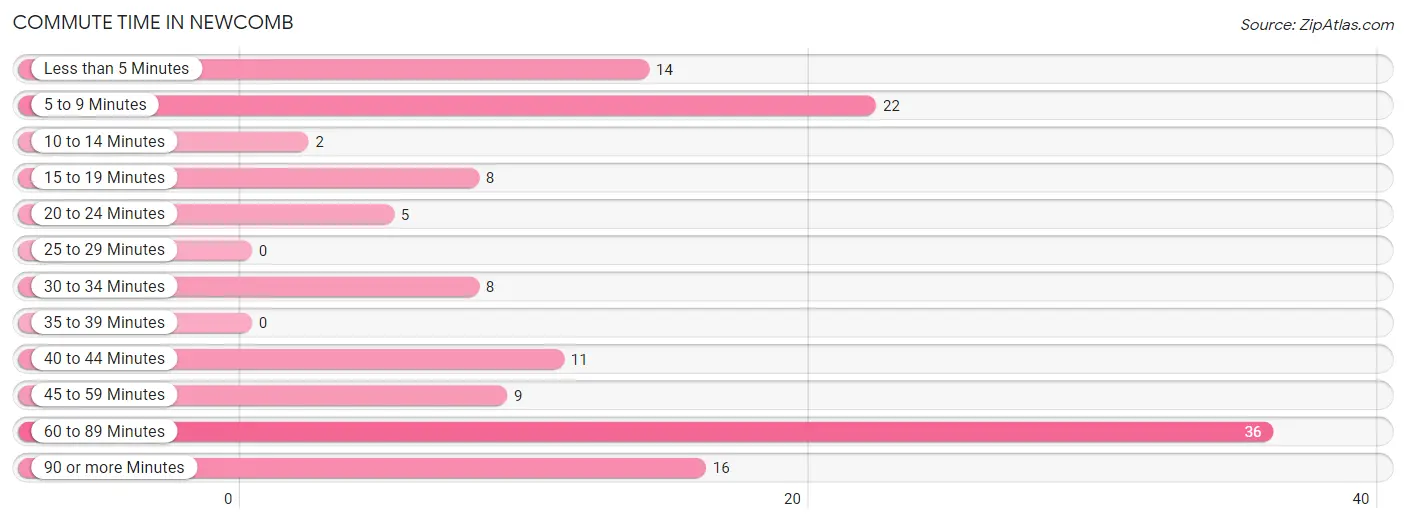
Commute Time in Newcomb
The most frequently occuring commute durations in Newcomb are 60 to 89 minutes (36 commuters, 27.5%), 5 to 9 minutes (22 commuters, 16.8%), and 90 or more minutes (16 commuters, 12.2%).
| Commute Time | # Commuters | % Commuters |
| Less than 5 Minutes | 14 | 10.7% |
| 5 to 9 Minutes | 22 | 16.8% |
| 10 to 14 Minutes | 2 | 1.5% |
| 15 to 19 Minutes | 8 | 6.1% |
| 20 to 24 Minutes | 5 | 3.8% |
| 25 to 29 Minutes | 0 | 0.0% |
| 30 to 34 Minutes | 8 | 6.1% |
| 35 to 39 Minutes | 0 | 0.0% |
| 40 to 44 Minutes | 11 | 8.4% |
| 45 to 59 Minutes | 9 | 6.9% |
| 60 to 89 Minutes | 36 | 27.5% |
| 90 or more Minutes | 16 | 12.2% |
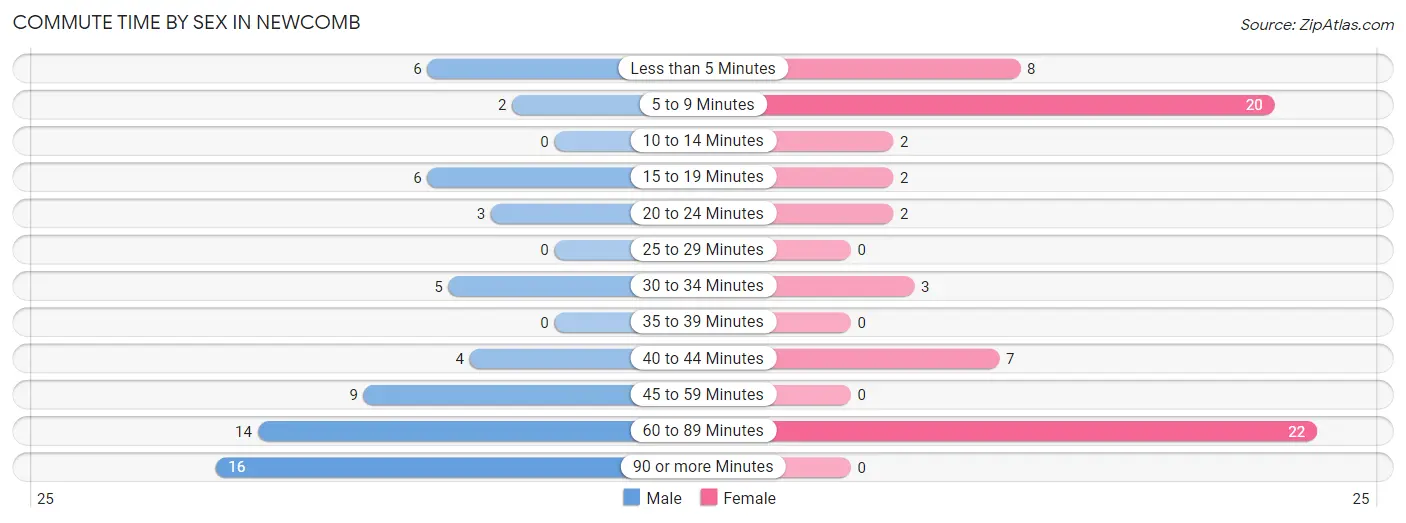
Commute Time by Sex in Newcomb
The most common commute times in Newcomb are 90 or more minutes (16 commuters, 24.6%) for males and 60 to 89 minutes (22 commuters, 33.3%) for females.
| Commute Time | Male | Female |
| Less than 5 Minutes | 6 (9.2%) | 8 (12.1%) |
| 5 to 9 Minutes | 2 (3.1%) | 20 (30.3%) |
| 10 to 14 Minutes | 0 (0.0%) | 2 (3.0%) |
| 15 to 19 Minutes | 6 (9.2%) | 2 (3.0%) |
| 20 to 24 Minutes | 3 (4.6%) | 2 (3.0%) |
| 25 to 29 Minutes | 0 (0.0%) | 0 (0.0%) |
| 30 to 34 Minutes | 5 (7.7%) | 3 (4.5%) |
| 35 to 39 Minutes | 0 (0.0%) | 0 (0.0%) |
| 40 to 44 Minutes | 4 (6.1%) | 7 (10.6%) |
| 45 to 59 Minutes | 9 (13.9%) | 0 (0.0%) |
| 60 to 89 Minutes | 14 (21.5%) | 22 (33.3%) |
| 90 or more Minutes | 16 (24.6%) | 0 (0.0%) |
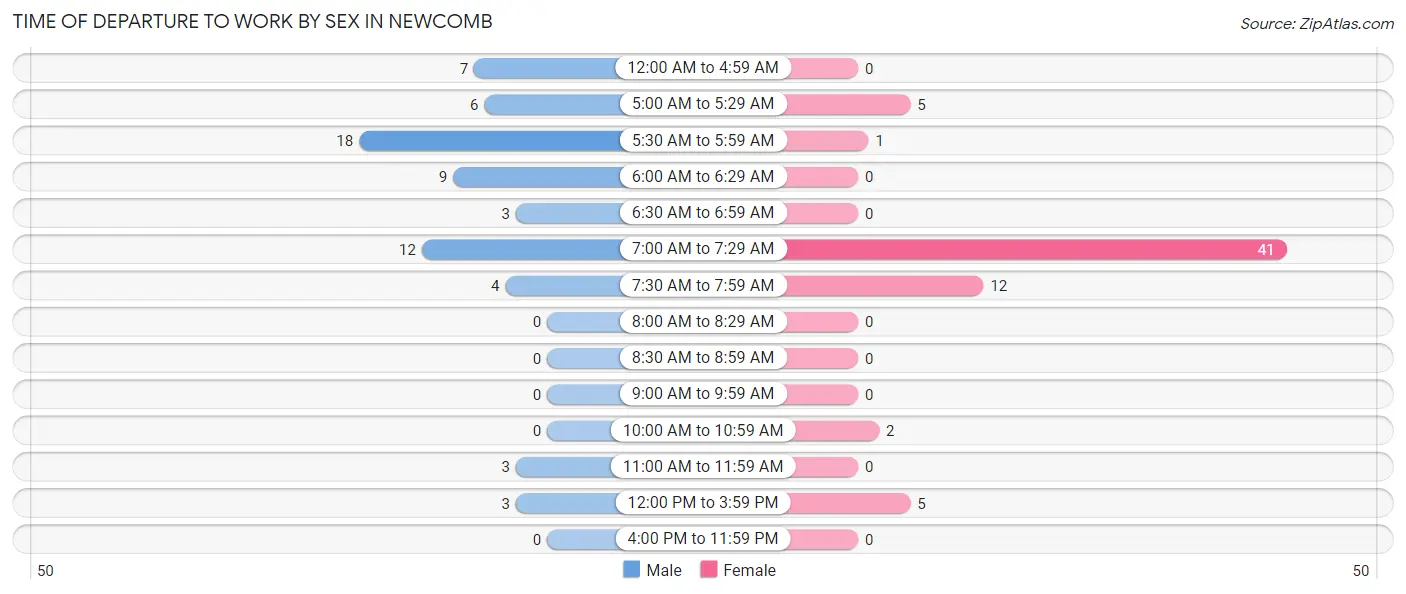
Time of Departure to Work by Sex in Newcomb
The most frequent times of departure to work in Newcomb are 5:30 AM to 5:59 AM (18, 27.7%) for males and 7:00 AM to 7:29 AM (41, 62.1%) for females.
| Time of Departure | Male | Female |
| 12:00 AM to 4:59 AM | 7 (10.8%) | 0 (0.0%) |
| 5:00 AM to 5:29 AM | 6 (9.2%) | 5 (7.6%) |
| 5:30 AM to 5:59 AM | 18 (27.7%) | 1 (1.5%) |
| 6:00 AM to 6:29 AM | 9 (13.9%) | 0 (0.0%) |
| 6:30 AM to 6:59 AM | 3 (4.6%) | 0 (0.0%) |
| 7:00 AM to 7:29 AM | 12 (18.5%) | 41 (62.1%) |
| 7:30 AM to 7:59 AM | 4 (6.1%) | 12 (18.2%) |
| 8:00 AM to 8:29 AM | 0 (0.0%) | 0 (0.0%) |
| 8:30 AM to 8:59 AM | 0 (0.0%) | 0 (0.0%) |
| 9:00 AM to 9:59 AM | 0 (0.0%) | 0 (0.0%) |
| 10:00 AM to 10:59 AM | 0 (0.0%) | 2 (3.0%) |
| 11:00 AM to 11:59 AM | 3 (4.6%) | 0 (0.0%) |
| 12:00 PM to 3:59 PM | 3 (4.6%) | 5 (7.6%) |
| 4:00 PM to 11:59 PM | 0 (0.0%) | 0 (0.0%) |
| Total | 65 (100.0%) | 66 (100.0%) |
Housing Occupancy in Newcomb
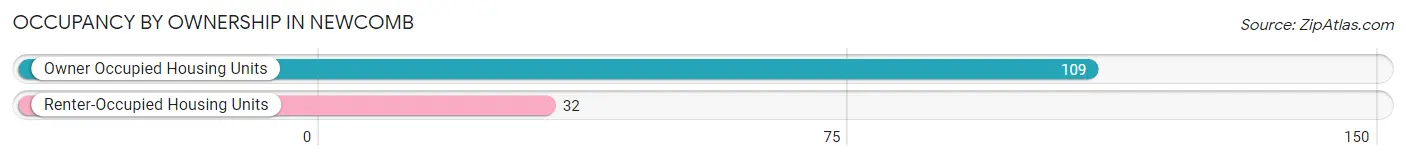
Occupancy by Ownership in Newcomb
Of the total 141 dwellings in Newcomb, owner-occupied units account for 109 (77.3%), while renter-occupied units make up 32 (22.7%).
| Occupancy | # Housing Units | % Housing Units |
| Owner Occupied Housing Units | 109 | 77.3% |
| Renter-Occupied Housing Units | 32 | 22.7% |
| Total Occupied Housing Units | 141 | 100.0% |
Occupancy by Household Size in Newcomb
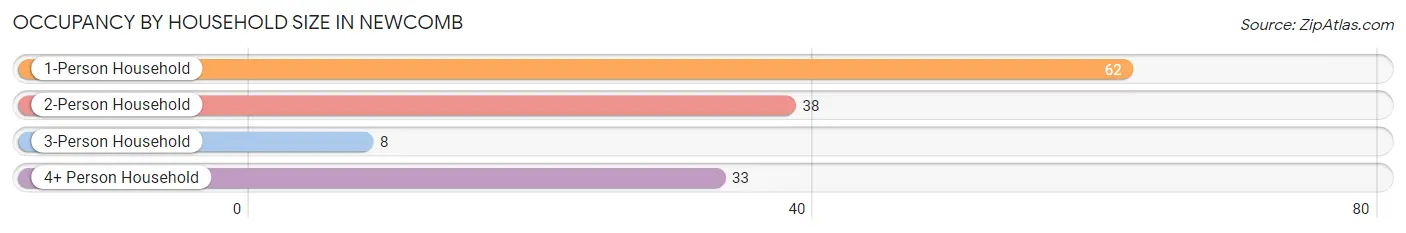
| Household Size | # Housing Units | % Housing Units |
| 1-Person Household | 62 | 44.0% |
| 2-Person Household | 38 | 27.0% |
| 3-Person Household | 8 | 5.7% |
| 4+ Person Household | 33 | 23.4% |
| Total Housing Units | 141 | 100.0% |
Occupancy by Ownership by Household Size in Newcomb
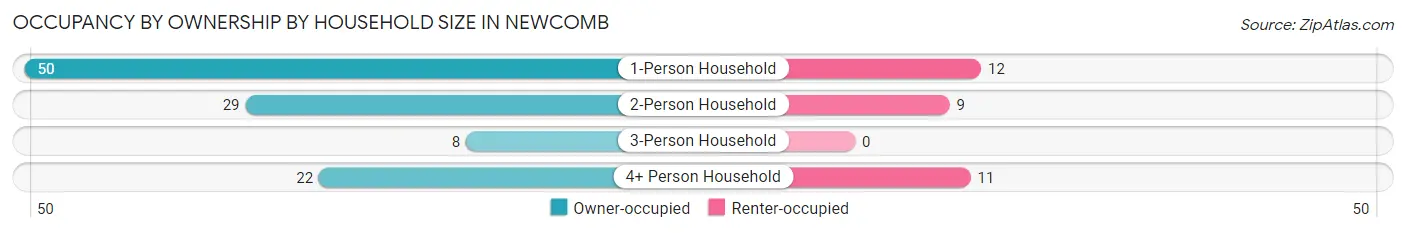
| Household Size | Owner-occupied | Renter-occupied |
| 1-Person Household | 50 (80.6%) | 12 (19.4%) |
| 2-Person Household | 29 (76.3%) | 9 (23.7%) |
| 3-Person Household | 8 (100.0%) | 0 (0.0%) |
| 4+ Person Household | 22 (66.7%) | 11 (33.3%) |
| Total Housing Units | 109 (77.3%) | 32 (22.7%) |
Occupancy by Educational Attainment in Newcomb
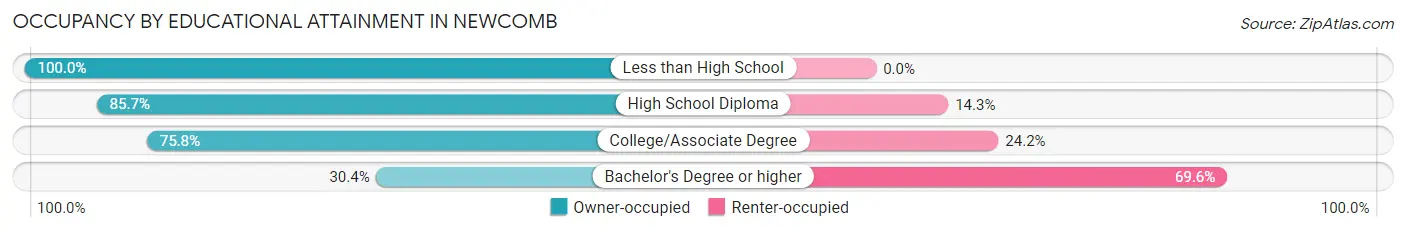
| Household Size | Owner-occupied | Renter-occupied |
| Less than High School | 29 (100.0%) | 0 (0.0%) |
| High School Diploma | 48 (85.7%) | 8 (14.3%) |
| College/Associate Degree | 25 (75.8%) | 8 (24.2%) |
| Bachelor's Degree or higher | 7 (30.4%) | 16 (69.6%) |
Occupancy by Age of Householder in Newcomb
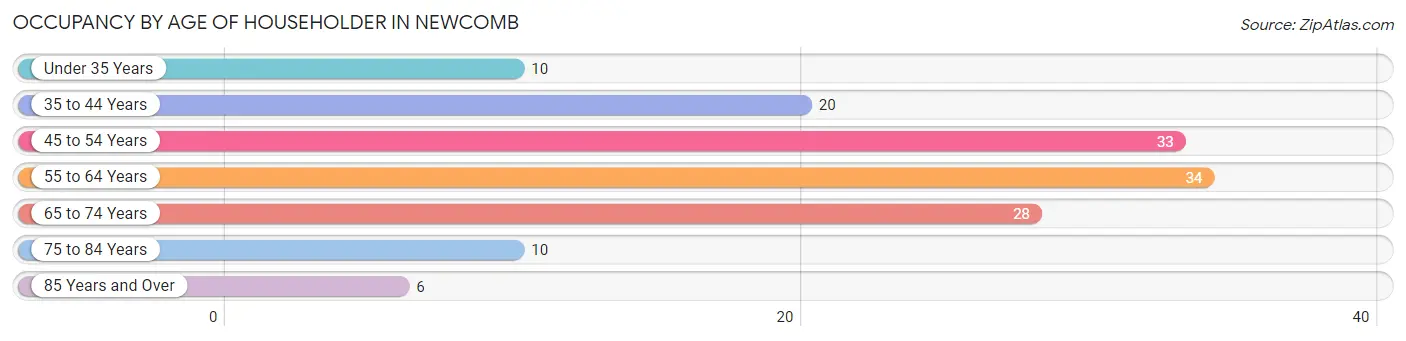
| Age Bracket | # Households | % Households |
| Under 35 Years | 10 | 7.1% |
| 35 to 44 Years | 20 | 14.2% |
| 45 to 54 Years | 33 | 23.4% |
| 55 to 64 Years | 34 | 24.1% |
| 65 to 74 Years | 28 | 19.9% |
| 75 to 84 Years | 10 | 7.1% |
| 85 Years and Over | 6 | 4.3% |
| Total | 141 | 100.0% |
Housing Finances in Newcomb
Median Income by Occupancy in Newcomb
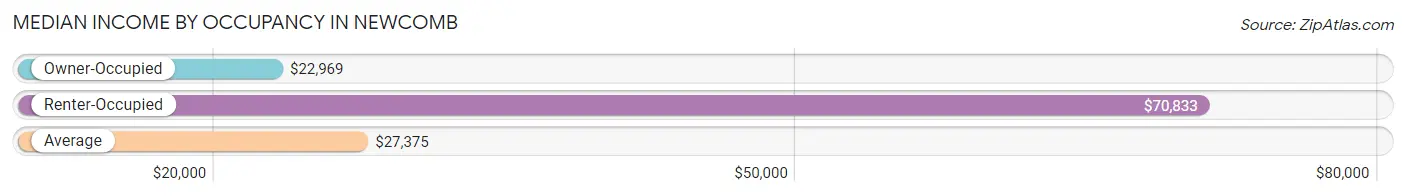
| Occupancy Type | # Households | Median Income |
| Owner-Occupied | 109 (77.3%) | $22,969 |
| Renter-Occupied | 32 (22.7%) | $70,833 |
| Average | 141 (100.0%) | $27,375 |
Occupancy by Householder Income Bracket in Newcomb
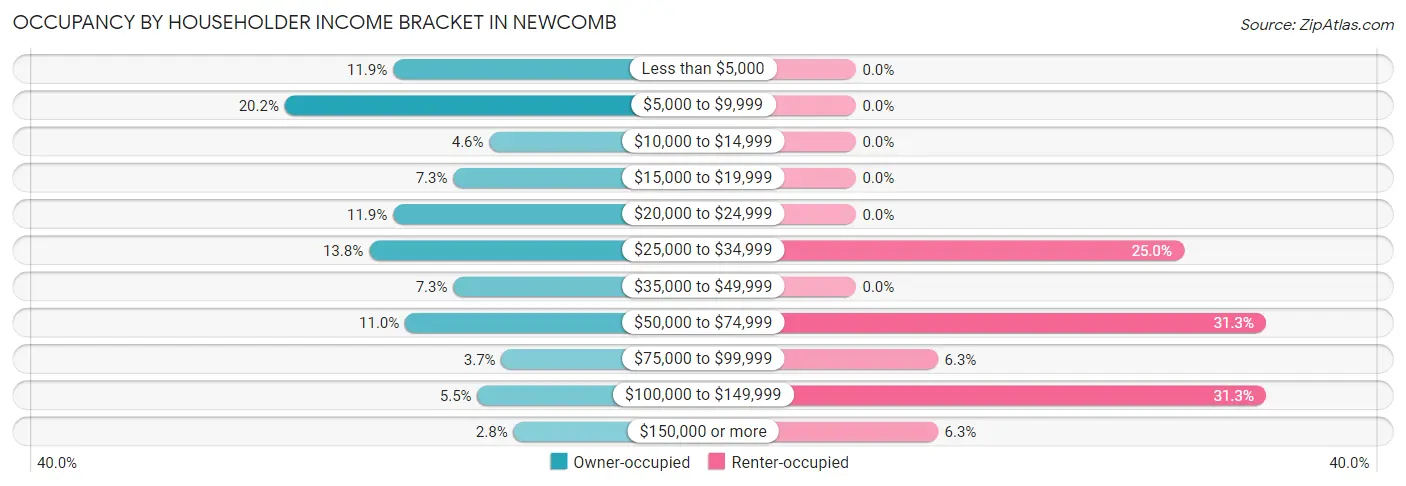
| Income Bracket | Owner-occupied | Renter-occupied |
| Less than $5,000 | 13 (11.9%) | 0 (0.0%) |
| $5,000 to $9,999 | 22 (20.2%) | 0 (0.0%) |
| $10,000 to $14,999 | 5 (4.6%) | 0 (0.0%) |
| $15,000 to $19,999 | 8 (7.3%) | 0 (0.0%) |
| $20,000 to $24,999 | 13 (11.9%) | 0 (0.0%) |
| $25,000 to $34,999 | 15 (13.8%) | 8 (25.0%) |
| $35,000 to $49,999 | 8 (7.3%) | 0 (0.0%) |
| $50,000 to $74,999 | 12 (11.0%) | 10 (31.2%) |
| $75,000 to $99,999 | 4 (3.7%) | 2 (6.2%) |
| $100,000 to $149,999 | 6 (5.5%) | 10 (31.2%) |
| $150,000 or more | 3 (2.8%) | 2 (6.2%) |
| Total | 109 (100.0%) | 32 (100.0%) |
Monthly Housing Cost Tiers in Newcomb
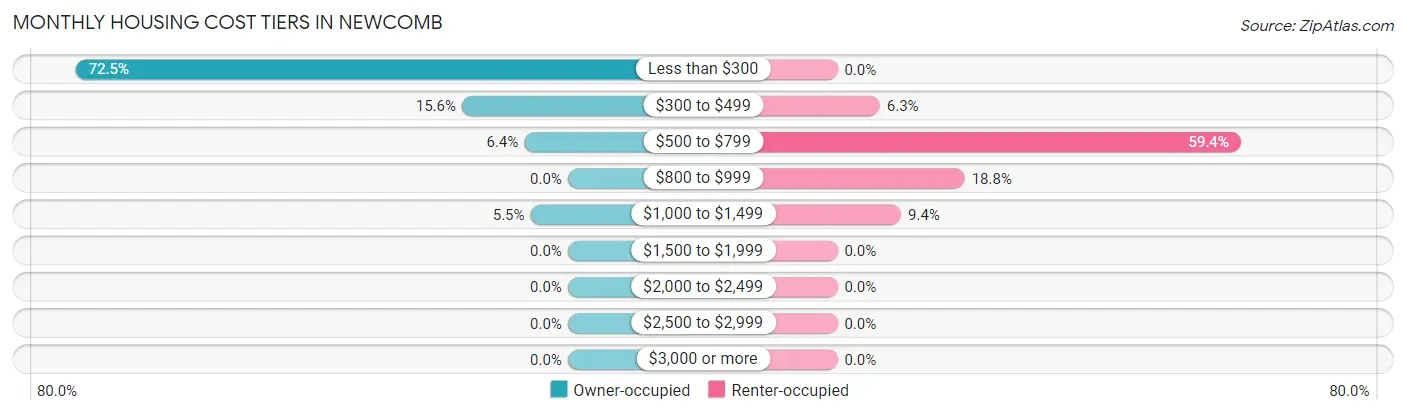
| Monthly Cost | Owner-occupied | Renter-occupied |
| Less than $300 | 79 (72.5%) | 0 (0.0%) |
| $300 to $499 | 17 (15.6%) | 2 (6.2%) |
| $500 to $799 | 7 (6.4%) | 19 (59.4%) |
| $800 to $999 | 0 (0.0%) | 6 (18.8%) |
| $1,000 to $1,499 | 6 (5.5%) | 3 (9.4%) |
| $1,500 to $1,999 | 0 (0.0%) | 0 (0.0%) |
| $2,000 to $2,499 | 0 (0.0%) | 0 (0.0%) |
| $2,500 to $2,999 | 0 (0.0%) | 0 (0.0%) |
| $3,000 or more | 0 (0.0%) | 0 (0.0%) |
| Total | 109 (100.0%) | 32 (100.0%) |
Physical Housing Characteristics in Newcomb
Housing Structures in Newcomb
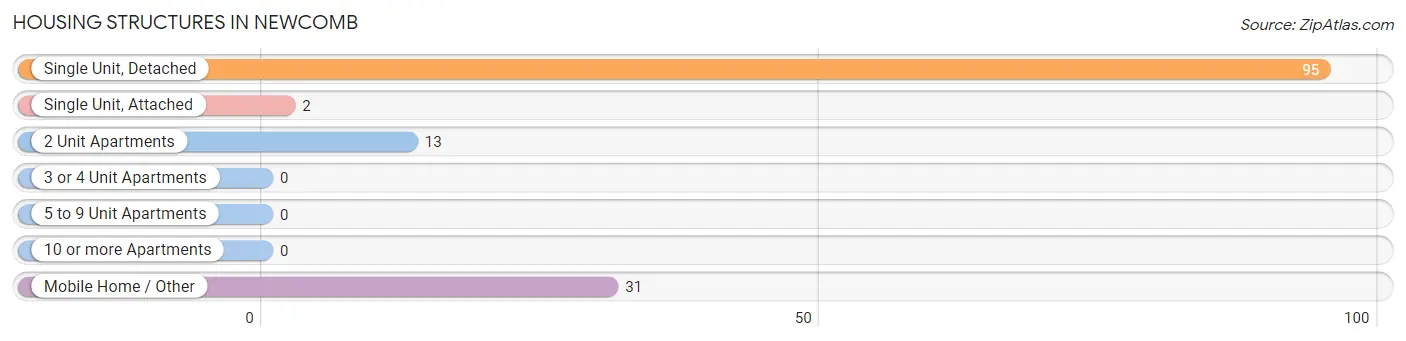
| Structure Type | # Housing Units | % Housing Units |
| Single Unit, Detached | 95 | 67.4% |
| Single Unit, Attached | 2 | 1.4% |
| 2 Unit Apartments | 13 | 9.2% |
| 3 or 4 Unit Apartments | 0 | 0.0% |
| 5 to 9 Unit Apartments | 0 | 0.0% |
| 10 or more Apartments | 0 | 0.0% |
| Mobile Home / Other | 31 | 22.0% |
| Total | 141 | 100.0% |
Housing Structures by Occupancy in Newcomb
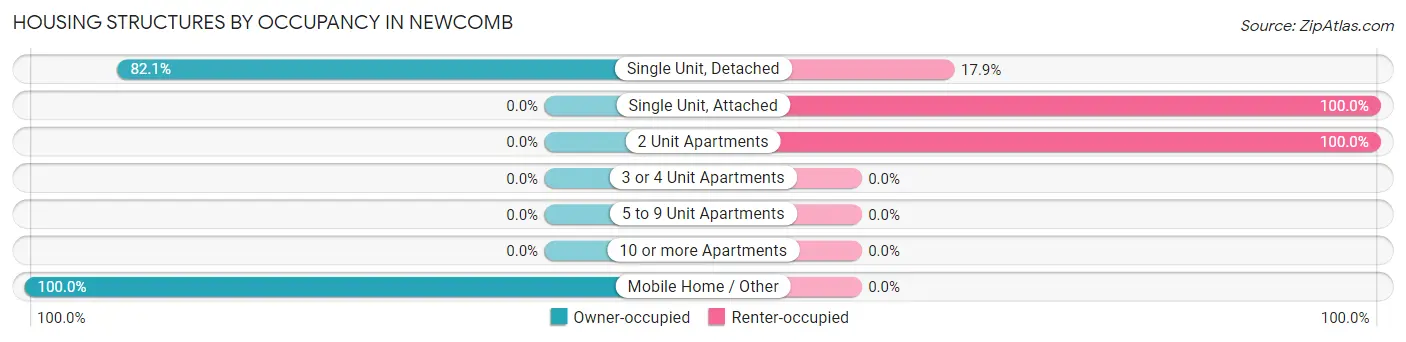
| Structure Type | Owner-occupied | Renter-occupied |
| Single Unit, Detached | 78 (82.1%) | 17 (17.9%) |
| Single Unit, Attached | 0 (0.0%) | 2 (100.0%) |
| 2 Unit Apartments | 0 (0.0%) | 13 (100.0%) |
| 3 or 4 Unit Apartments | 0 (0.0%) | 0 (0.0%) |
| 5 to 9 Unit Apartments | 0 (0.0%) | 0 (0.0%) |
| 10 or more Apartments | 0 (0.0%) | 0 (0.0%) |
| Mobile Home / Other | 31 (100.0%) | 0 (0.0%) |
| Total | 109 (77.3%) | 32 (22.7%) |
Housing Structures by Number of Rooms in Newcomb
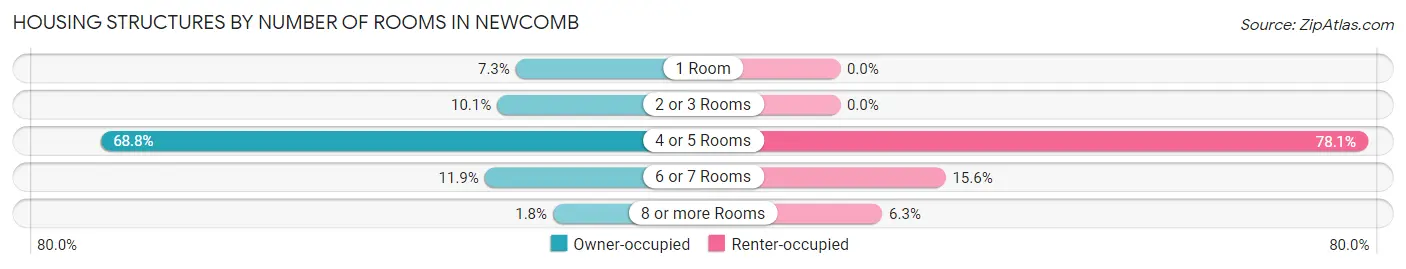
| Number of Rooms | Owner-occupied | Renter-occupied |
| 1 Room | 8 (7.3%) | 0 (0.0%) |
| 2 or 3 Rooms | 11 (10.1%) | 0 (0.0%) |
| 4 or 5 Rooms | 75 (68.8%) | 25 (78.1%) |
| 6 or 7 Rooms | 13 (11.9%) | 5 (15.6%) |
| 8 or more Rooms | 2 (1.8%) | 2 (6.2%) |
| Total | 109 (100.0%) | 32 (100.0%) |
Housing Structure by Heating Type in Newcomb
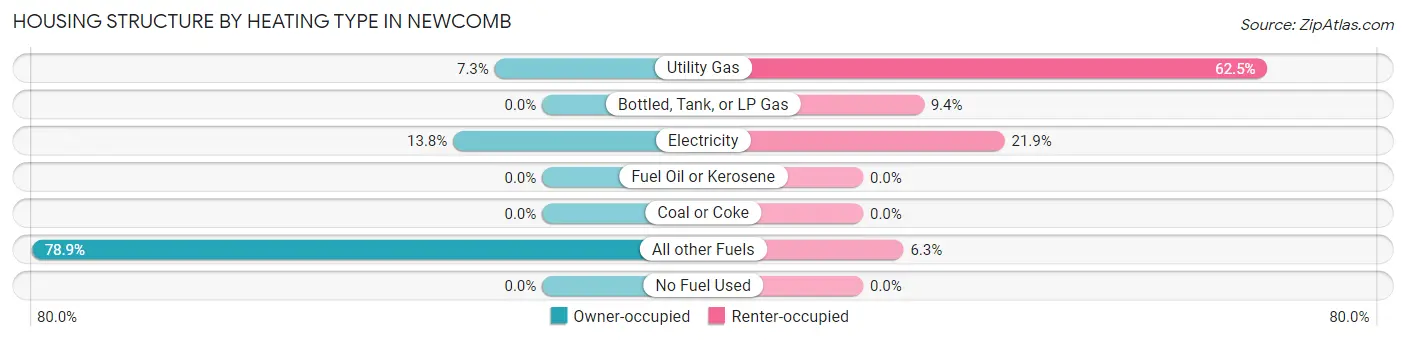
| Heating Type | Owner-occupied | Renter-occupied |
| Utility Gas | 8 (7.3%) | 20 (62.5%) |
| Bottled, Tank, or LP Gas | 0 (0.0%) | 3 (9.4%) |
| Electricity | 15 (13.8%) | 7 (21.9%) |
| Fuel Oil or Kerosene | 0 (0.0%) | 0 (0.0%) |
| Coal or Coke | 0 (0.0%) | 0 (0.0%) |
| All other Fuels | 86 (78.9%) | 2 (6.2%) |
| No Fuel Used | 0 (0.0%) | 0 (0.0%) |
| Total | 109 (100.0%) | 32 (100.0%) |
Household Vehicle Usage in Newcomb
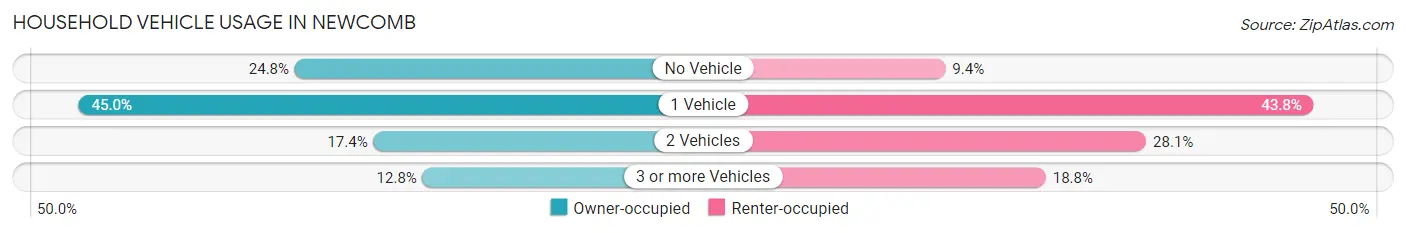
| Vehicles per Household | Owner-occupied | Renter-occupied |
| No Vehicle | 27 (24.8%) | 3 (9.4%) |
| 1 Vehicle | 49 (45.0%) | 14 (43.8%) |
| 2 Vehicles | 19 (17.4%) | 9 (28.1%) |
| 3 or more Vehicles | 14 (12.8%) | 6 (18.8%) |
| Total | 109 (100.0%) | 32 (100.0%) |
Real Estate & Mortgages in Newcomb
Real Estate and Mortgage Overview in Newcomb
| Characteristic | Without Mortgage | With Mortgage |
| Housing Units | 102 | 7 |
| Median Property Value | $21,700 | $118,800 |
| Median Household Income | $22,813 | $0 |
| Monthly Housing Costs | $200 | $0 |
| Real Estate Taxes | $199 | $5 |
Property Value by Mortgage Status in Newcomb
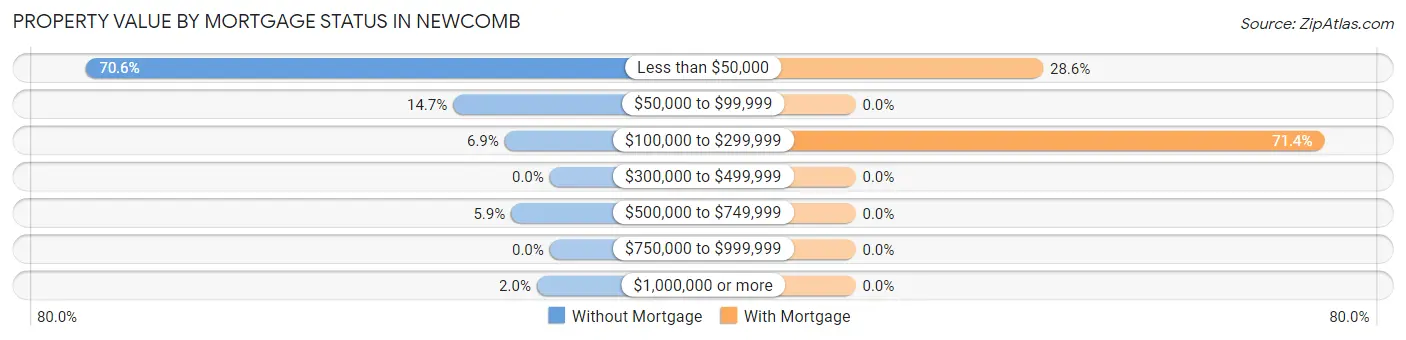
| Property Value | Without Mortgage | With Mortgage |
| Less than $50,000 | 72 (70.6%) | 2 (28.6%) |
| $50,000 to $99,999 | 15 (14.7%) | 0 (0.0%) |
| $100,000 to $299,999 | 7 (6.9%) | 5 (71.4%) |
| $300,000 to $499,999 | 0 (0.0%) | 0 (0.0%) |
| $500,000 to $749,999 | 6 (5.9%) | 0 (0.0%) |
| $750,000 to $999,999 | 0 (0.0%) | 0 (0.0%) |
| $1,000,000 or more | 2 (2.0%) | 0 (0.0%) |
| Total | 102 (100.0%) | 7 (100.0%) |
Household Income by Mortgage Status in Newcomb
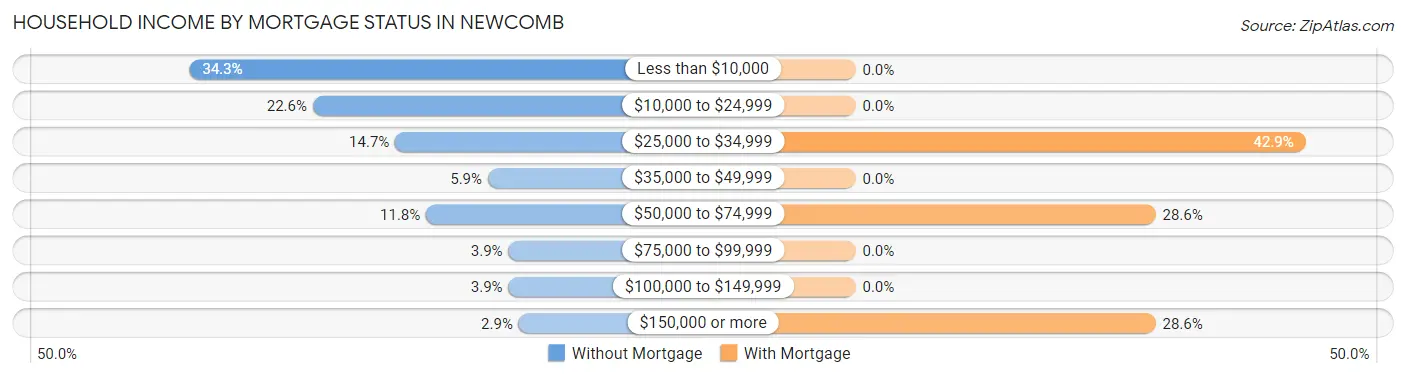
| Household Income | Without Mortgage | With Mortgage |
| Less than $10,000 | 35 (34.3%) | 0 (0.0%) |
| $10,000 to $24,999 | 23 (22.6%) | 0 (0.0%) |
| $25,000 to $34,999 | 15 (14.7%) | 3 (42.9%) |
| $35,000 to $49,999 | 6 (5.9%) | 0 (0.0%) |
| $50,000 to $74,999 | 12 (11.8%) | 2 (28.6%) |
| $75,000 to $99,999 | 4 (3.9%) | 0 (0.0%) |
| $100,000 to $149,999 | 4 (3.9%) | 0 (0.0%) |
| $150,000 or more | 3 (2.9%) | 2 (28.6%) |
| Total | 102 (100.0%) | 7 (100.0%) |
Property Value to Household Income Ratio in Newcomb
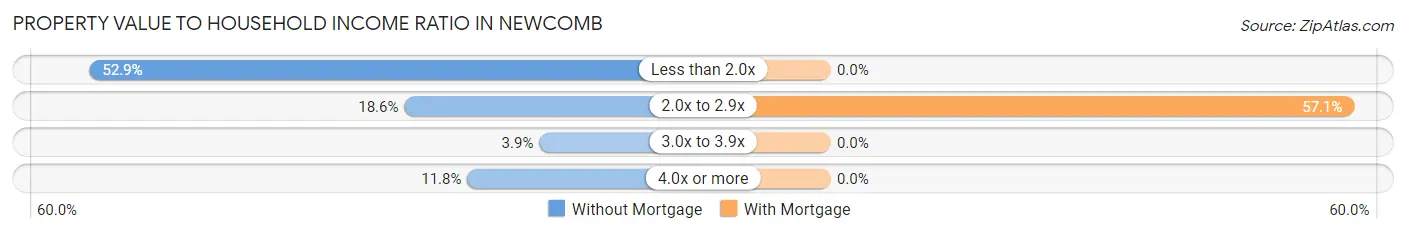
| Value-to-Income Ratio | Without Mortgage | With Mortgage |
| Less than 2.0x | 54 (52.9%) | 0 (0.0%) |
| 2.0x to 2.9x | 19 (18.6%) | 4 (57.1%) |
| 3.0x to 3.9x | 4 (3.9%) | 0 (0.0%) |
| 4.0x or more | 12 (11.8%) | 0 (0.0%) |
| Total | 102 (100.0%) | 7 (100.0%) |
Real Estate Taxes by Mortgage Status in Newcomb
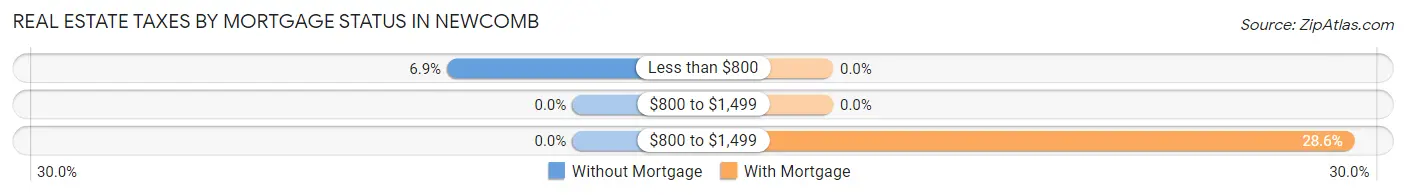
| Property Taxes | Without Mortgage | With Mortgage |
| Less than $800 | 7 (6.9%) | 0 (0.0%) |
| $800 to $1,499 | 0 (0.0%) | 0 (0.0%) |
| $800 to $1,499 | 0 (0.0%) | 2 (28.6%) |
| Total | 102 (100.0%) | 7 (100.0%) |
Health & Disability in Newcomb
Health Insurance Coverage by Age in Newcomb
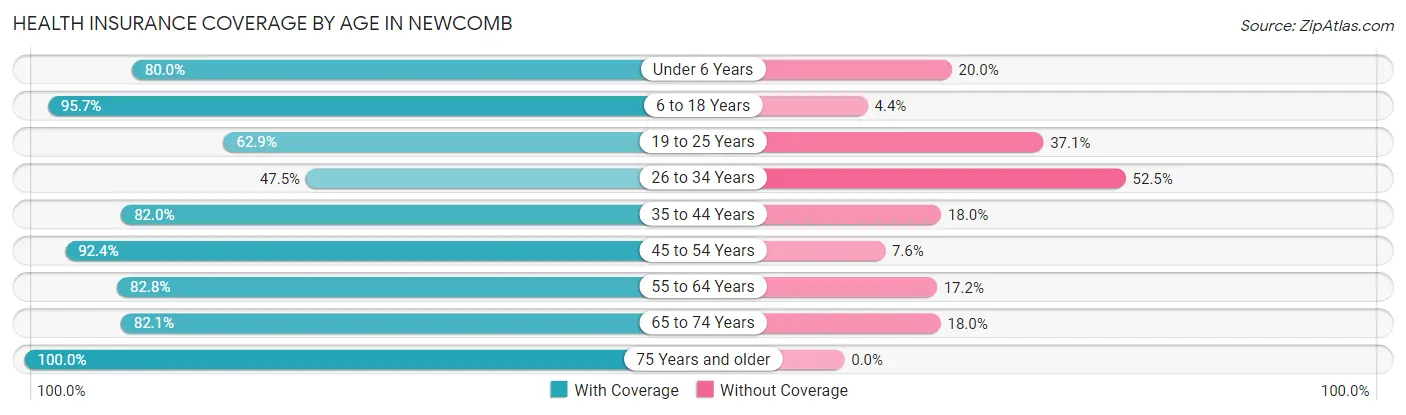
| Age Bracket | With Coverage | Without Coverage |
| Under 6 Years | 12 (80.0%) | 3 (20.0%) |
| 6 to 18 Years | 44 (95.7%) | 2 (4.3%) |
| 19 to 25 Years | 39 (62.9%) | 23 (37.1%) |
| 26 to 34 Years | 29 (47.5%) | 32 (52.5%) |
| 35 to 44 Years | 50 (82.0%) | 11 (18.0%) |
| 45 to 54 Years | 61 (92.4%) | 5 (7.6%) |
| 55 to 64 Years | 48 (82.8%) | 10 (17.2%) |
| 65 to 74 Years | 32 (82.1%) | 7 (17.9%) |
| 75 Years and older | 27 (100.0%) | 0 (0.0%) |
| Total | 342 (78.6%) | 93 (21.4%) |
Health Insurance Coverage by Citizenship Status in Newcomb
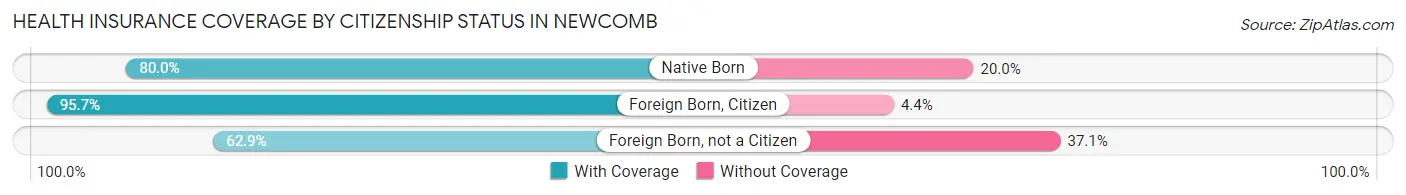
| Citizenship Status | With Coverage | Without Coverage |
| Native Born | 12 (80.0%) | 3 (20.0%) |
| Foreign Born, Citizen | 44 (95.7%) | 2 (4.3%) |
| Foreign Born, not a Citizen | 39 (62.9%) | 23 (37.1%) |
Health Insurance Coverage by Household Income in Newcomb
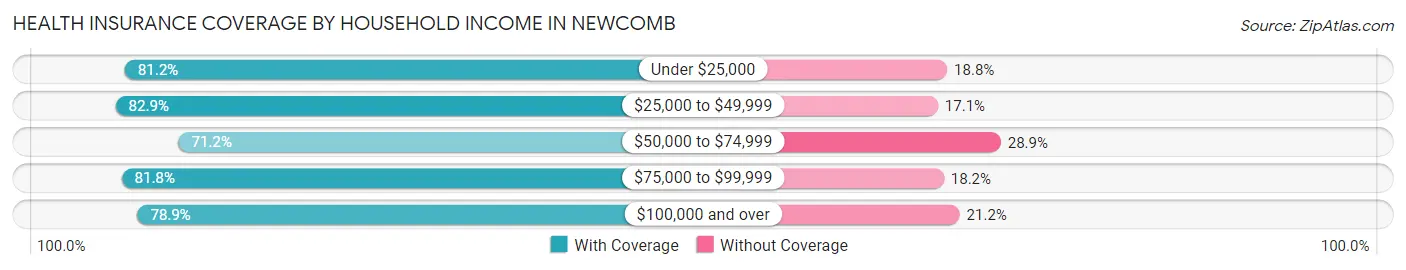
| Household Income | With Coverage | Without Coverage |
| Under $25,000 | 108 (81.2%) | 25 (18.8%) |
| $25,000 to $49,999 | 68 (82.9%) | 14 (17.1%) |
| $50,000 to $74,999 | 74 (71.2%) | 30 (28.8%) |
| $75,000 to $99,999 | 9 (81.8%) | 2 (18.2%) |
| $100,000 and over | 82 (78.8%) | 22 (21.1%) |
Public vs Private Health Insurance Coverage by Age in Newcomb
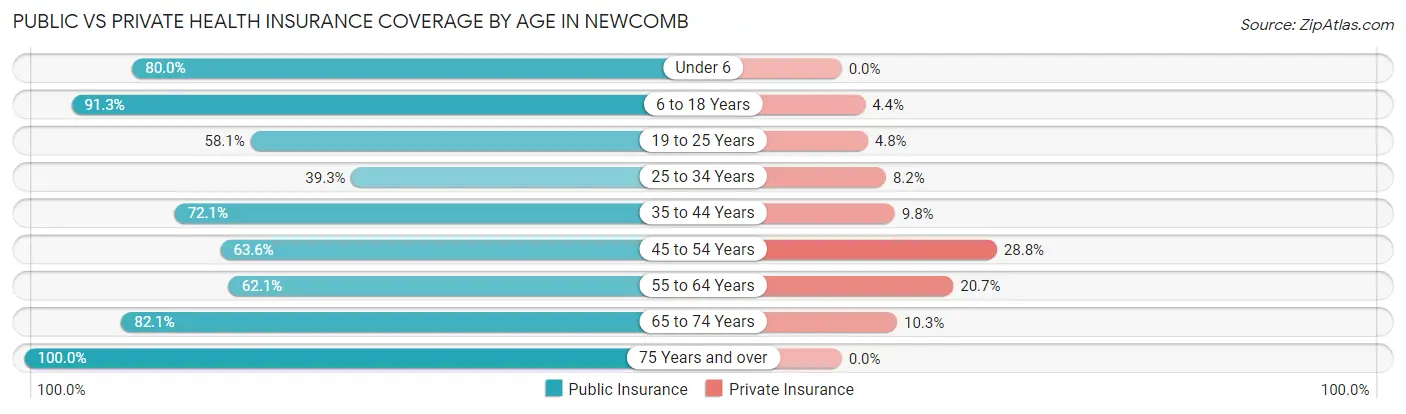
| Age Bracket | Public Insurance | Private Insurance |
| Under 6 | 12 (80.0%) | 0 (0.0%) |
| 6 to 18 Years | 42 (91.3%) | 2 (4.3%) |
| 19 to 25 Years | 36 (58.1%) | 3 (4.8%) |
| 25 to 34 Years | 24 (39.3%) | 5 (8.2%) |
| 35 to 44 Years | 44 (72.1%) | 6 (9.8%) |
| 45 to 54 Years | 42 (63.6%) | 19 (28.8%) |
| 55 to 64 Years | 36 (62.1%) | 12 (20.7%) |
| 65 to 74 Years | 32 (82.1%) | 4 (10.3%) |
| 75 Years and over | 27 (100.0%) | 0 (0.0%) |
| Total | 295 (67.8%) | 51 (11.7%) |
Disability Status by Sex by Age in Newcomb
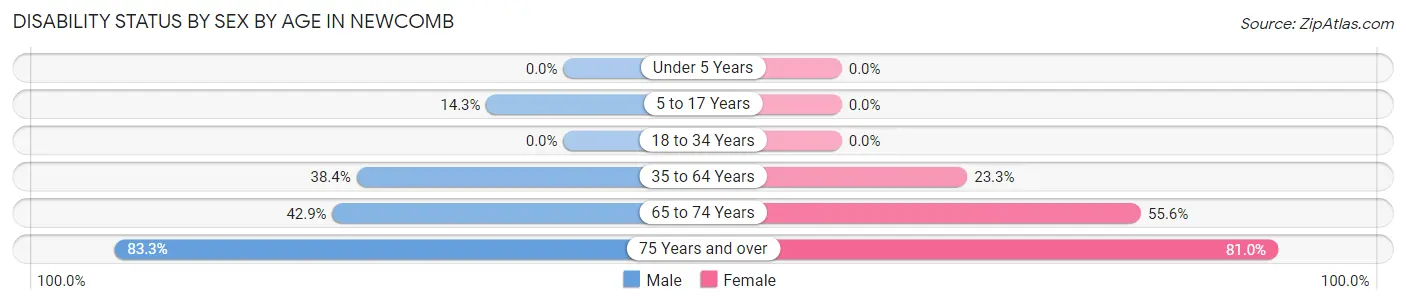
| Age Bracket | Male | Female |
| Under 5 Years | 0 (0.0%) | 0 (0.0%) |
| 5 to 17 Years | 3 (14.3%) | 0 (0.0%) |
| 18 to 34 Years | 0 (0.0%) | 0 (0.0%) |
| 35 to 64 Years | 43 (38.4%) | 17 (23.3%) |
| 65 to 74 Years | 9 (42.9%) | 10 (55.6%) |
| 75 Years and over | 5 (83.3%) | 17 (80.9%) |
Disability Class by Sex by Age in Newcomb
Disability Class: Hearing Difficulty
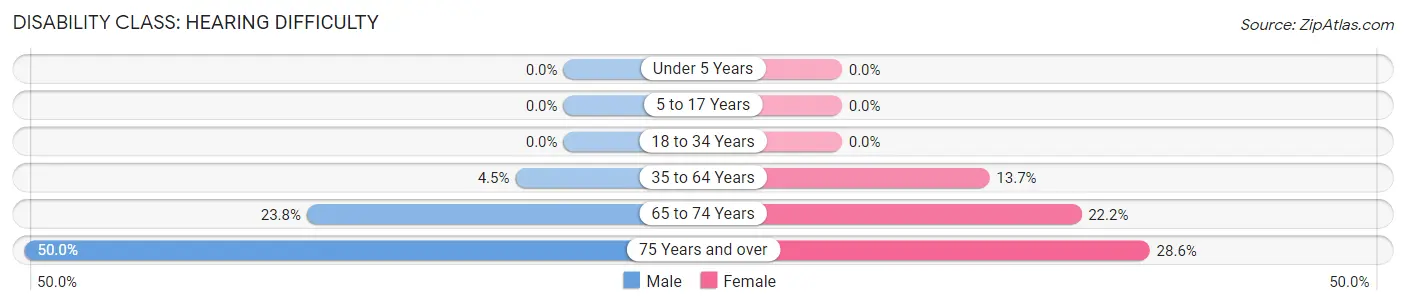
| Age Bracket | Male | Female |
| Under 5 Years | 0 (0.0%) | 0 (0.0%) |
| 5 to 17 Years | 0 (0.0%) | 0 (0.0%) |
| 18 to 34 Years | 0 (0.0%) | 0 (0.0%) |
| 35 to 64 Years | 5 (4.5%) | 10 (13.7%) |
| 65 to 74 Years | 5 (23.8%) | 4 (22.2%) |
| 75 Years and over | 3 (50.0%) | 6 (28.6%) |
Disability Class: Vision Difficulty
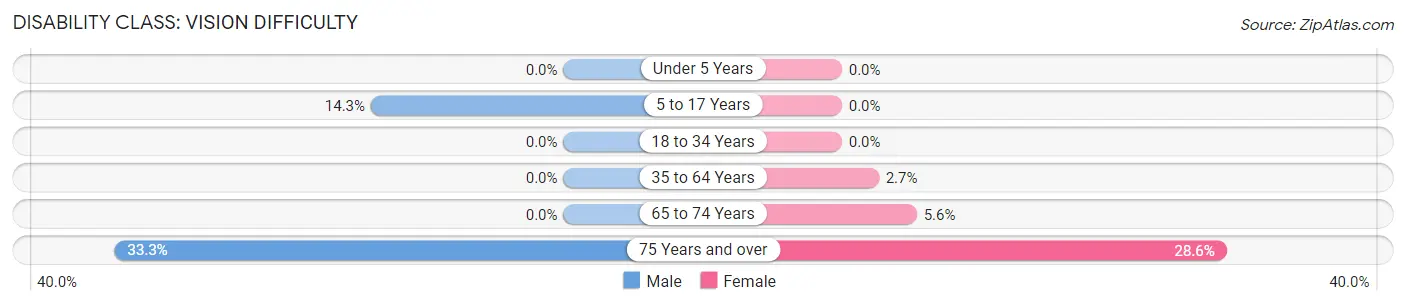
| Age Bracket | Male | Female |
| Under 5 Years | 0 (0.0%) | 0 (0.0%) |
| 5 to 17 Years | 3 (14.3%) | 0 (0.0%) |
| 18 to 34 Years | 0 (0.0%) | 0 (0.0%) |
| 35 to 64 Years | 0 (0.0%) | 2 (2.7%) |
| 65 to 74 Years | 0 (0.0%) | 1 (5.6%) |
| 75 Years and over | 2 (33.3%) | 6 (28.6%) |
Disability Class: Cognitive Difficulty
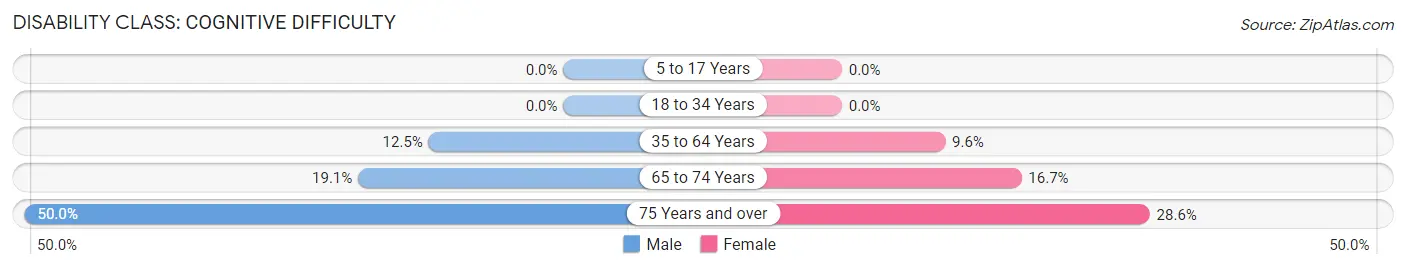
| Age Bracket | Male | Female |
| 5 to 17 Years | 0 (0.0%) | 0 (0.0%) |
| 18 to 34 Years | 0 (0.0%) | 0 (0.0%) |
| 35 to 64 Years | 14 (12.5%) | 7 (9.6%) |
| 65 to 74 Years | 4 (19.1%) | 3 (16.7%) |
| 75 Years and over | 3 (50.0%) | 6 (28.6%) |
Disability Class: Ambulatory Difficulty
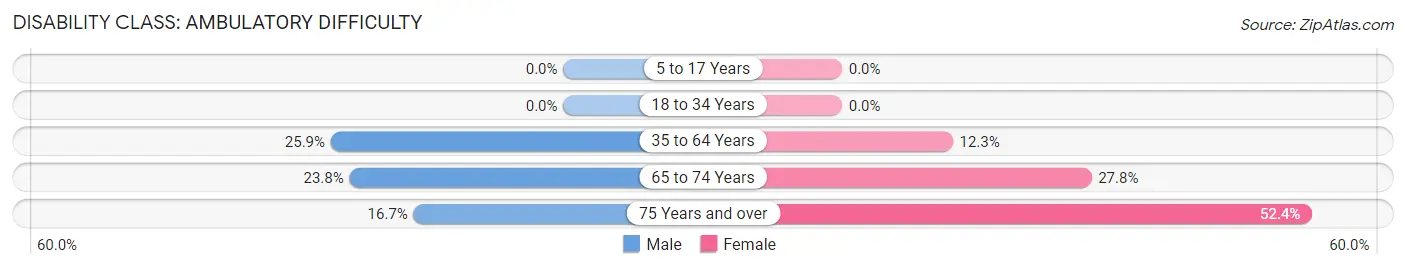
| Age Bracket | Male | Female |
| 5 to 17 Years | 0 (0.0%) | 0 (0.0%) |
| 18 to 34 Years | 0 (0.0%) | 0 (0.0%) |
| 35 to 64 Years | 29 (25.9%) | 9 (12.3%) |
| 65 to 74 Years | 5 (23.8%) | 5 (27.8%) |
| 75 Years and over | 1 (16.7%) | 11 (52.4%) |
Disability Class: Self-Care Difficulty
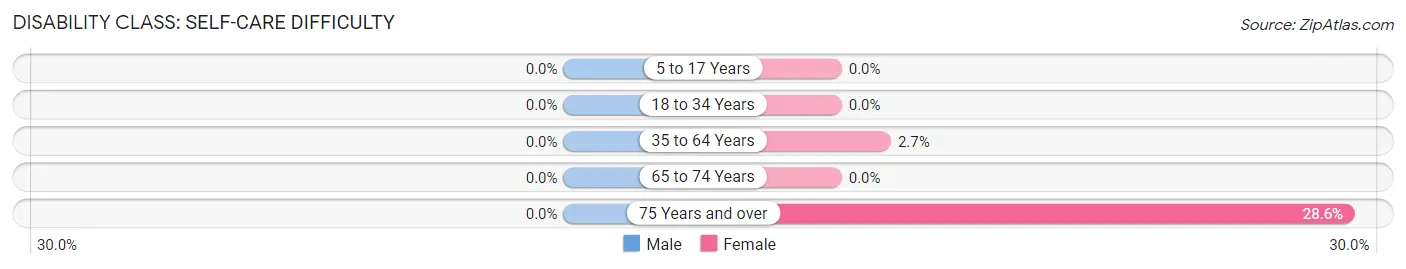
| Age Bracket | Male | Female |
| 5 to 17 Years | 0 (0.0%) | 0 (0.0%) |
| 18 to 34 Years | 0 (0.0%) | 0 (0.0%) |
| 35 to 64 Years | 0 (0.0%) | 2 (2.7%) |
| 65 to 74 Years | 0 (0.0%) | 0 (0.0%) |
| 75 Years and over | 0 (0.0%) | 6 (28.6%) |
Technology Access in Newcomb
Computing Device Access in Newcomb
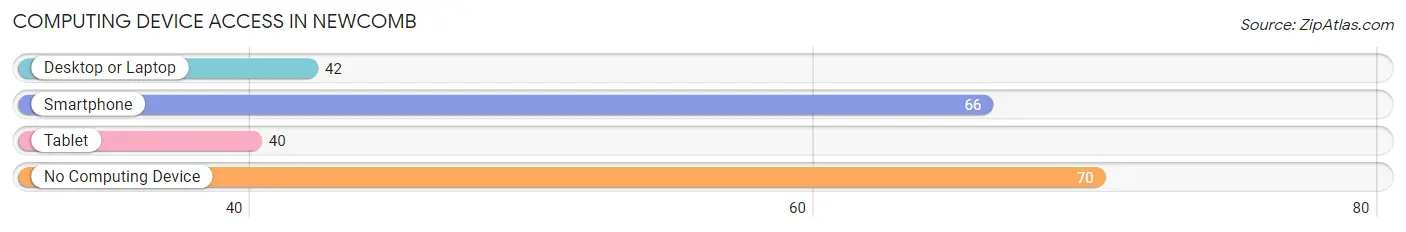
| Device Type | # Households | % Households |
| Desktop or Laptop | 42 | 29.8% |
| Smartphone | 66 | 46.8% |
| Tablet | 40 | 28.4% |
| No Computing Device | 70 | 49.6% |
| Total | 141 | 100.0% |
Internet Access in Newcomb
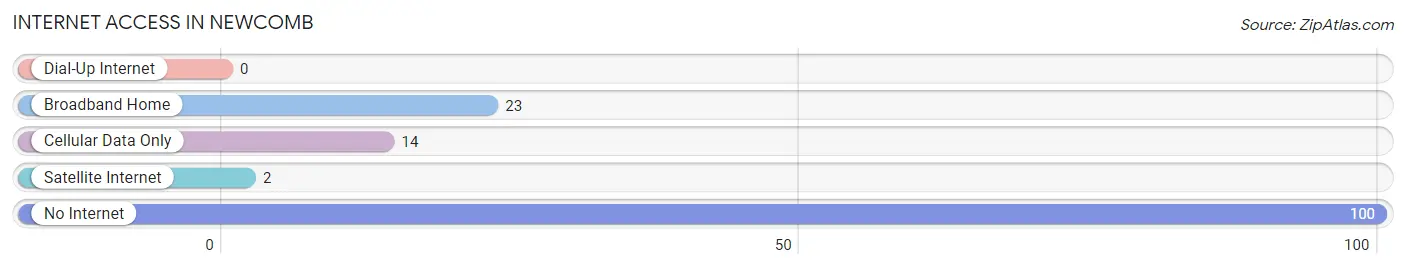
| Internet Type | # Households | % Households |
| Dial-Up Internet | 0 | 0.0% |
| Broadband Home | 23 | 16.3% |
| Cellular Data Only | 14 | 9.9% |
| Satellite Internet | 2 | 1.4% |
| No Internet | 100 | 70.9% |
| Total | 141 | 100.0% |
Newcomb Summary
Newcomb, New Mexico is a small unincorporated community located in the northwestern corner of the state. It is situated in the Chuska Mountains, near the Four Corners region, and is part of the Navajo Nation. The town was founded in the late 19th century and has a population of approximately 500 people.
History
Newcomb was founded in 1891 by the Reverend John Newcomb, a Presbyterian missionary. He established a mission in the area to serve the Navajo people, and the town was named in his honor. The mission was successful and the town grew rapidly, becoming a center of trade and commerce for the Navajo people.
In the early 20th century, Newcomb was a bustling town with a population of over 1,000 people. It had a post office, a school, a hotel, and several stores. The town was also home to a number of churches, including the Presbyterian Church, the Catholic Church, and the Methodist Church.
In the 1950s, the town began to decline as the Navajo people moved away in search of better economic opportunities. By the 1970s, the population had dropped to just over 500 people.
Geography
Newcomb is located in the northwestern corner of New Mexico, in the Chuska Mountains. It is situated near the Four Corners region, which is the only place in the United States where four states meet. The town is located at an elevation of 6,000 feet and is surrounded by mountains and forests.
The climate in Newcomb is semi-arid, with hot summers and cold winters. The average annual temperature is around 50 degrees Fahrenheit. The town receives an average of 12 inches of precipitation per year.
Economy
The economy of Newcomb is largely based on tourism and agriculture. The town is a popular destination for hikers, campers, and other outdoor enthusiasts. There are several nearby attractions, including the Chuska Mountains, the Four Corners Monument, and the Navajo National Monument.
Agriculture is also an important part of the local economy. The town is home to several farms, which produce a variety of crops, including corn, wheat, and hay. Livestock is also raised in the area, including sheep, goats, and cattle.
Demographics
As of the 2010 census, the population of Newcomb was 514 people. The racial makeup of the town was 95.3% Native American, 2.7% White, 0.2% African American, 0.2% Asian, and 1.6% from other races. The median household income was $25,000, and the median age was 33 years.
Newcomb is a small, rural community with a rich history and culture. The town is home to a diverse population of Native Americans, Hispanics, and Whites. The town is a popular destination for outdoor enthusiasts, and the local economy is largely based on tourism and agriculture.
Common Questions
What is Per Capita Income in Newcomb?
Per Capita income in Newcomb is $18,427.
What is the Median Family Income in Newcomb?
Median Family Income in Newcomb is $40,000.
What is the Median Household income in Newcomb?
Median Household Income in Newcomb is $27,375.
What is Income or Wage Gap in Newcomb?
Income or Wage Gap in Newcomb is 20.1%.
Women in Newcomb earn 79.9 cents for every dollar earned by a man.
What is Inequality or Gini Index in Newcomb?
Inequality or Gini Index in Newcomb is 0.52.
What is the Total Population of Newcomb?
Total Population of Newcomb is 435.
What is the Total Male Population of Newcomb?
Total Male Population of Newcomb is 223.
What is the Total Female Population of Newcomb?
Total Female Population of Newcomb is 212.
What is the Ratio of Males per 100 Females in Newcomb?
There are 105.19 Males per 100 Females in Newcomb.
What is the Ratio of Females per 100 Males in Newcomb?
There are 95.07 Females per 100 Males in Newcomb.
What is the Median Population Age in Newcomb?
Median Population Age in Newcomb is 41.5 Years.
What is the Average Family Size in Newcomb
Average Family Size in Newcomb is 4.8 People.
What is the Average Household Size in Newcomb
Average Household Size in Newcomb is 3.1 People.
How Large is the Labor Force in Newcomb?
There are 164 People in the Labor Forcein in Newcomb.
What is the Percentage of People in the Labor Force in Newcomb?
42.2% of People are in the Labor Force in Newcomb.
What is the Unemployment Rate in Newcomb?
Unemployment Rate in Newcomb is 5.5%.