Mescalero, NM Map & Demographics
Mescalero Map
Mescalero Overview
$22,974
PER CAPITA INCOME
$59,821
AVG FAMILY INCOME
$29,359
AVG HOUSEHOLD INCOME
8.2%
WAGE / INCOME GAP [ % ]
91.8¢/ $1
WAGE / INCOME GAP [ $ ]
0.48
INEQUALITY / GINI INDEX
891
TOTAL POPULATION
498
MALE POPULATION
393
FEMALE POPULATION
126.72
MALES / 100 FEMALES
78.92
FEMALES / 100 MALES
45.0
MEDIAN AGE
4.6
AVG FAMILY SIZE
2.5
AVG HOUSEHOLD SIZE
447
LABOR FORCE [ PEOPLE ]
55.4%
PERCENT IN LABOR FORCE
11.4%
UNEMPLOYMENT RATE
Mescalero Zip Codes
Mescalero Area Codes
Income in Mescalero
Income Overview in Mescalero
Per Capita Income in Mescalero is $22,974, while median incomes of families and households are $59,821 and $29,359 respectively.
| Characteristic | Number | Measure |
| Per Capita Income | 891 | $22,974 |
| Median Family Income | 119 | $59,821 |
| Mean Family Income | 119 | $73,082 |
| Median Household Income | 336 | $29,359 |
| Mean Household Income | 336 | $45,732 |
| Income Deficit | 119 | $0 |
| Wage / Income Gap (%) | 891 | 8.19% |
| Wage / Income Gap ($) | 891 | 91.81¢ per $1 |
| Gini / Inequality Index | 891 | 0.48 |
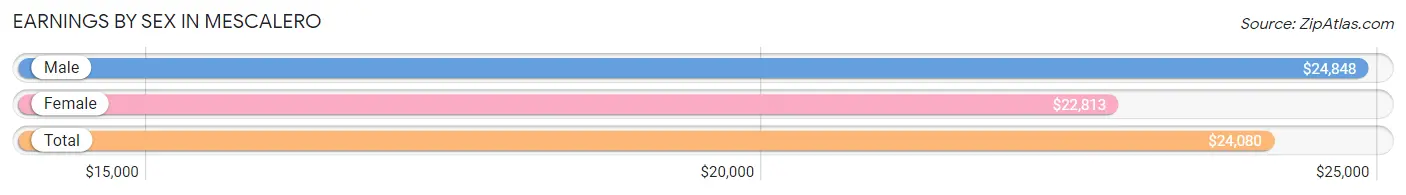
Earnings by Sex in Mescalero
Average Earnings in Mescalero are $24,080, $24,848 for men and $22,813 for women, a difference of 8.2%.
| Sex | Number | Average Earnings |
| Male | 272 (58.2%) | $24,848 |
| Female | 195 (41.8%) | $22,813 |
| Total | 467 (100.0%) | $24,080 |
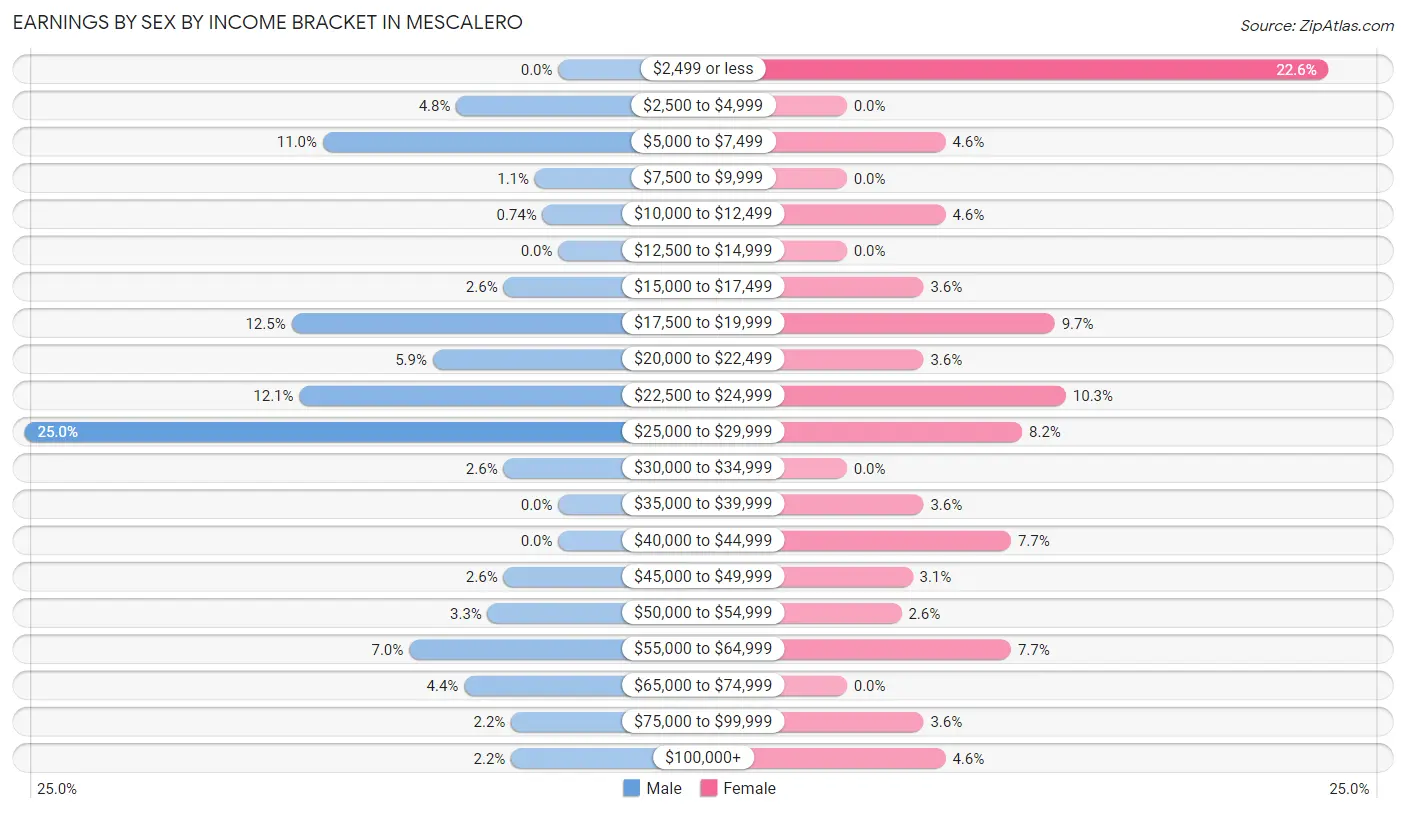
Earnings by Sex by Income Bracket in Mescalero
The most common earnings brackets in Mescalero are $25,000 to $29,999 for men (68 | 25.0%) and $2,499 or less for women (44 | 22.6%).
| Income | Male | Female |
| $2,499 or less | 0 (0.0%) | 44 (22.6%) |
| $2,500 to $4,999 | 13 (4.8%) | 0 (0.0%) |
| $5,000 to $7,499 | 30 (11.0%) | 9 (4.6%) |
| $7,500 to $9,999 | 3 (1.1%) | 0 (0.0%) |
| $10,000 to $12,499 | 2 (0.7%) | 9 (4.6%) |
| $12,500 to $14,999 | 0 (0.0%) | 0 (0.0%) |
| $15,000 to $17,499 | 7 (2.6%) | 7 (3.6%) |
| $17,500 to $19,999 | 34 (12.5%) | 19 (9.7%) |
| $20,000 to $22,499 | 16 (5.9%) | 7 (3.6%) |
| $22,500 to $24,999 | 33 (12.1%) | 20 (10.3%) |
| $25,000 to $29,999 | 68 (25.0%) | 16 (8.2%) |
| $30,000 to $34,999 | 7 (2.6%) | 0 (0.0%) |
| $35,000 to $39,999 | 0 (0.0%) | 7 (3.6%) |
| $40,000 to $44,999 | 0 (0.0%) | 15 (7.7%) |
| $45,000 to $49,999 | 7 (2.6%) | 6 (3.1%) |
| $50,000 to $54,999 | 9 (3.3%) | 5 (2.6%) |
| $55,000 to $64,999 | 19 (7.0%) | 15 (7.7%) |
| $65,000 to $74,999 | 12 (4.4%) | 0 (0.0%) |
| $75,000 to $99,999 | 6 (2.2%) | 7 (3.6%) |
| $100,000+ | 6 (2.2%) | 9 (4.6%) |
| Total | 272 (100.0%) | 195 (100.0%) |
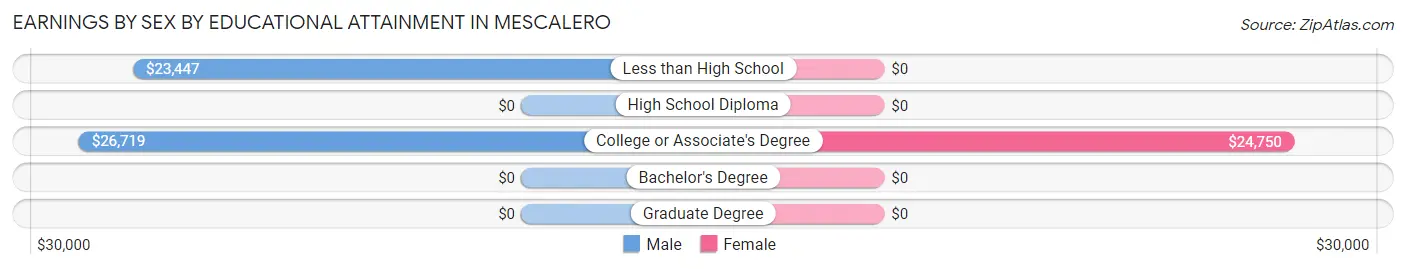
Earnings by Sex by Educational Attainment in Mescalero
Average earnings in Mescalero are $24,848 for men and $27,222 for women, a difference of 8.7%. Men with an educational attainment of college or associate's degree enjoy the highest average annual earnings of $26,719, while those with less than high school education earn the least with $23,447. Women with an educational attainment of college or associate's degree earn the most with the average annual earnings of $24,750, while those with college or associate's degree education have the smallest earnings of $24,750.
| Educational Attainment | Male Income | Female Income |
| Less than High School | $23,447 | $0 |
| High School Diploma | - | - |
| College or Associate's Degree | $26,719 | $24,750 |
| Bachelor's Degree | - | - |
| Graduate Degree | - | - |
| Total | $24,848 | $27,222 |
Family Income in Mescalero
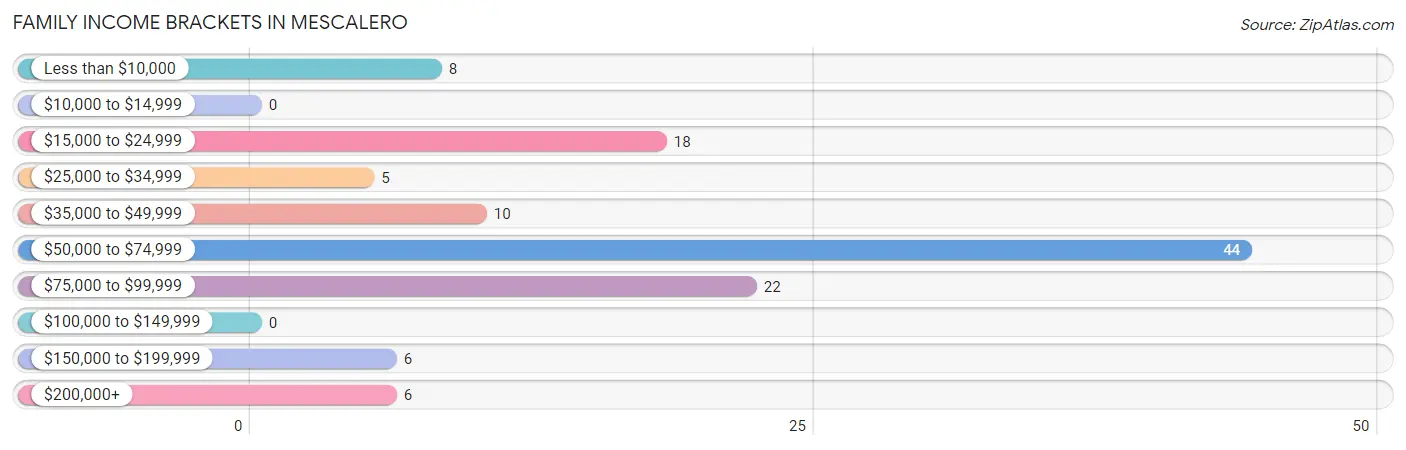
Family Income Brackets in Mescalero
According to the Mescalero family income data, there are 44 families falling into the $50,000 to $74,999 income range, which is the most common income bracket and makes up 37.0% of all families.
| Income Bracket | # Families | % Families |
| Less than $10,000 | 8 | 6.7% |
| $10,000 to $14,999 | 0 | 0.0% |
| $15,000 to $24,999 | 18 | 15.1% |
| $25,000 to $34,999 | 5 | 4.2% |
| $35,000 to $49,999 | 10 | 8.4% |
| $50,000 to $74,999 | 44 | 37.0% |
| $75,000 to $99,999 | 22 | 18.5% |
| $100,000 to $149,999 | 0 | 0.0% |
| $150,000 to $199,999 | 6 | 5.0% |
| $200,000+ | 6 | 5.0% |
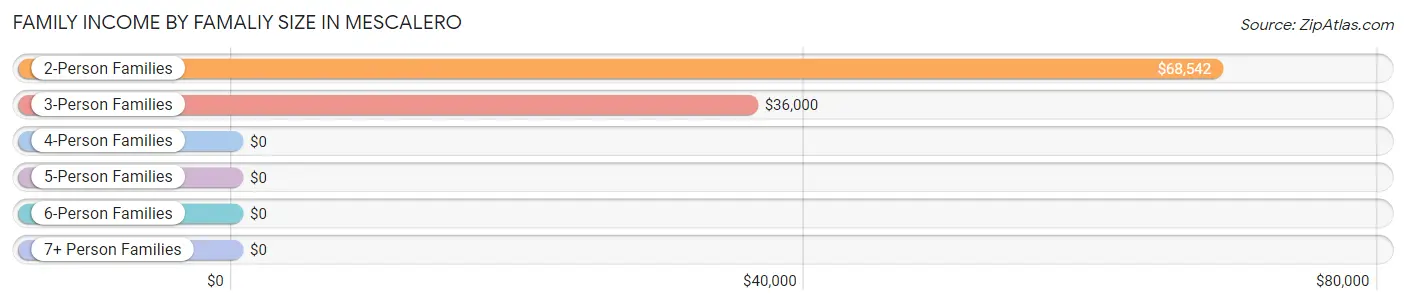
Family Income by Famaliy Size in Mescalero
2-person families (55 | 46.2%) account for the highest median family income in Mescalero with $68,542 per family, while 2-person families (55 | 46.2%) have the highest median income of $34,271 per family member.
| Income Bracket | # Families | Median Income |
| 2-Person Families | 55 (46.2%) | $68,542 |
| 3-Person Families | 26 (21.8%) | $36,000 |
| 4-Person Families | 29 (24.4%) | $0 |
| 5-Person Families | 9 (7.6%) | $0 |
| 6-Person Families | 0 (0.0%) | $0 |
| 7+ Person Families | 0 (0.0%) | $0 |
| Total | 119 (100.0%) | $59,821 |
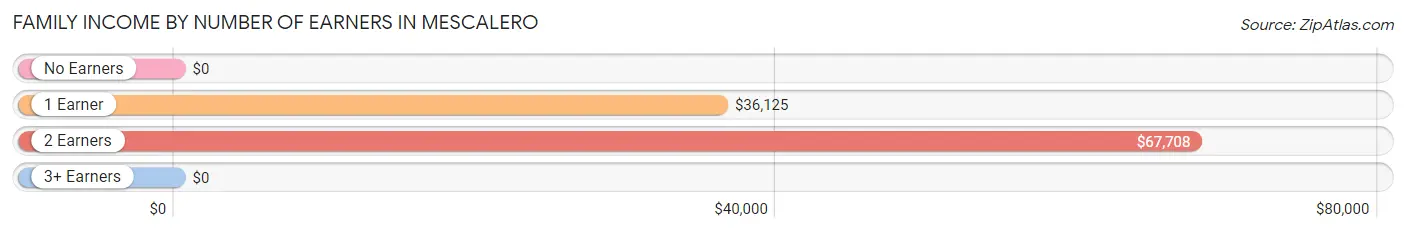
Family Income by Number of Earners in Mescalero
| Number of Earners | # Families | Median Income |
| No Earners | 8 (6.7%) | $0 |
| 1 Earner | 45 (37.8%) | $36,125 |
| 2 Earners | 55 (46.2%) | $67,708 |
| 3+ Earners | 11 (9.2%) | $0 |
| Total | 119 (100.0%) | $59,821 |
Household Income in Mescalero
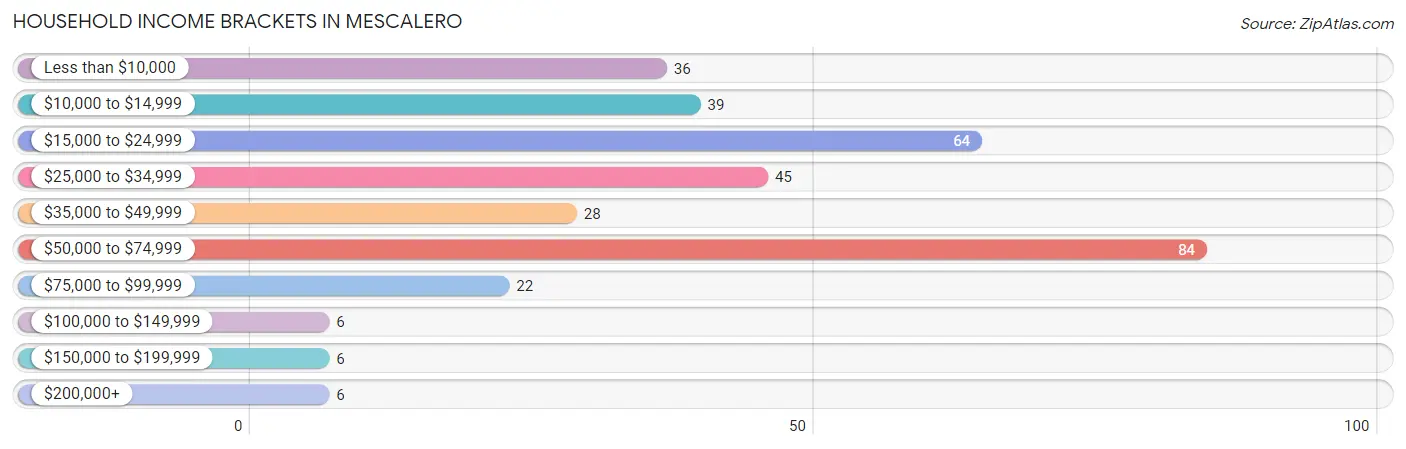
Household Income Brackets in Mescalero
With 84 households falling in the category, the $50,000 to $74,999 income range is the most frequent in Mescalero, accounting for 25.0% of all households. In contrast, only 6 households (1.8%) fall into the $100,000 to $149,999 income bracket, making it the least populous group.
| Income Bracket | # Households | % Households |
| Less than $10,000 | 36 | 10.7% |
| $10,000 to $14,999 | 39 | 11.6% |
| $15,000 to $24,999 | 64 | 19.0% |
| $25,000 to $34,999 | 45 | 13.4% |
| $35,000 to $49,999 | 28 | 8.3% |
| $50,000 to $74,999 | 84 | 25.0% |
| $75,000 to $99,999 | 22 | 6.5% |
| $100,000 to $149,999 | 6 | 1.8% |
| $150,000 to $199,999 | 6 | 1.8% |
| $200,000+ | 6 | 1.8% |
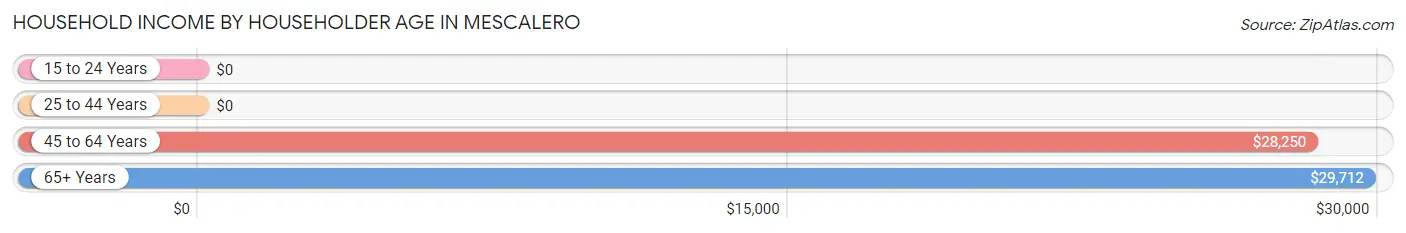
Household Income by Householder Age in Mescalero
The median household income in Mescalero is $29,359, with the highest median household income of $29,712 found in the 65+ years age bracket for the primary householder. A total of 86 households (25.6%) fall into this category.
| Income Bracket | # Households | Median Income |
| 15 to 24 Years | 0 (0.0%) | $0 |
| 25 to 44 Years | 77 (22.9%) | $0 |
| 45 to 64 Years | 173 (51.5%) | $28,250 |
| 65+ Years | 86 (25.6%) | $29,712 |
| Total | 336 (100.0%) | $29,359 |
Poverty in Mescalero
Income Below Poverty by Sex and Age in Mescalero
With 30.4% poverty level for males and 37.1% for females among the residents of Mescalero, under 5 year old males and 6 to 11 year old females are the most vulnerable to poverty, with 17 males (100.0%) and 19 females (100.0%) in their respective age groups living below the poverty level.
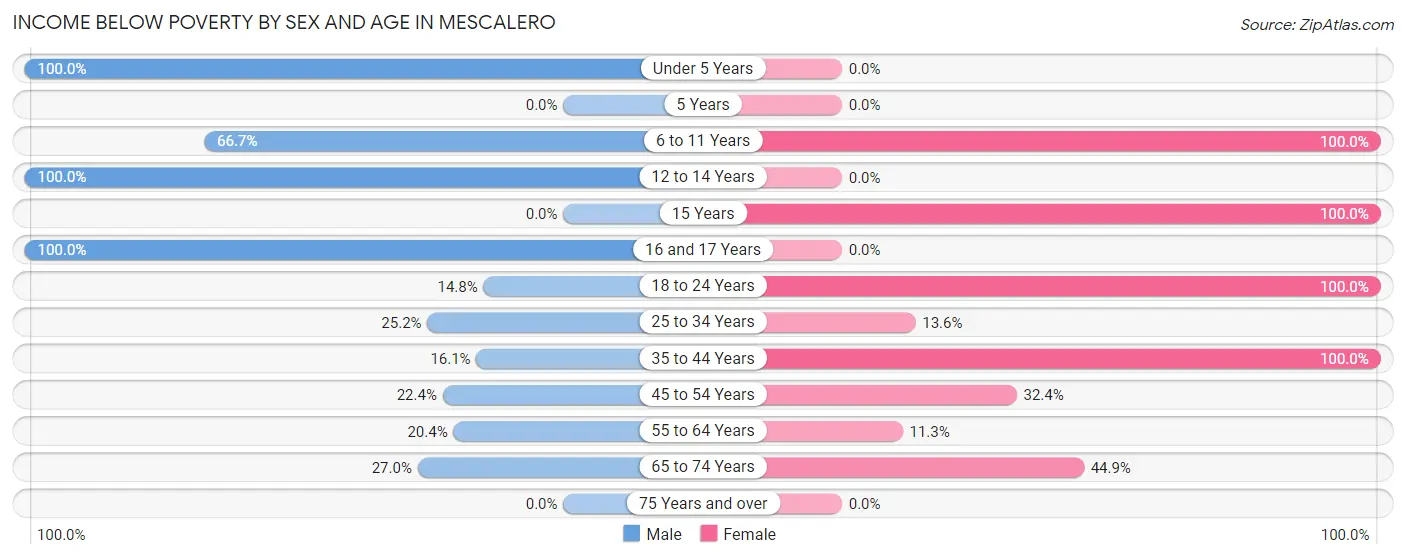
| Age Bracket | Male | Female |
| Under 5 Years | 17 (100.0%) | 0 (0.0%) |
| 5 Years | 0 (0.0%) | 0 (0.0%) |
| 6 to 11 Years | 18 (66.7%) | 19 (100.0%) |
| 12 to 14 Years | 8 (100.0%) | 0 (0.0%) |
| 15 Years | 0 (0.0%) | 13 (100.0%) |
| 16 and 17 Years | 12 (100.0%) | 0 (0.0%) |
| 18 to 24 Years | 4 (14.8%) | 38 (100.0%) |
| 25 to 34 Years | 27 (25.2%) | 9 (13.6%) |
| 35 to 44 Years | 10 (16.1%) | 16 (100.0%) |
| 45 to 54 Years | 15 (22.4%) | 12 (32.4%) |
| 55 to 64 Years | 21 (20.4%) | 8 (11.3%) |
| 65 to 74 Years | 10 (27.0%) | 22 (44.9%) |
| 75 Years and over | 0 (0.0%) | 0 (0.0%) |
| Total | 142 (30.4%) | 137 (37.1%) |
Income Above Poverty by Sex and Age in Mescalero
According to the poverty statistics in Mescalero, males aged 18 to 24 years and females aged 16 and 17 years are the age groups that are most secure financially, with 85.2% of males and 100.0% of females in these age groups living above the poverty line.
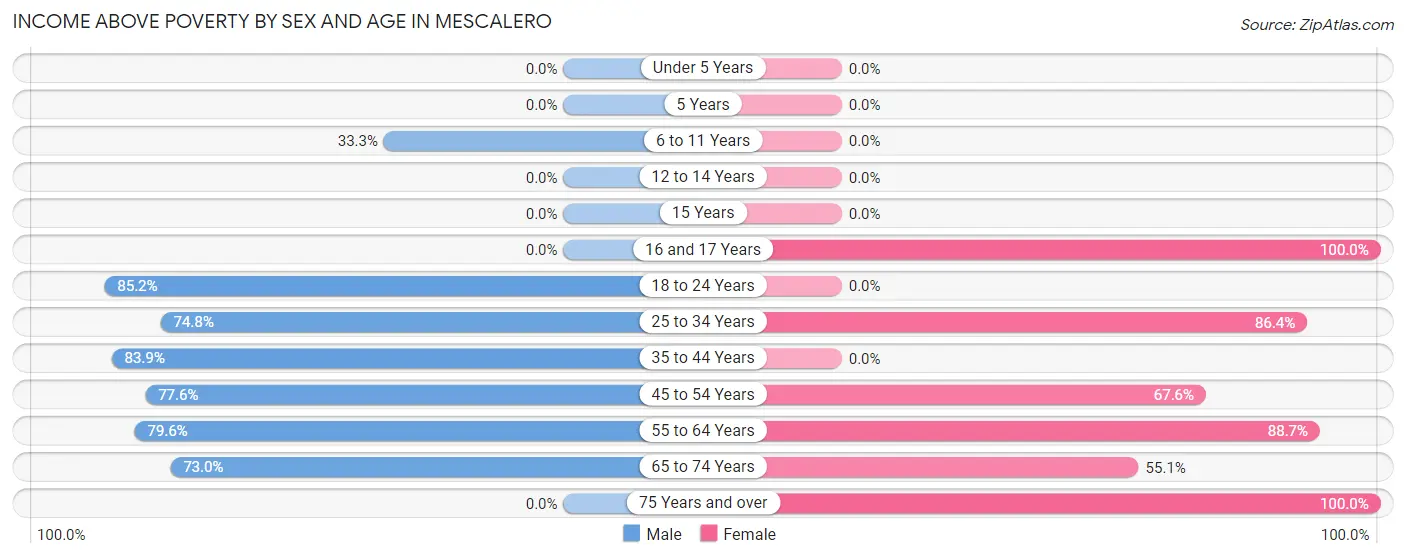
| Age Bracket | Male | Female |
| Under 5 Years | 0 (0.0%) | 0 (0.0%) |
| 5 Years | 0 (0.0%) | 0 (0.0%) |
| 6 to 11 Years | 9 (33.3%) | 0 (0.0%) |
| 12 to 14 Years | 0 (0.0%) | 0 (0.0%) |
| 15 Years | 0 (0.0%) | 0 (0.0%) |
| 16 and 17 Years | 0 (0.0%) | 23 (100.0%) |
| 18 to 24 Years | 23 (85.2%) | 0 (0.0%) |
| 25 to 34 Years | 80 (74.8%) | 57 (86.4%) |
| 35 to 44 Years | 52 (83.9%) | 0 (0.0%) |
| 45 to 54 Years | 52 (77.6%) | 25 (67.6%) |
| 55 to 64 Years | 82 (79.6%) | 63 (88.7%) |
| 65 to 74 Years | 27 (73.0%) | 27 (55.1%) |
| 75 Years and over | 0 (0.0%) | 37 (100.0%) |
| Total | 325 (69.6%) | 232 (62.9%) |
Income Below Poverty Among Married-Couple Families in Mescalero
| Children | Above Poverty | Below Poverty |
| No Children | 48 (100.0%) | 0 (0.0%) |
| 1 or 2 Children | 10 (100.0%) | 0 (0.0%) |
| 3 or 4 Children | 0 (0.0%) | 0 (0.0%) |
| 5 or more Children | 0 (0.0%) | 0 (0.0%) |
| Total | 58 (100.0%) | 0 (0.0%) |
Income Below Poverty Among Single-Parent Households in Mescalero
According to the poverty data in Mescalero, 45.2% or 14 single-father households and 56.7% or 17 single-mother households are living below the poverty line. Among single-father households, those with 1 or 2 children have the highest poverty rate, with 12 households (100.0%) experiencing poverty. Likewise, among single-mother households, those with 3 or 4 children have the highest poverty rate, with 17 households (100.0%) falling below the poverty line.
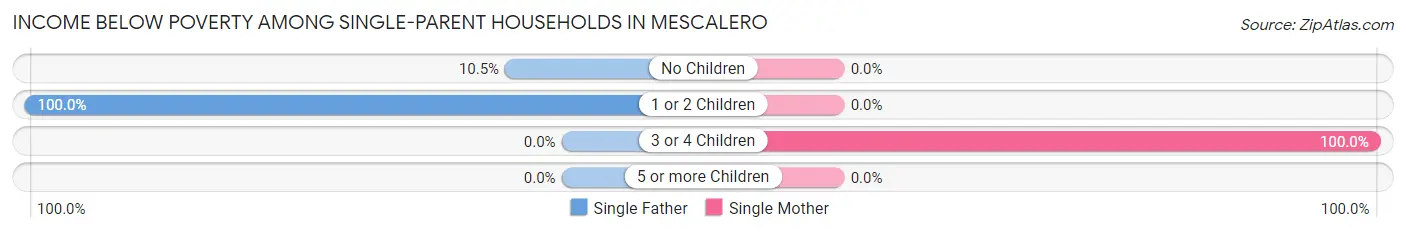
| Children | Single Father | Single Mother |
| No Children | 2 (10.5%) | 0 (0.0%) |
| 1 or 2 Children | 12 (100.0%) | 0 (0.0%) |
| 3 or 4 Children | 0 (0.0%) | 17 (100.0%) |
| 5 or more Children | 0 (0.0%) | 0 (0.0%) |
| Total | 14 (45.2%) | 17 (56.7%) |
Income Below Poverty Among Married-Couple vs Single-Parent Households in Mescalero
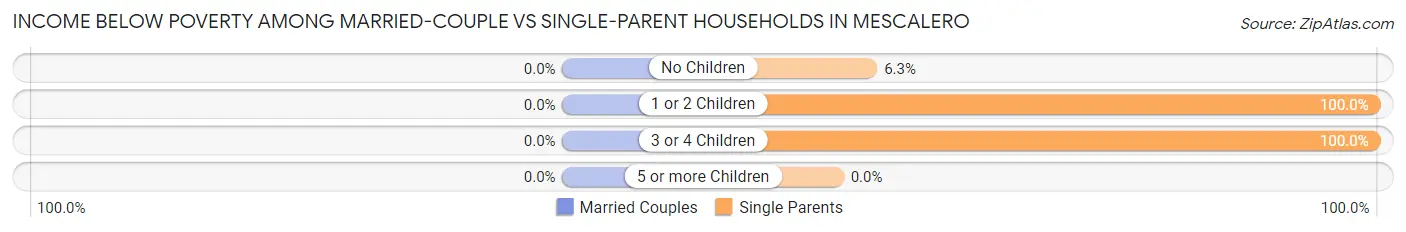
| Children | Married-Couple Families | Single-Parent Households |
| No Children | 0 (0.0%) | 2 (6.2%) |
| 1 or 2 Children | 0 (0.0%) | 12 (100.0%) |
| 3 or 4 Children | 0 (0.0%) | 17 (100.0%) |
| 5 or more Children | 0 (0.0%) | 0 (0.0%) |
| Total | 0 (0.0%) | 31 (50.8%) |
Race in Mescalero
The most populous races in Mescalero are Native / Alaskan (800 | 89.8%), White / Caucasian (47 | 5.3%), and Hispanic or Latino (44 | 4.9%).
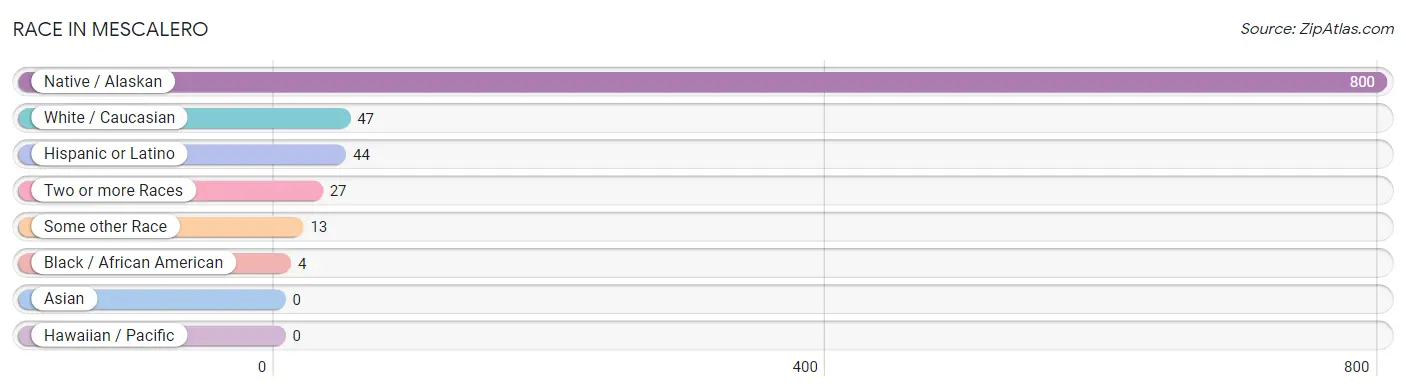
| Race | # Population | % Population |
| Asian | 0 | 0.0% |
| Black / African American | 4 | 0.4% |
| Hawaiian / Pacific | 0 | 0.0% |
| Hispanic or Latino | 44 | 4.9% |
| Native / Alaskan | 800 | 89.8% |
| White / Caucasian | 47 | 5.3% |
| Two or more Races | 27 | 3.0% |
| Some other Race | 13 | 1.5% |
| Total | 891 | 100.0% |
Ancestry in Mescalero
The most populous ancestries reported in Mescalero are Apache (719 | 80.7%), Mexican (40 | 4.5%), Pueblo (26 | 2.9%), Navajo (21 | 2.4%), and Ute (14 | 1.6%), together accounting for 92.0% of all Mescalero residents.
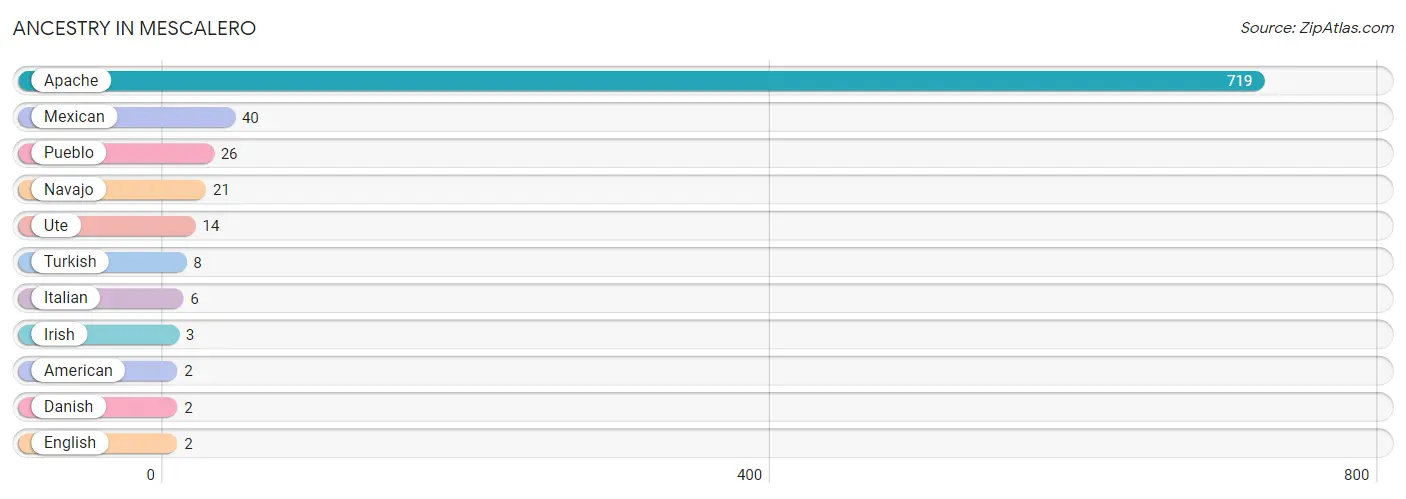
| Ancestry | # Population | % Population |
| American | 2 | 0.2% |
| Apache | 719 | 80.7% |
| Danish | 2 | 0.2% |
| English | 2 | 0.2% |
| Irish | 3 | 0.3% |
| Italian | 6 | 0.7% |
| Mexican | 40 | 4.5% |
| Navajo | 21 | 2.4% |
| Pueblo | 26 | 2.9% |
| Turkish | 8 | 0.9% |
| Ute | 14 | 1.6% | View All 11 Rows |
Immigrants in Mescalero
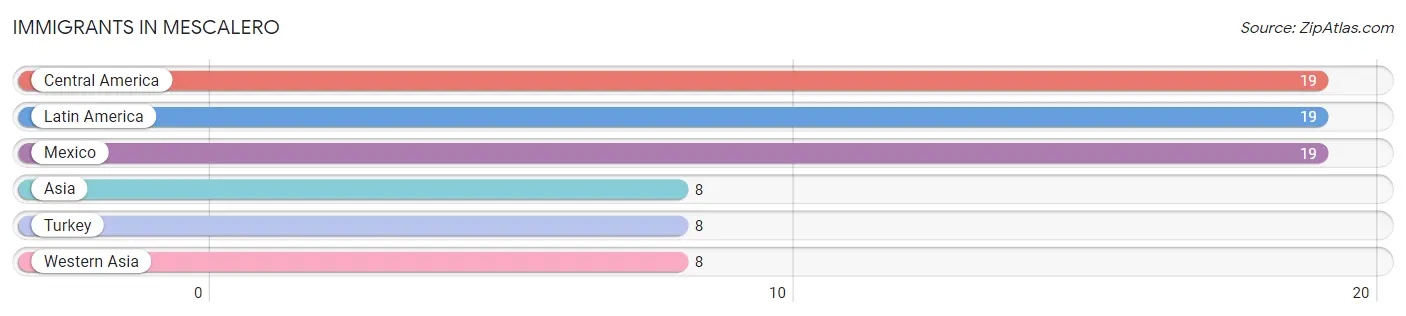
The most numerous immigrant groups reported in Mescalero came from Central America (19 | 2.1%), Latin America (19 | 2.1%), Mexico (19 | 2.1%), Asia (8 | 0.9%), and Turkey (8 | 0.9%), together accounting for 8.2% of all Mescalero residents.
| Immigration Origin | # Population | % Population |
| Asia | 8 | 0.9% |
| Central America | 19 | 2.1% |
| Latin America | 19 | 2.1% |
| Mexico | 19 | 2.1% |
| Turkey | 8 | 0.9% |
| Western Asia | 8 | 0.9% | View All 6 Rows |
Sex and Age in Mescalero
Sex and Age in Mescalero
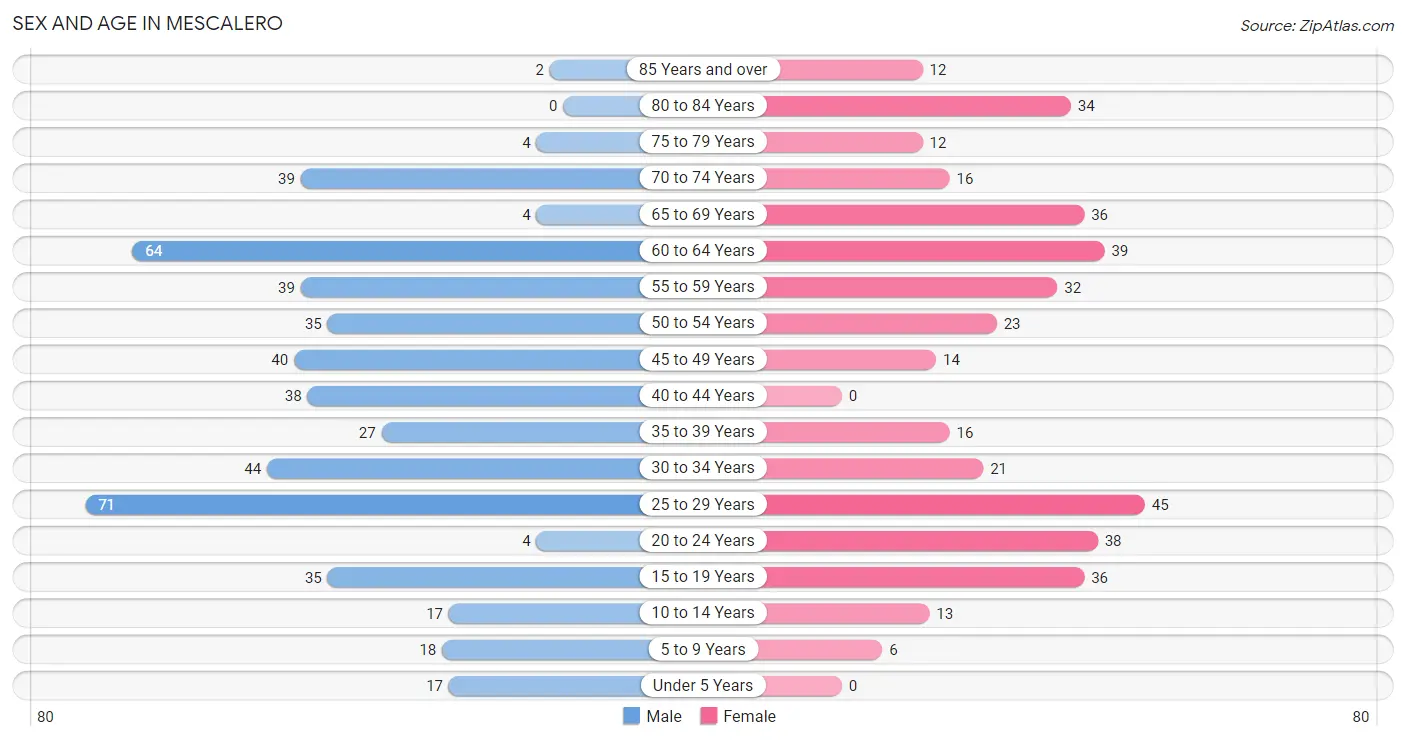
The most populous age groups in Mescalero are 25 to 29 Years (71 | 14.3%) for men and 25 to 29 Years (45 | 11.5%) for women.
| Age Bracket | Male | Female |
| Under 5 Years | 17 (3.4%) | 0 (0.0%) |
| 5 to 9 Years | 18 (3.6%) | 6 (1.5%) |
| 10 to 14 Years | 17 (3.4%) | 13 (3.3%) |
| 15 to 19 Years | 35 (7.0%) | 36 (9.2%) |
| 20 to 24 Years | 4 (0.8%) | 38 (9.7%) |
| 25 to 29 Years | 71 (14.3%) | 45 (11.5%) |
| 30 to 34 Years | 44 (8.8%) | 21 (5.3%) |
| 35 to 39 Years | 27 (5.4%) | 16 (4.1%) |
| 40 to 44 Years | 38 (7.6%) | 0 (0.0%) |
| 45 to 49 Years | 40 (8.0%) | 14 (3.6%) |
| 50 to 54 Years | 35 (7.0%) | 23 (5.9%) |
| 55 to 59 Years | 39 (7.8%) | 32 (8.1%) |
| 60 to 64 Years | 64 (12.9%) | 39 (9.9%) |
| 65 to 69 Years | 4 (0.8%) | 36 (9.2%) |
| 70 to 74 Years | 39 (7.8%) | 16 (4.1%) |
| 75 to 79 Years | 4 (0.8%) | 12 (3.0%) |
| 80 to 84 Years | 0 (0.0%) | 34 (8.6%) |
| 85 Years and over | 2 (0.4%) | 12 (3.0%) |
| Total | 498 (100.0%) | 393 (100.0%) |
Families and Households in Mescalero
Median Family Size in Mescalero
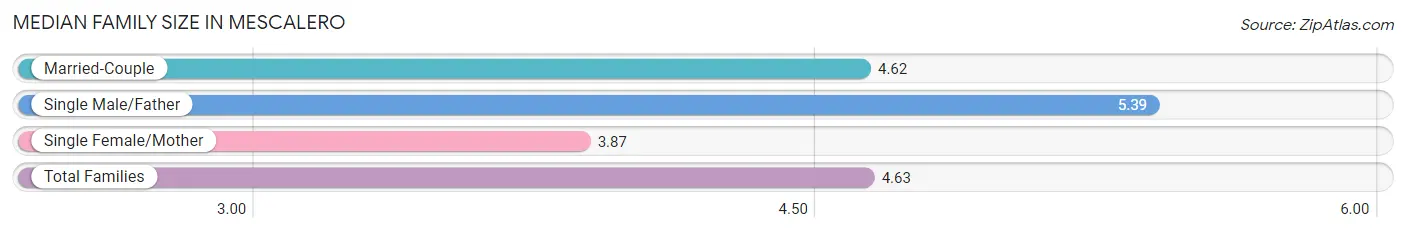
The median family size in Mescalero is 4.63 persons per family, with single male/father families (31 | 26.1%) accounting for the largest median family size of 5.39 persons per family. On the other hand, single female/mother families (30 | 25.2%) represent the smallest median family size with 3.87 persons per family.
| Family Type | # Families | Family Size |
| Married-Couple | 58 (48.7%) | 4.62 |
| Single Male/Father | 31 (26.1%) | 5.39 |
| Single Female/Mother | 30 (25.2%) | 3.87 |
| Total Families | 119 (100.0%) | 4.63 |
Median Household Size in Mescalero
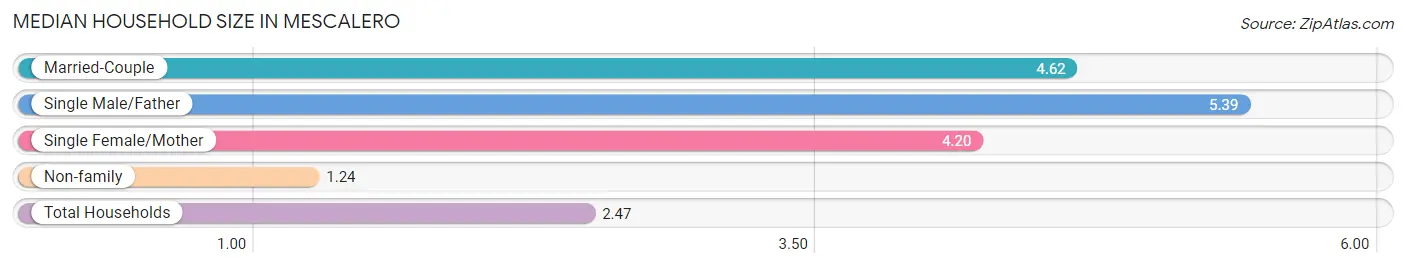
The median household size in Mescalero is 2.47 persons per household, with single male/father households (31 | 9.2%) accounting for the largest median household size of 5.39 persons per household. non-family households (217 | 64.6%) represent the smallest median household size with 1.24 persons per household.
| Household Type | # Households | Household Size |
| Married-Couple | 58 (17.3%) | 4.62 |
| Single Male/Father | 31 (9.2%) | 5.39 |
| Single Female/Mother | 30 (8.9%) | 4.20 |
| Non-family | 217 (64.6%) | 1.24 |
| Total Households | 336 (100.0%) | 2.47 |
Household Size by Marriage Status in Mescalero
Out of a total of 336 households in Mescalero, 119 (35.4%) are family households, while 217 (64.6%) are nonfamily households. The most numerous type of family households are 2-person households, comprising 55, and the most common type of nonfamily households are 1-person households, comprising 184.
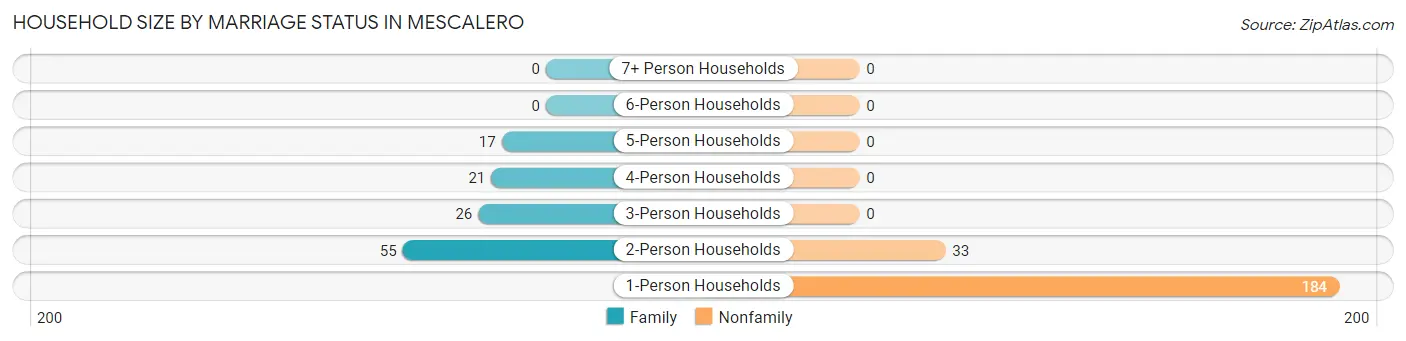
| Household Size | Family Households | Nonfamily Households |
| 1-Person Households | - | 184 (54.8%) |
| 2-Person Households | 55 (16.4%) | 33 (9.8%) |
| 3-Person Households | 26 (7.7%) | 0 (0.0%) |
| 4-Person Households | 21 (6.2%) | 0 (0.0%) |
| 5-Person Households | 17 (5.1%) | 0 (0.0%) |
| 6-Person Households | 0 (0.0%) | 0 (0.0%) |
| 7+ Person Households | 0 (0.0%) | 0 (0.0%) |
| Total | 119 (35.4%) | 217 (64.6%) |
Female Fertility in Mescalero
Fertility by Age in Mescalero
Average fertility rate in Mescalero is 41.0 births per 1,000 women. Women in the age bracket of 20 to 34 years have the highest fertility rate with 67.0 births per 1,000 women. Women in the age bracket of 20 to 34 years acount for 100.0% of all women with births.
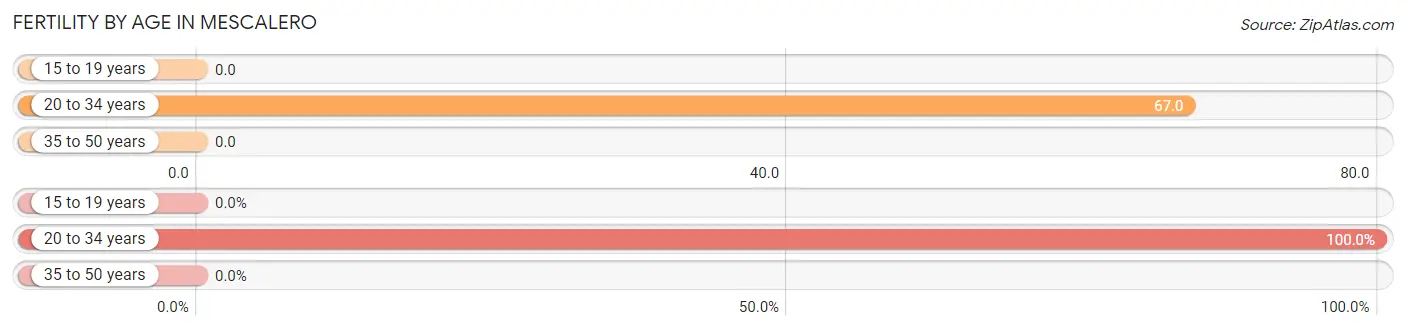
| Age Bracket | Women with Births | Births / 1,000 Women |
| 15 to 19 years | 0 (0.0%) | 0.0 |
| 20 to 34 years | 7 (100.0%) | 67.0 |
| 35 to 50 years | 0 (0.0%) | 0.0 |
| Total | 7 (100.0%) | 41.0 |
Fertility by Age by Marriage Status in Mescalero
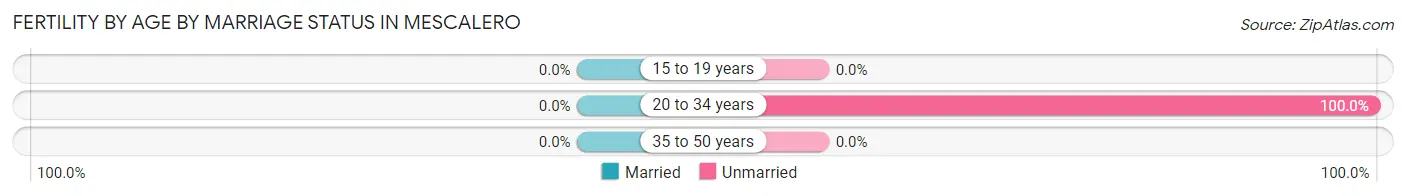
| Age Bracket | Married | Unmarried |
| 15 to 19 years | 0 (0.0%) | 0 (0.0%) |
| 20 to 34 years | 0 (0.0%) | 7 (100.0%) |
| 35 to 50 years | 0 (0.0%) | 0 (0.0%) |
| Total | 0 (0.0%) | 7 (100.0%) |
Fertility by Education in Mescalero
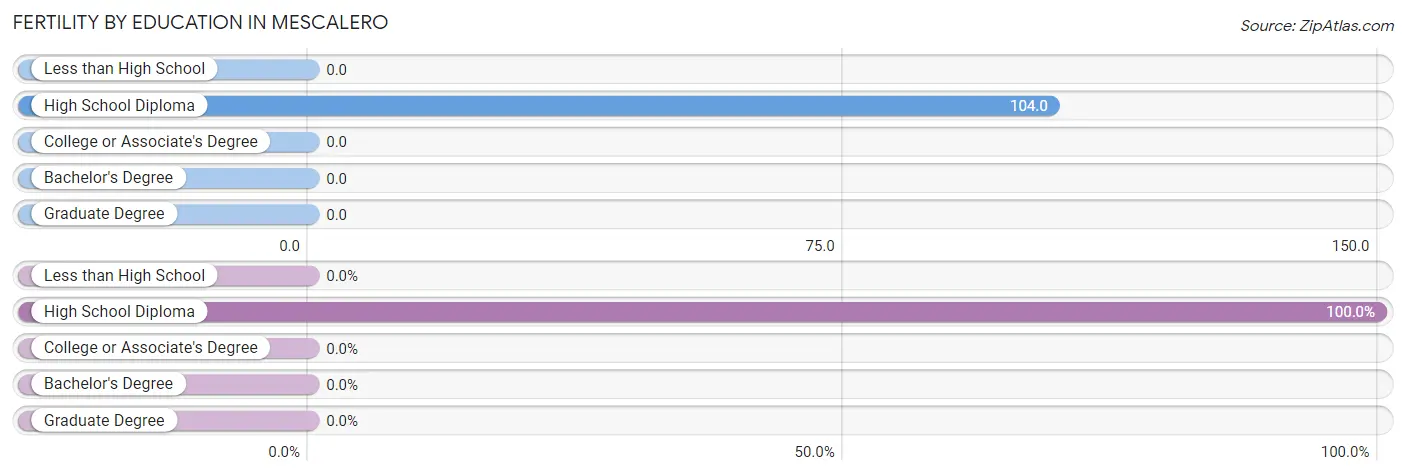
| Educational Attainment | Women with Births | Births / 1,000 Women |
| Less than High School | 0 (0.0%) | 0.0 |
| High School Diploma | 7 (100.0%) | 104.0 |
| College or Associate's Degree | 0 (0.0%) | 0.0 |
| Bachelor's Degree | 0 (0.0%) | 0.0 |
| Graduate Degree | 0 (0.0%) | 0.0 |
| Total | 7 (100.0%) | 41.0 |
Fertility by Education by Marriage Status in Mescalero
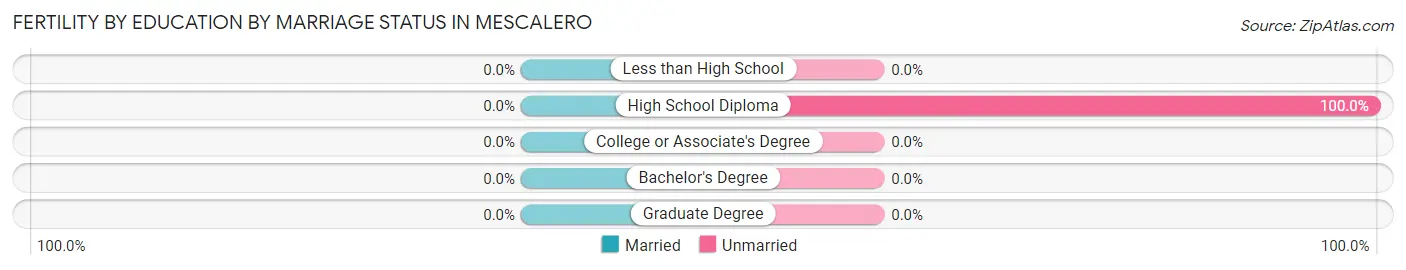
| Educational Attainment | Married | Unmarried |
| Less than High School | 0 (0.0%) | 0 (0.0%) |
| High School Diploma | 0 (0.0%) | 7 (100.0%) |
| College or Associate's Degree | 0 (0.0%) | 0 (0.0%) |
| Bachelor's Degree | 0 (0.0%) | 0 (0.0%) |
| Graduate Degree | 0 (0.0%) | 0 (0.0%) |
| Total | 0 (0.0%) | 7 (100.0%) |
Employment Characteristics in Mescalero
Employment by Class of Employer in Mescalero
Among the 375 employed individuals in Mescalero, local government employees (135 | 36.0%), federal government employees (94 | 25.1%), and private company employees (82 | 21.9%) make up the most common classes of employment.
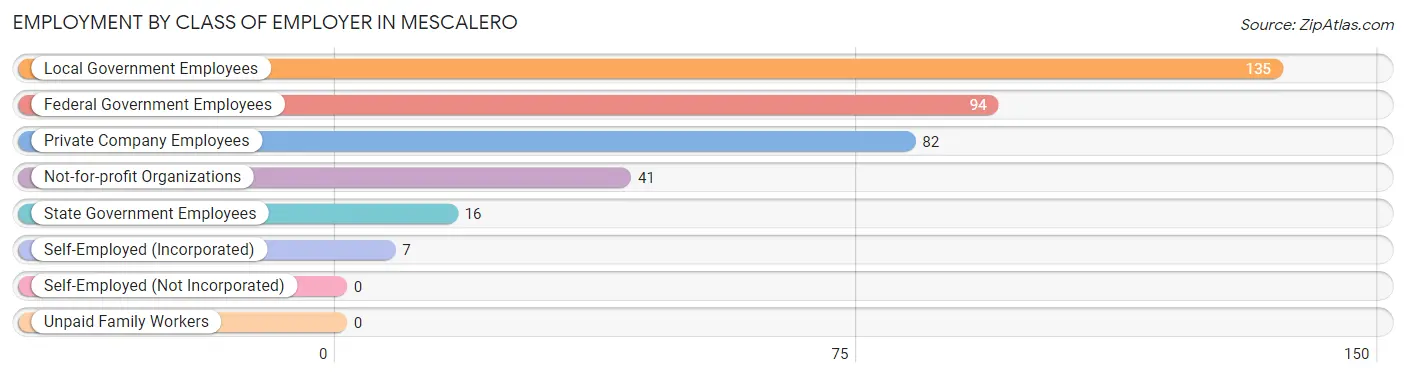
| Employer Class | # Employees | % Employees |
| Private Company Employees | 82 | 21.9% |
| Self-Employed (Incorporated) | 7 | 1.9% |
| Self-Employed (Not Incorporated) | 0 | 0.0% |
| Not-for-profit Organizations | 41 | 10.9% |
| Local Government Employees | 135 | 36.0% |
| State Government Employees | 16 | 4.3% |
| Federal Government Employees | 94 | 25.1% |
| Unpaid Family Workers | 0 | 0.0% |
| Total | 375 | 100.0% |
Employment Status by Age in Mescalero
According to the labor force statistics for Mescalero, out of the total population over 16 years of age (807), 55.4% or 447 individuals are in the labor force, with 11.4% or 51 of them unemployed. The age group with the highest labor force participation rate is 30 to 34 years, with 93.8% or 61 individuals in the labor force. Within the labor force, the 20 to 24 years age range has the highest percentage of unemployed individuals, with 50.0% or 19 of them being unemployed.
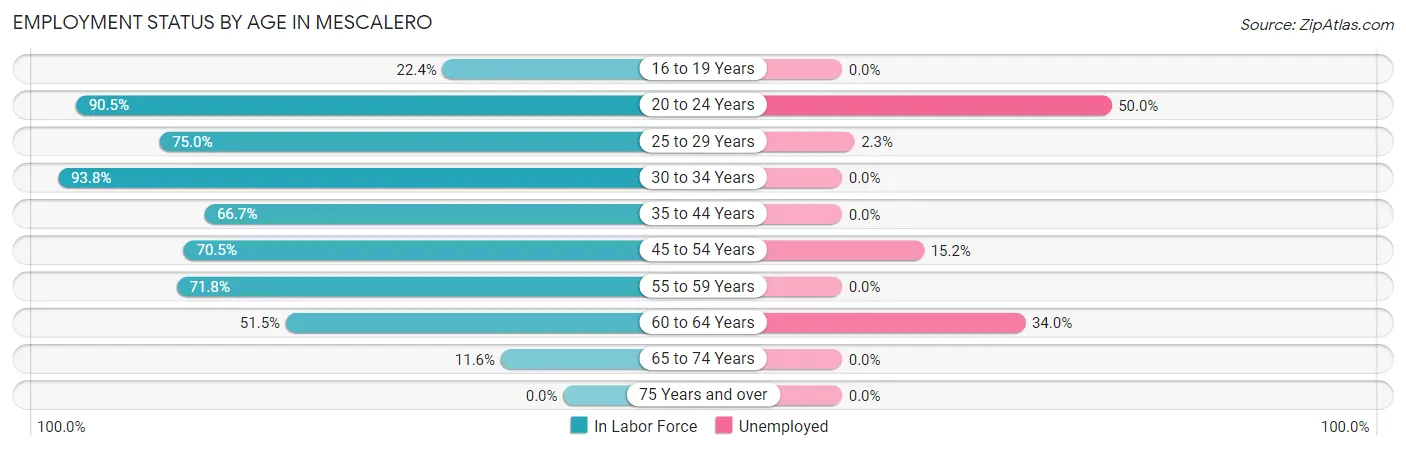
| Age Bracket | In Labor Force | Unemployed |
| 16 to 19 Years | 13 (22.4%) | 0 (0.0%) |
| 20 to 24 Years | 38 (90.5%) | 19 (50.0%) |
| 25 to 29 Years | 87 (75.0%) | 2 (2.3%) |
| 30 to 34 Years | 61 (93.8%) | 0 (0.0%) |
| 35 to 44 Years | 54 (66.7%) | 0 (0.0%) |
| 45 to 54 Years | 79 (70.5%) | 12 (15.2%) |
| 55 to 59 Years | 51 (71.8%) | 0 (0.0%) |
| 60 to 64 Years | 53 (51.5%) | 18 (34.0%) |
| 65 to 74 Years | 11 (11.6%) | 0 (0.0%) |
| 75 Years and over | 0 (0.0%) | 0 (0.0%) |
| Total | 447 (55.4%) | 51 (11.4%) |
Employment Status by Educational Attainment in Mescalero
According to labor force statistics for Mescalero, 70.3% of individuals (385) out of the total population between 25 and 64 years of age (548) are in the labor force, with 8.3% or 32 of them being unemployed. The group with the highest labor force participation rate are those with the educational attainment of bachelor's degree or higher, with 90.2% or 46 individuals in the labor force. Within the labor force, individuals with high school diploma education have the highest percentage of unemployment, with 14.0% or 12 of them being unemployed.
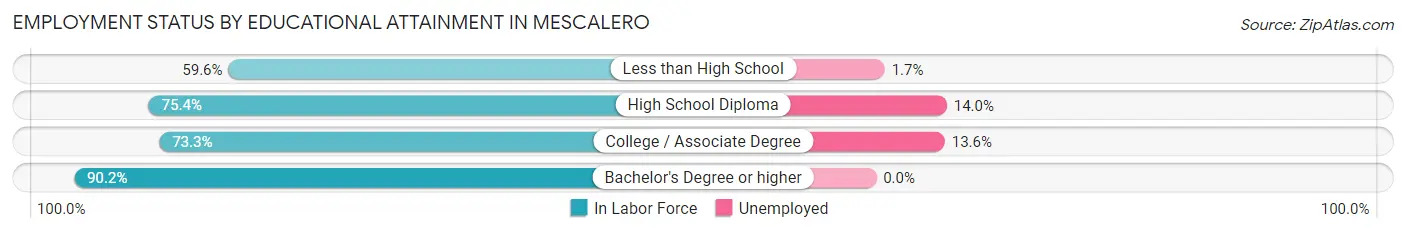
| Educational Attainment | In Labor Force | Unemployed |
| Less than High School | 121 (59.6%) | 3 (1.7%) |
| High School Diploma | 86 (75.4%) | 16 (14.0%) |
| College / Associate Degree | 132 (73.3%) | 24 (13.6%) |
| Bachelor's Degree or higher | 46 (90.2%) | 0 (0.0%) |
| Total | 385 (70.3%) | 45 (8.3%) |
Employment Occupations by Sex in Mescalero
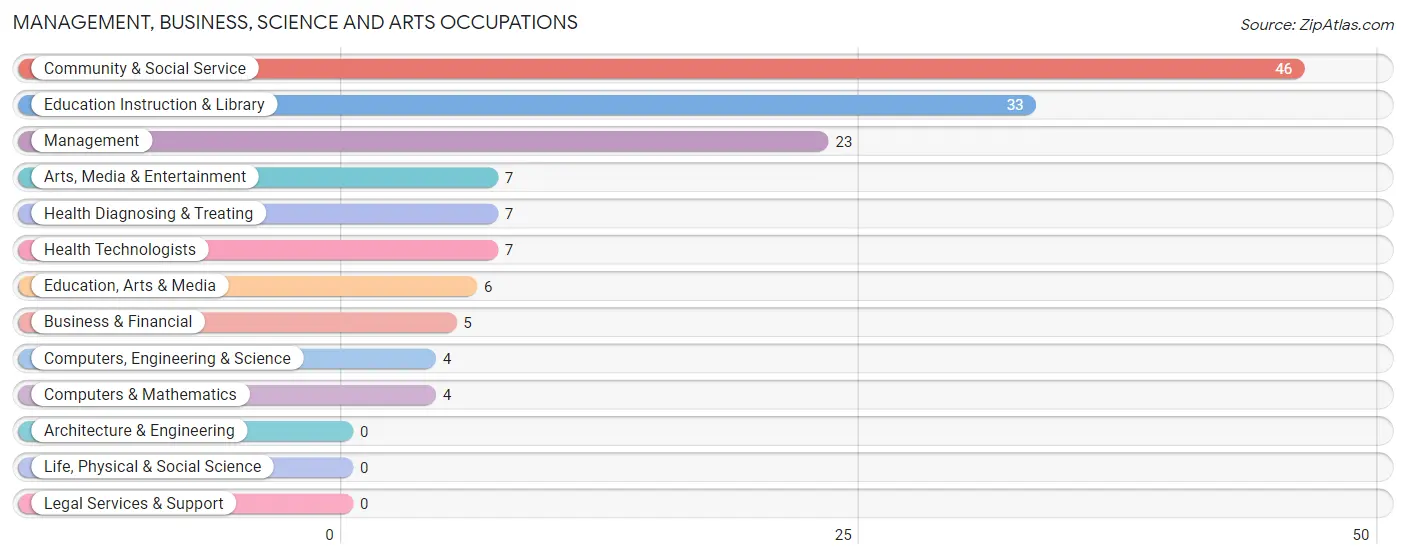
Management, Business, Science and Arts Occupations
The most common Management, Business, Science and Arts occupations in Mescalero are Community & Social Service (46 | 11.6%), Education Instruction & Library (33 | 8.3%), Management (23 | 5.8%), Arts, Media & Entertainment (7 | 1.8%), and Health Diagnosing & Treating (7 | 1.8%).
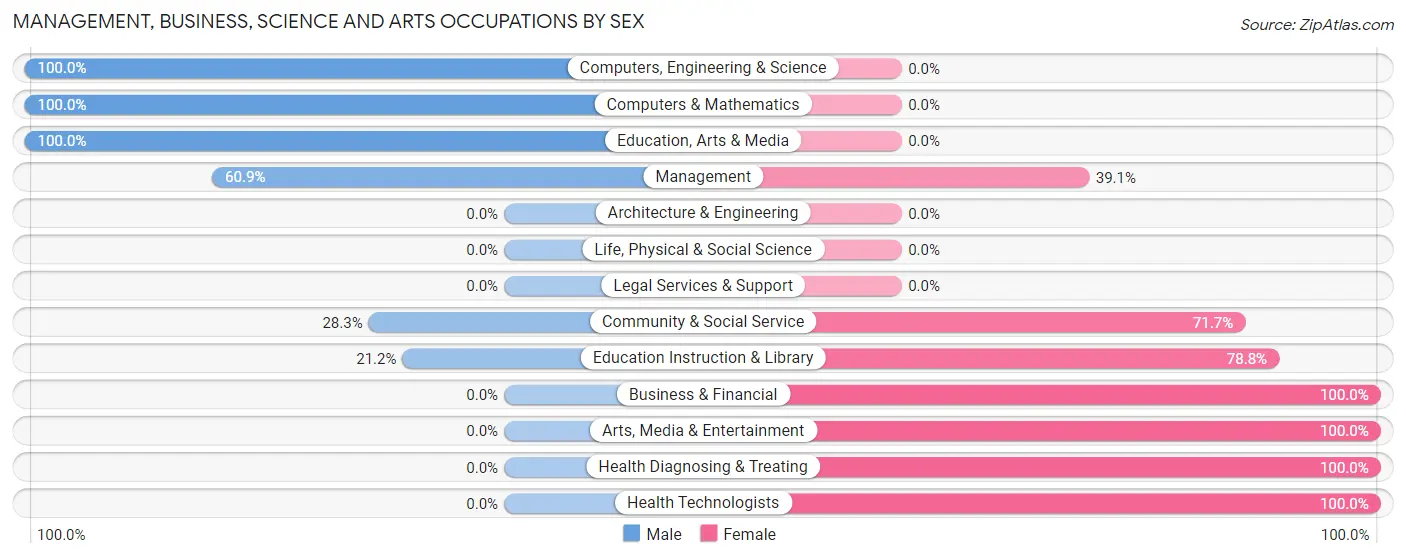
Management, Business, Science and Arts Occupations by Sex
Within the Management, Business, Science and Arts occupations in Mescalero, the most male-oriented occupations are Computers, Engineering & Science (100.0%), Computers & Mathematics (100.0%), and Education, Arts & Media (100.0%), while the most female-oriented occupations are Business & Financial (100.0%), Arts, Media & Entertainment (100.0%), and Health Diagnosing & Treating (100.0%).
| Occupation | Male | Female |
| Management | 14 (60.9%) | 9 (39.1%) |
| Business & Financial | 0 (0.0%) | 5 (100.0%) |
| Computers, Engineering & Science | 4 (100.0%) | 0 (0.0%) |
| Computers & Mathematics | 4 (100.0%) | 0 (0.0%) |
| Architecture & Engineering | 0 (0.0%) | 0 (0.0%) |
| Life, Physical & Social Science | 0 (0.0%) | 0 (0.0%) |
| Community & Social Service | 13 (28.3%) | 33 (71.7%) |
| Education, Arts & Media | 6 (100.0%) | 0 (0.0%) |
| Legal Services & Support | 0 (0.0%) | 0 (0.0%) |
| Education Instruction & Library | 7 (21.2%) | 26 (78.8%) |
| Arts, Media & Entertainment | 0 (0.0%) | 7 (100.0%) |
| Health Diagnosing & Treating | 0 (0.0%) | 7 (100.0%) |
| Health Technologists | 0 (0.0%) | 7 (100.0%) |
| Total (Category) | 31 (36.5%) | 54 (63.5%) |
| Total (Overall) | 232 (58.6%) | 164 (41.4%) |
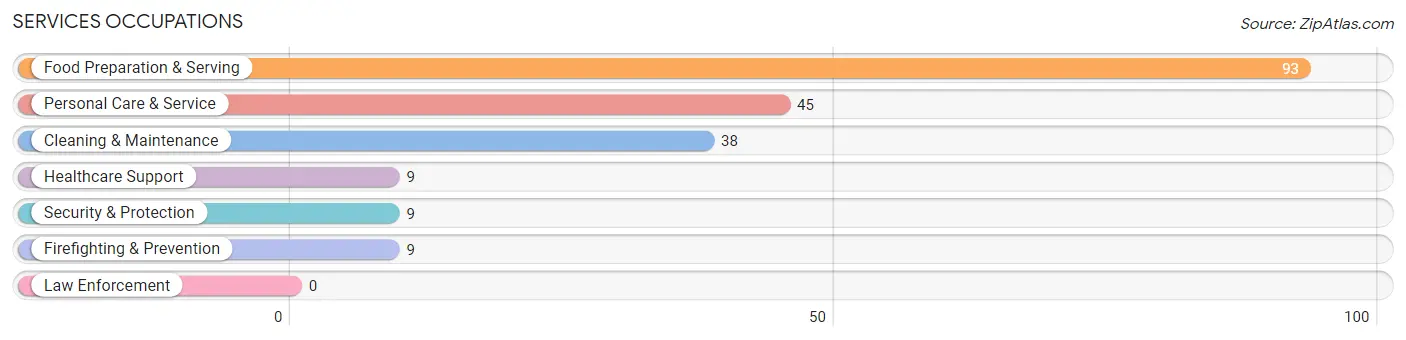
Services Occupations
The most common Services occupations in Mescalero are Food Preparation & Serving (93 | 23.5%), Personal Care & Service (45 | 11.4%), Cleaning & Maintenance (38 | 9.6%), Healthcare Support (9 | 2.3%), and Security & Protection (9 | 2.3%).
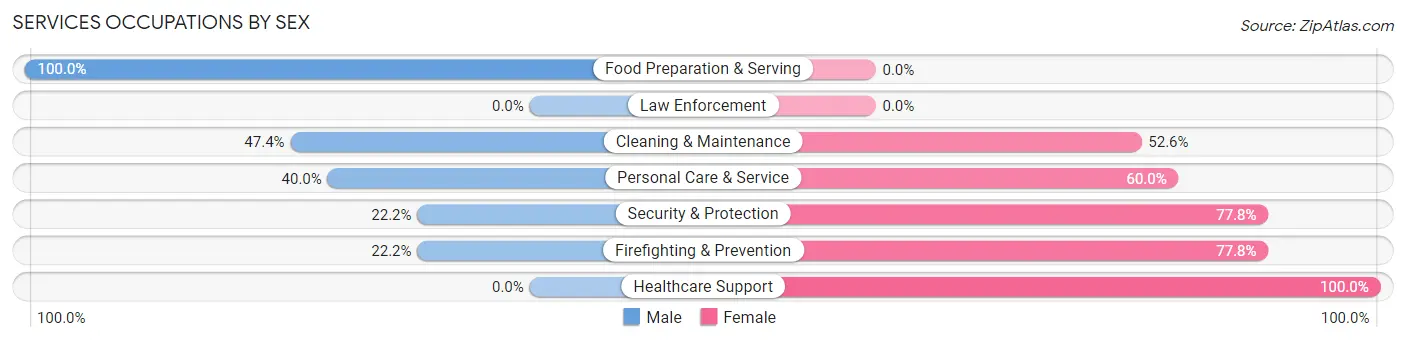
Services Occupations by Sex
Within the Services occupations in Mescalero, the most male-oriented occupations are Food Preparation & Serving (100.0%), Cleaning & Maintenance (47.4%), and Personal Care & Service (40.0%), while the most female-oriented occupations are Healthcare Support (100.0%), Security & Protection (77.8%), and Firefighting & Prevention (77.8%).
| Occupation | Male | Female |
| Healthcare Support | 0 (0.0%) | 9 (100.0%) |
| Security & Protection | 2 (22.2%) | 7 (77.8%) |
| Firefighting & Prevention | 2 (22.2%) | 7 (77.8%) |
| Law Enforcement | 0 (0.0%) | 0 (0.0%) |
| Food Preparation & Serving | 93 (100.0%) | 0 (0.0%) |
| Cleaning & Maintenance | 18 (47.4%) | 20 (52.6%) |
| Personal Care & Service | 18 (40.0%) | 27 (60.0%) |
| Total (Category) | 131 (67.5%) | 63 (32.5%) |
| Total (Overall) | 232 (58.6%) | 164 (41.4%) |
Sales and Office Occupations
The most common Sales and Office occupations in Mescalero are Sales & Related (36 | 9.1%), and Office & Administration (33 | 8.3%).
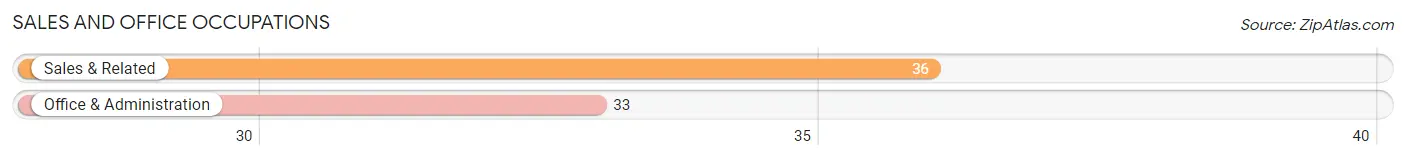
Sales and Office Occupations by Sex
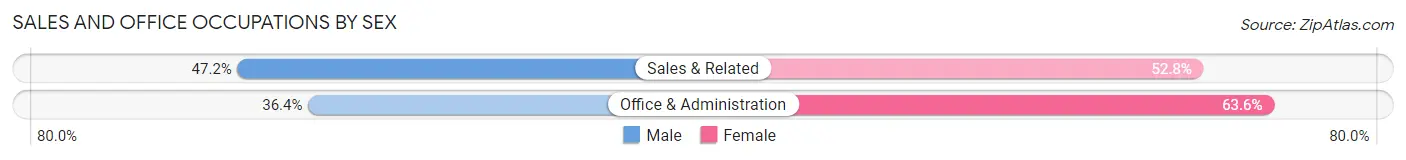
| Occupation | Male | Female |
| Sales & Related | 17 (47.2%) | 19 (52.8%) |
| Office & Administration | 12 (36.4%) | 21 (63.6%) |
| Total (Category) | 29 (42.0%) | 40 (58.0%) |
| Total (Overall) | 232 (58.6%) | 164 (41.4%) |
Natural Resources, Construction and Maintenance Occupations
The most common Natural Resources, Construction and Maintenance occupations in Mescalero are Farming, Fishing & Forestry (10 | 2.5%), Installation, Maintenance & Repair (7 | 1.8%), and Construction & Extraction (5 | 1.3%).
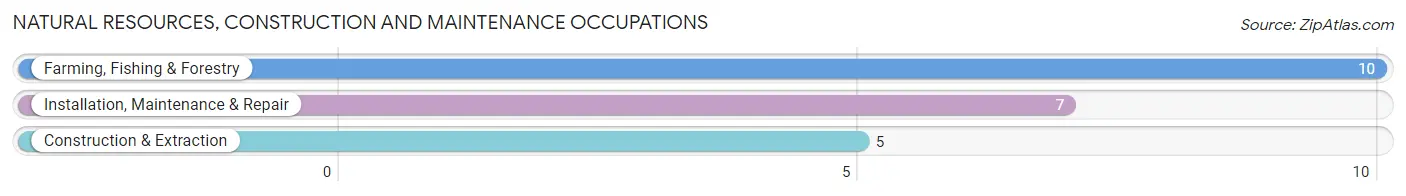
Natural Resources, Construction and Maintenance Occupations by Sex
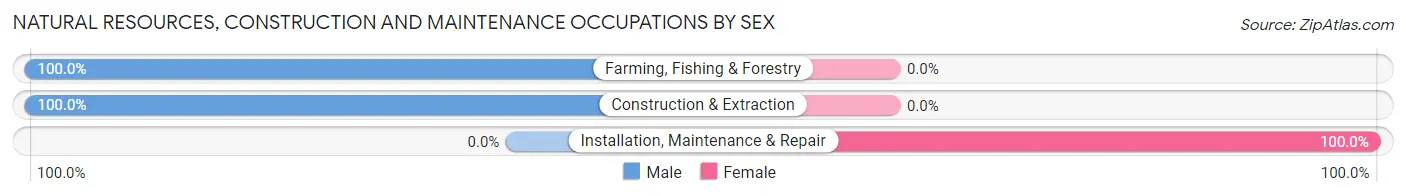
| Occupation | Male | Female |
| Farming, Fishing & Forestry | 10 (100.0%) | 0 (0.0%) |
| Construction & Extraction | 5 (100.0%) | 0 (0.0%) |
| Installation, Maintenance & Repair | 0 (0.0%) | 7 (100.0%) |
| Total (Category) | 15 (68.2%) | 7 (31.8%) |
| Total (Overall) | 232 (58.6%) | 164 (41.4%) |
Production, Transportation and Moving Occupations
The most common Production, Transportation and Moving occupations in Mescalero are Transportation (21 | 5.3%), and Material Moving (5 | 1.3%).
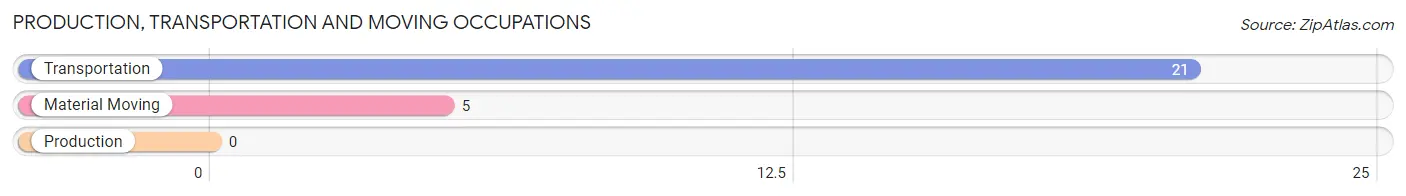
Production, Transportation and Moving Occupations by Sex
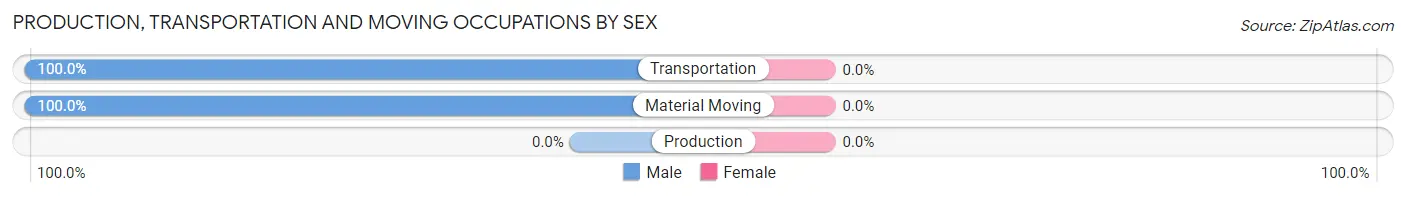
| Occupation | Male | Female |
| Production | 0 (0.0%) | 0 (0.0%) |
| Transportation | 21 (100.0%) | 0 (0.0%) |
| Material Moving | 5 (100.0%) | 0 (0.0%) |
| Total (Category) | 26 (100.0%) | 0 (0.0%) |
| Total (Overall) | 232 (58.6%) | 164 (41.4%) |
Employment Industries by Sex in Mescalero
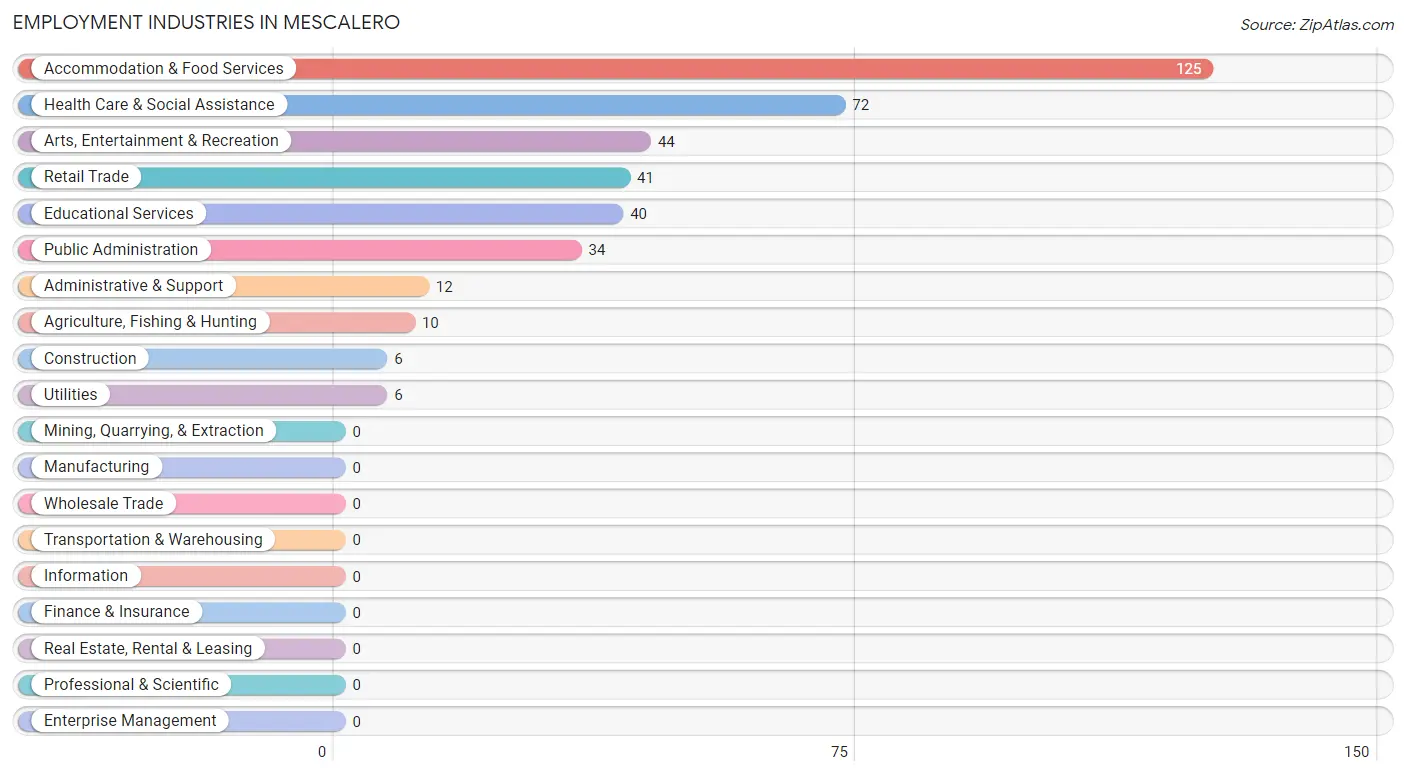
Employment Industries in Mescalero
The major employment industries in Mescalero include Accommodation & Food Services (125 | 31.6%), Health Care & Social Assistance (72 | 18.2%), Arts, Entertainment & Recreation (44 | 11.1%), Retail Trade (41 | 10.3%), and Educational Services (40 | 10.1%).
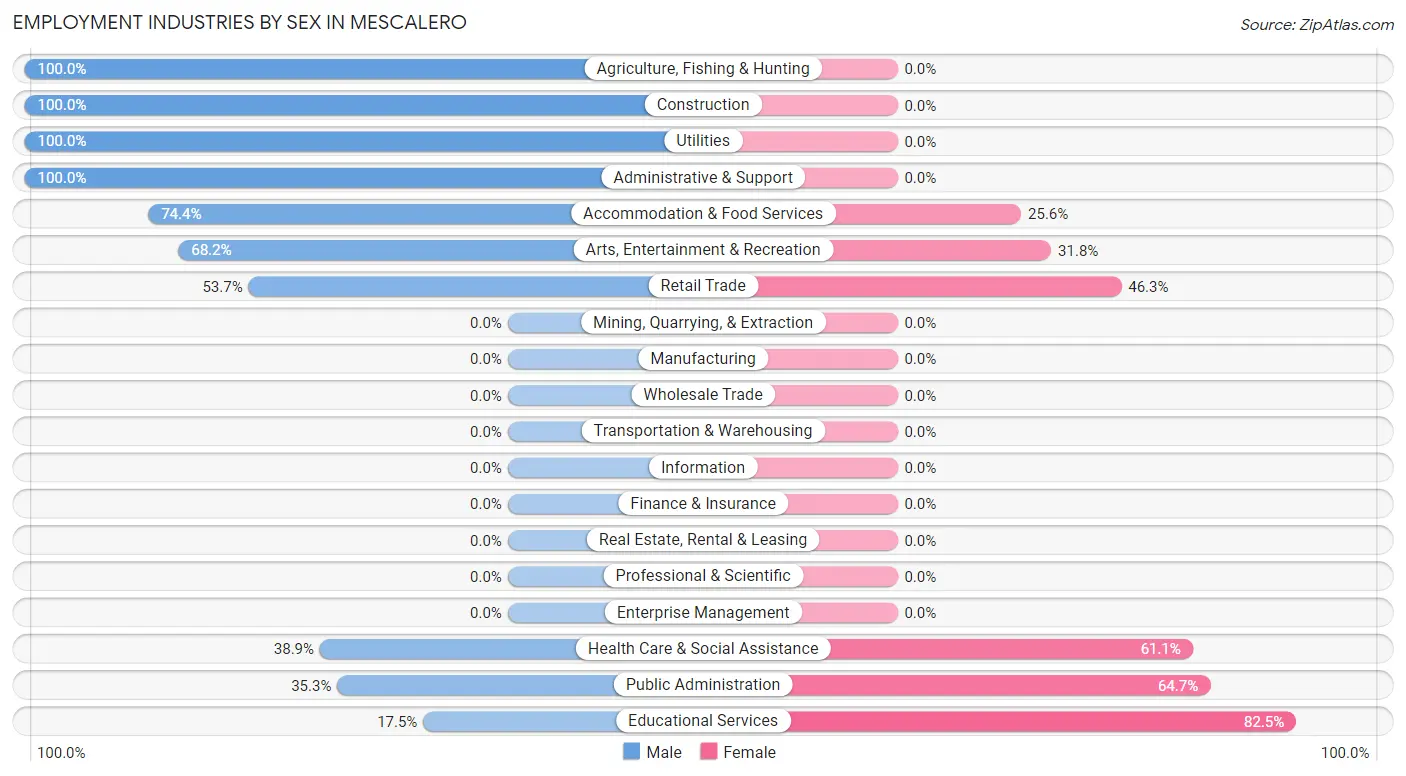
Employment Industries by Sex in Mescalero
The Mescalero industries that see more men than women are Agriculture, Fishing & Hunting (100.0%), Construction (100.0%), and Utilities (100.0%), whereas the industries that tend to have a higher number of women are Educational Services (82.5%), Public Administration (64.7%), and Health Care & Social Assistance (61.1%).
| Industry | Male | Female |
| Agriculture, Fishing & Hunting | 10 (100.0%) | 0 (0.0%) |
| Mining, Quarrying, & Extraction | 0 (0.0%) | 0 (0.0%) |
| Construction | 6 (100.0%) | 0 (0.0%) |
| Manufacturing | 0 (0.0%) | 0 (0.0%) |
| Wholesale Trade | 0 (0.0%) | 0 (0.0%) |
| Retail Trade | 22 (53.7%) | 19 (46.3%) |
| Transportation & Warehousing | 0 (0.0%) | 0 (0.0%) |
| Utilities | 6 (100.0%) | 0 (0.0%) |
| Information | 0 (0.0%) | 0 (0.0%) |
| Finance & Insurance | 0 (0.0%) | 0 (0.0%) |
| Real Estate, Rental & Leasing | 0 (0.0%) | 0 (0.0%) |
| Professional & Scientific | 0 (0.0%) | 0 (0.0%) |
| Enterprise Management | 0 (0.0%) | 0 (0.0%) |
| Administrative & Support | 12 (100.0%) | 0 (0.0%) |
| Educational Services | 7 (17.5%) | 33 (82.5%) |
| Health Care & Social Assistance | 28 (38.9%) | 44 (61.1%) |
| Arts, Entertainment & Recreation | 30 (68.2%) | 14 (31.8%) |
| Accommodation & Food Services | 93 (74.4%) | 32 (25.6%) |
| Public Administration | 12 (35.3%) | 22 (64.7%) |
| Total | 232 (58.6%) | 164 (41.4%) |
Education in Mescalero
School Enrollment in Mescalero
The most common levels of schooling among the 148 students in Mescalero are middle school (37 | 25.0%), college / undergraduate (37 | 25.0%), and high school (35 | 23.6%).
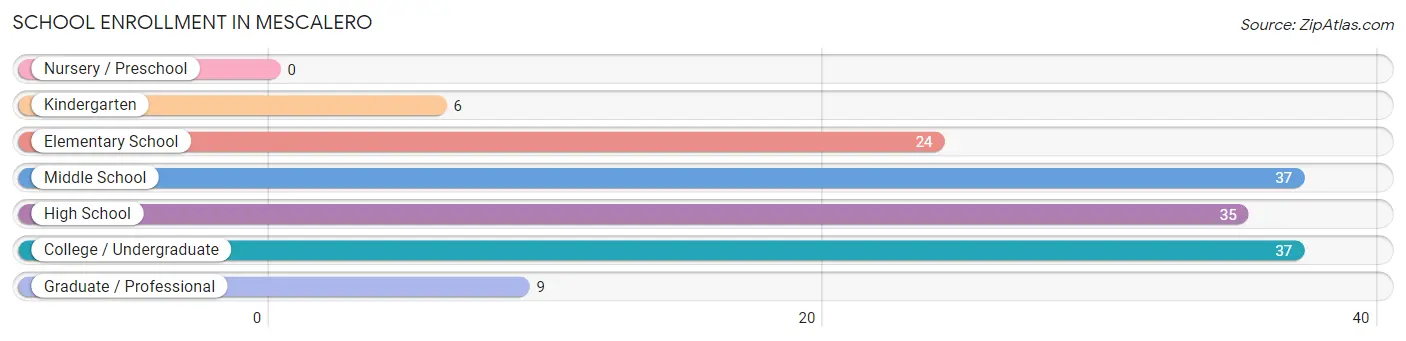
| School Level | # Students | % Students |
| Nursery / Preschool | 0 | 0.0% |
| Kindergarten | 6 | 4.1% |
| Elementary School | 24 | 16.2% |
| Middle School | 37 | 25.0% |
| High School | 35 | 23.6% |
| College / Undergraduate | 37 | 25.0% |
| Graduate / Professional | 9 | 6.1% |
| Total | 148 | 100.0% |
School Enrollment by Age by Funding Source in Mescalero
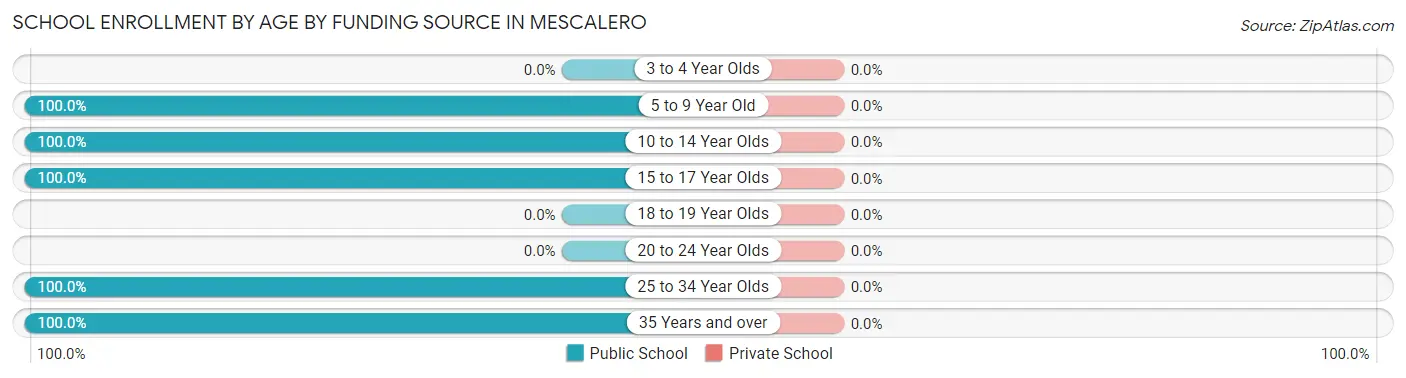
| Age Bracket | Public School | Private School |
| 3 to 4 Year Olds | 0 (0.0%) | 0 (0.0%) |
| 5 to 9 Year Old | 24 (100.0%) | 0 (0.0%) |
| 10 to 14 Year Olds | 30 (100.0%) | 0 (0.0%) |
| 15 to 17 Year Olds | 48 (100.0%) | 0 (0.0%) |
| 18 to 19 Year Olds | 0 (0.0%) | 0 (0.0%) |
| 20 to 24 Year Olds | 0 (0.0%) | 0 (0.0%) |
| 25 to 34 Year Olds | 29 (100.0%) | 0 (0.0%) |
| 35 Years and over | 17 (100.0%) | 0 (0.0%) |
| Total | 148 (100.0%) | 0 (0.0%) |
Educational Attainment by Field of Study in Mescalero
Science & technology (28 | 28.6%), business (17 | 17.3%), bio, nature & agricultural (13 | 13.3%), social sciences (11 | 11.2%), and liberal arts & history (11 | 11.2%) are the most common fields of study among 98 individuals in Mescalero who have obtained a bachelor's degree or higher.
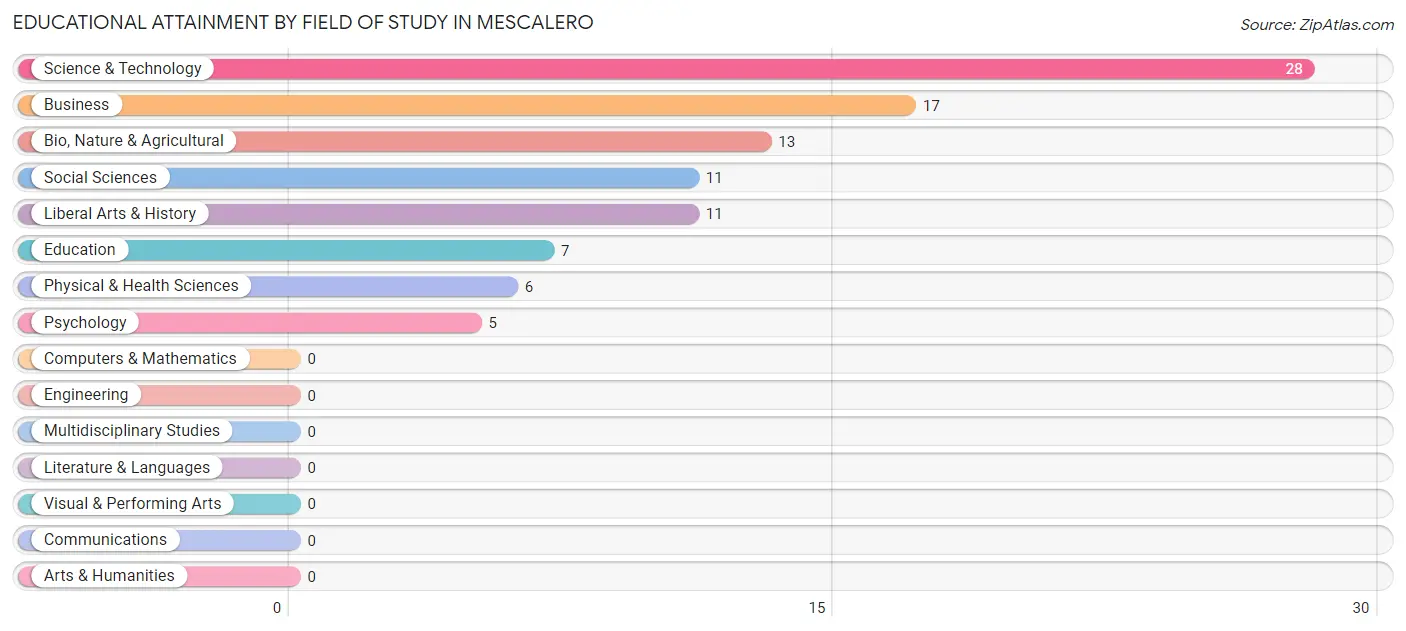
| Field of Study | # Graduates | % Graduates |
| Computers & Mathematics | 0 | 0.0% |
| Bio, Nature & Agricultural | 13 | 13.3% |
| Physical & Health Sciences | 6 | 6.1% |
| Psychology | 5 | 5.1% |
| Social Sciences | 11 | 11.2% |
| Engineering | 0 | 0.0% |
| Multidisciplinary Studies | 0 | 0.0% |
| Science & Technology | 28 | 28.6% |
| Business | 17 | 17.3% |
| Education | 7 | 7.1% |
| Literature & Languages | 0 | 0.0% |
| Liberal Arts & History | 11 | 11.2% |
| Visual & Performing Arts | 0 | 0.0% |
| Communications | 0 | 0.0% |
| Arts & Humanities | 0 | 0.0% |
| Total | 98 | 100.0% |
Transportation & Commute in Mescalero
Vehicle Availability by Sex in Mescalero
The most prevalent vehicle ownership categories in Mescalero are males with 1 vehicle (59, accounting for 28.0%) and females with 1 vehicle (45, making up 36.0%).
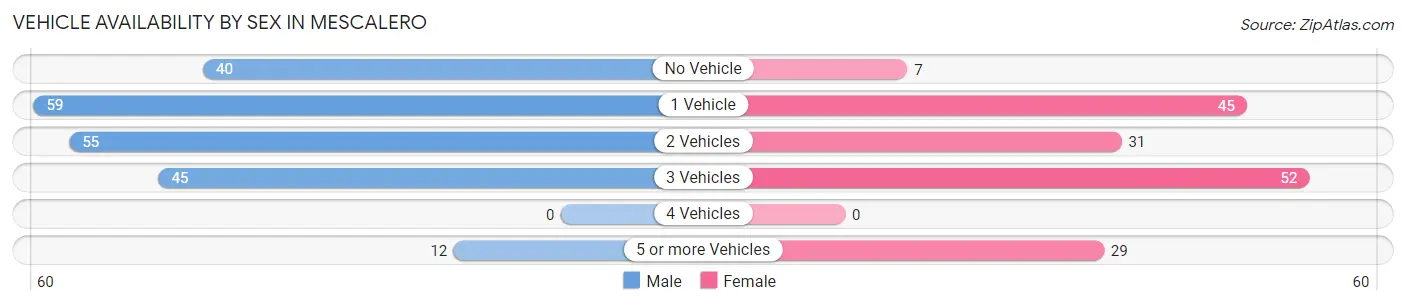
| Vehicles Available | Male | Female |
| No Vehicle | 40 (19.0%) | 7 (4.3%) |
| 1 Vehicle | 59 (28.0%) | 45 (27.4%) |
| 2 Vehicles | 55 (26.1%) | 31 (18.9%) |
| 3 Vehicles | 45 (21.3%) | 52 (31.7%) |
| 4 Vehicles | 0 (0.0%) | 0 (0.0%) |
| 5 or more Vehicles | 12 (5.7%) | 29 (17.7%) |
| Total | 211 (100.0%) | 164 (100.0%) |
Commute Time in Mescalero
The most frequently occuring commute durations in Mescalero are 20 to 24 minutes (69 commuters, 18.4%), 5 to 9 minutes (67 commuters, 17.9%), and 30 to 34 minutes (61 commuters, 16.3%).
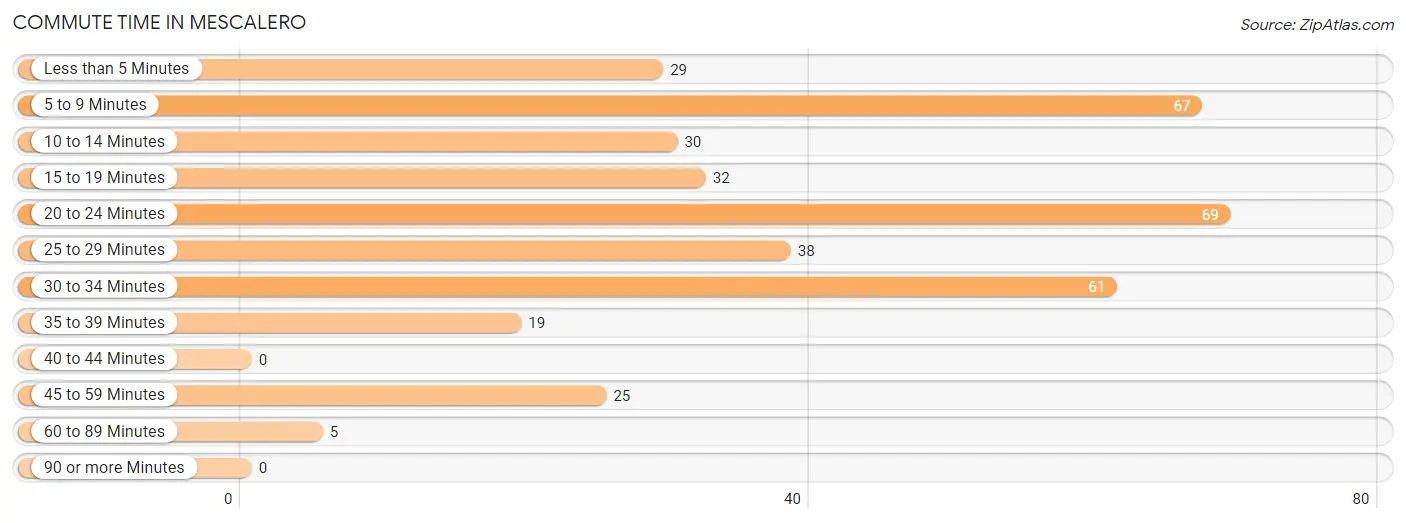
| Commute Time | # Commuters | % Commuters |
| Less than 5 Minutes | 29 | 7.7% |
| 5 to 9 Minutes | 67 | 17.9% |
| 10 to 14 Minutes | 30 | 8.0% |
| 15 to 19 Minutes | 32 | 8.5% |
| 20 to 24 Minutes | 69 | 18.4% |
| 25 to 29 Minutes | 38 | 10.1% |
| 30 to 34 Minutes | 61 | 16.3% |
| 35 to 39 Minutes | 19 | 5.1% |
| 40 to 44 Minutes | 0 | 0.0% |
| 45 to 59 Minutes | 25 | 6.7% |
| 60 to 89 Minutes | 5 | 1.3% |
| 90 or more Minutes | 0 | 0.0% |
Commute Time by Sex in Mescalero
The most common commute times in Mescalero are 20 to 24 minutes (42 commuters, 19.9%) for males and 5 to 9 minutes (34 commuters, 20.7%) for females.
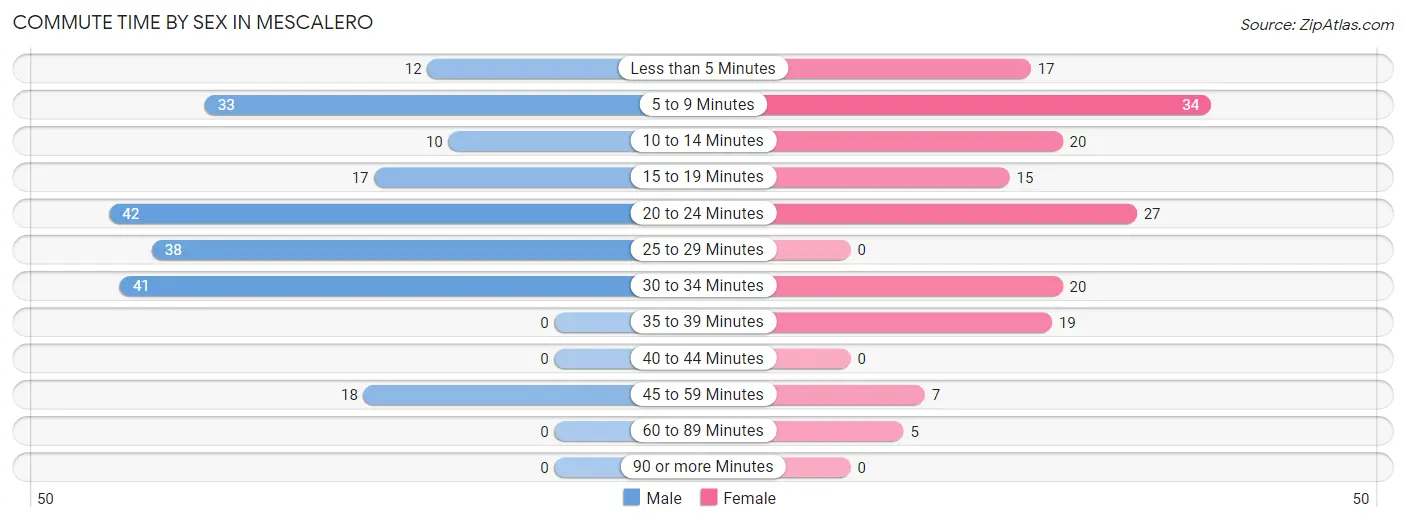
| Commute Time | Male | Female |
| Less than 5 Minutes | 12 (5.7%) | 17 (10.4%) |
| 5 to 9 Minutes | 33 (15.6%) | 34 (20.7%) |
| 10 to 14 Minutes | 10 (4.7%) | 20 (12.2%) |
| 15 to 19 Minutes | 17 (8.1%) | 15 (9.1%) |
| 20 to 24 Minutes | 42 (19.9%) | 27 (16.5%) |
| 25 to 29 Minutes | 38 (18.0%) | 0 (0.0%) |
| 30 to 34 Minutes | 41 (19.4%) | 20 (12.2%) |
| 35 to 39 Minutes | 0 (0.0%) | 19 (11.6%) |
| 40 to 44 Minutes | 0 (0.0%) | 0 (0.0%) |
| 45 to 59 Minutes | 18 (8.5%) | 7 (4.3%) |
| 60 to 89 Minutes | 0 (0.0%) | 5 (3.0%) |
| 90 or more Minutes | 0 (0.0%) | 0 (0.0%) |
Time of Departure to Work by Sex in Mescalero
The most frequent times of departure to work in Mescalero are 6:30 AM to 6:59 AM (68, 32.2%) for males and 6:30 AM to 6:59 AM (56, 34.2%) for females.
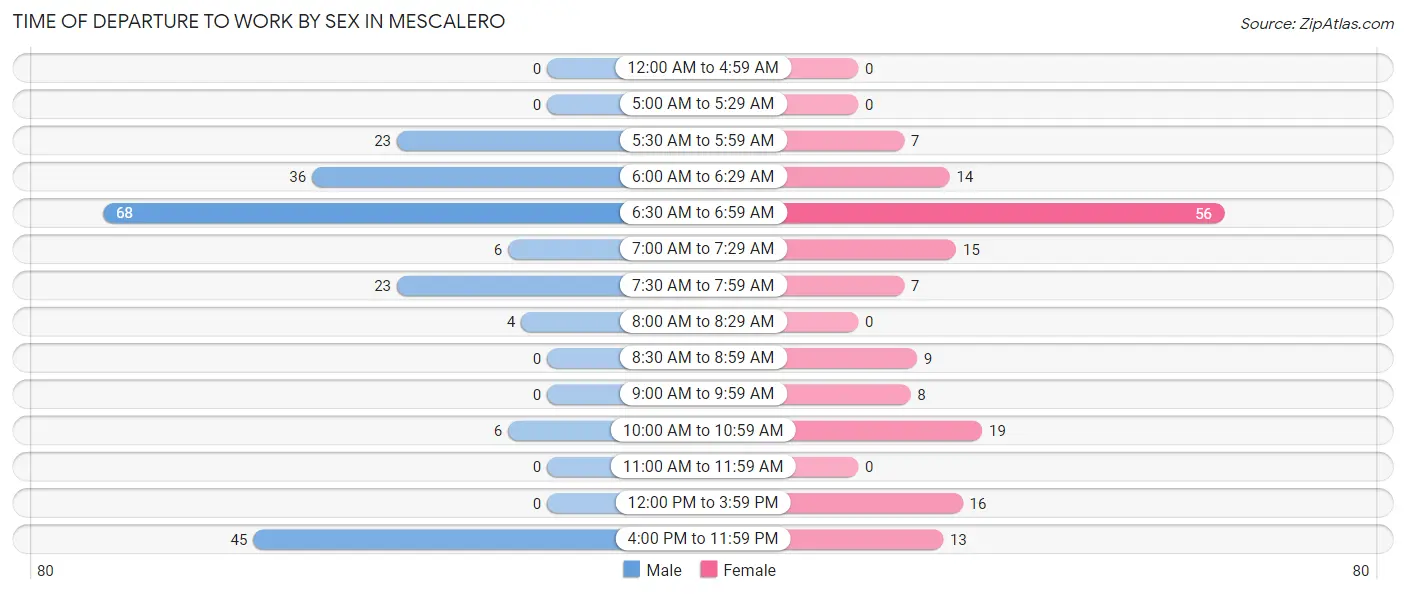
| Time of Departure | Male | Female |
| 12:00 AM to 4:59 AM | 0 (0.0%) | 0 (0.0%) |
| 5:00 AM to 5:29 AM | 0 (0.0%) | 0 (0.0%) |
| 5:30 AM to 5:59 AM | 23 (10.9%) | 7 (4.3%) |
| 6:00 AM to 6:29 AM | 36 (17.1%) | 14 (8.5%) |
| 6:30 AM to 6:59 AM | 68 (32.2%) | 56 (34.2%) |
| 7:00 AM to 7:29 AM | 6 (2.8%) | 15 (9.1%) |
| 7:30 AM to 7:59 AM | 23 (10.9%) | 7 (4.3%) |
| 8:00 AM to 8:29 AM | 4 (1.9%) | 0 (0.0%) |
| 8:30 AM to 8:59 AM | 0 (0.0%) | 9 (5.5%) |
| 9:00 AM to 9:59 AM | 0 (0.0%) | 8 (4.9%) |
| 10:00 AM to 10:59 AM | 6 (2.8%) | 19 (11.6%) |
| 11:00 AM to 11:59 AM | 0 (0.0%) | 0 (0.0%) |
| 12:00 PM to 3:59 PM | 0 (0.0%) | 16 (9.8%) |
| 4:00 PM to 11:59 PM | 45 (21.3%) | 13 (7.9%) |
| Total | 211 (100.0%) | 164 (100.0%) |
Housing Occupancy in Mescalero
Occupancy by Ownership in Mescalero
Of the total 336 dwellings in Mescalero, owner-occupied units account for 228 (67.9%), while renter-occupied units make up 108 (32.1%).
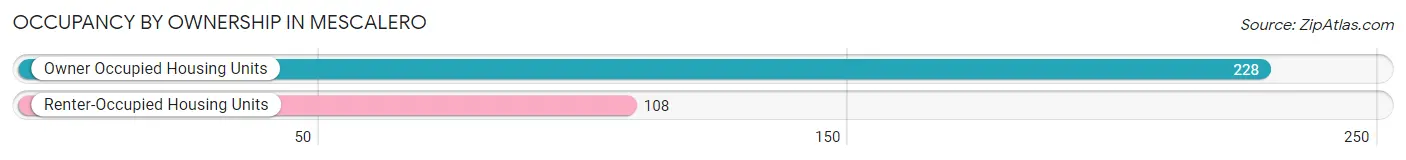
| Occupancy | # Housing Units | % Housing Units |
| Owner Occupied Housing Units | 228 | 67.9% |
| Renter-Occupied Housing Units | 108 | 32.1% |
| Total Occupied Housing Units | 336 | 100.0% |
Occupancy by Household Size in Mescalero
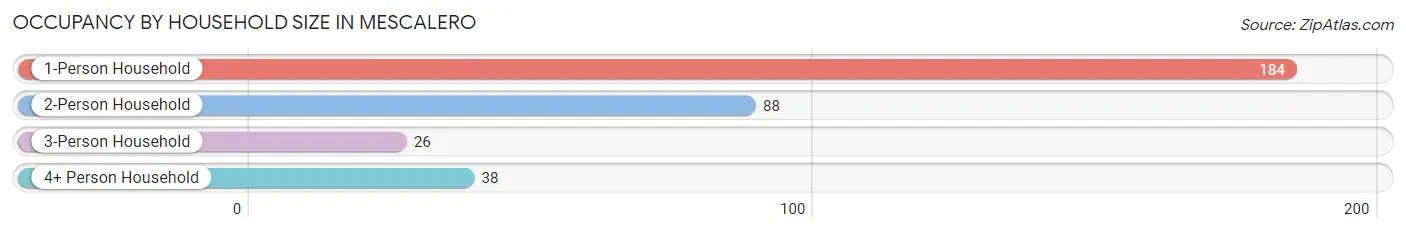
| Household Size | # Housing Units | % Housing Units |
| 1-Person Household | 184 | 54.8% |
| 2-Person Household | 88 | 26.2% |
| 3-Person Household | 26 | 7.7% |
| 4+ Person Household | 38 | 11.3% |
| Total Housing Units | 336 | 100.0% |
Occupancy by Ownership by Household Size in Mescalero
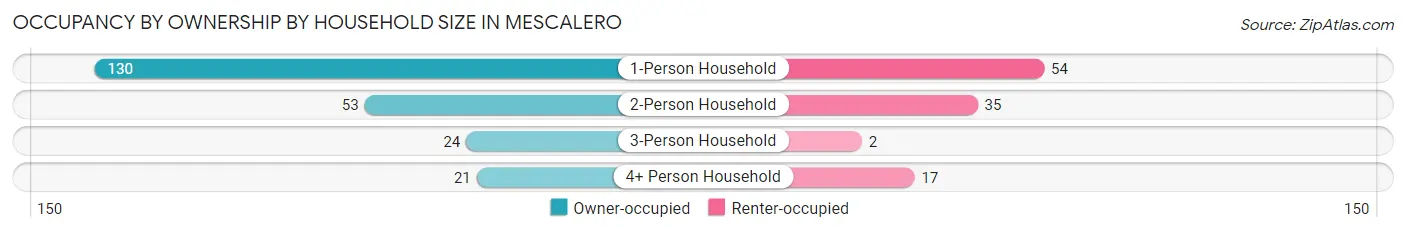
| Household Size | Owner-occupied | Renter-occupied |
| 1-Person Household | 130 (70.7%) | 54 (29.3%) |
| 2-Person Household | 53 (60.2%) | 35 (39.8%) |
| 3-Person Household | 24 (92.3%) | 2 (7.7%) |
| 4+ Person Household | 21 (55.3%) | 17 (44.7%) |
| Total Housing Units | 228 (67.9%) | 108 (32.1%) |
Occupancy by Educational Attainment in Mescalero
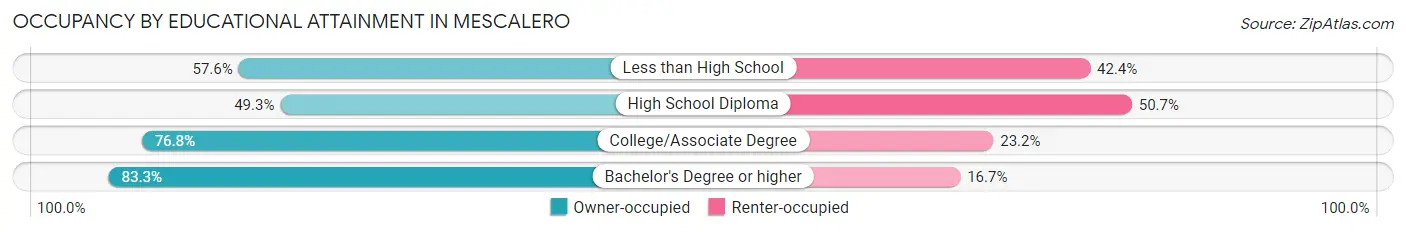
| Household Size | Owner-occupied | Renter-occupied |
| Less than High School | 38 (57.6%) | 28 (42.4%) |
| High School Diploma | 36 (49.3%) | 37 (50.7%) |
| College/Associate Degree | 119 (76.8%) | 36 (23.2%) |
| Bachelor's Degree or higher | 35 (83.3%) | 7 (16.7%) |
Occupancy by Age of Householder in Mescalero
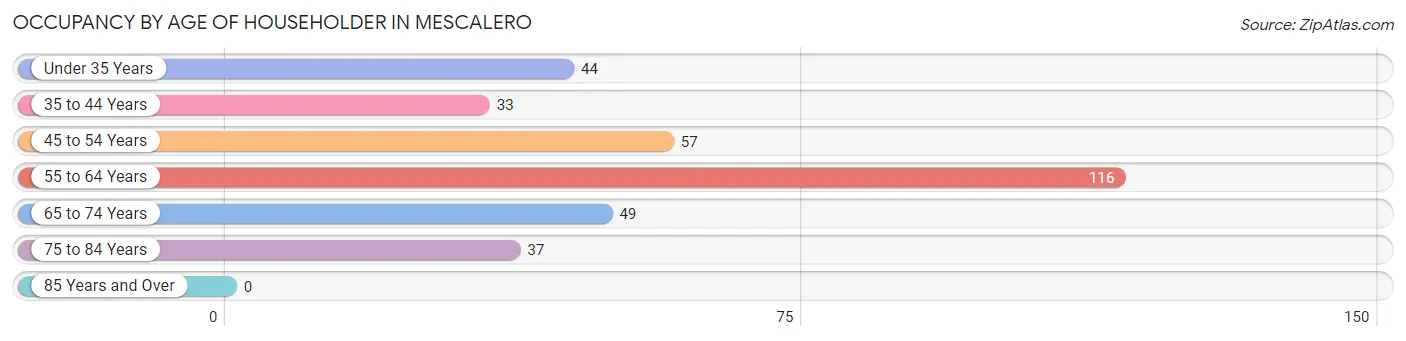
| Age Bracket | # Households | % Households |
| Under 35 Years | 44 | 13.1% |
| 35 to 44 Years | 33 | 9.8% |
| 45 to 54 Years | 57 | 17.0% |
| 55 to 64 Years | 116 | 34.5% |
| 65 to 74 Years | 49 | 14.6% |
| 75 to 84 Years | 37 | 11.0% |
| 85 Years and Over | 0 | 0.0% |
| Total | 336 | 100.0% |
Housing Finances in Mescalero
Median Income by Occupancy in Mescalero
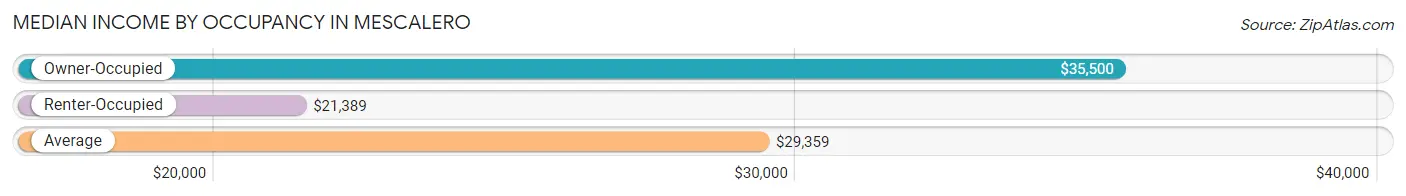
| Occupancy Type | # Households | Median Income |
| Owner-Occupied | 228 (67.9%) | $35,500 |
| Renter-Occupied | 108 (32.1%) | $21,389 |
| Average | 336 (100.0%) | $29,359 |
Occupancy by Householder Income Bracket in Mescalero
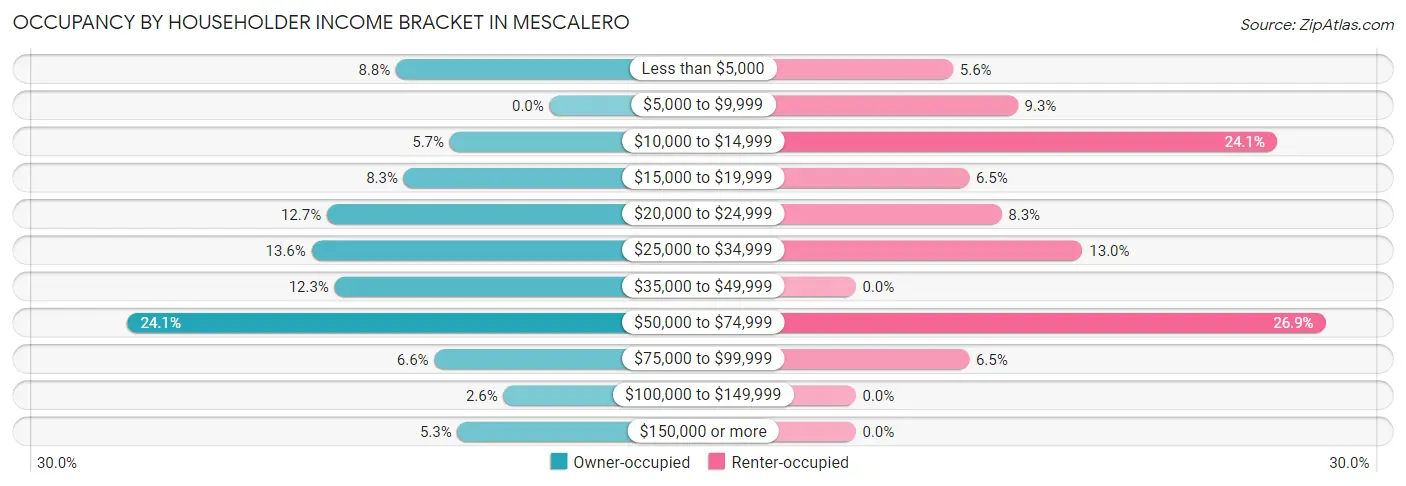
| Income Bracket | Owner-occupied | Renter-occupied |
| Less than $5,000 | 20 (8.8%) | 6 (5.6%) |
| $5,000 to $9,999 | 0 (0.0%) | 10 (9.3%) |
| $10,000 to $14,999 | 13 (5.7%) | 26 (24.1%) |
| $15,000 to $19,999 | 19 (8.3%) | 7 (6.5%) |
| $20,000 to $24,999 | 29 (12.7%) | 9 (8.3%) |
| $25,000 to $34,999 | 31 (13.6%) | 14 (13.0%) |
| $35,000 to $49,999 | 28 (12.3%) | 0 (0.0%) |
| $50,000 to $74,999 | 55 (24.1%) | 29 (26.9%) |
| $75,000 to $99,999 | 15 (6.6%) | 7 (6.5%) |
| $100,000 to $149,999 | 6 (2.6%) | 0 (0.0%) |
| $150,000 or more | 12 (5.3%) | 0 (0.0%) |
| Total | 228 (100.0%) | 108 (100.0%) |
Monthly Housing Cost Tiers in Mescalero
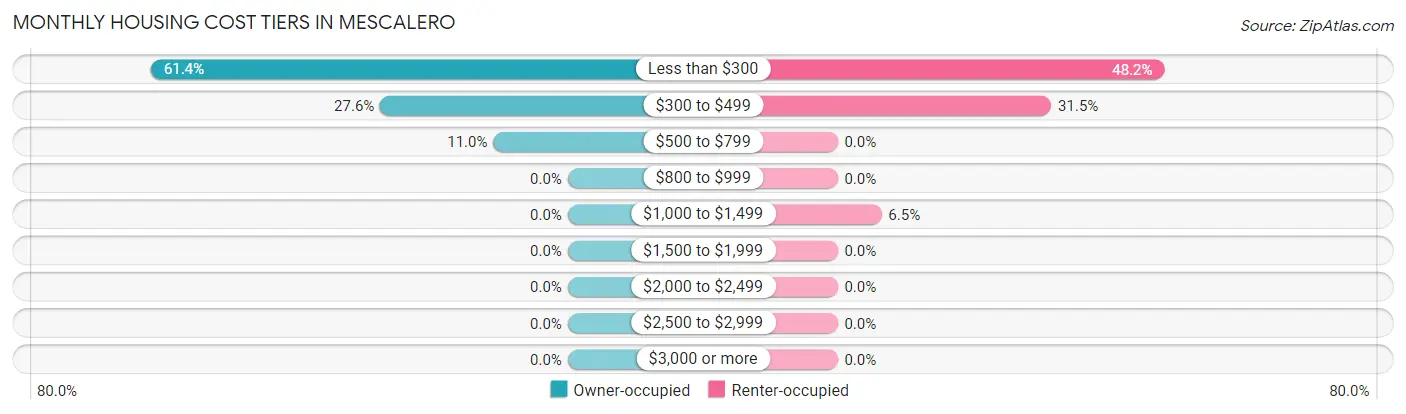
| Monthly Cost | Owner-occupied | Renter-occupied |
| Less than $300 | 140 (61.4%) | 52 (48.1%) |
| $300 to $499 | 63 (27.6%) | 34 (31.5%) |
| $500 to $799 | 25 (11.0%) | 0 (0.0%) |
| $800 to $999 | 0 (0.0%) | 0 (0.0%) |
| $1,000 to $1,499 | 0 (0.0%) | 7 (6.5%) |
| $1,500 to $1,999 | 0 (0.0%) | 0 (0.0%) |
| $2,000 to $2,499 | 0 (0.0%) | 0 (0.0%) |
| $2,500 to $2,999 | 0 (0.0%) | 0 (0.0%) |
| $3,000 or more | 0 (0.0%) | 0 (0.0%) |
| Total | 228 (100.0%) | 108 (100.0%) |
Physical Housing Characteristics in Mescalero
Housing Structures in Mescalero
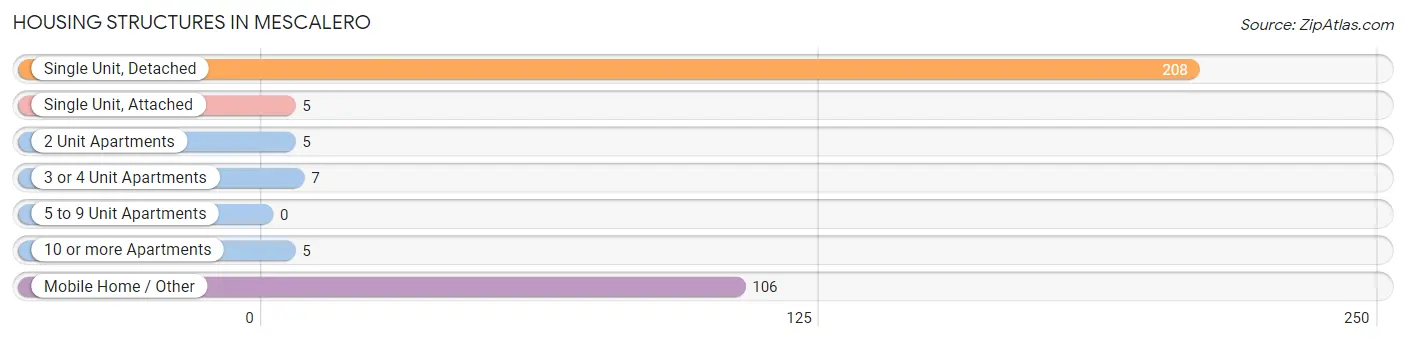
| Structure Type | # Housing Units | % Housing Units |
| Single Unit, Detached | 208 | 61.9% |
| Single Unit, Attached | 5 | 1.5% |
| 2 Unit Apartments | 5 | 1.5% |
| 3 or 4 Unit Apartments | 7 | 2.1% |
| 5 to 9 Unit Apartments | 0 | 0.0% |
| 10 or more Apartments | 5 | 1.5% |
| Mobile Home / Other | 106 | 31.6% |
| Total | 336 | 100.0% |
Housing Structures by Occupancy in Mescalero
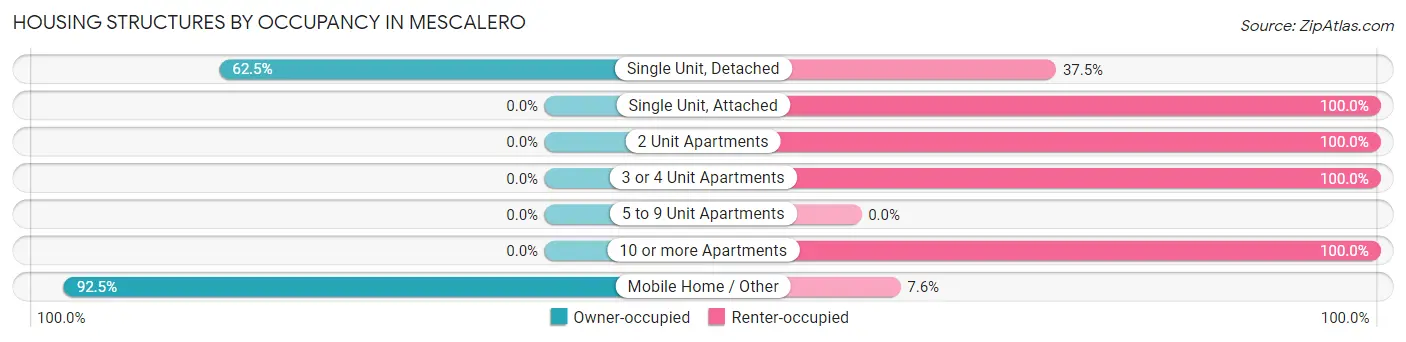
| Structure Type | Owner-occupied | Renter-occupied |
| Single Unit, Detached | 130 (62.5%) | 78 (37.5%) |
| Single Unit, Attached | 0 (0.0%) | 5 (100.0%) |
| 2 Unit Apartments | 0 (0.0%) | 5 (100.0%) |
| 3 or 4 Unit Apartments | 0 (0.0%) | 7 (100.0%) |
| 5 to 9 Unit Apartments | 0 (0.0%) | 0 (0.0%) |
| 10 or more Apartments | 0 (0.0%) | 5 (100.0%) |
| Mobile Home / Other | 98 (92.4%) | 8 (7.5%) |
| Total | 228 (67.9%) | 108 (32.1%) |
Housing Structures by Number of Rooms in Mescalero
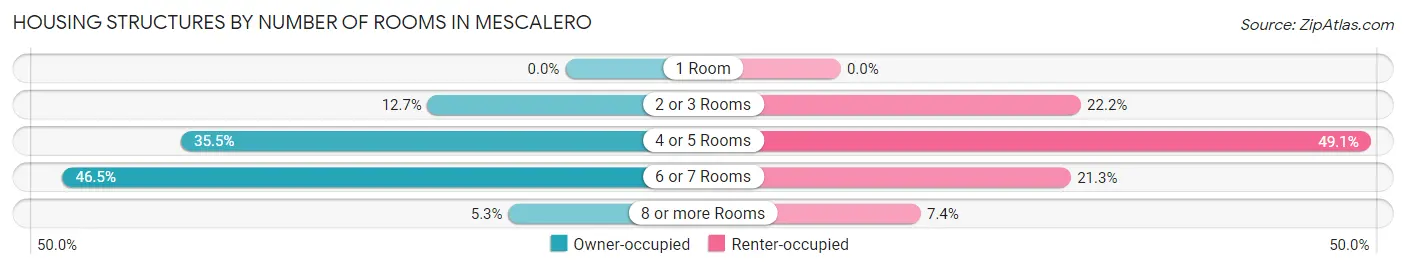
| Number of Rooms | Owner-occupied | Renter-occupied |
| 1 Room | 0 (0.0%) | 0 (0.0%) |
| 2 or 3 Rooms | 29 (12.7%) | 24 (22.2%) |
| 4 or 5 Rooms | 81 (35.5%) | 53 (49.1%) |
| 6 or 7 Rooms | 106 (46.5%) | 23 (21.3%) |
| 8 or more Rooms | 12 (5.3%) | 8 (7.4%) |
| Total | 228 (100.0%) | 108 (100.0%) |
Housing Structure by Heating Type in Mescalero
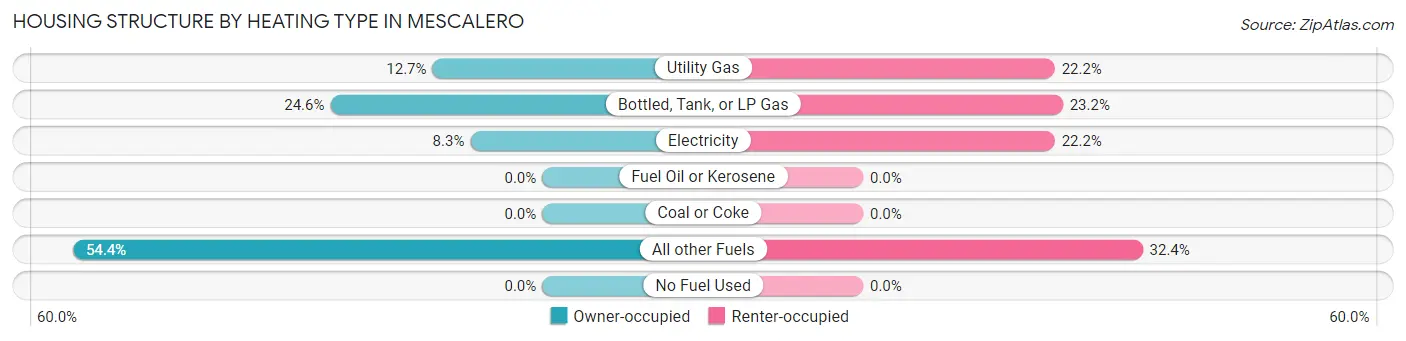
| Heating Type | Owner-occupied | Renter-occupied |
| Utility Gas | 29 (12.7%) | 24 (22.2%) |
| Bottled, Tank, or LP Gas | 56 (24.6%) | 25 (23.2%) |
| Electricity | 19 (8.3%) | 24 (22.2%) |
| Fuel Oil or Kerosene | 0 (0.0%) | 0 (0.0%) |
| Coal or Coke | 0 (0.0%) | 0 (0.0%) |
| All other Fuels | 124 (54.4%) | 35 (32.4%) |
| No Fuel Used | 0 (0.0%) | 0 (0.0%) |
| Total | 228 (100.0%) | 108 (100.0%) |
Household Vehicle Usage in Mescalero
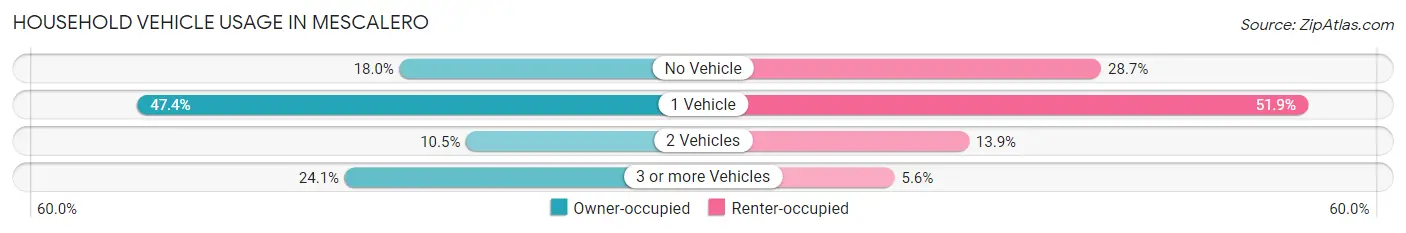
| Vehicles per Household | Owner-occupied | Renter-occupied |
| No Vehicle | 41 (18.0%) | 31 (28.7%) |
| 1 Vehicle | 108 (47.4%) | 56 (51.8%) |
| 2 Vehicles | 24 (10.5%) | 15 (13.9%) |
| 3 or more Vehicles | 55 (24.1%) | 6 (5.6%) |
| Total | 228 (100.0%) | 108 (100.0%) |
Real Estate & Mortgages in Mescalero
Real Estate and Mortgage Overview in Mescalero
| Characteristic | Without Mortgage | With Mortgage |
| Housing Units | 209 | 19 |
| Median Property Value | $31,600 | $55,600 |
| Median Household Income | $29,798 | $0 |
| Monthly Housing Costs | $182 | $0 |
| Real Estate Taxes | - | - |
Property Value by Mortgage Status in Mescalero
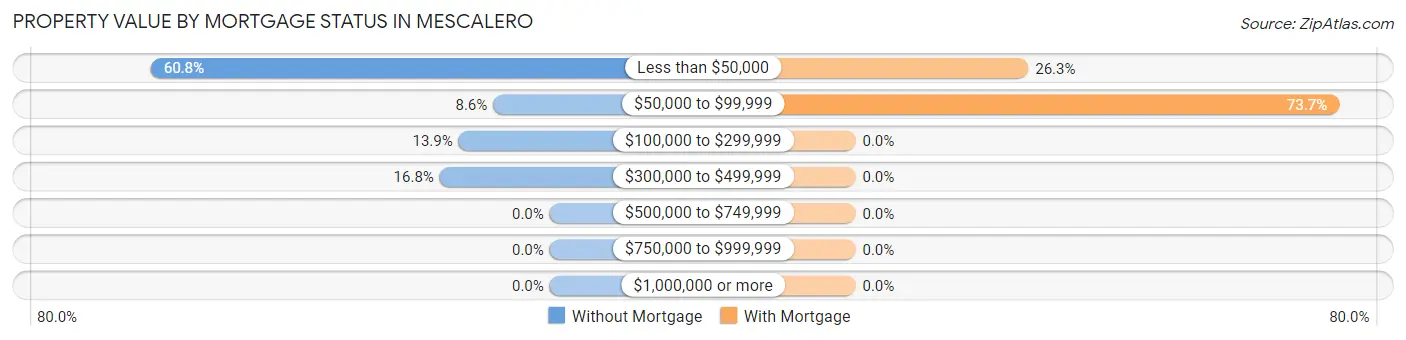
| Property Value | Without Mortgage | With Mortgage |
| Less than $50,000 | 127 (60.8%) | 5 (26.3%) |
| $50,000 to $99,999 | 18 (8.6%) | 14 (73.7%) |
| $100,000 to $299,999 | 29 (13.9%) | 0 (0.0%) |
| $300,000 to $499,999 | 35 (16.8%) | 0 (0.0%) |
| $500,000 to $749,999 | 0 (0.0%) | 0 (0.0%) |
| $750,000 to $999,999 | 0 (0.0%) | 0 (0.0%) |
| $1,000,000 or more | 0 (0.0%) | 0 (0.0%) |
| Total | 209 (100.0%) | 19 (100.0%) |
Household Income by Mortgage Status in Mescalero
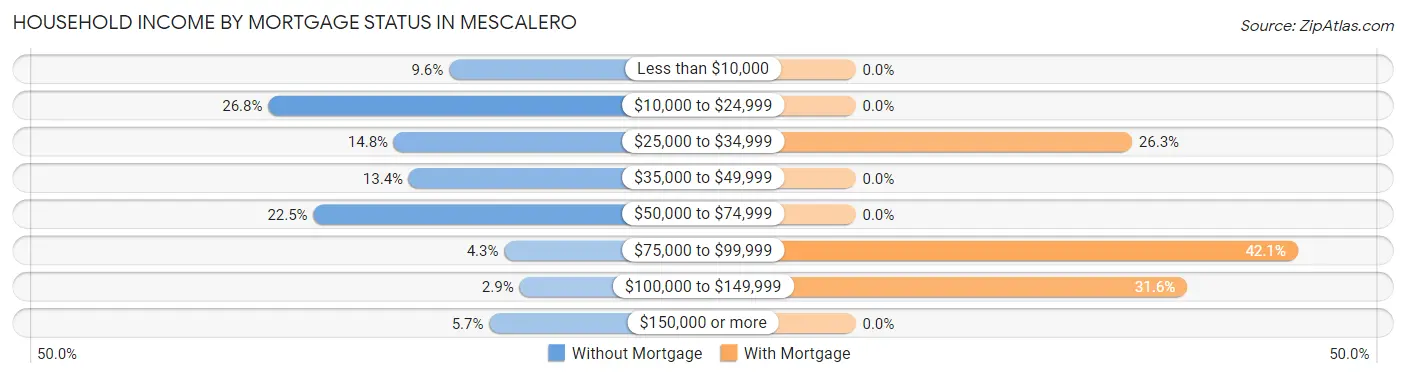
| Household Income | Without Mortgage | With Mortgage |
| Less than $10,000 | 20 (9.6%) | 0 (0.0%) |
| $10,000 to $24,999 | 56 (26.8%) | 0 (0.0%) |
| $25,000 to $34,999 | 31 (14.8%) | 5 (26.3%) |
| $35,000 to $49,999 | 28 (13.4%) | 0 (0.0%) |
| $50,000 to $74,999 | 47 (22.5%) | 0 (0.0%) |
| $75,000 to $99,999 | 9 (4.3%) | 8 (42.1%) |
| $100,000 to $149,999 | 6 (2.9%) | 6 (31.6%) |
| $150,000 or more | 12 (5.7%) | 0 (0.0%) |
| Total | 209 (100.0%) | 19 (100.0%) |
Property Value to Household Income Ratio in Mescalero
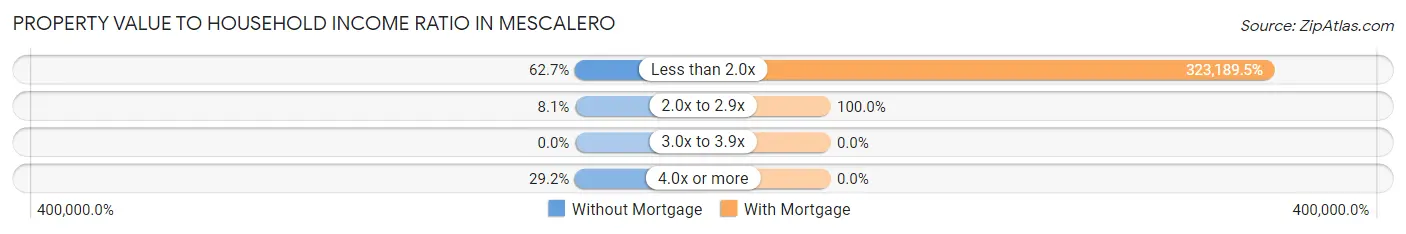
| Value-to-Income Ratio | Without Mortgage | With Mortgage |
| Less than 2.0x | 131 (62.7%) | 61,406 (323,189.5%) |
| 2.0x to 2.9x | 17 (8.1%) | 19 (100.0%) |
| 3.0x to 3.9x | 0 (0.0%) | 0 (0.0%) |
| 4.0x or more | 61 (29.2%) | 0 (0.0%) |
| Total | 209 (100.0%) | 19 (100.0%) |
Real Estate Taxes by Mortgage Status in Mescalero
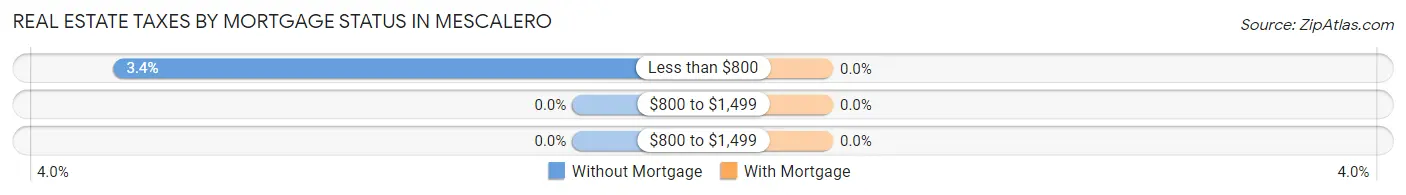
| Property Taxes | Without Mortgage | With Mortgage |
| Less than $800 | 7 (3.4%) | 0 (0.0%) |
| $800 to $1,499 | 0 (0.0%) | 0 (0.0%) |
| $800 to $1,499 | 0 (0.0%) | 0 (0.0%) |
| Total | 209 (100.0%) | 19 (100.0%) |
Health & Disability in Mescalero
Health Insurance Coverage by Age in Mescalero
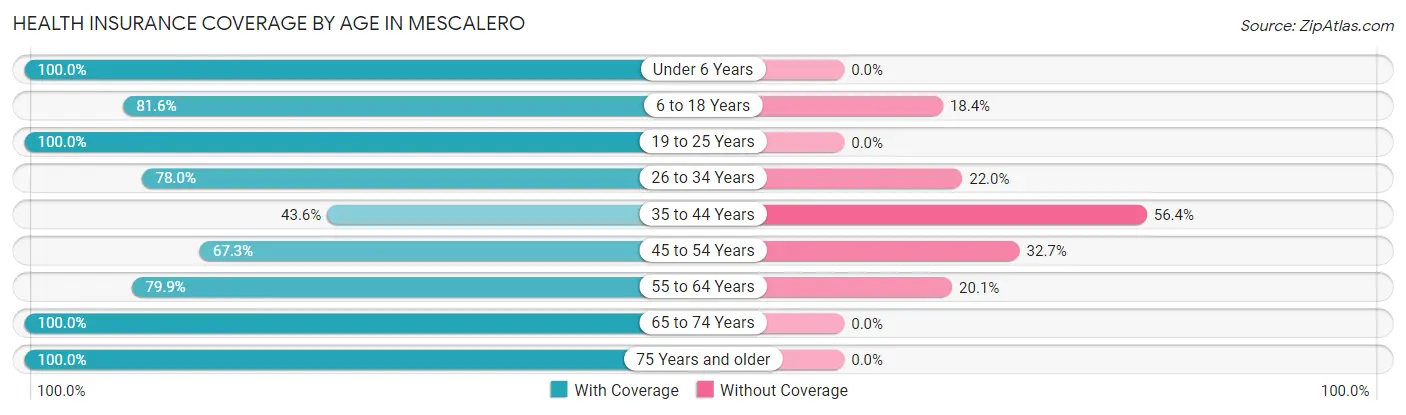
| Age Bracket | With Coverage | Without Coverage |
| Under 6 Years | 17 (100.0%) | 0 (0.0%) |
| 6 to 18 Years | 102 (81.6%) | 23 (18.4%) |
| 19 to 25 Years | 65 (100.0%) | 0 (0.0%) |
| 26 to 34 Years | 117 (78.0%) | 33 (22.0%) |
| 35 to 44 Years | 34 (43.6%) | 44 (56.4%) |
| 45 to 54 Years | 70 (67.3%) | 34 (32.7%) |
| 55 to 64 Years | 139 (79.9%) | 35 (20.1%) |
| 65 to 74 Years | 86 (100.0%) | 0 (0.0%) |
| 75 Years and older | 37 (100.0%) | 0 (0.0%) |
| Total | 667 (79.8%) | 169 (20.2%) |
Health Insurance Coverage by Citizenship Status in Mescalero
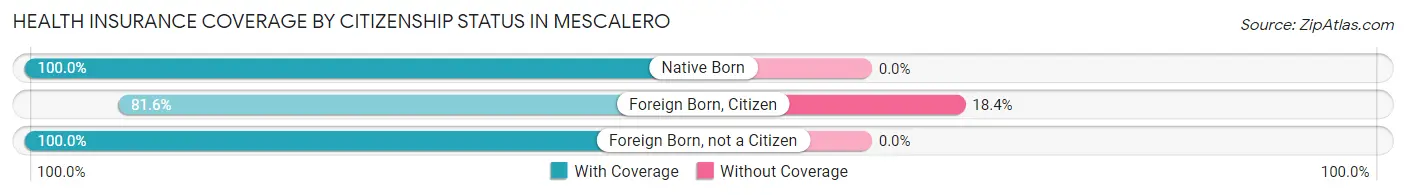
| Citizenship Status | With Coverage | Without Coverage |
| Native Born | 17 (100.0%) | 0 (0.0%) |
| Foreign Born, Citizen | 102 (81.6%) | 23 (18.4%) |
| Foreign Born, not a Citizen | 65 (100.0%) | 0 (0.0%) |
Health Insurance Coverage by Household Income in Mescalero
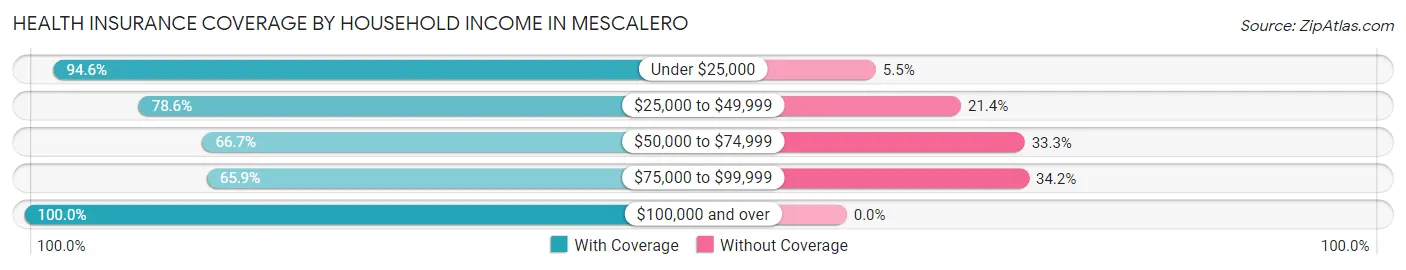
| Household Income | With Coverage | Without Coverage |
| Under $25,000 | 191 (94.6%) | 11 (5.4%) |
| $25,000 to $49,999 | 191 (78.6%) | 52 (21.4%) |
| $50,000 to $74,999 | 128 (66.7%) | 64 (33.3%) |
| $75,000 to $99,999 | 81 (65.8%) | 42 (34.2%) |
| $100,000 and over | 70 (100.0%) | 0 (0.0%) |
Public vs Private Health Insurance Coverage by Age in Mescalero
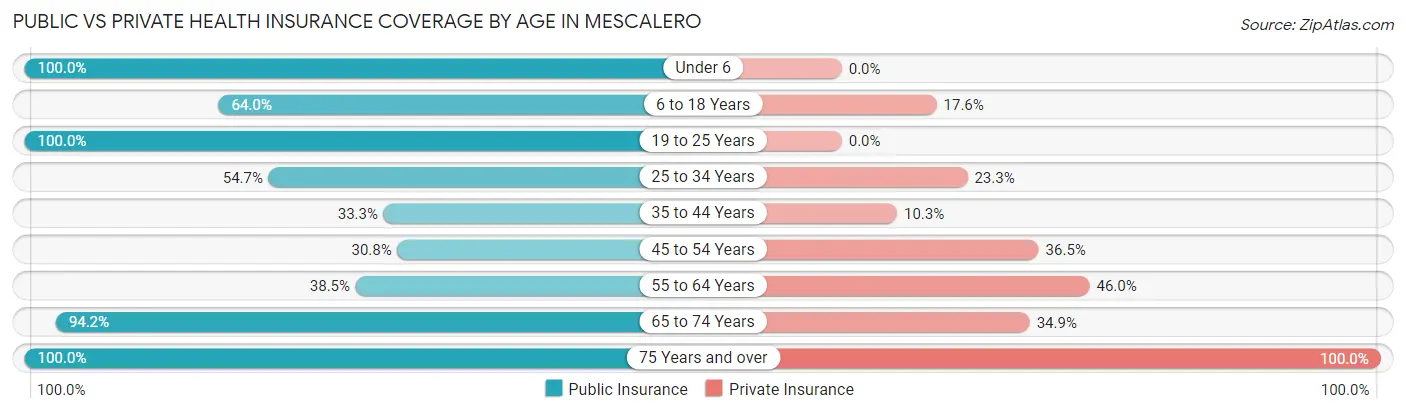
| Age Bracket | Public Insurance | Private Insurance |
| Under 6 | 17 (100.0%) | 0 (0.0%) |
| 6 to 18 Years | 80 (64.0%) | 22 (17.6%) |
| 19 to 25 Years | 65 (100.0%) | 0 (0.0%) |
| 25 to 34 Years | 82 (54.7%) | 35 (23.3%) |
| 35 to 44 Years | 26 (33.3%) | 8 (10.3%) |
| 45 to 54 Years | 32 (30.8%) | 38 (36.5%) |
| 55 to 64 Years | 67 (38.5%) | 80 (46.0%) |
| 65 to 74 Years | 81 (94.2%) | 30 (34.9%) |
| 75 Years and over | 37 (100.0%) | 37 (100.0%) |
| Total | 487 (58.3%) | 250 (29.9%) |
Disability Status by Sex by Age in Mescalero
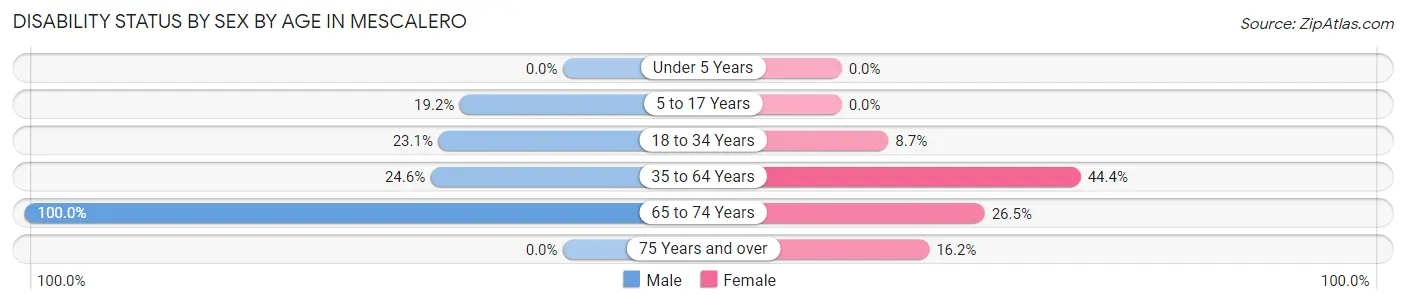
| Age Bracket | Male | Female |
| Under 5 Years | 0 (0.0%) | 0 (0.0%) |
| 5 to 17 Years | 9 (19.2%) | 0 (0.0%) |
| 18 to 34 Years | 31 (23.1%) | 9 (8.6%) |
| 35 to 64 Years | 57 (24.6%) | 55 (44.4%) |
| 65 to 74 Years | 37 (100.0%) | 13 (26.5%) |
| 75 Years and over | 0 (0.0%) | 6 (16.2%) |
Disability Class by Sex by Age in Mescalero
Disability Class: Hearing Difficulty
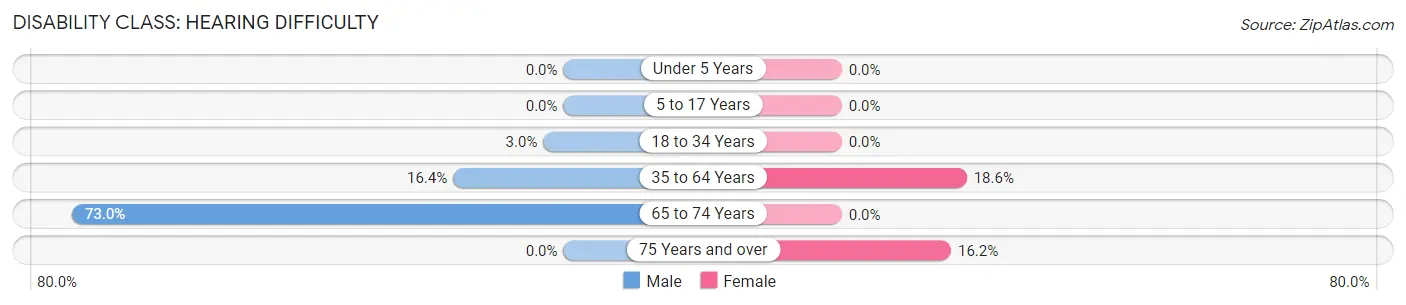
| Age Bracket | Male | Female |
| Under 5 Years | 0 (0.0%) | 0 (0.0%) |
| 5 to 17 Years | 0 (0.0%) | 0 (0.0%) |
| 18 to 34 Years | 4 (3.0%) | 0 (0.0%) |
| 35 to 64 Years | 38 (16.4%) | 23 (18.5%) |
| 65 to 74 Years | 27 (73.0%) | 0 (0.0%) |
| 75 Years and over | 0 (0.0%) | 6 (16.2%) |
Disability Class: Vision Difficulty
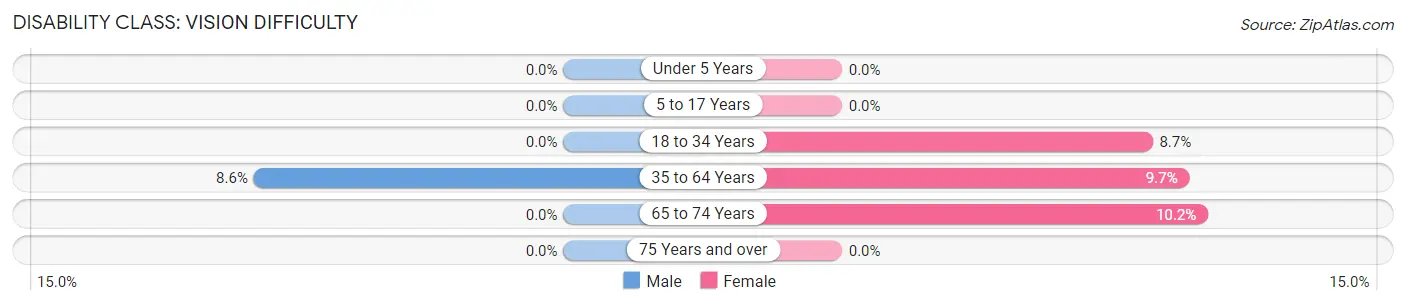
| Age Bracket | Male | Female |
| Under 5 Years | 0 (0.0%) | 0 (0.0%) |
| 5 to 17 Years | 0 (0.0%) | 0 (0.0%) |
| 18 to 34 Years | 0 (0.0%) | 9 (8.6%) |
| 35 to 64 Years | 20 (8.6%) | 12 (9.7%) |
| 65 to 74 Years | 0 (0.0%) | 5 (10.2%) |
| 75 Years and over | 0 (0.0%) | 0 (0.0%) |
Disability Class: Cognitive Difficulty
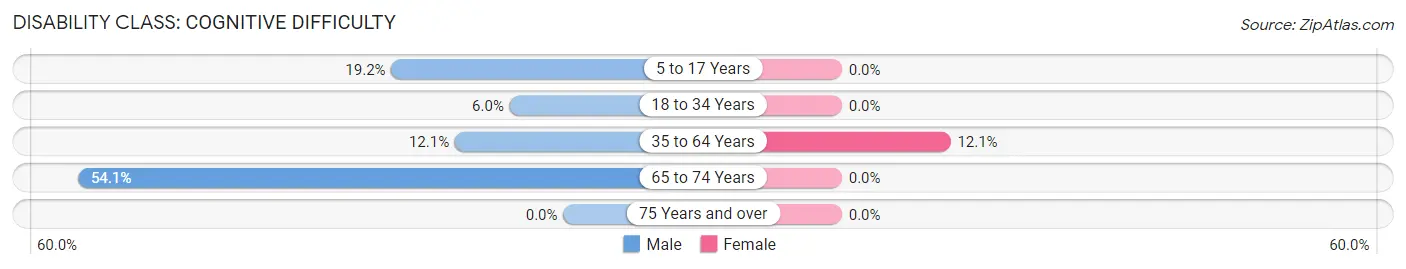
| Age Bracket | Male | Female |
| 5 to 17 Years | 9 (19.2%) | 0 (0.0%) |
| 18 to 34 Years | 8 (6.0%) | 0 (0.0%) |
| 35 to 64 Years | 28 (12.1%) | 15 (12.1%) |
| 65 to 74 Years | 20 (54.0%) | 0 (0.0%) |
| 75 Years and over | 0 (0.0%) | 0 (0.0%) |
Disability Class: Ambulatory Difficulty
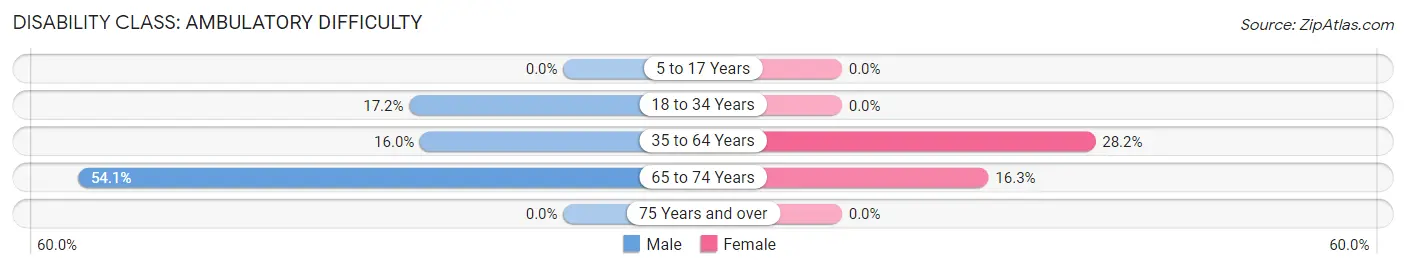
| Age Bracket | Male | Female |
| 5 to 17 Years | 0 (0.0%) | 0 (0.0%) |
| 18 to 34 Years | 23 (17.2%) | 0 (0.0%) |
| 35 to 64 Years | 37 (16.0%) | 35 (28.2%) |
| 65 to 74 Years | 20 (54.0%) | 8 (16.3%) |
| 75 Years and over | 0 (0.0%) | 0 (0.0%) |
Disability Class: Self-Care Difficulty
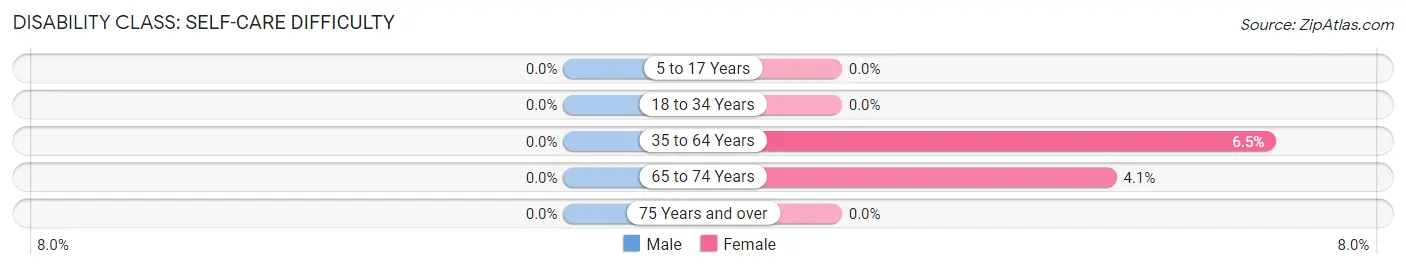
| Age Bracket | Male | Female |
| 5 to 17 Years | 0 (0.0%) | 0 (0.0%) |
| 18 to 34 Years | 0 (0.0%) | 0 (0.0%) |
| 35 to 64 Years | 0 (0.0%) | 8 (6.5%) |
| 65 to 74 Years | 0 (0.0%) | 2 (4.1%) |
| 75 Years and over | 0 (0.0%) | 0 (0.0%) |
Technology Access in Mescalero
Computing Device Access in Mescalero
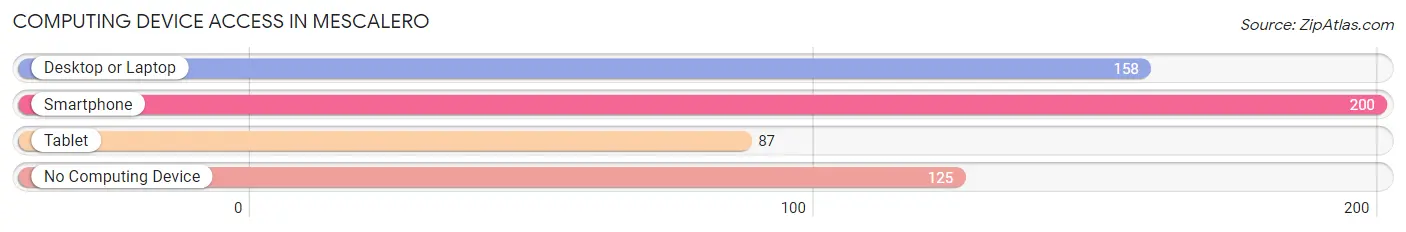
| Device Type | # Households | % Households |
| Desktop or Laptop | 158 | 47.0% |
| Smartphone | 200 | 59.5% |
| Tablet | 87 | 25.9% |
| No Computing Device | 125 | 37.2% |
| Total | 336 | 100.0% |
Internet Access in Mescalero
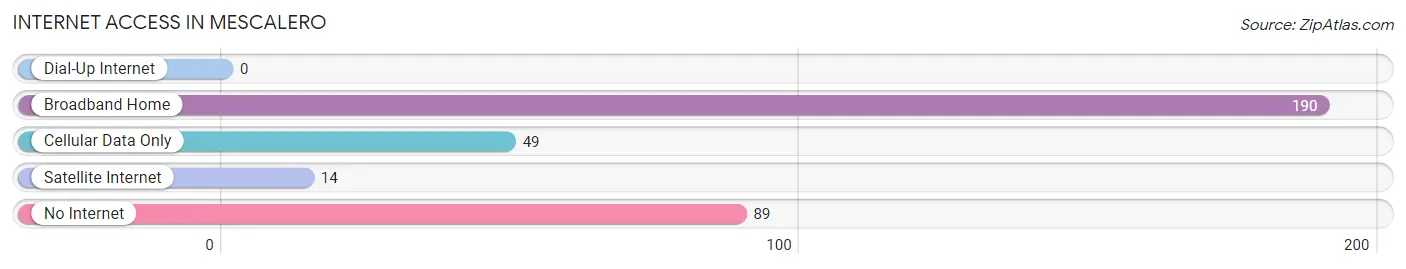
| Internet Type | # Households | % Households |
| Dial-Up Internet | 0 | 0.0% |
| Broadband Home | 190 | 56.6% |
| Cellular Data Only | 49 | 14.6% |
| Satellite Internet | 14 | 4.2% |
| No Internet | 89 | 26.5% |
| Total | 336 | 100.0% |
Mescalero Summary
Mescalero is a small town located in Otero County, New Mexico. It is situated in the Chihuahuan Desert, at an elevation of 5,890 feet. The town is located on the Mescalero Apache Indian Reservation, which is home to the Mescalero Apache Tribe. The population of Mescalero was 1,845 in the 2010 census.
Geography
Mescalero is located in the Chihuahuan Desert, at an elevation of 5,890 feet. The town is situated in the Sacramento Mountains, which are part of the Rocky Mountains. The town is located on the Mescalero Apache Indian Reservation, which covers an area of 1,862 square miles. The reservation is located in Otero County, and is bordered by the Lincoln National Forest to the north, the White Sands Missile Range to the east, and the Tularosa Basin to the south. The town is located approximately 30 miles south of Ruidoso, and is accessible via U.S. Highway 70.
Climate
Mescalero has a semi-arid climate, with hot summers and mild winters. The average high temperature in July is 92°F, and the average low temperature in January is 24°F. The average annual precipitation is 13.5 inches.
History
Mescalero was founded in 1873, when the Mescalero Apache Tribe was relocated to the area from their traditional homelands in Arizona and New Mexico. The tribe was granted a reservation in the area, and the town of Mescalero was established as the tribal headquarters. The town was named after the Mescalero Apache Tribe, which is known for its use of the mescal plant in its ceremonies.
In the early 20th century, the town was a popular tourist destination, due to its proximity to the nearby ski resort. The town was also home to a number of businesses, including a hotel, a general store, and a post office.
In the 1950s, the town was the site of a nuclear test conducted by the U.S. government. The test, known as the "Mescalero Test", was part of the U.S. government's nuclear weapons testing program.
Economy
The economy of Mescalero is largely based on tourism and the Mescalero Apache Tribe. The tribe operates a number of businesses in the town, including a casino, a hotel, and a golf course. The tribe also operates a number of tourist attractions, including a ski resort, a golf course, and a museum.
The town is also home to a number of small businesses, including restaurants, shops, and gas stations. The town is also home to a number of government offices, including the Mescalero Apache Tribal Office, the Mescalero Apache Tribal Court, and the Mescalero Apache Tribal Police Department.
Demographics
As of the 2010 census, the population of Mescalero was 1,845. The racial makeup of the town was 94.3% Native American, 4.2% White, 0.2% African American, 0.2% Asian, and 0.9% from other races. The median household income was $25,938, and the median family income was $30,938. The per capita income was $13,938.
Conclusion
Mescalero is a small town located in Otero County, New Mexico. It is situated in the Chihuahuan Desert, at an elevation of 5,890 feet, and is located on the Mescalero Apache Indian Reservation. The town has a semi-arid climate, with hot summers and mild winters. The economy of Mescalero is largely based on tourism and the Mescalero Apache Tribe. The population of Mescalero was 1,845 in the 2010 census, and the racial makeup of the town was 94.3% Native American, 4.2% White, 0.2% African American, 0.2% Asian, and 0.9% from other races.
Common Questions
What is Per Capita Income in Mescalero?
Per Capita income in Mescalero is $22,974.
What is the Median Family Income in Mescalero?
Median Family Income in Mescalero is $59,821.
What is the Median Household income in Mescalero?
Median Household Income in Mescalero is $29,359.
What is Income or Wage Gap in Mescalero?
Income or Wage Gap in Mescalero is 8.2%.
Women in Mescalero earn 91.8 cents for every dollar earned by a man.
What is Inequality or Gini Index in Mescalero?
Inequality or Gini Index in Mescalero is 0.48.
What is the Total Population of Mescalero?
Total Population of Mescalero is 891.
What is the Total Male Population of Mescalero?
Total Male Population of Mescalero is 498.
What is the Total Female Population of Mescalero?
Total Female Population of Mescalero is 393.
What is the Ratio of Males per 100 Females in Mescalero?
There are 126.72 Males per 100 Females in Mescalero.
What is the Ratio of Females per 100 Males in Mescalero?
There are 78.92 Females per 100 Males in Mescalero.
What is the Median Population Age in Mescalero?
Median Population Age in Mescalero is 45.0 Years.
What is the Average Family Size in Mescalero
Average Family Size in Mescalero is 4.6 People.
What is the Average Household Size in Mescalero
Average Household Size in Mescalero is 2.5 People.
How Large is the Labor Force in Mescalero?
There are 447 People in the Labor Forcein in Mescalero.
What is the Percentage of People in the Labor Force in Mescalero?
55.4% of People are in the Labor Force in Mescalero.
What is the Unemployment Rate in Mescalero?
Unemployment Rate in Mescalero is 11.4%.