Maxwell, NM Map & Demographics
Maxwell Map
Maxwell Overview
$17,328
PER CAPITA INCOME
$43,333
AVG FAMILY INCOME
$37,813
AVG HOUSEHOLD INCOME
12.3%
WAGE / INCOME GAP [ % ]
87.7¢/ $1
WAGE / INCOME GAP [ $ ]
0.41
INEQUALITY / GINI INDEX
482
TOTAL POPULATION
247
MALE POPULATION
235
FEMALE POPULATION
105.11
MALES / 100 FEMALES
95.14
FEMALES / 100 MALES
21.5
MEDIAN AGE
4.0
AVG FAMILY SIZE
3.4
AVG HOUSEHOLD SIZE
128
LABOR FORCE [ PEOPLE ]
40.3%
PERCENT IN LABOR FORCE
Maxwell Zip Codes
Maxwell Area Codes
Income in Maxwell
Income Overview in Maxwell
Per Capita Income in Maxwell is $17,328, while median incomes of families and households are $43,333 and $37,813 respectively.
| Characteristic | Number | Measure |
| Per Capita Income | 482 | $17,328 |
| Median Family Income | 104 | $43,333 |
| Mean Family Income | 104 | $64,588 |
| Median Household Income | 140 | $37,813 |
| Mean Household Income | 140 | $56,062 |
| Income Deficit | 104 | $0 |
| Wage / Income Gap (%) | 482 | 12.27% |
| Wage / Income Gap ($) | 482 | 87.73¢ per $1 |
| Gini / Inequality Index | 482 | 0.41 |
Earnings by Sex in Maxwell
Average Earnings in Maxwell are $37,868, $33,750 for men and $38,472 for women, a difference of 12.3%.
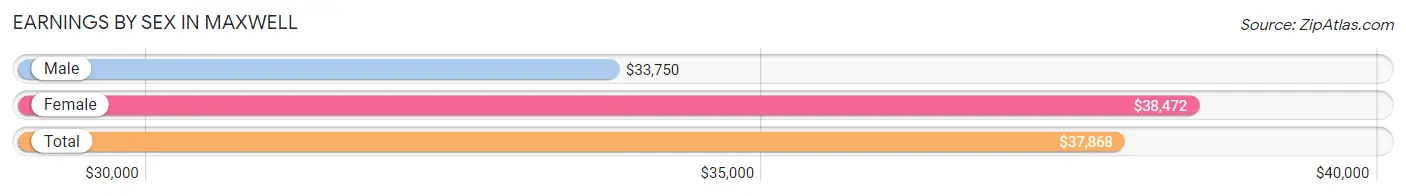
| Sex | Number | Average Earnings |
| Male | 90 (55.9%) | $33,750 |
| Female | 71 (44.1%) | $38,472 |
| Total | 161 (100.0%) | $37,868 |
Earnings by Sex by Income Bracket in Maxwell
The most common earnings brackets in Maxwell are $40,000 to $44,999 for men (17 | 18.9%) and $40,000 to $44,999 for women (28 | 39.4%).
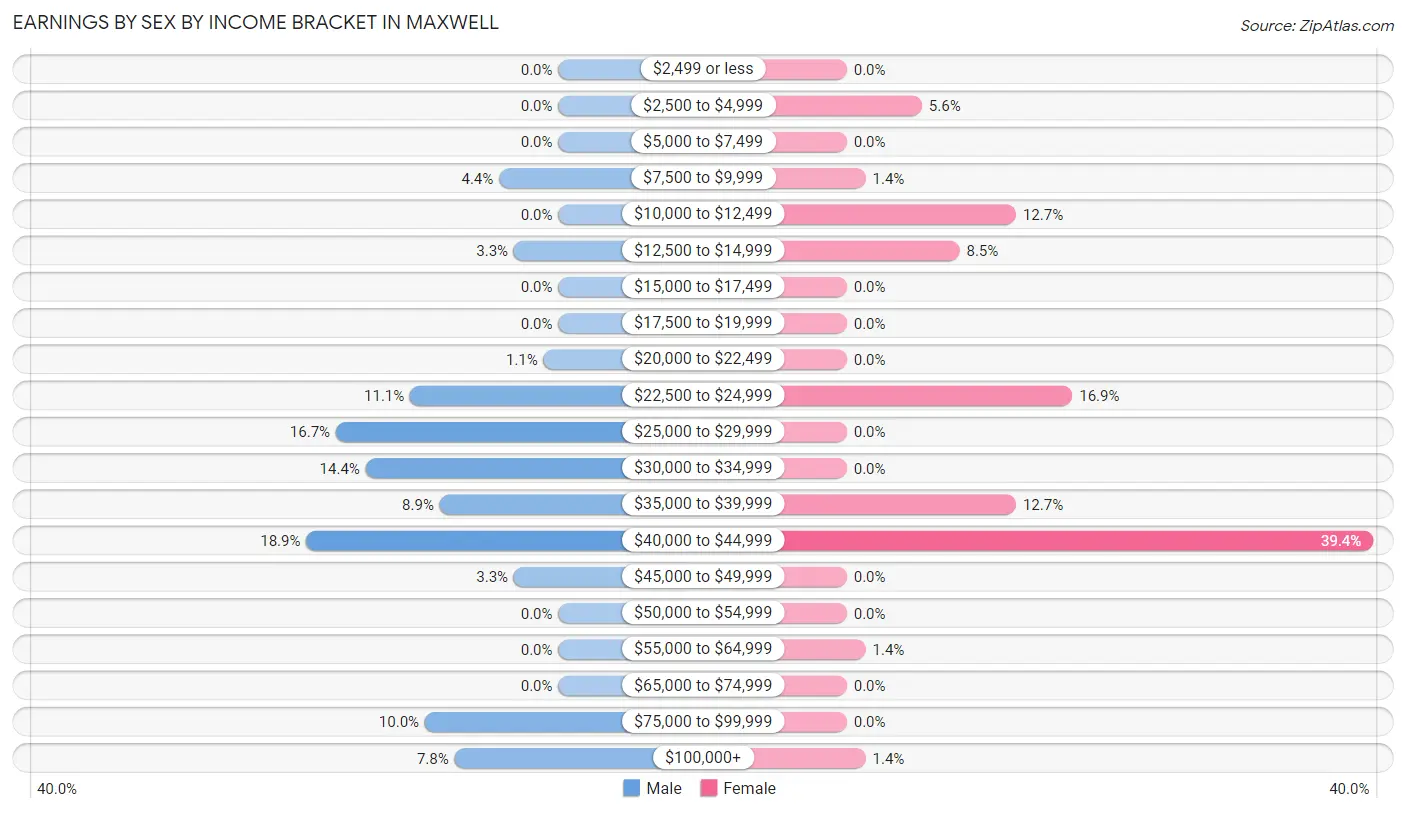
| Income | Male | Female |
| $2,499 or less | 0 (0.0%) | 0 (0.0%) |
| $2,500 to $4,999 | 0 (0.0%) | 4 (5.6%) |
| $5,000 to $7,499 | 0 (0.0%) | 0 (0.0%) |
| $7,500 to $9,999 | 4 (4.4%) | 1 (1.4%) |
| $10,000 to $12,499 | 0 (0.0%) | 9 (12.7%) |
| $12,500 to $14,999 | 3 (3.3%) | 6 (8.5%) |
| $15,000 to $17,499 | 0 (0.0%) | 0 (0.0%) |
| $17,500 to $19,999 | 0 (0.0%) | 0 (0.0%) |
| $20,000 to $22,499 | 1 (1.1%) | 0 (0.0%) |
| $22,500 to $24,999 | 10 (11.1%) | 12 (16.9%) |
| $25,000 to $29,999 | 15 (16.7%) | 0 (0.0%) |
| $30,000 to $34,999 | 13 (14.4%) | 0 (0.0%) |
| $35,000 to $39,999 | 8 (8.9%) | 9 (12.7%) |
| $40,000 to $44,999 | 17 (18.9%) | 28 (39.4%) |
| $45,000 to $49,999 | 3 (3.3%) | 0 (0.0%) |
| $50,000 to $54,999 | 0 (0.0%) | 0 (0.0%) |
| $55,000 to $64,999 | 0 (0.0%) | 1 (1.4%) |
| $65,000 to $74,999 | 0 (0.0%) | 0 (0.0%) |
| $75,000 to $99,999 | 9 (10.0%) | 0 (0.0%) |
| $100,000+ | 7 (7.8%) | 1 (1.4%) |
| Total | 90 (100.0%) | 71 (100.0%) |
Earnings by Sex by Educational Attainment in Maxwell
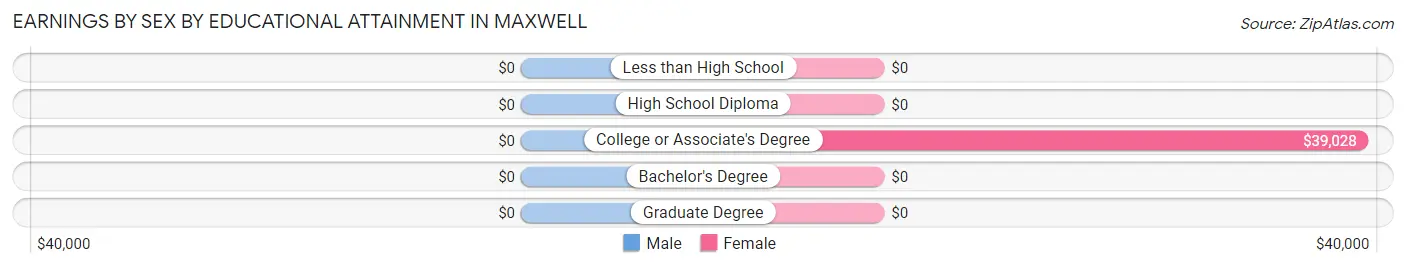
| Educational Attainment | Male Income | Female Income |
| Less than High School | - | - |
| High School Diploma | - | - |
| College or Associate's Degree | - | - |
| Bachelor's Degree | - | - |
| Graduate Degree | - | - |
| Total | $41,071 | $38,472 |
Family Income in Maxwell
Family Income Brackets in Maxwell
According to the Maxwell family income data, there are 32 families falling into the $35,000 to $49,999 income range, which is the most common income bracket and makes up 30.8% of all families.
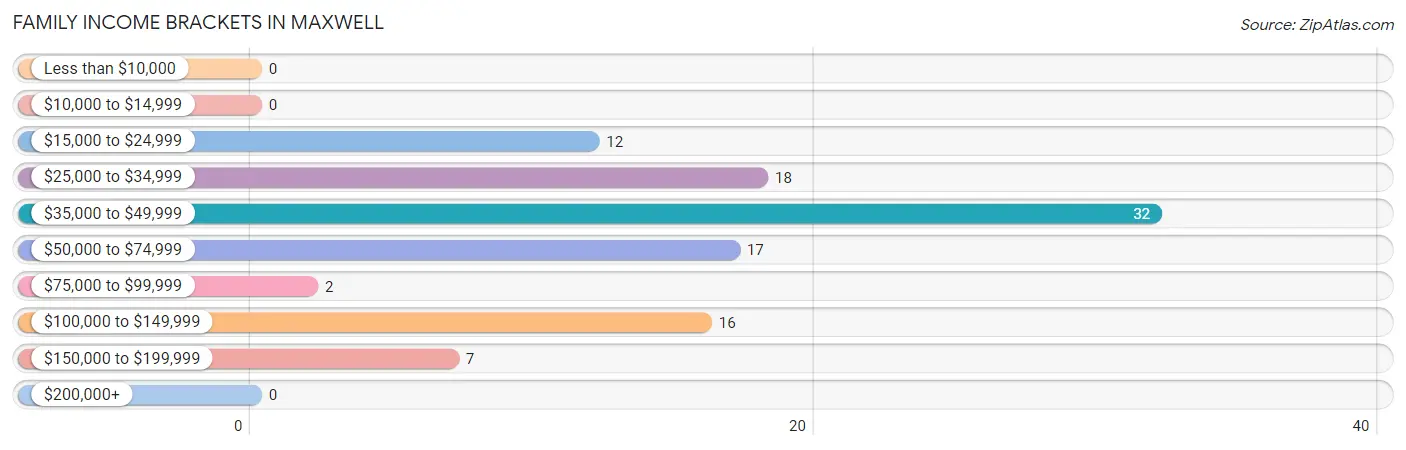
| Income Bracket | # Families | % Families |
| Less than $10,000 | 0 | 0.0% |
| $10,000 to $14,999 | 0 | 0.0% |
| $15,000 to $24,999 | 12 | 11.5% |
| $25,000 to $34,999 | 18 | 17.3% |
| $35,000 to $49,999 | 32 | 30.8% |
| $50,000 to $74,999 | 17 | 16.3% |
| $75,000 to $99,999 | 2 | 1.9% |
| $100,000 to $149,999 | 16 | 15.4% |
| $150,000 to $199,999 | 7 | 6.7% |
| $200,000+ | 0 | 0.0% |
Family Income by Famaliy Size in Maxwell
3-person families (14 | 13.5%) account for the highest median family income in Maxwell with $41,071 per family, while 2-person families (61 | 58.7%) have the highest median income of $18,438 per family member.
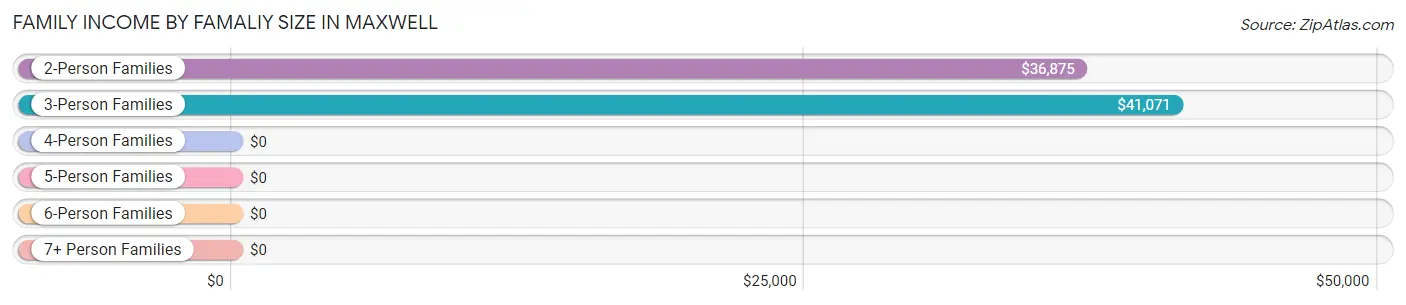
| Income Bracket | # Families | Median Income |
| 2-Person Families | 61 (58.7%) | $36,875 |
| 3-Person Families | 14 (13.5%) | $41,071 |
| 4-Person Families | 8 (7.7%) | $0 |
| 5-Person Families | 16 (15.4%) | $0 |
| 6-Person Families | 5 (4.8%) | $0 |
| 7+ Person Families | 0 (0.0%) | $0 |
| Total | 104 (100.0%) | $43,333 |
Family Income by Number of Earners in Maxwell
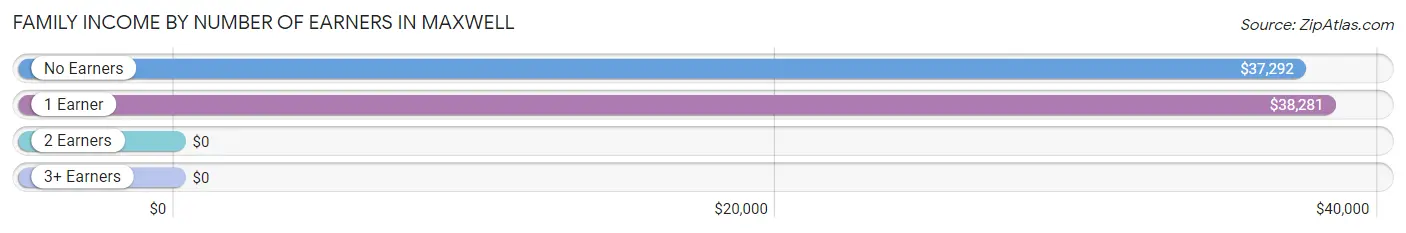
| Number of Earners | # Families | Median Income |
| No Earners | 27 (26.0%) | $37,292 |
| 1 Earner | 49 (47.1%) | $38,281 |
| 2 Earners | 21 (20.2%) | $0 |
| 3+ Earners | 7 (6.7%) | $0 |
| Total | 104 (100.0%) | $43,333 |
Household Income in Maxwell
Household Income Brackets in Maxwell
With 28 households falling in the category, the $15,000 to $24,999 income range is the most frequent in Maxwell, accounting for 20.0% of all households.
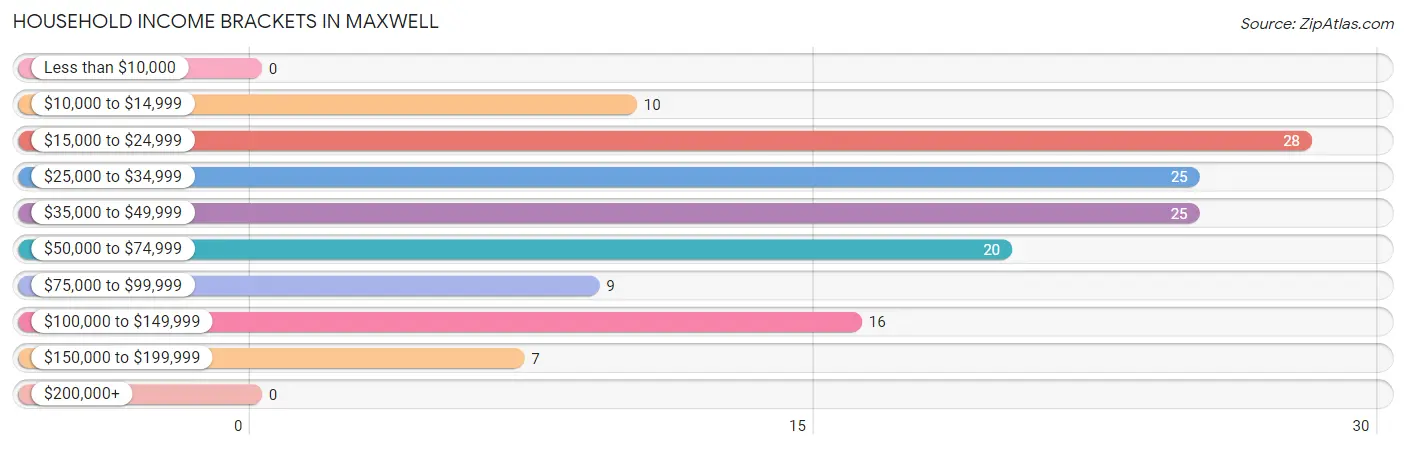
| Income Bracket | # Households | % Households |
| Less than $10,000 | 0 | 0.0% |
| $10,000 to $14,999 | 10 | 7.1% |
| $15,000 to $24,999 | 28 | 20.0% |
| $25,000 to $34,999 | 25 | 17.9% |
| $35,000 to $49,999 | 25 | 17.9% |
| $50,000 to $74,999 | 20 | 14.3% |
| $75,000 to $99,999 | 9 | 6.4% |
| $100,000 to $149,999 | 16 | 11.4% |
| $150,000 to $199,999 | 7 | 5.0% |
| $200,000+ | 0 | 0.0% |
Household Income by Householder Age in Maxwell
The median household income in Maxwell is $37,813, with the highest median household income of $81,071 found in the 25 to 44 years age bracket for the primary householder. A total of 44 households (31.4%) fall into this category. Meanwhile, the 15 to 24 years age bracket for the primary householder has the lowest median household income of $0, with 10 households (7.1%) in this group.
| Income Bracket | # Households | Median Income |
| 15 to 24 Years | 10 (7.1%) | $0 |
| 25 to 44 Years | 44 (31.4%) | $81,071 |
| 45 to 64 Years | 41 (29.3%) | $29,792 |
| 65+ Years | 45 (32.1%) | $23,958 |
| Total | 140 (100.0%) | $37,813 |
Poverty in Maxwell
Income Below Poverty by Sex and Age in Maxwell
With 1.2% poverty level for males and 11.1% for females among the residents of Maxwell, 16 and 17 year old males and 18 to 24 year old females are the most vulnerable to poverty, with 3 males (23.1%) and 11 females (100.0%) in their respective age groups living below the poverty level.
| Age Bracket | Male | Female |
| Under 5 Years | 0 (0.0%) | 0 (0.0%) |
| 5 Years | 0 (0.0%) | 0 (0.0%) |
| 6 to 11 Years | 0 (0.0%) | 0 (0.0%) |
| 12 to 14 Years | 0 (0.0%) | 0 (0.0%) |
| 15 Years | 0 (0.0%) | 0 (0.0%) |
| 16 and 17 Years | 3 (23.1%) | 0 (0.0%) |
| 18 to 24 Years | 0 (0.0%) | 11 (100.0%) |
| 25 to 34 Years | 0 (0.0%) | 0 (0.0%) |
| 35 to 44 Years | 0 (0.0%) | 0 (0.0%) |
| 45 to 54 Years | 0 (0.0%) | 3 (42.9%) |
| 55 to 64 Years | 0 (0.0%) | 3 (16.7%) |
| 65 to 74 Years | 0 (0.0%) | 6 (31.6%) |
| 75 Years and over | 0 (0.0%) | 3 (17.6%) |
| Total | 3 (1.2%) | 26 (11.1%) |
Income Above Poverty by Sex and Age in Maxwell
According to the poverty statistics in Maxwell, males aged under 5 years and females aged under 5 years are the age groups that are most secure financially, with 100.0% of males and 100.0% of females in these age groups living above the poverty line.
| Age Bracket | Male | Female |
| Under 5 Years | 9 (100.0%) | 10 (100.0%) |
| 5 Years | 5 (100.0%) | 0 (0.0%) |
| 6 to 11 Years | 54 (100.0%) | 56 (100.0%) |
| 12 to 14 Years | 29 (100.0%) | 1 (100.0%) |
| 15 Years | 0 (0.0%) | 0 (0.0%) |
| 16 and 17 Years | 10 (76.9%) | 51 (100.0%) |
| 18 to 24 Years | 20 (100.0%) | 0 (0.0%) |
| 25 to 34 Years | 41 (100.0%) | 33 (100.0%) |
| 35 to 44 Years | 16 (100.0%) | 12 (100.0%) |
| 45 to 54 Years | 9 (100.0%) | 4 (57.1%) |
| 55 to 64 Years | 28 (100.0%) | 15 (83.3%) |
| 65 to 74 Years | 12 (100.0%) | 13 (68.4%) |
| 75 Years and over | 11 (100.0%) | 14 (82.4%) |
| Total | 244 (98.8%) | 209 (88.9%) |
Income Below Poverty Among Married-Couple Families in Maxwell
| Children | Above Poverty | Below Poverty |
| No Children | 34 (100.0%) | 0 (0.0%) |
| 1 or 2 Children | 1 (100.0%) | 0 (0.0%) |
| 3 or 4 Children | 21 (100.0%) | 0 (0.0%) |
| 5 or more Children | 0 (0.0%) | 0 (0.0%) |
| Total | 56 (100.0%) | 0 (0.0%) |
Income Below Poverty Among Single-Parent Households in Maxwell
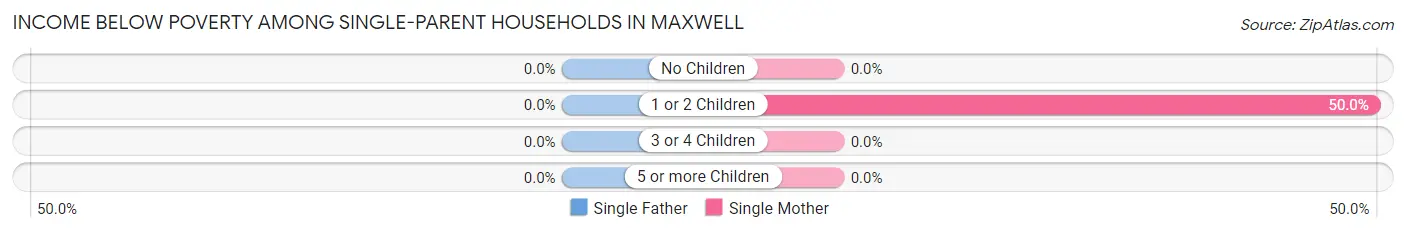
| Children | Single Father | Single Mother |
| No Children | 0 (0.0%) | 0 (0.0%) |
| 1 or 2 Children | 0 (0.0%) | 2 (50.0%) |
| 3 or 4 Children | 0 (0.0%) | 0 (0.0%) |
| 5 or more Children | 0 (0.0%) | 0 (0.0%) |
| Total | 0 (0.0%) | 2 (33.3%) |
Income Below Poverty Among Married-Couple vs Single-Parent Households in Maxwell
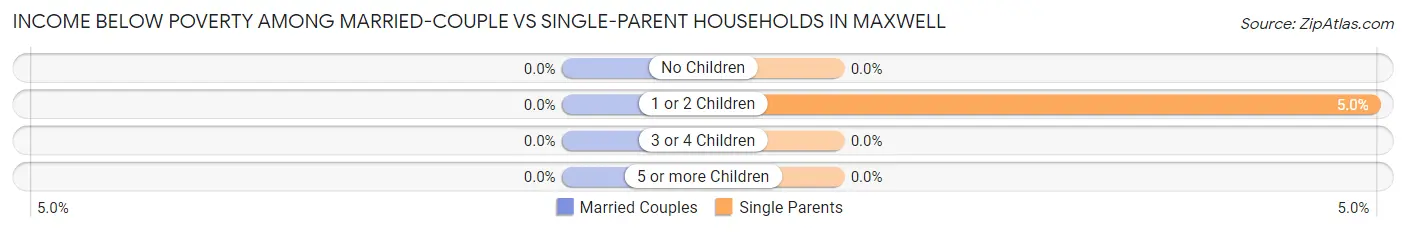
| Children | Married-Couple Families | Single-Parent Households |
| No Children | 0 (0.0%) | 0 (0.0%) |
| 1 or 2 Children | 0 (0.0%) | 2 (5.0%) |
| 3 or 4 Children | 0 (0.0%) | 0 (0.0%) |
| 5 or more Children | 0 (0.0%) | 0 (0.0%) |
| Total | 0 (0.0%) | 2 (4.2%) |
Race in Maxwell
The most populous races in Maxwell are White / Caucasian (403 | 83.6%), Hispanic or Latino (378 | 78.4%), and Two or more Races (64 | 13.3%).
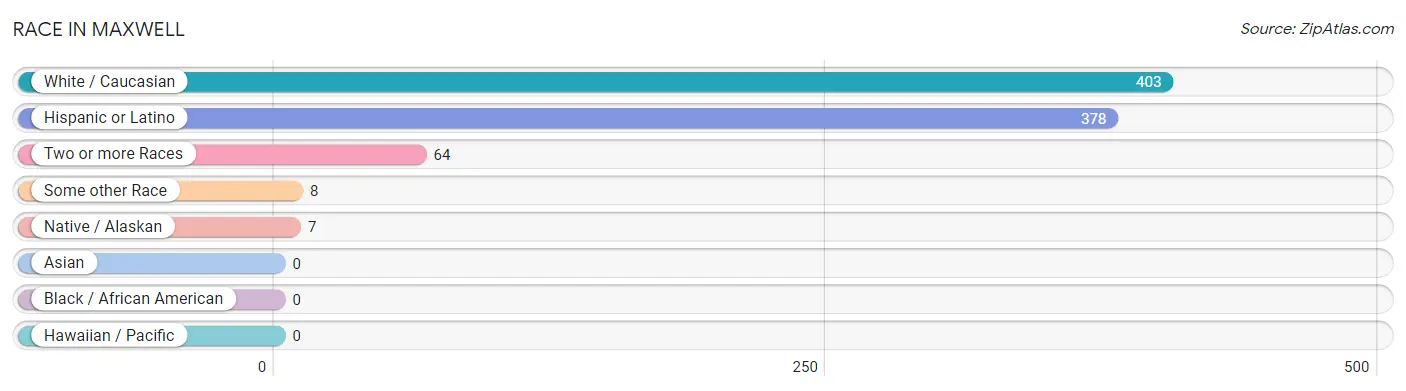
| Race | # Population | % Population |
| Asian | 0 | 0.0% |
| Black / African American | 0 | 0.0% |
| Hawaiian / Pacific | 0 | 0.0% |
| Hispanic or Latino | 378 | 78.4% |
| Native / Alaskan | 7 | 1.5% |
| White / Caucasian | 403 | 83.6% |
| Two or more Races | 64 | 13.3% |
| Some other Race | 8 | 1.7% |
| Total | 482 | 100.0% |
Ancestry in Maxwell
The most populous ancestries reported in Maxwell are Mexican (207 | 42.9%), Scotch-Irish (55 | 11.4%), Irish (47 | 9.8%), Italian (38 | 7.9%), and Spaniard (38 | 7.9%), together accounting for 79.9% of all Maxwell residents.
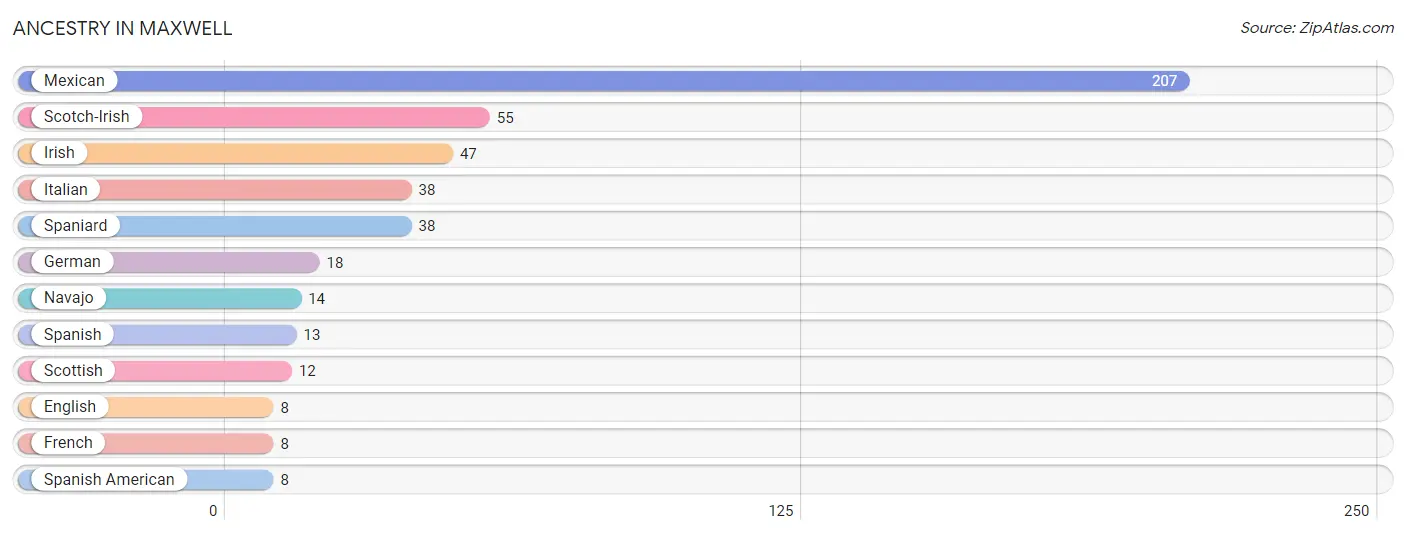
| Ancestry | # Population | % Population |
| English | 8 | 1.7% |
| French | 8 | 1.7% |
| German | 18 | 3.7% |
| Irish | 47 | 9.8% |
| Italian | 38 | 7.9% |
| Mexican | 207 | 42.9% |
| Navajo | 14 | 2.9% |
| Scotch-Irish | 55 | 11.4% |
| Scottish | 12 | 2.5% |
| Spaniard | 38 | 7.9% |
| Spanish | 13 | 2.7% |
| Spanish American | 8 | 1.7% | View All 12 Rows |
Immigrants in Maxwell

| Immigration Origin | # Population | % Population | View All 0 Rows |
Sex and Age in Maxwell
Sex and Age in Maxwell
The most populous age groups in Maxwell are 10 to 14 Years (50 | 20.2%) for men and 15 to 19 Years (51 | 21.7%) for women.
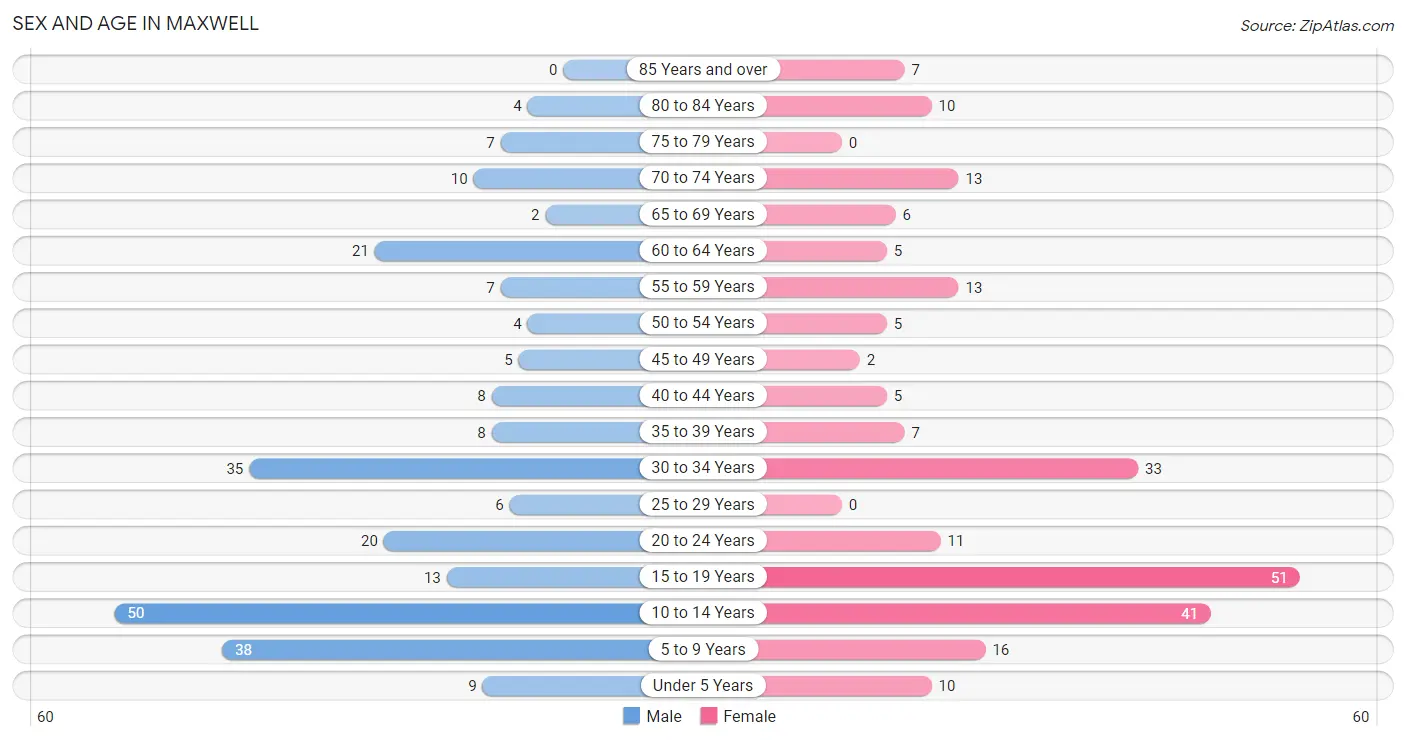
| Age Bracket | Male | Female |
| Under 5 Years | 9 (3.6%) | 10 (4.3%) |
| 5 to 9 Years | 38 (15.4%) | 16 (6.8%) |
| 10 to 14 Years | 50 (20.2%) | 41 (17.4%) |
| 15 to 19 Years | 13 (5.3%) | 51 (21.7%) |
| 20 to 24 Years | 20 (8.1%) | 11 (4.7%) |
| 25 to 29 Years | 6 (2.4%) | 0 (0.0%) |
| 30 to 34 Years | 35 (14.2%) | 33 (14.0%) |
| 35 to 39 Years | 8 (3.2%) | 7 (3.0%) |
| 40 to 44 Years | 8 (3.2%) | 5 (2.1%) |
| 45 to 49 Years | 5 (2.0%) | 2 (0.9%) |
| 50 to 54 Years | 4 (1.6%) | 5 (2.1%) |
| 55 to 59 Years | 7 (2.8%) | 13 (5.5%) |
| 60 to 64 Years | 21 (8.5%) | 5 (2.1%) |
| 65 to 69 Years | 2 (0.8%) | 6 (2.5%) |
| 70 to 74 Years | 10 (4.1%) | 13 (5.5%) |
| 75 to 79 Years | 7 (2.8%) | 0 (0.0%) |
| 80 to 84 Years | 4 (1.6%) | 10 (4.3%) |
| 85 Years and over | 0 (0.0%) | 7 (3.0%) |
| Total | 247 (100.0%) | 235 (100.0%) |
Families and Households in Maxwell
Median Family Size in Maxwell
The median family size in Maxwell is 4.02 persons per family, with married-couple families (56 | 53.8%) accounting for the largest median family size of 4.14 persons per family. On the other hand, single female/mother families (6 | 5.8%) represent the smallest median family size with 3.67 persons per family.
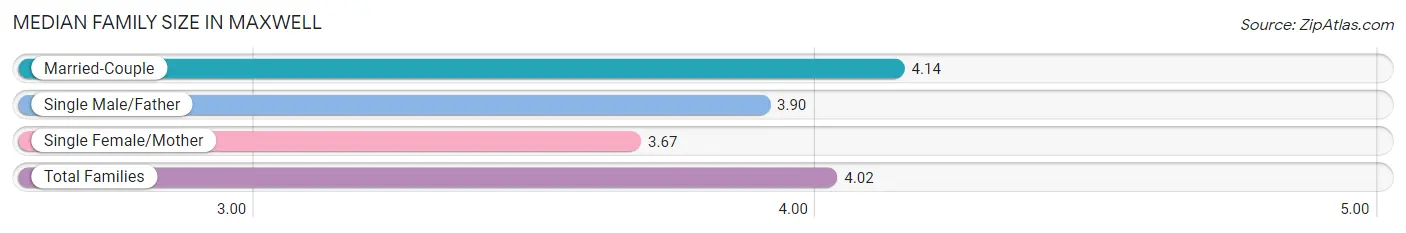
| Family Type | # Families | Family Size |
| Married-Couple | 56 (53.8%) | 4.14 |
| Single Male/Father | 42 (40.4%) | 3.90 |
| Single Female/Mother | 6 (5.8%) | 3.67 |
| Total Families | 104 (100.0%) | 4.02 |
Median Household Size in Maxwell
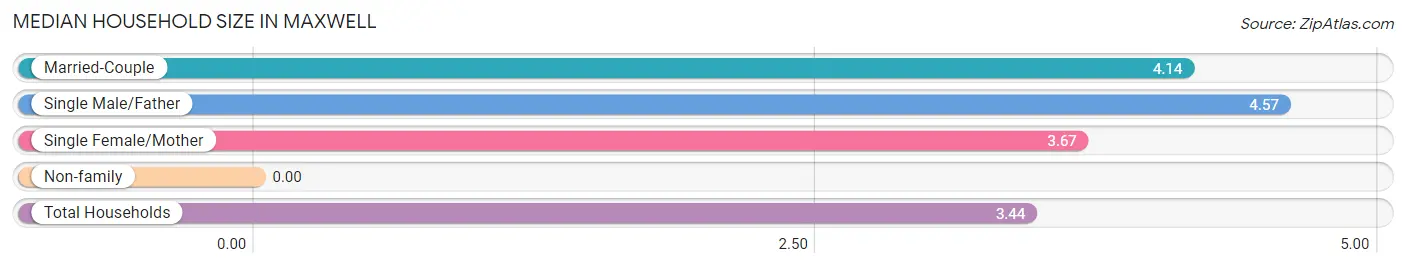
| Household Type | # Households | Household Size |
| Married-Couple | 56 (40.0%) | 4.14 |
| Single Male/Father | 42 (30.0%) | 4.57 |
| Single Female/Mother | 6 (4.3%) | 3.67 |
| Non-family | 36 (25.7%) | - |
| Total Households | 140 (100.0%) | 3.44 |
Household Size by Marriage Status in Maxwell
Out of a total of 140 households in Maxwell, 104 (74.3%) are family households, while 36 (25.7%) are nonfamily households. The most numerous type of family households are 2-person households, comprising 51, and the most common type of nonfamily households are 1-person households, comprising 36.
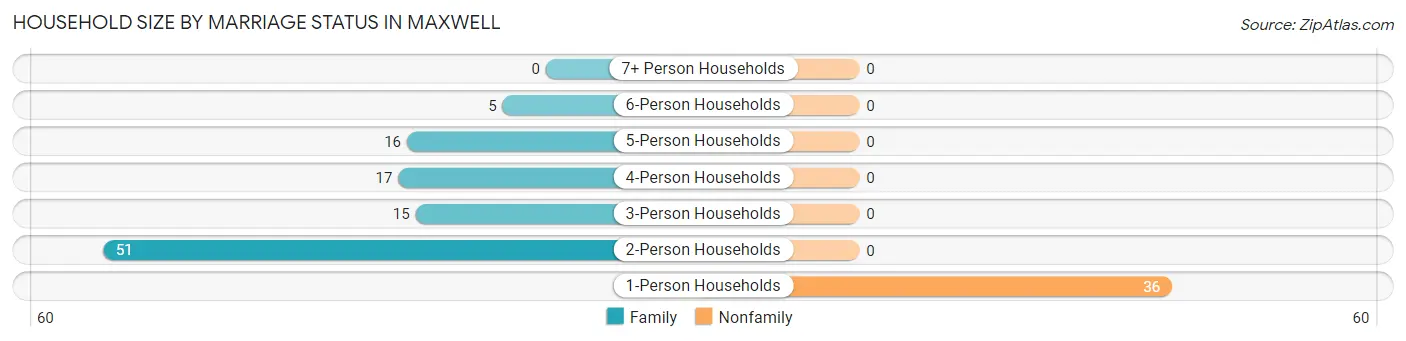
| Household Size | Family Households | Nonfamily Households |
| 1-Person Households | - | 36 (25.7%) |
| 2-Person Households | 51 (36.4%) | 0 (0.0%) |
| 3-Person Households | 15 (10.7%) | 0 (0.0%) |
| 4-Person Households | 17 (12.1%) | 0 (0.0%) |
| 5-Person Households | 16 (11.4%) | 0 (0.0%) |
| 6-Person Households | 5 (3.6%) | 0 (0.0%) |
| 7+ Person Households | 0 (0.0%) | 0 (0.0%) |
| Total | 104 (74.3%) | 36 (25.7%) |
Female Fertility in Maxwell
Fertility by Age in Maxwell
| Age Bracket | Women with Births | Births / 1,000 Women |
| 15 to 19 years | 0 (0.0%) | 0.0 |
| 20 to 34 years | 0 (0.0%) | 0.0 |
| 35 to 50 years | 0 (0.0%) | 0.0 |
| Total | 0 (0.0%) | 0.0 |
Fertility by Age by Marriage Status in Maxwell
| Age Bracket | Married | Unmarried |
| 15 to 19 years | 0 (0.0%) | 0 (0.0%) |
| 20 to 34 years | 0 (0.0%) | 0 (0.0%) |
| 35 to 50 years | 0 (0.0%) | 0 (0.0%) |
| Total | 0 (0.0%) | 0 (0.0%) |
Fertility by Education in Maxwell
| Educational Attainment | Women with Births | Births / 1,000 Women |
| Less than High School | 0 (0.0%) | 0.0 |
| High School Diploma | 0 (0.0%) | 0.0 |
| College or Associate's Degree | 0 (0.0%) | 0.0 |
| Bachelor's Degree | 0 (0.0%) | 0.0 |
| Graduate Degree | 0 (0.0%) | 0.0 |
| Total | 0 (0.0%) | 0.0 |
Fertility by Education by Marriage Status in Maxwell
| Educational Attainment | Married | Unmarried |
| Less than High School | 0 (0.0%) | 0 (0.0%) |
| High School Diploma | 0 (0.0%) | 0 (0.0%) |
| College or Associate's Degree | 0 (0.0%) | 0 (0.0%) |
| Bachelor's Degree | 0 (0.0%) | 0 (0.0%) |
| Graduate Degree | 0 (0.0%) | 0 (0.0%) |
| Total | 0 (0.0%) | 0 (0.0%) |
Employment Characteristics in Maxwell
Employment by Class of Employer in Maxwell
Among the 128 employed individuals in Maxwell, private company employees (60 | 46.9%), state government employees (28 | 21.9%), and not-for-profit organizations (12 | 9.4%) make up the most common classes of employment.
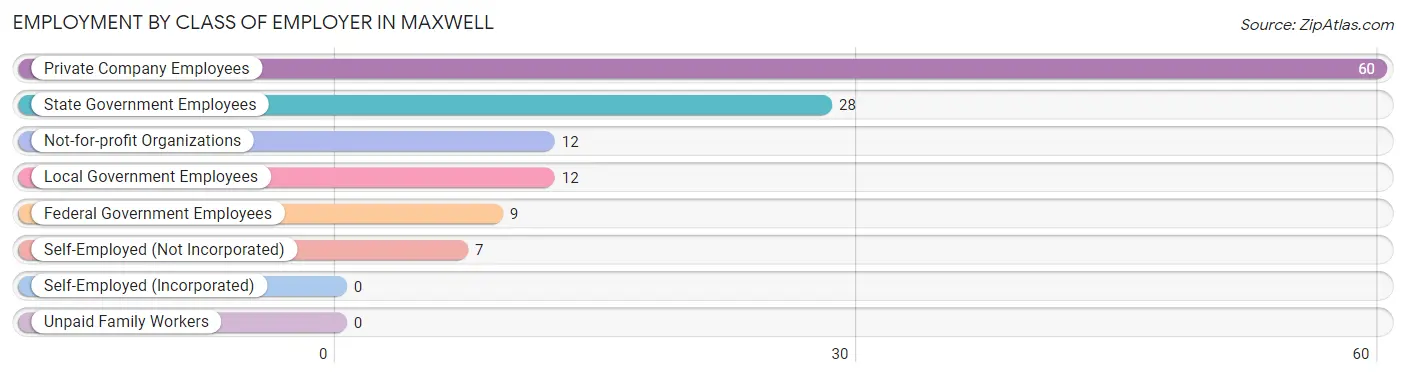
| Employer Class | # Employees | % Employees |
| Private Company Employees | 60 | 46.9% |
| Self-Employed (Incorporated) | 0 | 0.0% |
| Self-Employed (Not Incorporated) | 7 | 5.5% |
| Not-for-profit Organizations | 12 | 9.4% |
| Local Government Employees | 12 | 9.4% |
| State Government Employees | 28 | 21.9% |
| Federal Government Employees | 9 | 7.0% |
| Unpaid Family Workers | 0 | 0.0% |
| Total | 128 | 100.0% |
Employment Status by Age in Maxwell
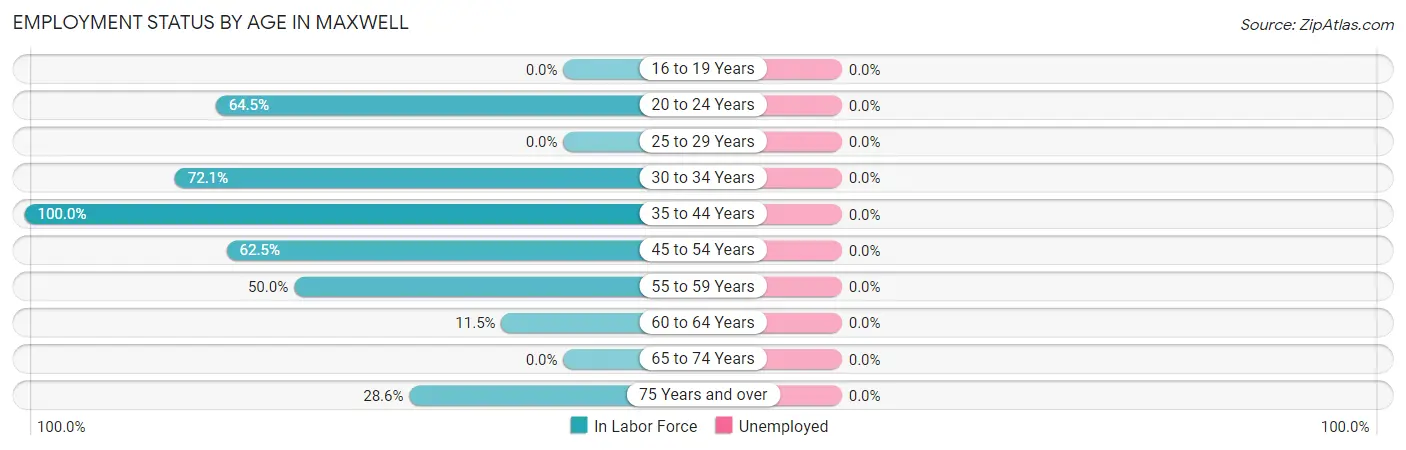
| Age Bracket | In Labor Force | Unemployed |
| 16 to 19 Years | 0 (0.0%) | 0 (0.0%) |
| 20 to 24 Years | 20 (64.5%) | 0 (0.0%) |
| 25 to 29 Years | 0 (0.0%) | 0 (0.0%) |
| 30 to 34 Years | 49 (72.1%) | 0 (0.0%) |
| 35 to 44 Years | 28 (100.0%) | 0 (0.0%) |
| 45 to 54 Years | 10 (62.5%) | 0 (0.0%) |
| 55 to 59 Years | 10 (50.0%) | 0 (0.0%) |
| 60 to 64 Years | 3 (11.5%) | 0 (0.0%) |
| 65 to 74 Years | 0 (0.0%) | 0 (0.0%) |
| 75 Years and over | 8 (28.6%) | 0 (0.0%) |
| Total | 128 (40.3%) | 0 (0.0%) |
Employment Status by Educational Attainment in Maxwell
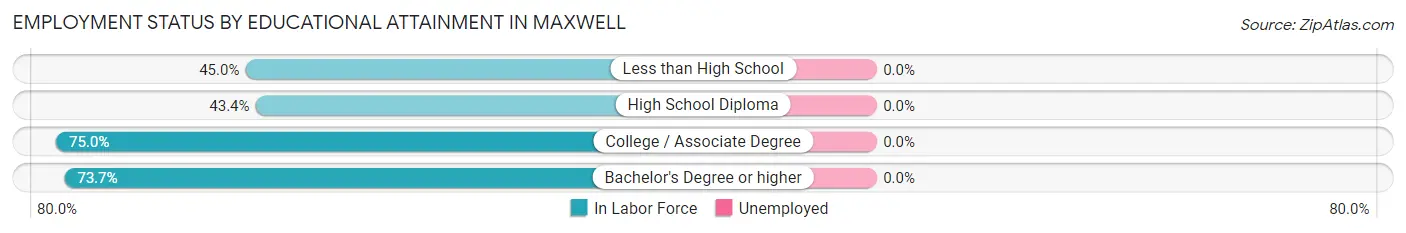
| Educational Attainment | In Labor Force | Unemployed |
| Less than High School | 9 (45.0%) | 0 (0.0%) |
| High School Diploma | 23 (43.4%) | 0 (0.0%) |
| College / Associate Degree | 54 (75.0%) | 0 (0.0%) |
| Bachelor's Degree or higher | 14 (73.7%) | 0 (0.0%) |
| Total | 100 (61.0%) | 0 (0.0%) |
Employment Occupations by Sex in Maxwell
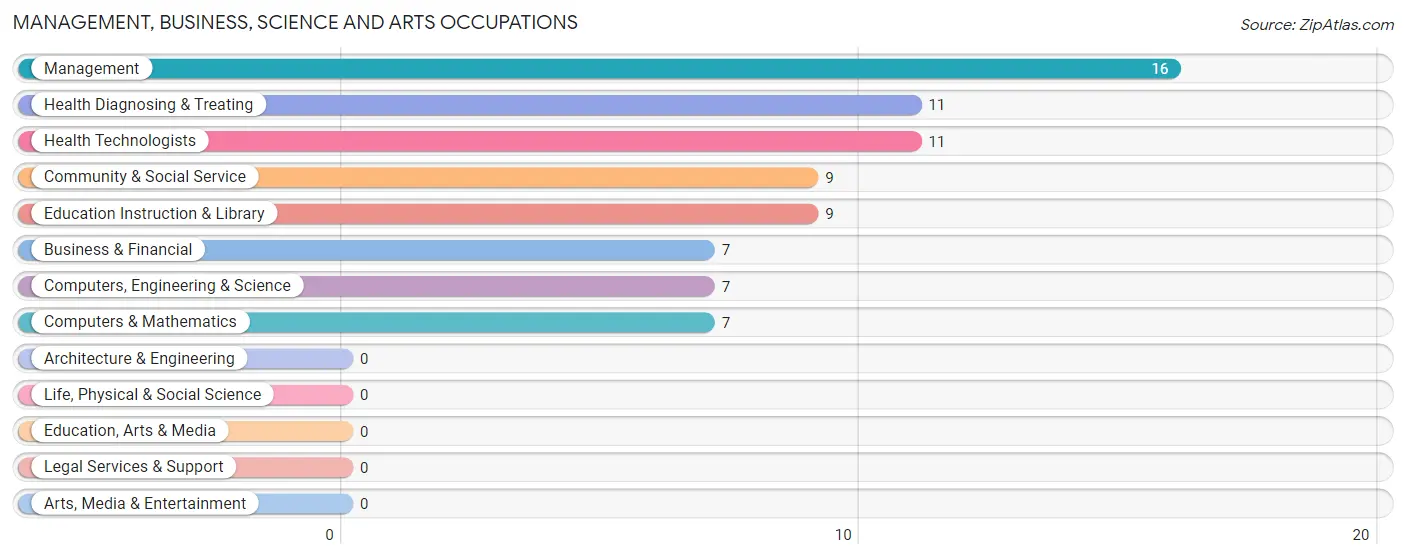
Management, Business, Science and Arts Occupations
The most common Management, Business, Science and Arts occupations in Maxwell are Management (16 | 13.5%), Health Diagnosing & Treating (11 | 9.2%), Health Technologists (11 | 9.2%), Community & Social Service (9 | 7.6%), and Education Instruction & Library (9 | 7.6%).
Management, Business, Science and Arts Occupations by Sex
Within the Management, Business, Science and Arts occupations in Maxwell, the most male-oriented occupations are Computers, Engineering & Science (100.0%), and Computers & Mathematics (100.0%), while the most female-oriented occupations are Management (100.0%), Business & Financial (100.0%), and Community & Social Service (100.0%).
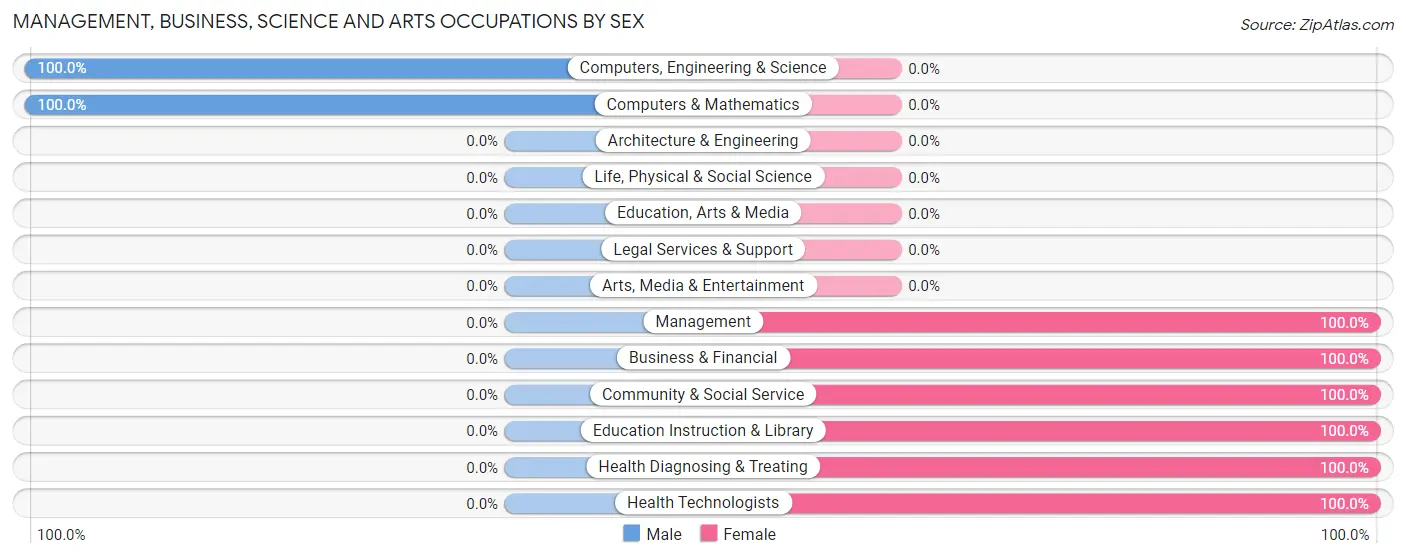
| Occupation | Male | Female |
| Management | 0 (0.0%) | 16 (100.0%) |
| Business & Financial | 0 (0.0%) | 7 (100.0%) |
| Computers, Engineering & Science | 7 (100.0%) | 0 (0.0%) |
| Computers & Mathematics | 7 (100.0%) | 0 (0.0%) |
| Architecture & Engineering | 0 (0.0%) | 0 (0.0%) |
| Life, Physical & Social Science | 0 (0.0%) | 0 (0.0%) |
| Community & Social Service | 0 (0.0%) | 9 (100.0%) |
| Education, Arts & Media | 0 (0.0%) | 0 (0.0%) |
| Legal Services & Support | 0 (0.0%) | 0 (0.0%) |
| Education Instruction & Library | 0 (0.0%) | 9 (100.0%) |
| Arts, Media & Entertainment | 0 (0.0%) | 0 (0.0%) |
| Health Diagnosing & Treating | 0 (0.0%) | 11 (100.0%) |
| Health Technologists | 0 (0.0%) | 11 (100.0%) |
| Total (Category) | 7 (14.0%) | 43 (86.0%) |
| Total (Overall) | 57 (47.9%) | 62 (52.1%) |
Services Occupations
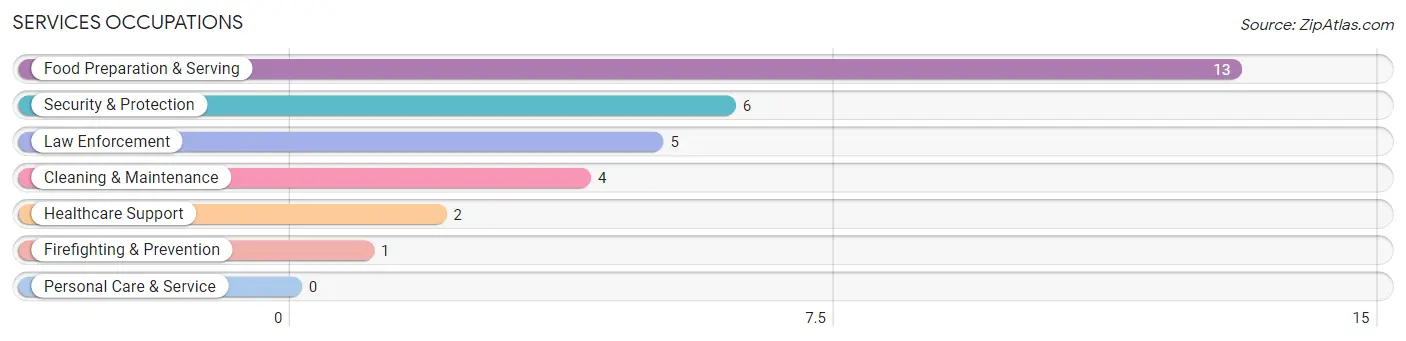
The most common Services occupations in Maxwell are Food Preparation & Serving (13 | 10.9%), Security & Protection (6 | 5.0%), Law Enforcement (5 | 4.2%), Cleaning & Maintenance (4 | 3.4%), and Healthcare Support (2 | 1.7%).
Services Occupations by Sex
Within the Services occupations in Maxwell, the most male-oriented occupations are Security & Protection (100.0%), Firefighting & Prevention (100.0%), and Law Enforcement (100.0%), while the most female-oriented occupations are Healthcare Support (100.0%), and Cleaning & Maintenance (50.0%).
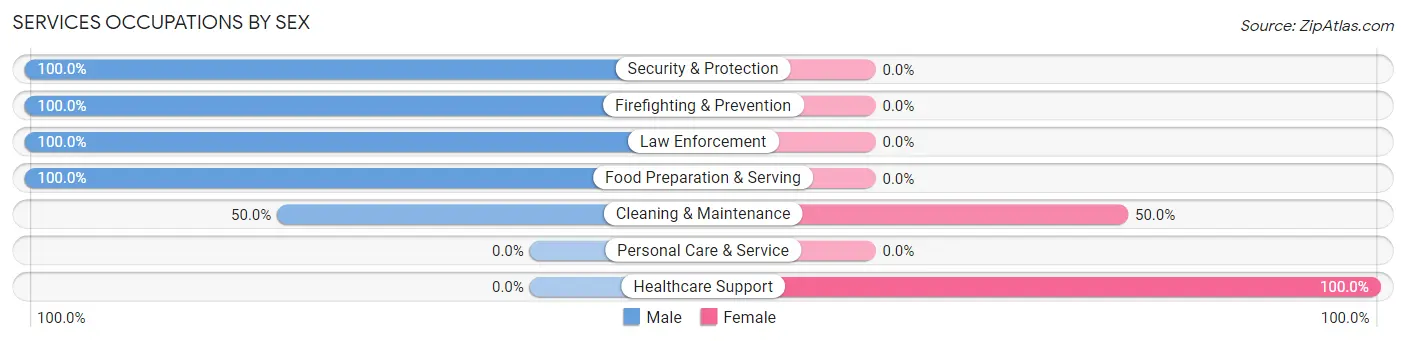
| Occupation | Male | Female |
| Healthcare Support | 0 (0.0%) | 2 (100.0%) |
| Security & Protection | 6 (100.0%) | 0 (0.0%) |
| Firefighting & Prevention | 1 (100.0%) | 0 (0.0%) |
| Law Enforcement | 5 (100.0%) | 0 (0.0%) |
| Food Preparation & Serving | 13 (100.0%) | 0 (0.0%) |
| Cleaning & Maintenance | 2 (50.0%) | 2 (50.0%) |
| Personal Care & Service | 0 (0.0%) | 0 (0.0%) |
| Total (Category) | 21 (84.0%) | 4 (16.0%) |
| Total (Overall) | 57 (47.9%) | 62 (52.1%) |
Sales and Office Occupations
The most common Sales and Office occupations in Maxwell are Sales & Related (6 | 5.0%), and Office & Administration (6 | 5.0%).

Sales and Office Occupations by Sex

| Occupation | Male | Female |
| Sales & Related | 6 (100.0%) | 0 (0.0%) |
| Office & Administration | 0 (0.0%) | 6 (100.0%) |
| Total (Category) | 6 (50.0%) | 6 (50.0%) |
| Total (Overall) | 57 (47.9%) | 62 (52.1%) |
Natural Resources, Construction and Maintenance Occupations
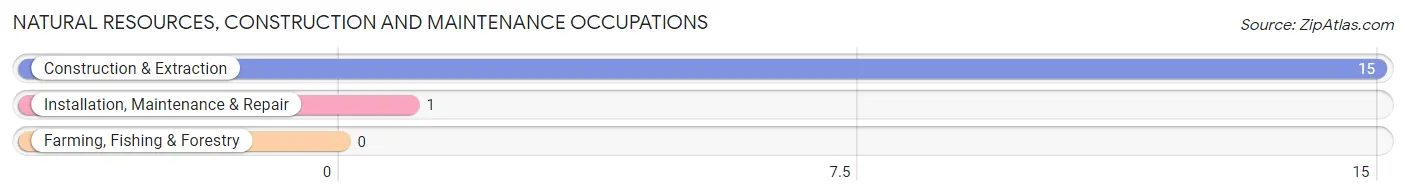
The most common Natural Resources, Construction and Maintenance occupations in Maxwell are Construction & Extraction (15 | 12.6%), and Installation, Maintenance & Repair (1 | 0.8%).
Natural Resources, Construction and Maintenance Occupations by Sex
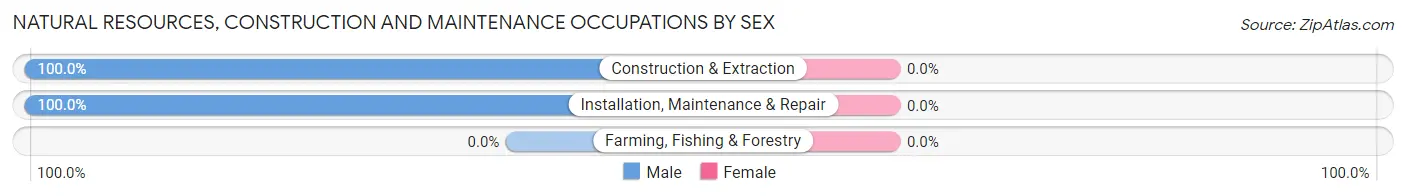
| Occupation | Male | Female |
| Farming, Fishing & Forestry | 0 (0.0%) | 0 (0.0%) |
| Construction & Extraction | 15 (100.0%) | 0 (0.0%) |
| Installation, Maintenance & Repair | 1 (100.0%) | 0 (0.0%) |
| Total (Category) | 16 (100.0%) | 0 (0.0%) |
| Total (Overall) | 57 (47.9%) | 62 (52.1%) |
Production, Transportation and Moving Occupations
The most common Production, Transportation and Moving occupations in Maxwell are , and Transportation (16 | 13.5%).
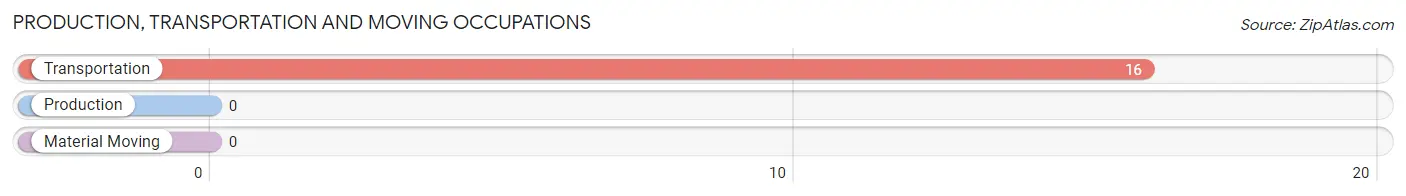
Production, Transportation and Moving Occupations by Sex
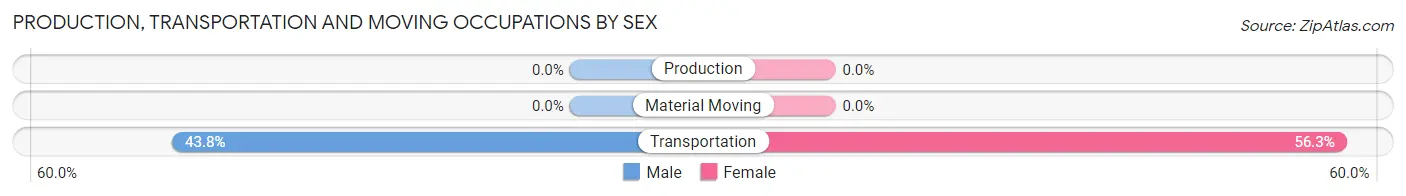
| Occupation | Male | Female |
| Production | 0 (0.0%) | 0 (0.0%) |
| Transportation | 7 (43.8%) | 9 (56.2%) |
| Material Moving | 0 (0.0%) | 0 (0.0%) |
| Total (Category) | 7 (43.8%) | 9 (56.2%) |
| Total (Overall) | 57 (47.9%) | 62 (52.1%) |
Employment Industries by Sex in Maxwell
Employment Industries in Maxwell
The major employment industries in Maxwell include Health Care & Social Assistance (30 | 25.2%), Educational Services (22 | 18.5%), Construction (15 | 12.6%), Accommodation & Food Services (14 | 11.8%), and Public Administration (14 | 11.8%).
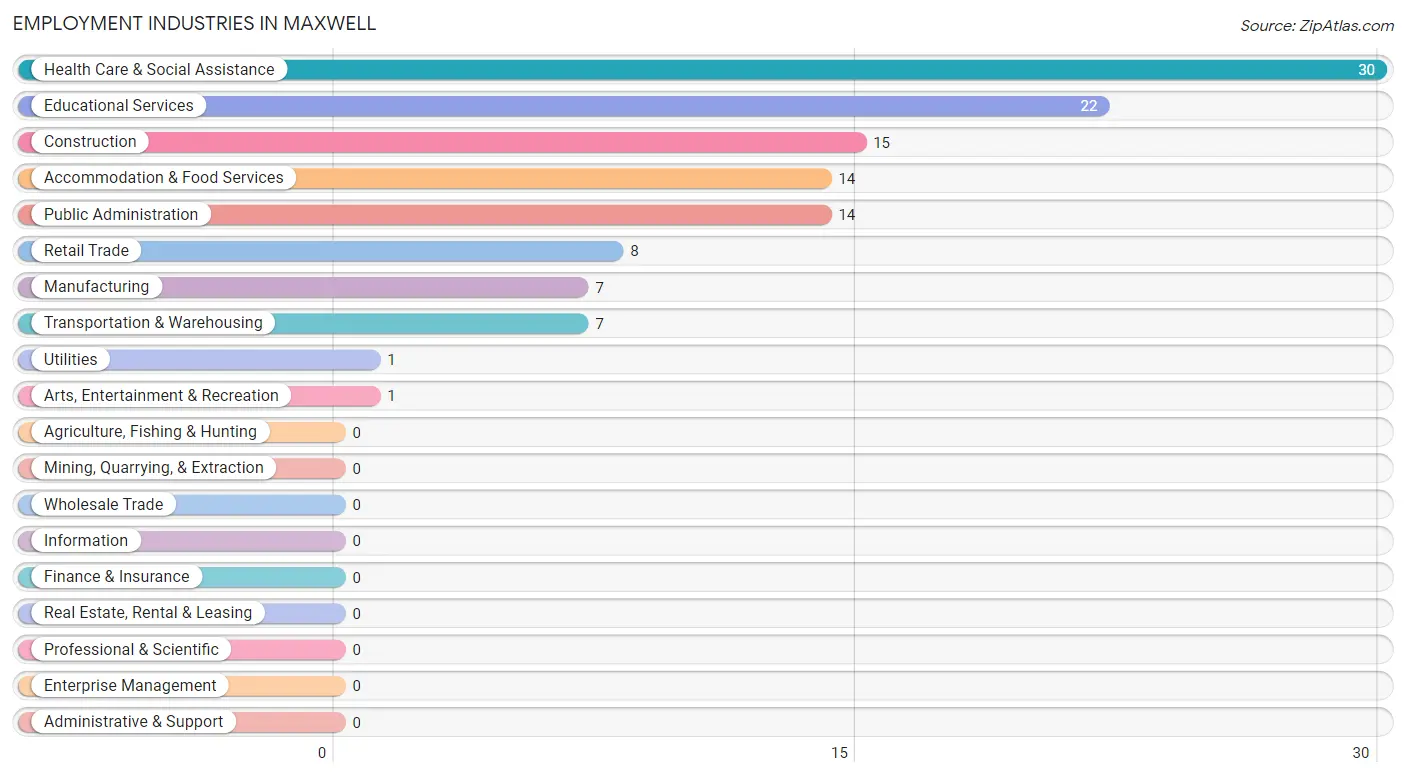
Employment Industries by Sex in Maxwell
The Maxwell industries that see more men than women are Construction (100.0%), Manufacturing (100.0%), and Retail Trade (100.0%), whereas the industries that tend to have a higher number of women are Utilities (100.0%), Educational Services (100.0%), and Health Care & Social Assistance (100.0%).
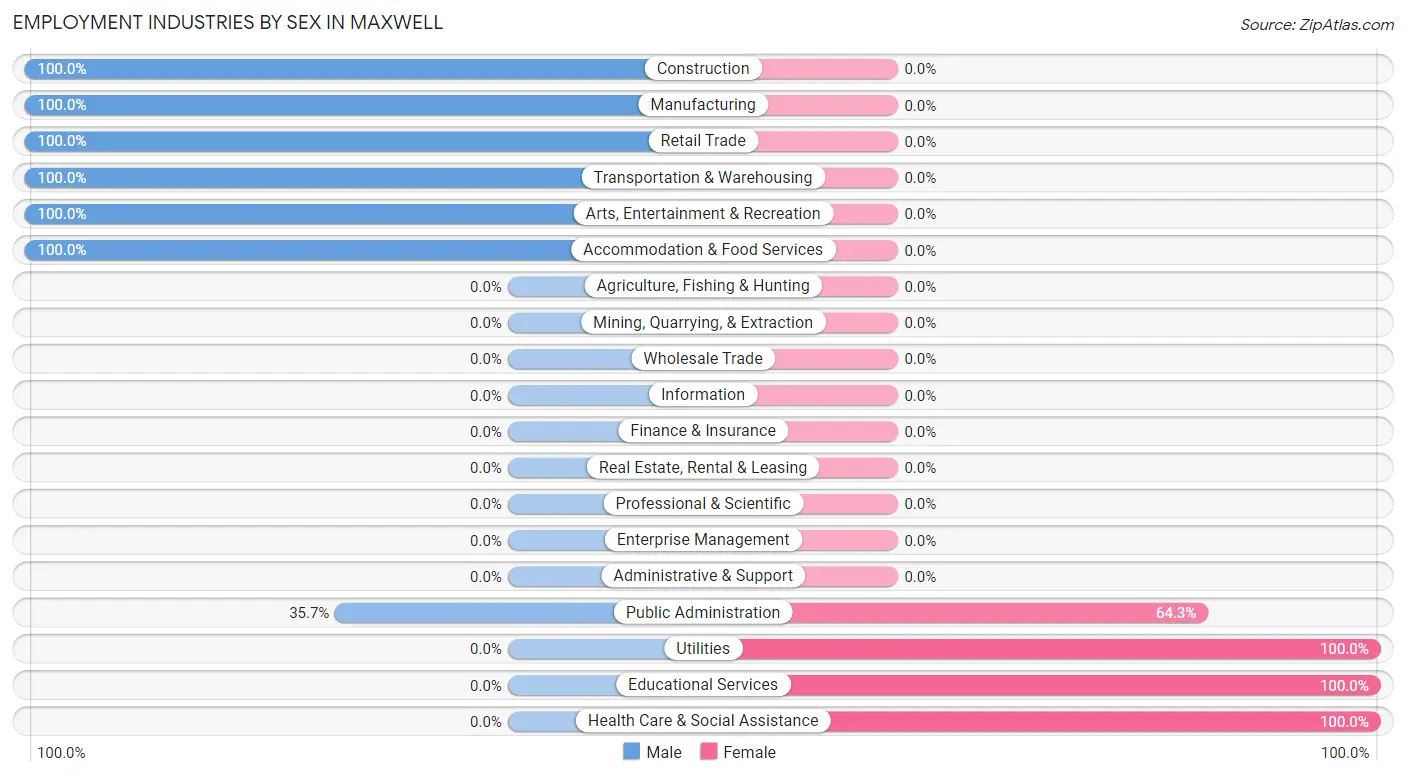
| Industry | Male | Female |
| Agriculture, Fishing & Hunting | 0 (0.0%) | 0 (0.0%) |
| Mining, Quarrying, & Extraction | 0 (0.0%) | 0 (0.0%) |
| Construction | 15 (100.0%) | 0 (0.0%) |
| Manufacturing | 7 (100.0%) | 0 (0.0%) |
| Wholesale Trade | 0 (0.0%) | 0 (0.0%) |
| Retail Trade | 8 (100.0%) | 0 (0.0%) |
| Transportation & Warehousing | 7 (100.0%) | 0 (0.0%) |
| Utilities | 0 (0.0%) | 1 (100.0%) |
| Information | 0 (0.0%) | 0 (0.0%) |
| Finance & Insurance | 0 (0.0%) | 0 (0.0%) |
| Real Estate, Rental & Leasing | 0 (0.0%) | 0 (0.0%) |
| Professional & Scientific | 0 (0.0%) | 0 (0.0%) |
| Enterprise Management | 0 (0.0%) | 0 (0.0%) |
| Administrative & Support | 0 (0.0%) | 0 (0.0%) |
| Educational Services | 0 (0.0%) | 22 (100.0%) |
| Health Care & Social Assistance | 0 (0.0%) | 30 (100.0%) |
| Arts, Entertainment & Recreation | 1 (100.0%) | 0 (0.0%) |
| Accommodation & Food Services | 14 (100.0%) | 0 (0.0%) |
| Public Administration | 5 (35.7%) | 9 (64.3%) |
| Total | 57 (47.9%) | 62 (52.1%) |
Education in Maxwell
School Enrollment in Maxwell
The most common levels of schooling among the 208 students in Maxwell are middle school (63 | 30.3%), high school (61 | 29.3%), and elementary school (54 | 26.0%).
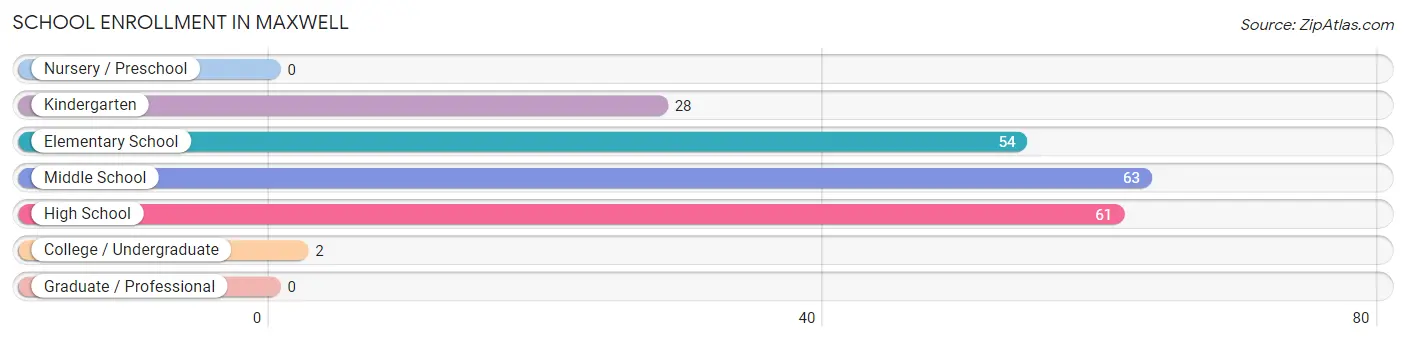
| School Level | # Students | % Students |
| Nursery / Preschool | 0 | 0.0% |
| Kindergarten | 28 | 13.5% |
| Elementary School | 54 | 26.0% |
| Middle School | 63 | 30.3% |
| High School | 61 | 29.3% |
| College / Undergraduate | 2 | 1.0% |
| Graduate / Professional | 0 | 0.0% |
| Total | 208 | 100.0% |
School Enrollment by Age by Funding Source in Maxwell
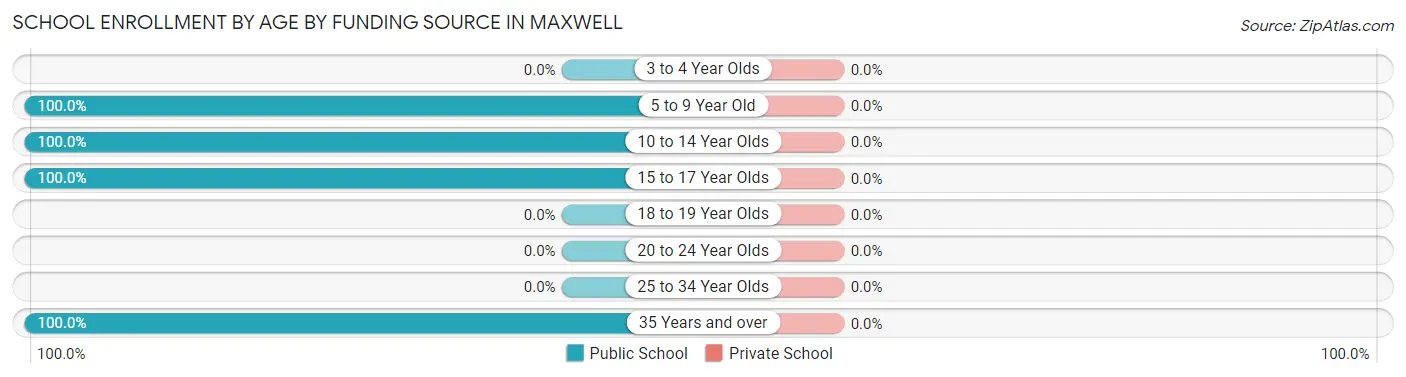
| Age Bracket | Public School | Private School |
| 3 to 4 Year Olds | 0 (0.0%) | 0 (0.0%) |
| 5 to 9 Year Old | 54 (100.0%) | 0 (0.0%) |
| 10 to 14 Year Olds | 91 (100.0%) | 0 (0.0%) |
| 15 to 17 Year Olds | 61 (100.0%) | 0 (0.0%) |
| 18 to 19 Year Olds | 0 (0.0%) | 0 (0.0%) |
| 20 to 24 Year Olds | 0 (0.0%) | 0 (0.0%) |
| 25 to 34 Year Olds | 0 (0.0%) | 0 (0.0%) |
| 35 Years and over | 2 (100.0%) | 0 (0.0%) |
| Total | 208 (100.0%) | 0 (0.0%) |
Educational Attainment by Field of Study in Maxwell
Science & technology (11 | 35.5%), psychology (10 | 32.3%), physical & health sciences (7 | 22.6%), and education (3 | 9.7%) are the most common fields of study among 31 individuals in Maxwell who have obtained a bachelor's degree or higher.
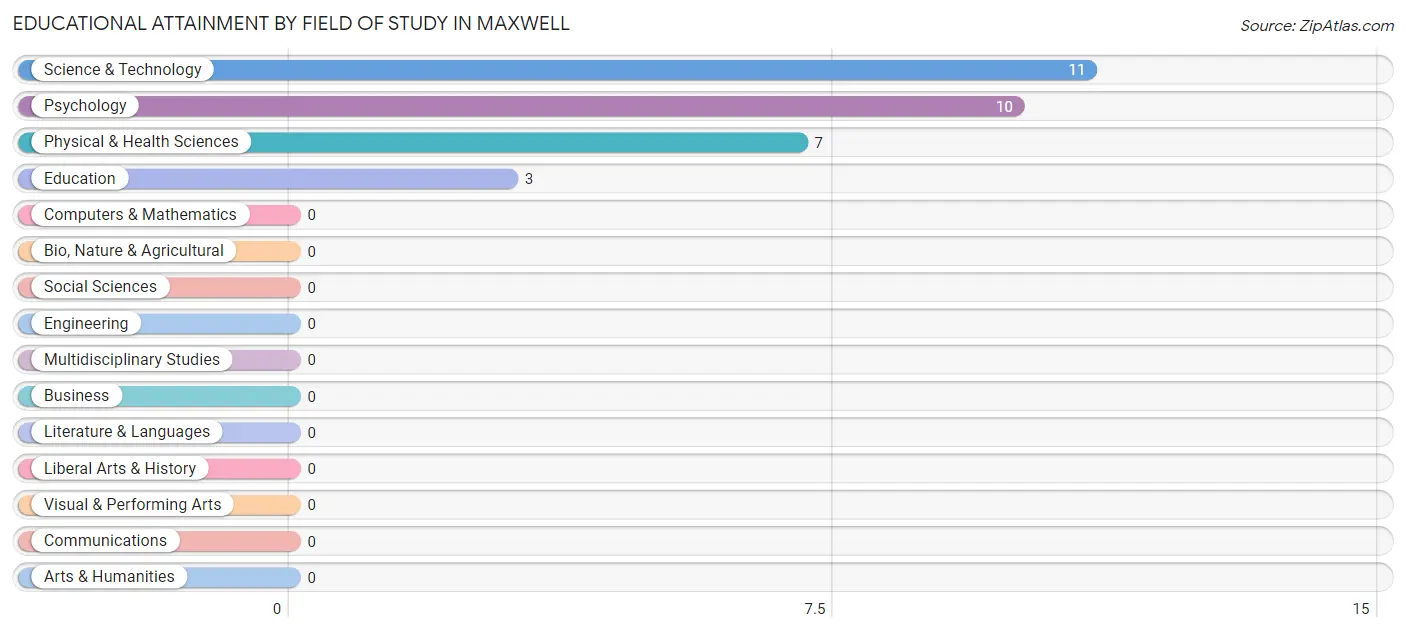
| Field of Study | # Graduates | % Graduates |
| Computers & Mathematics | 0 | 0.0% |
| Bio, Nature & Agricultural | 0 | 0.0% |
| Physical & Health Sciences | 7 | 22.6% |
| Psychology | 10 | 32.3% |
| Social Sciences | 0 | 0.0% |
| Engineering | 0 | 0.0% |
| Multidisciplinary Studies | 0 | 0.0% |
| Science & Technology | 11 | 35.5% |
| Business | 0 | 0.0% |
| Education | 3 | 9.7% |
| Literature & Languages | 0 | 0.0% |
| Liberal Arts & History | 0 | 0.0% |
| Visual & Performing Arts | 0 | 0.0% |
| Communications | 0 | 0.0% |
| Arts & Humanities | 0 | 0.0% |
| Total | 31 | 100.0% |
Transportation & Commute in Maxwell
Vehicle Availability by Sex in Maxwell
The most prevalent vehicle ownership categories in Maxwell are males with 3 vehicles (30, accounting for 45.5%) and females with 3 vehicles (20, making up 48.4%).
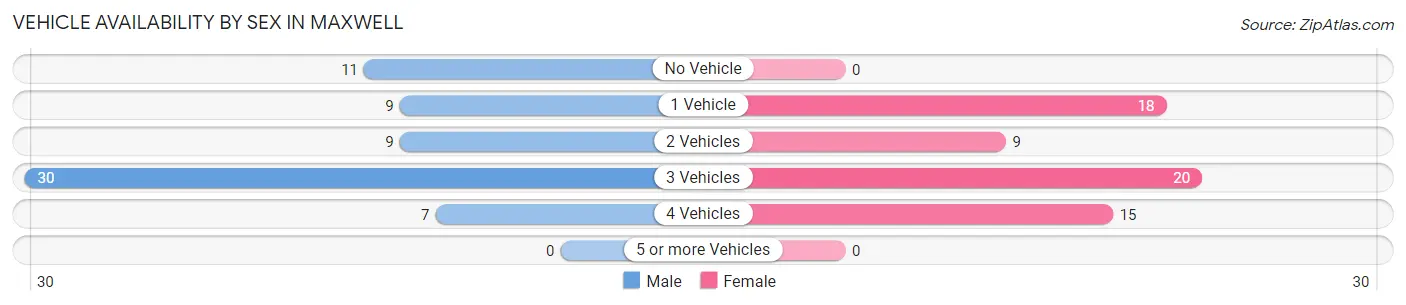
| Vehicles Available | Male | Female |
| No Vehicle | 11 (16.7%) | 0 (0.0%) |
| 1 Vehicle | 9 (13.6%) | 18 (29.0%) |
| 2 Vehicles | 9 (13.6%) | 9 (14.5%) |
| 3 Vehicles | 30 (45.5%) | 20 (32.3%) |
| 4 Vehicles | 7 (10.6%) | 15 (24.2%) |
| 5 or more Vehicles | 0 (0.0%) | 0 (0.0%) |
| Total | 66 (100.0%) | 62 (100.0%) |
Commute Time in Maxwell
The most frequently occuring commute durations in Maxwell are 25 to 29 minutes (29 commuters, 25.9%), less than 5 minutes (17 commuters, 15.2%), and 90 or more minutes (11 commuters, 9.8%).
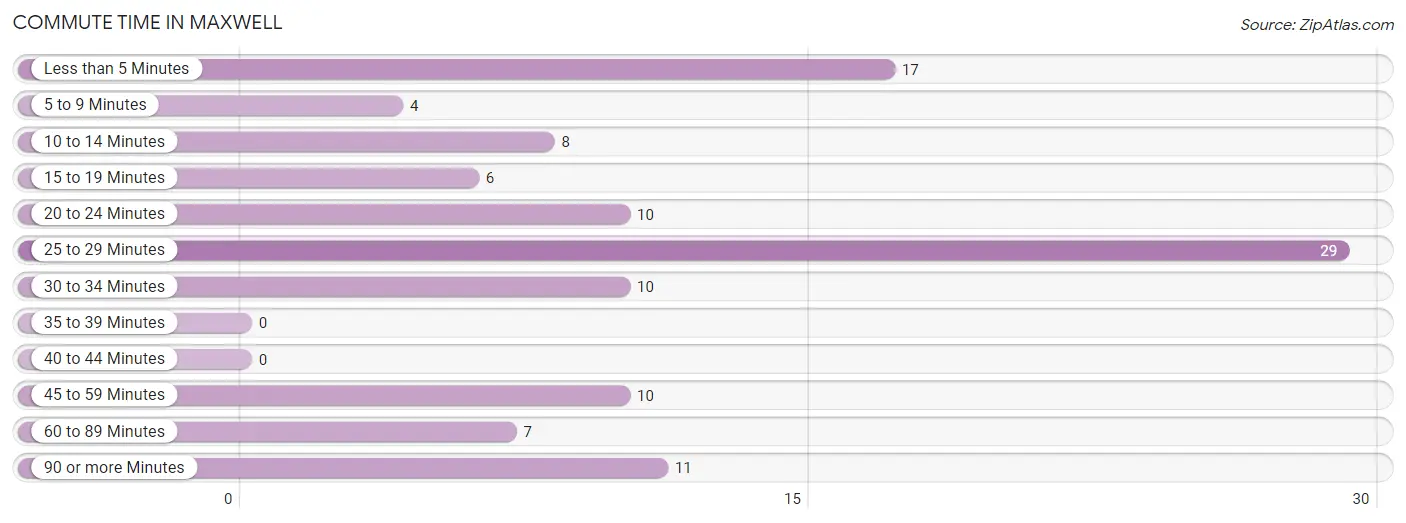
| Commute Time | # Commuters | % Commuters |
| Less than 5 Minutes | 17 | 15.2% |
| 5 to 9 Minutes | 4 | 3.6% |
| 10 to 14 Minutes | 8 | 7.1% |
| 15 to 19 Minutes | 6 | 5.4% |
| 20 to 24 Minutes | 10 | 8.9% |
| 25 to 29 Minutes | 29 | 25.9% |
| 30 to 34 Minutes | 10 | 8.9% |
| 35 to 39 Minutes | 0 | 0.0% |
| 40 to 44 Minutes | 0 | 0.0% |
| 45 to 59 Minutes | 10 | 8.9% |
| 60 to 89 Minutes | 7 | 6.2% |
| 90 or more Minutes | 11 | 9.8% |
Commute Time by Sex in Maxwell
The most common commute times in Maxwell are 25 to 29 minutes (18 commuters, 27.3%) for males and less than 5 minutes (17 commuters, 37.0%) for females.
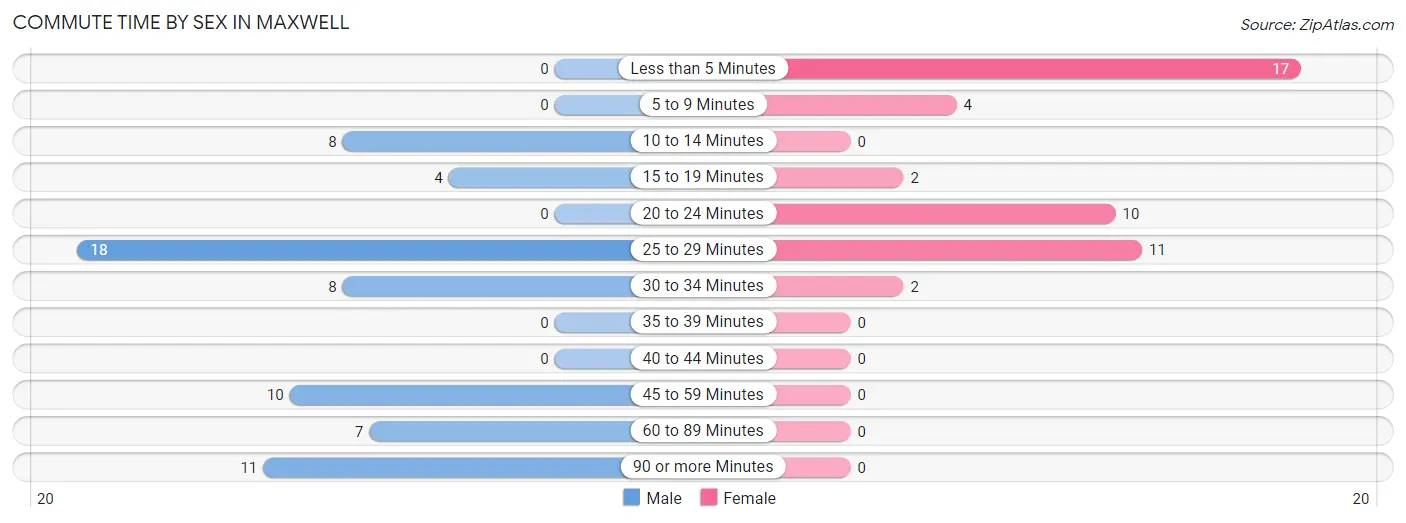
| Commute Time | Male | Female |
| Less than 5 Minutes | 0 (0.0%) | 17 (37.0%) |
| 5 to 9 Minutes | 0 (0.0%) | 4 (8.7%) |
| 10 to 14 Minutes | 8 (12.1%) | 0 (0.0%) |
| 15 to 19 Minutes | 4 (6.1%) | 2 (4.3%) |
| 20 to 24 Minutes | 0 (0.0%) | 10 (21.7%) |
| 25 to 29 Minutes | 18 (27.3%) | 11 (23.9%) |
| 30 to 34 Minutes | 8 (12.1%) | 2 (4.3%) |
| 35 to 39 Minutes | 0 (0.0%) | 0 (0.0%) |
| 40 to 44 Minutes | 0 (0.0%) | 0 (0.0%) |
| 45 to 59 Minutes | 10 (15.1%) | 0 (0.0%) |
| 60 to 89 Minutes | 7 (10.6%) | 0 (0.0%) |
| 90 or more Minutes | 11 (16.7%) | 0 (0.0%) |
Time of Departure to Work by Sex in Maxwell
The most frequent times of departure to work in Maxwell are 12:00 AM to 4:59 AM (17, 25.8%) for males and 7:00 AM to 7:29 AM (18, 39.1%) for females.
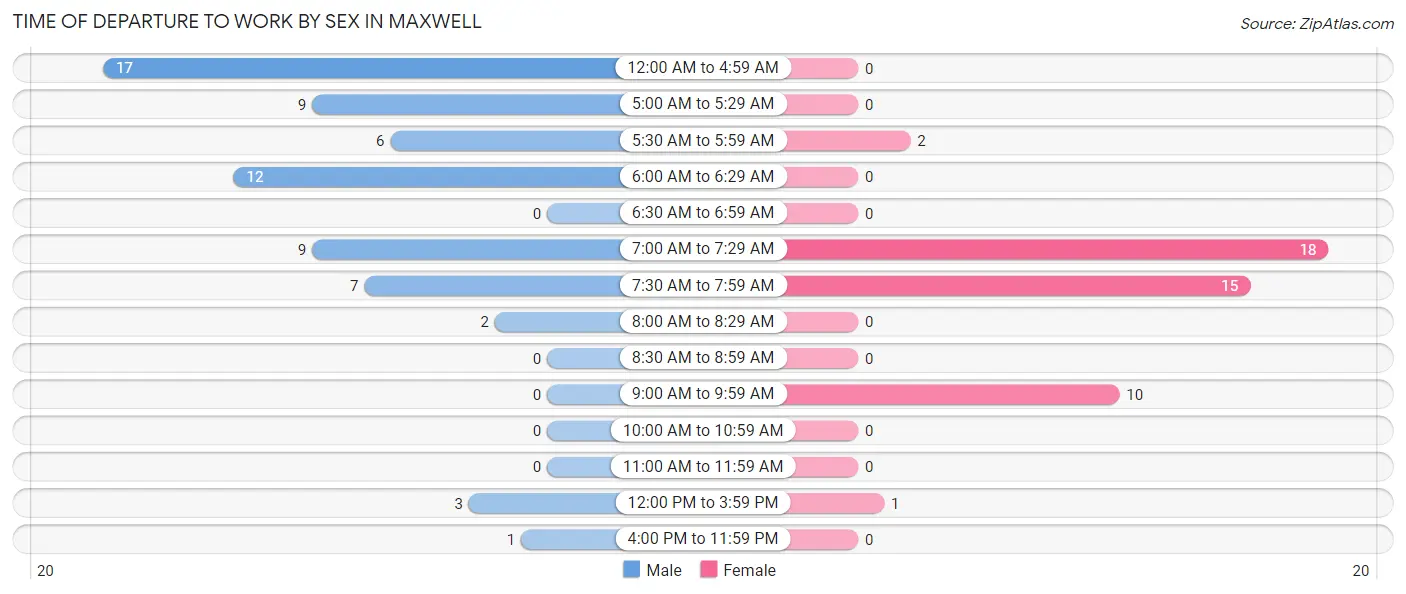
| Time of Departure | Male | Female |
| 12:00 AM to 4:59 AM | 17 (25.8%) | 0 (0.0%) |
| 5:00 AM to 5:29 AM | 9 (13.6%) | 0 (0.0%) |
| 5:30 AM to 5:59 AM | 6 (9.1%) | 2 (4.3%) |
| 6:00 AM to 6:29 AM | 12 (18.2%) | 0 (0.0%) |
| 6:30 AM to 6:59 AM | 0 (0.0%) | 0 (0.0%) |
| 7:00 AM to 7:29 AM | 9 (13.6%) | 18 (39.1%) |
| 7:30 AM to 7:59 AM | 7 (10.6%) | 15 (32.6%) |
| 8:00 AM to 8:29 AM | 2 (3.0%) | 0 (0.0%) |
| 8:30 AM to 8:59 AM | 0 (0.0%) | 0 (0.0%) |
| 9:00 AM to 9:59 AM | 0 (0.0%) | 10 (21.7%) |
| 10:00 AM to 10:59 AM | 0 (0.0%) | 0 (0.0%) |
| 11:00 AM to 11:59 AM | 0 (0.0%) | 0 (0.0%) |
| 12:00 PM to 3:59 PM | 3 (4.5%) | 1 (2.2%) |
| 4:00 PM to 11:59 PM | 1 (1.5%) | 0 (0.0%) |
| Total | 66 (100.0%) | 46 (100.0%) |
Housing Occupancy in Maxwell
Occupancy by Ownership in Maxwell
Of the total 140 dwellings in Maxwell, owner-occupied units account for 82 (58.6%), while renter-occupied units make up 58 (41.4%).
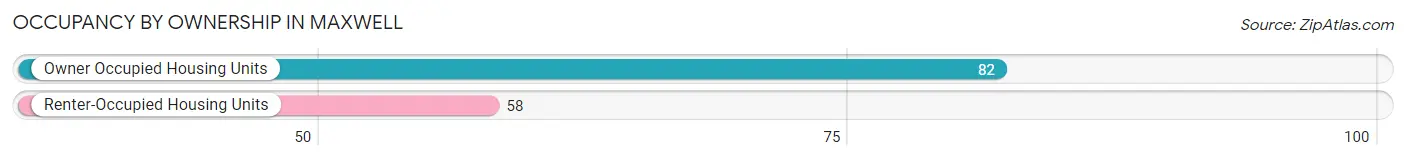
| Occupancy | # Housing Units | % Housing Units |
| Owner Occupied Housing Units | 82 | 58.6% |
| Renter-Occupied Housing Units | 58 | 41.4% |
| Total Occupied Housing Units | 140 | 100.0% |
Occupancy by Household Size in Maxwell
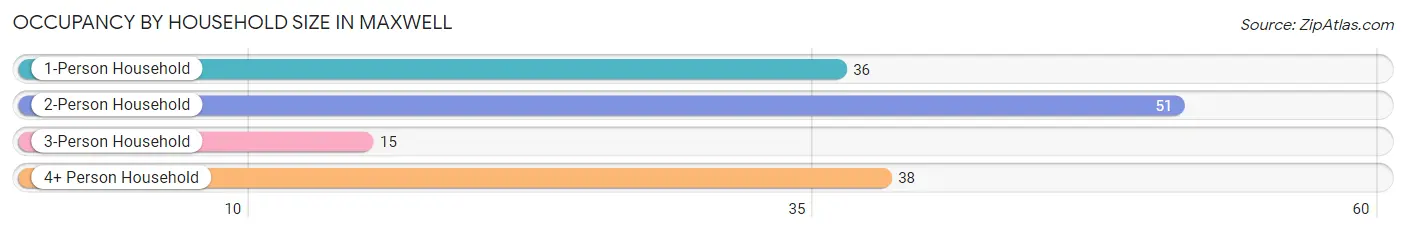
| Household Size | # Housing Units | % Housing Units |
| 1-Person Household | 36 | 25.7% |
| 2-Person Household | 51 | 36.4% |
| 3-Person Household | 15 | 10.7% |
| 4+ Person Household | 38 | 27.1% |
| Total Housing Units | 140 | 100.0% |
Occupancy by Ownership by Household Size in Maxwell
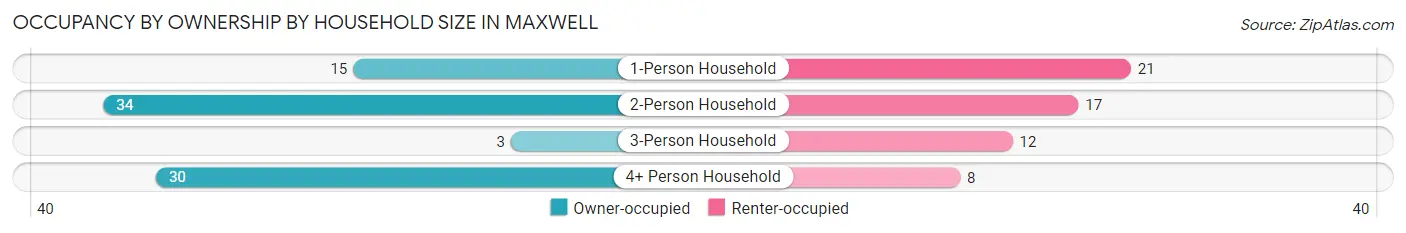
| Household Size | Owner-occupied | Renter-occupied |
| 1-Person Household | 15 (41.7%) | 21 (58.3%) |
| 2-Person Household | 34 (66.7%) | 17 (33.3%) |
| 3-Person Household | 3 (20.0%) | 12 (80.0%) |
| 4+ Person Household | 30 (78.9%) | 8 (21.0%) |
| Total Housing Units | 82 (58.6%) | 58 (41.4%) |
Occupancy by Educational Attainment in Maxwell
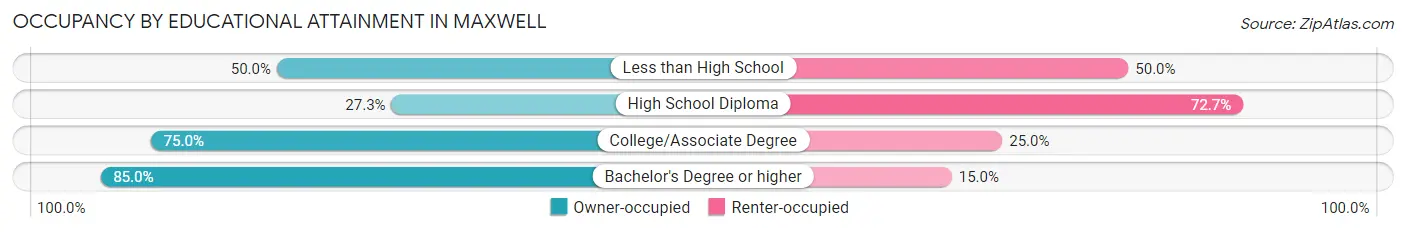
| Household Size | Owner-occupied | Renter-occupied |
| Less than High School | 8 (50.0%) | 8 (50.0%) |
| High School Diploma | 12 (27.3%) | 32 (72.7%) |
| College/Associate Degree | 45 (75.0%) | 15 (25.0%) |
| Bachelor's Degree or higher | 17 (85.0%) | 3 (15.0%) |
Occupancy by Age of Householder in Maxwell
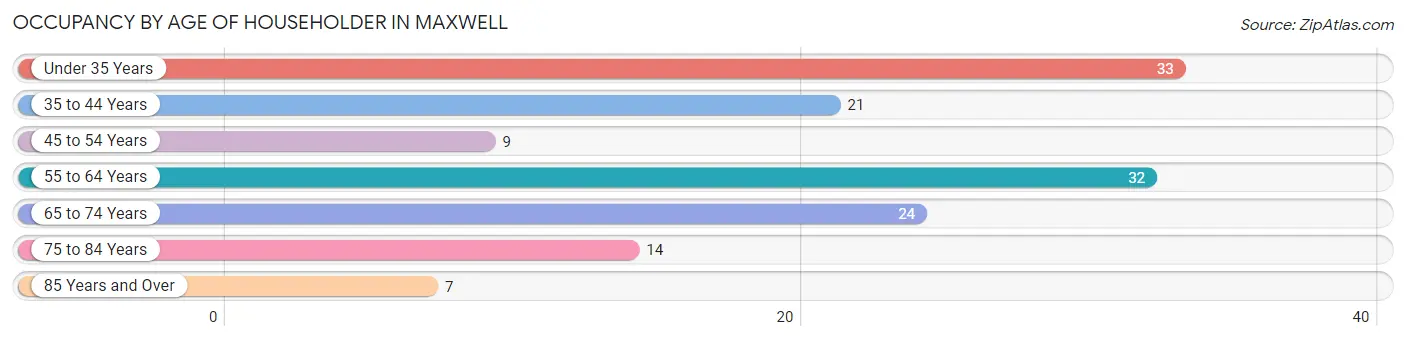
| Age Bracket | # Households | % Households |
| Under 35 Years | 33 | 23.6% |
| 35 to 44 Years | 21 | 15.0% |
| 45 to 54 Years | 9 | 6.4% |
| 55 to 64 Years | 32 | 22.9% |
| 65 to 74 Years | 24 | 17.1% |
| 75 to 84 Years | 14 | 10.0% |
| 85 Years and Over | 7 | 5.0% |
| Total | 140 | 100.0% |
Housing Finances in Maxwell
Median Income by Occupancy in Maxwell
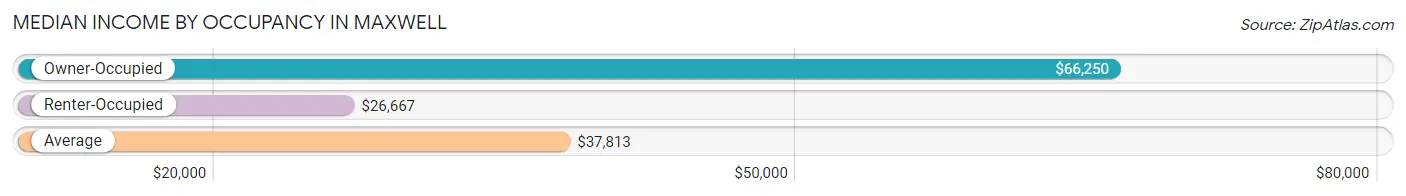
| Occupancy Type | # Households | Median Income |
| Owner-Occupied | 82 (58.6%) | $66,250 |
| Renter-Occupied | 58 (41.4%) | $26,667 |
| Average | 140 (100.0%) | $37,813 |
Occupancy by Householder Income Bracket in Maxwell
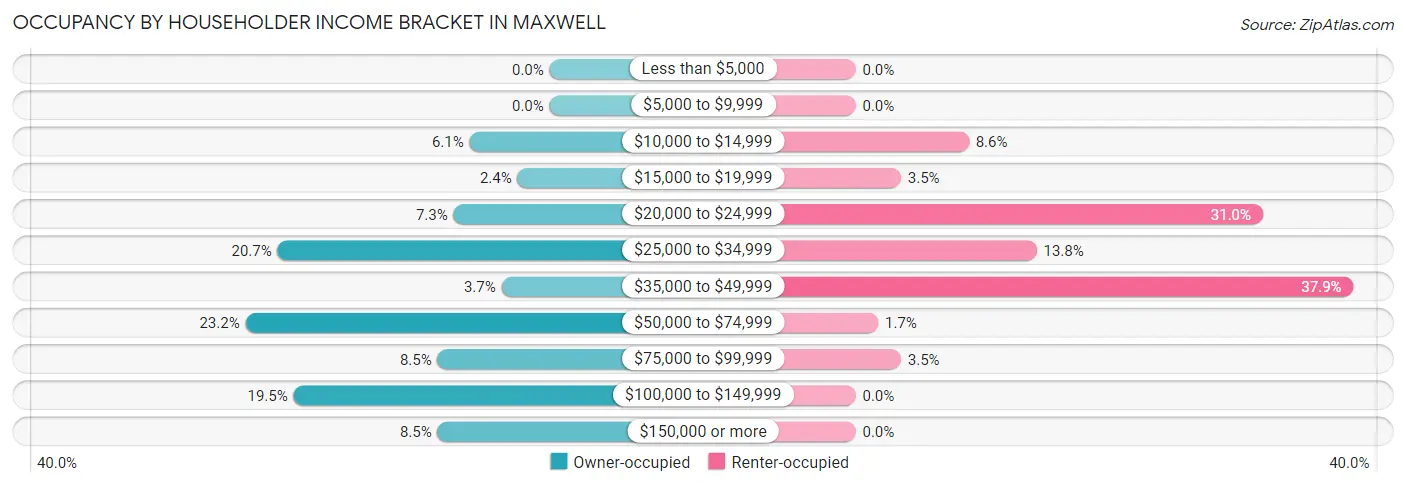
| Income Bracket | Owner-occupied | Renter-occupied |
| Less than $5,000 | 0 (0.0%) | 0 (0.0%) |
| $5,000 to $9,999 | 0 (0.0%) | 0 (0.0%) |
| $10,000 to $14,999 | 5 (6.1%) | 5 (8.6%) |
| $15,000 to $19,999 | 2 (2.4%) | 2 (3.5%) |
| $20,000 to $24,999 | 6 (7.3%) | 18 (31.0%) |
| $25,000 to $34,999 | 17 (20.7%) | 8 (13.8%) |
| $35,000 to $49,999 | 3 (3.7%) | 22 (37.9%) |
| $50,000 to $74,999 | 19 (23.2%) | 1 (1.7%) |
| $75,000 to $99,999 | 7 (8.5%) | 2 (3.5%) |
| $100,000 to $149,999 | 16 (19.5%) | 0 (0.0%) |
| $150,000 or more | 7 (8.5%) | 0 (0.0%) |
| Total | 82 (100.0%) | 58 (100.0%) |
Monthly Housing Cost Tiers in Maxwell
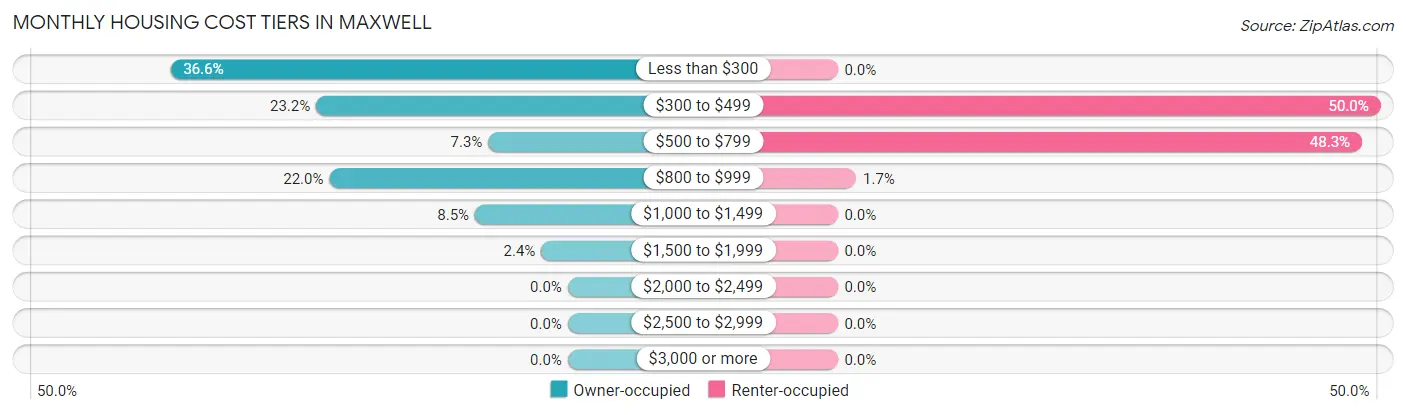
| Monthly Cost | Owner-occupied | Renter-occupied |
| Less than $300 | 30 (36.6%) | 0 (0.0%) |
| $300 to $499 | 19 (23.2%) | 29 (50.0%) |
| $500 to $799 | 6 (7.3%) | 28 (48.3%) |
| $800 to $999 | 18 (22.0%) | 1 (1.7%) |
| $1,000 to $1,499 | 7 (8.5%) | 0 (0.0%) |
| $1,500 to $1,999 | 2 (2.4%) | 0 (0.0%) |
| $2,000 to $2,499 | 0 (0.0%) | 0 (0.0%) |
| $2,500 to $2,999 | 0 (0.0%) | 0 (0.0%) |
| $3,000 or more | 0 (0.0%) | 0 (0.0%) |
| Total | 82 (100.0%) | 58 (100.0%) |
Physical Housing Characteristics in Maxwell
Housing Structures in Maxwell
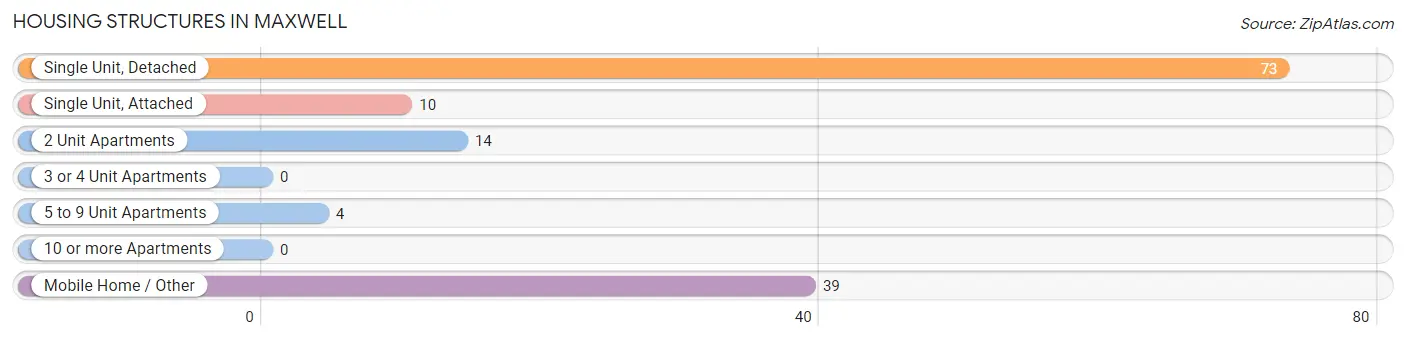
| Structure Type | # Housing Units | % Housing Units |
| Single Unit, Detached | 73 | 52.1% |
| Single Unit, Attached | 10 | 7.1% |
| 2 Unit Apartments | 14 | 10.0% |
| 3 or 4 Unit Apartments | 0 | 0.0% |
| 5 to 9 Unit Apartments | 4 | 2.9% |
| 10 or more Apartments | 0 | 0.0% |
| Mobile Home / Other | 39 | 27.9% |
| Total | 140 | 100.0% |
Housing Structures by Occupancy in Maxwell
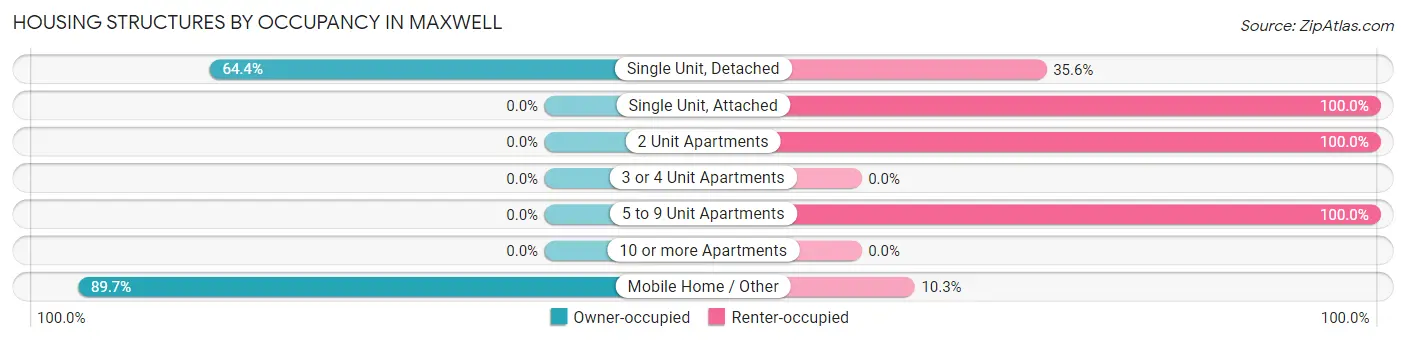
| Structure Type | Owner-occupied | Renter-occupied |
| Single Unit, Detached | 47 (64.4%) | 26 (35.6%) |
| Single Unit, Attached | 0 (0.0%) | 10 (100.0%) |
| 2 Unit Apartments | 0 (0.0%) | 14 (100.0%) |
| 3 or 4 Unit Apartments | 0 (0.0%) | 0 (0.0%) |
| 5 to 9 Unit Apartments | 0 (0.0%) | 4 (100.0%) |
| 10 or more Apartments | 0 (0.0%) | 0 (0.0%) |
| Mobile Home / Other | 35 (89.7%) | 4 (10.3%) |
| Total | 82 (58.6%) | 58 (41.4%) |
Housing Structures by Number of Rooms in Maxwell
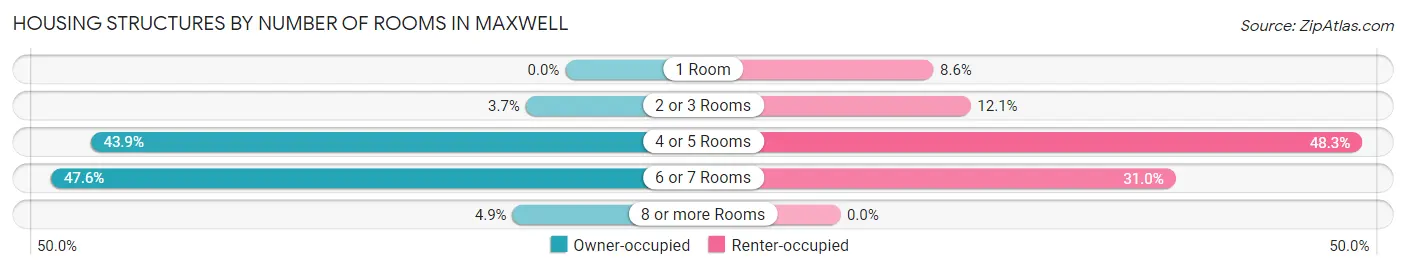
| Number of Rooms | Owner-occupied | Renter-occupied |
| 1 Room | 0 (0.0%) | 5 (8.6%) |
| 2 or 3 Rooms | 3 (3.7%) | 7 (12.1%) |
| 4 or 5 Rooms | 36 (43.9%) | 28 (48.3%) |
| 6 or 7 Rooms | 39 (47.6%) | 18 (31.0%) |
| 8 or more Rooms | 4 (4.9%) | 0 (0.0%) |
| Total | 82 (100.0%) | 58 (100.0%) |
Housing Structure by Heating Type in Maxwell
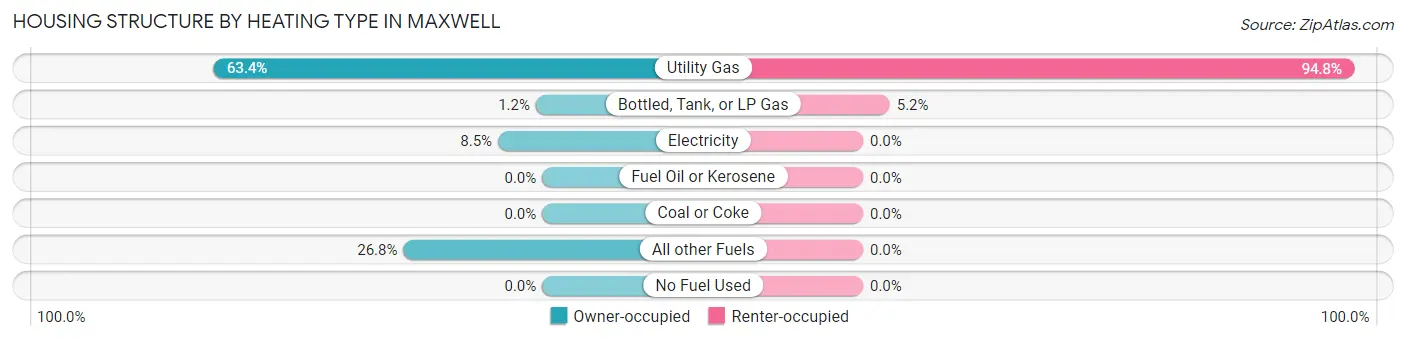
| Heating Type | Owner-occupied | Renter-occupied |
| Utility Gas | 52 (63.4%) | 55 (94.8%) |
| Bottled, Tank, or LP Gas | 1 (1.2%) | 3 (5.2%) |
| Electricity | 7 (8.5%) | 0 (0.0%) |
| Fuel Oil or Kerosene | 0 (0.0%) | 0 (0.0%) |
| Coal or Coke | 0 (0.0%) | 0 (0.0%) |
| All other Fuels | 22 (26.8%) | 0 (0.0%) |
| No Fuel Used | 0 (0.0%) | 0 (0.0%) |
| Total | 82 (100.0%) | 58 (100.0%) |
Household Vehicle Usage in Maxwell
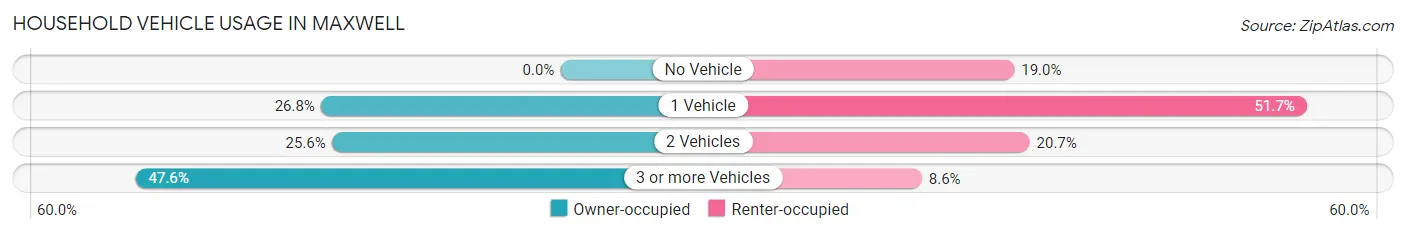
| Vehicles per Household | Owner-occupied | Renter-occupied |
| No Vehicle | 0 (0.0%) | 11 (19.0%) |
| 1 Vehicle | 22 (26.8%) | 30 (51.7%) |
| 2 Vehicles | 21 (25.6%) | 12 (20.7%) |
| 3 or more Vehicles | 39 (47.6%) | 5 (8.6%) |
| Total | 82 (100.0%) | 58 (100.0%) |
Real Estate & Mortgages in Maxwell
Real Estate and Mortgage Overview in Maxwell
| Characteristic | Without Mortgage | With Mortgage |
| Housing Units | 53 | 29 |
| Median Property Value | $61,300 | $89,500 |
| Median Household Income | $44,375 | $0 |
| Monthly Housing Costs | $291 | $0 |
| Real Estate Taxes | $475 | $2 |
Property Value by Mortgage Status in Maxwell
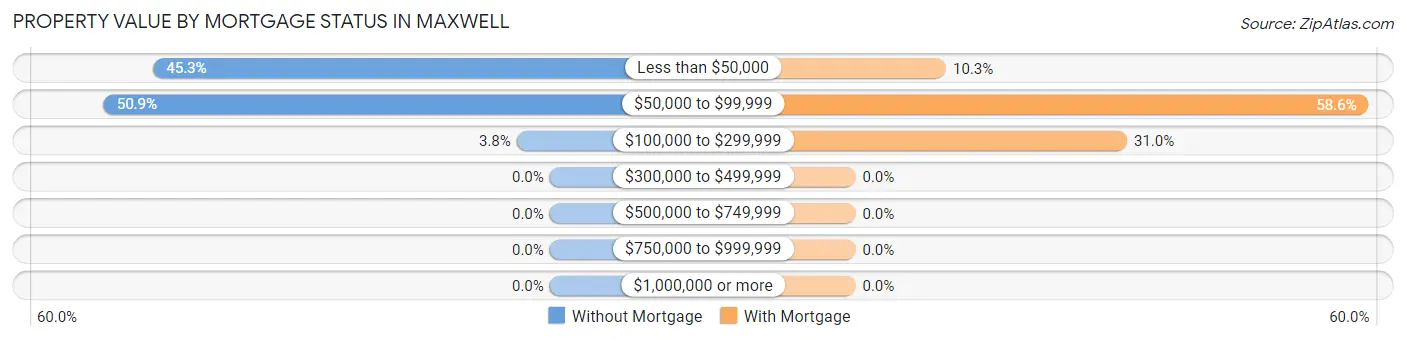
| Property Value | Without Mortgage | With Mortgage |
| Less than $50,000 | 24 (45.3%) | 3 (10.3%) |
| $50,000 to $99,999 | 27 (50.9%) | 17 (58.6%) |
| $100,000 to $299,999 | 2 (3.8%) | 9 (31.0%) |
| $300,000 to $499,999 | 0 (0.0%) | 0 (0.0%) |
| $500,000 to $749,999 | 0 (0.0%) | 0 (0.0%) |
| $750,000 to $999,999 | 0 (0.0%) | 0 (0.0%) |
| $1,000,000 or more | 0 (0.0%) | 0 (0.0%) |
| Total | 53 (100.0%) | 29 (100.0%) |
Household Income by Mortgage Status in Maxwell
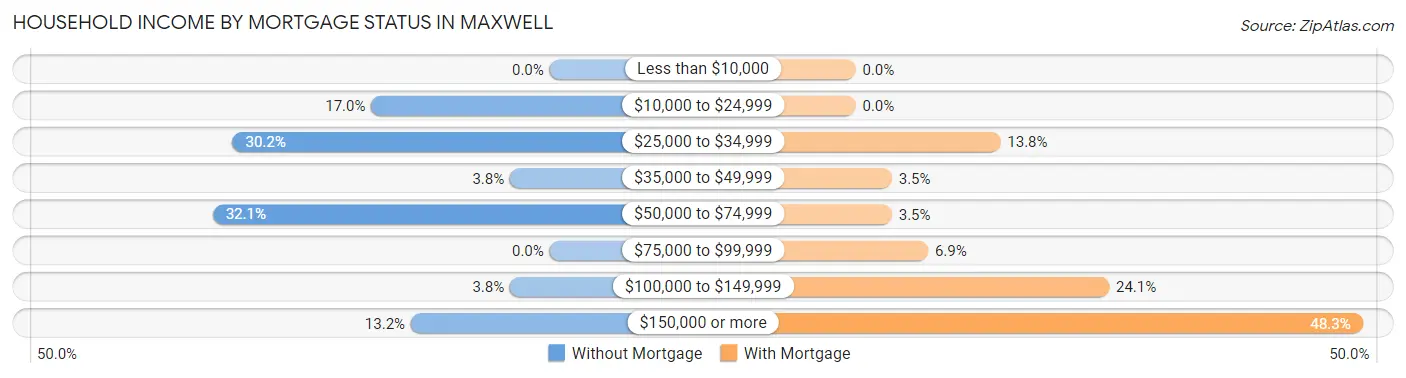
| Household Income | Without Mortgage | With Mortgage |
| Less than $10,000 | 0 (0.0%) | 0 (0.0%) |
| $10,000 to $24,999 | 9 (17.0%) | 0 (0.0%) |
| $25,000 to $34,999 | 16 (30.2%) | 4 (13.8%) |
| $35,000 to $49,999 | 2 (3.8%) | 1 (3.5%) |
| $50,000 to $74,999 | 17 (32.1%) | 1 (3.5%) |
| $75,000 to $99,999 | 0 (0.0%) | 2 (6.9%) |
| $100,000 to $149,999 | 2 (3.8%) | 7 (24.1%) |
| $150,000 or more | 7 (13.2%) | 14 (48.3%) |
| Total | 53 (100.0%) | 29 (100.0%) |
Property Value to Household Income Ratio in Maxwell
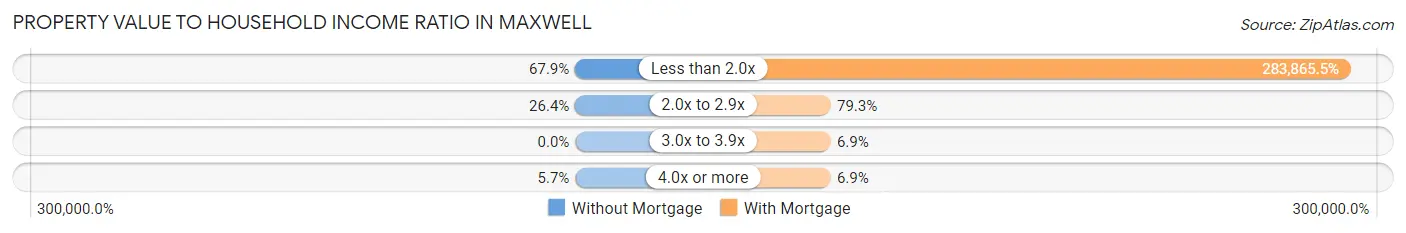
| Value-to-Income Ratio | Without Mortgage | With Mortgage |
| Less than 2.0x | 36 (67.9%) | 82,321 (283,865.5%) |
| 2.0x to 2.9x | 14 (26.4%) | 23 (79.3%) |
| 3.0x to 3.9x | 0 (0.0%) | 2 (6.9%) |
| 4.0x or more | 3 (5.7%) | 2 (6.9%) |
| Total | 53 (100.0%) | 29 (100.0%) |
Real Estate Taxes by Mortgage Status in Maxwell
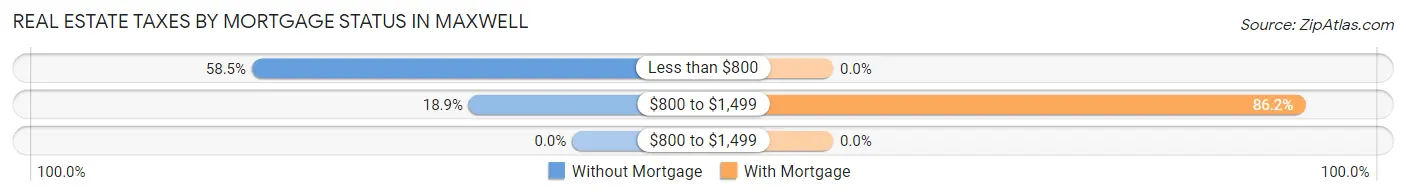
| Property Taxes | Without Mortgage | With Mortgage |
| Less than $800 | 31 (58.5%) | 0 (0.0%) |
| $800 to $1,499 | 10 (18.9%) | 25 (86.2%) |
| $800 to $1,499 | 0 (0.0%) | 0 (0.0%) |
| Total | 53 (100.0%) | 29 (100.0%) |
Health & Disability in Maxwell
Health Insurance Coverage by Age in Maxwell
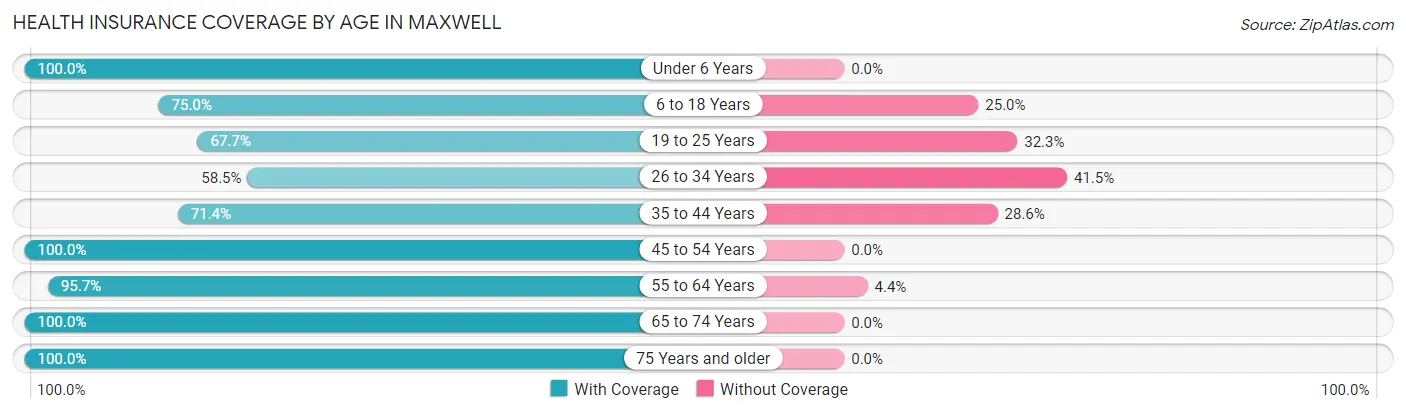
| Age Bracket | With Coverage | Without Coverage |
| Under 6 Years | 24 (100.0%) | 0 (0.0%) |
| 6 to 18 Years | 153 (75.0%) | 51 (25.0%) |
| 19 to 25 Years | 21 (67.7%) | 10 (32.3%) |
| 26 to 34 Years | 38 (58.5%) | 27 (41.5%) |
| 35 to 44 Years | 20 (71.4%) | 8 (28.6%) |
| 45 to 54 Years | 16 (100.0%) | 0 (0.0%) |
| 55 to 64 Years | 44 (95.7%) | 2 (4.3%) |
| 65 to 74 Years | 31 (100.0%) | 0 (0.0%) |
| 75 Years and older | 28 (100.0%) | 0 (0.0%) |
| Total | 375 (79.3%) | 98 (20.7%) |
Health Insurance Coverage by Citizenship Status in Maxwell
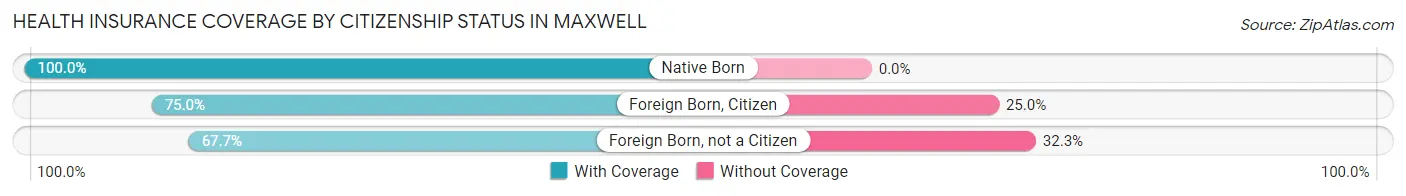
| Citizenship Status | With Coverage | Without Coverage |
| Native Born | 24 (100.0%) | 0 (0.0%) |
| Foreign Born, Citizen | 153 (75.0%) | 51 (25.0%) |
| Foreign Born, not a Citizen | 21 (67.7%) | 10 (32.3%) |
Health Insurance Coverage by Household Income in Maxwell
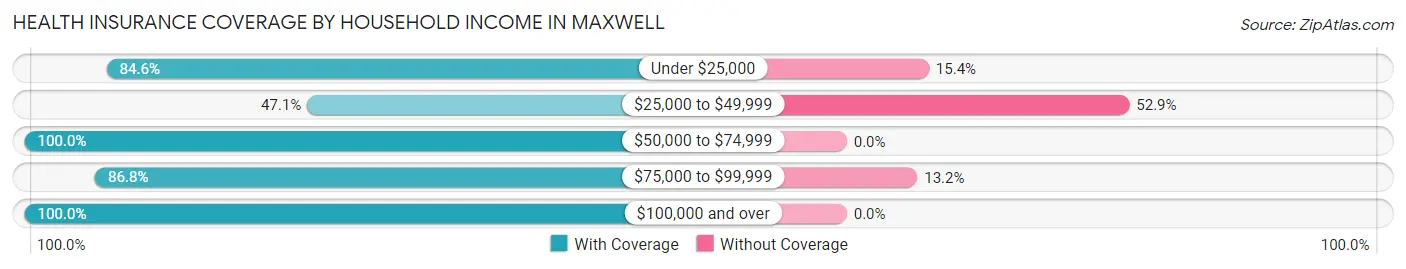
| Household Income | With Coverage | Without Coverage |
| Under $25,000 | 55 (84.6%) | 10 (15.4%) |
| $25,000 to $49,999 | 72 (47.1%) | 81 (52.9%) |
| $50,000 to $74,999 | 77 (100.0%) | 0 (0.0%) |
| $75,000 to $99,999 | 46 (86.8%) | 7 (13.2%) |
| $100,000 and over | 125 (100.0%) | 0 (0.0%) |
Public vs Private Health Insurance Coverage by Age in Maxwell
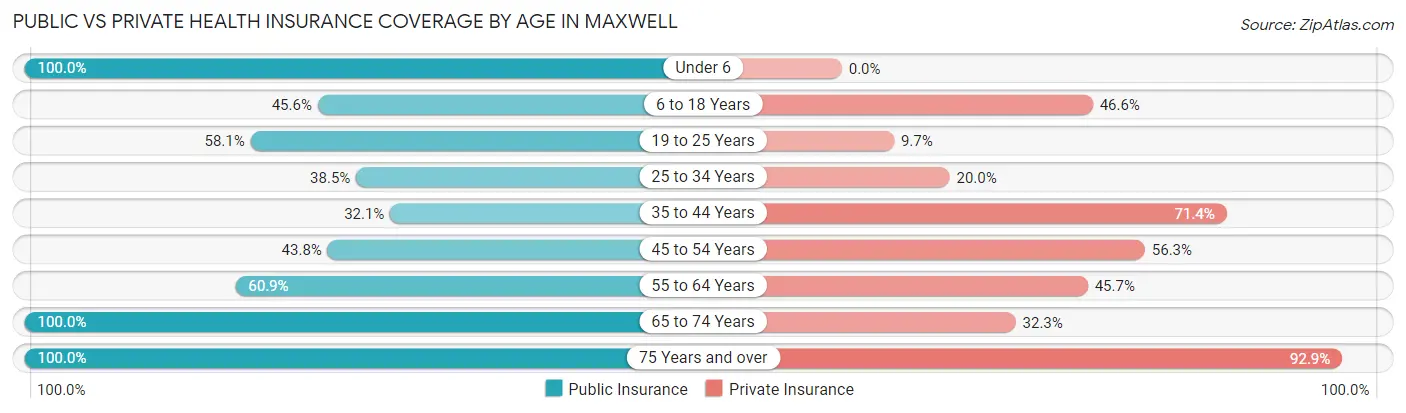
| Age Bracket | Public Insurance | Private Insurance |
| Under 6 | 24 (100.0%) | 0 (0.0%) |
| 6 to 18 Years | 93 (45.6%) | 95 (46.6%) |
| 19 to 25 Years | 18 (58.1%) | 3 (9.7%) |
| 25 to 34 Years | 25 (38.5%) | 13 (20.0%) |
| 35 to 44 Years | 9 (32.1%) | 20 (71.4%) |
| 45 to 54 Years | 7 (43.8%) | 9 (56.2%) |
| 55 to 64 Years | 28 (60.9%) | 21 (45.7%) |
| 65 to 74 Years | 31 (100.0%) | 10 (32.3%) |
| 75 Years and over | 28 (100.0%) | 26 (92.9%) |
| Total | 263 (55.6%) | 197 (41.6%) |
Disability Status by Sex by Age in Maxwell
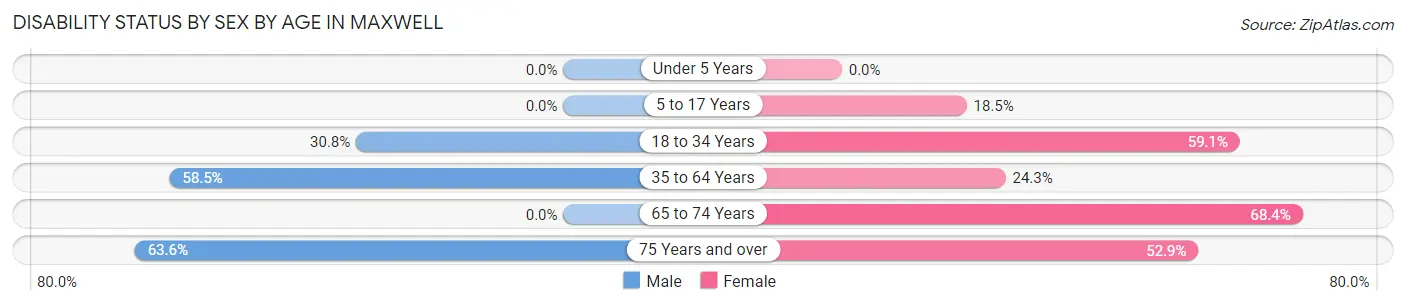
| Age Bracket | Male | Female |
| Under 5 Years | 0 (0.0%) | 0 (0.0%) |
| 5 to 17 Years | 0 (0.0%) | 20 (18.5%) |
| 18 to 34 Years | 16 (30.8%) | 26 (59.1%) |
| 35 to 64 Years | 31 (58.5%) | 9 (24.3%) |
| 65 to 74 Years | 0 (0.0%) | 13 (68.4%) |
| 75 Years and over | 7 (63.6%) | 9 (52.9%) |
Disability Class by Sex by Age in Maxwell
Disability Class: Hearing Difficulty
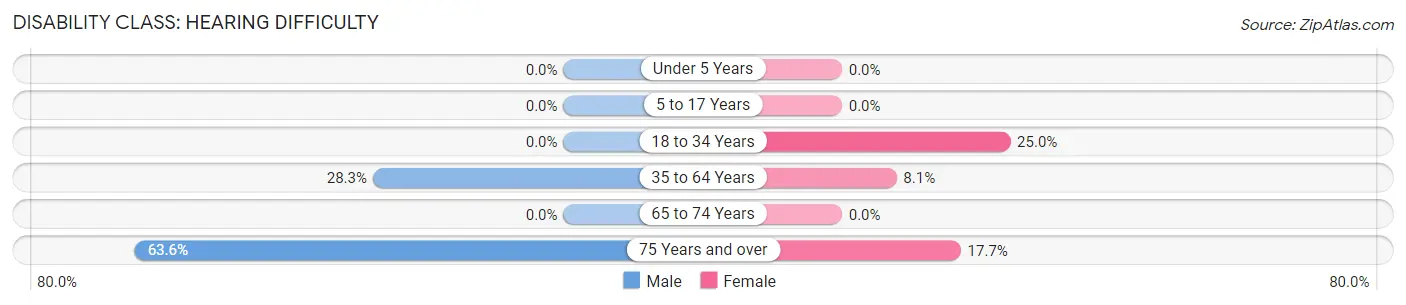
| Age Bracket | Male | Female |
| Under 5 Years | 0 (0.0%) | 0 (0.0%) |
| 5 to 17 Years | 0 (0.0%) | 0 (0.0%) |
| 18 to 34 Years | 0 (0.0%) | 11 (25.0%) |
| 35 to 64 Years | 15 (28.3%) | 3 (8.1%) |
| 65 to 74 Years | 0 (0.0%) | 0 (0.0%) |
| 75 Years and over | 7 (63.6%) | 3 (17.6%) |
Disability Class: Vision Difficulty
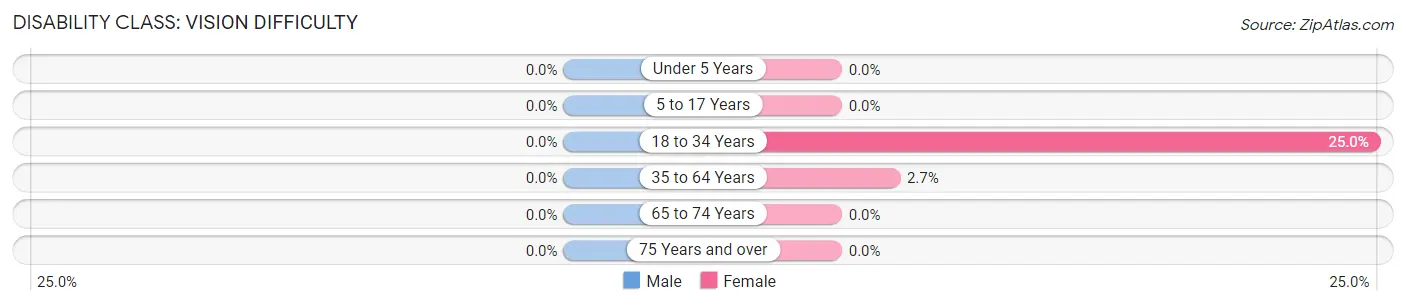
| Age Bracket | Male | Female |
| Under 5 Years | 0 (0.0%) | 0 (0.0%) |
| 5 to 17 Years | 0 (0.0%) | 0 (0.0%) |
| 18 to 34 Years | 0 (0.0%) | 11 (25.0%) |
| 35 to 64 Years | 0 (0.0%) | 1 (2.7%) |
| 65 to 74 Years | 0 (0.0%) | 0 (0.0%) |
| 75 Years and over | 0 (0.0%) | 0 (0.0%) |
Disability Class: Cognitive Difficulty
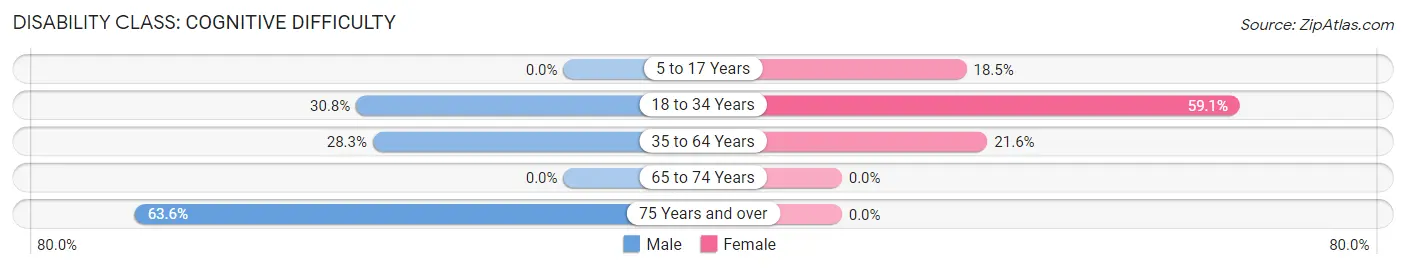
| Age Bracket | Male | Female |
| 5 to 17 Years | 0 (0.0%) | 20 (18.5%) |
| 18 to 34 Years | 16 (30.8%) | 26 (59.1%) |
| 35 to 64 Years | 15 (28.3%) | 8 (21.6%) |
| 65 to 74 Years | 0 (0.0%) | 0 (0.0%) |
| 75 Years and over | 7 (63.6%) | 0 (0.0%) |
Disability Class: Ambulatory Difficulty
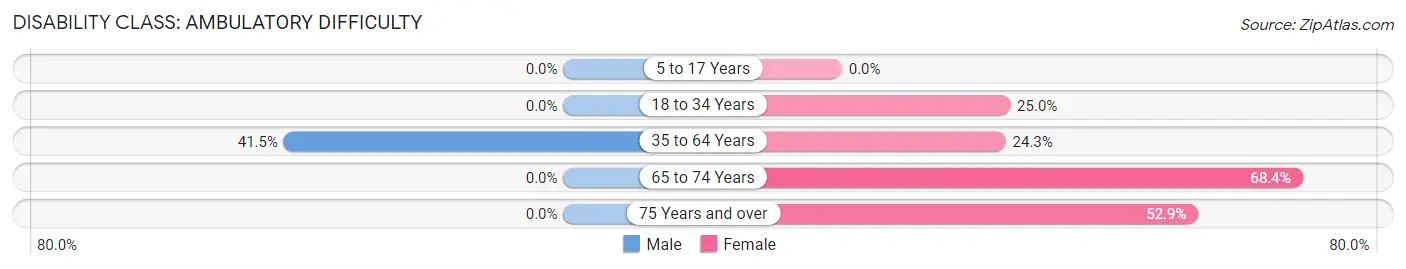
| Age Bracket | Male | Female |
| 5 to 17 Years | 0 (0.0%) | 0 (0.0%) |
| 18 to 34 Years | 0 (0.0%) | 11 (25.0%) |
| 35 to 64 Years | 22 (41.5%) | 9 (24.3%) |
| 65 to 74 Years | 0 (0.0%) | 13 (68.4%) |
| 75 Years and over | 0 (0.0%) | 9 (52.9%) |
Disability Class: Self-Care Difficulty
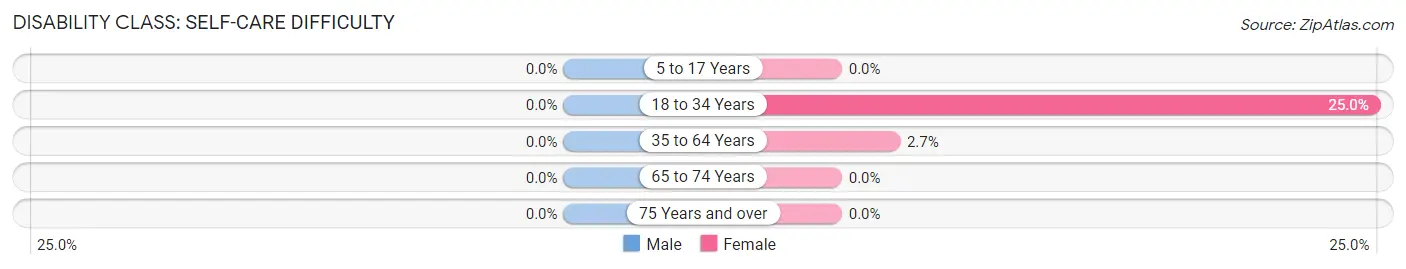
| Age Bracket | Male | Female |
| 5 to 17 Years | 0 (0.0%) | 0 (0.0%) |
| 18 to 34 Years | 0 (0.0%) | 11 (25.0%) |
| 35 to 64 Years | 0 (0.0%) | 1 (2.7%) |
| 65 to 74 Years | 0 (0.0%) | 0 (0.0%) |
| 75 Years and over | 0 (0.0%) | 0 (0.0%) |
Technology Access in Maxwell
Computing Device Access in Maxwell
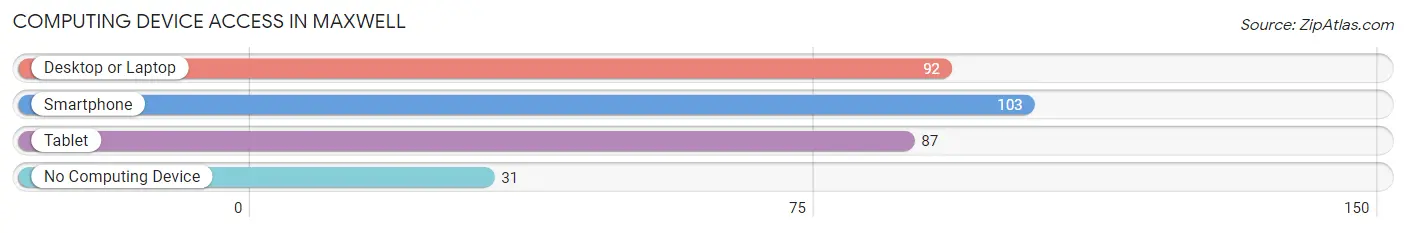
| Device Type | # Households | % Households |
| Desktop or Laptop | 92 | 65.7% |
| Smartphone | 103 | 73.6% |
| Tablet | 87 | 62.1% |
| No Computing Device | 31 | 22.1% |
| Total | 140 | 100.0% |
Internet Access in Maxwell
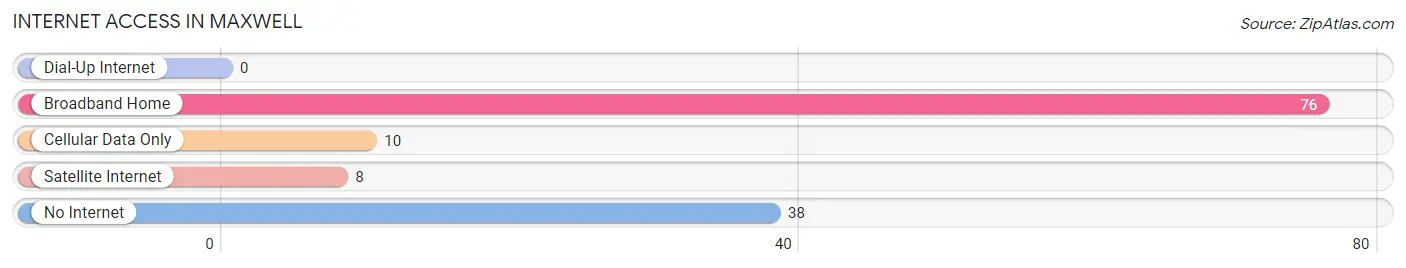
| Internet Type | # Households | % Households |
| Dial-Up Internet | 0 | 0.0% |
| Broadband Home | 76 | 54.3% |
| Cellular Data Only | 10 | 7.1% |
| Satellite Internet | 8 | 5.7% |
| No Internet | 38 | 27.1% |
| Total | 140 | 100.0% |
Maxwell Summary
Maxwell is a small unincorporated community located in Colfax County, New Mexico. It is situated in the northeastern part of the state, approximately 25 miles east of Raton and about 40 miles south of the Colorado border. The town is located in the foothills of the Sangre de Cristo Mountains, and is surrounded by rolling hills and grasslands. The population of Maxwell was estimated to be around 200 people in 2020.
History
Maxwell was founded in 1881 by a group of settlers from Texas. The town was named after a local rancher, William Maxwell, who owned a large ranch in the area. The town quickly grew and by the early 1900s, it had become a bustling community with a post office, a school, a hotel, and several stores.
In the early 1900s, Maxwell was a major stop on the Santa Fe Trail, and the town was a popular destination for travelers. The town also served as a supply center for the surrounding ranches and farms.
In the 1920s, Maxwell was a major center for the cattle industry. The town was home to several large ranches, and the Maxwell Livestock Company was one of the largest in the area.
Geography
Maxwell is located in the northeastern part of New Mexico, in Colfax County. The town is situated in the foothills of the Sangre de Cristo Mountains, and is surrounded by rolling hills and grasslands. The town is located at an elevation of 6,400 feet above sea level.
The climate in Maxwell is semi-arid, with hot summers and cold winters. The average annual temperature is around 50 degrees Fahrenheit, and the average annual precipitation is around 12 inches.
Economy
The economy of Maxwell is largely based on agriculture and ranching. The town is home to several large ranches, and the Maxwell Livestock Company is one of the largest in the area. The town also has a few small businesses, including a grocery store, a hardware store, and a few restaurants.
Demographics
As of the 2010 census, the population of Maxwell was estimated to be around 200 people. The racial makeup of the town was 95.0% White, 0.5% Native American, 0.5% Asian, and 4.0% from other races. The median household income in Maxwell was $31,250, and the median family income was $37,500. The per capita income in Maxwell was $14,818.
Maxwell is a small, rural community with a close-knit population. The town is home to a variety of people, from ranchers and farmers to small business owners and retirees. The town is known for its friendly atmosphere and welcoming attitude towards newcomers.
Common Questions
What is Per Capita Income in Maxwell?
Per Capita income in Maxwell is $17,328.
What is the Median Family Income in Maxwell?
Median Family Income in Maxwell is $43,333.
What is the Median Household income in Maxwell?
Median Household Income in Maxwell is $37,813.
What is Income or Wage Gap in Maxwell?
Income or Wage Gap in Maxwell is 12.3%.
Women in Maxwell earn 87.7 cents for every dollar earned by a man.
What is Inequality or Gini Index in Maxwell?
Inequality or Gini Index in Maxwell is 0.41.
What is the Total Population of Maxwell?
Total Population of Maxwell is 482.
What is the Total Male Population of Maxwell?
Total Male Population of Maxwell is 247.
What is the Total Female Population of Maxwell?
Total Female Population of Maxwell is 235.
What is the Ratio of Males per 100 Females in Maxwell?
There are 105.11 Males per 100 Females in Maxwell.
What is the Ratio of Females per 100 Males in Maxwell?
There are 95.14 Females per 100 Males in Maxwell.
What is the Median Population Age in Maxwell?
Median Population Age in Maxwell is 21.5 Years.
What is the Average Family Size in Maxwell
Average Family Size in Maxwell is 4.0 People.
What is the Average Household Size in Maxwell
Average Household Size in Maxwell is 3.4 People.
How Large is the Labor Force in Maxwell?
There are 128 People in the Labor Forcein in Maxwell.
What is the Percentage of People in the Labor Force in Maxwell?
40.3% of People are in the Labor Force in Maxwell.