Magdalena, NM Map & Demographics
Magdalena Map
Magdalena Overview
$37,302
PER CAPITA INCOME
$28,848
AVG HOUSEHOLD INCOME
57.6%
WAGE / INCOME GAP [ % ]
42.4¢/ $1
WAGE / INCOME GAP [ $ ]
0.60
INEQUALITY / GINI INDEX
791
TOTAL POPULATION
401
MALE POPULATION
390
FEMALE POPULATION
102.82
MALES / 100 FEMALES
97.26
FEMALES / 100 MALES
62.2
MEDIAN AGE
2.8
AVG FAMILY SIZE
2.1
AVG HOUSEHOLD SIZE
278
LABOR FORCE [ PEOPLE ]
36.8%
PERCENT IN LABOR FORCE
Magdalena Zip Codes
Magdalena Area Codes
Income in Magdalena
Income Overview in Magdalena
| Characteristic | Number | Measure |
| Per Capita Income | 791 | $37,302 |
| Median Family Income | 236 | $0 |
| Mean Family Income | 236 | $80,767 |
| Median Household Income | 369 | $28,848 |
| Mean Household Income | 369 | $67,966 |
| Income Deficit | 236 | $0 |
| Wage / Income Gap (%) | 791 | 57.61% |
| Wage / Income Gap ($) | 791 | 42.39¢ per $1 |
| Gini / Inequality Index | 791 | 0.60 |
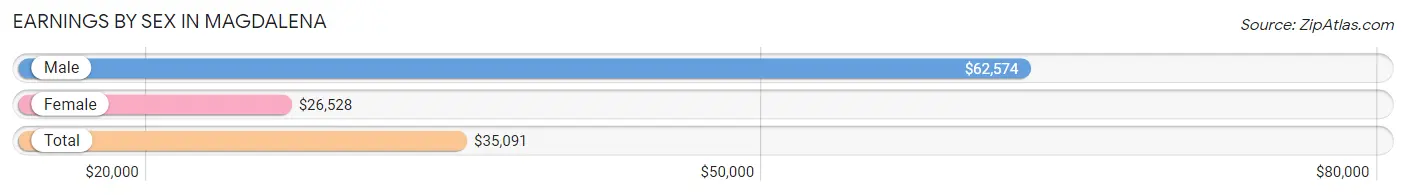
Earnings by Sex in Magdalena
Average Earnings in Magdalena are $35,091, $62,574 for men and $26,528 for women, a difference of 57.6%.
| Sex | Number | Average Earnings |
| Male | 167 (47.2%) | $62,574 |
| Female | 187 (52.8%) | $26,528 |
| Total | 354 (100.0%) | $35,091 |
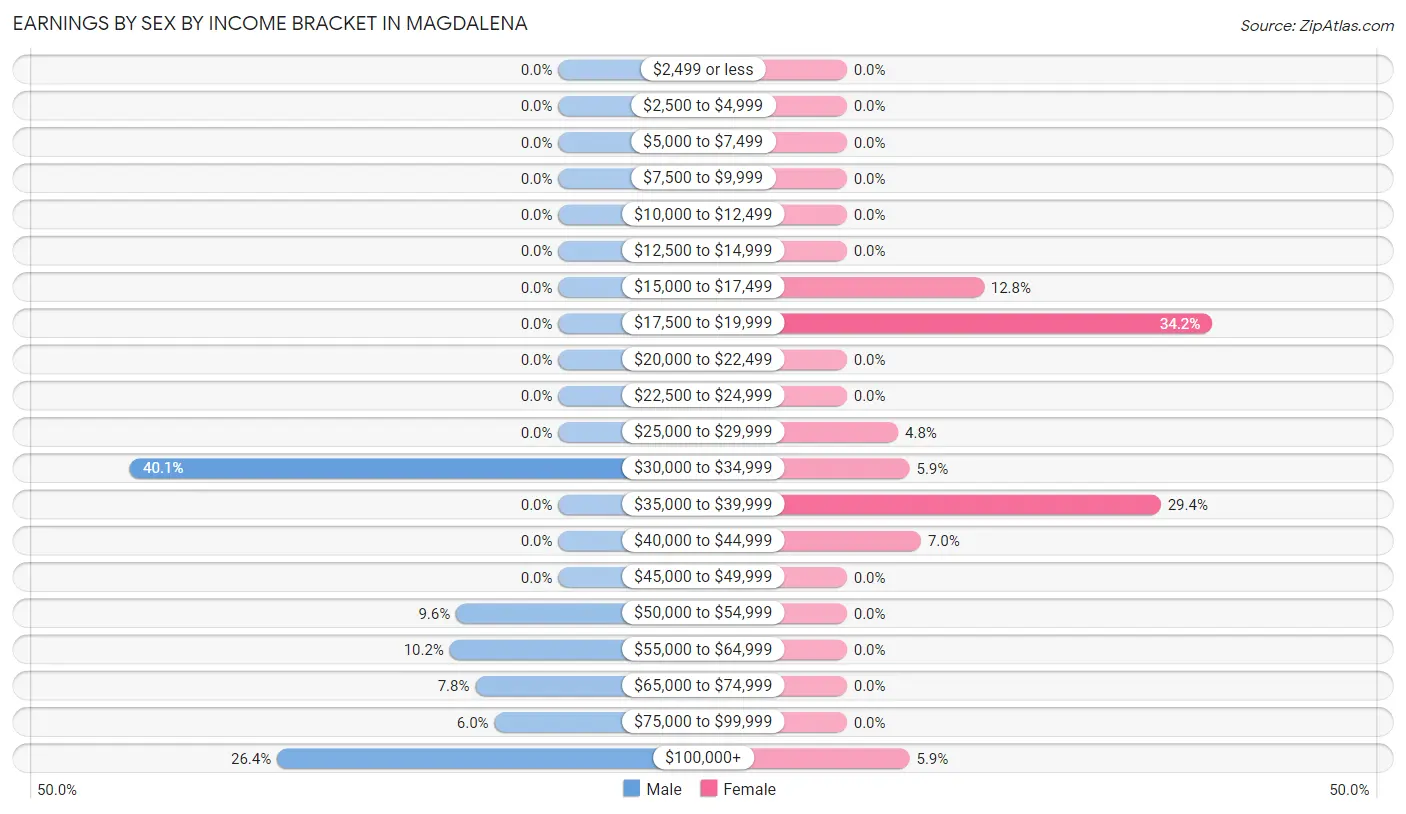
Earnings by Sex by Income Bracket in Magdalena
The most common earnings brackets in Magdalena are $30,000 to $34,999 for men (67 | 40.1%) and $17,500 to $19,999 for women (64 | 34.2%).
| Income | Male | Female |
| $2,499 or less | 0 (0.0%) | 0 (0.0%) |
| $2,500 to $4,999 | 0 (0.0%) | 0 (0.0%) |
| $5,000 to $7,499 | 0 (0.0%) | 0 (0.0%) |
| $7,500 to $9,999 | 0 (0.0%) | 0 (0.0%) |
| $10,000 to $12,499 | 0 (0.0%) | 0 (0.0%) |
| $12,500 to $14,999 | 0 (0.0%) | 0 (0.0%) |
| $15,000 to $17,499 | 0 (0.0%) | 24 (12.8%) |
| $17,500 to $19,999 | 0 (0.0%) | 64 (34.2%) |
| $20,000 to $22,499 | 0 (0.0%) | 0 (0.0%) |
| $22,500 to $24,999 | 0 (0.0%) | 0 (0.0%) |
| $25,000 to $29,999 | 0 (0.0%) | 9 (4.8%) |
| $30,000 to $34,999 | 67 (40.1%) | 11 (5.9%) |
| $35,000 to $39,999 | 0 (0.0%) | 55 (29.4%) |
| $40,000 to $44,999 | 0 (0.0%) | 13 (7.0%) |
| $45,000 to $49,999 | 0 (0.0%) | 0 (0.0%) |
| $50,000 to $54,999 | 16 (9.6%) | 0 (0.0%) |
| $55,000 to $64,999 | 17 (10.2%) | 0 (0.0%) |
| $65,000 to $74,999 | 13 (7.8%) | 0 (0.0%) |
| $75,000 to $99,999 | 10 (6.0%) | 0 (0.0%) |
| $100,000+ | 44 (26.4%) | 11 (5.9%) |
| Total | 167 (100.0%) | 187 (100.0%) |
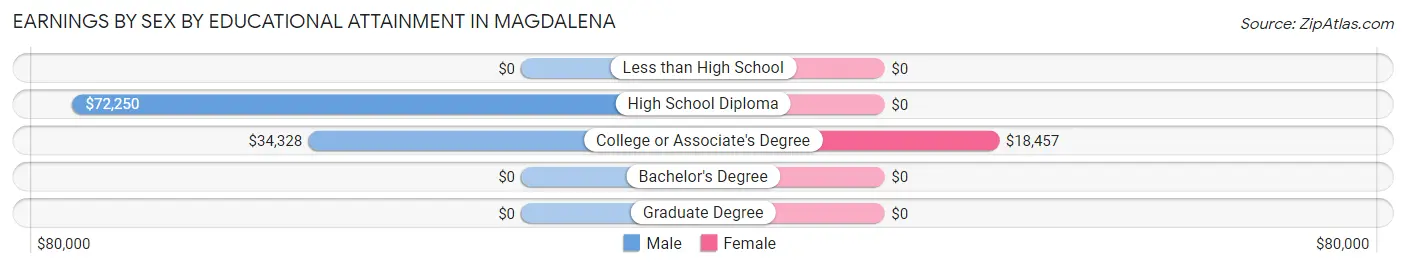
Earnings by Sex by Educational Attainment in Magdalena
Average earnings in Magdalena are $62,574 for men and $26,528 for women, a difference of 57.6%. Men with an educational attainment of high school diploma enjoy the highest average annual earnings of $72,250, while those with college or associate's degree education earn the least with $34,328. Women with an educational attainment of college or associate's degree earn the most with the average annual earnings of $18,457, while those with college or associate's degree education have the smallest earnings of $18,457.
| Educational Attainment | Male Income | Female Income |
| Less than High School | - | - |
| High School Diploma | $72,250 | $0 |
| College or Associate's Degree | $34,328 | $18,457 |
| Bachelor's Degree | - | - |
| Graduate Degree | - | - |
| Total | $62,574 | $26,528 |
Family Income in Magdalena
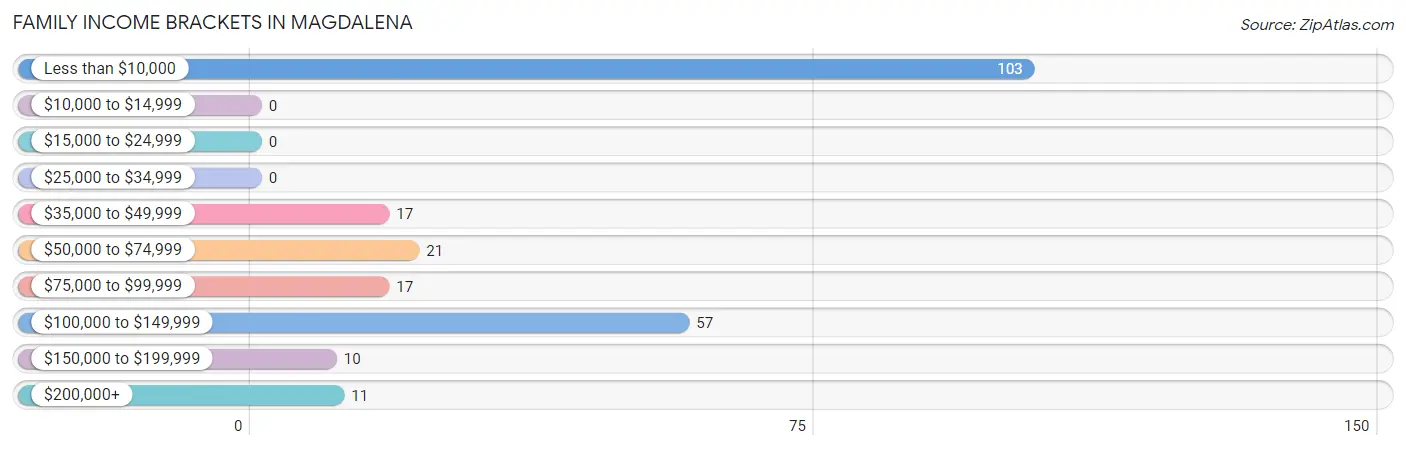
Family Income Brackets in Magdalena
According to the Magdalena family income data, there are 103 families falling into the less than $10,000 income range, which is the most common income bracket and makes up 43.6% of all families.
| Income Bracket | # Families | % Families |
| Less than $10,000 | 103 | 43.6% |
| $10,000 to $14,999 | 0 | 0.0% |
| $15,000 to $24,999 | 0 | 0.0% |
| $25,000 to $34,999 | 0 | 0.0% |
| $35,000 to $49,999 | 17 | 7.2% |
| $50,000 to $74,999 | 21 | 8.9% |
| $75,000 to $99,999 | 17 | 7.2% |
| $100,000 to $149,999 | 57 | 24.2% |
| $150,000 to $199,999 | 10 | 4.2% |
| $200,000+ | 11 | 4.7% |
Family Income by Famaliy Size in Magdalena
| Income Bracket | # Families | Median Income |
| 2-Person Families | 202 (85.6%) | $0 |
| 3-Person Families | 14 (5.9%) | $0 |
| 4-Person Families | 20 (8.5%) | $0 |
| 5-Person Families | 0 (0.0%) | $0 |
| 6-Person Families | 0 (0.0%) | $0 |
| 7+ Person Families | 0 (0.0%) | $0 |
| Total | 236 (100.0%) | $0 |
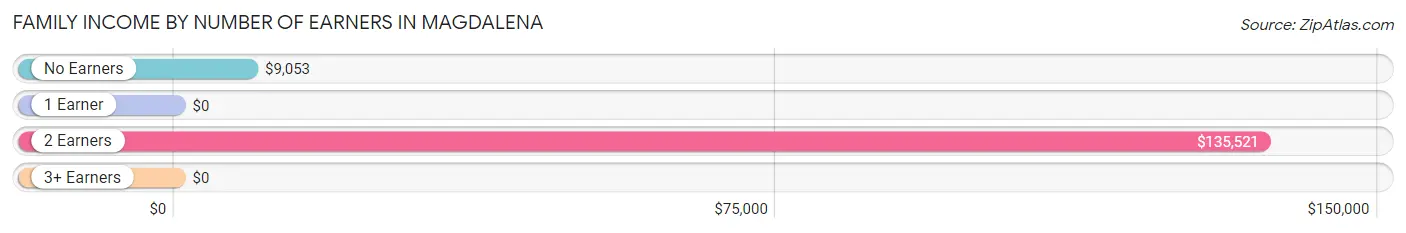
Family Income by Number of Earners in Magdalena
| Number of Earners | # Families | Median Income |
| No Earners | 128 (54.2%) | $9,053 |
| 1 Earner | 35 (14.8%) | $0 |
| 2 Earners | 66 (28.0%) | $135,521 |
| 3+ Earners | 7 (3.0%) | $0 |
| Total | 236 (100.0%) | $0 |
Household Income in Magdalena
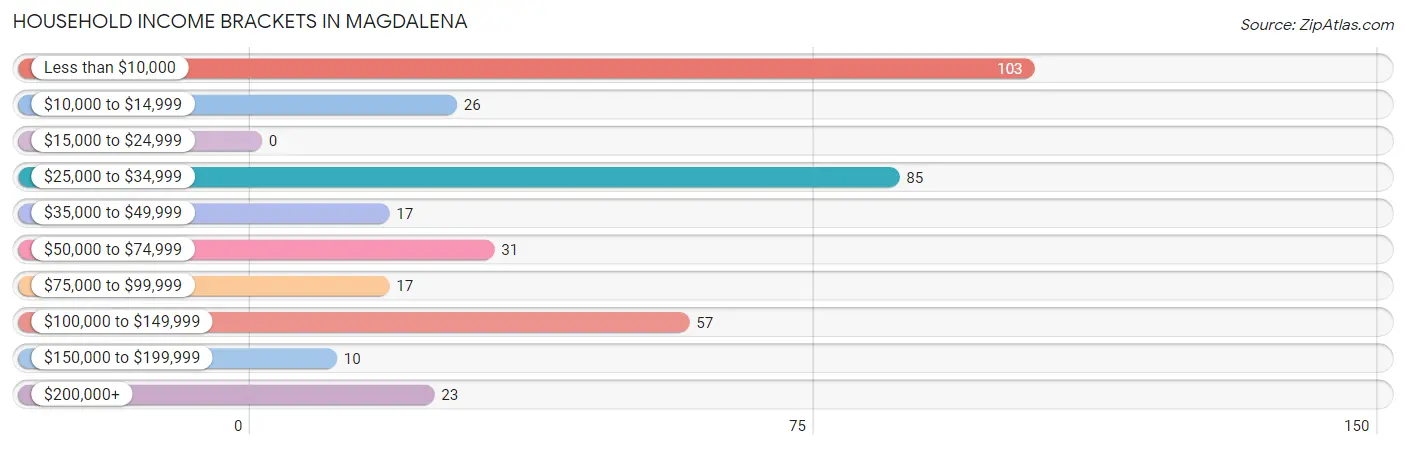
Household Income Brackets in Magdalena
With 103 households falling in the category, the less than $10,000 income range is the most frequent in Magdalena, accounting for 27.9% of all households.
| Income Bracket | # Households | % Households |
| Less than $10,000 | 103 | 27.9% |
| $10,000 to $14,999 | 26 | 7.0% |
| $15,000 to $24,999 | 0 | 0.0% |
| $25,000 to $34,999 | 85 | 23.0% |
| $35,000 to $49,999 | 17 | 4.6% |
| $50,000 to $74,999 | 31 | 8.4% |
| $75,000 to $99,999 | 17 | 4.6% |
| $100,000 to $149,999 | 57 | 15.4% |
| $150,000 to $199,999 | 10 | 2.7% |
| $200,000+ | 23 | 6.2% |
Household Income by Householder Age in Magdalena
The median household income in Magdalena is $28,848, with the highest median household income of $29,199 found in the 65+ years age bracket for the primary householder. A total of 157 households (42.5%) fall into this category.
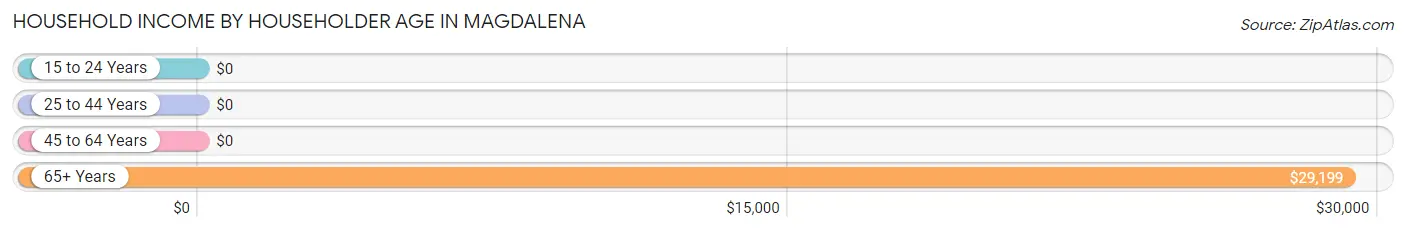
| Income Bracket | # Households | Median Income |
| 15 to 24 Years | 0 (0.0%) | $0 |
| 25 to 44 Years | 16 (4.3%) | $0 |
| 45 to 64 Years | 196 (53.1%) | $0 |
| 65+ Years | 157 (42.5%) | $29,199 |
| Total | 369 (100.0%) | $28,848 |
Poverty in Magdalena
Income Below Poverty by Sex and Age in Magdalena
With 21.7% poverty level for males and 29.5% for females among the residents of Magdalena, 65 to 74 year old males and 55 to 64 year old females are the most vulnerable to poverty, with 87 males (66.9%) and 115 females (74.2%) in their respective age groups living below the poverty level.
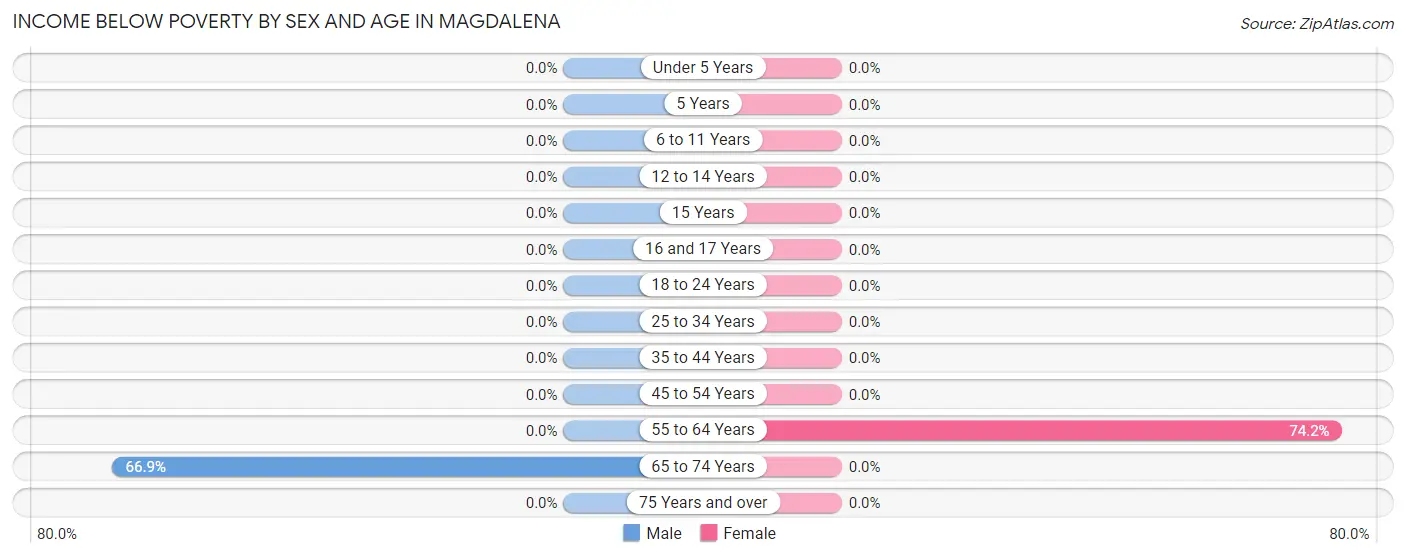
| Age Bracket | Male | Female |
| Under 5 Years | 0 (0.0%) | 0 (0.0%) |
| 5 Years | 0 (0.0%) | 0 (0.0%) |
| 6 to 11 Years | 0 (0.0%) | 0 (0.0%) |
| 12 to 14 Years | 0 (0.0%) | 0 (0.0%) |
| 15 Years | 0 (0.0%) | 0 (0.0%) |
| 16 and 17 Years | 0 (0.0%) | 0 (0.0%) |
| 18 to 24 Years | 0 (0.0%) | 0 (0.0%) |
| 25 to 34 Years | 0 (0.0%) | 0 (0.0%) |
| 35 to 44 Years | 0 (0.0%) | 0 (0.0%) |
| 45 to 54 Years | 0 (0.0%) | 0 (0.0%) |
| 55 to 64 Years | 0 (0.0%) | 115 (74.2%) |
| 65 to 74 Years | 87 (66.9%) | 0 (0.0%) |
| 75 Years and over | 0 (0.0%) | 0 (0.0%) |
| Total | 87 (21.7%) | 115 (29.5%) |
Income Above Poverty by Sex and Age in Magdalena
According to the poverty statistics in Magdalena, males aged 16 and 17 years and females aged under 5 years are the age groups that are most secure financially, with 100.0% of males and 100.0% of females in these age groups living above the poverty line.
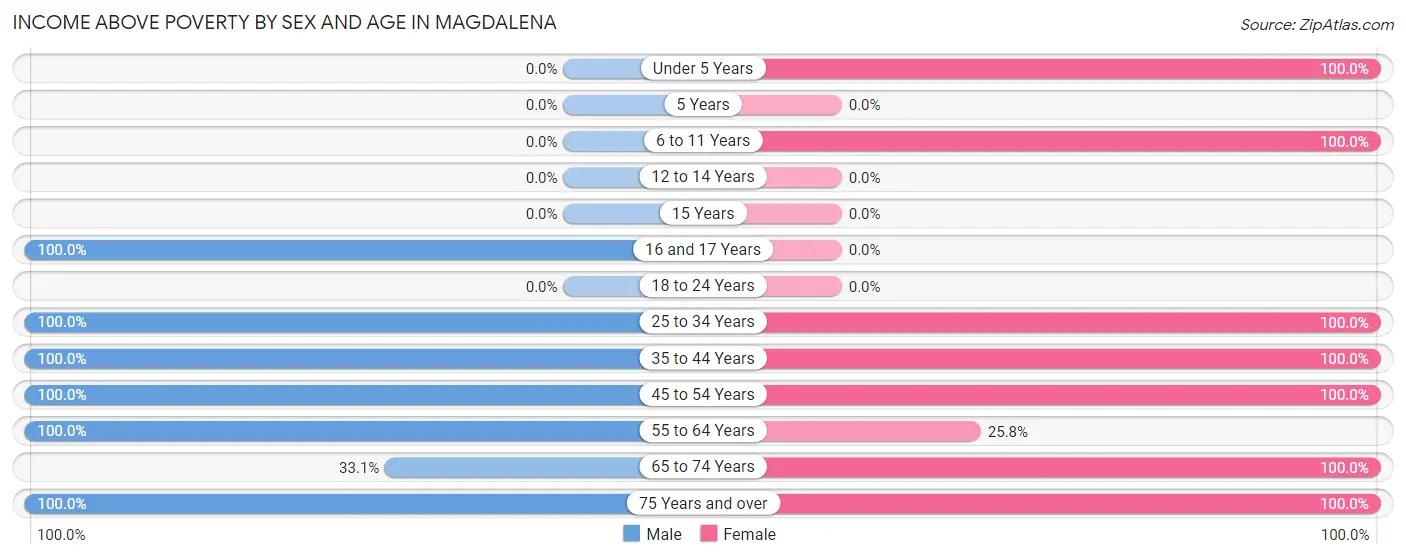
| Age Bracket | Male | Female |
| Under 5 Years | 0 (0.0%) | 16 (100.0%) |
| 5 Years | 0 (0.0%) | 0 (0.0%) |
| 6 to 11 Years | 0 (0.0%) | 20 (100.0%) |
| 12 to 14 Years | 0 (0.0%) | 0 (0.0%) |
| 15 Years | 0 (0.0%) | 0 (0.0%) |
| 16 and 17 Years | 41 (100.0%) | 0 (0.0%) |
| 18 to 24 Years | 0 (0.0%) | 0 (0.0%) |
| 25 to 34 Years | 16 (100.0%) | 65 (100.0%) |
| 35 to 44 Years | 70 (100.0%) | 3 (100.0%) |
| 45 to 54 Years | 15 (100.0%) | 24 (100.0%) |
| 55 to 64 Years | 66 (100.0%) | 40 (25.8%) |
| 65 to 74 Years | 43 (33.1%) | 75 (100.0%) |
| 75 Years and over | 63 (100.0%) | 32 (100.0%) |
| Total | 314 (78.3%) | 275 (70.5%) |
Income Below Poverty Among Married-Couple Families in Magdalena
The poverty statistics for married-couple families in Magdalena show that 49.5% or 103 of the total 208 families live below the poverty line. Families with no children have the highest poverty rate of 56.9%, comprising of 103 families. On the other hand, families with 1 or 2 children have the lowest poverty rate of 0.0%, which includes 0 families.
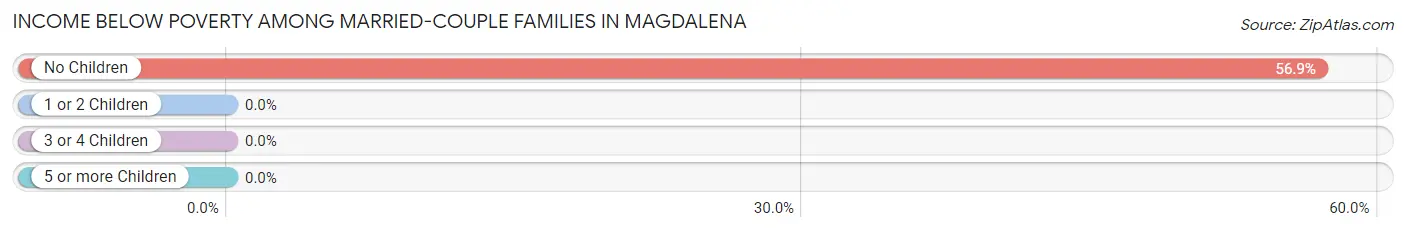
| Children | Above Poverty | Below Poverty |
| No Children | 78 (43.1%) | 103 (56.9%) |
| 1 or 2 Children | 27 (100.0%) | 0 (0.0%) |
| 3 or 4 Children | 0 (0.0%) | 0 (0.0%) |
| 5 or more Children | 0 (0.0%) | 0 (0.0%) |
| Total | 105 (50.5%) | 103 (49.5%) |
Income Below Poverty Among Single-Parent Households in Magdalena
| Children | Single Father | Single Mother |
| No Children | 0 (0.0%) | 0 (0.0%) |
| 1 or 2 Children | 0 (0.0%) | 0 (0.0%) |
| 3 or 4 Children | 0 (0.0%) | 0 (0.0%) |
| 5 or more Children | 0 (0.0%) | 0 (0.0%) |
| Total | 0 (0.0%) | 0 (0.0%) |
Income Below Poverty Among Married-Couple vs Single-Parent Households in Magdalena
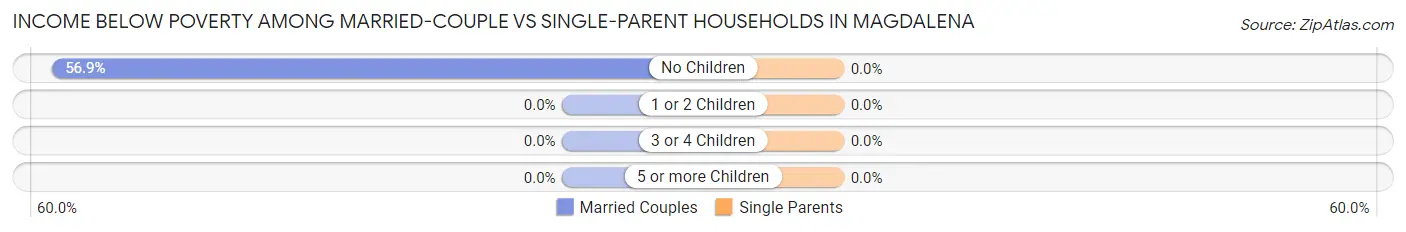
| Children | Married-Couple Families | Single-Parent Households |
| No Children | 103 (56.9%) | 0 (0.0%) |
| 1 or 2 Children | 0 (0.0%) | 0 (0.0%) |
| 3 or 4 Children | 0 (0.0%) | 0 (0.0%) |
| 5 or more Children | 0 (0.0%) | 0 (0.0%) |
| Total | 103 (49.5%) | 0 (0.0%) |
Race in Magdalena
The most populous races in Magdalena are White / Caucasian (582 | 73.6%), Hispanic or Latino (423 | 53.5%), and Two or more Races (209 | 26.4%).
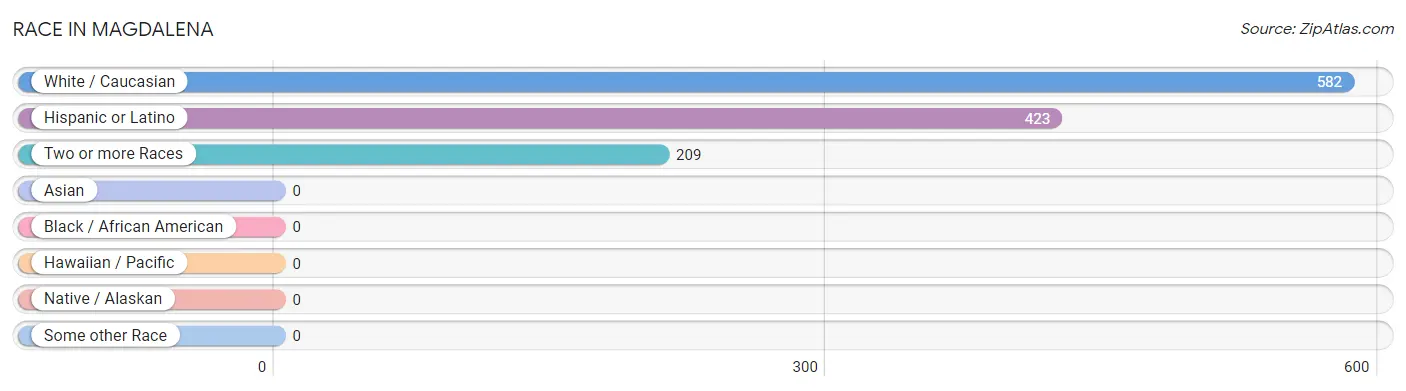
| Race | # Population | % Population |
| Asian | 0 | 0.0% |
| Black / African American | 0 | 0.0% |
| Hawaiian / Pacific | 0 | 0.0% |
| Hispanic or Latino | 423 | 53.5% |
| Native / Alaskan | 0 | 0.0% |
| White / Caucasian | 582 | 73.6% |
| Two or more Races | 209 | 26.4% |
| Some other Race | 0 | 0.0% |
| Total | 791 | 100.0% |
Ancestry in Magdalena
The most populous ancestries reported in Magdalena are Spanish (176 | 22.3%), English (150 | 19.0%), German (138 | 17.4%), American (116 | 14.7%), and British (67 | 8.5%), together accounting for 81.8% of all Magdalena residents.
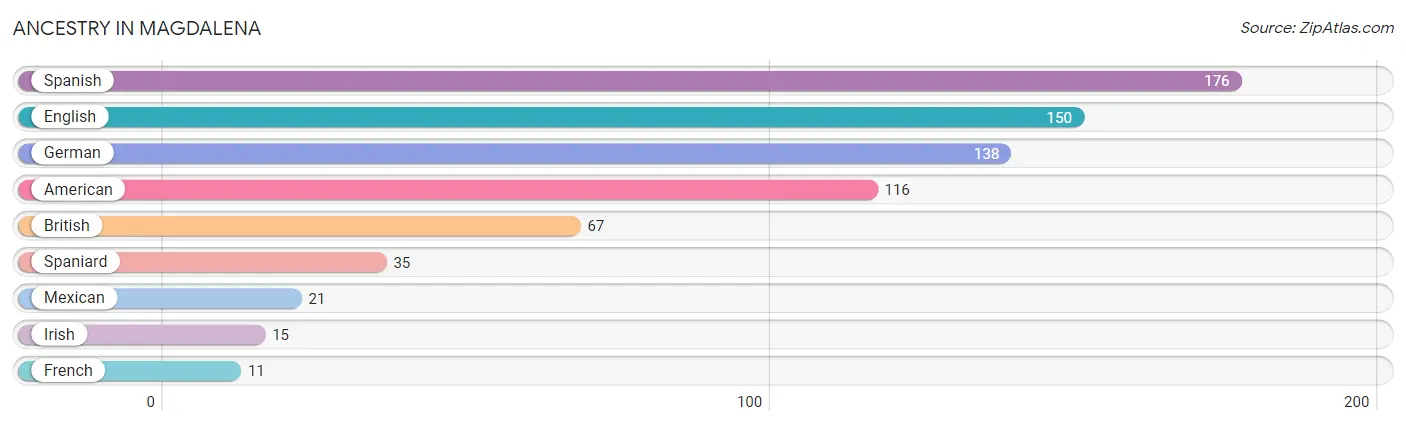
| Ancestry | # Population | % Population |
| American | 116 | 14.7% |
| British | 67 | 8.5% |
| English | 150 | 19.0% |
| French | 11 | 1.4% |
| German | 138 | 17.4% |
| Irish | 15 | 1.9% |
| Mexican | 21 | 2.6% |
| Spaniard | 35 | 4.4% |
| Spanish | 176 | 22.3% | View All 9 Rows |
Immigrants in Magdalena

| Immigration Origin | # Population | % Population | View All 0 Rows |
Sex and Age in Magdalena
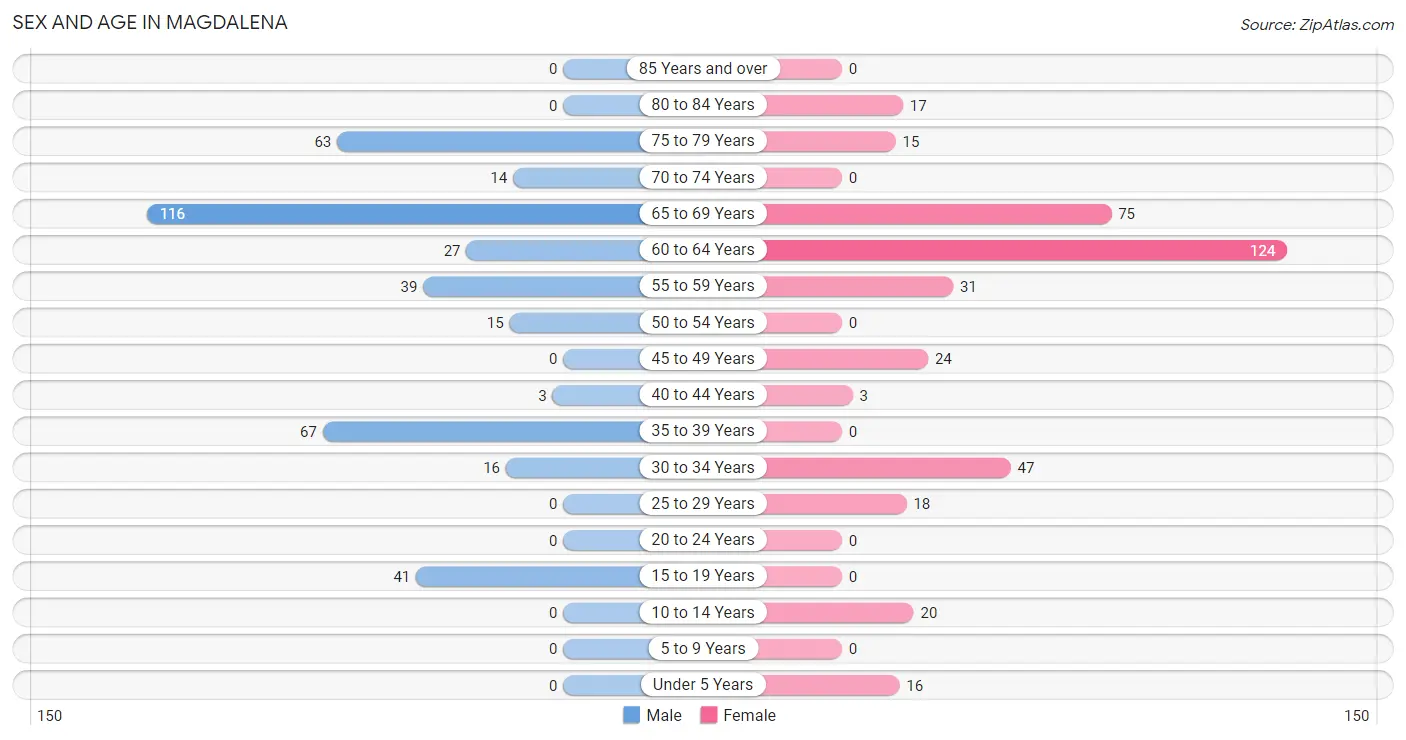
Sex and Age in Magdalena
The most populous age groups in Magdalena are 65 to 69 Years (116 | 28.9%) for men and 60 to 64 Years (124 | 31.8%) for women.
| Age Bracket | Male | Female |
| Under 5 Years | 0 (0.0%) | 16 (4.1%) |
| 5 to 9 Years | 0 (0.0%) | 0 (0.0%) |
| 10 to 14 Years | 0 (0.0%) | 20 (5.1%) |
| 15 to 19 Years | 41 (10.2%) | 0 (0.0%) |
| 20 to 24 Years | 0 (0.0%) | 0 (0.0%) |
| 25 to 29 Years | 0 (0.0%) | 18 (4.6%) |
| 30 to 34 Years | 16 (4.0%) | 47 (12.0%) |
| 35 to 39 Years | 67 (16.7%) | 0 (0.0%) |
| 40 to 44 Years | 3 (0.7%) | 3 (0.8%) |
| 45 to 49 Years | 0 (0.0%) | 24 (6.1%) |
| 50 to 54 Years | 15 (3.7%) | 0 (0.0%) |
| 55 to 59 Years | 39 (9.7%) | 31 (8.0%) |
| 60 to 64 Years | 27 (6.7%) | 124 (31.8%) |
| 65 to 69 Years | 116 (28.9%) | 75 (19.2%) |
| 70 to 74 Years | 14 (3.5%) | 0 (0.0%) |
| 75 to 79 Years | 63 (15.7%) | 15 (3.8%) |
| 80 to 84 Years | 0 (0.0%) | 17 (4.4%) |
| 85 Years and over | 0 (0.0%) | 0 (0.0%) |
| Total | 401 (100.0%) | 390 (100.0%) |
Families and Households in Magdalena
Median Family Size in Magdalena
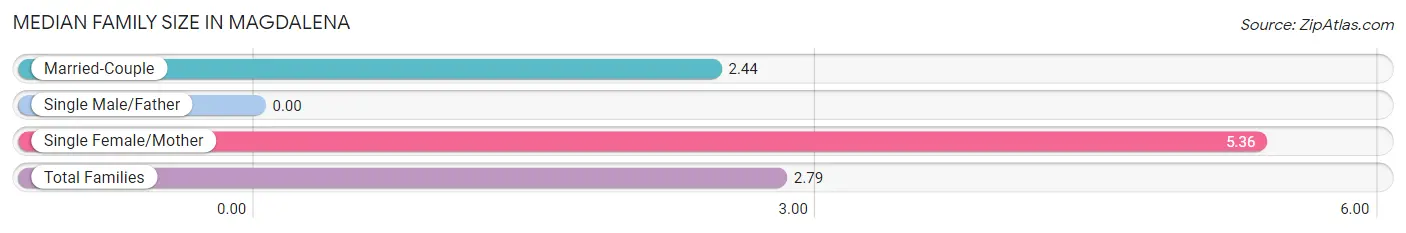
| Family Type | # Families | Family Size |
| Married-Couple | 208 (88.1%) | 2.44 |
| Single Male/Father | 0 (0.0%) | - |
| Single Female/Mother | 28 (11.9%) | 5.36 |
| Total Families | 236 (100.0%) | 2.79 |
Median Household Size in Magdalena
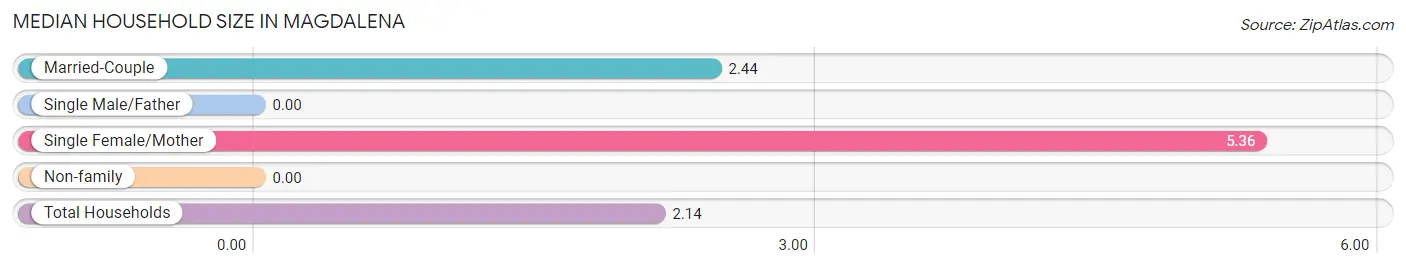
| Household Type | # Households | Household Size |
| Married-Couple | 208 (56.4%) | 2.44 |
| Single Male/Father | 0 (0.0%) | - |
| Single Female/Mother | 28 (7.6%) | 5.36 |
| Non-family | 133 (36.0%) | - |
| Total Households | 369 (100.0%) | 2.14 |
Household Size by Marriage Status in Magdalena
Out of a total of 369 households in Magdalena, 236 (64.0%) are family households, while 133 (36.0%) are nonfamily households. The most numerous type of family households are 2-person households, comprising 202, and the most common type of nonfamily households are 1-person households, comprising 133.
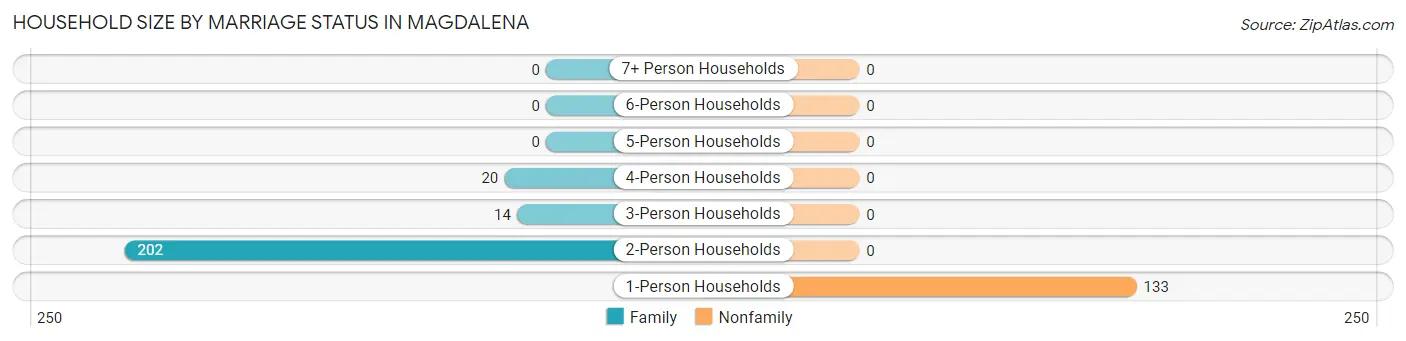
| Household Size | Family Households | Nonfamily Households |
| 1-Person Households | - | 133 (36.0%) |
| 2-Person Households | 202 (54.7%) | 0 (0.0%) |
| 3-Person Households | 14 (3.8%) | 0 (0.0%) |
| 4-Person Households | 20 (5.4%) | 0 (0.0%) |
| 5-Person Households | 0 (0.0%) | 0 (0.0%) |
| 6-Person Households | 0 (0.0%) | 0 (0.0%) |
| 7+ Person Households | 0 (0.0%) | 0 (0.0%) |
| Total | 236 (64.0%) | 133 (36.0%) |
Female Fertility in Magdalena
Fertility by Age in Magdalena
| Age Bracket | Women with Births | Births / 1,000 Women |
| 15 to 19 years | 0 (0.0%) | 0.0 |
| 20 to 34 years | 0 (0.0%) | 0.0 |
| 35 to 50 years | 0 (0.0%) | 0.0 |
| Total | 0 (0.0%) | 0.0 |
Fertility by Age by Marriage Status in Magdalena
| Age Bracket | Married | Unmarried |
| 15 to 19 years | 0 (0.0%) | 0 (0.0%) |
| 20 to 34 years | 0 (0.0%) | 0 (0.0%) |
| 35 to 50 years | 0 (0.0%) | 0 (0.0%) |
| Total | 0 (0.0%) | 0 (0.0%) |
Fertility by Education in Magdalena
| Educational Attainment | Women with Births | Births / 1,000 Women |
| Less than High School | 0 (0.0%) | 0.0 |
| High School Diploma | 0 (0.0%) | 0.0 |
| College or Associate's Degree | 0 (0.0%) | 0.0 |
| Bachelor's Degree | 0 (0.0%) | 0.0 |
| Graduate Degree | 0 (0.0%) | 0.0 |
| Total | 0 (0.0%) | 0.0 |
Fertility by Education by Marriage Status in Magdalena
| Educational Attainment | Married | Unmarried |
| Less than High School | 0 (0.0%) | 0 (0.0%) |
| High School Diploma | 0 (0.0%) | 0 (0.0%) |
| College or Associate's Degree | 0 (0.0%) | 0 (0.0%) |
| Bachelor's Degree | 0 (0.0%) | 0 (0.0%) |
| Graduate Degree | 0 (0.0%) | 0 (0.0%) |
| Total | 0 (0.0%) | 0 (0.0%) |
Employment Characteristics in Magdalena
Employment by Class of Employer in Magdalena
Among the 278 employed individuals in Magdalena, private company employees (165 | 59.4%), state government employees (44 | 15.8%), and self-employed (not incorporated) (36 | 13.0%) make up the most common classes of employment.
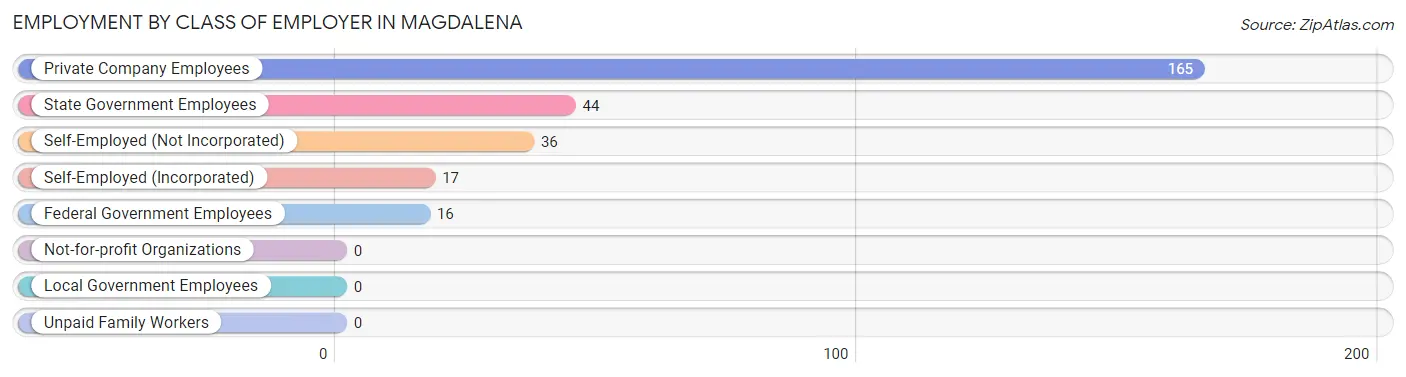
| Employer Class | # Employees | % Employees |
| Private Company Employees | 165 | 59.4% |
| Self-Employed (Incorporated) | 17 | 6.1% |
| Self-Employed (Not Incorporated) | 36 | 13.0% |
| Not-for-profit Organizations | 0 | 0.0% |
| Local Government Employees | 0 | 0.0% |
| State Government Employees | 44 | 15.8% |
| Federal Government Employees | 16 | 5.8% |
| Unpaid Family Workers | 0 | 0.0% |
| Total | 278 | 100.0% |
Employment Status by Age in Magdalena
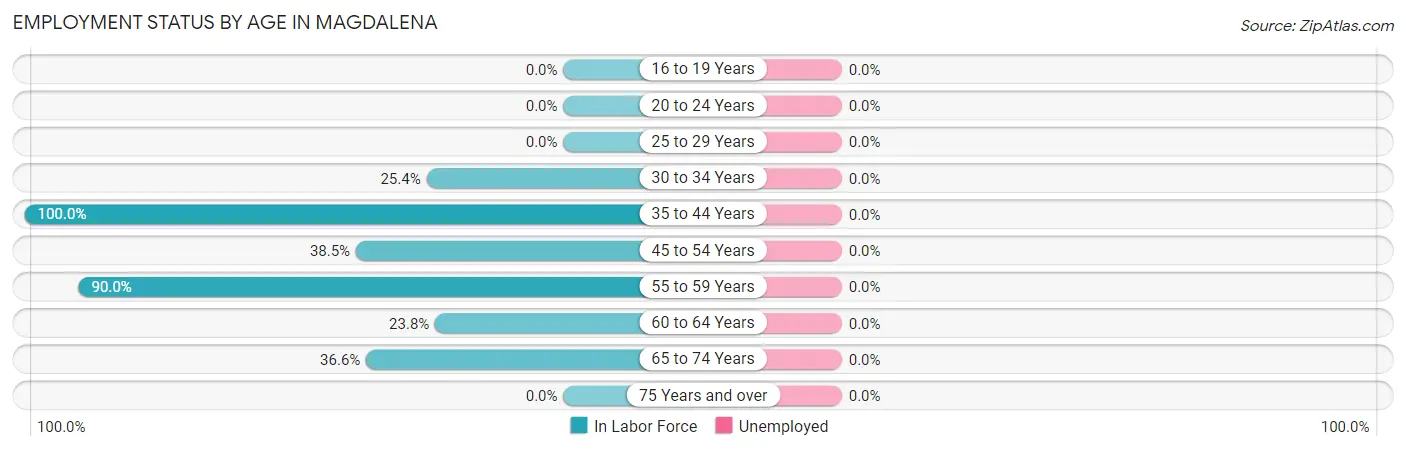
| Age Bracket | In Labor Force | Unemployed |
| 16 to 19 Years | 0 (0.0%) | 0 (0.0%) |
| 20 to 24 Years | 0 (0.0%) | 0 (0.0%) |
| 25 to 29 Years | 0 (0.0%) | 0 (0.0%) |
| 30 to 34 Years | 16 (25.4%) | 0 (0.0%) |
| 35 to 44 Years | 73 (100.0%) | 0 (0.0%) |
| 45 to 54 Years | 15 (38.5%) | 0 (0.0%) |
| 55 to 59 Years | 63 (90.0%) | 0 (0.0%) |
| 60 to 64 Years | 36 (23.8%) | 0 (0.0%) |
| 65 to 74 Years | 75 (36.6%) | 0 (0.0%) |
| 75 Years and over | 0 (0.0%) | 0 (0.0%) |
| Total | 278 (36.8%) | 0 (0.0%) |
Employment Status by Educational Attainment in Magdalena
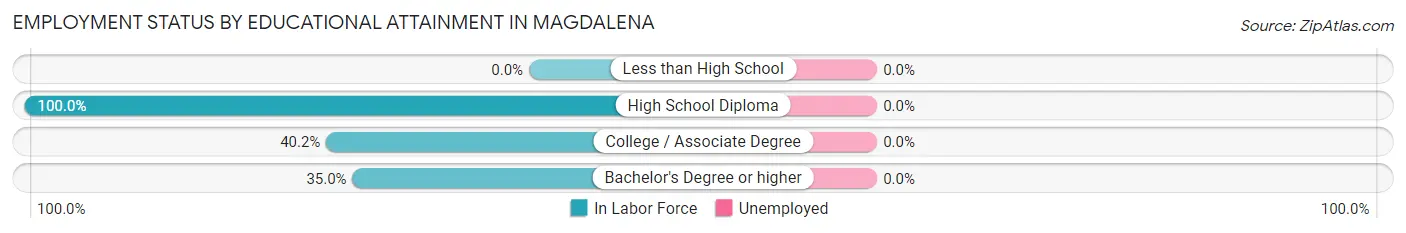
| Educational Attainment | In Labor Force | Unemployed |
| Less than High School | 0 (0.0%) | 0 (0.0%) |
| High School Diploma | 68 (100.0%) | 0 (0.0%) |
| College / Associate Degree | 107 (40.2%) | 0 (0.0%) |
| Bachelor's Degree or higher | 28 (35.0%) | 0 (0.0%) |
| Total | 203 (49.0%) | 0 (0.0%) |
Employment Occupations by Sex in Magdalena
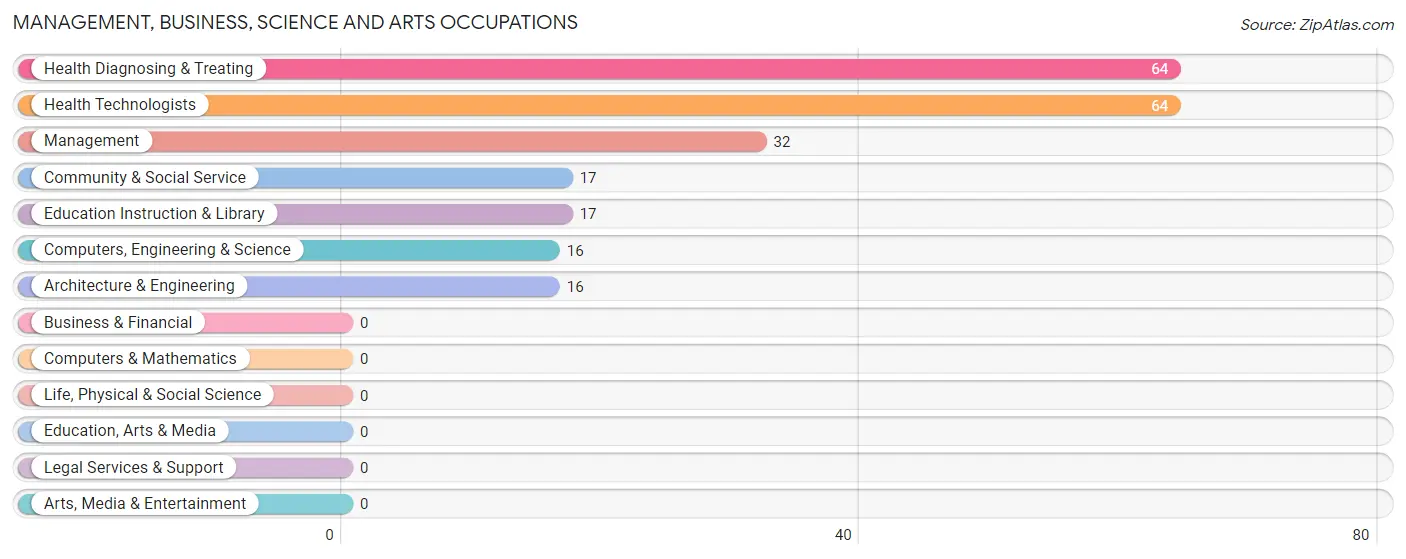
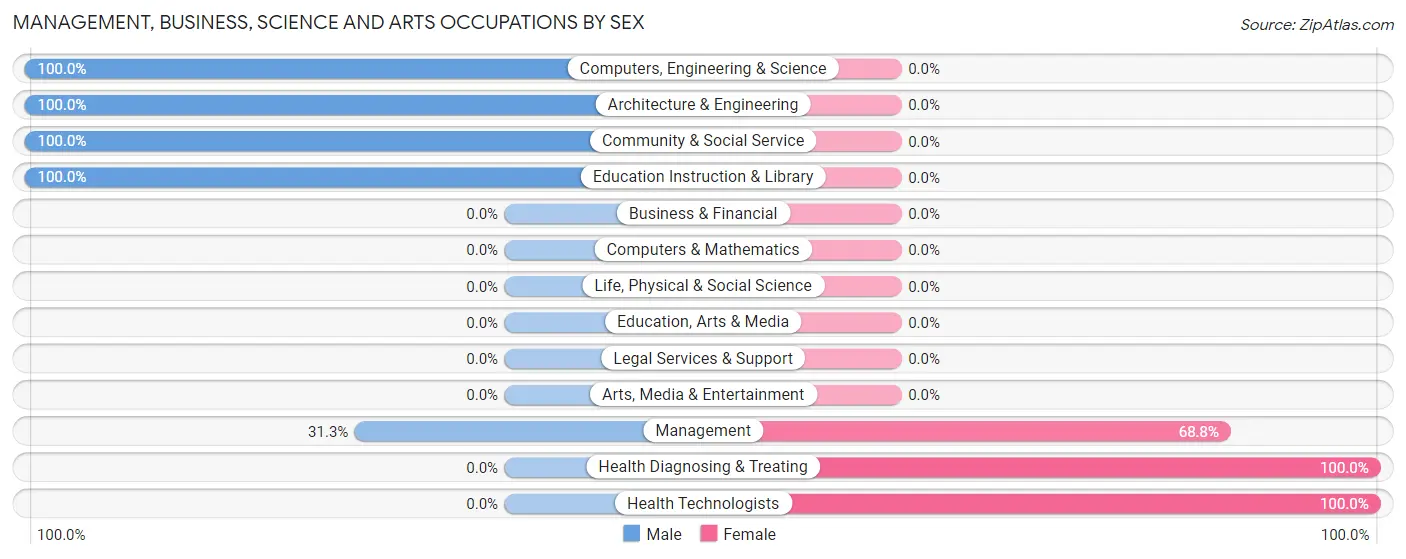
Management, Business, Science and Arts Occupations
The most common Management, Business, Science and Arts occupations in Magdalena are Health Diagnosing & Treating (64 | 23.0%), Health Technologists (64 | 23.0%), Management (32 | 11.5%), Community & Social Service (17 | 6.1%), and Education Instruction & Library (17 | 6.1%).
Management, Business, Science and Arts Occupations by Sex
Within the Management, Business, Science and Arts occupations in Magdalena, the most male-oriented occupations are Computers, Engineering & Science (100.0%), Architecture & Engineering (100.0%), and Community & Social Service (100.0%), while the most female-oriented occupations are Health Diagnosing & Treating (100.0%), Health Technologists (100.0%), and Management (68.8%).
| Occupation | Male | Female |
| Management | 10 (31.2%) | 22 (68.8%) |
| Business & Financial | 0 (0.0%) | 0 (0.0%) |
| Computers, Engineering & Science | 16 (100.0%) | 0 (0.0%) |
| Computers & Mathematics | 0 (0.0%) | 0 (0.0%) |
| Architecture & Engineering | 16 (100.0%) | 0 (0.0%) |
| Life, Physical & Social Science | 0 (0.0%) | 0 (0.0%) |
| Community & Social Service | 17 (100.0%) | 0 (0.0%) |
| Education, Arts & Media | 0 (0.0%) | 0 (0.0%) |
| Legal Services & Support | 0 (0.0%) | 0 (0.0%) |
| Education Instruction & Library | 17 (100.0%) | 0 (0.0%) |
| Arts, Media & Entertainment | 0 (0.0%) | 0 (0.0%) |
| Health Diagnosing & Treating | 0 (0.0%) | 64 (100.0%) |
| Health Technologists | 0 (0.0%) | 64 (100.0%) |
| Total (Category) | 43 (33.3%) | 86 (66.7%) |
| Total (Overall) | 167 (60.1%) | 111 (39.9%) |
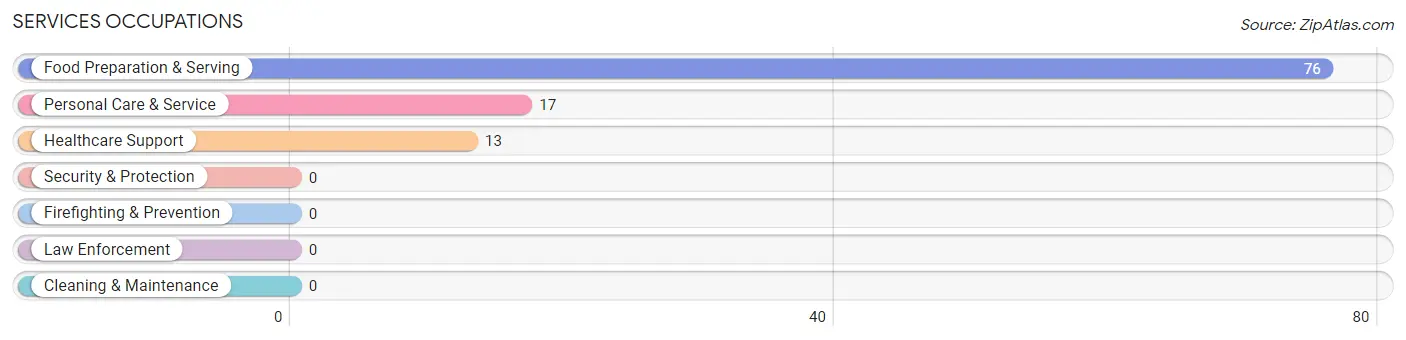
Services Occupations
The most common Services occupations in Magdalena are Food Preparation & Serving (76 | 27.3%), Personal Care & Service (17 | 6.1%), and Healthcare Support (13 | 4.7%).
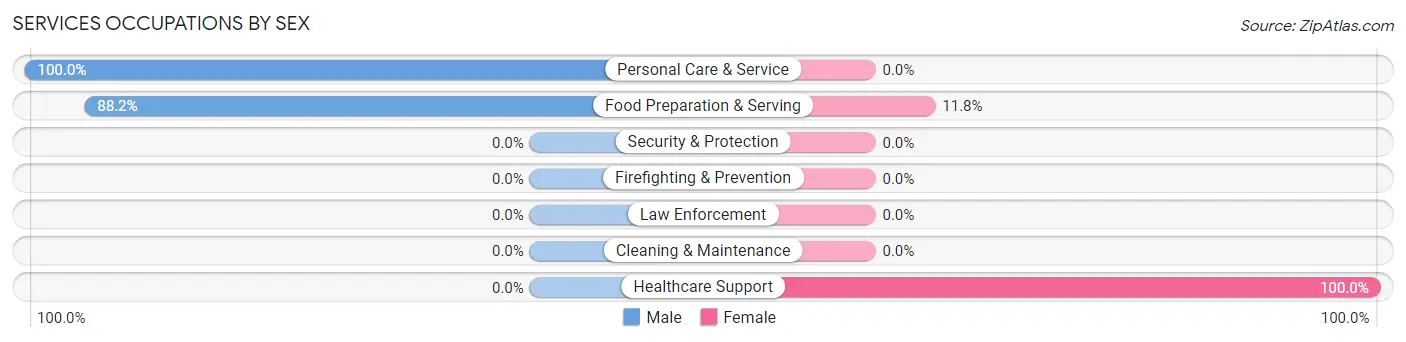
Services Occupations by Sex
Within the Services occupations in Magdalena, the most male-oriented occupations are Personal Care & Service (100.0%), and Food Preparation & Serving (88.2%), while the most female-oriented occupations are Healthcare Support (100.0%), and Food Preparation & Serving (11.8%).
| Occupation | Male | Female |
| Healthcare Support | 0 (0.0%) | 13 (100.0%) |
| Security & Protection | 0 (0.0%) | 0 (0.0%) |
| Firefighting & Prevention | 0 (0.0%) | 0 (0.0%) |
| Law Enforcement | 0 (0.0%) | 0 (0.0%) |
| Food Preparation & Serving | 67 (88.2%) | 9 (11.8%) |
| Cleaning & Maintenance | 0 (0.0%) | 0 (0.0%) |
| Personal Care & Service | 17 (100.0%) | 0 (0.0%) |
| Total (Category) | 84 (79.2%) | 22 (20.7%) |
| Total (Overall) | 167 (60.1%) | 111 (39.9%) |
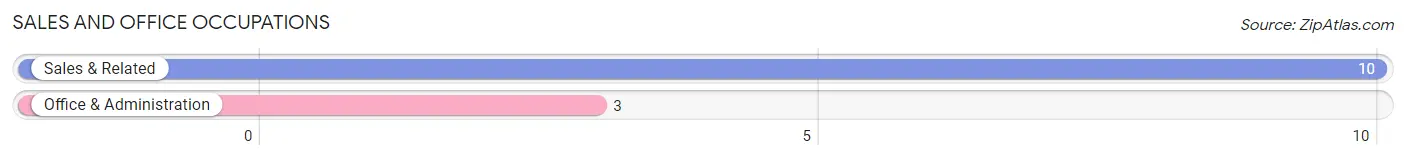
Sales and Office Occupations
The most common Sales and Office occupations in Magdalena are Sales & Related (10 | 3.6%), and Office & Administration (3 | 1.1%).
Sales and Office Occupations by Sex
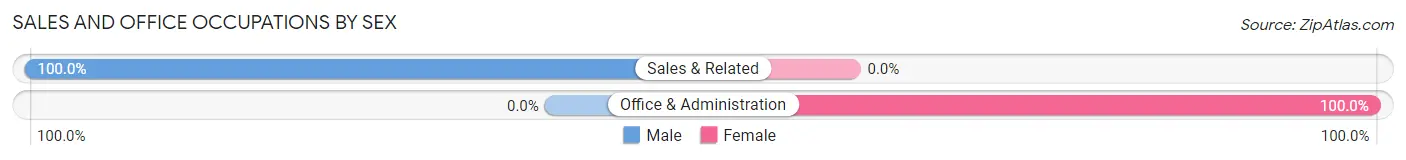
| Occupation | Male | Female |
| Sales & Related | 10 (100.0%) | 0 (0.0%) |
| Office & Administration | 0 (0.0%) | 3 (100.0%) |
| Total (Category) | 10 (76.9%) | 3 (23.1%) |
| Total (Overall) | 167 (60.1%) | 111 (39.9%) |
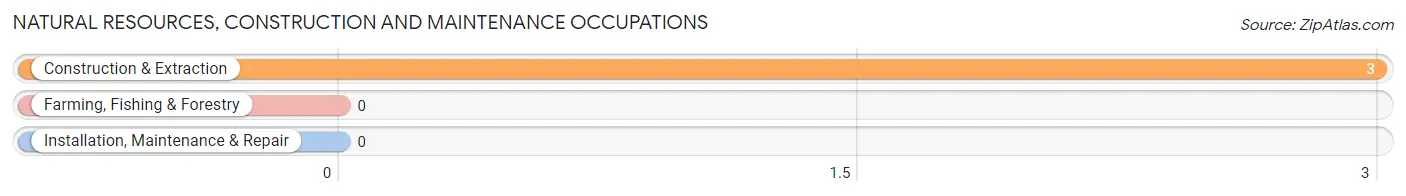
Natural Resources, Construction and Maintenance Occupations
The most common Natural Resources, Construction and Maintenance occupations in Magdalena are , and Construction & Extraction (3 | 1.1%).
Natural Resources, Construction and Maintenance Occupations by Sex
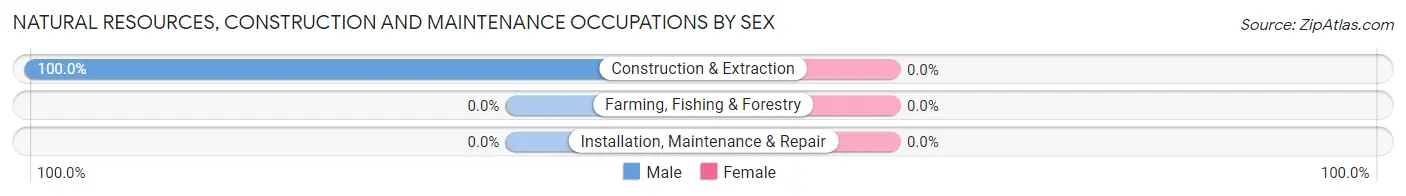
| Occupation | Male | Female |
| Farming, Fishing & Forestry | 0 (0.0%) | 0 (0.0%) |
| Construction & Extraction | 3 (100.0%) | 0 (0.0%) |
| Installation, Maintenance & Repair | 0 (0.0%) | 0 (0.0%) |
| Total (Category) | 3 (100.0%) | 0 (0.0%) |
| Total (Overall) | 167 (60.1%) | 111 (39.9%) |
Production, Transportation and Moving Occupations
The most common Production, Transportation and Moving occupations in Magdalena are , and Transportation (27 | 9.7%).
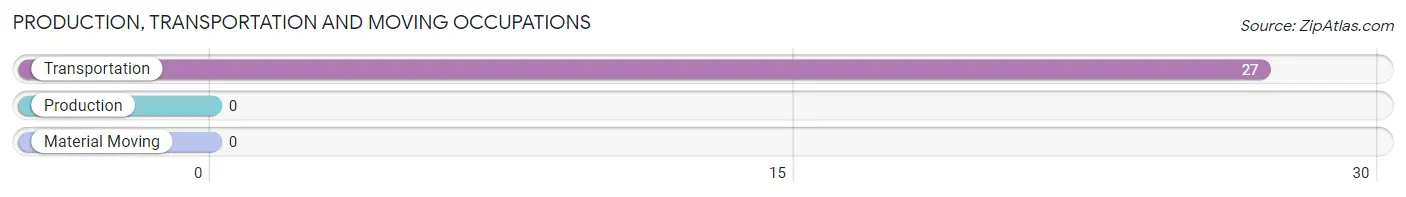
Production, Transportation and Moving Occupations by Sex
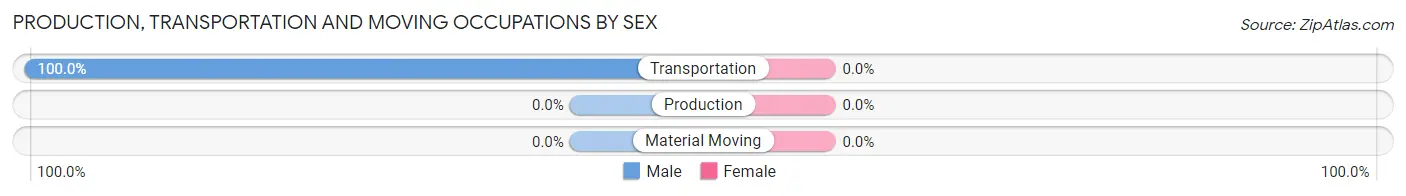
| Occupation | Male | Female |
| Production | 0 (0.0%) | 0 (0.0%) |
| Transportation | 27 (100.0%) | 0 (0.0%) |
| Material Moving | 0 (0.0%) | 0 (0.0%) |
| Total (Category) | 27 (100.0%) | 0 (0.0%) |
| Total (Overall) | 167 (60.1%) | 111 (39.9%) |
Employment Industries by Sex in Magdalena
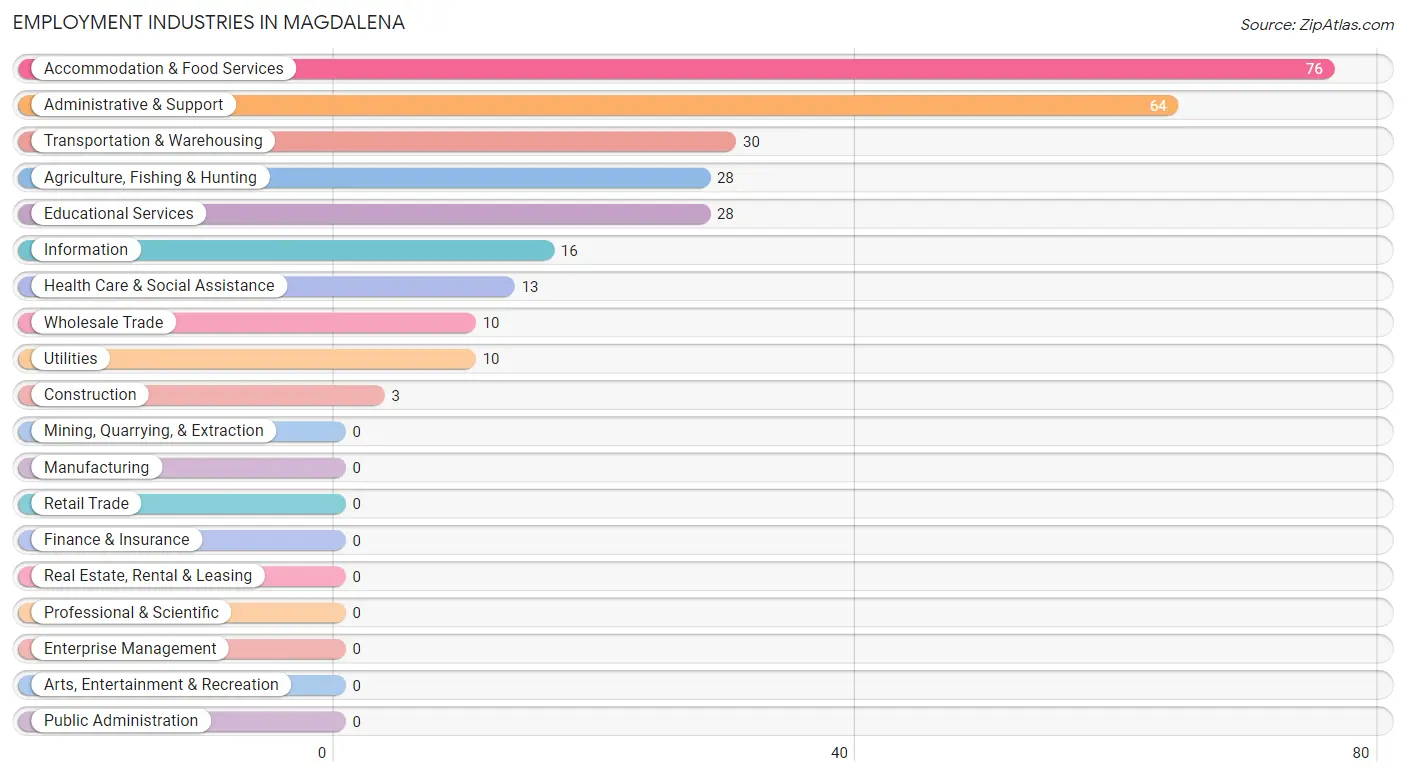
Employment Industries in Magdalena
The major employment industries in Magdalena include Accommodation & Food Services (76 | 27.3%), Administrative & Support (64 | 23.0%), Transportation & Warehousing (30 | 10.8%), Agriculture, Fishing & Hunting (28 | 10.1%), and Educational Services (28 | 10.1%).
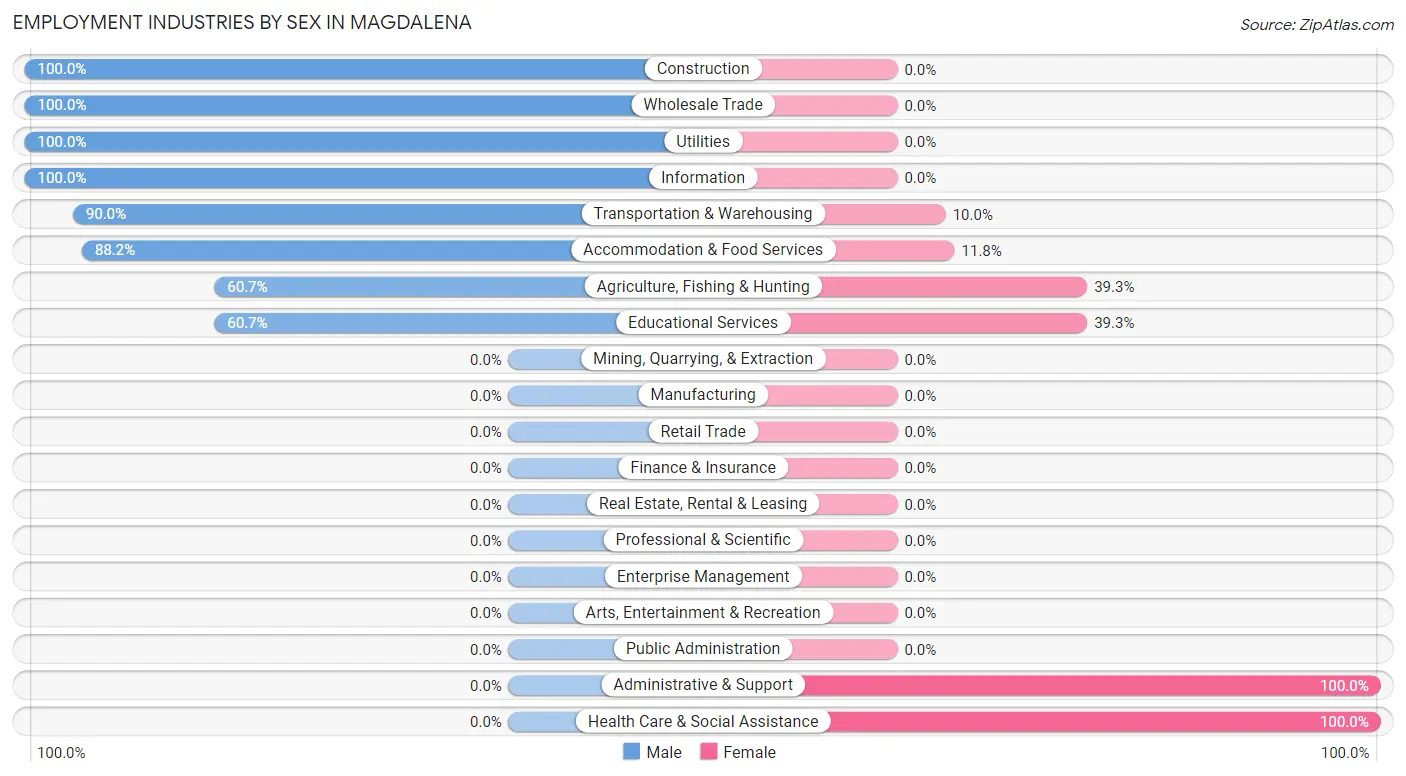
Employment Industries by Sex in Magdalena
The Magdalena industries that see more men than women are Construction (100.0%), Wholesale Trade (100.0%), and Utilities (100.0%), whereas the industries that tend to have a higher number of women are Administrative & Support (100.0%), Health Care & Social Assistance (100.0%), and Agriculture, Fishing & Hunting (39.3%).
| Industry | Male | Female |
| Agriculture, Fishing & Hunting | 17 (60.7%) | 11 (39.3%) |
| Mining, Quarrying, & Extraction | 0 (0.0%) | 0 (0.0%) |
| Construction | 3 (100.0%) | 0 (0.0%) |
| Manufacturing | 0 (0.0%) | 0 (0.0%) |
| Wholesale Trade | 10 (100.0%) | 0 (0.0%) |
| Retail Trade | 0 (0.0%) | 0 (0.0%) |
| Transportation & Warehousing | 27 (90.0%) | 3 (10.0%) |
| Utilities | 10 (100.0%) | 0 (0.0%) |
| Information | 16 (100.0%) | 0 (0.0%) |
| Finance & Insurance | 0 (0.0%) | 0 (0.0%) |
| Real Estate, Rental & Leasing | 0 (0.0%) | 0 (0.0%) |
| Professional & Scientific | 0 (0.0%) | 0 (0.0%) |
| Enterprise Management | 0 (0.0%) | 0 (0.0%) |
| Administrative & Support | 0 (0.0%) | 64 (100.0%) |
| Educational Services | 17 (60.7%) | 11 (39.3%) |
| Health Care & Social Assistance | 0 (0.0%) | 13 (100.0%) |
| Arts, Entertainment & Recreation | 0 (0.0%) | 0 (0.0%) |
| Accommodation & Food Services | 67 (88.2%) | 9 (11.8%) |
| Public Administration | 0 (0.0%) | 0 (0.0%) |
| Total | 167 (60.1%) | 111 (39.9%) |
Education in Magdalena
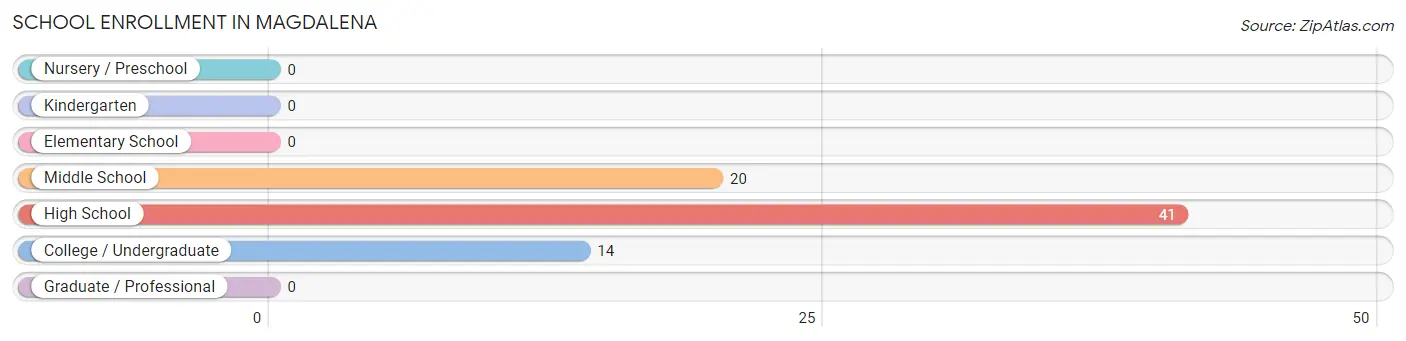
School Enrollment in Magdalena
The most common levels of schooling among the 75 students in Magdalena are high school (41 | 54.7%), middle school (20 | 26.7%), and college / undergraduate (14 | 18.7%).
| School Level | # Students | % Students |
| Nursery / Preschool | 0 | 0.0% |
| Kindergarten | 0 | 0.0% |
| Elementary School | 0 | 0.0% |
| Middle School | 20 | 26.7% |
| High School | 41 | 54.7% |
| College / Undergraduate | 14 | 18.7% |
| Graduate / Professional | 0 | 0.0% |
| Total | 75 | 100.0% |
School Enrollment by Age by Funding Source in Magdalena
Out of a total of 75 students who are enrolled in schools in Magdalena, 8 (10.7%) attend a private institution, while the remaining 67 (89.3%) are enrolled in public schools. The age group of 35 years and over has the highest likelihood of being enrolled in private schools, with 3 (21.4% in the age bracket) enrolled. Conversely, the age group of 10 to 14 year olds has the lowest likelihood of being enrolled in a private school, with 20 (100.0% in the age bracket) attending a public institution.
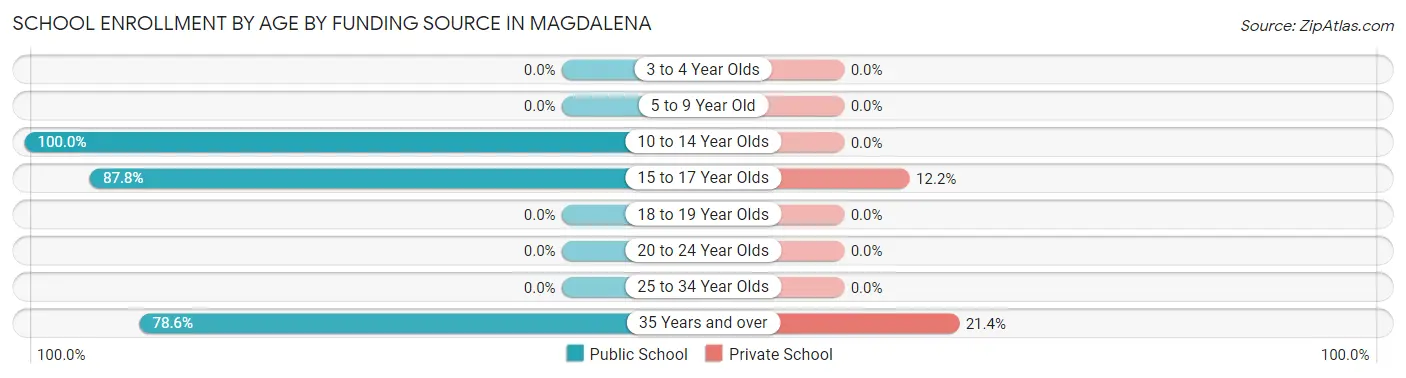
| Age Bracket | Public School | Private School |
| 3 to 4 Year Olds | 0 (0.0%) | 0 (0.0%) |
| 5 to 9 Year Old | 0 (0.0%) | 0 (0.0%) |
| 10 to 14 Year Olds | 20 (100.0%) | 0 (0.0%) |
| 15 to 17 Year Olds | 36 (87.8%) | 5 (12.2%) |
| 18 to 19 Year Olds | 0 (0.0%) | 0 (0.0%) |
| 20 to 24 Year Olds | 0 (0.0%) | 0 (0.0%) |
| 25 to 34 Year Olds | 0 (0.0%) | 0 (0.0%) |
| 35 Years and over | 11 (78.6%) | 3 (21.4%) |
| Total | 67 (89.3%) | 8 (10.7%) |
Educational Attainment by Field of Study in Magdalena
Visual & performing arts (34 | 30.1%), education (33 | 29.2%), physical & health sciences (28 | 24.8%), and arts & humanities (18 | 15.9%) are the most common fields of study among 113 individuals in Magdalena who have obtained a bachelor's degree or higher.
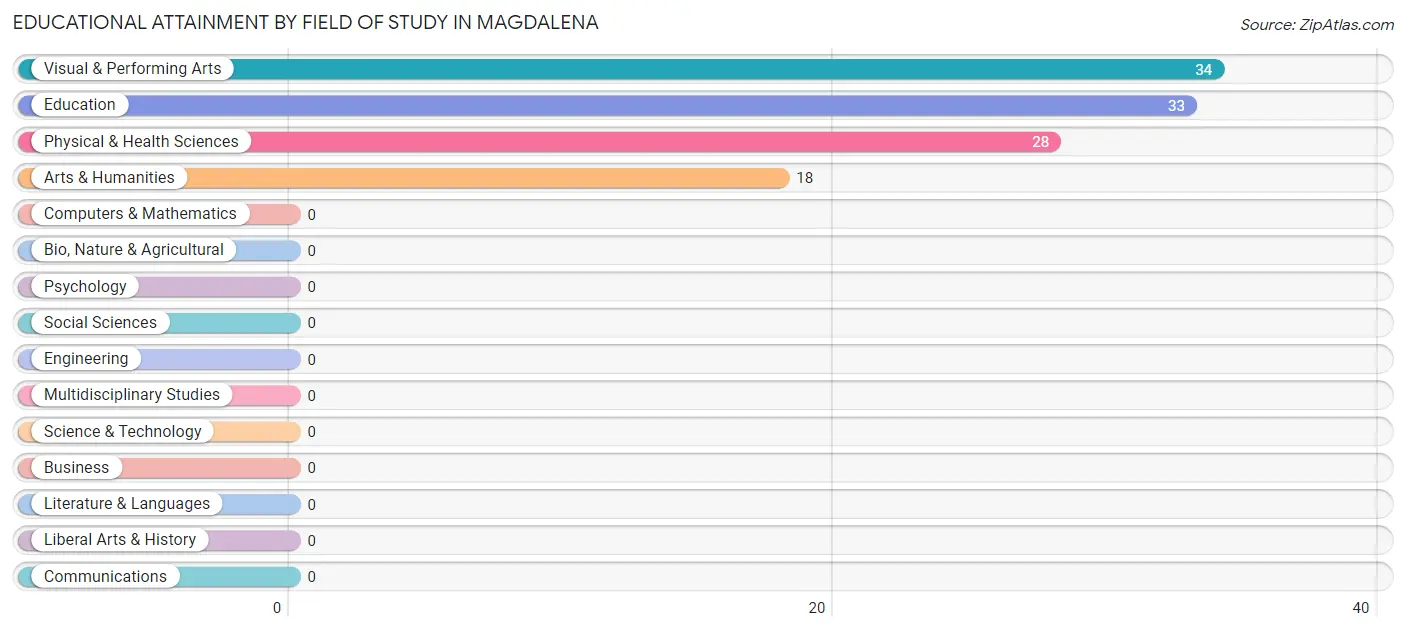
| Field of Study | # Graduates | % Graduates |
| Computers & Mathematics | 0 | 0.0% |
| Bio, Nature & Agricultural | 0 | 0.0% |
| Physical & Health Sciences | 28 | 24.8% |
| Psychology | 0 | 0.0% |
| Social Sciences | 0 | 0.0% |
| Engineering | 0 | 0.0% |
| Multidisciplinary Studies | 0 | 0.0% |
| Science & Technology | 0 | 0.0% |
| Business | 0 | 0.0% |
| Education | 33 | 29.2% |
| Literature & Languages | 0 | 0.0% |
| Liberal Arts & History | 0 | 0.0% |
| Visual & Performing Arts | 34 | 30.1% |
| Communications | 0 | 0.0% |
| Arts & Humanities | 18 | 15.9% |
| Total | 113 | 100.0% |
Transportation & Commute in Magdalena
Vehicle Availability by Sex in Magdalena
The most prevalent vehicle ownership categories in Magdalena are males with 2 vehicles (96, accounting for 57.5%) and females with 2 vehicles (33, making up 86.5%).
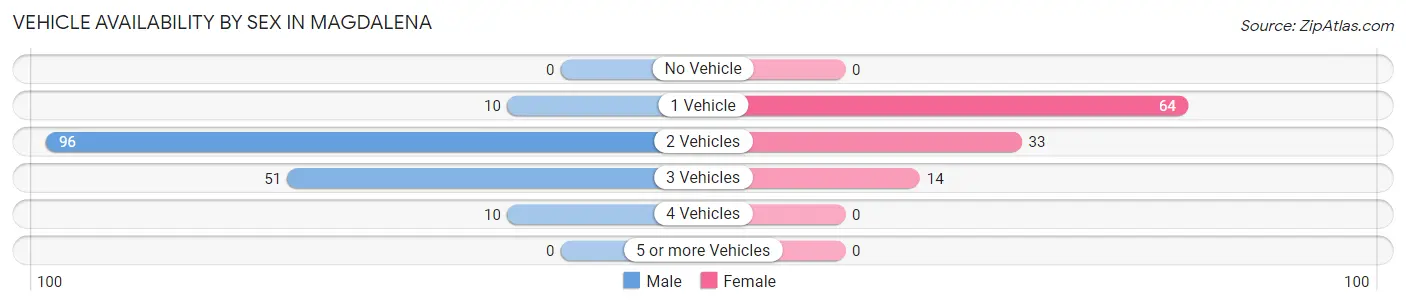
| Vehicles Available | Male | Female |
| No Vehicle | 0 (0.0%) | 0 (0.0%) |
| 1 Vehicle | 10 (6.0%) | 64 (57.7%) |
| 2 Vehicles | 96 (57.5%) | 33 (29.7%) |
| 3 Vehicles | 51 (30.5%) | 14 (12.6%) |
| 4 Vehicles | 10 (6.0%) | 0 (0.0%) |
| 5 or more Vehicles | 0 (0.0%) | 0 (0.0%) |
| Total | 167 (100.0%) | 111 (100.0%) |
Commute Time in Magdalena
The most frequently occuring commute durations in Magdalena are 30 to 34 minutes (90 commuters, 46.9%), 20 to 24 minutes (28 commuters, 14.6%), and 60 to 89 minutes (28 commuters, 14.6%).
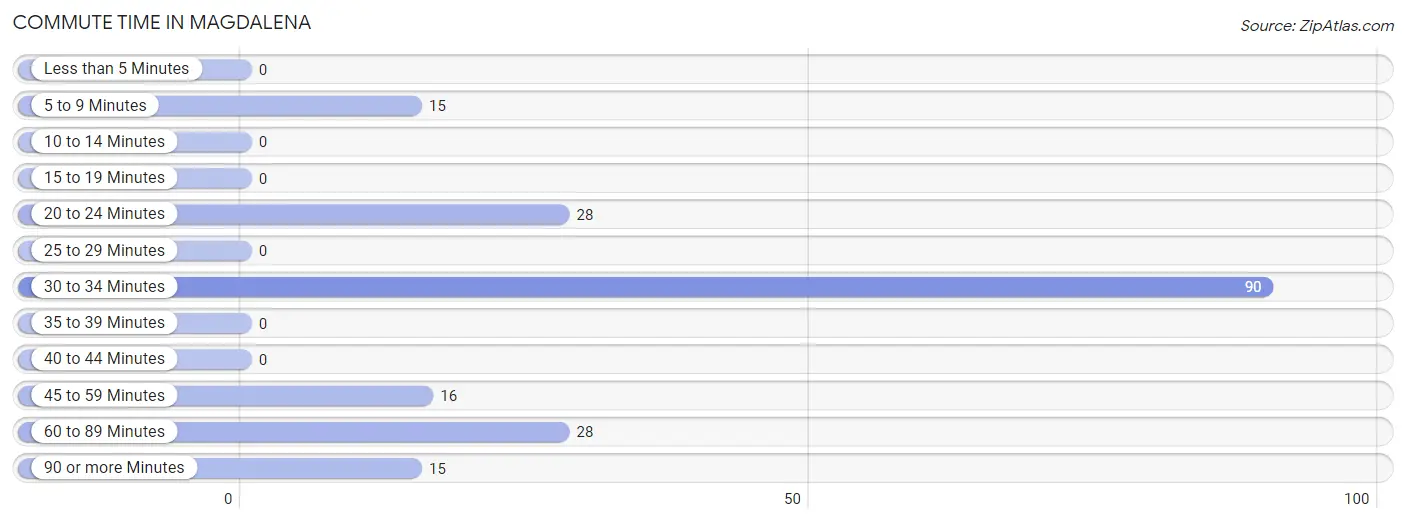
| Commute Time | # Commuters | % Commuters |
| Less than 5 Minutes | 0 | 0.0% |
| 5 to 9 Minutes | 15 | 7.8% |
| 10 to 14 Minutes | 0 | 0.0% |
| 15 to 19 Minutes | 0 | 0.0% |
| 20 to 24 Minutes | 28 | 14.6% |
| 25 to 29 Minutes | 0 | 0.0% |
| 30 to 34 Minutes | 90 | 46.9% |
| 35 to 39 Minutes | 0 | 0.0% |
| 40 to 44 Minutes | 0 | 0.0% |
| 45 to 59 Minutes | 16 | 8.3% |
| 60 to 89 Minutes | 28 | 14.6% |
| 90 or more Minutes | 15 | 7.8% |
Commute Time by Sex in Magdalena
The most common commute times in Magdalena are 30 to 34 minutes (77 commuters, 53.1%) for males and 30 to 34 minutes (13 commuters, 27.7%) for females.
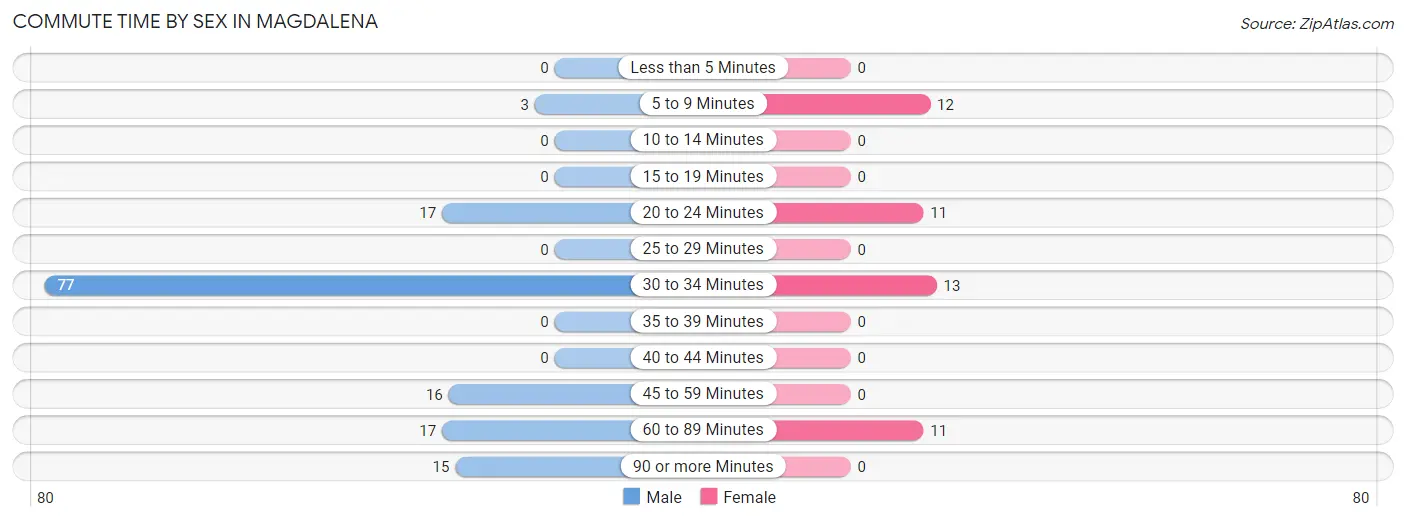
| Commute Time | Male | Female |
| Less than 5 Minutes | 0 (0.0%) | 0 (0.0%) |
| 5 to 9 Minutes | 3 (2.1%) | 12 (25.5%) |
| 10 to 14 Minutes | 0 (0.0%) | 0 (0.0%) |
| 15 to 19 Minutes | 0 (0.0%) | 0 (0.0%) |
| 20 to 24 Minutes | 17 (11.7%) | 11 (23.4%) |
| 25 to 29 Minutes | 0 (0.0%) | 0 (0.0%) |
| 30 to 34 Minutes | 77 (53.1%) | 13 (27.7%) |
| 35 to 39 Minutes | 0 (0.0%) | 0 (0.0%) |
| 40 to 44 Minutes | 0 (0.0%) | 0 (0.0%) |
| 45 to 59 Minutes | 16 (11.0%) | 0 (0.0%) |
| 60 to 89 Minutes | 17 (11.7%) | 11 (23.4%) |
| 90 or more Minutes | 15 (10.3%) | 0 (0.0%) |
Time of Departure to Work by Sex in Magdalena
The most frequent times of departure to work in Magdalena are 6:00 AM to 6:29 AM (93, 64.1%) for males and 7:30 AM to 7:59 AM (20, 42.5%) for females.
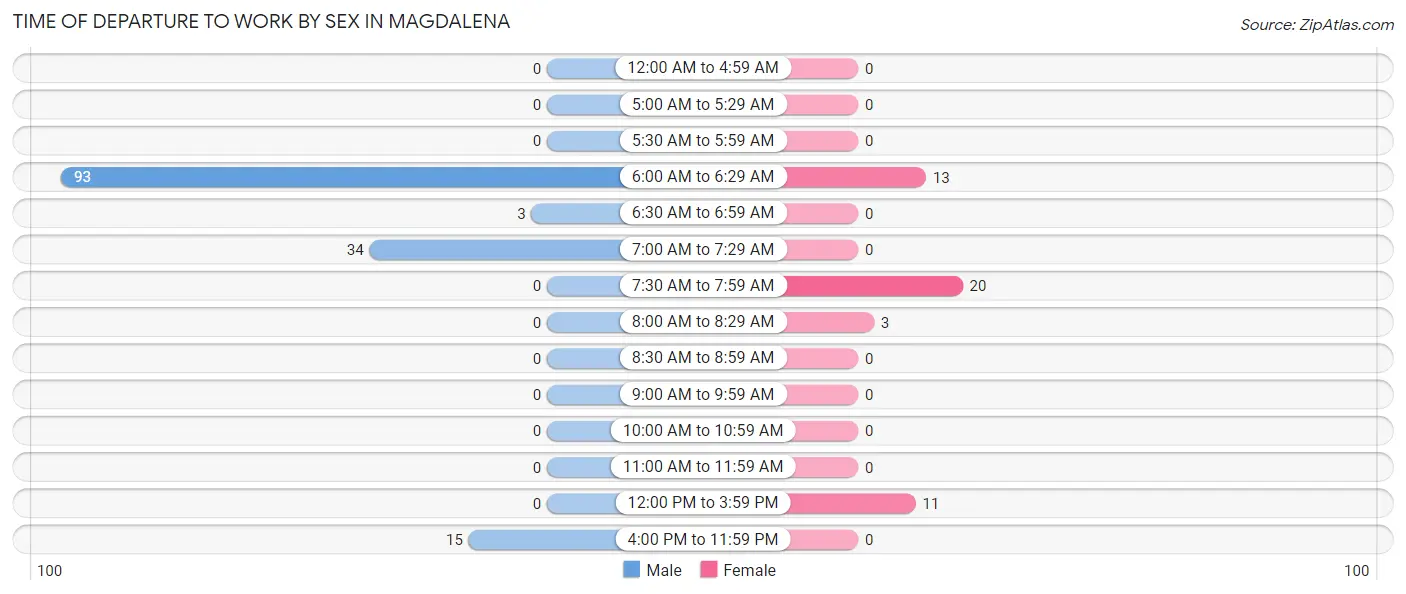
| Time of Departure | Male | Female |
| 12:00 AM to 4:59 AM | 0 (0.0%) | 0 (0.0%) |
| 5:00 AM to 5:29 AM | 0 (0.0%) | 0 (0.0%) |
| 5:30 AM to 5:59 AM | 0 (0.0%) | 0 (0.0%) |
| 6:00 AM to 6:29 AM | 93 (64.1%) | 13 (27.7%) |
| 6:30 AM to 6:59 AM | 3 (2.1%) | 0 (0.0%) |
| 7:00 AM to 7:29 AM | 34 (23.4%) | 0 (0.0%) |
| 7:30 AM to 7:59 AM | 0 (0.0%) | 20 (42.5%) |
| 8:00 AM to 8:29 AM | 0 (0.0%) | 3 (6.4%) |
| 8:30 AM to 8:59 AM | 0 (0.0%) | 0 (0.0%) |
| 9:00 AM to 9:59 AM | 0 (0.0%) | 0 (0.0%) |
| 10:00 AM to 10:59 AM | 0 (0.0%) | 0 (0.0%) |
| 11:00 AM to 11:59 AM | 0 (0.0%) | 0 (0.0%) |
| 12:00 PM to 3:59 PM | 0 (0.0%) | 11 (23.4%) |
| 4:00 PM to 11:59 PM | 15 (10.3%) | 0 (0.0%) |
| Total | 145 (100.0%) | 47 (100.0%) |
Housing Occupancy in Magdalena
Occupancy by Ownership in Magdalena
Of the total 369 dwellings in Magdalena, owner-occupied units account for 348 (94.3%), while renter-occupied units make up 21 (5.7%).
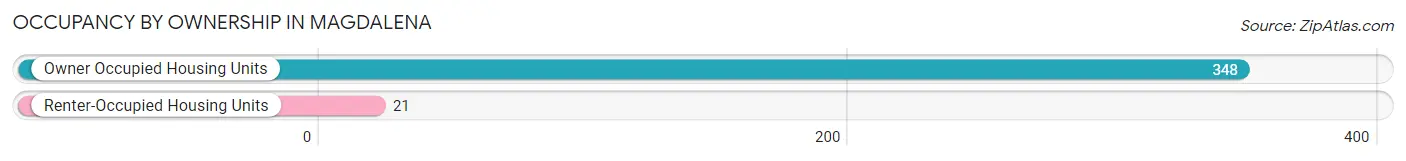
| Occupancy | # Housing Units | % Housing Units |
| Owner Occupied Housing Units | 348 | 94.3% |
| Renter-Occupied Housing Units | 21 | 5.7% |
| Total Occupied Housing Units | 369 | 100.0% |
Occupancy by Household Size in Magdalena
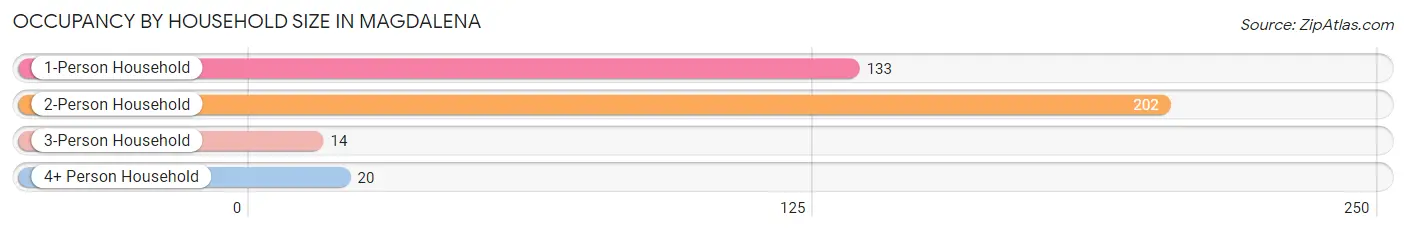
| Household Size | # Housing Units | % Housing Units |
| 1-Person Household | 133 | 36.0% |
| 2-Person Household | 202 | 54.7% |
| 3-Person Household | 14 | 3.8% |
| 4+ Person Household | 20 | 5.4% |
| Total Housing Units | 369 | 100.0% |
Occupancy by Ownership by Household Size in Magdalena
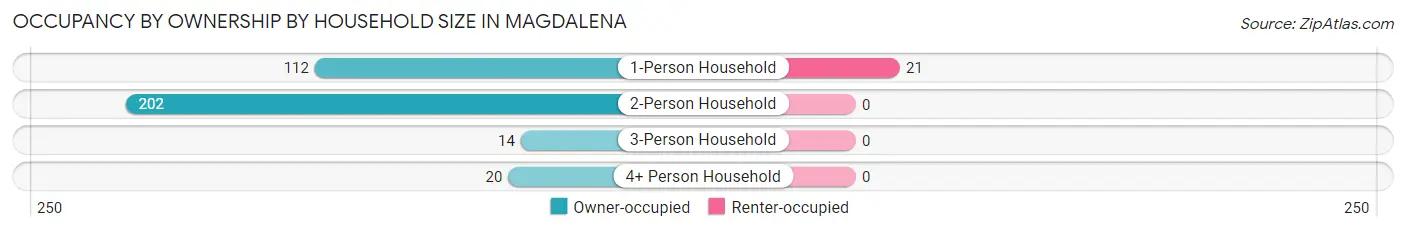
| Household Size | Owner-occupied | Renter-occupied |
| 1-Person Household | 112 (84.2%) | 21 (15.8%) |
| 2-Person Household | 202 (100.0%) | 0 (0.0%) |
| 3-Person Household | 14 (100.0%) | 0 (0.0%) |
| 4+ Person Household | 20 (100.0%) | 0 (0.0%) |
| Total Housing Units | 348 (94.3%) | 21 (5.7%) |
Occupancy by Educational Attainment in Magdalena
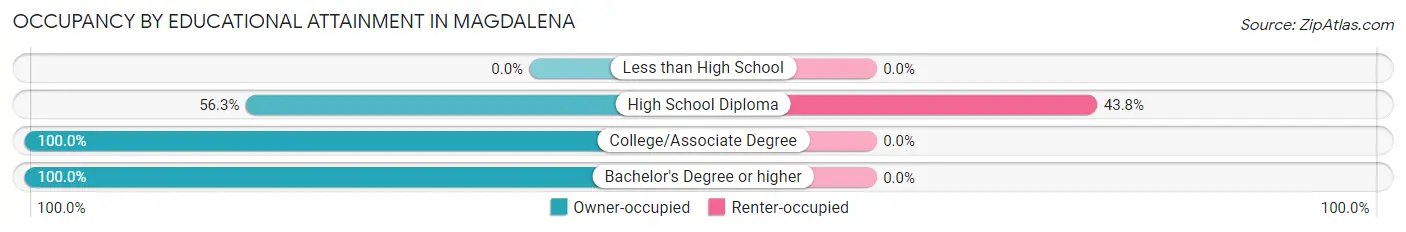
| Household Size | Owner-occupied | Renter-occupied |
| Less than High School | 0 (0.0%) | 0 (0.0%) |
| High School Diploma | 27 (56.2%) | 21 (43.8%) |
| College/Associate Degree | 277 (100.0%) | 0 (0.0%) |
| Bachelor's Degree or higher | 44 (100.0%) | 0 (0.0%) |
Occupancy by Age of Householder in Magdalena
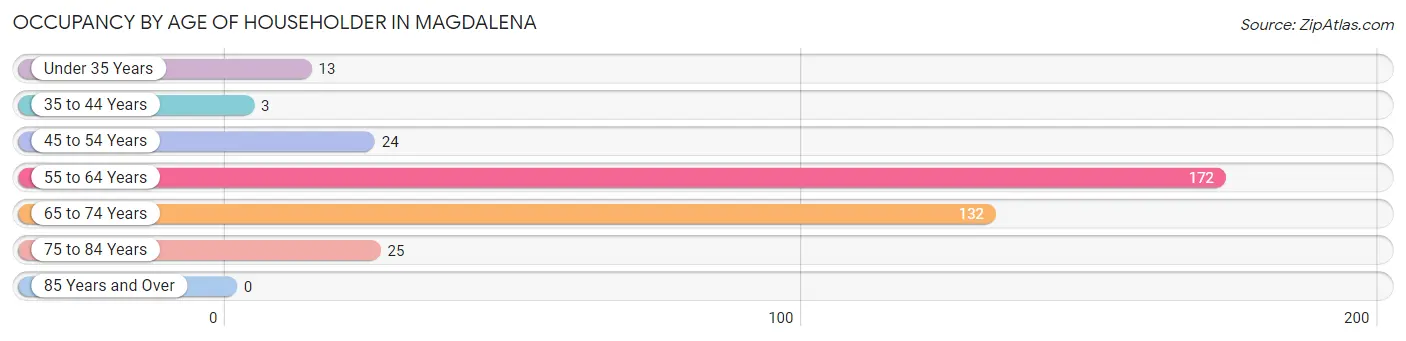
| Age Bracket | # Households | % Households |
| Under 35 Years | 13 | 3.5% |
| 35 to 44 Years | 3 | 0.8% |
| 45 to 54 Years | 24 | 6.5% |
| 55 to 64 Years | 172 | 46.6% |
| 65 to 74 Years | 132 | 35.8% |
| 75 to 84 Years | 25 | 6.8% |
| 85 Years and Over | 0 | 0.0% |
| Total | 369 | 100.0% |
Housing Finances in Magdalena
Median Income by Occupancy in Magdalena
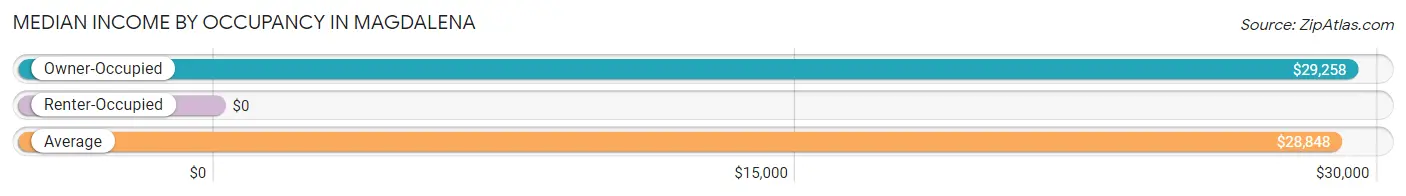
| Occupancy Type | # Households | Median Income |
| Owner-Occupied | 348 (94.3%) | $29,258 |
| Renter-Occupied | 21 (5.7%) | $0 |
| Average | 369 (100.0%) | $28,848 |
Occupancy by Householder Income Bracket in Magdalena
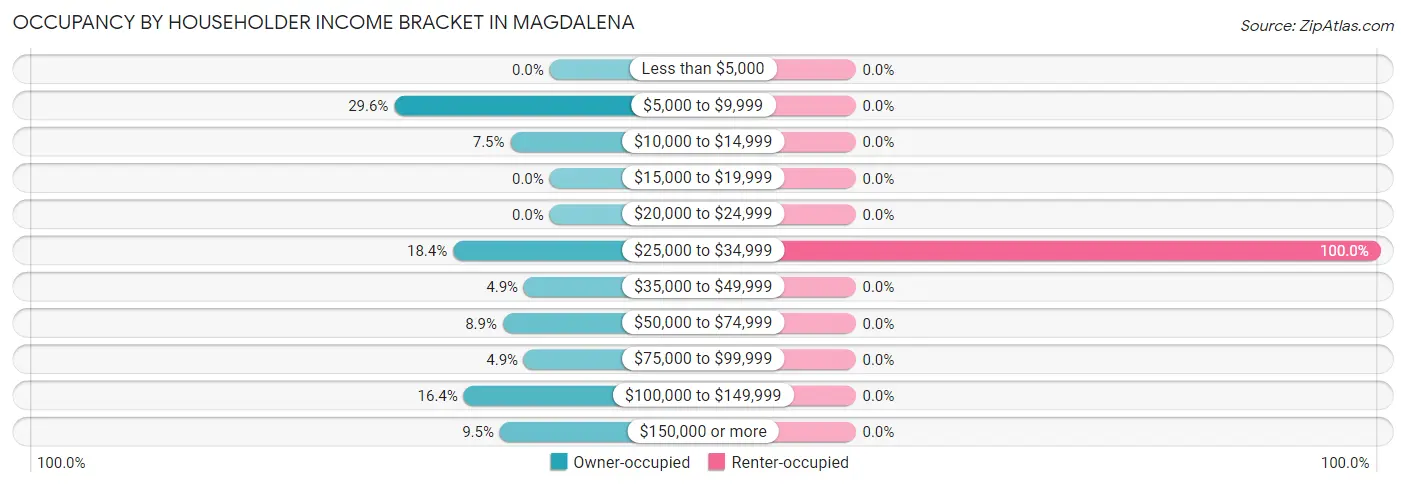
| Income Bracket | Owner-occupied | Renter-occupied |
| Less than $5,000 | 0 (0.0%) | 0 (0.0%) |
| $5,000 to $9,999 | 103 (29.6%) | 0 (0.0%) |
| $10,000 to $14,999 | 26 (7.5%) | 0 (0.0%) |
| $15,000 to $19,999 | 0 (0.0%) | 0 (0.0%) |
| $20,000 to $24,999 | 0 (0.0%) | 0 (0.0%) |
| $25,000 to $34,999 | 64 (18.4%) | 21 (100.0%) |
| $35,000 to $49,999 | 17 (4.9%) | 0 (0.0%) |
| $50,000 to $74,999 | 31 (8.9%) | 0 (0.0%) |
| $75,000 to $99,999 | 17 (4.9%) | 0 (0.0%) |
| $100,000 to $149,999 | 57 (16.4%) | 0 (0.0%) |
| $150,000 or more | 33 (9.5%) | 0 (0.0%) |
| Total | 348 (100.0%) | 21 (100.0%) |
Monthly Housing Cost Tiers in Magdalena
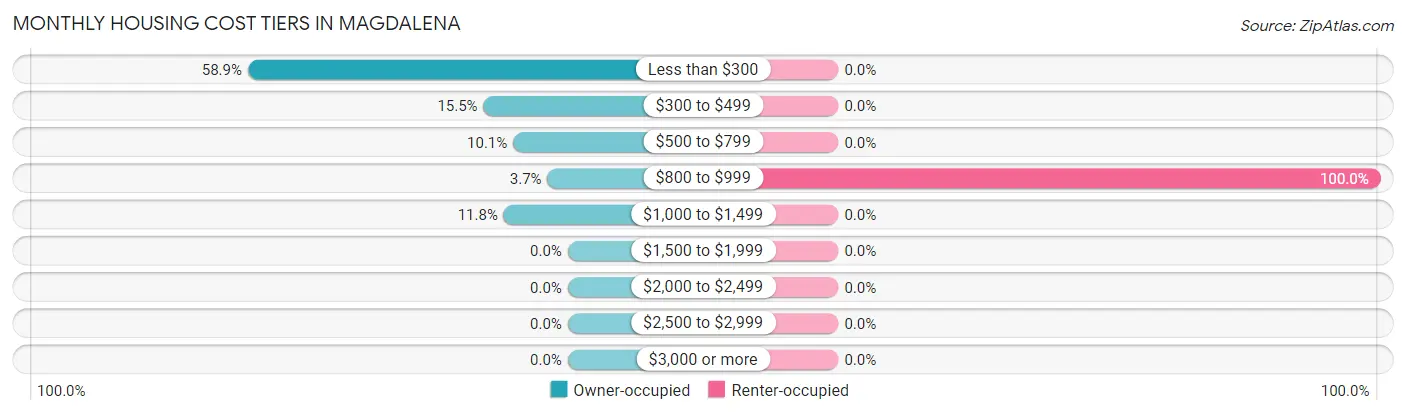
| Monthly Cost | Owner-occupied | Renter-occupied |
| Less than $300 | 205 (58.9%) | 0 (0.0%) |
| $300 to $499 | 54 (15.5%) | 0 (0.0%) |
| $500 to $799 | 35 (10.1%) | 0 (0.0%) |
| $800 to $999 | 13 (3.7%) | 21 (100.0%) |
| $1,000 to $1,499 | 41 (11.8%) | 0 (0.0%) |
| $1,500 to $1,999 | 0 (0.0%) | 0 (0.0%) |
| $2,000 to $2,499 | 0 (0.0%) | 0 (0.0%) |
| $2,500 to $2,999 | 0 (0.0%) | 0 (0.0%) |
| $3,000 or more | 0 (0.0%) | 0 (0.0%) |
| Total | 348 (100.0%) | 21 (100.0%) |
Physical Housing Characteristics in Magdalena
Housing Structures in Magdalena
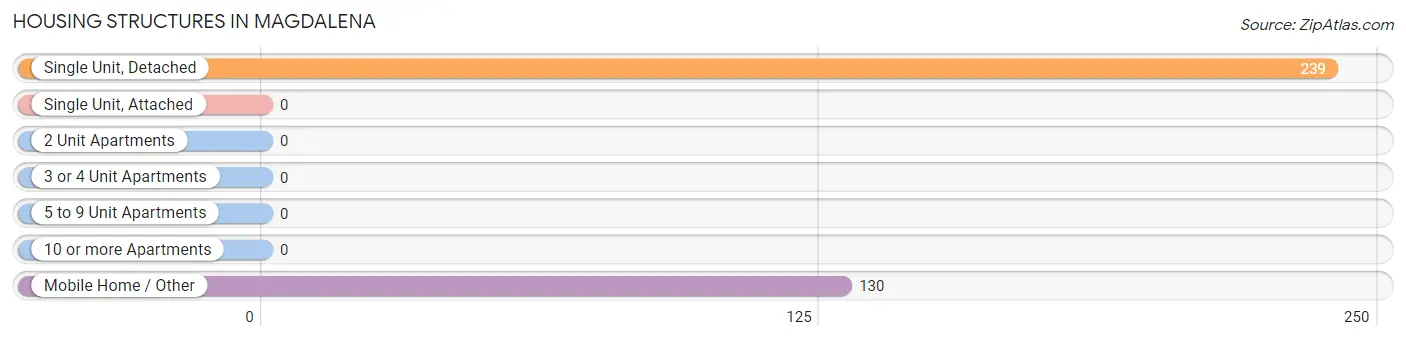
| Structure Type | # Housing Units | % Housing Units |
| Single Unit, Detached | 239 | 64.8% |
| Single Unit, Attached | 0 | 0.0% |
| 2 Unit Apartments | 0 | 0.0% |
| 3 or 4 Unit Apartments | 0 | 0.0% |
| 5 to 9 Unit Apartments | 0 | 0.0% |
| 10 or more Apartments | 0 | 0.0% |
| Mobile Home / Other | 130 | 35.2% |
| Total | 369 | 100.0% |
Housing Structures by Occupancy in Magdalena
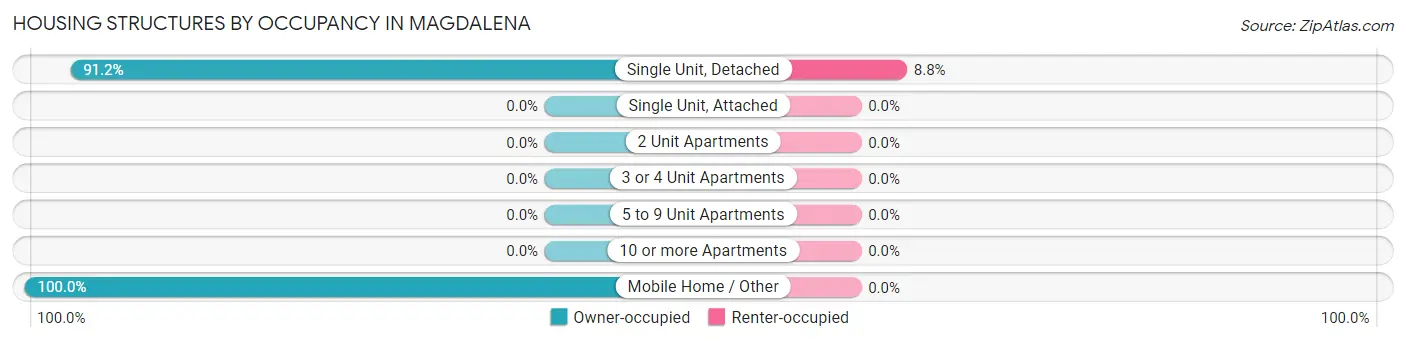
| Structure Type | Owner-occupied | Renter-occupied |
| Single Unit, Detached | 218 (91.2%) | 21 (8.8%) |
| Single Unit, Attached | 0 (0.0%) | 0 (0.0%) |
| 2 Unit Apartments | 0 (0.0%) | 0 (0.0%) |
| 3 or 4 Unit Apartments | 0 (0.0%) | 0 (0.0%) |
| 5 to 9 Unit Apartments | 0 (0.0%) | 0 (0.0%) |
| 10 or more Apartments | 0 (0.0%) | 0 (0.0%) |
| Mobile Home / Other | 130 (100.0%) | 0 (0.0%) |
| Total | 348 (94.3%) | 21 (5.7%) |
Housing Structures by Number of Rooms in Magdalena
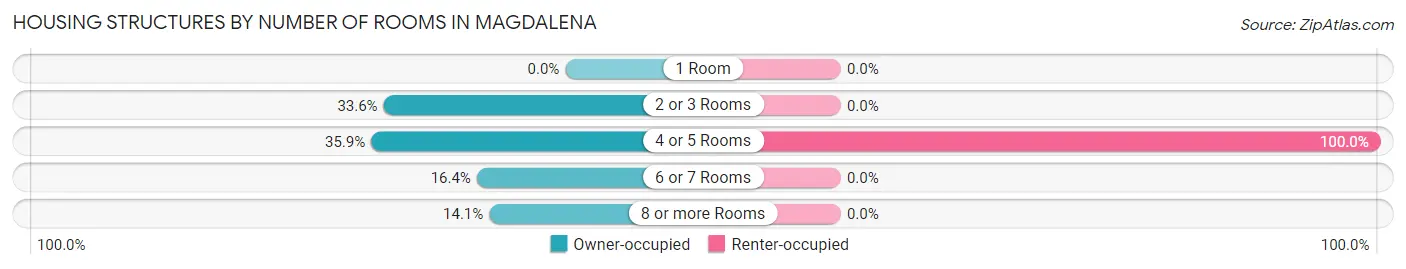
| Number of Rooms | Owner-occupied | Renter-occupied |
| 1 Room | 0 (0.0%) | 0 (0.0%) |
| 2 or 3 Rooms | 117 (33.6%) | 0 (0.0%) |
| 4 or 5 Rooms | 125 (35.9%) | 21 (100.0%) |
| 6 or 7 Rooms | 57 (16.4%) | 0 (0.0%) |
| 8 or more Rooms | 49 (14.1%) | 0 (0.0%) |
| Total | 348 (100.0%) | 21 (100.0%) |
Housing Structure by Heating Type in Magdalena
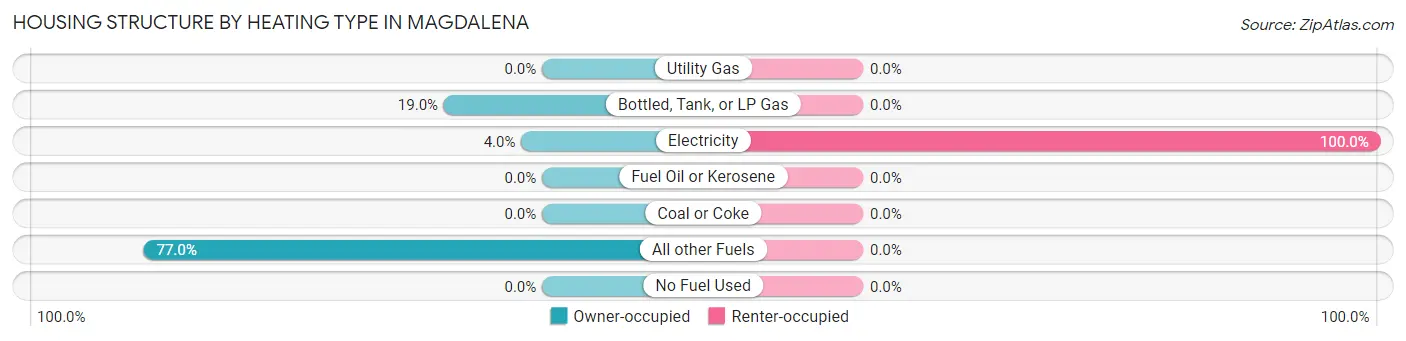
| Heating Type | Owner-occupied | Renter-occupied |
| Utility Gas | 0 (0.0%) | 0 (0.0%) |
| Bottled, Tank, or LP Gas | 66 (19.0%) | 0 (0.0%) |
| Electricity | 14 (4.0%) | 21 (100.0%) |
| Fuel Oil or Kerosene | 0 (0.0%) | 0 (0.0%) |
| Coal or Coke | 0 (0.0%) | 0 (0.0%) |
| All other Fuels | 268 (77.0%) | 0 (0.0%) |
| No Fuel Used | 0 (0.0%) | 0 (0.0%) |
| Total | 348 (100.0%) | 21 (100.0%) |
Household Vehicle Usage in Magdalena
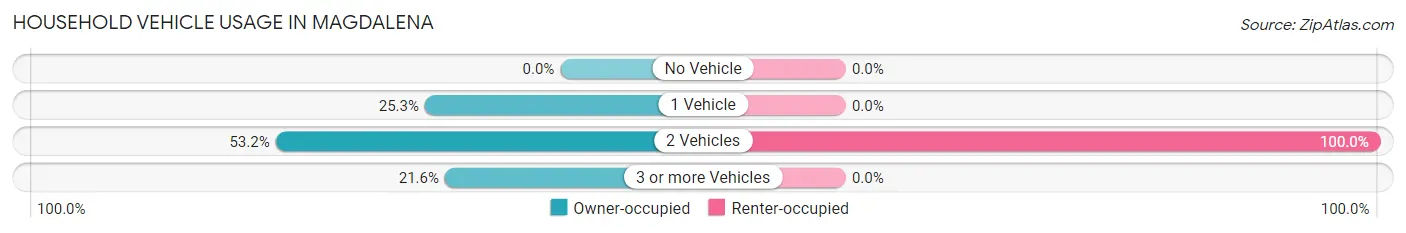
| Vehicles per Household | Owner-occupied | Renter-occupied |
| No Vehicle | 0 (0.0%) | 0 (0.0%) |
| 1 Vehicle | 88 (25.3%) | 0 (0.0%) |
| 2 Vehicles | 185 (53.2%) | 21 (100.0%) |
| 3 or more Vehicles | 75 (21.5%) | 0 (0.0%) |
| Total | 348 (100.0%) | 21 (100.0%) |
Real Estate & Mortgages in Magdalena
Real Estate and Mortgage Overview in Magdalena
| Characteristic | Without Mortgage | With Mortgage |
| Housing Units | 294 | 54 |
| Median Property Value | $109,900 | $114,600 |
| Median Household Income | $28,203 | $0 |
| Monthly Housing Costs | $214 | $0 |
| Real Estate Taxes | $405 | $0 |
Property Value by Mortgage Status in Magdalena
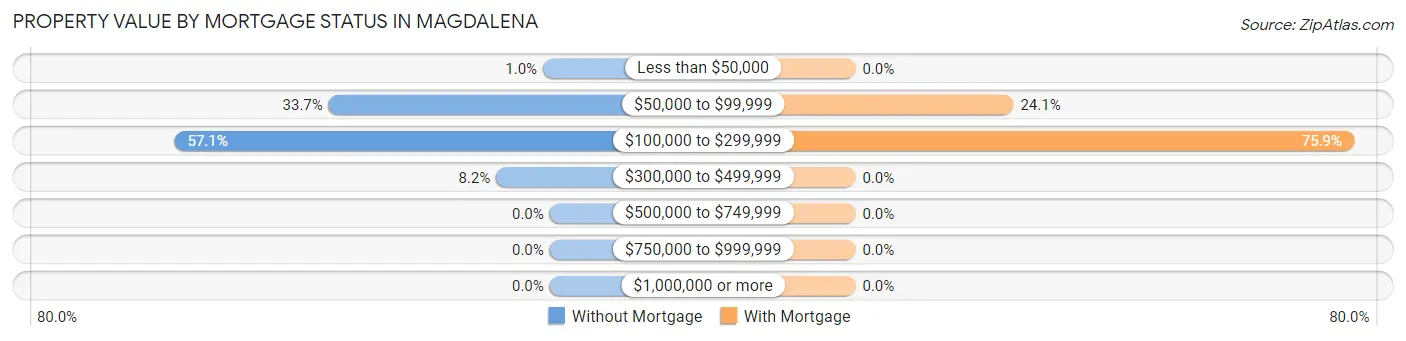
| Property Value | Without Mortgage | With Mortgage |
| Less than $50,000 | 3 (1.0%) | 0 (0.0%) |
| $50,000 to $99,999 | 99 (33.7%) | 13 (24.1%) |
| $100,000 to $299,999 | 168 (57.1%) | 41 (75.9%) |
| $300,000 to $499,999 | 24 (8.2%) | 0 (0.0%) |
| $500,000 to $749,999 | 0 (0.0%) | 0 (0.0%) |
| $750,000 to $999,999 | 0 (0.0%) | 0 (0.0%) |
| $1,000,000 or more | 0 (0.0%) | 0 (0.0%) |
| Total | 294 (100.0%) | 54 (100.0%) |
Household Income by Mortgage Status in Magdalena
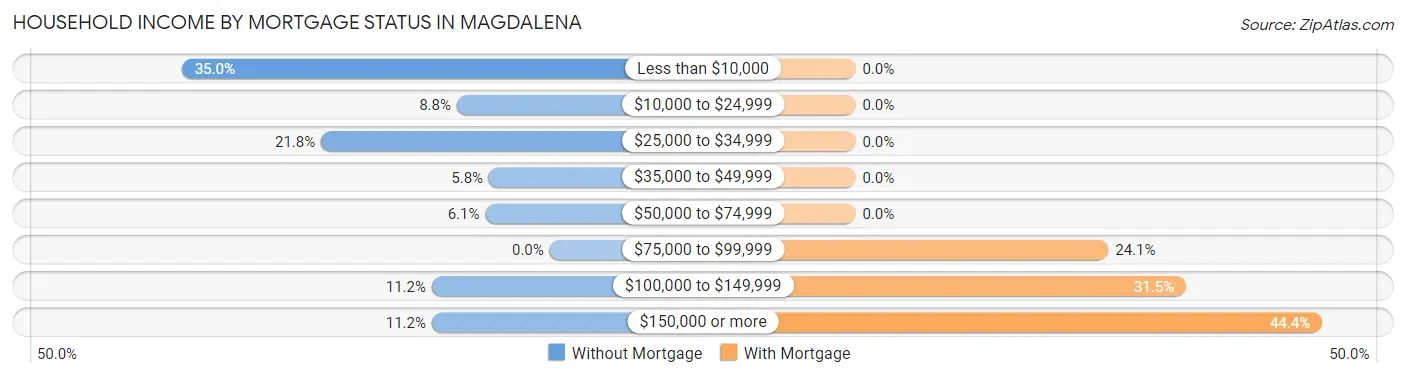
| Household Income | Without Mortgage | With Mortgage |
| Less than $10,000 | 103 (35.0%) | 0 (0.0%) |
| $10,000 to $24,999 | 26 (8.8%) | 0 (0.0%) |
| $25,000 to $34,999 | 64 (21.8%) | 0 (0.0%) |
| $35,000 to $49,999 | 17 (5.8%) | 0 (0.0%) |
| $50,000 to $74,999 | 18 (6.1%) | 0 (0.0%) |
| $75,000 to $99,999 | 0 (0.0%) | 13 (24.1%) |
| $100,000 to $149,999 | 33 (11.2%) | 17 (31.5%) |
| $150,000 or more | 33 (11.2%) | 24 (44.4%) |
| Total | 294 (100.0%) | 54 (100.0%) |
Property Value to Household Income Ratio in Magdalena
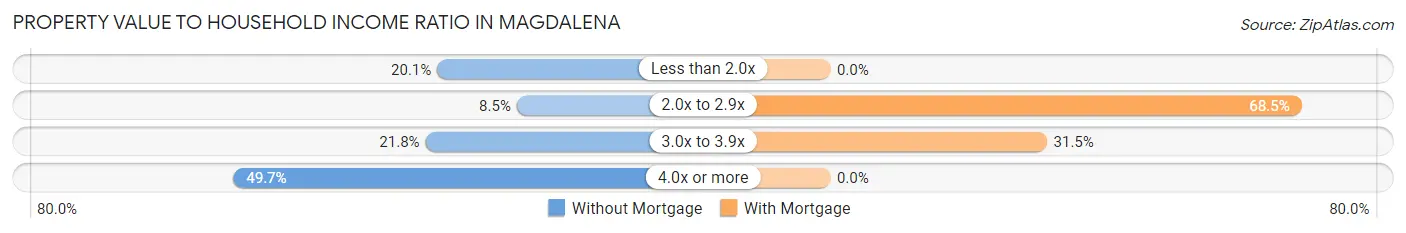
| Value-to-Income Ratio | Without Mortgage | With Mortgage |
| Less than 2.0x | 59 (20.1%) | 0 (0.0%) |
| 2.0x to 2.9x | 25 (8.5%) | 37 (68.5%) |
| 3.0x to 3.9x | 64 (21.8%) | 17 (31.5%) |
| 4.0x or more | 146 (49.7%) | 0 (0.0%) |
| Total | 294 (100.0%) | 54 (100.0%) |
Real Estate Taxes by Mortgage Status in Magdalena
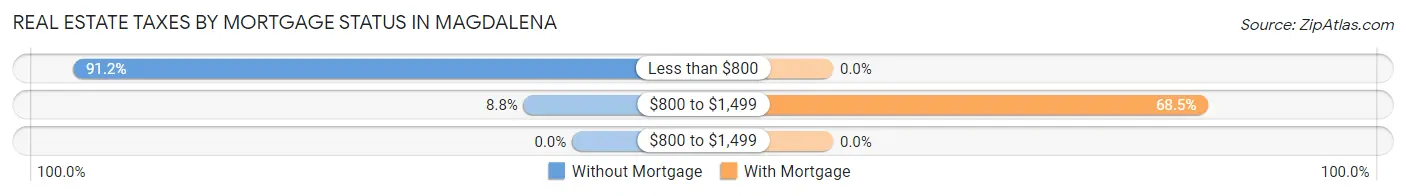
| Property Taxes | Without Mortgage | With Mortgage |
| Less than $800 | 268 (91.2%) | 0 (0.0%) |
| $800 to $1,499 | 26 (8.8%) | 37 (68.5%) |
| $800 to $1,499 | 0 (0.0%) | 0 (0.0%) |
| Total | 294 (100.0%) | 54 (100.0%) |
Health & Disability in Magdalena
Health Insurance Coverage by Age in Magdalena
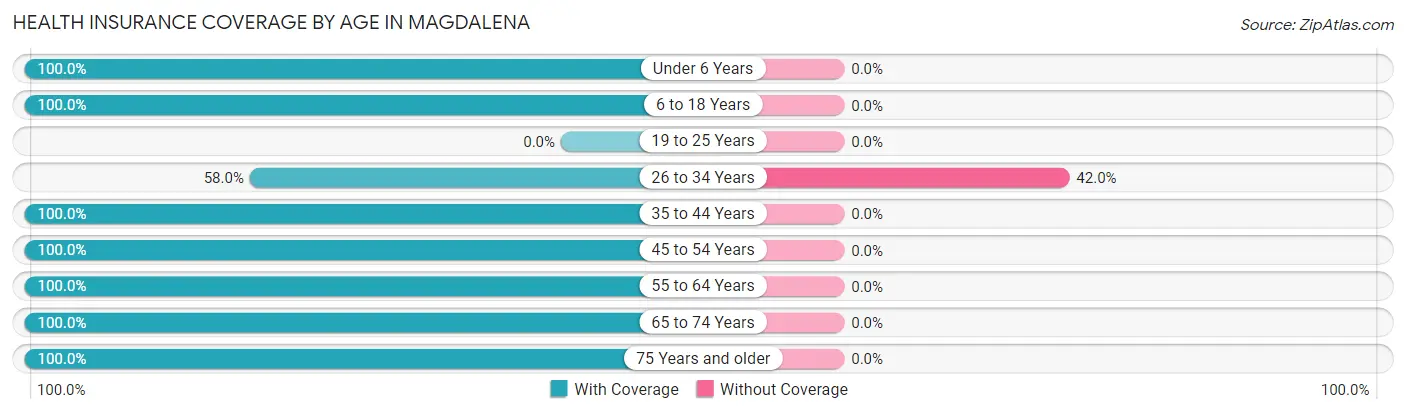
| Age Bracket | With Coverage | Without Coverage |
| Under 6 Years | 16 (100.0%) | 0 (0.0%) |
| 6 to 18 Years | 61 (100.0%) | 0 (0.0%) |
| 19 to 25 Years | 0 (0.0%) | 0 (0.0%) |
| 26 to 34 Years | 47 (58.0%) | 34 (42.0%) |
| 35 to 44 Years | 73 (100.0%) | 0 (0.0%) |
| 45 to 54 Years | 39 (100.0%) | 0 (0.0%) |
| 55 to 64 Years | 221 (100.0%) | 0 (0.0%) |
| 65 to 74 Years | 205 (100.0%) | 0 (0.0%) |
| 75 Years and older | 95 (100.0%) | 0 (0.0%) |
| Total | 757 (95.7%) | 34 (4.3%) |
Health Insurance Coverage by Citizenship Status in Magdalena
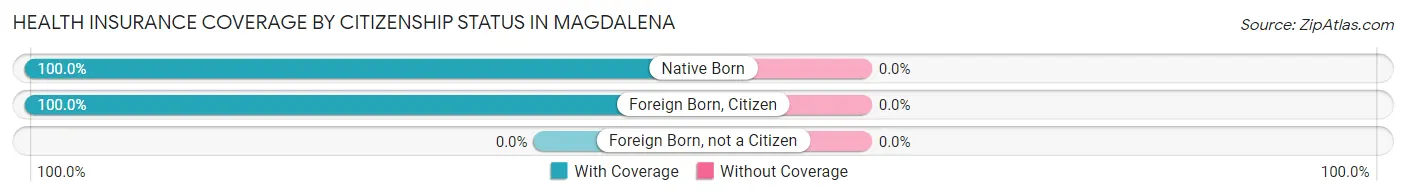
| Citizenship Status | With Coverage | Without Coverage |
| Native Born | 16 (100.0%) | 0 (0.0%) |
| Foreign Born, Citizen | 61 (100.0%) | 0 (0.0%) |
| Foreign Born, not a Citizen | 0 (0.0%) | 0 (0.0%) |
Health Insurance Coverage by Household Income in Magdalena
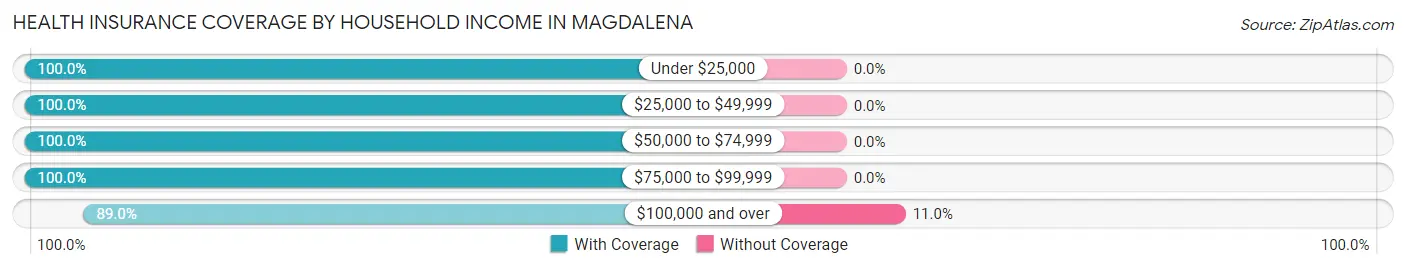
| Household Income | With Coverage | Without Coverage |
| Under $25,000 | 202 (100.0%) | 0 (0.0%) |
| $25,000 to $49,999 | 157 (100.0%) | 0 (0.0%) |
| $50,000 to $74,999 | 98 (100.0%) | 0 (0.0%) |
| $75,000 to $99,999 | 26 (100.0%) | 0 (0.0%) |
| $100,000 and over | 274 (89.0%) | 34 (11.0%) |
Public vs Private Health Insurance Coverage by Age in Magdalena
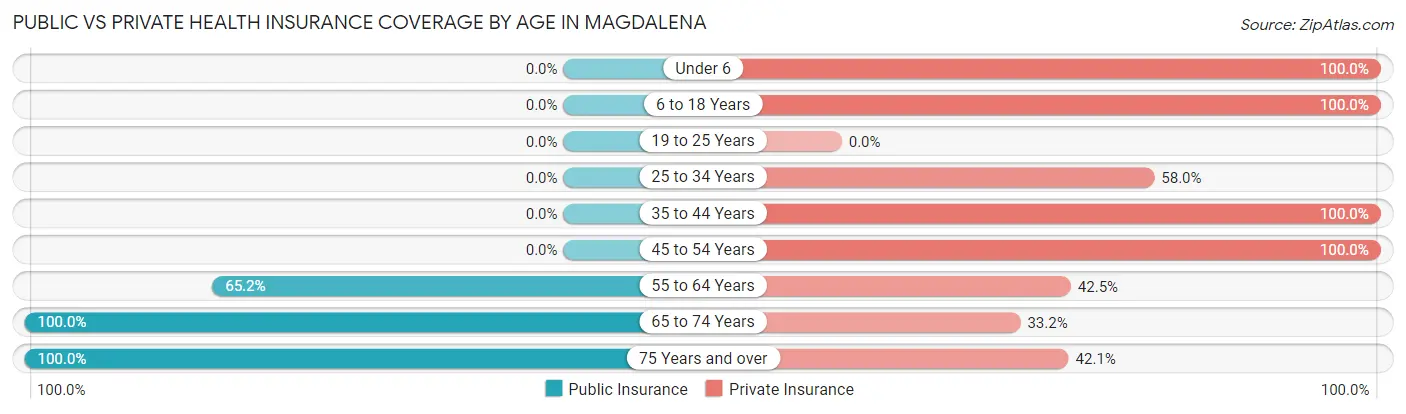
| Age Bracket | Public Insurance | Private Insurance |
| Under 6 | 0 (0.0%) | 16 (100.0%) |
| 6 to 18 Years | 0 (0.0%) | 61 (100.0%) |
| 19 to 25 Years | 0 (0.0%) | 0 (0.0%) |
| 25 to 34 Years | 0 (0.0%) | 47 (58.0%) |
| 35 to 44 Years | 0 (0.0%) | 73 (100.0%) |
| 45 to 54 Years | 0 (0.0%) | 39 (100.0%) |
| 55 to 64 Years | 144 (65.2%) | 94 (42.5%) |
| 65 to 74 Years | 205 (100.0%) | 68 (33.2%) |
| 75 Years and over | 95 (100.0%) | 40 (42.1%) |
| Total | 444 (56.1%) | 438 (55.4%) |
Disability Status by Sex by Age in Magdalena
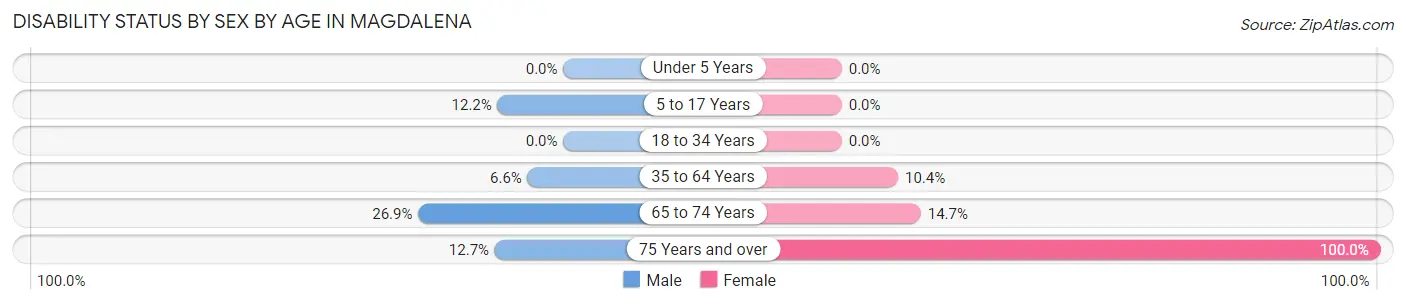
| Age Bracket | Male | Female |
| Under 5 Years | 0 (0.0%) | 0 (0.0%) |
| 5 to 17 Years | 5 (12.2%) | 0 (0.0%) |
| 18 to 34 Years | 0 (0.0%) | 0 (0.0%) |
| 35 to 64 Years | 10 (6.6%) | 19 (10.4%) |
| 65 to 74 Years | 35 (26.9%) | 11 (14.7%) |
| 75 Years and over | 8 (12.7%) | 32 (100.0%) |
Disability Class by Sex by Age in Magdalena
Disability Class: Hearing Difficulty
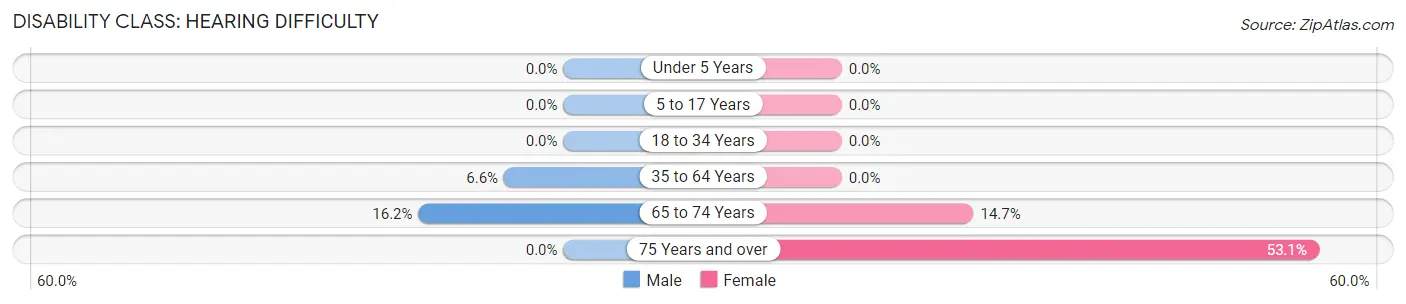
| Age Bracket | Male | Female |
| Under 5 Years | 0 (0.0%) | 0 (0.0%) |
| 5 to 17 Years | 0 (0.0%) | 0 (0.0%) |
| 18 to 34 Years | 0 (0.0%) | 0 (0.0%) |
| 35 to 64 Years | 10 (6.6%) | 0 (0.0%) |
| 65 to 74 Years | 21 (16.2%) | 11 (14.7%) |
| 75 Years and over | 0 (0.0%) | 17 (53.1%) |
Disability Class: Vision Difficulty
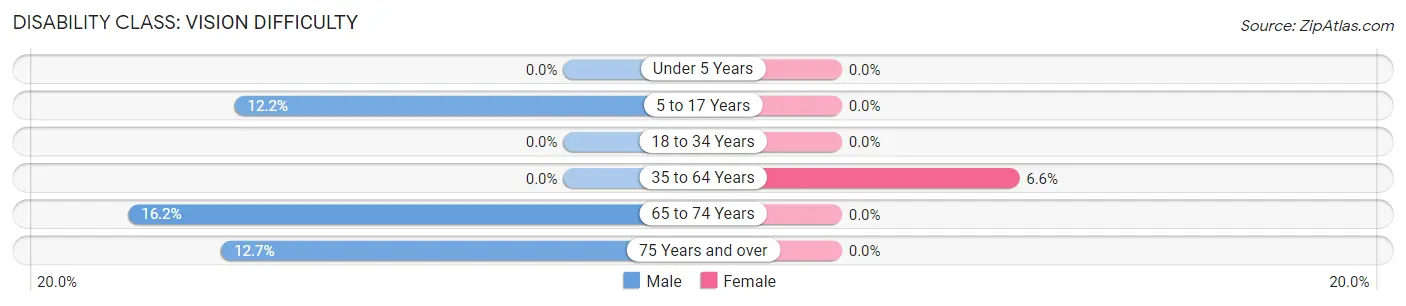
| Age Bracket | Male | Female |
| Under 5 Years | 0 (0.0%) | 0 (0.0%) |
| 5 to 17 Years | 5 (12.2%) | 0 (0.0%) |
| 18 to 34 Years | 0 (0.0%) | 0 (0.0%) |
| 35 to 64 Years | 0 (0.0%) | 12 (6.6%) |
| 65 to 74 Years | 21 (16.2%) | 0 (0.0%) |
| 75 Years and over | 8 (12.7%) | 0 (0.0%) |
Disability Class: Cognitive Difficulty
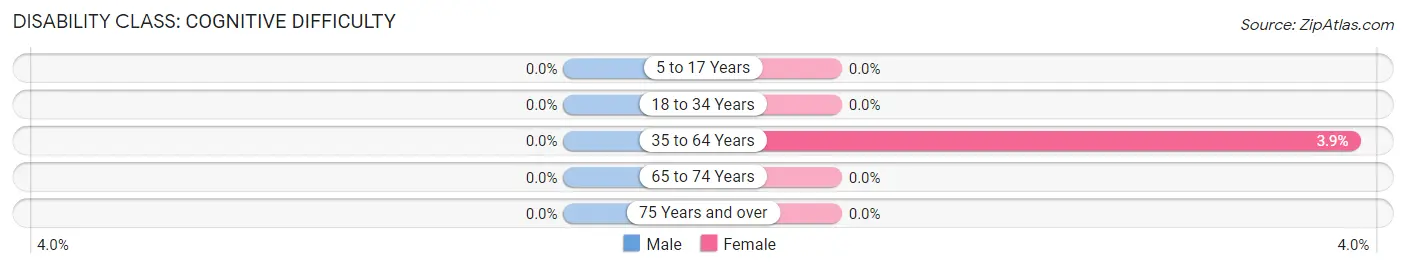
| Age Bracket | Male | Female |
| 5 to 17 Years | 0 (0.0%) | 0 (0.0%) |
| 18 to 34 Years | 0 (0.0%) | 0 (0.0%) |
| 35 to 64 Years | 0 (0.0%) | 7 (3.8%) |
| 65 to 74 Years | 0 (0.0%) | 0 (0.0%) |
| 75 Years and over | 0 (0.0%) | 0 (0.0%) |
Disability Class: Ambulatory Difficulty
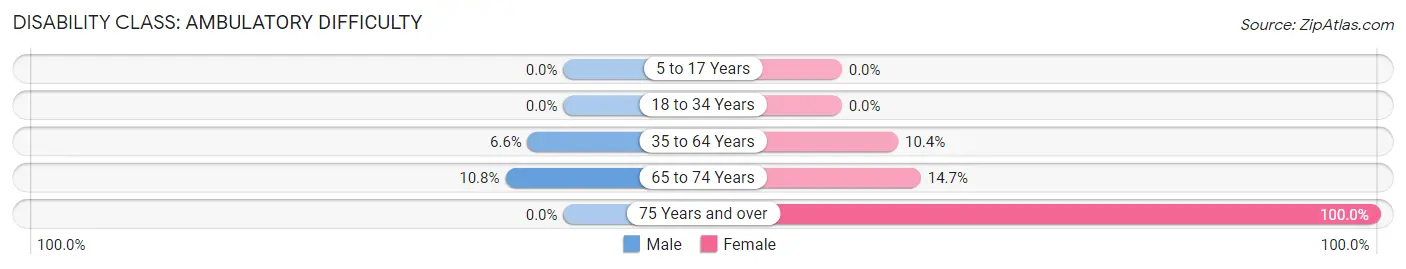
| Age Bracket | Male | Female |
| 5 to 17 Years | 0 (0.0%) | 0 (0.0%) |
| 18 to 34 Years | 0 (0.0%) | 0 (0.0%) |
| 35 to 64 Years | 10 (6.6%) | 19 (10.4%) |
| 65 to 74 Years | 14 (10.8%) | 11 (14.7%) |
| 75 Years and over | 0 (0.0%) | 32 (100.0%) |
Disability Class: Self-Care Difficulty
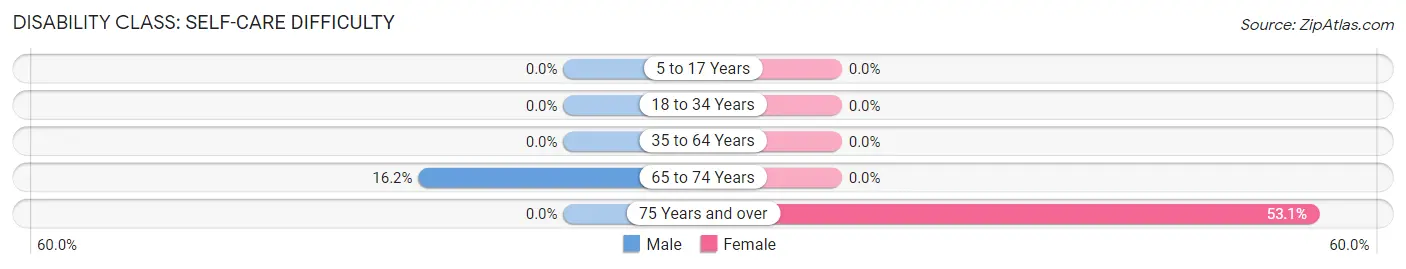
| Age Bracket | Male | Female |
| 5 to 17 Years | 0 (0.0%) | 0 (0.0%) |
| 18 to 34 Years | 0 (0.0%) | 0 (0.0%) |
| 35 to 64 Years | 0 (0.0%) | 0 (0.0%) |
| 65 to 74 Years | 21 (16.2%) | 0 (0.0%) |
| 75 Years and over | 0 (0.0%) | 17 (53.1%) |
Technology Access in Magdalena
Computing Device Access in Magdalena
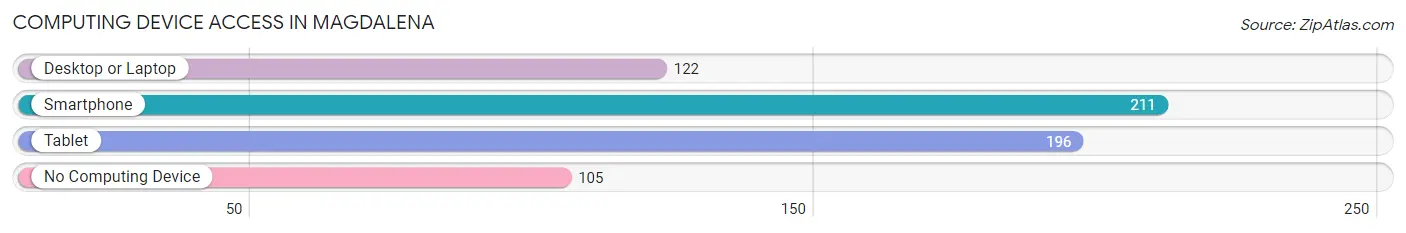
| Device Type | # Households | % Households |
| Desktop or Laptop | 122 | 33.1% |
| Smartphone | 211 | 57.2% |
| Tablet | 196 | 53.1% |
| No Computing Device | 105 | 28.5% |
| Total | 369 | 100.0% |
Internet Access in Magdalena
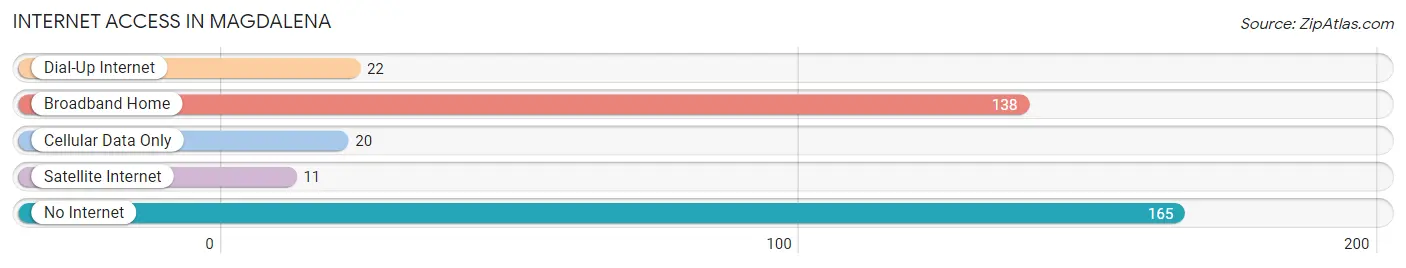
| Internet Type | # Households | % Households |
| Dial-Up Internet | 22 | 6.0% |
| Broadband Home | 138 | 37.4% |
| Cellular Data Only | 20 | 5.4% |
| Satellite Internet | 11 | 3.0% |
| No Internet | 165 | 44.7% |
| Total | 369 | 100.0% |
Magdalena Summary
History
The small town of Magdalena, New Mexico is located in the foothills of the Magdalena Mountains in Socorro County. The area was first inhabited by the Mescalero Apache, who were later joined by the Navajo and Comanche. The first European settlers arrived in the area in the late 1800s, and the town of Magdalena was officially founded in 1883.
The town was named after the nearby Magdalena Mountains, which were named after the biblical figure Mary Magdalene. The town was originally a mining town, with the first mine opening in 1884. The mine was a silver mine, and it was soon followed by other mines for gold, copper, and lead. The town quickly grew, and by the early 1900s, it had become a bustling mining town with a population of over 1,000 people.
The town's economy was largely based on the mining industry, and it remained so until the mid-1900s. In the 1950s, the mining industry began to decline, and the town's population began to dwindle. By the 1970s, the town's population had dropped to just over 500 people.
In the late 1970s, the town began to experience a resurgence in population and economic activity. This was due in part to the discovery of oil and gas in the area, as well as the development of tourism. Today, the town has a population of around 1,000 people and is a popular tourist destination.
Geography
Magdalena is located in the foothills of the Magdalena Mountains in Socorro County, New Mexico. The town is situated at an elevation of 5,400 feet, and the surrounding mountains reach heights of up to 8,000 feet. The town is located in a semi-arid climate, with hot summers and cold winters.
The town is located on the western edge of the Chihuahuan Desert, and the nearby Magdalena Mountains are home to a variety of wildlife, including deer, elk, and bighorn sheep. The nearby San Mateo Mountains are also home to a variety of wildlife, including black bears, mountain lions, and coyotes.
Economy
The economy of Magdalena is largely based on tourism, as well as oil and gas production. The town is home to several tourist attractions, including the Magdalena Museum, the Magdalena Historical Society, and the Magdalena Rodeo. The town is also home to several restaurants, bars, and shops.
The town is also home to several oil and gas production companies, as well as several mining companies. The town is also home to several small businesses, including a grocery store, a hardware store, and a gas station.
Demographics
As of the 2010 census, the population of Magdalena was 1,037. The population is largely Hispanic, with over 90% of the population identifying as Hispanic or Latino. The median household income in the town is $30,000, and the median age is 37. The town is home to several churches, including the Catholic Church of Magdalena, the First Baptist Church of Magdalena, and the Magdalena United Methodist Church.
Common Questions
What is Per Capita Income in Magdalena?
Per Capita income in Magdalena is $37,302.
What is the Median Household income in Magdalena?
Median Household Income in Magdalena is $28,848.
What is Income or Wage Gap in Magdalena?
Income or Wage Gap in Magdalena is 57.6%.
Women in Magdalena earn 42.4 cents for every dollar earned by a man.
What is Inequality or Gini Index in Magdalena?
Inequality or Gini Index in Magdalena is 0.60.
What is the Total Population of Magdalena?
Total Population of Magdalena is 791.
What is the Total Male Population of Magdalena?
Total Male Population of Magdalena is 401.
What is the Total Female Population of Magdalena?
Total Female Population of Magdalena is 390.
What is the Ratio of Males per 100 Females in Magdalena?
There are 102.82 Males per 100 Females in Magdalena.
What is the Ratio of Females per 100 Males in Magdalena?
There are 97.26 Females per 100 Males in Magdalena.
What is the Median Population Age in Magdalena?
Median Population Age in Magdalena is 62.2 Years.
What is the Average Family Size in Magdalena
Average Family Size in Magdalena is 2.8 People.
What is the Average Household Size in Magdalena
Average Household Size in Magdalena is 2.1 People.
How Large is the Labor Force in Magdalena?
There are 278 People in the Labor Forcein in Magdalena.
What is the Percentage of People in the Labor Force in Magdalena?
36.8% of People are in the Labor Force in Magdalena.