Lemitar, NM Map & Demographics
Lemitar Map
Lemitar Overview
$12,878
PER CAPITA INCOME
$78,707
AVG FAMILY INCOME
0.40
INEQUALITY / GINI INDEX
533
TOTAL POPULATION
181
MALE POPULATION
352
FEMALE POPULATION
51.42
MALES / 100 FEMALES
194.48
FEMALES / 100 MALES
47.1
MEDIAN AGE
4.4
AVG FAMILY SIZE
3.9
AVG HOUSEHOLD SIZE
131
LABOR FORCE [ PEOPLE ]
34.1%
PERCENT IN LABOR FORCE
Lemitar Zip Codes
Lemitar Area Codes
Income in Lemitar
Income Overview in Lemitar
| Characteristic | Number | Measure |
| Per Capita Income | 533 | $12,878 |
| Median Family Income | 116 | $78,707 |
| Mean Family Income | 116 | $61,375 |
| Median Household Income | 137 | $0 |
| Mean Household Income | 137 | $51,967 |
| Income Deficit | 116 | $0 |
| Wage / Income Gap (%) | 533 | 0.00% |
| Wage / Income Gap ($) | 533 | 100.00¢ per $1 |
| Gini / Inequality Index | 533 | 0.40 |
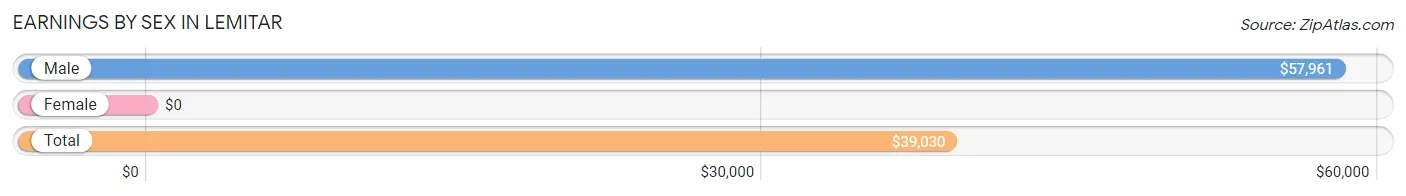
Earnings by Sex in Lemitar
| Sex | Number | Average Earnings |
| Male | 72 (55.0%) | $57,961 |
| Female | 59 (45.0%) | $0 |
| Total | 131 (100.0%) | $39,030 |
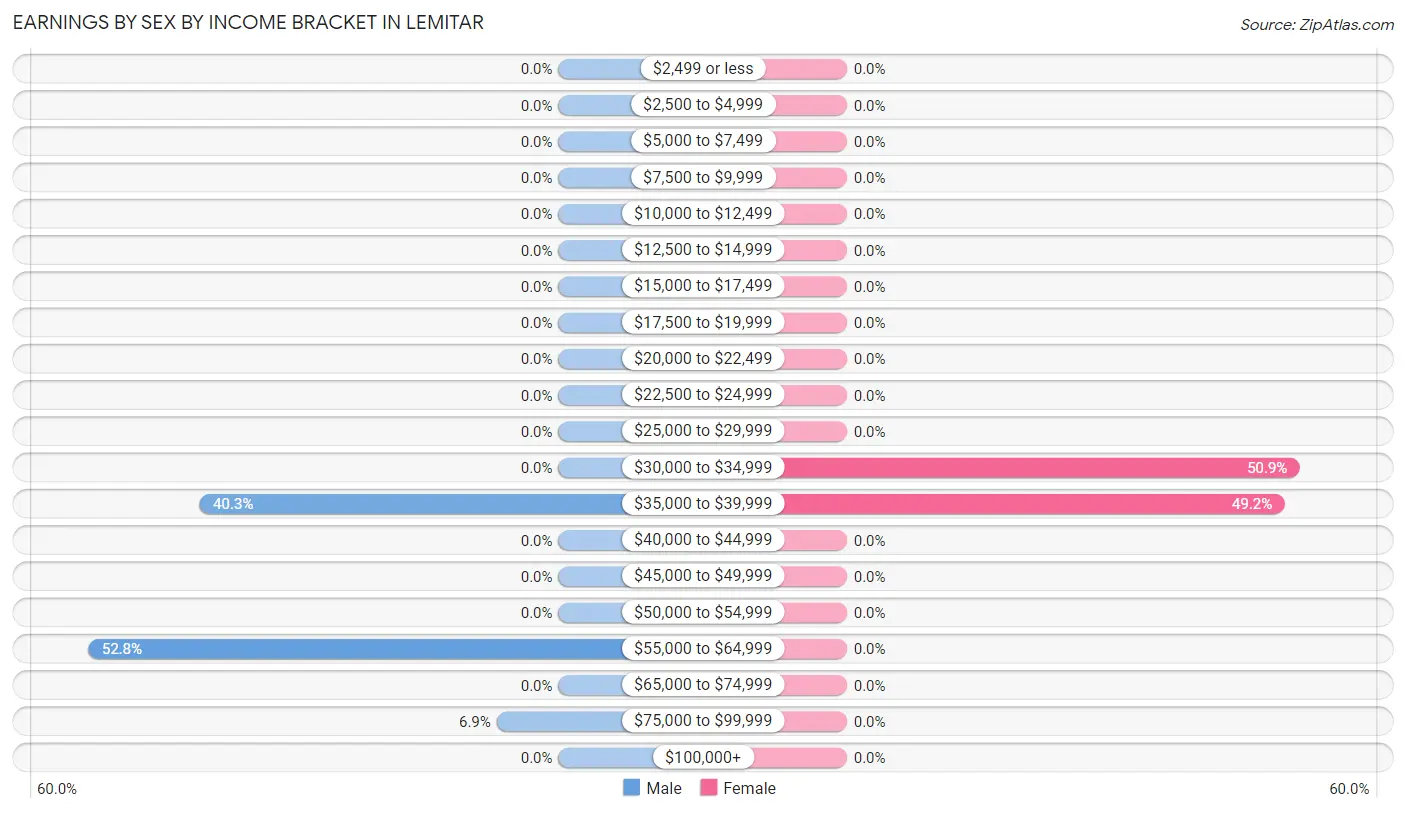
Earnings by Sex by Income Bracket in Lemitar
The most common earnings brackets in Lemitar are $55,000 to $64,999 for men (38 | 52.8%) and $30,000 to $34,999 for women (30 | 50.8%).
| Income | Male | Female |
| $2,499 or less | 0 (0.0%) | 0 (0.0%) |
| $2,500 to $4,999 | 0 (0.0%) | 0 (0.0%) |
| $5,000 to $7,499 | 0 (0.0%) | 0 (0.0%) |
| $7,500 to $9,999 | 0 (0.0%) | 0 (0.0%) |
| $10,000 to $12,499 | 0 (0.0%) | 0 (0.0%) |
| $12,500 to $14,999 | 0 (0.0%) | 0 (0.0%) |
| $15,000 to $17,499 | 0 (0.0%) | 0 (0.0%) |
| $17,500 to $19,999 | 0 (0.0%) | 0 (0.0%) |
| $20,000 to $22,499 | 0 (0.0%) | 0 (0.0%) |
| $22,500 to $24,999 | 0 (0.0%) | 0 (0.0%) |
| $25,000 to $29,999 | 0 (0.0%) | 0 (0.0%) |
| $30,000 to $34,999 | 0 (0.0%) | 30 (50.8%) |
| $35,000 to $39,999 | 29 (40.3%) | 29 (49.1%) |
| $40,000 to $44,999 | 0 (0.0%) | 0 (0.0%) |
| $45,000 to $49,999 | 0 (0.0%) | 0 (0.0%) |
| $50,000 to $54,999 | 0 (0.0%) | 0 (0.0%) |
| $55,000 to $64,999 | 38 (52.8%) | 0 (0.0%) |
| $65,000 to $74,999 | 0 (0.0%) | 0 (0.0%) |
| $75,000 to $99,999 | 5 (6.9%) | 0 (0.0%) |
| $100,000+ | 0 (0.0%) | 0 (0.0%) |
| Total | 72 (100.0%) | 59 (100.0%) |
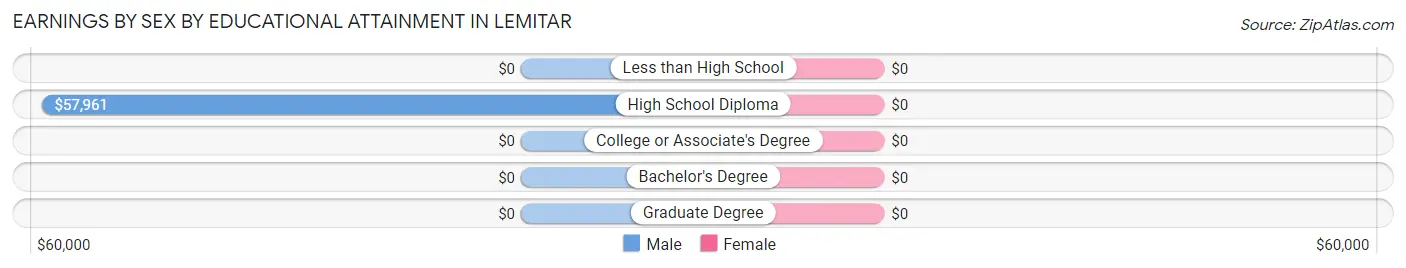
Earnings by Sex by Educational Attainment in Lemitar
| Educational Attainment | Male Income | Female Income |
| Less than High School | - | - |
| High School Diploma | $57,961 | $0 |
| College or Associate's Degree | - | - |
| Bachelor's Degree | - | - |
| Graduate Degree | - | - |
| Total | $57,961 | $0 |
Family Income in Lemitar
Family Income Brackets in Lemitar
According to the Lemitar family income data, there are 72 families falling into the $75,000 to $99,999 income range, which is the most common income bracket and makes up 62.1% of all families.
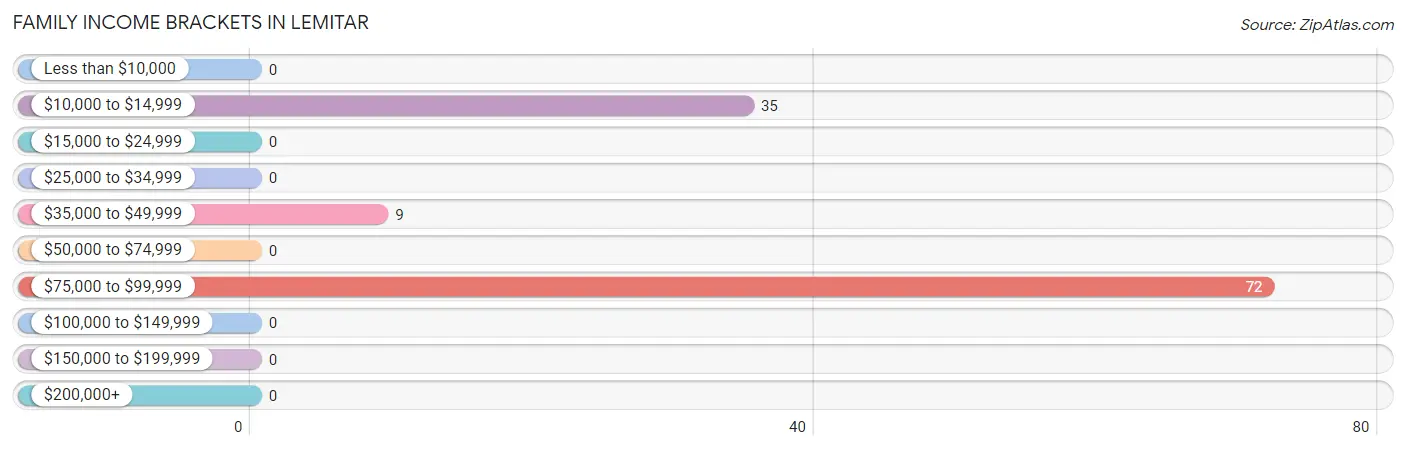
| Income Bracket | # Families | % Families |
| Less than $10,000 | 0 | 0.0% |
| $10,000 to $14,999 | 35 | 30.2% |
| $15,000 to $24,999 | 0 | 0.0% |
| $25,000 to $34,999 | 0 | 0.0% |
| $35,000 to $49,999 | 9 | 7.8% |
| $50,000 to $74,999 | 0 | 0.0% |
| $75,000 to $99,999 | 72 | 62.1% |
| $100,000 to $149,999 | 0 | 0.0% |
| $150,000 to $199,999 | 0 | 0.0% |
| $200,000+ | 0 | 0.0% |
Family Income by Famaliy Size in Lemitar
| Income Bracket | # Families | Median Income |
| 2-Person Families | 38 (32.8%) | $0 |
| 3-Person Families | 35 (30.2%) | $0 |
| 4-Person Families | 0 (0.0%) | $0 |
| 5-Person Families | 43 (37.1%) | $0 |
| 6-Person Families | 0 (0.0%) | $0 |
| 7+ Person Families | 0 (0.0%) | $0 |
| Total | 116 (100.0%) | $78,707 |
Family Income by Number of Earners in Lemitar
| Number of Earners | # Families | Median Income |
| No Earners | 44 (37.9%) | $0 |
| 1 Earner | 5 (4.3%) | $0 |
| 2 Earners | 67 (57.8%) | $0 |
| 3+ Earners | 0 (0.0%) | $0 |
| Total | 116 (100.0%) | $78,707 |
Household Income in Lemitar
Household Income Brackets in Lemitar
With 72 households falling in the category, the $75,000 to $99,999 income range is the most frequent in Lemitar, accounting for 52.5% of all households.
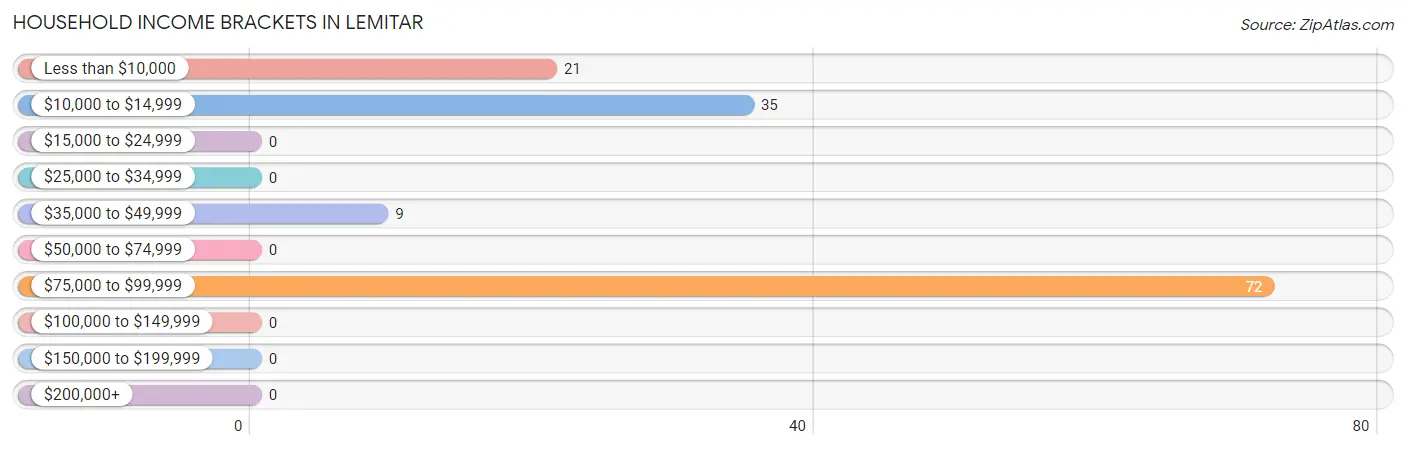
| Income Bracket | # Households | % Households |
| Less than $10,000 | 21 | 15.3% |
| $10,000 to $14,999 | 35 | 25.5% |
| $15,000 to $24,999 | 0 | 0.0% |
| $25,000 to $34,999 | 0 | 0.0% |
| $35,000 to $49,999 | 9 | 6.6% |
| $50,000 to $74,999 | 0 | 0.0% |
| $75,000 to $99,999 | 72 | 52.6% |
| $100,000 to $149,999 | 0 | 0.0% |
| $150,000 to $199,999 | 0 | 0.0% |
| $200,000+ | 0 | 0.0% |
Household Income by Householder Age in Lemitar
The median household income in Lemitar is $0, with the highest median household income of $92,632 found in the 25 to 44 years age bracket for the primary householder. A total of 72 households (52.5%) fall into this category.
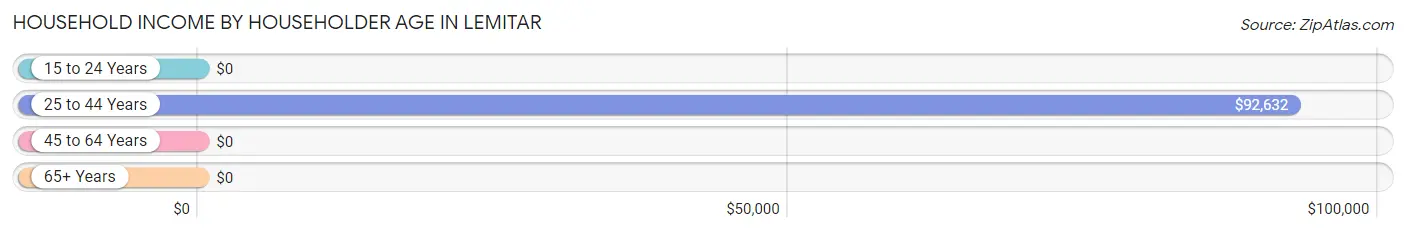
| Income Bracket | # Households | Median Income |
| 15 to 24 Years | 0 (0.0%) | $0 |
| 25 to 44 Years | 72 (52.5%) | $92,632 |
| 45 to 64 Years | 56 (40.9%) | $0 |
| 65+ Years | 9 (6.6%) | $0 |
| Total | 137 (100.0%) | $0 |
Poverty in Lemitar
Income Below Poverty by Sex and Age in Lemitar
With 30.9% poverty level for males and 49.1% for females among the residents of Lemitar, 45 to 54 year old males and 45 to 54 year old females are the most vulnerable to poverty, with 35 males (100.0%) and 173 females (85.6%) in their respective age groups living below the poverty level.
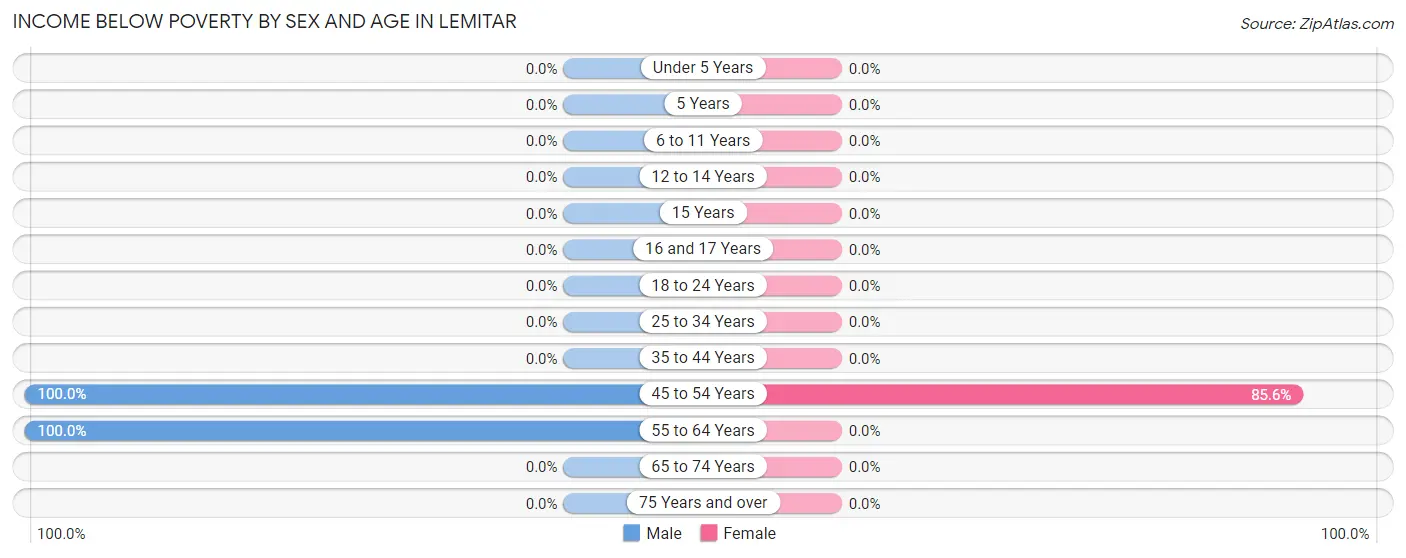
| Age Bracket | Male | Female |
| Under 5 Years | 0 (0.0%) | 0 (0.0%) |
| 5 Years | 0 (0.0%) | 0 (0.0%) |
| 6 to 11 Years | 0 (0.0%) | 0 (0.0%) |
| 12 to 14 Years | 0 (0.0%) | 0 (0.0%) |
| 15 Years | 0 (0.0%) | 0 (0.0%) |
| 16 and 17 Years | 0 (0.0%) | 0 (0.0%) |
| 18 to 24 Years | 0 (0.0%) | 0 (0.0%) |
| 25 to 34 Years | 0 (0.0%) | 0 (0.0%) |
| 35 to 44 Years | 0 (0.0%) | 0 (0.0%) |
| 45 to 54 Years | 35 (100.0%) | 173 (85.6%) |
| 55 to 64 Years | 21 (100.0%) | 0 (0.0%) |
| 65 to 74 Years | 0 (0.0%) | 0 (0.0%) |
| 75 Years and over | 0 (0.0%) | 0 (0.0%) |
| Total | 56 (30.9%) | 173 (49.1%) |
Income Above Poverty by Sex and Age in Lemitar
According to the poverty statistics in Lemitar, males aged under 5 years and females aged 6 to 11 years are the age groups that are most secure financially, with 100.0% of males and 100.0% of females in these age groups living above the poverty line.
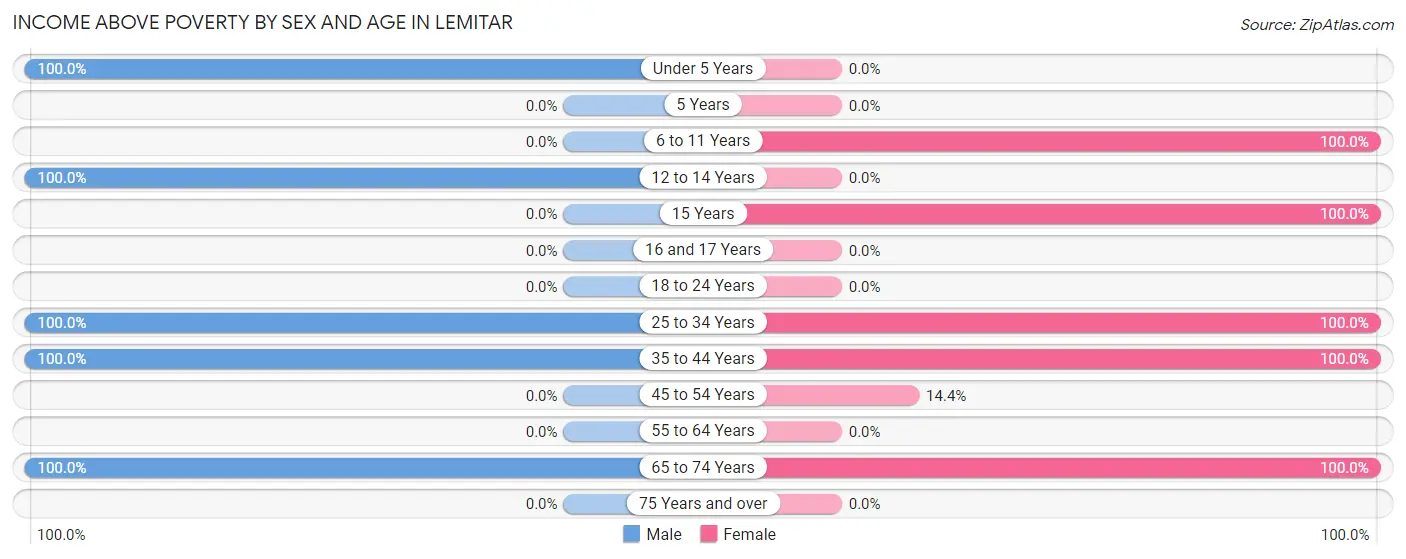
| Age Bracket | Male | Female |
| Under 5 Years | 39 (100.0%) | 0 (0.0%) |
| 5 Years | 0 (0.0%) | 0 (0.0%) |
| 6 to 11 Years | 0 (0.0%) | 59 (100.0%) |
| 12 to 14 Years | 4 (100.0%) | 0 (0.0%) |
| 15 Years | 0 (0.0%) | 47 (100.0%) |
| 16 and 17 Years | 0 (0.0%) | 0 (0.0%) |
| 18 to 24 Years | 0 (0.0%) | 0 (0.0%) |
| 25 to 34 Years | 38 (100.0%) | 30 (100.0%) |
| 35 to 44 Years | 34 (100.0%) | 5 (100.0%) |
| 45 to 54 Years | 0 (0.0%) | 29 (14.4%) |
| 55 to 64 Years | 0 (0.0%) | 0 (0.0%) |
| 65 to 74 Years | 10 (100.0%) | 9 (100.0%) |
| 75 Years and over | 0 (0.0%) | 0 (0.0%) |
| Total | 125 (69.1%) | 179 (50.8%) |
Income Below Poverty Among Married-Couple Families in Lemitar
The poverty statistics for married-couple families in Lemitar show that 30.2% or 35 of the total 116 families live below the poverty line. Families with no children have the highest poverty rate of 47.9%, comprising of 35 families. On the other hand, families with 3 or 4 children have the lowest poverty rate of 0.0%, which includes 0 families.
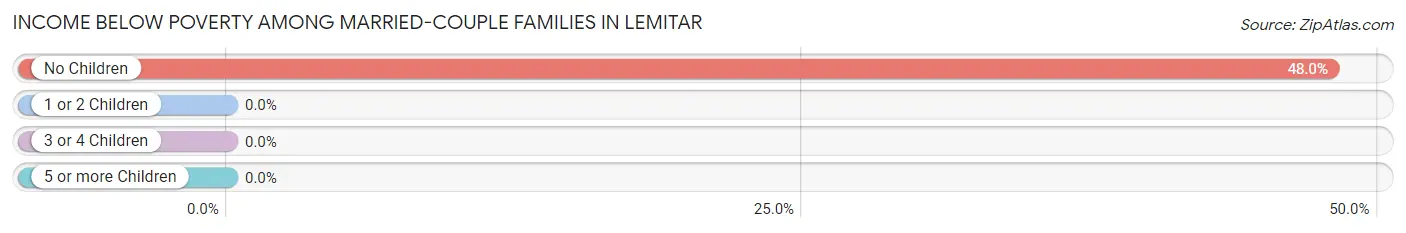
| Children | Above Poverty | Below Poverty |
| No Children | 38 (52.0%) | 35 (47.9%) |
| 1 or 2 Children | 0 (0.0%) | 0 (0.0%) |
| 3 or 4 Children | 43 (100.0%) | 0 (0.0%) |
| 5 or more Children | 0 (0.0%) | 0 (0.0%) |
| Total | 81 (69.8%) | 35 (30.2%) |
Income Below Poverty Among Single-Parent Households in Lemitar
| Children | Single Father | Single Mother |
| No Children | 0 (0.0%) | 0 (0.0%) |
| 1 or 2 Children | 0 (0.0%) | 0 (0.0%) |
| 3 or 4 Children | 0 (0.0%) | 0 (0.0%) |
| 5 or more Children | 0 (0.0%) | 0 (0.0%) |
| Total | 0 (0.0%) | 0 (0.0%) |
Income Below Poverty Among Married-Couple vs Single-Parent Households in Lemitar
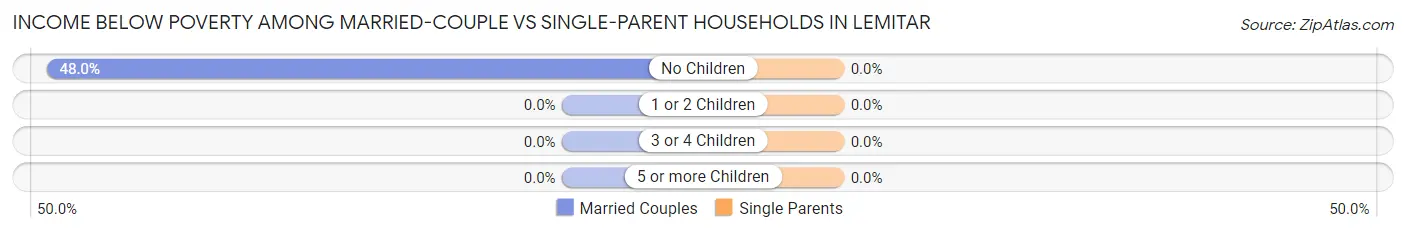
| Children | Married-Couple Families | Single-Parent Households |
| No Children | 35 (47.9%) | 0 (0.0%) |
| 1 or 2 Children | 0 (0.0%) | 0 (0.0%) |
| 3 or 4 Children | 0 (0.0%) | 0 (0.0%) |
| 5 or more Children | 0 (0.0%) | 0 (0.0%) |
| Total | 35 (30.2%) | 0 (0.0%) |
Race in Lemitar
The most populous races in Lemitar are Hispanic or Latino (493 | 92.5%), White / Caucasian (475 | 89.1%), and Some other Race (58 | 10.9%).
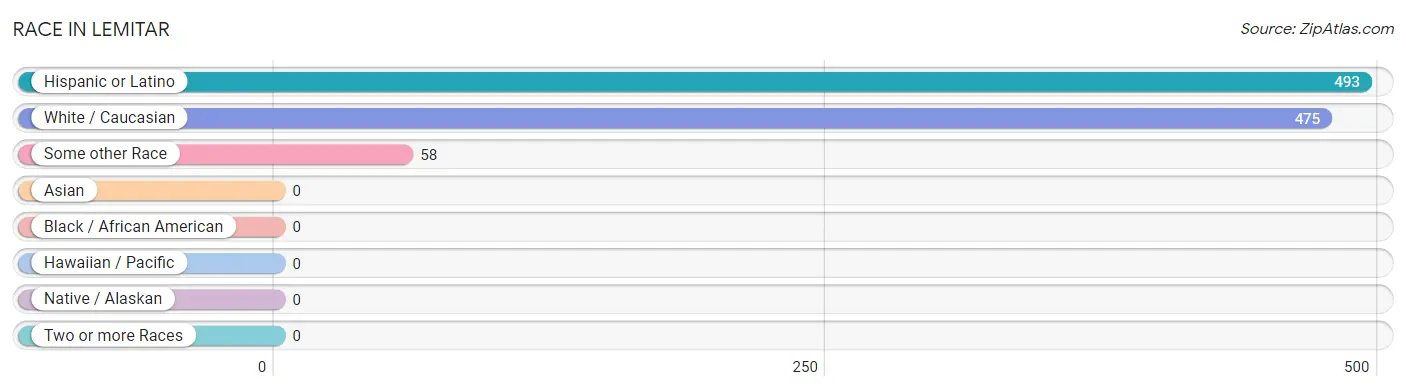
| Race | # Population | % Population |
| Asian | 0 | 0.0% |
| Black / African American | 0 | 0.0% |
| Hawaiian / Pacific | 0 | 0.0% |
| Hispanic or Latino | 493 | 92.5% |
| Native / Alaskan | 0 | 0.0% |
| White / Caucasian | 475 | 89.1% |
| Two or more Races | 0 | 0.0% |
| Some other Race | 58 | 10.9% |
| Total | 533 | 100.0% |
Ancestry in Lemitar
The most populous ancestries reported in Lemitar are American (173 | 32.5%), Mexican (58 | 10.9%), French Canadian (10 | 1.9%), and Irish (9 | 1.7%), together accounting for 46.9% of all Lemitar residents.
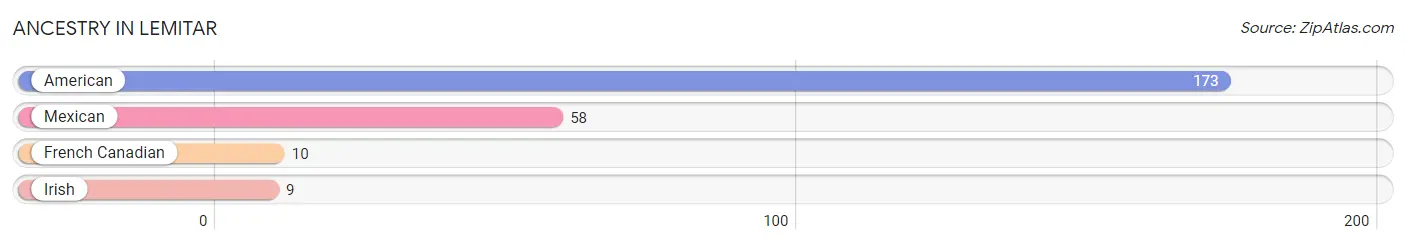
| Ancestry | # Population | % Population |
| American | 173 | 32.5% |
| French Canadian | 10 | 1.9% |
| Irish | 9 | 1.7% |
| Mexican | 58 | 10.9% | View All 4 Rows |
Immigrants in Lemitar
The most numerous immigrant groups reported in Lemitar came from Central America (35 | 6.6%), Latin America (35 | 6.6%), and Mexico (35 | 6.6%), together accounting for 19.7% of all Lemitar residents.
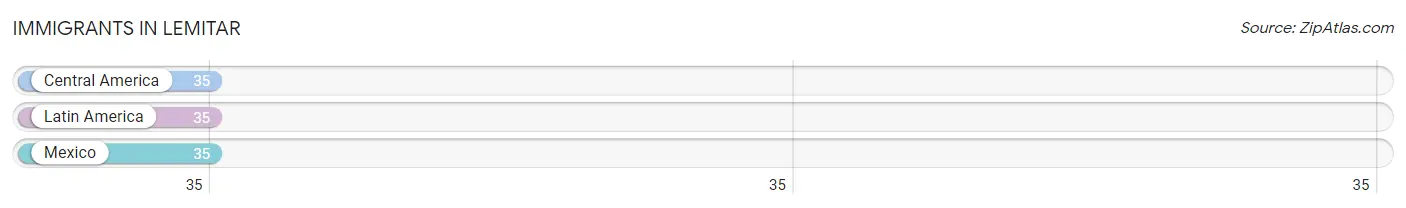
| Immigration Origin | # Population | % Population |
| Central America | 35 | 6.6% |
| Latin America | 35 | 6.6% |
| Mexico | 35 | 6.6% | View All 3 Rows |
Sex and Age in Lemitar
Sex and Age in Lemitar
The most populous age groups in Lemitar are Under 5 Years (39 | 21.5%) for men and 45 to 49 Years (167 | 47.4%) for women.
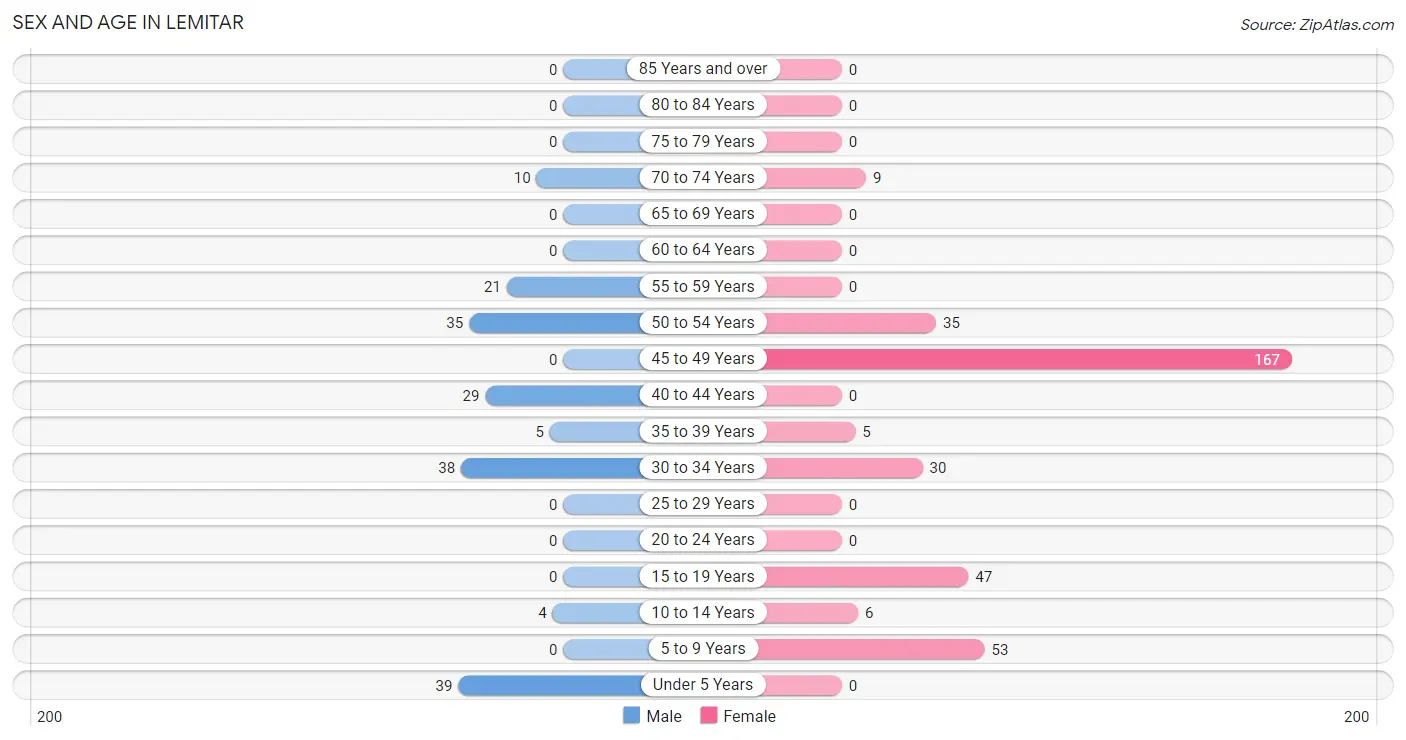
| Age Bracket | Male | Female |
| Under 5 Years | 39 (21.5%) | 0 (0.0%) |
| 5 to 9 Years | 0 (0.0%) | 53 (15.1%) |
| 10 to 14 Years | 4 (2.2%) | 6 (1.7%) |
| 15 to 19 Years | 0 (0.0%) | 47 (13.4%) |
| 20 to 24 Years | 0 (0.0%) | 0 (0.0%) |
| 25 to 29 Years | 0 (0.0%) | 0 (0.0%) |
| 30 to 34 Years | 38 (21.0%) | 30 (8.5%) |
| 35 to 39 Years | 5 (2.8%) | 5 (1.4%) |
| 40 to 44 Years | 29 (16.0%) | 0 (0.0%) |
| 45 to 49 Years | 0 (0.0%) | 167 (47.4%) |
| 50 to 54 Years | 35 (19.3%) | 35 (9.9%) |
| 55 to 59 Years | 21 (11.6%) | 0 (0.0%) |
| 60 to 64 Years | 0 (0.0%) | 0 (0.0%) |
| 65 to 69 Years | 0 (0.0%) | 0 (0.0%) |
| 70 to 74 Years | 10 (5.5%) | 9 (2.6%) |
| 75 to 79 Years | 0 (0.0%) | 0 (0.0%) |
| 80 to 84 Years | 0 (0.0%) | 0 (0.0%) |
| 85 Years and over | 0 (0.0%) | 0 (0.0%) |
| Total | 181 (100.0%) | 352 (100.0%) |
Families and Households in Lemitar
Median Family Size in Lemitar
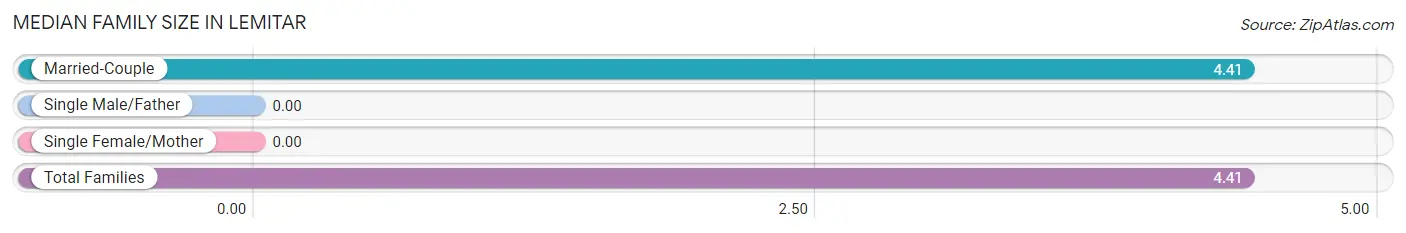
| Family Type | # Families | Family Size |
| Married-Couple | 116 (100.0%) | 4.41 |
| Single Male/Father | 0 (0.0%) | - |
| Single Female/Mother | 0 (0.0%) | - |
| Total Families | 116 (100.0%) | 4.41 |
Median Household Size in Lemitar
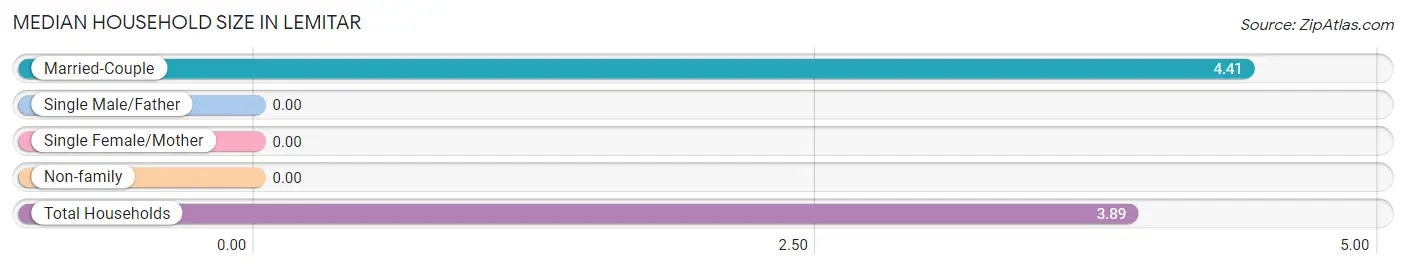
| Household Type | # Households | Household Size |
| Married-Couple | 116 (84.7%) | 4.41 |
| Single Male/Father | 0 (0.0%) | - |
| Single Female/Mother | 0 (0.0%) | - |
| Non-family | 21 (15.3%) | - |
| Total Households | 137 (100.0%) | 3.89 |
Household Size by Marriage Status in Lemitar
Out of a total of 137 households in Lemitar, 116 (84.7%) are family households, while 21 (15.3%) are nonfamily households. The most numerous type of family households are 5-person households, comprising 43, and the most common type of nonfamily households are 1-person households, comprising 21.
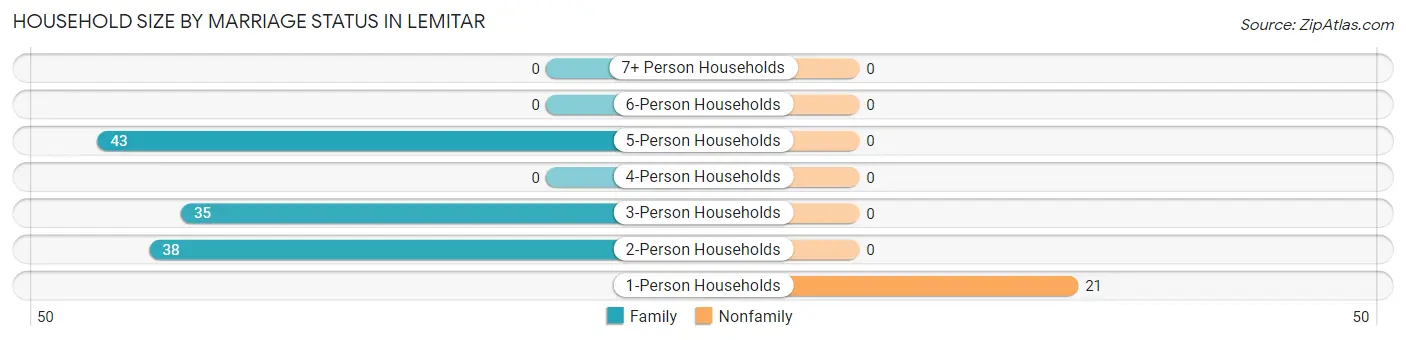
| Household Size | Family Households | Nonfamily Households |
| 1-Person Households | - | 21 (15.3%) |
| 2-Person Households | 38 (27.7%) | 0 (0.0%) |
| 3-Person Households | 35 (25.6%) | 0 (0.0%) |
| 4-Person Households | 0 (0.0%) | 0 (0.0%) |
| 5-Person Households | 43 (31.4%) | 0 (0.0%) |
| 6-Person Households | 0 (0.0%) | 0 (0.0%) |
| 7+ Person Households | 0 (0.0%) | 0 (0.0%) |
| Total | 116 (84.7%) | 21 (15.3%) |
Female Fertility in Lemitar
Fertility by Age in Lemitar
| Age Bracket | Women with Births | Births / 1,000 Women |
| 15 to 19 years | 0 (0.0%) | 0.0 |
| 20 to 34 years | 0 (0.0%) | 0.0 |
| 35 to 50 years | 0 (0.0%) | 0.0 |
| Total | 0 (0.0%) | 0.0 |
Fertility by Age by Marriage Status in Lemitar
| Age Bracket | Married | Unmarried |
| 15 to 19 years | 0 (0.0%) | 0 (0.0%) |
| 20 to 34 years | 0 (0.0%) | 0 (0.0%) |
| 35 to 50 years | 0 (0.0%) | 0 (0.0%) |
| Total | 0 (0.0%) | 0 (0.0%) |
Fertility by Education in Lemitar
| Educational Attainment | Women with Births | Births / 1,000 Women |
| Less than High School | 0 (0.0%) | 0.0 |
| High School Diploma | 0 (0.0%) | 0.0 |
| College or Associate's Degree | 0 (0.0%) | 0.0 |
| Bachelor's Degree | 0 (0.0%) | 0.0 |
| Graduate Degree | 0 (0.0%) | 0.0 |
| Total | 0 (0.0%) | 0.0 |
Fertility by Education by Marriage Status in Lemitar
| Educational Attainment | Married | Unmarried |
| Less than High School | 0 (0.0%) | 0 (0.0%) |
| High School Diploma | 0 (0.0%) | 0 (0.0%) |
| College or Associate's Degree | 0 (0.0%) | 0 (0.0%) |
| Bachelor's Degree | 0 (0.0%) | 0 (0.0%) |
| Graduate Degree | 0 (0.0%) | 0 (0.0%) |
| Total | 0 (0.0%) | 0 (0.0%) |
Employment Characteristics in Lemitar
Employment by Class of Employer in Lemitar
Among the 131 employed individuals in Lemitar, local government employees (58 | 44.3%), self-employed (not incorporated) (38 | 29.0%), and private company employees (35 | 26.7%) make up the most common classes of employment.
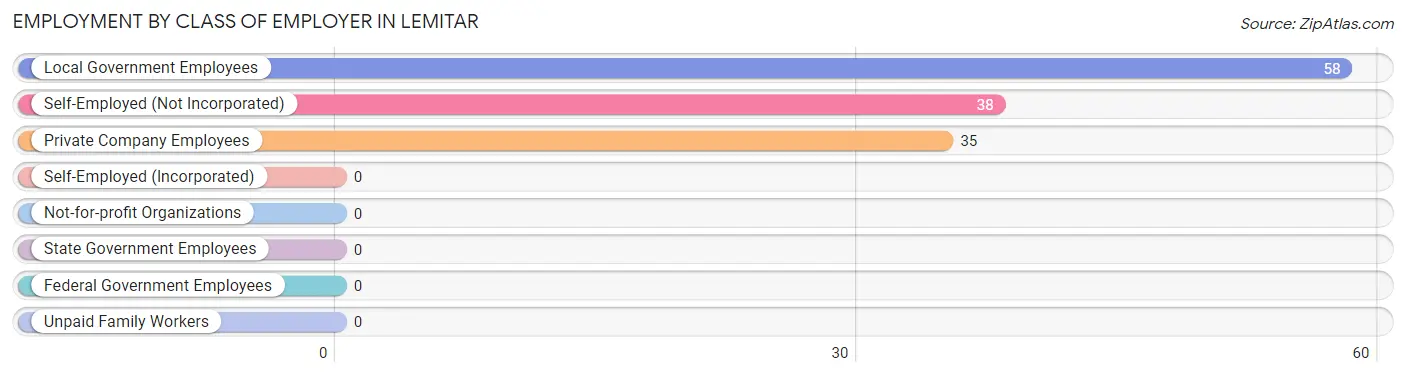
| Employer Class | # Employees | % Employees |
| Private Company Employees | 35 | 26.7% |
| Self-Employed (Incorporated) | 0 | 0.0% |
| Self-Employed (Not Incorporated) | 38 | 29.0% |
| Not-for-profit Organizations | 0 | 0.0% |
| Local Government Employees | 58 | 44.3% |
| State Government Employees | 0 | 0.0% |
| Federal Government Employees | 0 | 0.0% |
| Unpaid Family Workers | 0 | 0.0% |
| Total | 131 | 100.0% |
Employment Status by Age in Lemitar
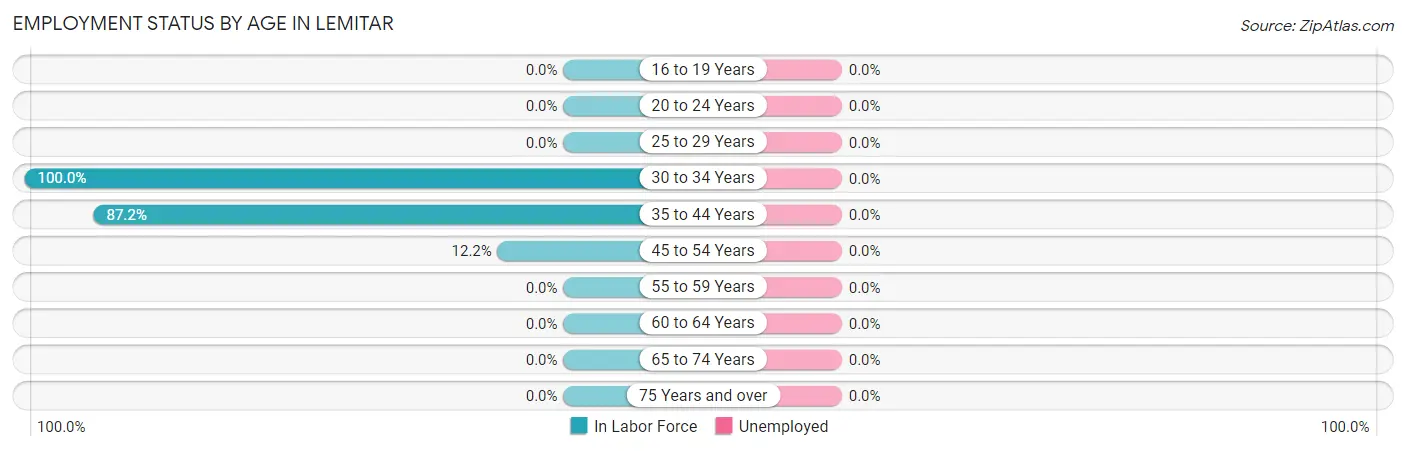
| Age Bracket | In Labor Force | Unemployed |
| 16 to 19 Years | 0 (0.0%) | 0 (0.0%) |
| 20 to 24 Years | 0 (0.0%) | 0 (0.0%) |
| 25 to 29 Years | 0 (0.0%) | 0 (0.0%) |
| 30 to 34 Years | 68 (100.0%) | 0 (0.0%) |
| 35 to 44 Years | 34 (87.2%) | 0 (0.0%) |
| 45 to 54 Years | 29 (12.2%) | 0 (0.0%) |
| 55 to 59 Years | 0 (0.0%) | 0 (0.0%) |
| 60 to 64 Years | 0 (0.0%) | 0 (0.0%) |
| 65 to 74 Years | 0 (0.0%) | 0 (0.0%) |
| 75 Years and over | 0 (0.0%) | 0 (0.0%) |
| Total | 131 (34.1%) | 0 (0.0%) |
Employment Status by Educational Attainment in Lemitar
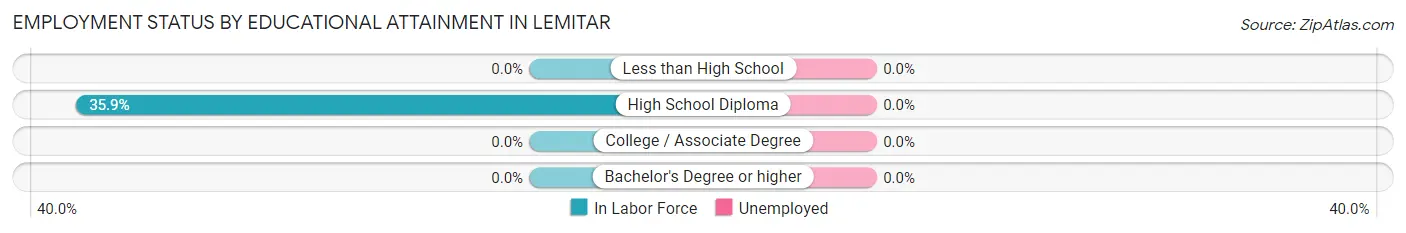
| Educational Attainment | In Labor Force | Unemployed |
| Less than High School | 0 (0.0%) | 0 (0.0%) |
| High School Diploma | 131 (35.9%) | 0 (0.0%) |
| College / Associate Degree | 0 (0.0%) | 0 (0.0%) |
| Bachelor's Degree or higher | 0 (0.0%) | 0 (0.0%) |
| Total | 131 (35.9%) | 0 (0.0%) |
Employment Occupations by Sex in Lemitar
Management, Business, Science and Arts Occupations
Management, Business, Science and Arts Occupations by Sex
| Occupation | Male | Female |
| Management | 0 (0.0%) | 0 (0.0%) |
| Business & Financial | 0 (0.0%) | 0 (0.0%) |
| Computers, Engineering & Science | 0 (0.0%) | 0 (0.0%) |
| Computers & Mathematics | 0 (0.0%) | 0 (0.0%) |
| Architecture & Engineering | 0 (0.0%) | 0 (0.0%) |
| Life, Physical & Social Science | 0 (0.0%) | 0 (0.0%) |
| Community & Social Service | 0 (0.0%) | 0 (0.0%) |
| Education, Arts & Media | 0 (0.0%) | 0 (0.0%) |
| Legal Services & Support | 0 (0.0%) | 0 (0.0%) |
| Education Instruction & Library | 0 (0.0%) | 0 (0.0%) |
| Arts, Media & Entertainment | 0 (0.0%) | 0 (0.0%) |
| Health Diagnosing & Treating | 0 (0.0%) | 0 (0.0%) |
| Health Technologists | 0 (0.0%) | 0 (0.0%) |
| Total (Category) | 0 (0.0%) | 0 (0.0%) |
| Total (Overall) | 72 (55.0%) | 59 (45.0%) |
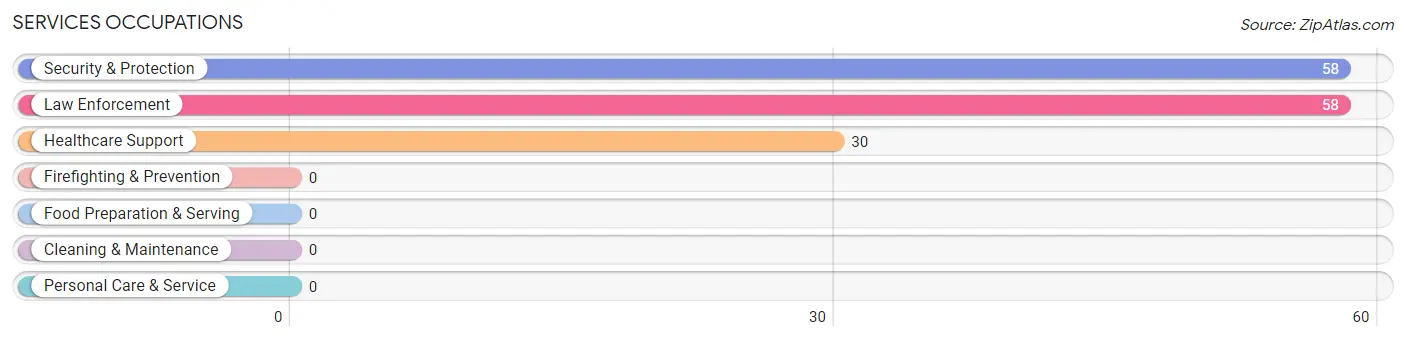
Services Occupations
The most common Services occupations in Lemitar are Security & Protection (58 | 44.3%), Law Enforcement (58 | 44.3%), and Healthcare Support (30 | 22.9%).
Services Occupations by Sex
Within the Services occupations in Lemitar, the most male-oriented occupations are Security & Protection (50.0%), and Law Enforcement (50.0%), while the most female-oriented occupations are Healthcare Support (100.0%), Security & Protection (50.0%), and Law Enforcement (50.0%).
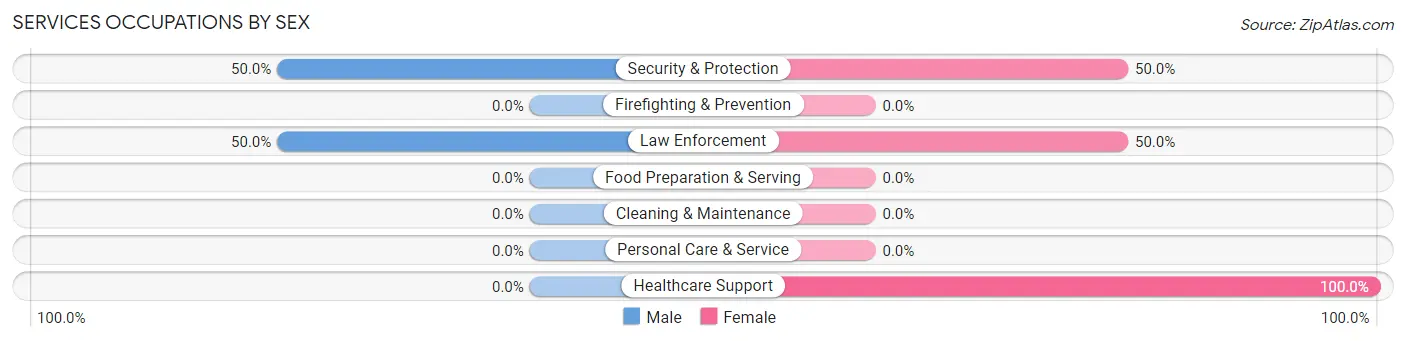
| Occupation | Male | Female |
| Healthcare Support | 0 (0.0%) | 30 (100.0%) |
| Security & Protection | 29 (50.0%) | 29 (50.0%) |
| Firefighting & Prevention | 0 (0.0%) | 0 (0.0%) |
| Law Enforcement | 29 (50.0%) | 29 (50.0%) |
| Food Preparation & Serving | 0 (0.0%) | 0 (0.0%) |
| Cleaning & Maintenance | 0 (0.0%) | 0 (0.0%) |
| Personal Care & Service | 0 (0.0%) | 0 (0.0%) |
| Total (Category) | 29 (33.0%) | 59 (67.0%) |
| Total (Overall) | 72 (55.0%) | 59 (45.0%) |
Sales and Office Occupations
Sales and Office Occupations by Sex
| Occupation | Male | Female |
| Sales & Related | 0 (0.0%) | 0 (0.0%) |
| Office & Administration | 0 (0.0%) | 0 (0.0%) |
| Total (Category) | 0 (0.0%) | 0 (0.0%) |
| Total (Overall) | 72 (55.0%) | 59 (45.0%) |
Natural Resources, Construction and Maintenance Occupations
The most common Natural Resources, Construction and Maintenance occupations in Lemitar are , and Installation, Maintenance & Repair (5 | 3.8%).
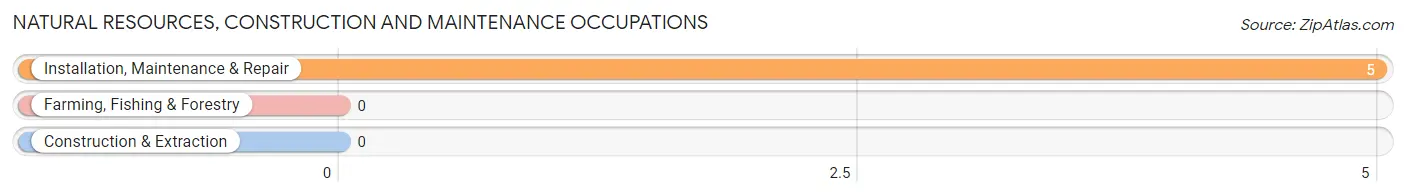
Natural Resources, Construction and Maintenance Occupations by Sex
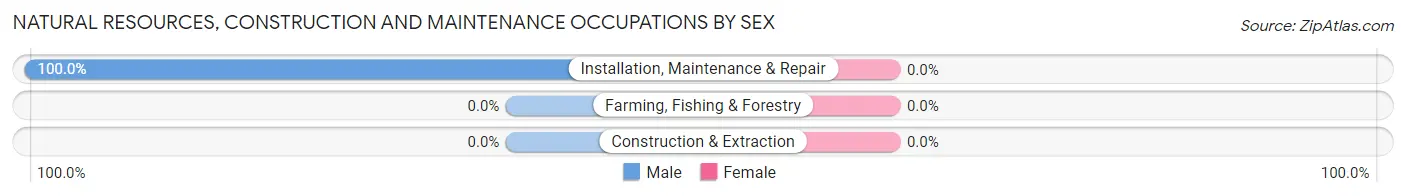
| Occupation | Male | Female |
| Farming, Fishing & Forestry | 0 (0.0%) | 0 (0.0%) |
| Construction & Extraction | 0 (0.0%) | 0 (0.0%) |
| Installation, Maintenance & Repair | 5 (100.0%) | 0 (0.0%) |
| Total (Category) | 5 (100.0%) | 0 (0.0%) |
| Total (Overall) | 72 (55.0%) | 59 (45.0%) |
Production, Transportation and Moving Occupations
The most common Production, Transportation and Moving occupations in Lemitar are , and Transportation (38 | 29.0%).
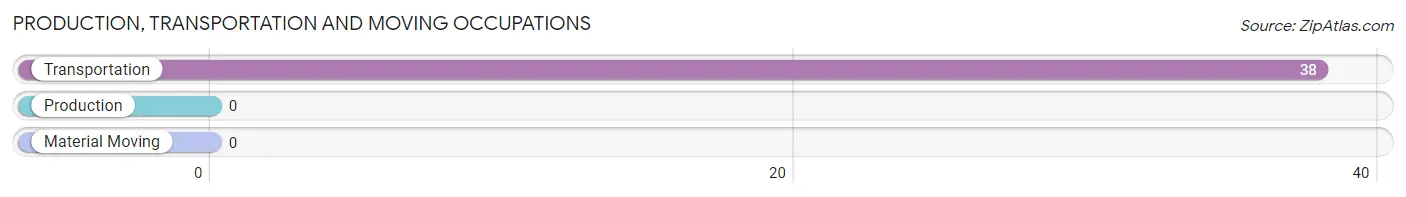
Production, Transportation and Moving Occupations by Sex
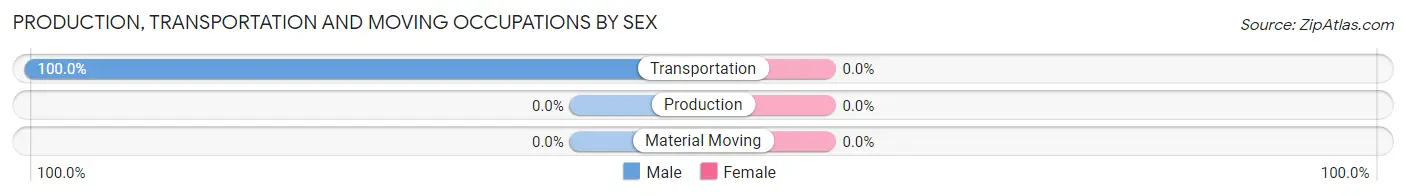
| Occupation | Male | Female |
| Production | 0 (0.0%) | 0 (0.0%) |
| Transportation | 38 (100.0%) | 0 (0.0%) |
| Material Moving | 0 (0.0%) | 0 (0.0%) |
| Total (Category) | 38 (100.0%) | 0 (0.0%) |
| Total (Overall) | 72 (55.0%) | 59 (45.0%) |
Employment Industries by Sex in Lemitar
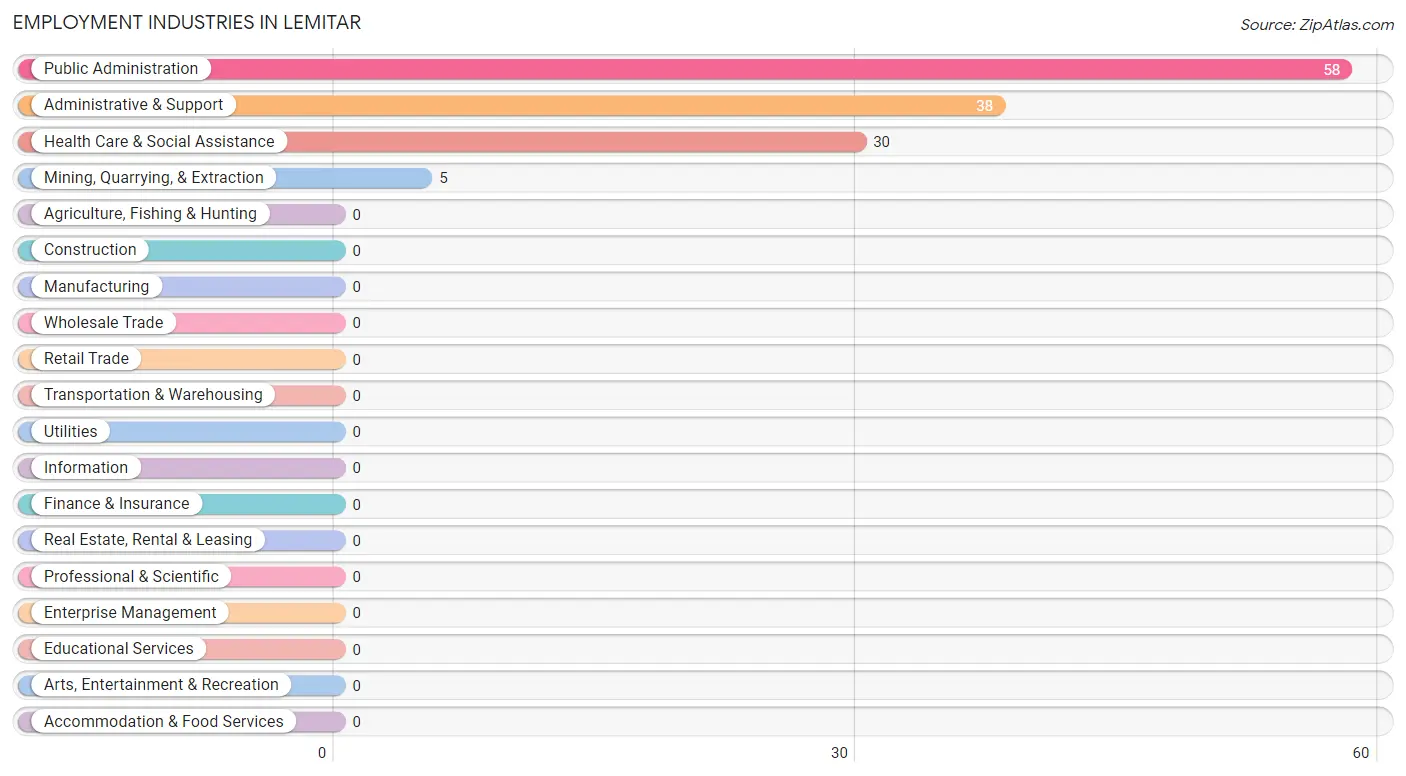
Employment Industries in Lemitar
The major employment industries in Lemitar include Public Administration (58 | 44.3%), Administrative & Support (38 | 29.0%), Health Care & Social Assistance (30 | 22.9%), and Mining, Quarrying, & Extraction (5 | 3.8%).
Employment Industries by Sex in Lemitar
The Lemitar industries that see more men than women are Mining, Quarrying, & Extraction (100.0%), Administrative & Support (100.0%), and Public Administration (50.0%), whereas the industries that tend to have a higher number of women are Health Care & Social Assistance (100.0%), and Public Administration (50.0%).
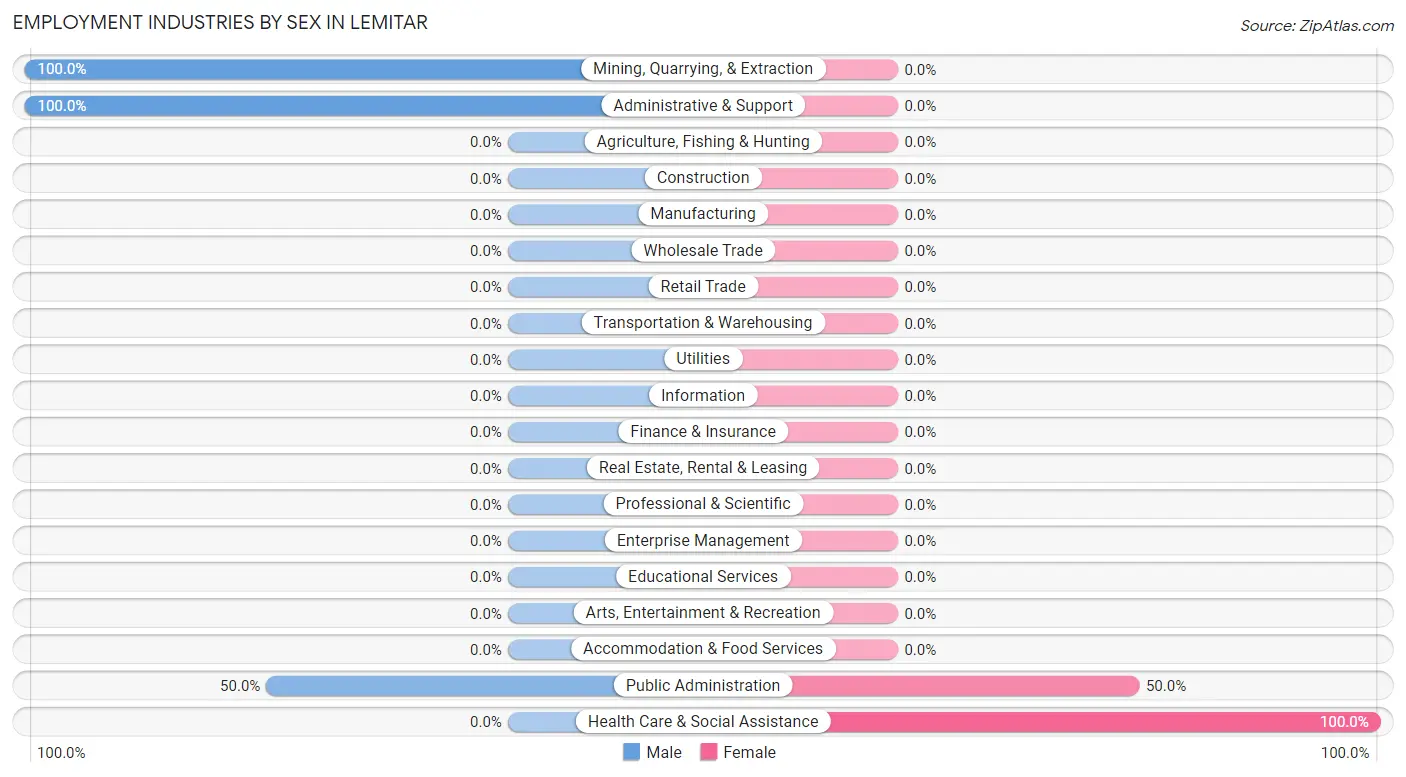
| Industry | Male | Female |
| Agriculture, Fishing & Hunting | 0 (0.0%) | 0 (0.0%) |
| Mining, Quarrying, & Extraction | 5 (100.0%) | 0 (0.0%) |
| Construction | 0 (0.0%) | 0 (0.0%) |
| Manufacturing | 0 (0.0%) | 0 (0.0%) |
| Wholesale Trade | 0 (0.0%) | 0 (0.0%) |
| Retail Trade | 0 (0.0%) | 0 (0.0%) |
| Transportation & Warehousing | 0 (0.0%) | 0 (0.0%) |
| Utilities | 0 (0.0%) | 0 (0.0%) |
| Information | 0 (0.0%) | 0 (0.0%) |
| Finance & Insurance | 0 (0.0%) | 0 (0.0%) |
| Real Estate, Rental & Leasing | 0 (0.0%) | 0 (0.0%) |
| Professional & Scientific | 0 (0.0%) | 0 (0.0%) |
| Enterprise Management | 0 (0.0%) | 0 (0.0%) |
| Administrative & Support | 38 (100.0%) | 0 (0.0%) |
| Educational Services | 0 (0.0%) | 0 (0.0%) |
| Health Care & Social Assistance | 0 (0.0%) | 30 (100.0%) |
| Arts, Entertainment & Recreation | 0 (0.0%) | 0 (0.0%) |
| Accommodation & Food Services | 0 (0.0%) | 0 (0.0%) |
| Public Administration | 29 (50.0%) | 29 (50.0%) |
| Total | 72 (55.0%) | 59 (45.0%) |
Education in Lemitar
School Enrollment in Lemitar
The most common levels of schooling among the 110 students in Lemitar are high school (51 | 46.4%), elementary school (47 | 42.7%), and middle school (12 | 10.9%).
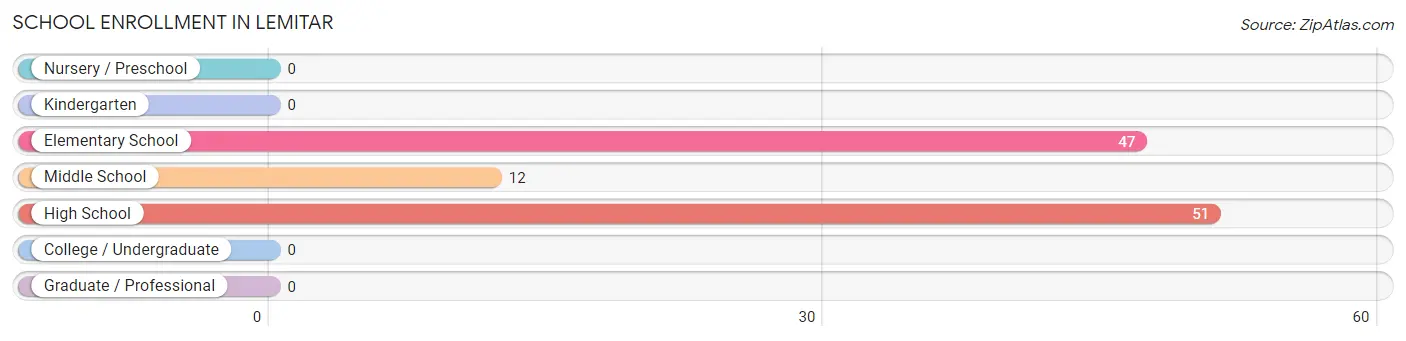
| School Level | # Students | % Students |
| Nursery / Preschool | 0 | 0.0% |
| Kindergarten | 0 | 0.0% |
| Elementary School | 47 | 42.7% |
| Middle School | 12 | 10.9% |
| High School | 51 | 46.4% |
| College / Undergraduate | 0 | 0.0% |
| Graduate / Professional | 0 | 0.0% |
| Total | 110 | 100.0% |
School Enrollment by Age by Funding Source in Lemitar
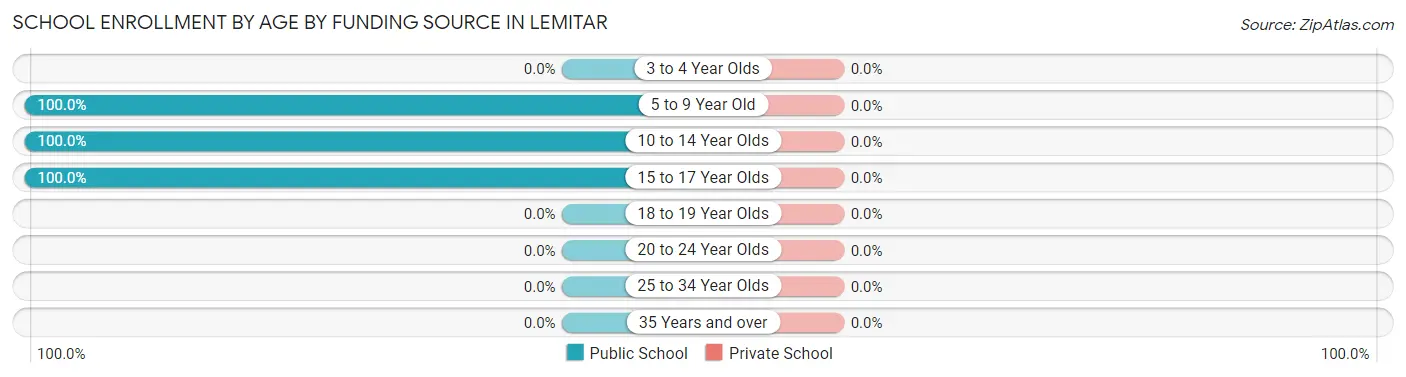
| Age Bracket | Public School | Private School |
| 3 to 4 Year Olds | 0 (0.0%) | 0 (0.0%) |
| 5 to 9 Year Old | 53 (100.0%) | 0 (0.0%) |
| 10 to 14 Year Olds | 10 (100.0%) | 0 (0.0%) |
| 15 to 17 Year Olds | 47 (100.0%) | 0 (0.0%) |
| 18 to 19 Year Olds | 0 (0.0%) | 0 (0.0%) |
| 20 to 24 Year Olds | 0 (0.0%) | 0 (0.0%) |
| 25 to 34 Year Olds | 0 (0.0%) | 0 (0.0%) |
| 35 Years and over | 0 (0.0%) | 0 (0.0%) |
| Total | 110 (100.0%) | 0 (0.0%) |
Educational Attainment by Field of Study in Lemitar
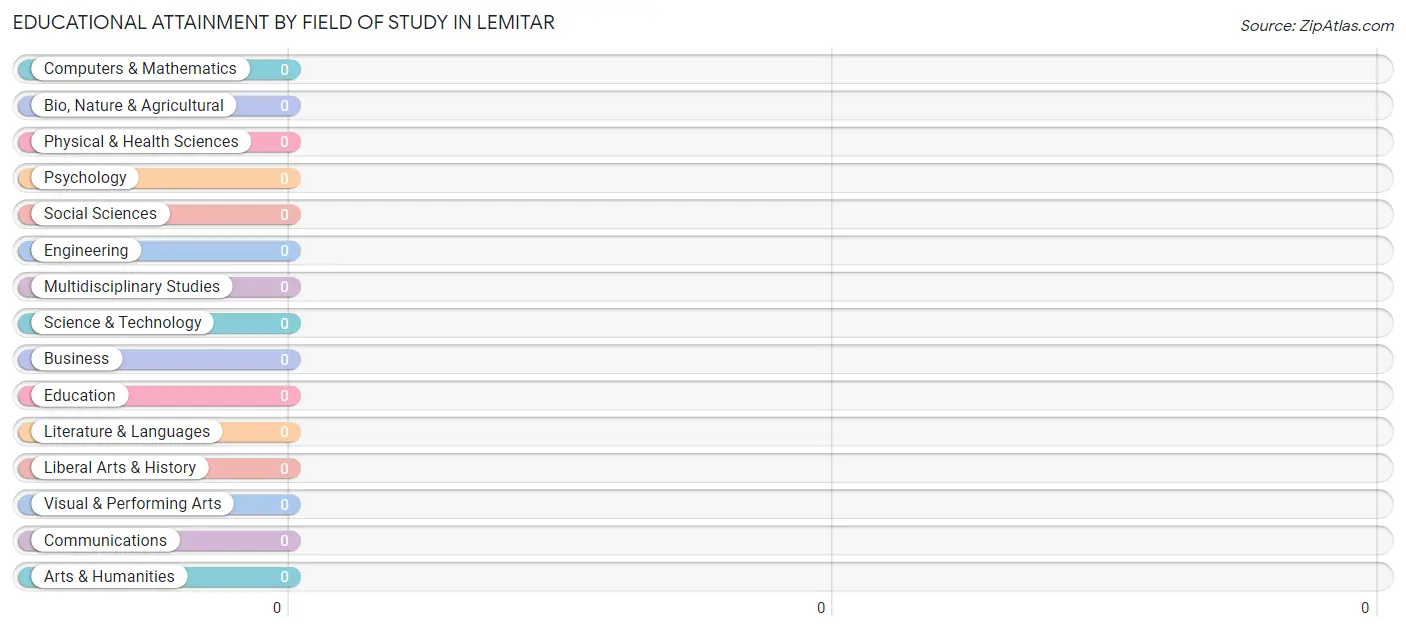
| Field of Study | # Graduates | % Graduates |
| Computers & Mathematics | 0 | 0.0% |
| Bio, Nature & Agricultural | 0 | 0.0% |
| Physical & Health Sciences | 0 | 0.0% |
| Psychology | 0 | 0.0% |
| Social Sciences | 0 | 0.0% |
| Engineering | 0 | 0.0% |
| Multidisciplinary Studies | 0 | 0.0% |
| Science & Technology | 0 | 0.0% |
| Business | 0 | 0.0% |
| Education | 0 | 0.0% |
| Literature & Languages | 0 | 0.0% |
| Liberal Arts & History | 0 | 0.0% |
| Visual & Performing Arts | 0 | 0.0% |
| Communications | 0 | 0.0% |
| Arts & Humanities | 0 | 0.0% |
| Total | 0 | 0.0% |
Transportation & Commute in Lemitar
Vehicle Availability by Sex in Lemitar
The most prevalent vehicle ownership categories in Lemitar are males with 3 vehicles (38, accounting for 52.8%) and females with 3 vehicles (30, making up 64.4%).
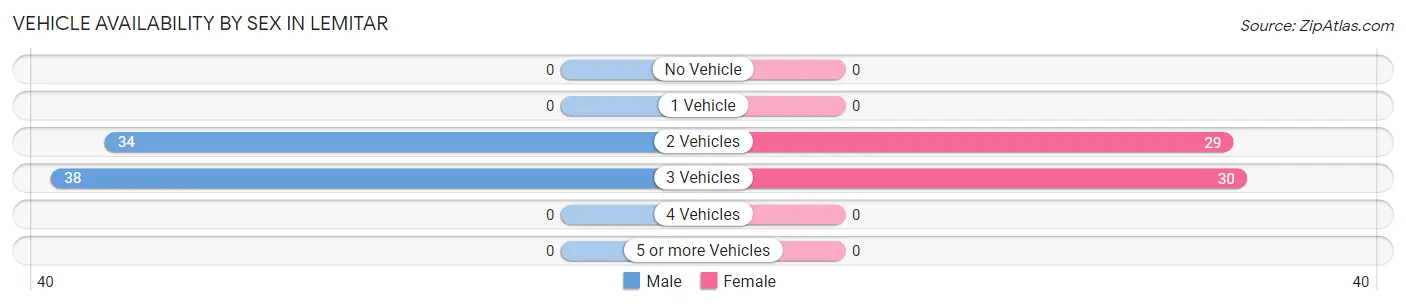
| Vehicles Available | Male | Female |
| No Vehicle | 0 (0.0%) | 0 (0.0%) |
| 1 Vehicle | 0 (0.0%) | 0 (0.0%) |
| 2 Vehicles | 34 (47.2%) | 29 (49.1%) |
| 3 Vehicles | 38 (52.8%) | 30 (50.8%) |
| 4 Vehicles | 0 (0.0%) | 0 (0.0%) |
| 5 or more Vehicles | 0 (0.0%) | 0 (0.0%) |
| Total | 72 (100.0%) | 59 (100.0%) |
Commute Time in Lemitar
The most frequently occuring commute durations in Lemitar are 40 to 44 minutes (38 commuters, 29.0%), 20 to 24 minutes (30 commuters, 22.9%), and 5 to 9 minutes (29 commuters, 22.1%).
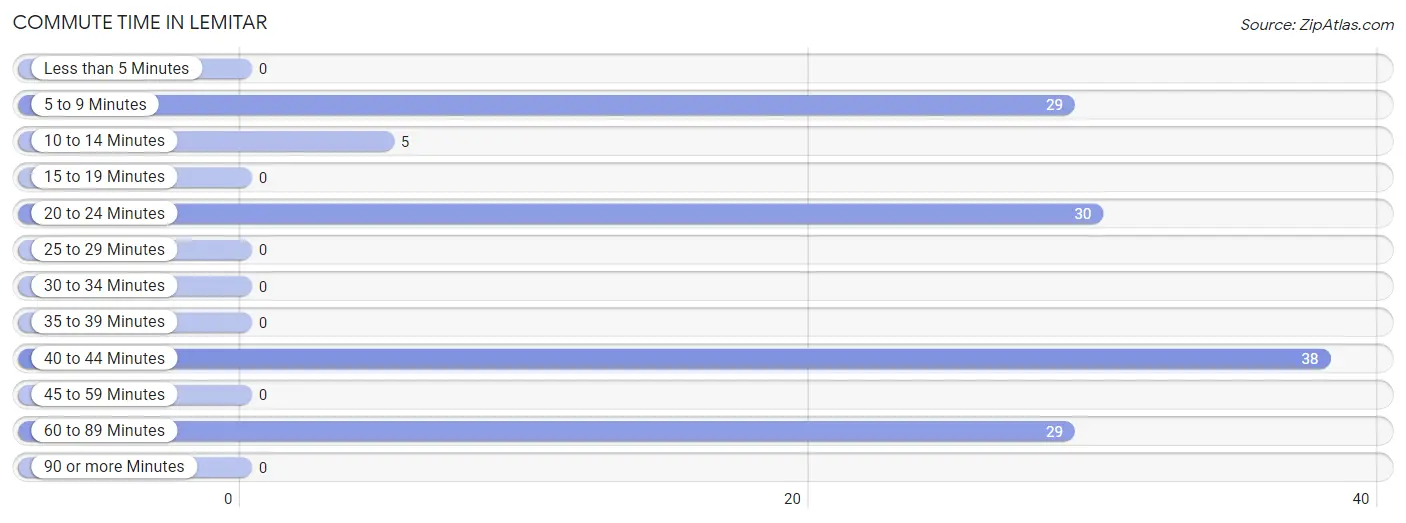
| Commute Time | # Commuters | % Commuters |
| Less than 5 Minutes | 0 | 0.0% |
| 5 to 9 Minutes | 29 | 22.1% |
| 10 to 14 Minutes | 5 | 3.8% |
| 15 to 19 Minutes | 0 | 0.0% |
| 20 to 24 Minutes | 30 | 22.9% |
| 25 to 29 Minutes | 0 | 0.0% |
| 30 to 34 Minutes | 0 | 0.0% |
| 35 to 39 Minutes | 0 | 0.0% |
| 40 to 44 Minutes | 38 | 29.0% |
| 45 to 59 Minutes | 0 | 0.0% |
| 60 to 89 Minutes | 29 | 22.1% |
| 90 or more Minutes | 0 | 0.0% |
Commute Time by Sex in Lemitar
The most common commute times in Lemitar are 40 to 44 minutes (38 commuters, 52.8%) for males and 20 to 24 minutes (30 commuters, 50.8%) for females.
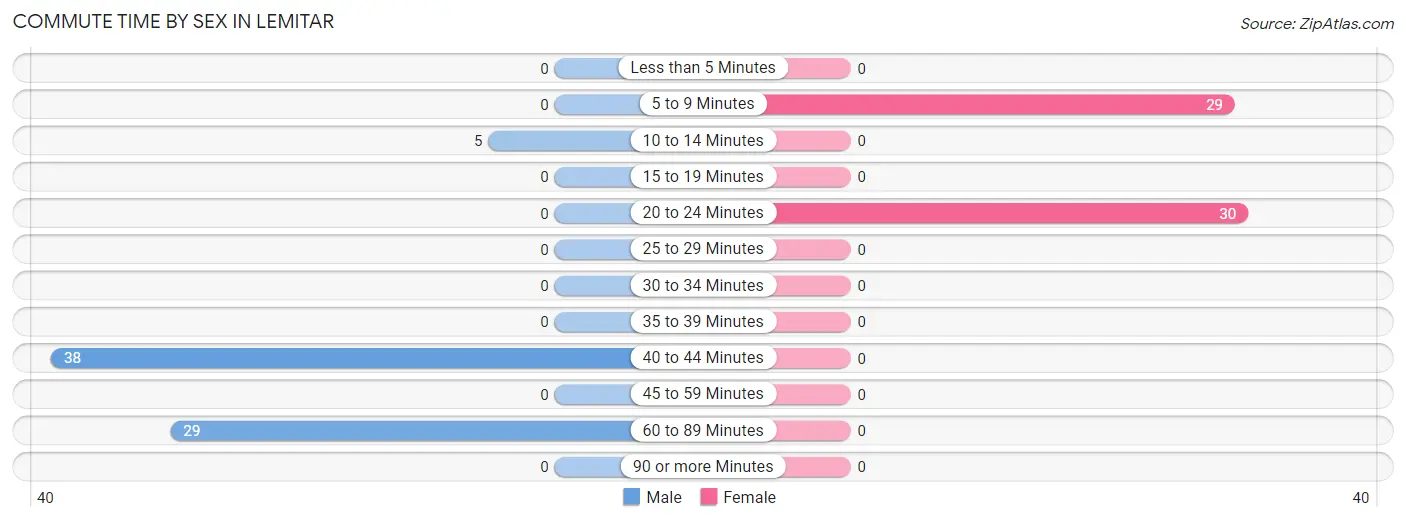
| Commute Time | Male | Female |
| Less than 5 Minutes | 0 (0.0%) | 0 (0.0%) |
| 5 to 9 Minutes | 0 (0.0%) | 29 (49.1%) |
| 10 to 14 Minutes | 5 (6.9%) | 0 (0.0%) |
| 15 to 19 Minutes | 0 (0.0%) | 0 (0.0%) |
| 20 to 24 Minutes | 0 (0.0%) | 30 (50.8%) |
| 25 to 29 Minutes | 0 (0.0%) | 0 (0.0%) |
| 30 to 34 Minutes | 0 (0.0%) | 0 (0.0%) |
| 35 to 39 Minutes | 0 (0.0%) | 0 (0.0%) |
| 40 to 44 Minutes | 38 (52.8%) | 0 (0.0%) |
| 45 to 59 Minutes | 0 (0.0%) | 0 (0.0%) |
| 60 to 89 Minutes | 29 (40.3%) | 0 (0.0%) |
| 90 or more Minutes | 0 (0.0%) | 0 (0.0%) |
Time of Departure to Work by Sex in Lemitar
The most frequent times of departure to work in Lemitar are 6:00 AM to 6:29 AM (38, 52.8%) for males and 7:30 AM to 7:59 AM (30, 50.8%) for females.
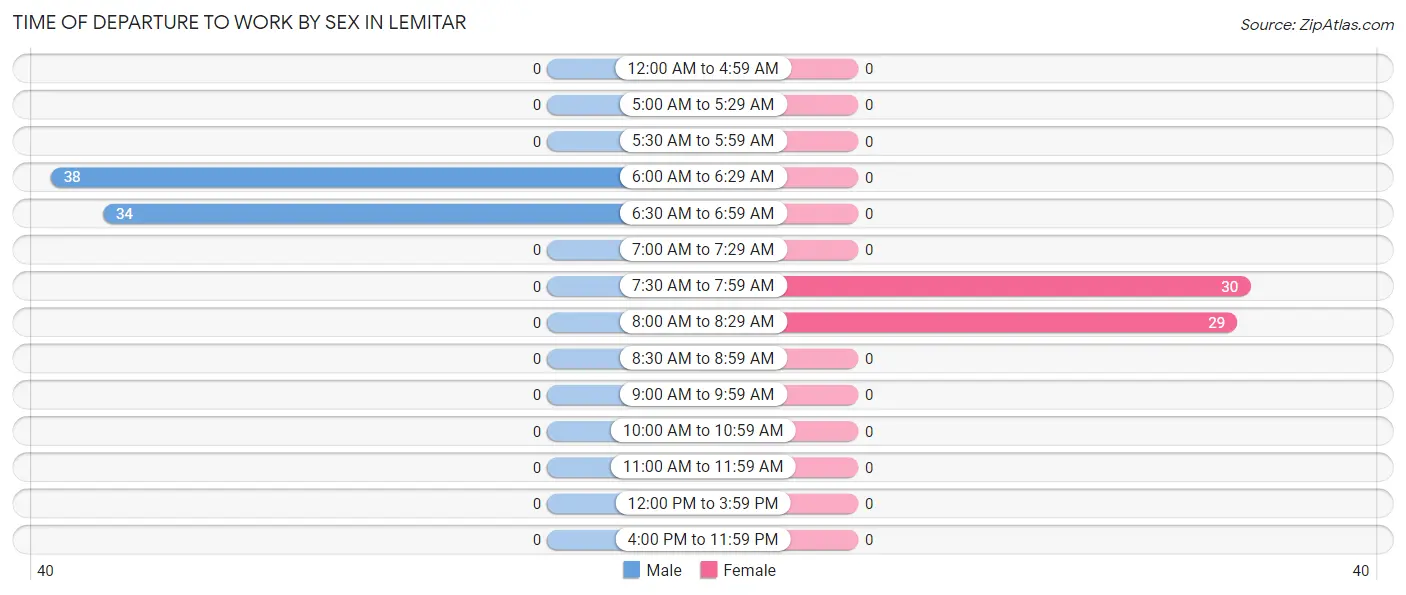
| Time of Departure | Male | Female |
| 12:00 AM to 4:59 AM | 0 (0.0%) | 0 (0.0%) |
| 5:00 AM to 5:29 AM | 0 (0.0%) | 0 (0.0%) |
| 5:30 AM to 5:59 AM | 0 (0.0%) | 0 (0.0%) |
| 6:00 AM to 6:29 AM | 38 (52.8%) | 0 (0.0%) |
| 6:30 AM to 6:59 AM | 34 (47.2%) | 0 (0.0%) |
| 7:00 AM to 7:29 AM | 0 (0.0%) | 0 (0.0%) |
| 7:30 AM to 7:59 AM | 0 (0.0%) | 30 (50.8%) |
| 8:00 AM to 8:29 AM | 0 (0.0%) | 29 (49.1%) |
| 8:30 AM to 8:59 AM | 0 (0.0%) | 0 (0.0%) |
| 9:00 AM to 9:59 AM | 0 (0.0%) | 0 (0.0%) |
| 10:00 AM to 10:59 AM | 0 (0.0%) | 0 (0.0%) |
| 11:00 AM to 11:59 AM | 0 (0.0%) | 0 (0.0%) |
| 12:00 PM to 3:59 PM | 0 (0.0%) | 0 (0.0%) |
| 4:00 PM to 11:59 PM | 0 (0.0%) | 0 (0.0%) |
| Total | 72 (100.0%) | 59 (100.0%) |
Housing Occupancy in Lemitar
Occupancy by Ownership in Lemitar
Of the total 137 dwellings in Lemitar, owner-occupied units account for 137 (100.0%), while renter-occupied units make up 0 (0.0%).
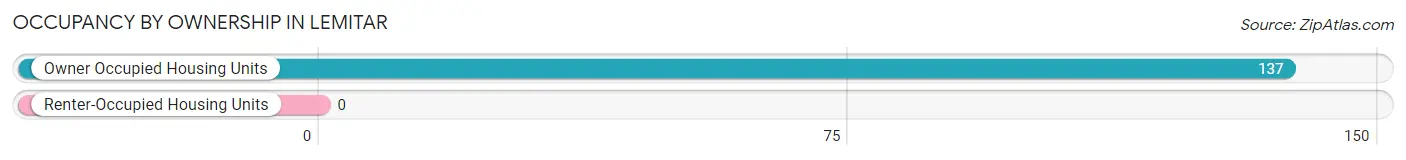
| Occupancy | # Housing Units | % Housing Units |
| Owner Occupied Housing Units | 137 | 100.0% |
| Renter-Occupied Housing Units | 0 | 0.0% |
| Total Occupied Housing Units | 137 | 100.0% |
Occupancy by Household Size in Lemitar
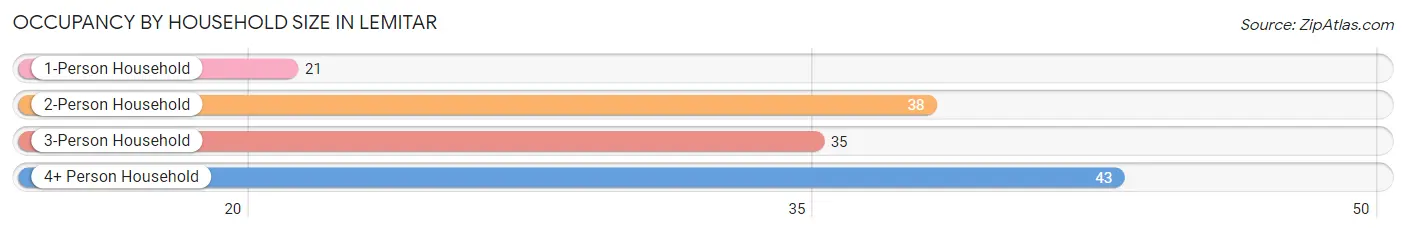
| Household Size | # Housing Units | % Housing Units |
| 1-Person Household | 21 | 15.3% |
| 2-Person Household | 38 | 27.7% |
| 3-Person Household | 35 | 25.6% |
| 4+ Person Household | 43 | 31.4% |
| Total Housing Units | 137 | 100.0% |
Occupancy by Ownership by Household Size in Lemitar
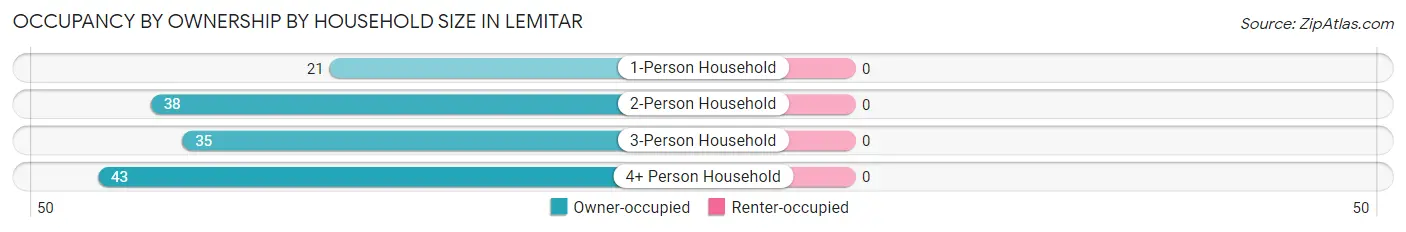
| Household Size | Owner-occupied | Renter-occupied |
| 1-Person Household | 21 (100.0%) | 0 (0.0%) |
| 2-Person Household | 38 (100.0%) | 0 (0.0%) |
| 3-Person Household | 35 (100.0%) | 0 (0.0%) |
| 4+ Person Household | 43 (100.0%) | 0 (0.0%) |
| Total Housing Units | 137 (100.0%) | 0 (0.0%) |
Occupancy by Educational Attainment in Lemitar
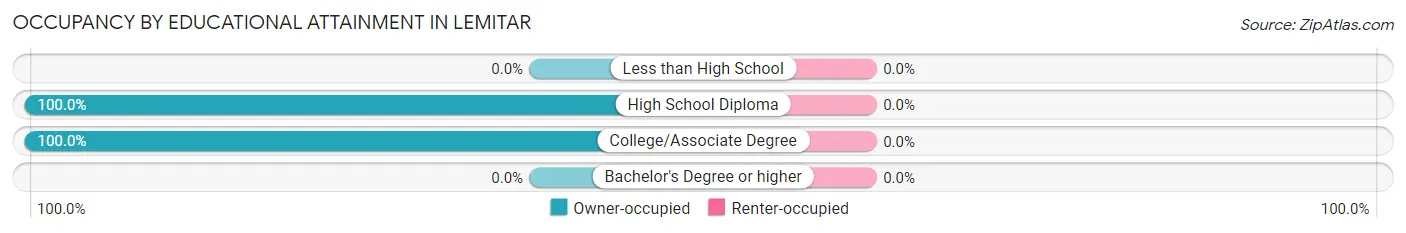
| Household Size | Owner-occupied | Renter-occupied |
| Less than High School | 0 (0.0%) | 0 (0.0%) |
| High School Diploma | 128 (100.0%) | 0 (0.0%) |
| College/Associate Degree | 9 (100.0%) | 0 (0.0%) |
| Bachelor's Degree or higher | 0 (0.0%) | 0 (0.0%) |
Occupancy by Age of Householder in Lemitar
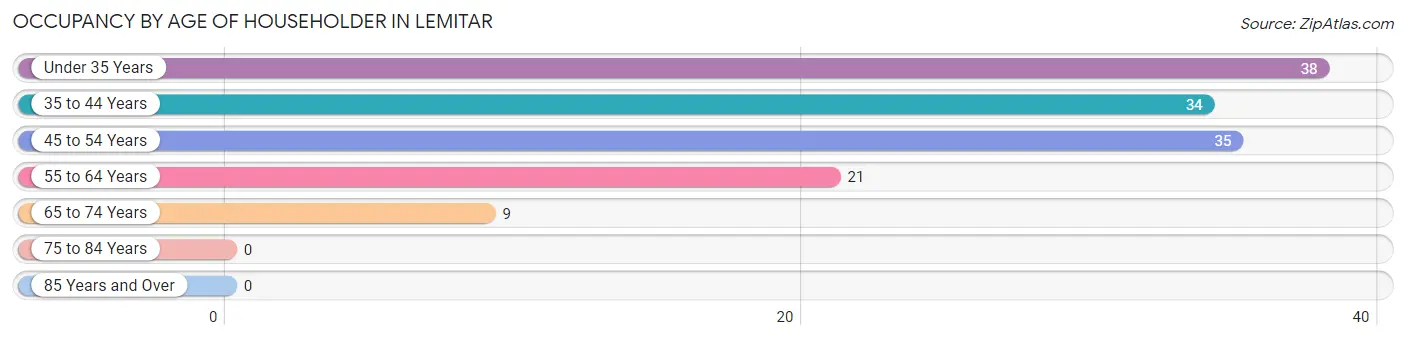
| Age Bracket | # Households | % Households |
| Under 35 Years | 38 | 27.7% |
| 35 to 44 Years | 34 | 24.8% |
| 45 to 54 Years | 35 | 25.6% |
| 55 to 64 Years | 21 | 15.3% |
| 65 to 74 Years | 9 | 6.6% |
| 75 to 84 Years | 0 | 0.0% |
| 85 Years and Over | 0 | 0.0% |
| Total | 137 | 100.0% |
Housing Finances in Lemitar
Median Income by Occupancy in Lemitar
| Occupancy Type | # Households | Median Income |
| Owner-Occupied | 137 (100.0%) | $0 |
| Renter-Occupied | 0 (0.0%) | $0 |
| Average | 137 (100.0%) | $0 |
Occupancy by Householder Income Bracket in Lemitar
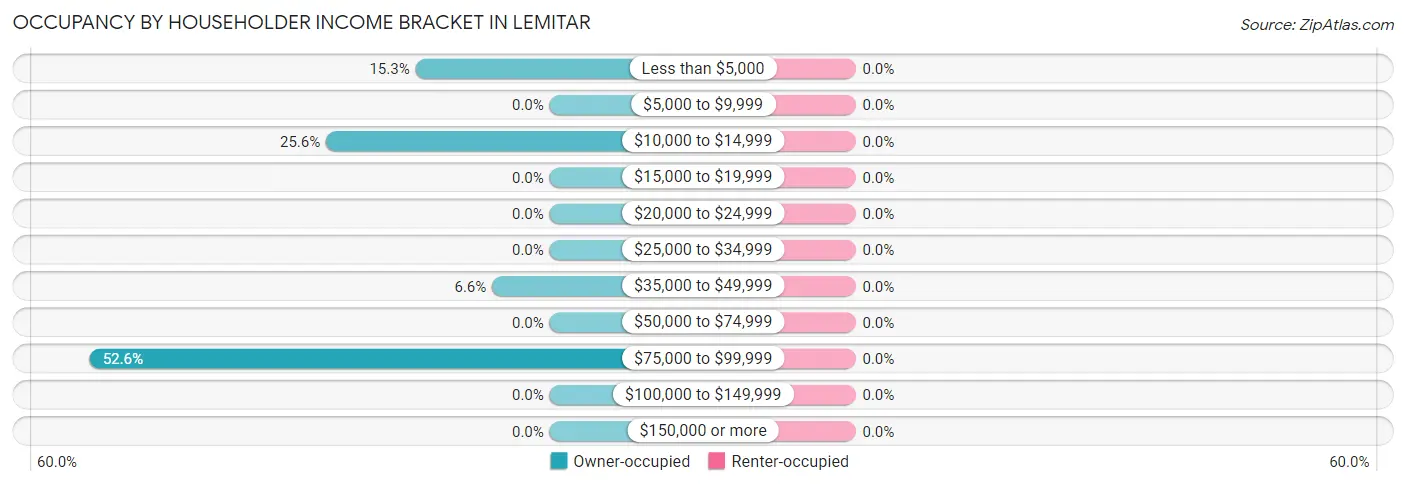
| Income Bracket | Owner-occupied | Renter-occupied |
| Less than $5,000 | 21 (15.3%) | 0 (0.0%) |
| $5,000 to $9,999 | 0 (0.0%) | 0 (0.0%) |
| $10,000 to $14,999 | 35 (25.6%) | 0 (0.0%) |
| $15,000 to $19,999 | 0 (0.0%) | 0 (0.0%) |
| $20,000 to $24,999 | 0 (0.0%) | 0 (0.0%) |
| $25,000 to $34,999 | 0 (0.0%) | 0 (0.0%) |
| $35,000 to $49,999 | 9 (6.6%) | 0 (0.0%) |
| $50,000 to $74,999 | 0 (0.0%) | 0 (0.0%) |
| $75,000 to $99,999 | 72 (52.5%) | 0 (0.0%) |
| $100,000 to $149,999 | 0 (0.0%) | 0 (0.0%) |
| $150,000 or more | 0 (0.0%) | 0 (0.0%) |
| Total | 137 (100.0%) | 0 (0.0%) |
Monthly Housing Cost Tiers in Lemitar
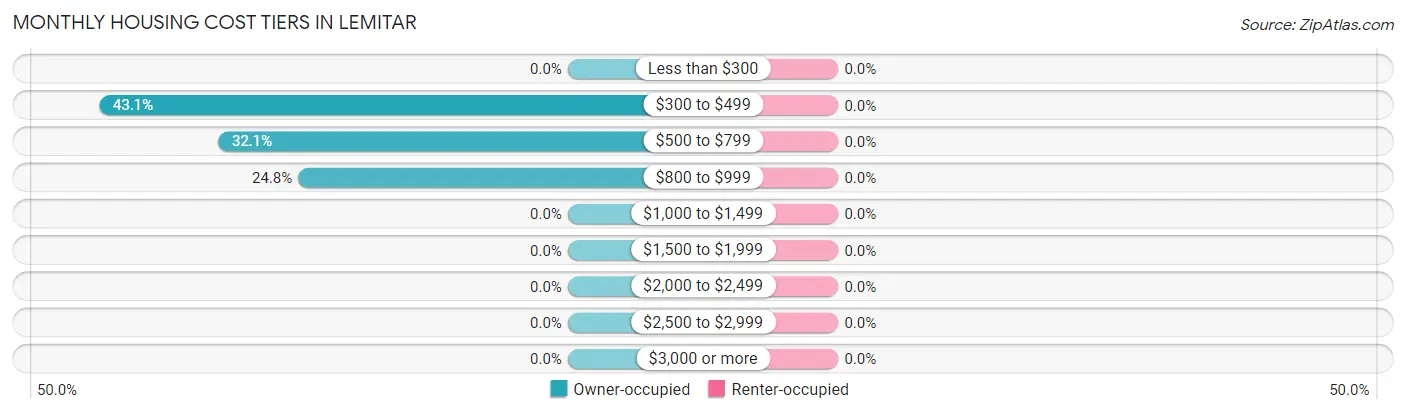
| Monthly Cost | Owner-occupied | Renter-occupied |
| Less than $300 | 0 (0.0%) | 0 (0.0%) |
| $300 to $499 | 59 (43.1%) | 0 (0.0%) |
| $500 to $799 | 44 (32.1%) | 0 (0.0%) |
| $800 to $999 | 34 (24.8%) | 0 (0.0%) |
| $1,000 to $1,499 | 0 (0.0%) | 0 (0.0%) |
| $1,500 to $1,999 | 0 (0.0%) | 0 (0.0%) |
| $2,000 to $2,499 | 0 (0.0%) | 0 (0.0%) |
| $2,500 to $2,999 | 0 (0.0%) | 0 (0.0%) |
| $3,000 or more | 0 (0.0%) | 0 (0.0%) |
| Total | 137 (100.0%) | 0 (0.0%) |
Physical Housing Characteristics in Lemitar
Housing Structures in Lemitar
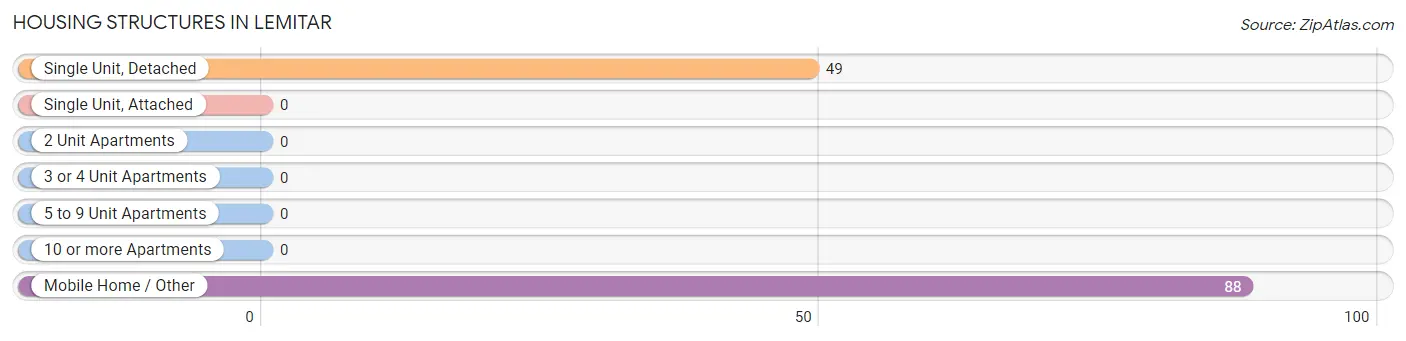
| Structure Type | # Housing Units | % Housing Units |
| Single Unit, Detached | 49 | 35.8% |
| Single Unit, Attached | 0 | 0.0% |
| 2 Unit Apartments | 0 | 0.0% |
| 3 or 4 Unit Apartments | 0 | 0.0% |
| 5 to 9 Unit Apartments | 0 | 0.0% |
| 10 or more Apartments | 0 | 0.0% |
| Mobile Home / Other | 88 | 64.2% |
| Total | 137 | 100.0% |
Housing Structures by Occupancy in Lemitar
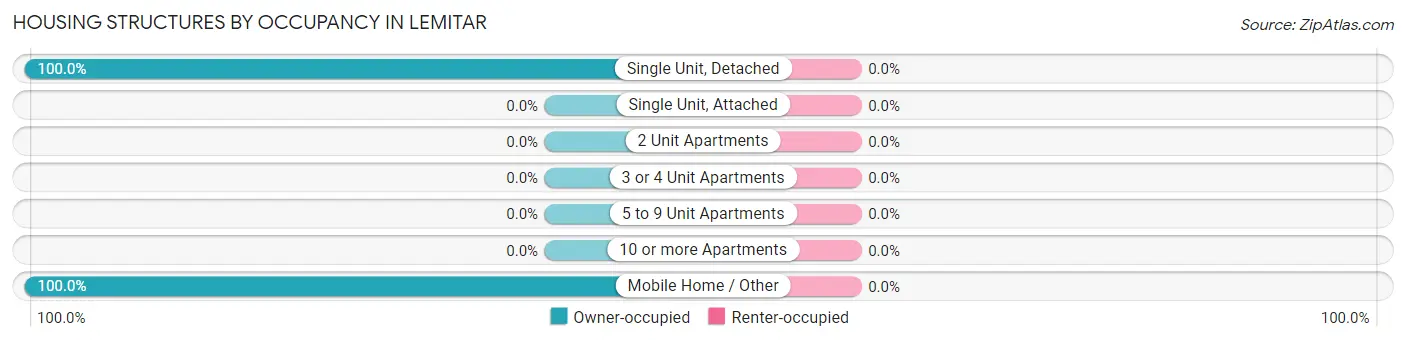
| Structure Type | Owner-occupied | Renter-occupied |
| Single Unit, Detached | 49 (100.0%) | 0 (0.0%) |
| Single Unit, Attached | 0 (0.0%) | 0 (0.0%) |
| 2 Unit Apartments | 0 (0.0%) | 0 (0.0%) |
| 3 or 4 Unit Apartments | 0 (0.0%) | 0 (0.0%) |
| 5 to 9 Unit Apartments | 0 (0.0%) | 0 (0.0%) |
| 10 or more Apartments | 0 (0.0%) | 0 (0.0%) |
| Mobile Home / Other | 88 (100.0%) | 0 (0.0%) |
| Total | 137 (100.0%) | 0 (0.0%) |
Housing Structures by Number of Rooms in Lemitar
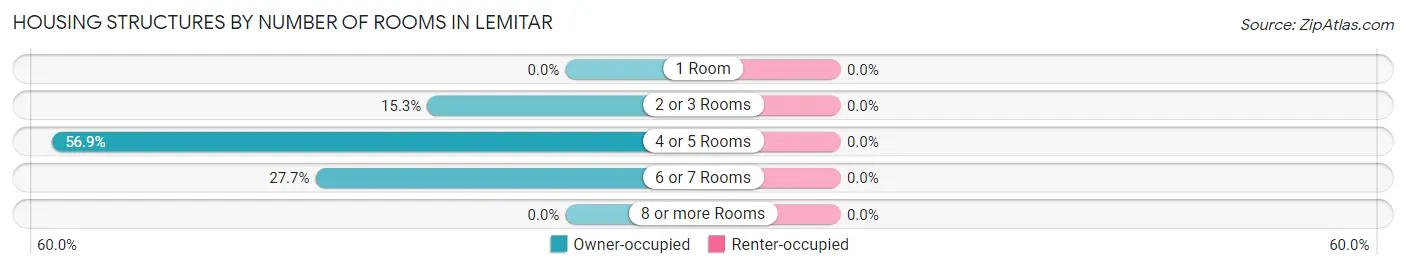
| Number of Rooms | Owner-occupied | Renter-occupied |
| 1 Room | 0 (0.0%) | 0 (0.0%) |
| 2 or 3 Rooms | 21 (15.3%) | 0 (0.0%) |
| 4 or 5 Rooms | 78 (56.9%) | 0 (0.0%) |
| 6 or 7 Rooms | 38 (27.7%) | 0 (0.0%) |
| 8 or more Rooms | 0 (0.0%) | 0 (0.0%) |
| Total | 137 (100.0%) | 0 (0.0%) |
Housing Structure by Heating Type in Lemitar
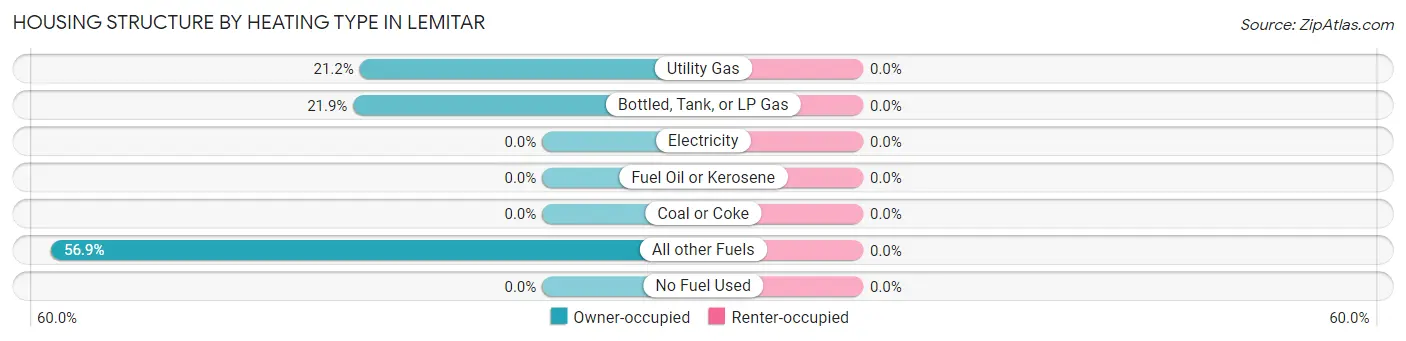
| Heating Type | Owner-occupied | Renter-occupied |
| Utility Gas | 29 (21.2%) | 0 (0.0%) |
| Bottled, Tank, or LP Gas | 30 (21.9%) | 0 (0.0%) |
| Electricity | 0 (0.0%) | 0 (0.0%) |
| Fuel Oil or Kerosene | 0 (0.0%) | 0 (0.0%) |
| Coal or Coke | 0 (0.0%) | 0 (0.0%) |
| All other Fuels | 78 (56.9%) | 0 (0.0%) |
| No Fuel Used | 0 (0.0%) | 0 (0.0%) |
| Total | 137 (100.0%) | 0 (0.0%) |
Household Vehicle Usage in Lemitar
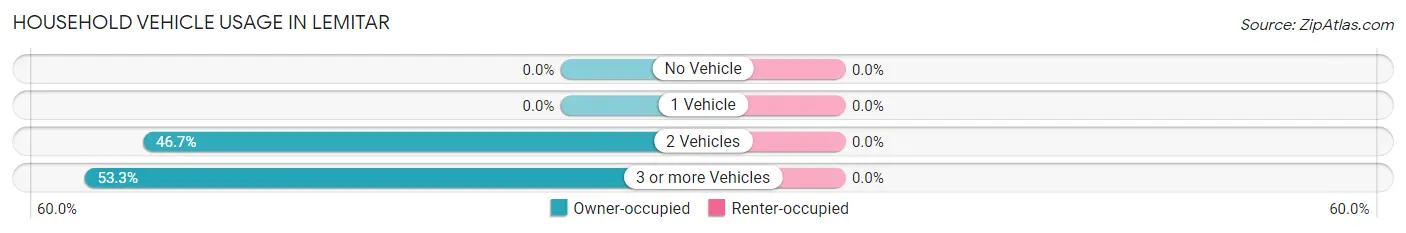
| Vehicles per Household | Owner-occupied | Renter-occupied |
| No Vehicle | 0 (0.0%) | 0 (0.0%) |
| 1 Vehicle | 0 (0.0%) | 0 (0.0%) |
| 2 Vehicles | 64 (46.7%) | 0 (0.0%) |
| 3 or more Vehicles | 73 (53.3%) | 0 (0.0%) |
| Total | 137 (100.0%) | 0 (0.0%) |
Real Estate & Mortgages in Lemitar
Real Estate and Mortgage Overview in Lemitar
| Characteristic | Without Mortgage | With Mortgage |
| Housing Units | 99 | 38 |
| Median Property Value | $134,800 | $0 |
| Median Household Income | - | - |
| Monthly Housing Costs | $475 | $0 |
| Real Estate Taxes | $763 | $0 |
Property Value by Mortgage Status in Lemitar
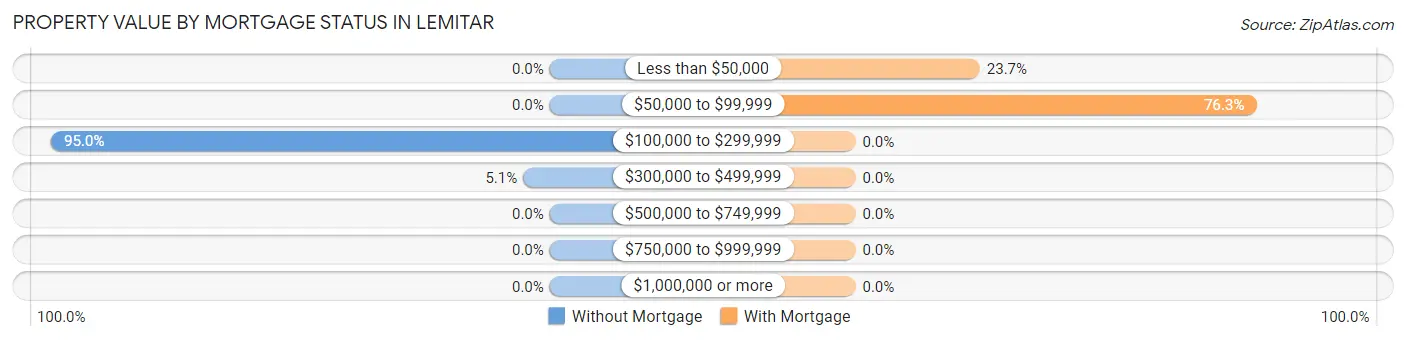
| Property Value | Without Mortgage | With Mortgage |
| Less than $50,000 | 0 (0.0%) | 9 (23.7%) |
| $50,000 to $99,999 | 0 (0.0%) | 29 (76.3%) |
| $100,000 to $299,999 | 94 (95.0%) | 0 (0.0%) |
| $300,000 to $499,999 | 5 (5.1%) | 0 (0.0%) |
| $500,000 to $749,999 | 0 (0.0%) | 0 (0.0%) |
| $750,000 to $999,999 | 0 (0.0%) | 0 (0.0%) |
| $1,000,000 or more | 0 (0.0%) | 0 (0.0%) |
| Total | 99 (100.0%) | 38 (100.0%) |
Household Income by Mortgage Status in Lemitar
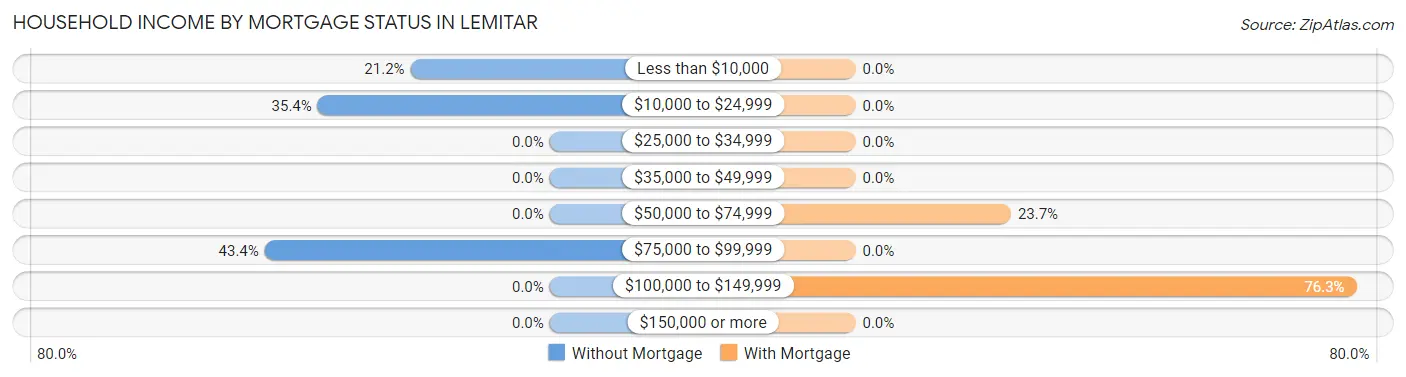
| Household Income | Without Mortgage | With Mortgage |
| Less than $10,000 | 21 (21.2%) | 0 (0.0%) |
| $10,000 to $24,999 | 35 (35.3%) | 0 (0.0%) |
| $25,000 to $34,999 | 0 (0.0%) | 0 (0.0%) |
| $35,000 to $49,999 | 0 (0.0%) | 0 (0.0%) |
| $50,000 to $74,999 | 0 (0.0%) | 9 (23.7%) |
| $75,000 to $99,999 | 43 (43.4%) | 0 (0.0%) |
| $100,000 to $149,999 | 0 (0.0%) | 29 (76.3%) |
| $150,000 or more | 0 (0.0%) | 0 (0.0%) |
| Total | 99 (100.0%) | 38 (100.0%) |
Property Value to Household Income Ratio in Lemitar
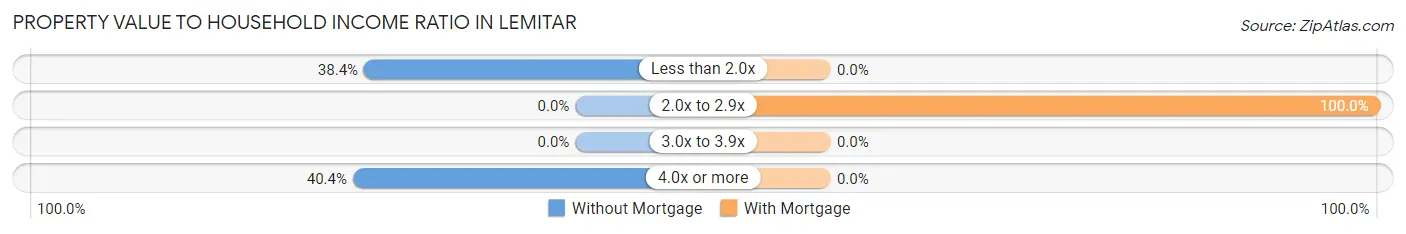
| Value-to-Income Ratio | Without Mortgage | With Mortgage |
| Less than 2.0x | 38 (38.4%) | 0 (0.0%) |
| 2.0x to 2.9x | 0 (0.0%) | 38 (100.0%) |
| 3.0x to 3.9x | 0 (0.0%) | 0 (0.0%) |
| 4.0x or more | 40 (40.4%) | 0 (0.0%) |
| Total | 99 (100.0%) | 38 (100.0%) |
Real Estate Taxes by Mortgage Status in Lemitar
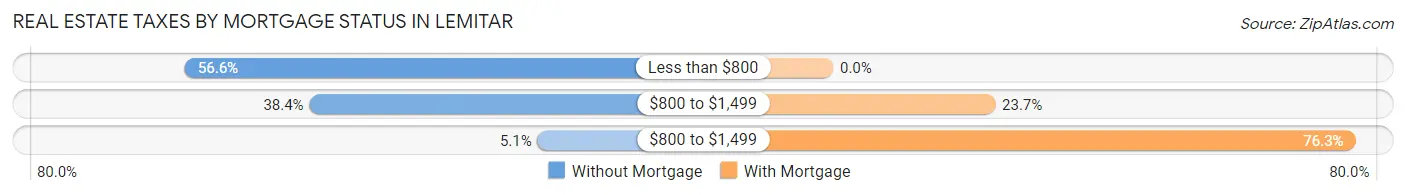
| Property Taxes | Without Mortgage | With Mortgage |
| Less than $800 | 56 (56.6%) | 0 (0.0%) |
| $800 to $1,499 | 38 (38.4%) | 9 (23.7%) |
| $800 to $1,499 | 5 (5.1%) | 29 (76.3%) |
| Total | 99 (100.0%) | 38 (100.0%) |
Health & Disability in Lemitar
Health Insurance Coverage by Age in Lemitar
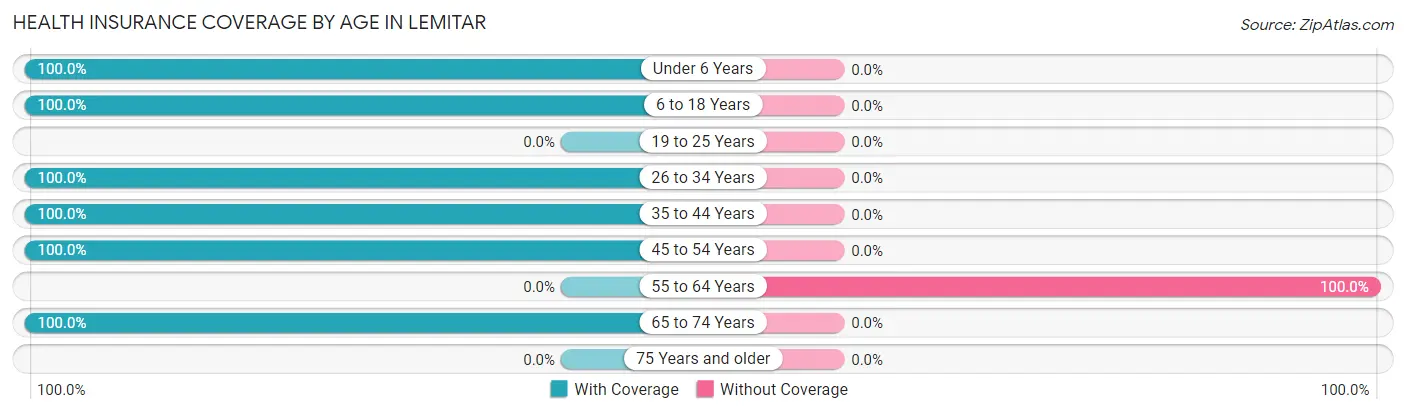
| Age Bracket | With Coverage | Without Coverage |
| Under 6 Years | 39 (100.0%) | 0 (0.0%) |
| 6 to 18 Years | 110 (100.0%) | 0 (0.0%) |
| 19 to 25 Years | 0 (0.0%) | 0 (0.0%) |
| 26 to 34 Years | 68 (100.0%) | 0 (0.0%) |
| 35 to 44 Years | 39 (100.0%) | 0 (0.0%) |
| 45 to 54 Years | 237 (100.0%) | 0 (0.0%) |
| 55 to 64 Years | 0 (0.0%) | 21 (100.0%) |
| 65 to 74 Years | 19 (100.0%) | 0 (0.0%) |
| 75 Years and older | 0 (0.0%) | 0 (0.0%) |
| Total | 512 (96.1%) | 21 (3.9%) |
Health Insurance Coverage by Citizenship Status in Lemitar
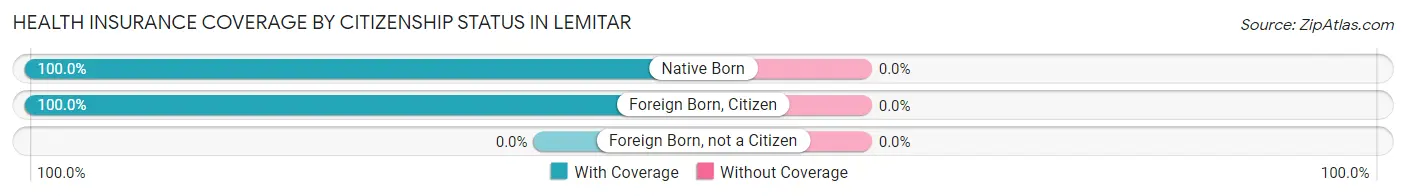
| Citizenship Status | With Coverage | Without Coverage |
| Native Born | 39 (100.0%) | 0 (0.0%) |
| Foreign Born, Citizen | 110 (100.0%) | 0 (0.0%) |
| Foreign Born, not a Citizen | 0 (0.0%) | 0 (0.0%) |
Health Insurance Coverage by Household Income in Lemitar
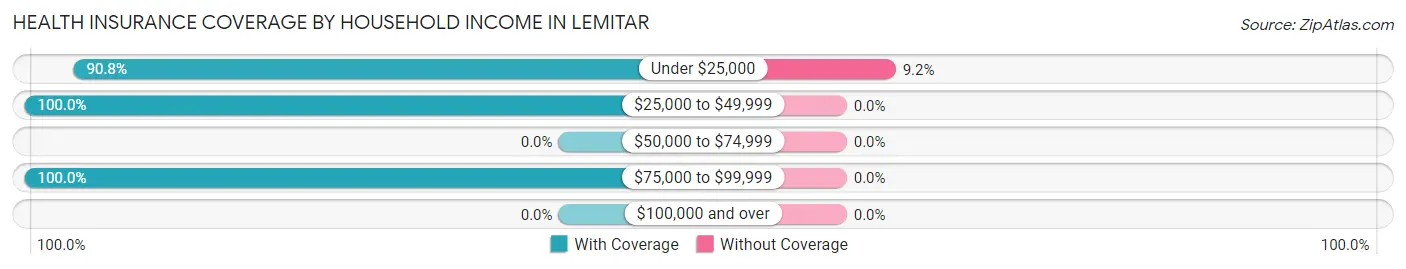
| Household Income | With Coverage | Without Coverage |
| Under $25,000 | 208 (90.8%) | 21 (9.2%) |
| $25,000 to $49,999 | 19 (100.0%) | 0 (0.0%) |
| $50,000 to $74,999 | 0 (0.0%) | 0 (0.0%) |
| $75,000 to $99,999 | 285 (100.0%) | 0 (0.0%) |
| $100,000 and over | 0 (0.0%) | 0 (0.0%) |
Public vs Private Health Insurance Coverage by Age in Lemitar
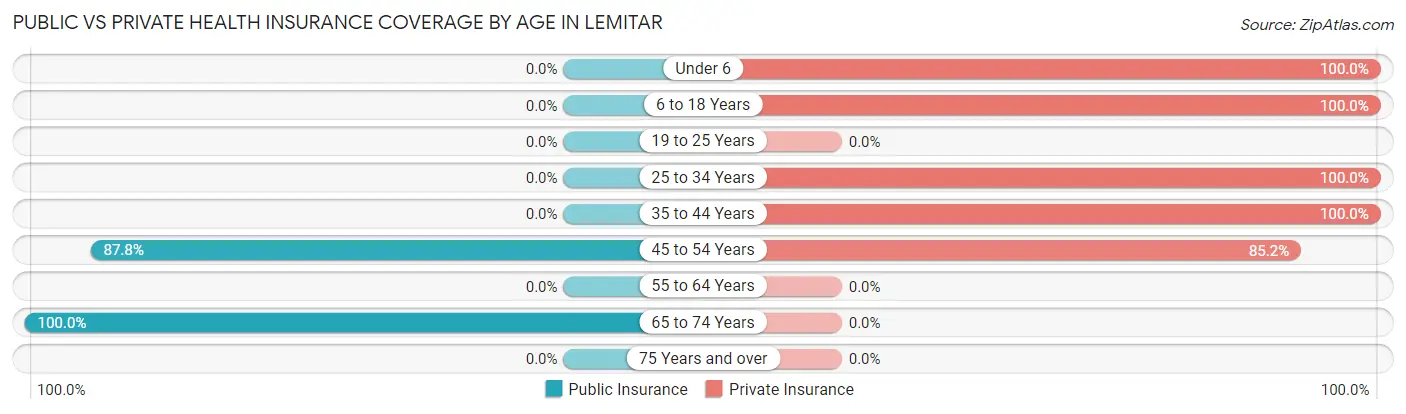
| Age Bracket | Public Insurance | Private Insurance |
| Under 6 | 0 (0.0%) | 39 (100.0%) |
| 6 to 18 Years | 0 (0.0%) | 110 (100.0%) |
| 19 to 25 Years | 0 (0.0%) | 0 (0.0%) |
| 25 to 34 Years | 0 (0.0%) | 68 (100.0%) |
| 35 to 44 Years | 0 (0.0%) | 39 (100.0%) |
| 45 to 54 Years | 208 (87.8%) | 202 (85.2%) |
| 55 to 64 Years | 0 (0.0%) | 0 (0.0%) |
| 65 to 74 Years | 19 (100.0%) | 0 (0.0%) |
| 75 Years and over | 0 (0.0%) | 0 (0.0%) |
| Total | 227 (42.6%) | 458 (85.9%) |
Disability Status by Sex by Age in Lemitar
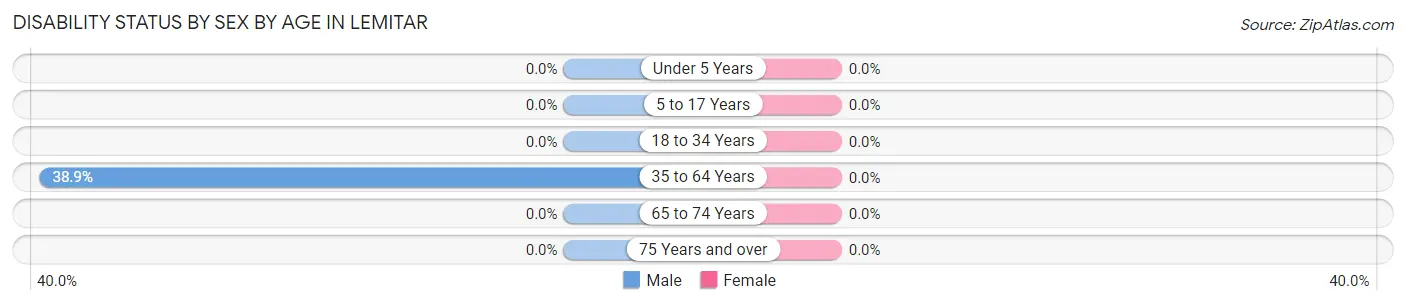
| Age Bracket | Male | Female |
| Under 5 Years | 0 (0.0%) | 0 (0.0%) |
| 5 to 17 Years | 0 (0.0%) | 0 (0.0%) |
| 18 to 34 Years | 0 (0.0%) | 0 (0.0%) |
| 35 to 64 Years | 35 (38.9%) | 0 (0.0%) |
| 65 to 74 Years | 0 (0.0%) | 0 (0.0%) |
| 75 Years and over | 0 (0.0%) | 0 (0.0%) |
Disability Class by Sex by Age in Lemitar
Disability Class: Hearing Difficulty
| Age Bracket | Male | Female |
| Under 5 Years | 0 (0.0%) | 0 (0.0%) |
| 5 to 17 Years | 0 (0.0%) | 0 (0.0%) |
| 18 to 34 Years | 0 (0.0%) | 0 (0.0%) |
| 35 to 64 Years | 0 (0.0%) | 0 (0.0%) |
| 65 to 74 Years | 0 (0.0%) | 0 (0.0%) |
| 75 Years and over | 0 (0.0%) | 0 (0.0%) |
Disability Class: Vision Difficulty
| Age Bracket | Male | Female |
| Under 5 Years | 0 (0.0%) | 0 (0.0%) |
| 5 to 17 Years | 0 (0.0%) | 0 (0.0%) |
| 18 to 34 Years | 0 (0.0%) | 0 (0.0%) |
| 35 to 64 Years | 0 (0.0%) | 0 (0.0%) |
| 65 to 74 Years | 0 (0.0%) | 0 (0.0%) |
| 75 Years and over | 0 (0.0%) | 0 (0.0%) |
Disability Class: Cognitive Difficulty
| Age Bracket | Male | Female |
| 5 to 17 Years | 0 (0.0%) | 0 (0.0%) |
| 18 to 34 Years | 0 (0.0%) | 0 (0.0%) |
| 35 to 64 Years | 0 (0.0%) | 0 (0.0%) |
| 65 to 74 Years | 0 (0.0%) | 0 (0.0%) |
| 75 Years and over | 0 (0.0%) | 0 (0.0%) |
Disability Class: Ambulatory Difficulty
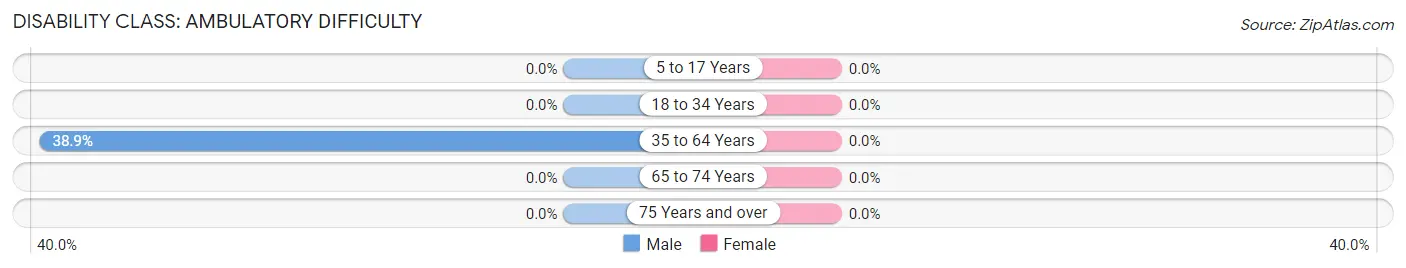
| Age Bracket | Male | Female |
| 5 to 17 Years | 0 (0.0%) | 0 (0.0%) |
| 18 to 34 Years | 0 (0.0%) | 0 (0.0%) |
| 35 to 64 Years | 35 (38.9%) | 0 (0.0%) |
| 65 to 74 Years | 0 (0.0%) | 0 (0.0%) |
| 75 Years and over | 0 (0.0%) | 0 (0.0%) |
Disability Class: Self-Care Difficulty
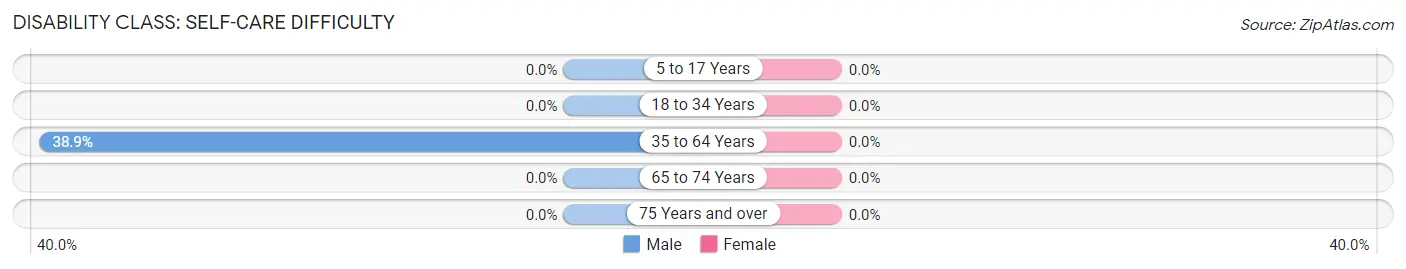
| Age Bracket | Male | Female |
| 5 to 17 Years | 0 (0.0%) | 0 (0.0%) |
| 18 to 34 Years | 0 (0.0%) | 0 (0.0%) |
| 35 to 64 Years | 35 (38.9%) | 0 (0.0%) |
| 65 to 74 Years | 0 (0.0%) | 0 (0.0%) |
| 75 Years and over | 0 (0.0%) | 0 (0.0%) |
Technology Access in Lemitar
Computing Device Access in Lemitar
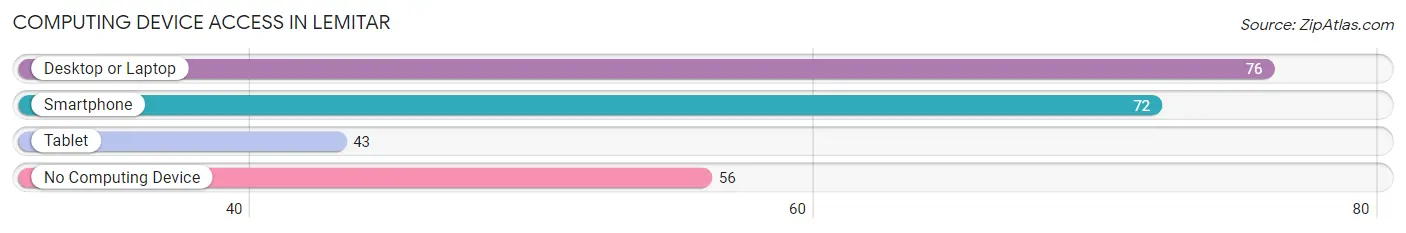
| Device Type | # Households | % Households |
| Desktop or Laptop | 76 | 55.5% |
| Smartphone | 72 | 52.5% |
| Tablet | 43 | 31.4% |
| No Computing Device | 56 | 40.9% |
| Total | 137 | 100.0% |
Internet Access in Lemitar
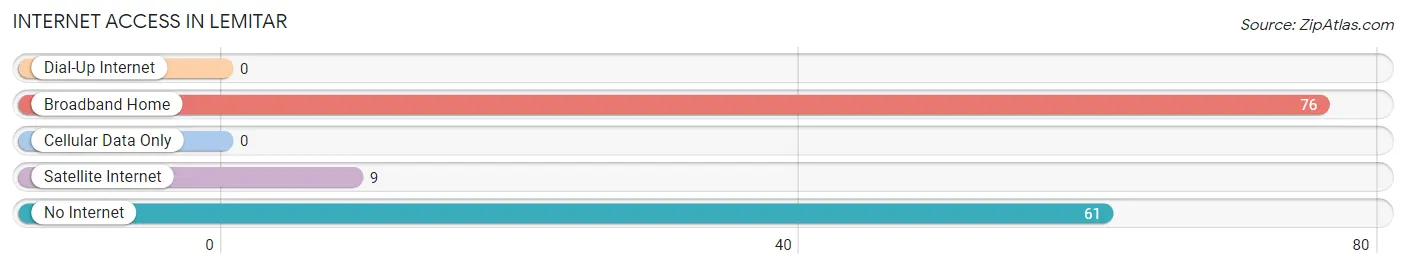
| Internet Type | # Households | % Households |
| Dial-Up Internet | 0 | 0.0% |
| Broadband Home | 76 | 55.5% |
| Cellular Data Only | 0 | 0.0% |
| Satellite Internet | 9 | 6.6% |
| No Internet | 61 | 44.5% |
| Total | 137 | 100.0% |
Lemitar Summary
Lemitar is a small unincorporated community located in Socorro County, New Mexico. It is situated in the Rio Grande Valley, approximately 25 miles south of Socorro and 40 miles north of Truth or Consequences. The population of Lemitar was estimated to be around 500 in 2020.
History
Lemitar was founded in 1881 by a group of settlers from the nearby town of San Marcial. The settlers were looking for a place to settle and farm, and they chose the area around Lemitar because of its fertile soil and abundant water supply. The town was named after the nearby Lemitar Mountains, which were named after a Spanish explorer who had passed through the area in the late 1700s.
The town grew quickly, and by the early 1900s it had become a thriving agricultural community. The main crops grown in the area were wheat, corn, and alfalfa. The town also had a small sawmill and a few stores.
In the 1920s, the town began to decline as the railroad bypassed it and the population began to move away. By the 1950s, the population had dropped to around 200.
Geography
Lemitar is located in the Rio Grande Valley, in the foothills of the Lemitar Mountains. The town is situated at an elevation of 4,400 feet, and the surrounding area is mostly flat. The climate is semi-arid, with hot summers and mild winters.
The town is located near the Rio Grande River, which provides a source of irrigation for the local farms. The nearby mountains provide a scenic backdrop to the town.
Economy
The economy of Lemitar is largely based on agriculture. The main crops grown in the area are wheat, corn, and alfalfa. The town also has a few small businesses, including a sawmill and a few stores.
Demographics
As of the 2010 census, the population of Lemitar was estimated to be around 500. The racial makeup of the town was 94.2% White, 0.2% African American, 0.2% Native American, 0.2% Asian, 0.2% Pacific Islander, and 4.2% from other races. The median household income was $25,000, and the median family income was $30,000.
Conclusion
Lemitar is a small unincorporated community located in Socorro County, New Mexico. It is situated in the Rio Grande Valley, approximately 25 miles south of Socorro and 40 miles north of Truth or Consequences. The population of Lemitar was estimated to be around 500 in 2020. The economy of Lemitar is largely based on agriculture, and the main crops grown in the area are wheat, corn, and alfalfa. The racial makeup of the town was 94.2% White, 0.2% African American, 0.2% Native American, 0.2% Asian, 0.2% Pacific Islander, and 4.2% from other races. The median household income was $25,000, and the median family income was $30,000.
Common Questions
What is Per Capita Income in Lemitar?
Per Capita income in Lemitar is $12,878.
What is the Median Family Income in Lemitar?
Median Family Income in Lemitar is $78,707.
What is Inequality or Gini Index in Lemitar?
Inequality or Gini Index in Lemitar is 0.40.
What is the Total Population of Lemitar?
Total Population of Lemitar is 533.
What is the Total Male Population of Lemitar?
Total Male Population of Lemitar is 181.
What is the Total Female Population of Lemitar?
Total Female Population of Lemitar is 352.
What is the Ratio of Males per 100 Females in Lemitar?
There are 51.42 Males per 100 Females in Lemitar.
What is the Ratio of Females per 100 Males in Lemitar?
There are 194.48 Females per 100 Males in Lemitar.
What is the Median Population Age in Lemitar?
Median Population Age in Lemitar is 47.1 Years.
What is the Average Family Size in Lemitar
Average Family Size in Lemitar is 4.4 People.
What is the Average Household Size in Lemitar
Average Household Size in Lemitar is 3.9 People.
How Large is the Labor Force in Lemitar?
There are 131 People in the Labor Forcein in Lemitar.
What is the Percentage of People in the Labor Force in Lemitar?
34.1% of People are in the Labor Force in Lemitar.