Lake Arthur, NM Map & Demographics
Lake Arthur Map
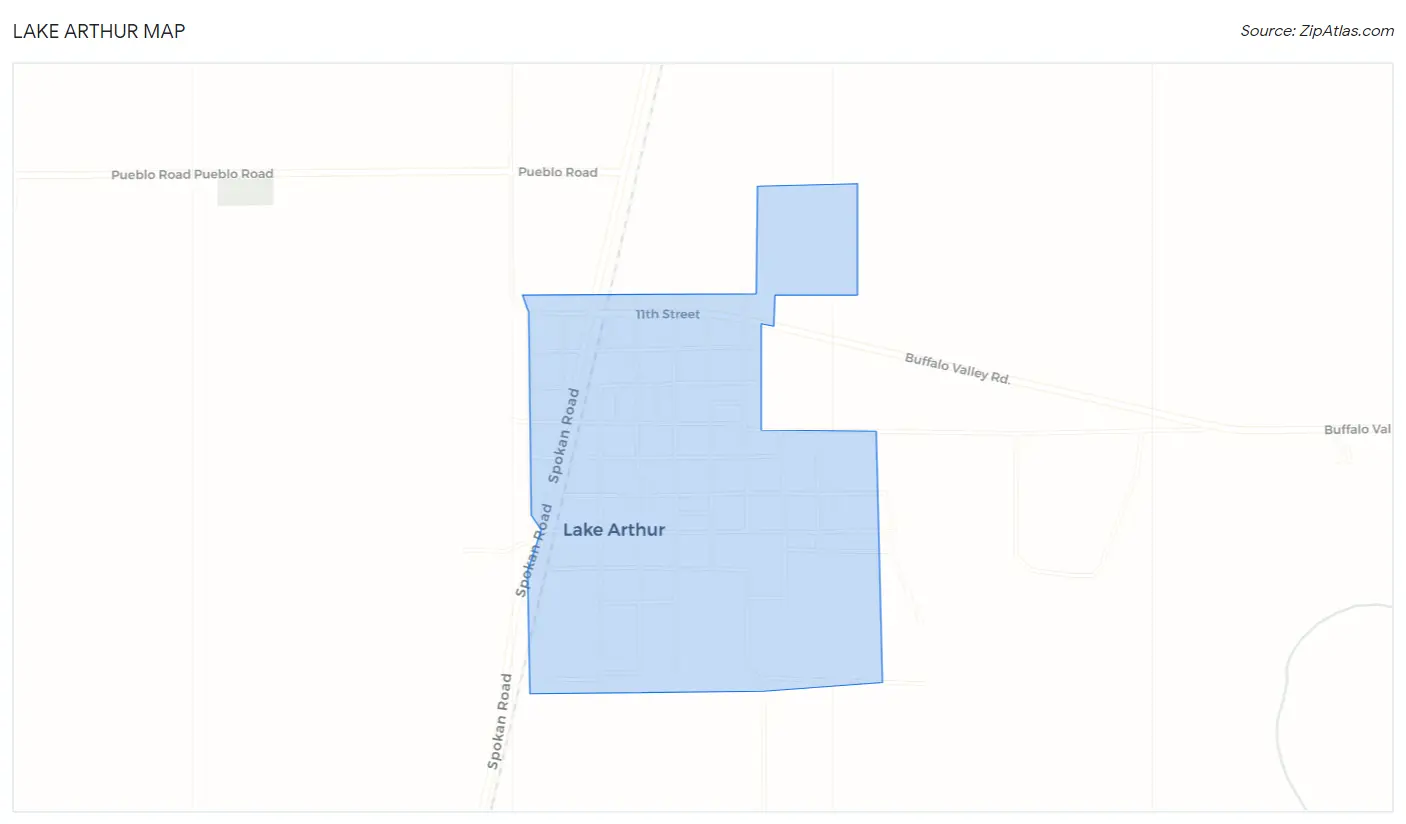
Lake Arthur Overview
$24,676
PER CAPITA INCOME
$81,250
AVG FAMILY INCOME
$51,429
AVG HOUSEHOLD INCOME
27.8%
WAGE / INCOME GAP [ % ]
72.2¢/ $1
WAGE / INCOME GAP [ $ ]
0.47
INEQUALITY / GINI INDEX
527
TOTAL POPULATION
310
MALE POPULATION
217
FEMALE POPULATION
142.86
MALES / 100 FEMALES
70.00
FEMALES / 100 MALES
38.1
MEDIAN AGE
3.9
AVG FAMILY SIZE
3.4
AVG HOUSEHOLD SIZE
288
LABOR FORCE [ PEOPLE ]
62.7%
PERCENT IN LABOR FORCE
4.5%
UNEMPLOYMENT RATE
Lake Arthur Zip Codes
Lake Arthur Area Codes
Income in Lake Arthur
Income Overview in Lake Arthur
Per Capita Income in Lake Arthur is $24,676, while median incomes of families and households are $81,250 and $51,429 respectively.
| Characteristic | Number | Measure |
| Per Capita Income | 527 | $24,676 |
| Median Family Income | 110 | $81,250 |
| Mean Family Income | 110 | $92,739 |
| Median Household Income | 154 | $51,429 |
| Mean Household Income | 154 | $78,064 |
| Income Deficit | 110 | $0 |
| Wage / Income Gap (%) | 527 | 27.79% |
| Wage / Income Gap ($) | 527 | 72.21¢ per $1 |
| Gini / Inequality Index | 527 | 0.47 |
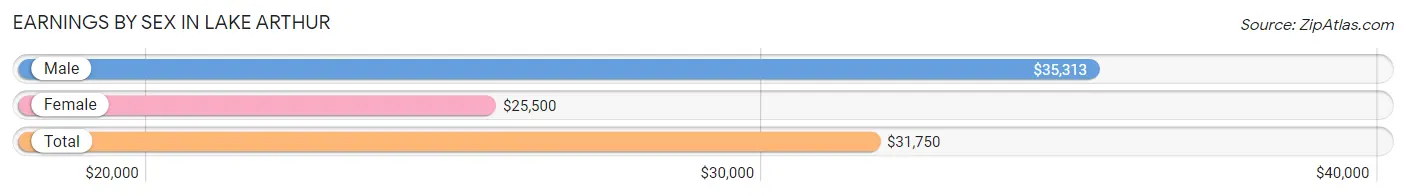
Earnings by Sex in Lake Arthur
Average Earnings in Lake Arthur are $31,750, $35,313 for men and $25,500 for women, a difference of 27.8%.
| Sex | Number | Average Earnings |
| Male | 196 (64.9%) | $35,313 |
| Female | 106 (35.1%) | $25,500 |
| Total | 302 (100.0%) | $31,750 |
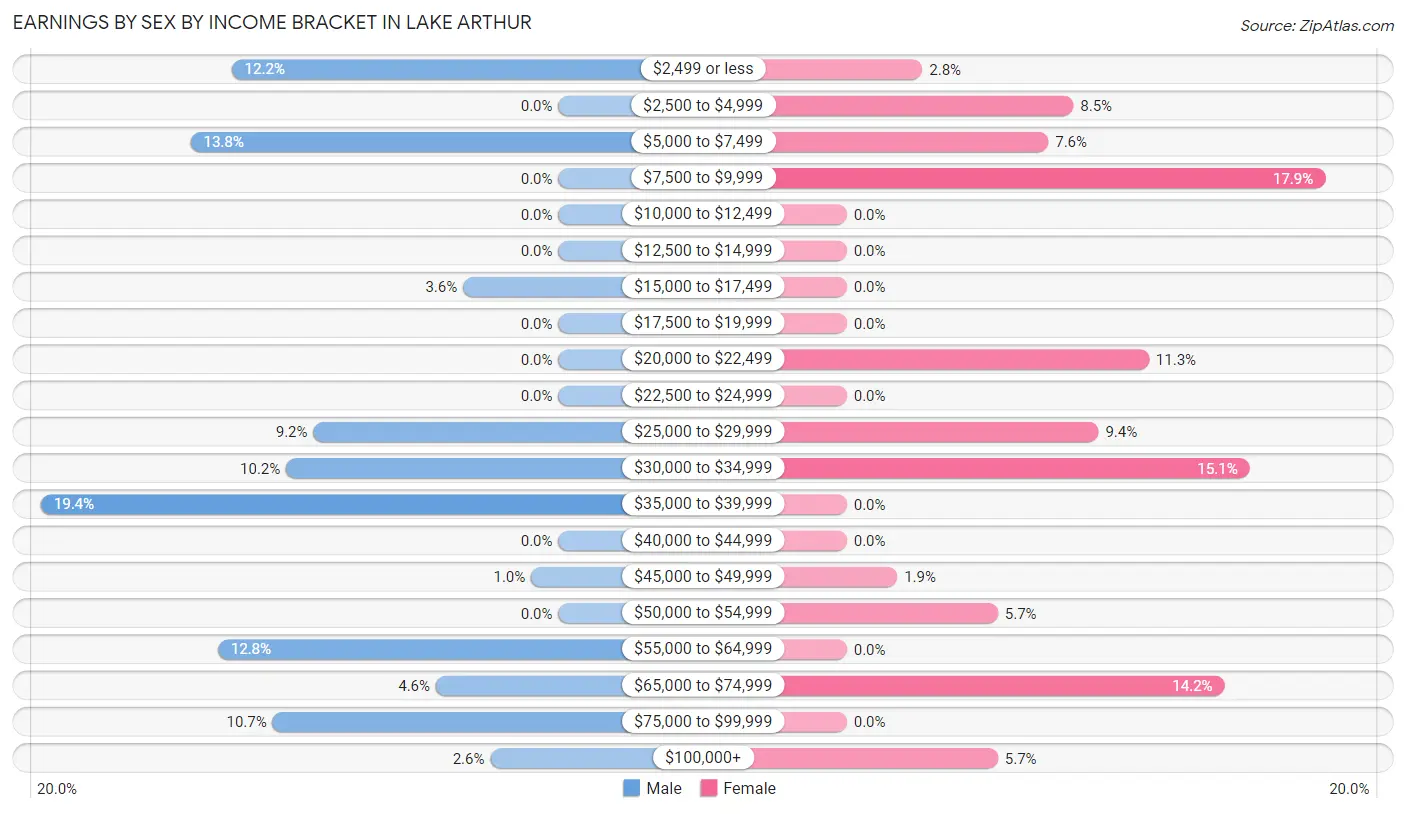
Earnings by Sex by Income Bracket in Lake Arthur
The most common earnings brackets in Lake Arthur are $35,000 to $39,999 for men (38 | 19.4%) and $7,500 to $9,999 for women (19 | 17.9%).
| Income | Male | Female |
| $2,499 or less | 24 (12.2%) | 3 (2.8%) |
| $2,500 to $4,999 | 0 (0.0%) | 9 (8.5%) |
| $5,000 to $7,499 | 27 (13.8%) | 8 (7.5%) |
| $7,500 to $9,999 | 0 (0.0%) | 19 (17.9%) |
| $10,000 to $12,499 | 0 (0.0%) | 0 (0.0%) |
| $12,500 to $14,999 | 0 (0.0%) | 0 (0.0%) |
| $15,000 to $17,499 | 7 (3.6%) | 0 (0.0%) |
| $17,500 to $19,999 | 0 (0.0%) | 0 (0.0%) |
| $20,000 to $22,499 | 0 (0.0%) | 12 (11.3%) |
| $22,500 to $24,999 | 0 (0.0%) | 0 (0.0%) |
| $25,000 to $29,999 | 18 (9.2%) | 10 (9.4%) |
| $30,000 to $34,999 | 20 (10.2%) | 16 (15.1%) |
| $35,000 to $39,999 | 38 (19.4%) | 0 (0.0%) |
| $40,000 to $44,999 | 0 (0.0%) | 0 (0.0%) |
| $45,000 to $49,999 | 2 (1.0%) | 2 (1.9%) |
| $50,000 to $54,999 | 0 (0.0%) | 6 (5.7%) |
| $55,000 to $64,999 | 25 (12.8%) | 0 (0.0%) |
| $65,000 to $74,999 | 9 (4.6%) | 15 (14.1%) |
| $75,000 to $99,999 | 21 (10.7%) | 0 (0.0%) |
| $100,000+ | 5 (2.5%) | 6 (5.7%) |
| Total | 196 (100.0%) | 106 (100.0%) |
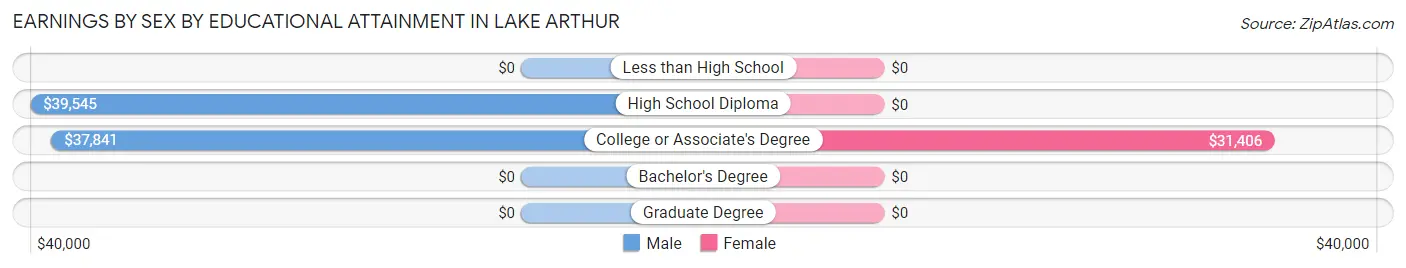
Earnings by Sex by Educational Attainment in Lake Arthur
Average earnings in Lake Arthur are $39,830 for men and $30,547 for women, a difference of 23.3%. Men with an educational attainment of high school diploma enjoy the highest average annual earnings of $39,545, while those with college or associate's degree education earn the least with $37,841. Women with an educational attainment of college or associate's degree earn the most with the average annual earnings of $31,406, while those with college or associate's degree education have the smallest earnings of $31,406.
| Educational Attainment | Male Income | Female Income |
| Less than High School | - | - |
| High School Diploma | $39,545 | $0 |
| College or Associate's Degree | $37,841 | $31,406 |
| Bachelor's Degree | - | - |
| Graduate Degree | - | - |
| Total | $39,830 | $30,547 |
Family Income in Lake Arthur
Family Income Brackets in Lake Arthur
According to the Lake Arthur family income data, there are 20 families falling into the $100,000 to $149,999 income range, which is the most common income bracket and makes up 18.2% of all families.
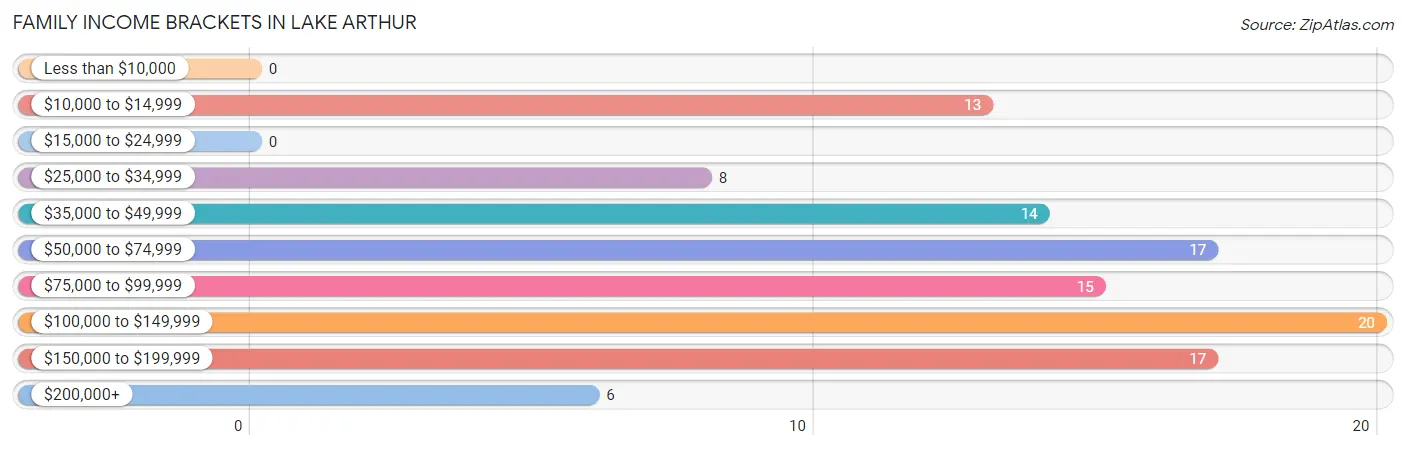
| Income Bracket | # Families | % Families |
| Less than $10,000 | 0 | 0.0% |
| $10,000 to $14,999 | 13 | 11.8% |
| $15,000 to $24,999 | 0 | 0.0% |
| $25,000 to $34,999 | 8 | 7.3% |
| $35,000 to $49,999 | 14 | 12.7% |
| $50,000 to $74,999 | 17 | 15.5% |
| $75,000 to $99,999 | 15 | 13.6% |
| $100,000 to $149,999 | 20 | 18.2% |
| $150,000 to $199,999 | 17 | 15.5% |
| $200,000+ | 6 | 5.5% |
Family Income by Famaliy Size in Lake Arthur
4-person families (22 | 20.0%) account for the highest median family income in Lake Arthur with $180,882 per family, while 4-person families (22 | 20.0%) have the highest median income of $45,220 per family member.
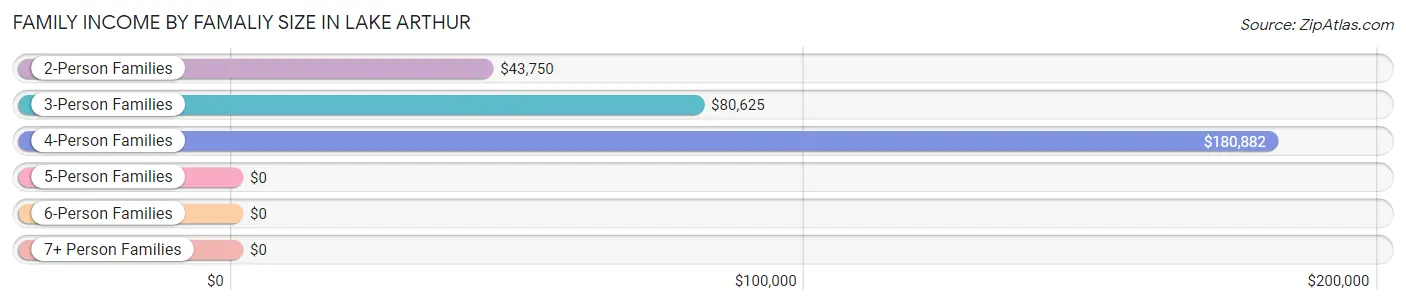
| Income Bracket | # Families | Median Income |
| 2-Person Families | 30 (27.3%) | $43,750 |
| 3-Person Families | 37 (33.6%) | $80,625 |
| 4-Person Families | 22 (20.0%) | $180,882 |
| 5-Person Families | 2 (1.8%) | $0 |
| 6-Person Families | 14 (12.7%) | $0 |
| 7+ Person Families | 5 (4.5%) | $0 |
| Total | 110 (100.0%) | $81,250 |
Family Income by Number of Earners in Lake Arthur
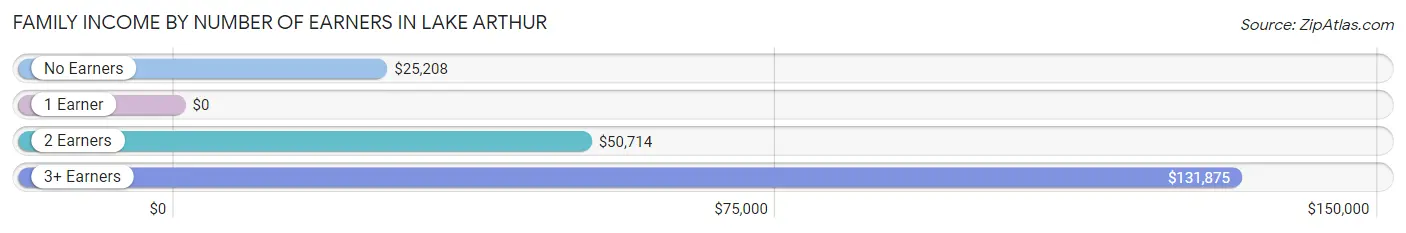
| Number of Earners | # Families | Median Income |
| No Earners | 15 (13.6%) | $25,208 |
| 1 Earner | 14 (12.7%) | $0 |
| 2 Earners | 32 (29.1%) | $50,714 |
| 3+ Earners | 49 (44.6%) | $131,875 |
| Total | 110 (100.0%) | $81,250 |
Household Income in Lake Arthur
Household Income Brackets in Lake Arthur
With 31 households falling in the category, the $25,000 to $34,999 income range is the most frequent in Lake Arthur, accounting for 20.1% of all households.
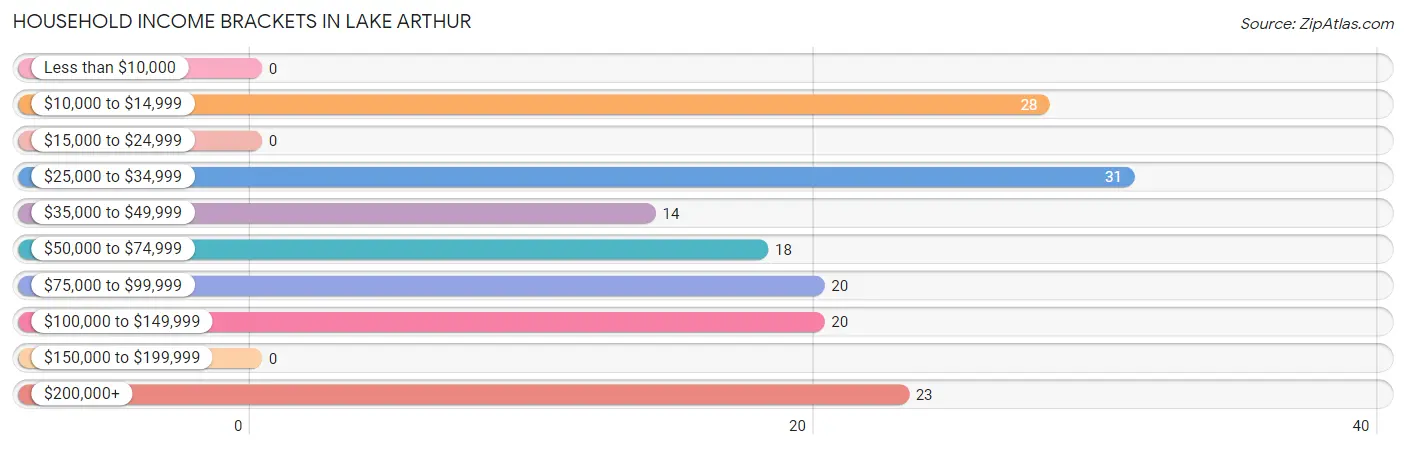
| Income Bracket | # Households | % Households |
| Less than $10,000 | 0 | 0.0% |
| $10,000 to $14,999 | 28 | 18.2% |
| $15,000 to $24,999 | 0 | 0.0% |
| $25,000 to $34,999 | 31 | 20.1% |
| $35,000 to $49,999 | 14 | 9.1% |
| $50,000 to $74,999 | 18 | 11.7% |
| $75,000 to $99,999 | 20 | 13.0% |
| $100,000 to $149,999 | 20 | 13.0% |
| $150,000 to $199,999 | 0 | 0.0% |
| $200,000+ | 23 | 14.9% |
Household Income by Householder Age in Lake Arthur
The median household income in Lake Arthur is $51,429, with the highest median household income of $13,906 found in the 65+ years age bracket for the primary householder. A total of 21 households (13.6%) fall into this category. Meanwhile, the 15 to 24 years age bracket for the primary householder has the lowest median household income of $0, with 1 households (0.6%) in this group.
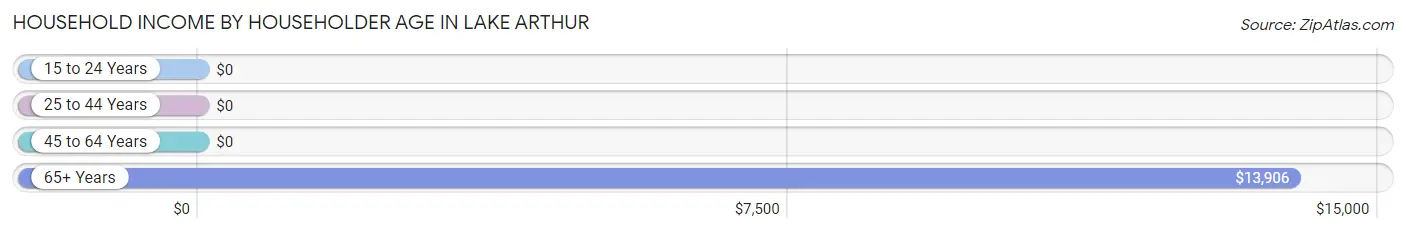
| Income Bracket | # Households | Median Income |
| 15 to 24 Years | 1 (0.6%) | $0 |
| 25 to 44 Years | 56 (36.4%) | $0 |
| 45 to 64 Years | 76 (49.3%) | $0 |
| 65+ Years | 21 (13.6%) | $13,906 |
| Total | 154 (100.0%) | $51,429 |
Poverty in Lake Arthur
Income Below Poverty by Sex and Age in Lake Arthur
With 9.7% poverty level for males and 16.1% for females among the residents of Lake Arthur, 45 to 54 year old males and 55 to 64 year old females are the most vulnerable to poverty, with 8 males (40.0%) and 23 females (51.1%) in their respective age groups living below the poverty level.
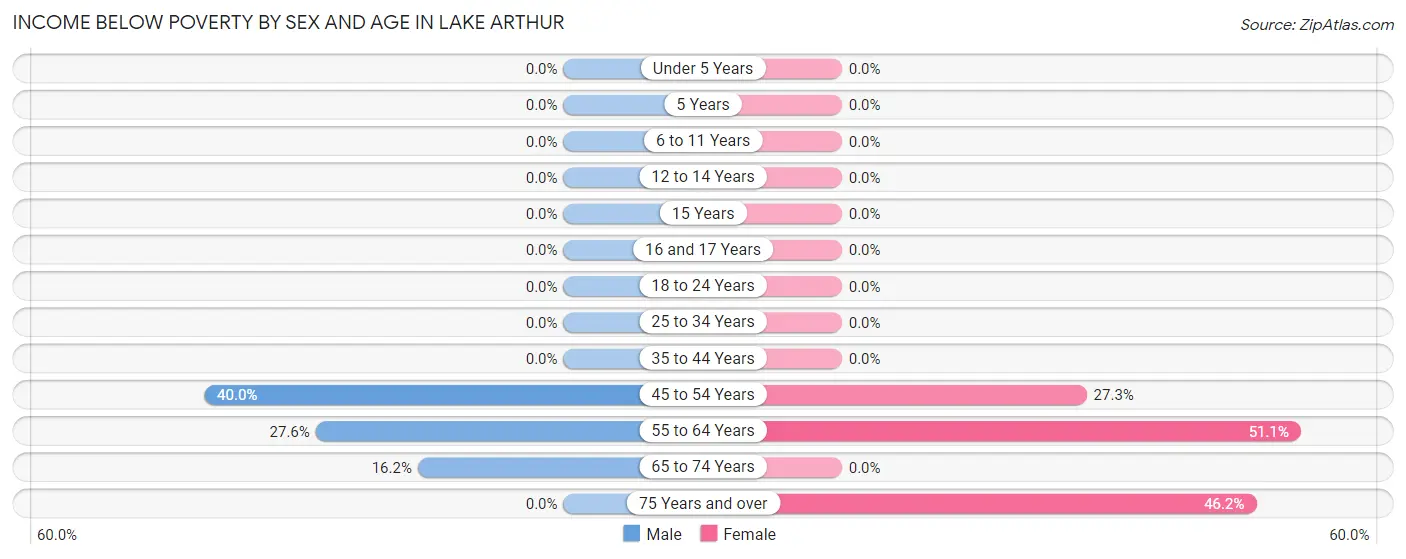
| Age Bracket | Male | Female |
| Under 5 Years | 0 (0.0%) | 0 (0.0%) |
| 5 Years | 0 (0.0%) | 0 (0.0%) |
| 6 to 11 Years | 0 (0.0%) | 0 (0.0%) |
| 12 to 14 Years | 0 (0.0%) | 0 (0.0%) |
| 15 Years | 0 (0.0%) | 0 (0.0%) |
| 16 and 17 Years | 0 (0.0%) | 0 (0.0%) |
| 18 to 24 Years | 0 (0.0%) | 0 (0.0%) |
| 25 to 34 Years | 0 (0.0%) | 0 (0.0%) |
| 35 to 44 Years | 0 (0.0%) | 0 (0.0%) |
| 45 to 54 Years | 8 (40.0%) | 6 (27.3%) |
| 55 to 64 Years | 16 (27.6%) | 23 (51.1%) |
| 65 to 74 Years | 6 (16.2%) | 0 (0.0%) |
| 75 Years and over | 0 (0.0%) | 6 (46.2%) |
| Total | 30 (9.7%) | 35 (16.1%) |
Income Above Poverty by Sex and Age in Lake Arthur
According to the poverty statistics in Lake Arthur, males aged under 5 years and females aged under 5 years are the age groups that are most secure financially, with 100.0% of males and 100.0% of females in these age groups living above the poverty line.
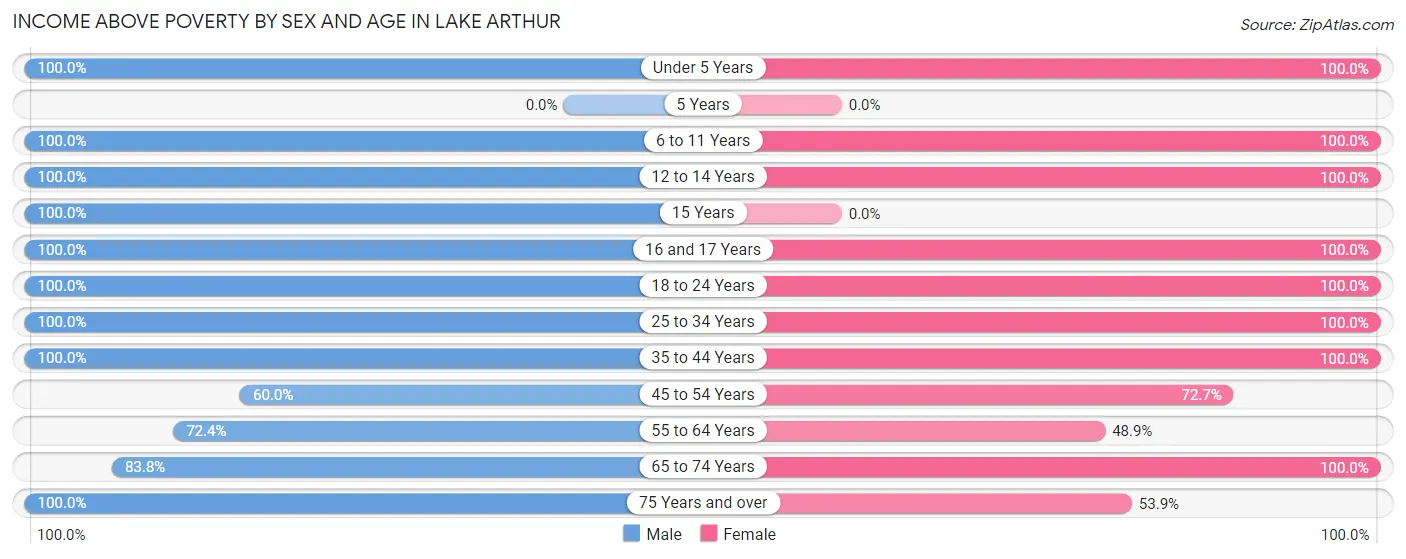
| Age Bracket | Male | Female |
| Under 5 Years | 3 (100.0%) | 4 (100.0%) |
| 5 Years | 0 (0.0%) | 0 (0.0%) |
| 6 to 11 Years | 6 (100.0%) | 18 (100.0%) |
| 12 to 14 Years | 11 (100.0%) | 8 (100.0%) |
| 15 Years | 18 (100.0%) | 0 (0.0%) |
| 16 and 17 Years | 9 (100.0%) | 6 (100.0%) |
| 18 to 24 Years | 60 (100.0%) | 31 (100.0%) |
| 25 to 34 Years | 33 (100.0%) | 22 (100.0%) |
| 35 to 44 Years | 52 (100.0%) | 35 (100.0%) |
| 45 to 54 Years | 12 (60.0%) | 16 (72.7%) |
| 55 to 64 Years | 42 (72.4%) | 22 (48.9%) |
| 65 to 74 Years | 31 (83.8%) | 13 (100.0%) |
| 75 Years and over | 3 (100.0%) | 7 (53.8%) |
| Total | 280 (90.3%) | 182 (83.9%) |
Income Below Poverty Among Married-Couple Families in Lake Arthur
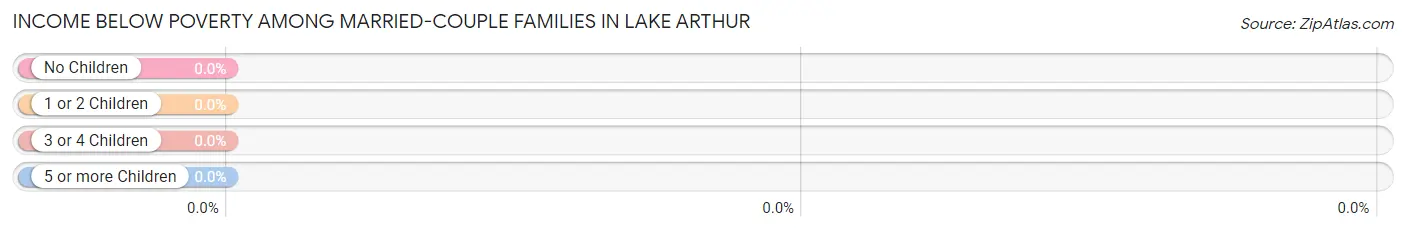
| Children | Above Poverty | Below Poverty |
| No Children | 30 (100.0%) | 0 (0.0%) |
| 1 or 2 Children | 13 (100.0%) | 0 (0.0%) |
| 3 or 4 Children | 12 (100.0%) | 0 (0.0%) |
| 5 or more Children | 0 (0.0%) | 0 (0.0%) |
| Total | 55 (100.0%) | 0 (0.0%) |
Income Below Poverty Among Single-Parent Households in Lake Arthur
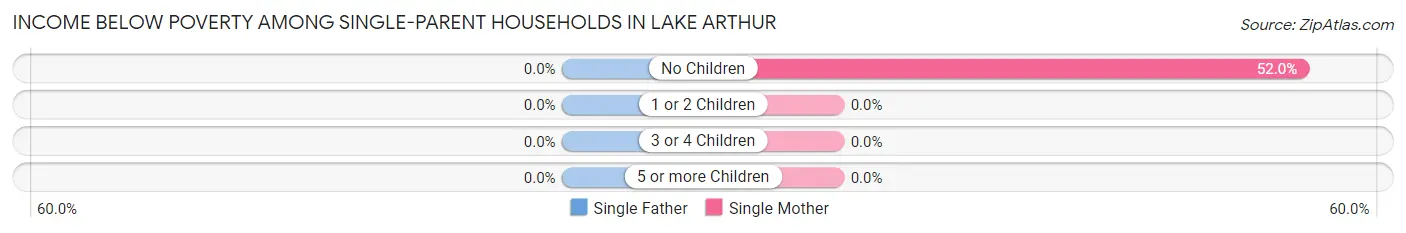
| Children | Single Father | Single Mother |
| No Children | 0 (0.0%) | 13 (52.0%) |
| 1 or 2 Children | 0 (0.0%) | 0 (0.0%) |
| 3 or 4 Children | 0 (0.0%) | 0 (0.0%) |
| 5 or more Children | 0 (0.0%) | 0 (0.0%) |
| Total | 0 (0.0%) | 13 (38.2%) |
Income Below Poverty Among Married-Couple vs Single-Parent Households in Lake Arthur
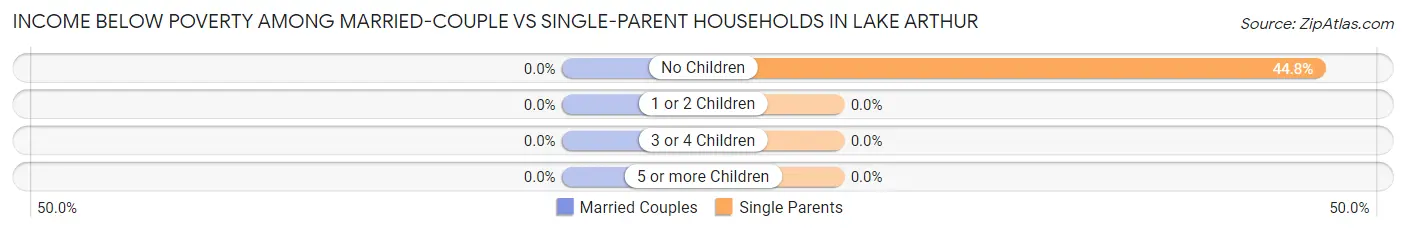
| Children | Married-Couple Families | Single-Parent Households |
| No Children | 0 (0.0%) | 13 (44.8%) |
| 1 or 2 Children | 0 (0.0%) | 0 (0.0%) |
| 3 or 4 Children | 0 (0.0%) | 0 (0.0%) |
| 5 or more Children | 0 (0.0%) | 0 (0.0%) |
| Total | 0 (0.0%) | 13 (23.6%) |
Race in Lake Arthur
The most populous races in Lake Arthur are White / Caucasian (361 | 68.5%), Hispanic or Latino (325 | 61.7%), and Two or more Races (107 | 20.3%).
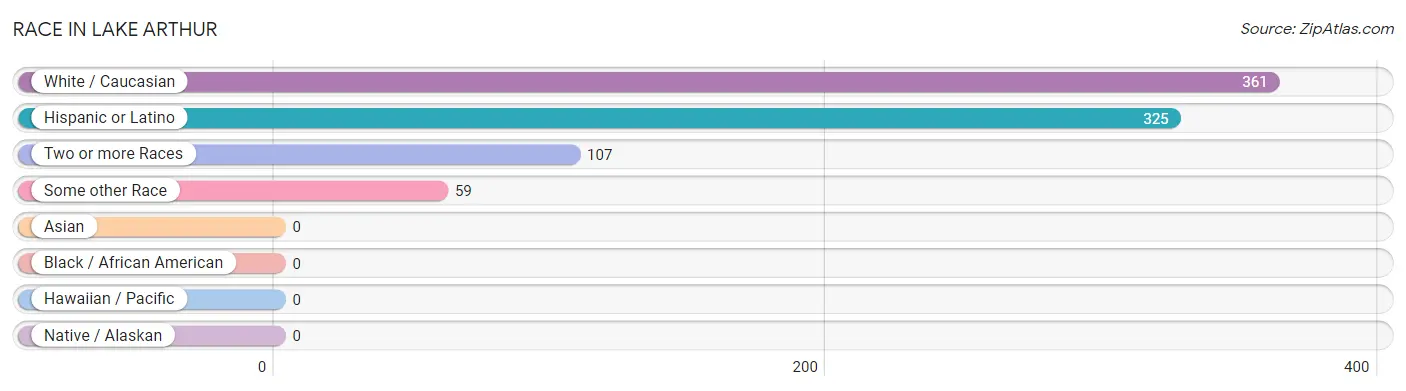
| Race | # Population | % Population |
| Asian | 0 | 0.0% |
| Black / African American | 0 | 0.0% |
| Hawaiian / Pacific | 0 | 0.0% |
| Hispanic or Latino | 325 | 61.7% |
| Native / Alaskan | 0 | 0.0% |
| White / Caucasian | 361 | 68.5% |
| Two or more Races | 107 | 20.3% |
| Some other Race | 59 | 11.2% |
| Total | 527 | 100.0% |
Ancestry in Lake Arthur
The most populous ancestries reported in Lake Arthur are Mexican (309 | 58.6%), Irish (45 | 8.5%), English (27 | 5.1%), Spanish (7 | 1.3%), and Spaniard (6 | 1.1%), together accounting for 74.8% of all Lake Arthur residents.
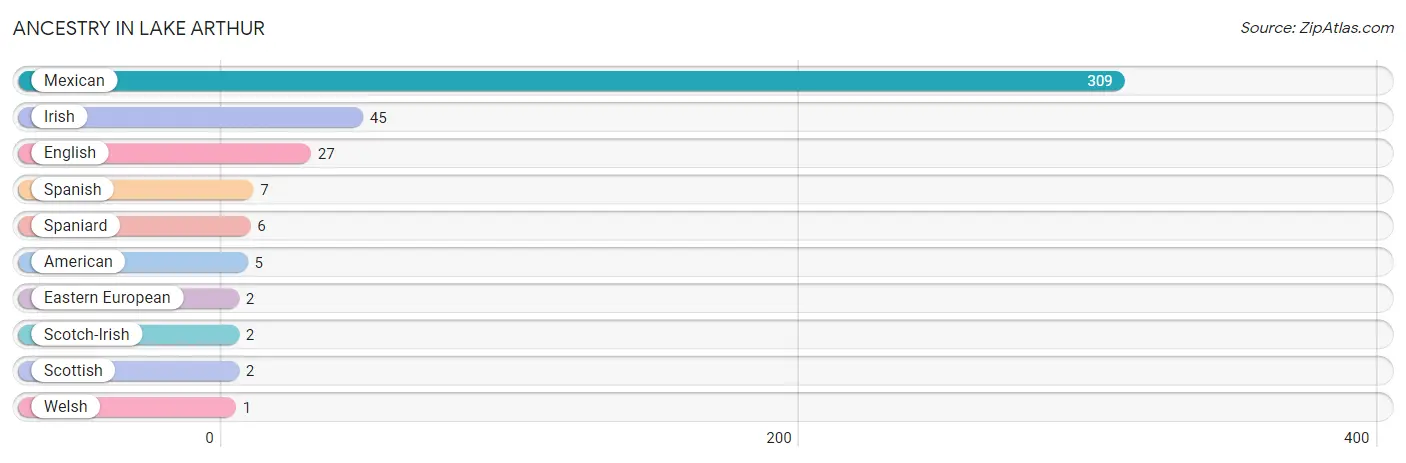
| Ancestry | # Population | % Population |
| American | 5 | 0.9% |
| Eastern European | 2 | 0.4% |
| English | 27 | 5.1% |
| Irish | 45 | 8.5% |
| Mexican | 309 | 58.6% |
| Scotch-Irish | 2 | 0.4% |
| Scottish | 2 | 0.4% |
| Spaniard | 6 | 1.1% |
| Spanish | 7 | 1.3% |
| Welsh | 1 | 0.2% | View All 10 Rows |
Immigrants in Lake Arthur
The most numerous immigrant groups reported in Lake Arthur came from Central America (25 | 4.7%), Latin America (25 | 4.7%), and Mexico (25 | 4.7%), together accounting for 14.2% of all Lake Arthur residents.
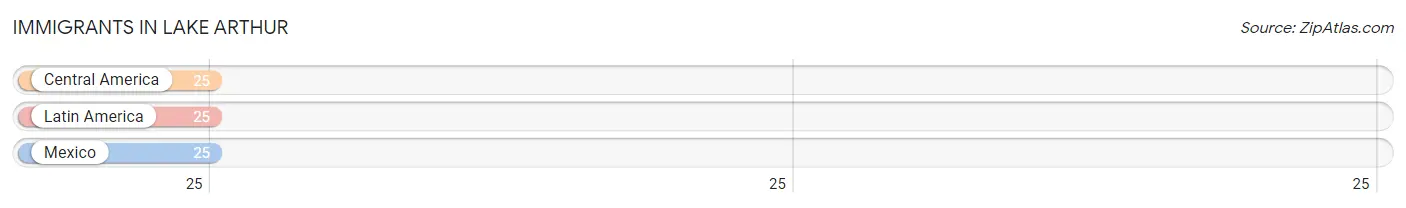
| Immigration Origin | # Population | % Population |
| Central America | 25 | 4.7% |
| Latin America | 25 | 4.7% |
| Mexico | 25 | 4.7% | View All 3 Rows |
Sex and Age in Lake Arthur
Sex and Age in Lake Arthur
The most populous age groups in Lake Arthur are 15 to 19 Years (74 | 23.9%) for men and 15 to 19 Years (35 | 16.1%) for women.
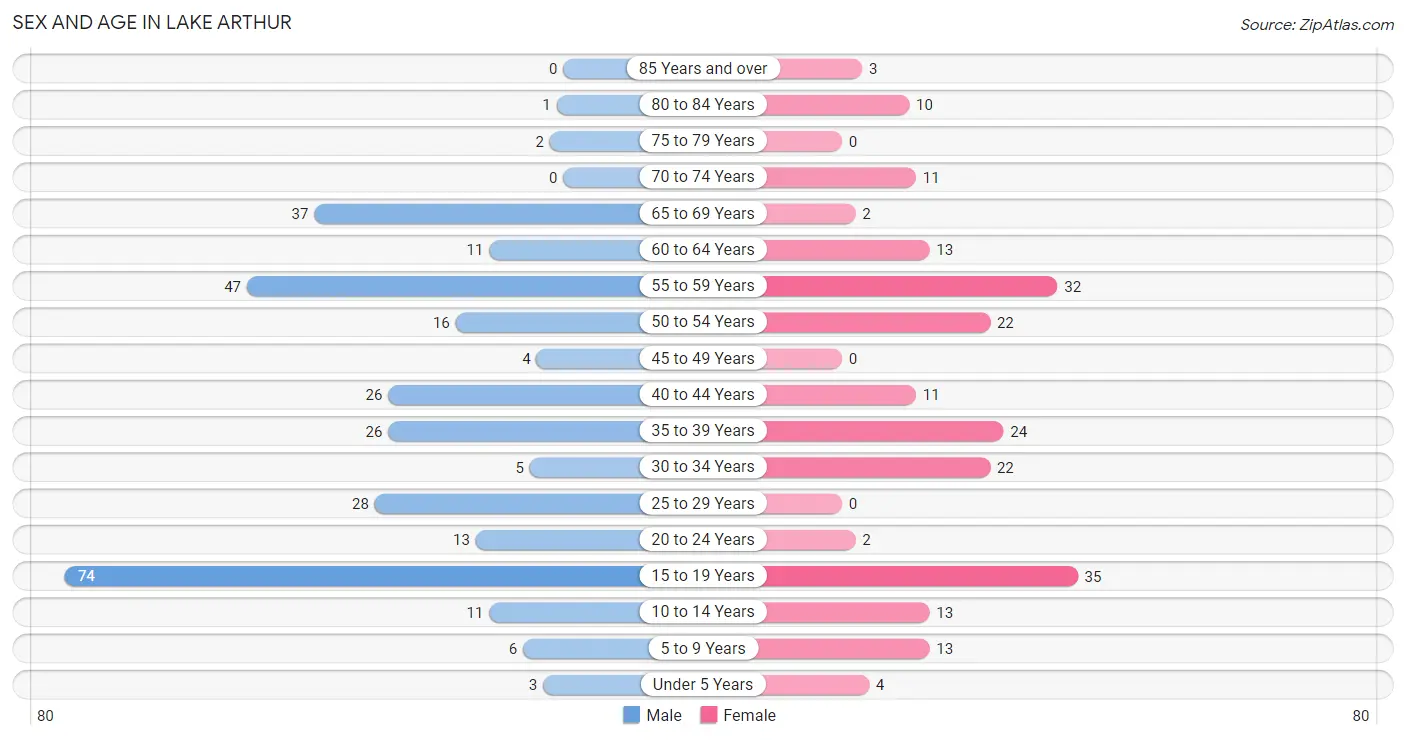
| Age Bracket | Male | Female |
| Under 5 Years | 3 (1.0%) | 4 (1.8%) |
| 5 to 9 Years | 6 (1.9%) | 13 (6.0%) |
| 10 to 14 Years | 11 (3.5%) | 13 (6.0%) |
| 15 to 19 Years | 74 (23.9%) | 35 (16.1%) |
| 20 to 24 Years | 13 (4.2%) | 2 (0.9%) |
| 25 to 29 Years | 28 (9.0%) | 0 (0.0%) |
| 30 to 34 Years | 5 (1.6%) | 22 (10.1%) |
| 35 to 39 Years | 26 (8.4%) | 24 (11.1%) |
| 40 to 44 Years | 26 (8.4%) | 11 (5.1%) |
| 45 to 49 Years | 4 (1.3%) | 0 (0.0%) |
| 50 to 54 Years | 16 (5.2%) | 22 (10.1%) |
| 55 to 59 Years | 47 (15.2%) | 32 (14.7%) |
| 60 to 64 Years | 11 (3.5%) | 13 (6.0%) |
| 65 to 69 Years | 37 (11.9%) | 2 (0.9%) |
| 70 to 74 Years | 0 (0.0%) | 11 (5.1%) |
| 75 to 79 Years | 2 (0.6%) | 0 (0.0%) |
| 80 to 84 Years | 1 (0.3%) | 10 (4.6%) |
| 85 Years and over | 0 (0.0%) | 3 (1.4%) |
| Total | 310 (100.0%) | 217 (100.0%) |
Families and Households in Lake Arthur
Median Family Size in Lake Arthur
The median family size in Lake Arthur is 3.90 persons per family, with single male/father families (21 | 19.1%) accounting for the largest median family size of 4.29 persons per family. On the other hand, single female/mother families (34 | 30.9%) represent the smallest median family size with 3.41 persons per family.
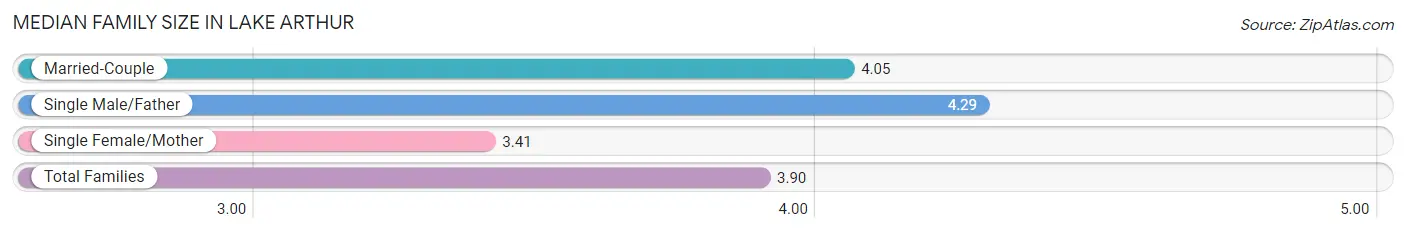
| Family Type | # Families | Family Size |
| Married-Couple | 55 (50.0%) | 4.05 |
| Single Male/Father | 21 (19.1%) | 4.29 |
| Single Female/Mother | 34 (30.9%) | 3.41 |
| Total Families | 110 (100.0%) | 3.90 |
Median Household Size in Lake Arthur
The median household size in Lake Arthur is 3.42 persons per household, with single male/father households (21 | 13.6%) accounting for the largest median household size of 5.05 persons per household. non-family households (44 | 28.6%) represent the smallest median household size with 1.20 persons per household.
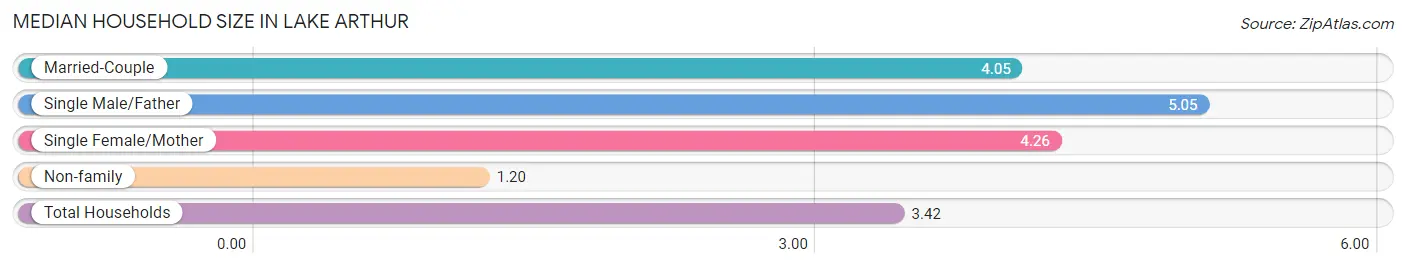
| Household Type | # Households | Household Size |
| Married-Couple | 55 (35.7%) | 4.05 |
| Single Male/Father | 21 (13.6%) | 5.05 |
| Single Female/Mother | 34 (22.1%) | 4.26 |
| Non-family | 44 (28.6%) | 1.20 |
| Total Households | 154 (100.0%) | 3.42 |
Household Size by Marriage Status in Lake Arthur
Out of a total of 154 households in Lake Arthur, 110 (71.4%) are family households, while 44 (28.6%) are nonfamily households. The most numerous type of family households are 3-person households, comprising 37, and the most common type of nonfamily households are 1-person households, comprising 37.
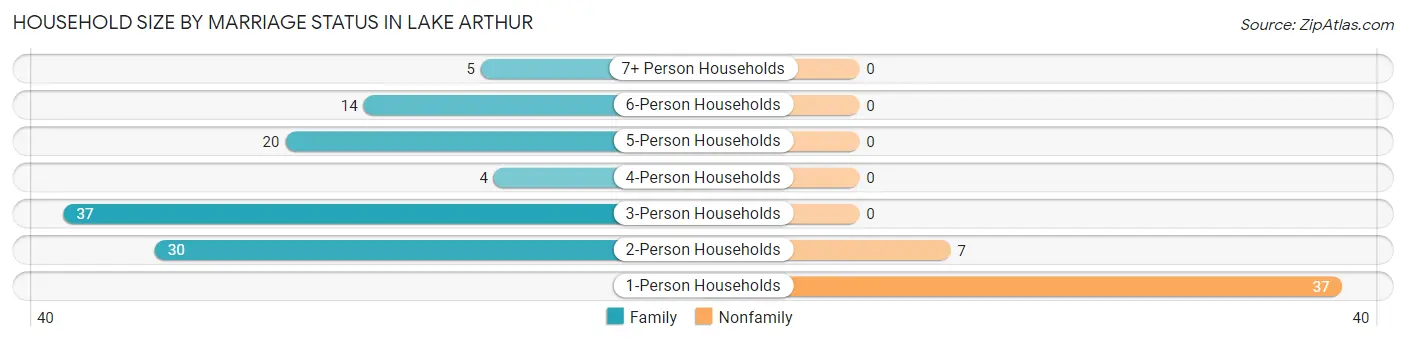
| Household Size | Family Households | Nonfamily Households |
| 1-Person Households | - | 37 (24.0%) |
| 2-Person Households | 30 (19.5%) | 7 (4.5%) |
| 3-Person Households | 37 (24.0%) | 0 (0.0%) |
| 4-Person Households | 4 (2.6%) | 0 (0.0%) |
| 5-Person Households | 20 (13.0%) | 0 (0.0%) |
| 6-Person Households | 14 (9.1%) | 0 (0.0%) |
| 7+ Person Households | 5 (3.3%) | 0 (0.0%) |
| Total | 110 (71.4%) | 44 (28.6%) |
Female Fertility in Lake Arthur
Fertility by Age in Lake Arthur
Average fertility rate in Lake Arthur is 32.0 births per 1,000 women. Women in the age bracket of 20 to 34 years have the highest fertility rate with 125.0 births per 1,000 women. Women in the age bracket of 20 to 34 years acount for 100.0% of all women with births.
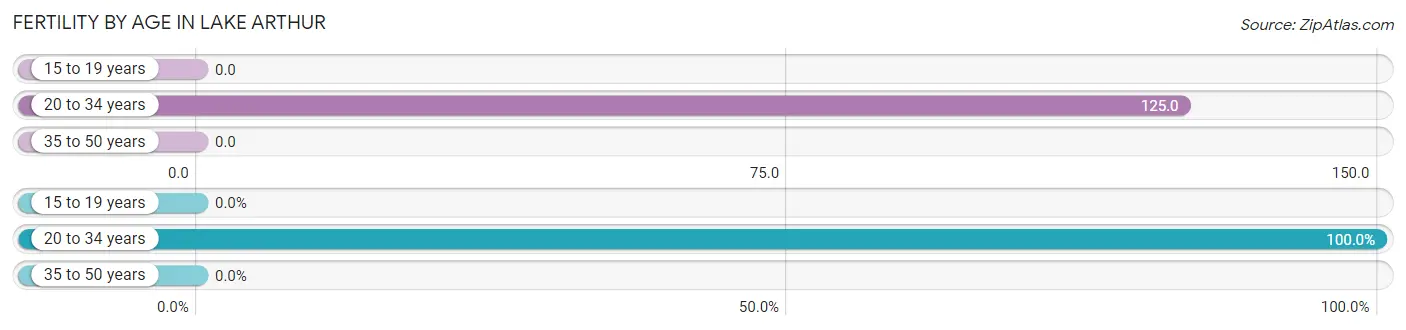
| Age Bracket | Women with Births | Births / 1,000 Women |
| 15 to 19 years | 0 (0.0%) | 0.0 |
| 20 to 34 years | 3 (100.0%) | 125.0 |
| 35 to 50 years | 0 (0.0%) | 0.0 |
| Total | 3 (100.0%) | 32.0 |
Fertility by Age by Marriage Status in Lake Arthur
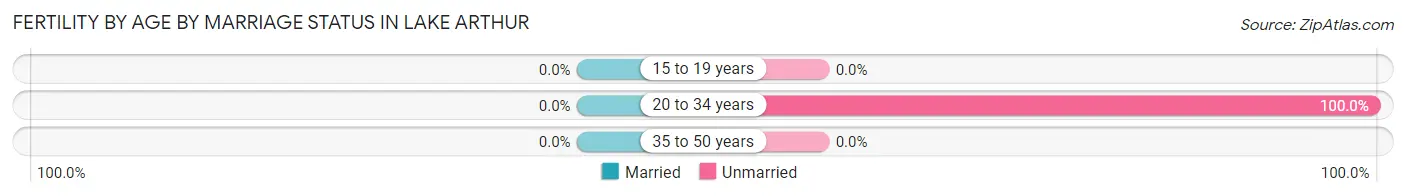
| Age Bracket | Married | Unmarried |
| 15 to 19 years | 0 (0.0%) | 0 (0.0%) |
| 20 to 34 years | 0 (0.0%) | 3 (100.0%) |
| 35 to 50 years | 0 (0.0%) | 0 (0.0%) |
| Total | 0 (0.0%) | 3 (100.0%) |
Fertility by Education in Lake Arthur
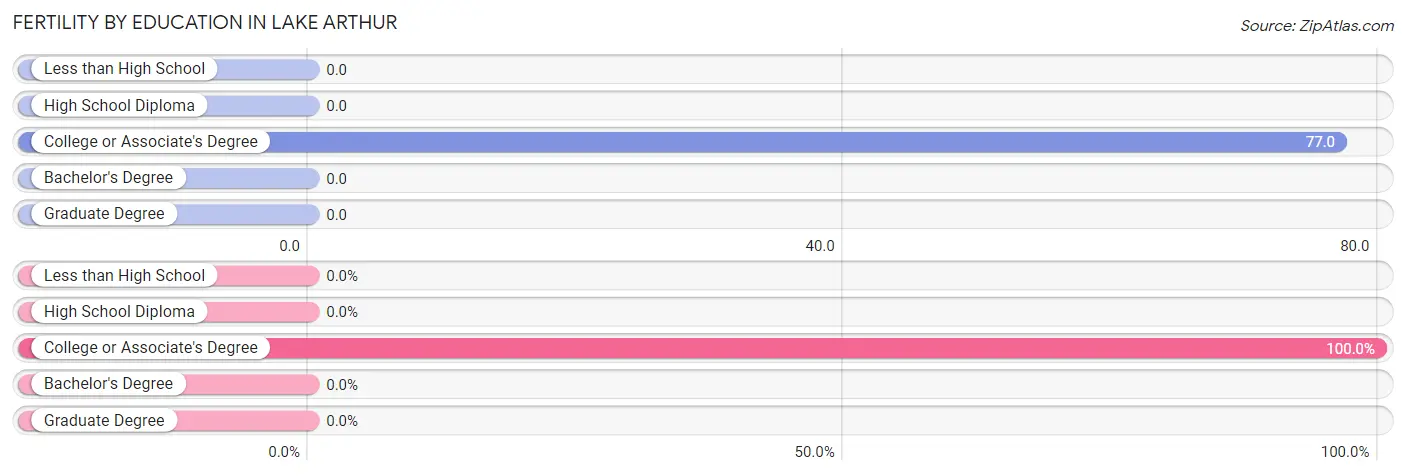
| Educational Attainment | Women with Births | Births / 1,000 Women |
| Less than High School | 0 (0.0%) | 0.0 |
| High School Diploma | 0 (0.0%) | 0.0 |
| College or Associate's Degree | 3 (100.0%) | 77.0 |
| Bachelor's Degree | 0 (0.0%) | 0.0 |
| Graduate Degree | 0 (0.0%) | 0.0 |
| Total | 3 (100.0%) | 32.0 |
Fertility by Education by Marriage Status in Lake Arthur
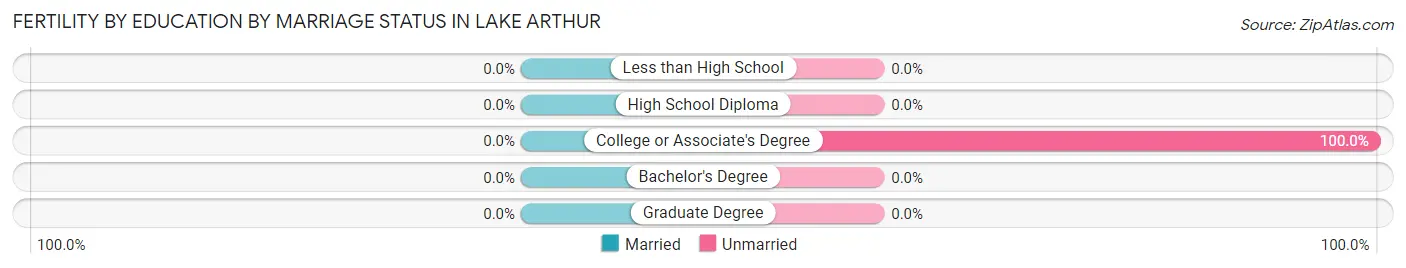
| Educational Attainment | Married | Unmarried |
| Less than High School | 0 (0.0%) | 0 (0.0%) |
| High School Diploma | 0 (0.0%) | 0 (0.0%) |
| College or Associate's Degree | 0 (0.0%) | 3 (100.0%) |
| Bachelor's Degree | 0 (0.0%) | 0 (0.0%) |
| Graduate Degree | 0 (0.0%) | 0 (0.0%) |
| Total | 0 (0.0%) | 3 (100.0%) |
Employment Characteristics in Lake Arthur
Employment by Class of Employer in Lake Arthur
Among the 274 employed individuals in Lake Arthur, private company employees (202 | 73.7%), self-employed (not incorporated) (27 | 9.9%), and self-employed (incorporated) (10 | 3.6%) make up the most common classes of employment.
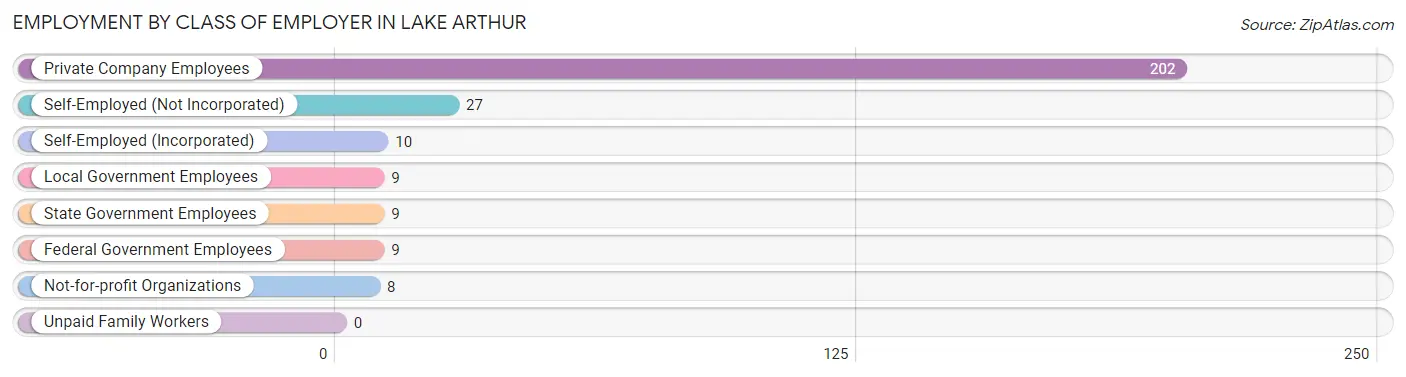
| Employer Class | # Employees | % Employees |
| Private Company Employees | 202 | 73.7% |
| Self-Employed (Incorporated) | 10 | 3.6% |
| Self-Employed (Not Incorporated) | 27 | 9.9% |
| Not-for-profit Organizations | 8 | 2.9% |
| Local Government Employees | 9 | 3.3% |
| State Government Employees | 9 | 3.3% |
| Federal Government Employees | 9 | 3.3% |
| Unpaid Family Workers | 0 | 0.0% |
| Total | 274 | 100.0% |
Employment Status by Age in Lake Arthur
According to the labor force statistics for Lake Arthur, out of the total population over 16 years of age (459), 62.7% or 288 individuals are in the labor force, with 4.5% or 13 of them unemployed. The age group with the highest labor force participation rate is 20 to 24 years, with 100.0% or 15 individuals in the labor force. Within the labor force, the 20 to 24 years age range has the highest percentage of unemployed individuals, with 86.7% or 13 of them being unemployed.
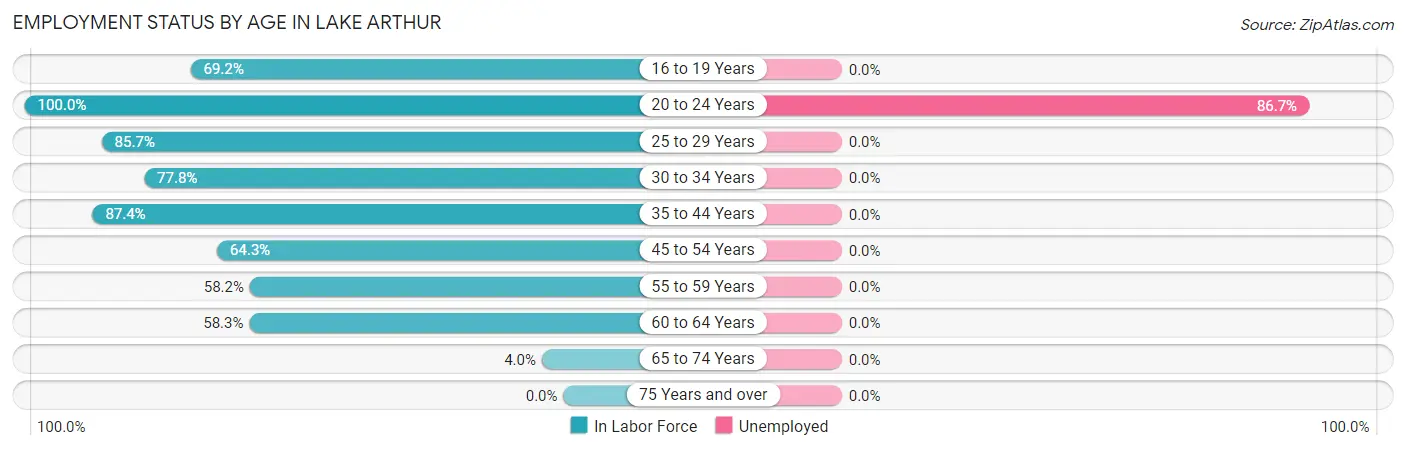
| Age Bracket | In Labor Force | Unemployed |
| 16 to 19 Years | 63 (69.2%) | 0 (0.0%) |
| 20 to 24 Years | 15 (100.0%) | 13 (86.7%) |
| 25 to 29 Years | 24 (85.7%) | 0 (0.0%) |
| 30 to 34 Years | 21 (77.8%) | 0 (0.0%) |
| 35 to 44 Years | 76 (87.4%) | 0 (0.0%) |
| 45 to 54 Years | 27 (64.3%) | 0 (0.0%) |
| 55 to 59 Years | 46 (58.2%) | 0 (0.0%) |
| 60 to 64 Years | 14 (58.3%) | 0 (0.0%) |
| 65 to 74 Years | 2 (4.0%) | 0 (0.0%) |
| 75 Years and over | 0 (0.0%) | 0 (0.0%) |
| Total | 288 (62.7%) | 13 (4.5%) |
Employment Status by Educational Attainment in Lake Arthur
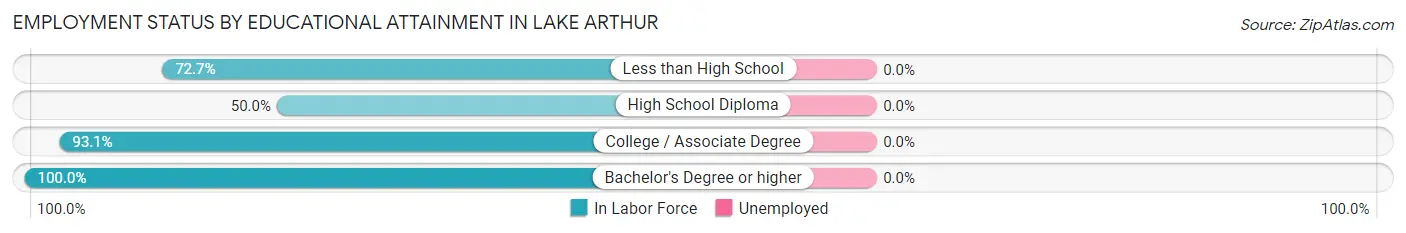
| Educational Attainment | In Labor Force | Unemployed |
| Less than High School | 48 (72.7%) | 0 (0.0%) |
| High School Diploma | 54 (50.0%) | 0 (0.0%) |
| College / Associate Degree | 95 (93.1%) | 0 (0.0%) |
| Bachelor's Degree or higher | 11 (100.0%) | 0 (0.0%) |
| Total | 208 (72.5%) | 0 (0.0%) |
Employment Occupations by Sex in Lake Arthur
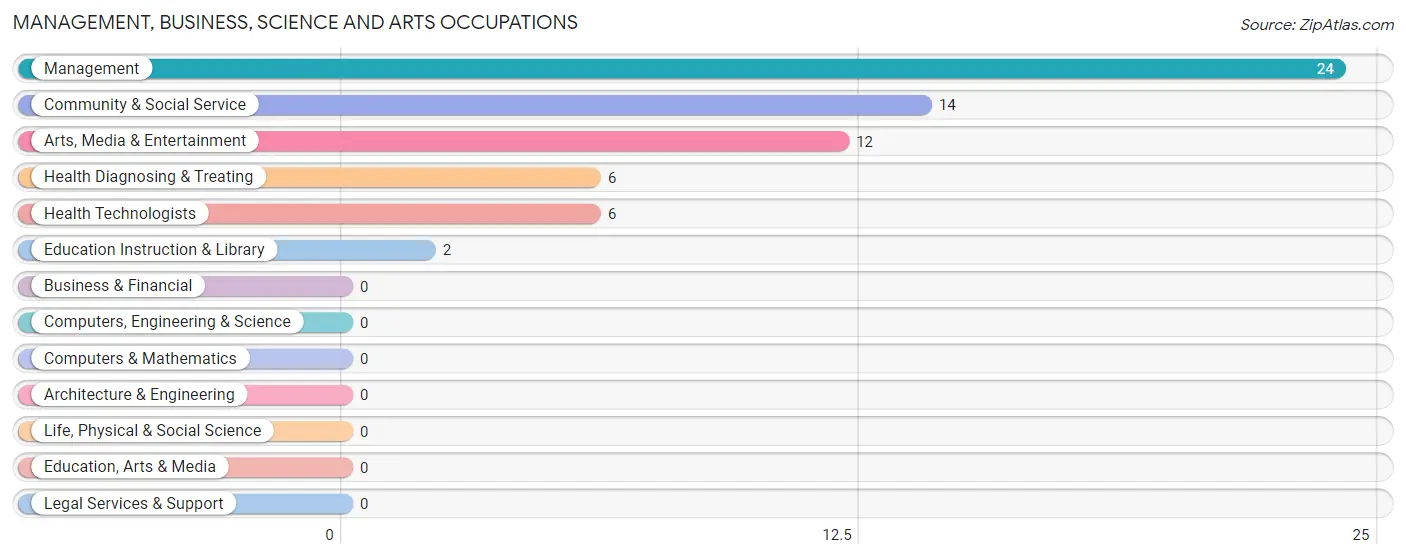
Management, Business, Science and Arts Occupations
The most common Management, Business, Science and Arts occupations in Lake Arthur are Management (24 | 8.7%), Community & Social Service (14 | 5.1%), Arts, Media & Entertainment (12 | 4.4%), Health Diagnosing & Treating (6 | 2.2%), and Health Technologists (6 | 2.2%).
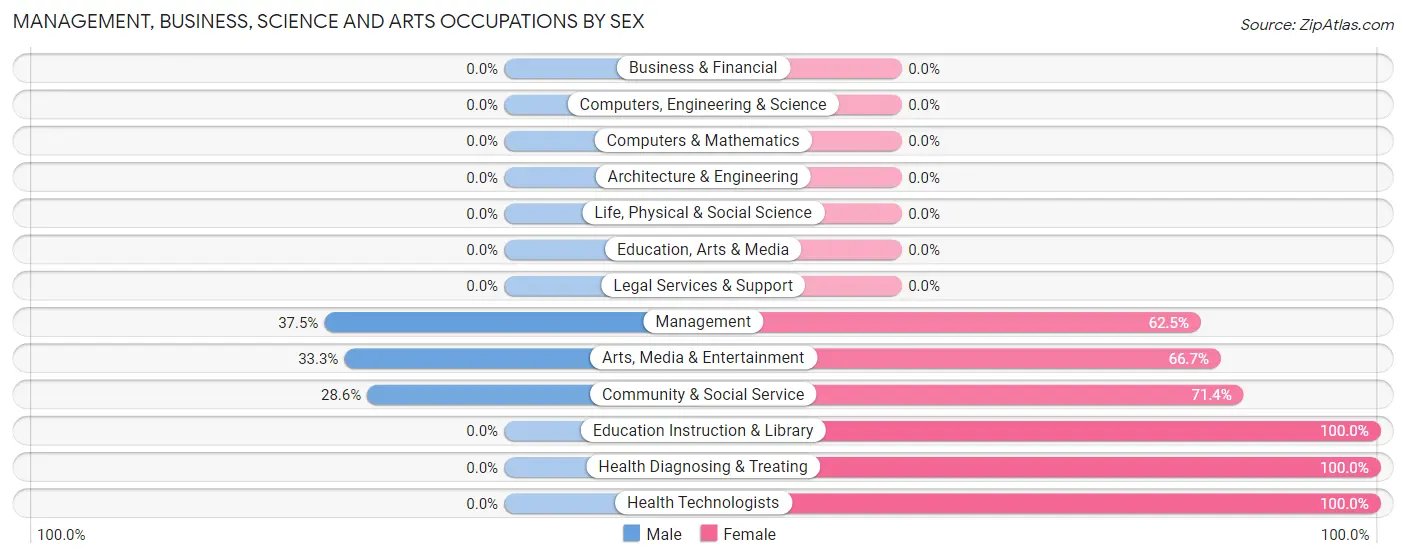
Management, Business, Science and Arts Occupations by Sex
Within the Management, Business, Science and Arts occupations in Lake Arthur, the most male-oriented occupations are Management (37.5%), Arts, Media & Entertainment (33.3%), and Community & Social Service (28.6%), while the most female-oriented occupations are Education Instruction & Library (100.0%), Health Diagnosing & Treating (100.0%), and Health Technologists (100.0%).
| Occupation | Male | Female |
| Management | 9 (37.5%) | 15 (62.5%) |
| Business & Financial | 0 (0.0%) | 0 (0.0%) |
| Computers, Engineering & Science | 0 (0.0%) | 0 (0.0%) |
| Computers & Mathematics | 0 (0.0%) | 0 (0.0%) |
| Architecture & Engineering | 0 (0.0%) | 0 (0.0%) |
| Life, Physical & Social Science | 0 (0.0%) | 0 (0.0%) |
| Community & Social Service | 4 (28.6%) | 10 (71.4%) |
| Education, Arts & Media | 0 (0.0%) | 0 (0.0%) |
| Legal Services & Support | 0 (0.0%) | 0 (0.0%) |
| Education Instruction & Library | 0 (0.0%) | 2 (100.0%) |
| Arts, Media & Entertainment | 4 (33.3%) | 8 (66.7%) |
| Health Diagnosing & Treating | 0 (0.0%) | 6 (100.0%) |
| Health Technologists | 0 (0.0%) | 6 (100.0%) |
| Total (Category) | 13 (29.5%) | 31 (70.5%) |
| Total (Overall) | 169 (61.5%) | 106 (38.6%) |
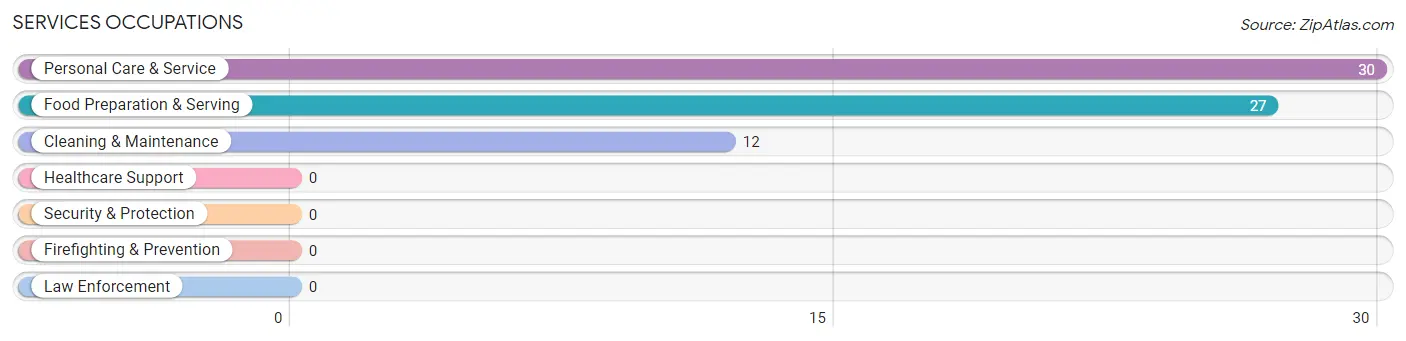
Services Occupations
The most common Services occupations in Lake Arthur are Personal Care & Service (30 | 10.9%), Food Preparation & Serving (27 | 9.8%), and Cleaning & Maintenance (12 | 4.4%).
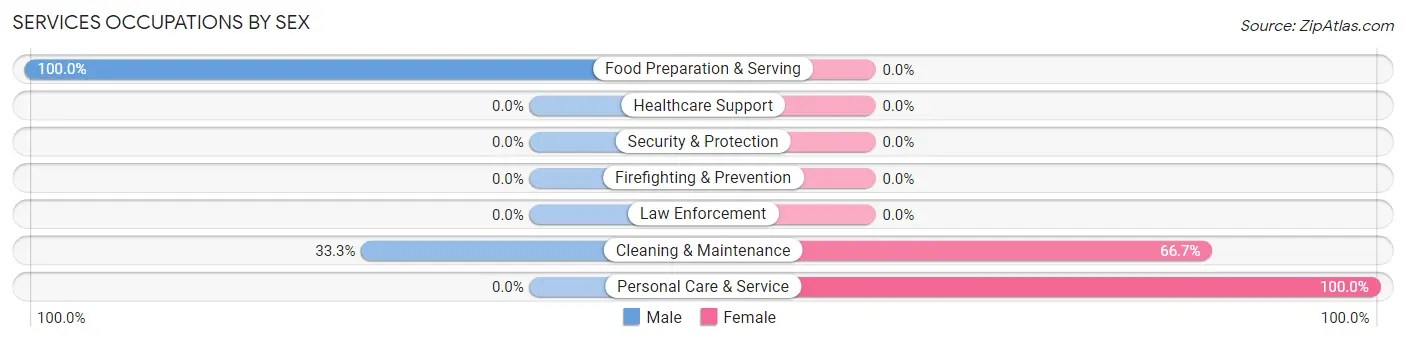
Services Occupations by Sex
Within the Services occupations in Lake Arthur, the most male-oriented occupations are Food Preparation & Serving (100.0%), and Cleaning & Maintenance (33.3%), while the most female-oriented occupations are Personal Care & Service (100.0%), and Cleaning & Maintenance (66.7%).
| Occupation | Male | Female |
| Healthcare Support | 0 (0.0%) | 0 (0.0%) |
| Security & Protection | 0 (0.0%) | 0 (0.0%) |
| Firefighting & Prevention | 0 (0.0%) | 0 (0.0%) |
| Law Enforcement | 0 (0.0%) | 0 (0.0%) |
| Food Preparation & Serving | 27 (100.0%) | 0 (0.0%) |
| Cleaning & Maintenance | 4 (33.3%) | 8 (66.7%) |
| Personal Care & Service | 0 (0.0%) | 30 (100.0%) |
| Total (Category) | 31 (44.9%) | 38 (55.1%) |
| Total (Overall) | 169 (61.5%) | 106 (38.6%) |
Sales and Office Occupations
The most common Sales and Office occupations in Lake Arthur are Sales & Related (48 | 17.4%), and Office & Administration (11 | 4.0%).
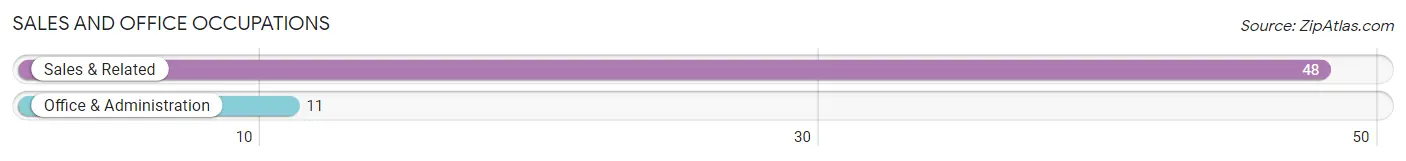
Sales and Office Occupations by Sex
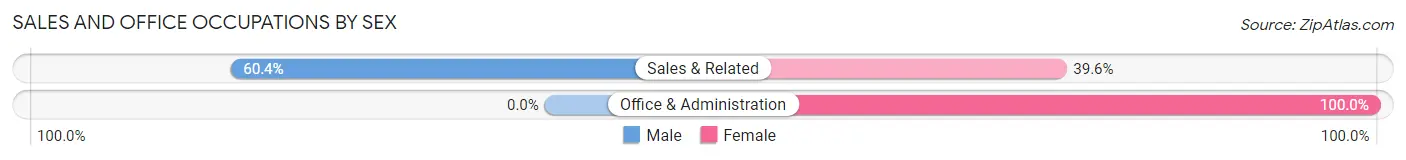
| Occupation | Male | Female |
| Sales & Related | 29 (60.4%) | 19 (39.6%) |
| Office & Administration | 0 (0.0%) | 11 (100.0%) |
| Total (Category) | 29 (49.1%) | 30 (50.8%) |
| Total (Overall) | 169 (61.5%) | 106 (38.6%) |
Natural Resources, Construction and Maintenance Occupations
The most common Natural Resources, Construction and Maintenance occupations in Lake Arthur are Construction & Extraction (47 | 17.1%), Installation, Maintenance & Repair (6 | 2.2%), and Farming, Fishing & Forestry (4 | 1.5%).
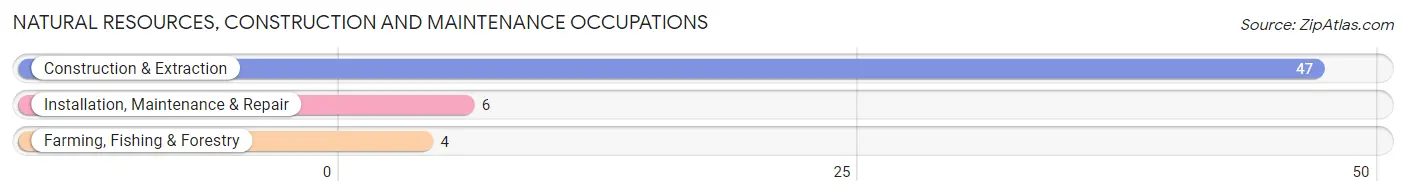
Natural Resources, Construction and Maintenance Occupations by Sex
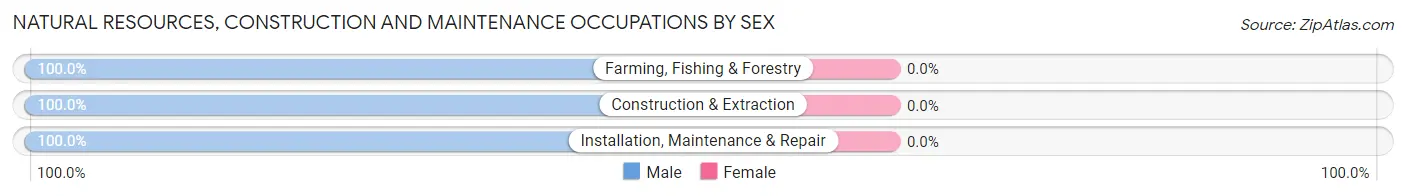
| Occupation | Male | Female |
| Farming, Fishing & Forestry | 4 (100.0%) | 0 (0.0%) |
| Construction & Extraction | 47 (100.0%) | 0 (0.0%) |
| Installation, Maintenance & Repair | 6 (100.0%) | 0 (0.0%) |
| Total (Category) | 57 (100.0%) | 0 (0.0%) |
| Total (Overall) | 169 (61.5%) | 106 (38.6%) |
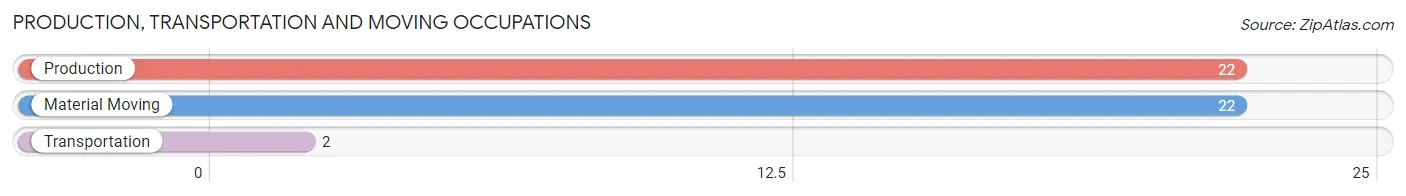
Production, Transportation and Moving Occupations
The most common Production, Transportation and Moving occupations in Lake Arthur are Production (22 | 8.0%), Material Moving (22 | 8.0%), and Transportation (2 | 0.7%).
Production, Transportation and Moving Occupations by Sex
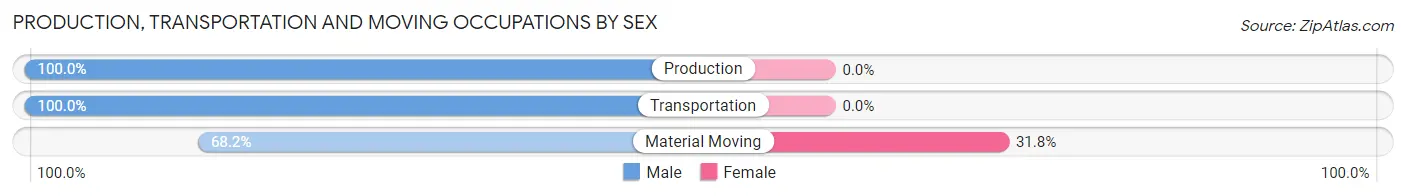
| Occupation | Male | Female |
| Production | 22 (100.0%) | 0 (0.0%) |
| Transportation | 2 (100.0%) | 0 (0.0%) |
| Material Moving | 15 (68.2%) | 7 (31.8%) |
| Total (Category) | 39 (84.8%) | 7 (15.2%) |
| Total (Overall) | 169 (61.5%) | 106 (38.6%) |
Employment Industries by Sex in Lake Arthur
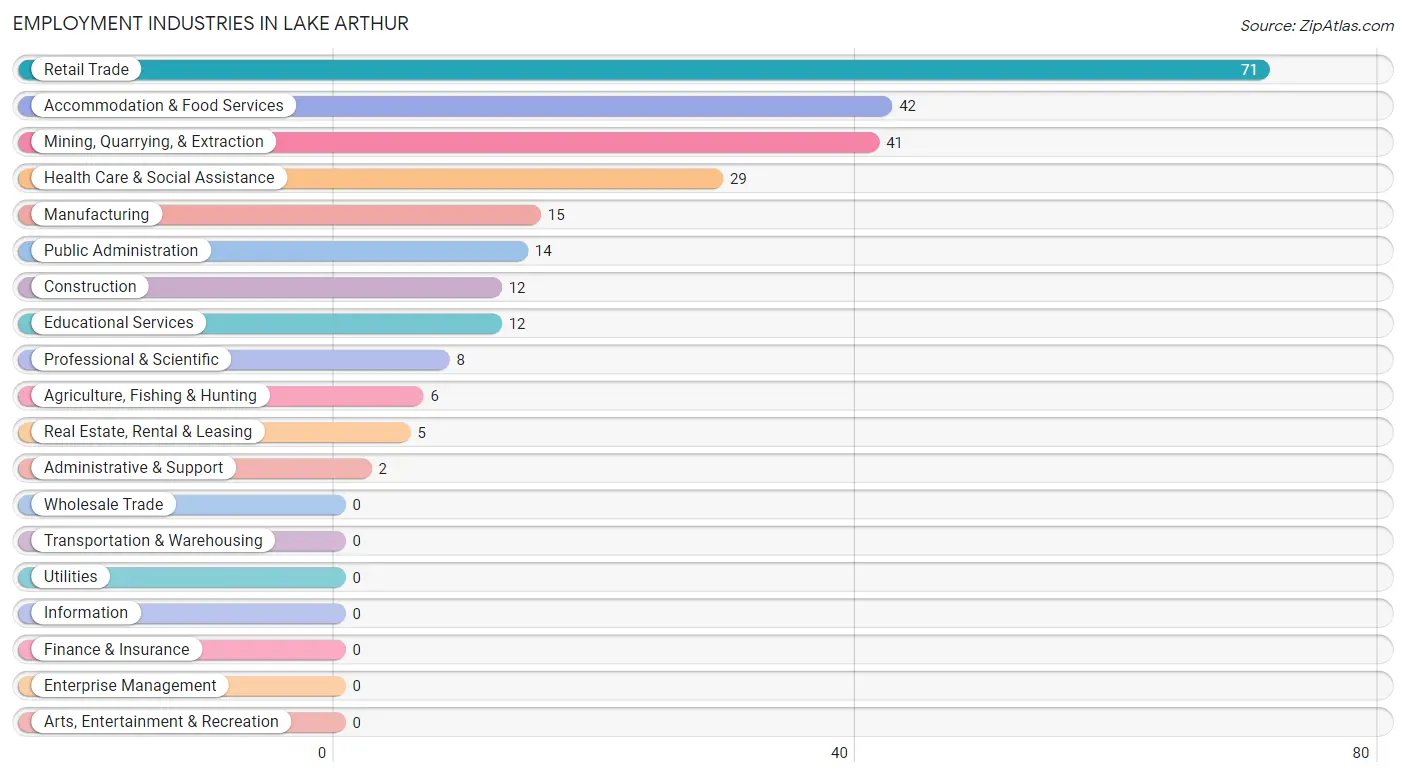
Employment Industries in Lake Arthur
The major employment industries in Lake Arthur include Retail Trade (71 | 25.8%), Accommodation & Food Services (42 | 15.3%), Mining, Quarrying, & Extraction (41 | 14.9%), Health Care & Social Assistance (29 | 10.5%), and Manufacturing (15 | 5.4%).
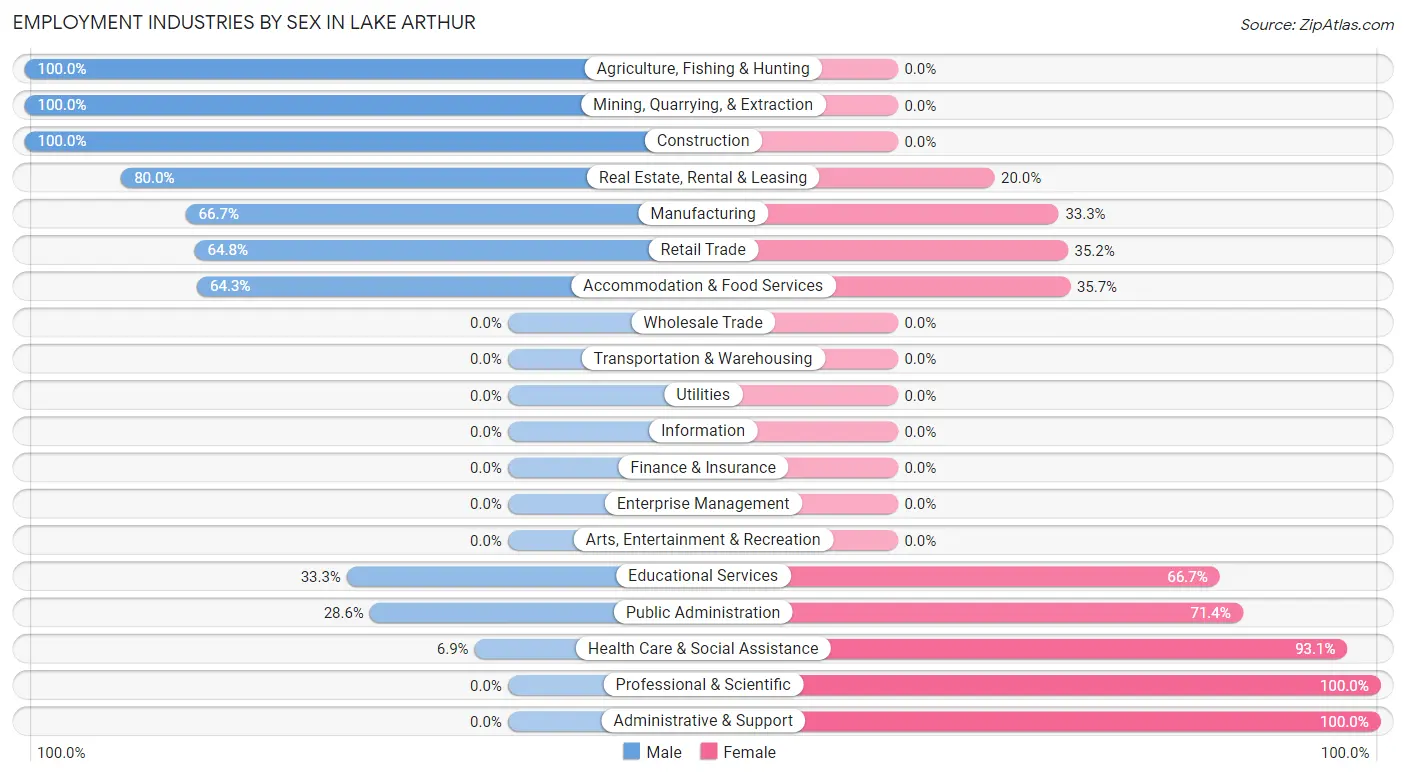
Employment Industries by Sex in Lake Arthur
The Lake Arthur industries that see more men than women are Agriculture, Fishing & Hunting (100.0%), Mining, Quarrying, & Extraction (100.0%), and Construction (100.0%), whereas the industries that tend to have a higher number of women are Professional & Scientific (100.0%), Administrative & Support (100.0%), and Health Care & Social Assistance (93.1%).
| Industry | Male | Female |
| Agriculture, Fishing & Hunting | 6 (100.0%) | 0 (0.0%) |
| Mining, Quarrying, & Extraction | 41 (100.0%) | 0 (0.0%) |
| Construction | 12 (100.0%) | 0 (0.0%) |
| Manufacturing | 10 (66.7%) | 5 (33.3%) |
| Wholesale Trade | 0 (0.0%) | 0 (0.0%) |
| Retail Trade | 46 (64.8%) | 25 (35.2%) |
| Transportation & Warehousing | 0 (0.0%) | 0 (0.0%) |
| Utilities | 0 (0.0%) | 0 (0.0%) |
| Information | 0 (0.0%) | 0 (0.0%) |
| Finance & Insurance | 0 (0.0%) | 0 (0.0%) |
| Real Estate, Rental & Leasing | 4 (80.0%) | 1 (20.0%) |
| Professional & Scientific | 0 (0.0%) | 8 (100.0%) |
| Enterprise Management | 0 (0.0%) | 0 (0.0%) |
| Administrative & Support | 0 (0.0%) | 2 (100.0%) |
| Educational Services | 4 (33.3%) | 8 (66.7%) |
| Health Care & Social Assistance | 2 (6.9%) | 27 (93.1%) |
| Arts, Entertainment & Recreation | 0 (0.0%) | 0 (0.0%) |
| Accommodation & Food Services | 27 (64.3%) | 15 (35.7%) |
| Public Administration | 4 (28.6%) | 10 (71.4%) |
| Total | 169 (61.5%) | 106 (38.6%) |
Education in Lake Arthur
School Enrollment in Lake Arthur
The most common levels of schooling among the 113 students in Lake Arthur are high school (63 | 55.7%), elementary school (19 | 16.8%), and middle school (19 | 16.8%).
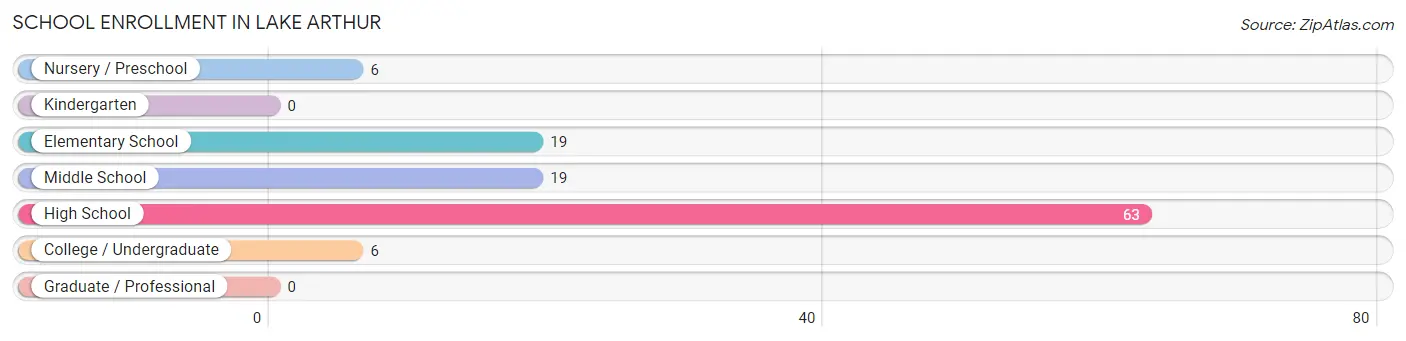
| School Level | # Students | % Students |
| Nursery / Preschool | 6 | 5.3% |
| Kindergarten | 0 | 0.0% |
| Elementary School | 19 | 16.8% |
| Middle School | 19 | 16.8% |
| High School | 63 | 55.7% |
| College / Undergraduate | 6 | 5.3% |
| Graduate / Professional | 0 | 0.0% |
| Total | 113 | 100.0% |
School Enrollment by Age by Funding Source in Lake Arthur
Out of a total of 113 students who are enrolled in schools in Lake Arthur, 5 (4.4%) attend a private institution, while the remaining 108 (95.6%) are enrolled in public schools. The age group of 18 to 19 year olds has the highest likelihood of being enrolled in private schools, with 5 (17.9% in the age bracket) enrolled. Conversely, the age group of 3 to 4 year olds has the lowest likelihood of being enrolled in a private school, with 6 (100.0% in the age bracket) attending a public institution.
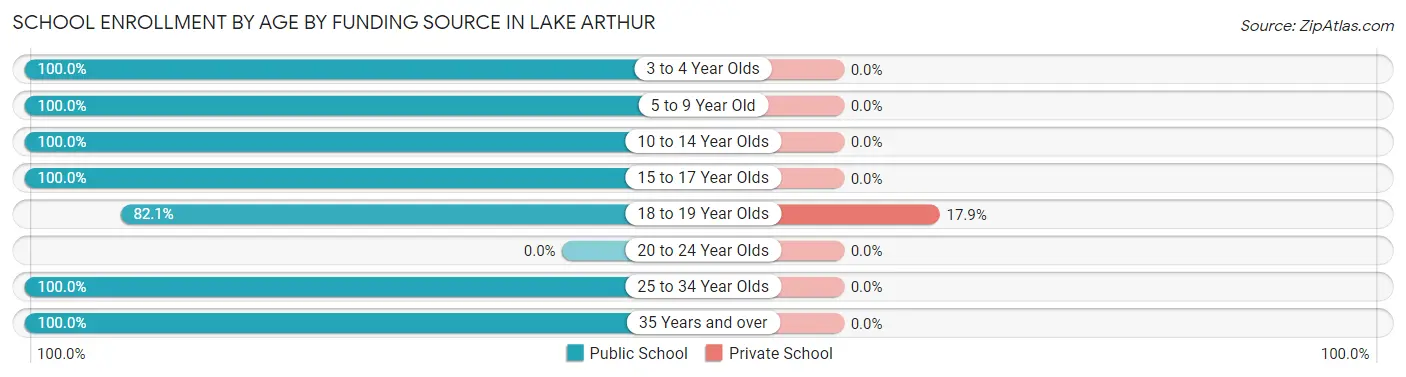
| Age Bracket | Public School | Private School |
| 3 to 4 Year Olds | 6 (100.0%) | 0 (0.0%) |
| 5 to 9 Year Old | 19 (100.0%) | 0 (0.0%) |
| 10 to 14 Year Olds | 24 (100.0%) | 0 (0.0%) |
| 15 to 17 Year Olds | 33 (100.0%) | 0 (0.0%) |
| 18 to 19 Year Olds | 23 (82.1%) | 5 (17.9%) |
| 20 to 24 Year Olds | 0 (0.0%) | 0 (0.0%) |
| 25 to 34 Year Olds | 2 (100.0%) | 0 (0.0%) |
| 35 Years and over | 1 (100.0%) | 0 (0.0%) |
| Total | 108 (95.6%) | 5 (4.4%) |
Educational Attainment by Field of Study in Lake Arthur
Psychology (7 | 31.8%), science & technology (6 | 27.3%), education (6 | 27.3%), physical & health sciences (1 | 4.5%), and social sciences (1 | 4.5%) are the most common fields of study among 22 individuals in Lake Arthur who have obtained a bachelor's degree or higher.
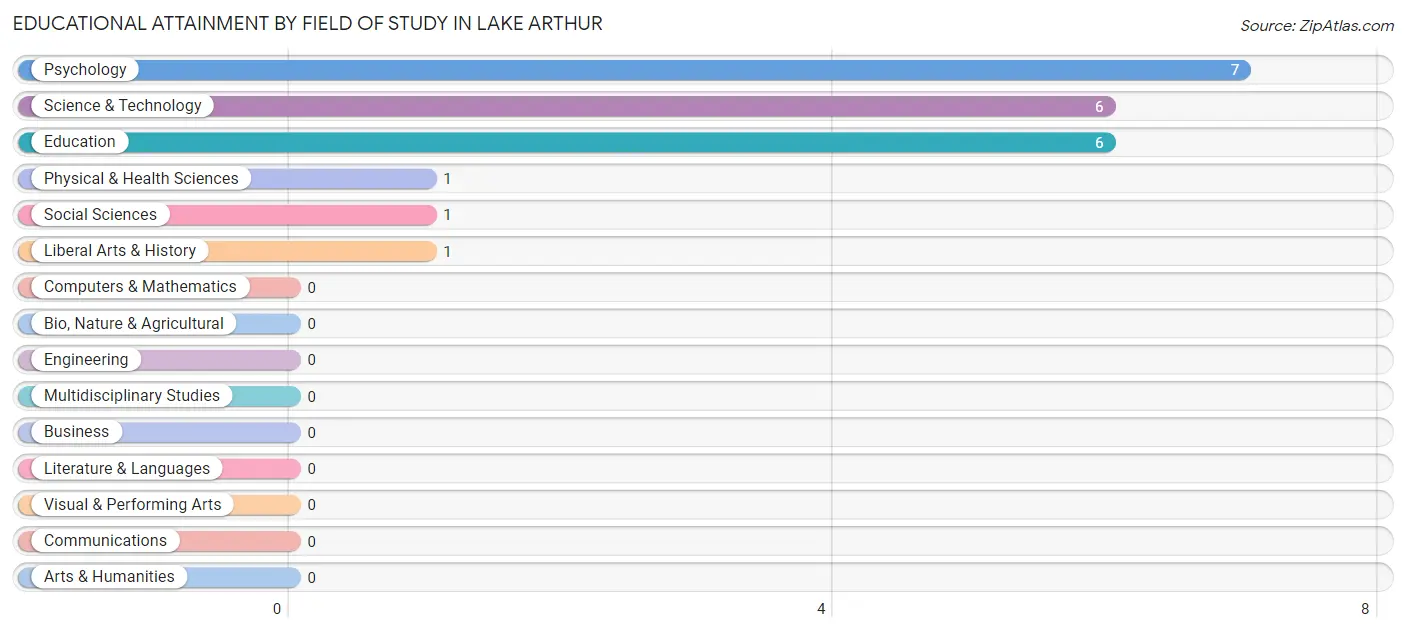
| Field of Study | # Graduates | % Graduates |
| Computers & Mathematics | 0 | 0.0% |
| Bio, Nature & Agricultural | 0 | 0.0% |
| Physical & Health Sciences | 1 | 4.5% |
| Psychology | 7 | 31.8% |
| Social Sciences | 1 | 4.5% |
| Engineering | 0 | 0.0% |
| Multidisciplinary Studies | 0 | 0.0% |
| Science & Technology | 6 | 27.3% |
| Business | 0 | 0.0% |
| Education | 6 | 27.3% |
| Literature & Languages | 0 | 0.0% |
| Liberal Arts & History | 1 | 4.5% |
| Visual & Performing Arts | 0 | 0.0% |
| Communications | 0 | 0.0% |
| Arts & Humanities | 0 | 0.0% |
| Total | 22 | 100.0% |
Transportation & Commute in Lake Arthur
Vehicle Availability by Sex in Lake Arthur
The most prevalent vehicle ownership categories in Lake Arthur are males with 5 or more vehicles (67, accounting for 39.6%) and females with 5 or more vehicles (38, making up 63.8%).
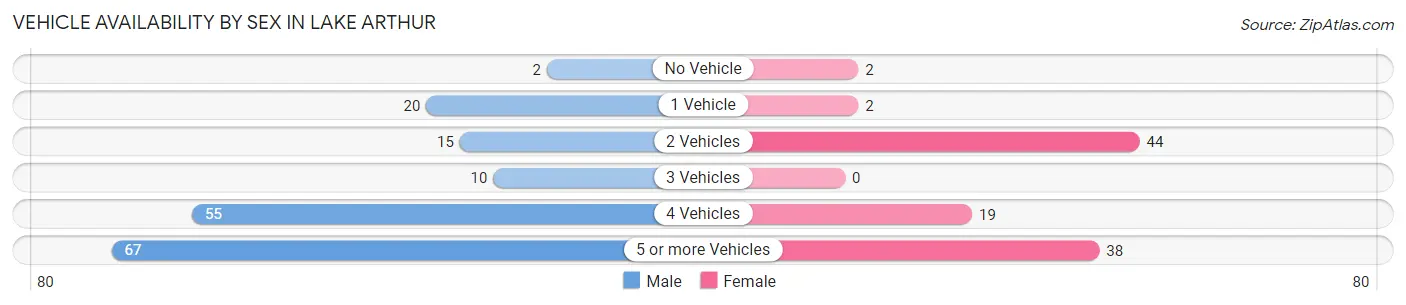
| Vehicles Available | Male | Female |
| No Vehicle | 2 (1.2%) | 2 (1.9%) |
| 1 Vehicle | 20 (11.8%) | 2 (1.9%) |
| 2 Vehicles | 15 (8.9%) | 44 (41.9%) |
| 3 Vehicles | 10 (5.9%) | 0 (0.0%) |
| 4 Vehicles | 55 (32.5%) | 19 (18.1%) |
| 5 or more Vehicles | 67 (39.6%) | 38 (36.2%) |
| Total | 169 (100.0%) | 105 (100.0%) |
Commute Time in Lake Arthur
The most frequently occuring commute durations in Lake Arthur are 15 to 19 minutes (97 commuters, 36.6%), 30 to 34 minutes (97 commuters, 36.6%), and 20 to 24 minutes (38 commuters, 14.3%).
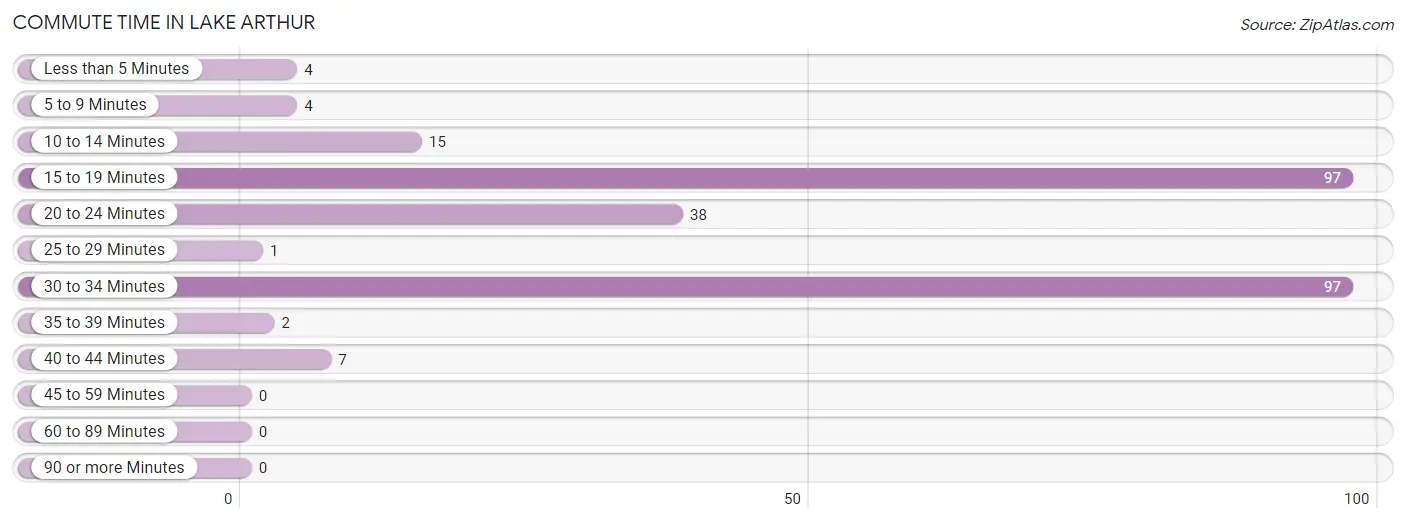
| Commute Time | # Commuters | % Commuters |
| Less than 5 Minutes | 4 | 1.5% |
| 5 to 9 Minutes | 4 | 1.5% |
| 10 to 14 Minutes | 15 | 5.7% |
| 15 to 19 Minutes | 97 | 36.6% |
| 20 to 24 Minutes | 38 | 14.3% |
| 25 to 29 Minutes | 1 | 0.4% |
| 30 to 34 Minutes | 97 | 36.6% |
| 35 to 39 Minutes | 2 | 0.7% |
| 40 to 44 Minutes | 7 | 2.6% |
| 45 to 59 Minutes | 0 | 0.0% |
| 60 to 89 Minutes | 0 | 0.0% |
| 90 or more Minutes | 0 | 0.0% |
Commute Time by Sex in Lake Arthur
The most common commute times in Lake Arthur are 15 to 19 minutes (62 commuters, 36.7%) for males and 30 to 34 minutes (36 commuters, 37.5%) for females.
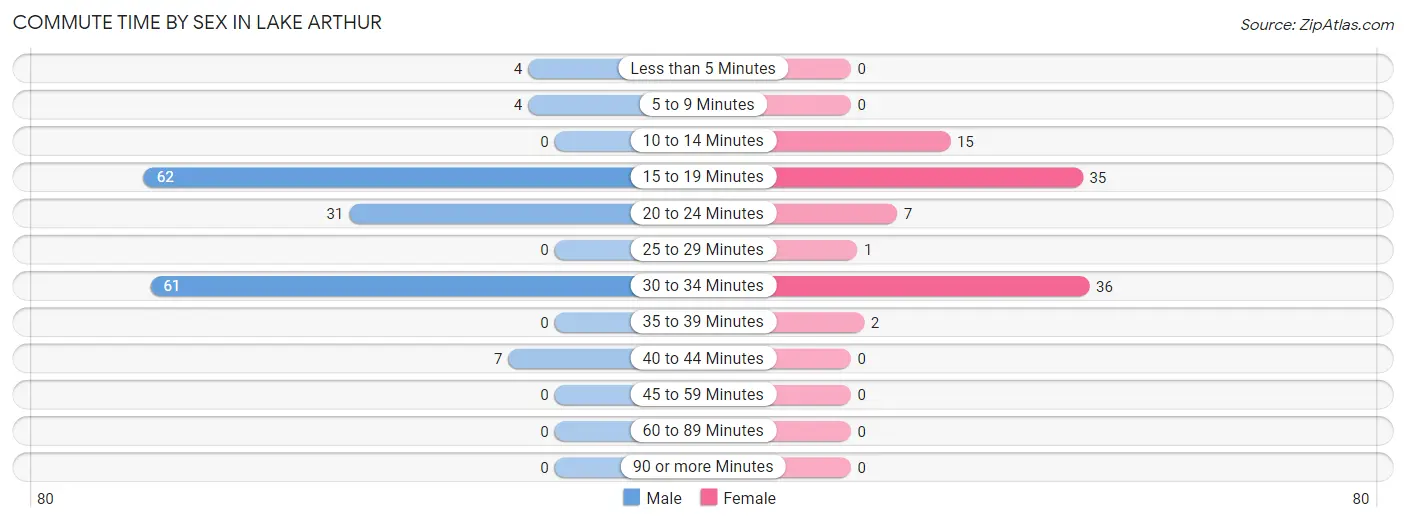
| Commute Time | Male | Female |
| Less than 5 Minutes | 4 (2.4%) | 0 (0.0%) |
| 5 to 9 Minutes | 4 (2.4%) | 0 (0.0%) |
| 10 to 14 Minutes | 0 (0.0%) | 15 (15.6%) |
| 15 to 19 Minutes | 62 (36.7%) | 35 (36.5%) |
| 20 to 24 Minutes | 31 (18.3%) | 7 (7.3%) |
| 25 to 29 Minutes | 0 (0.0%) | 1 (1.0%) |
| 30 to 34 Minutes | 61 (36.1%) | 36 (37.5%) |
| 35 to 39 Minutes | 0 (0.0%) | 2 (2.1%) |
| 40 to 44 Minutes | 7 (4.1%) | 0 (0.0%) |
| 45 to 59 Minutes | 0 (0.0%) | 0 (0.0%) |
| 60 to 89 Minutes | 0 (0.0%) | 0 (0.0%) |
| 90 or more Minutes | 0 (0.0%) | 0 (0.0%) |
Time of Departure to Work by Sex in Lake Arthur
The most frequent times of departure to work in Lake Arthur are 6:30 AM to 6:59 AM (43, 25.4%) for males and 6:30 AM to 6:59 AM (21, 21.9%) for females.
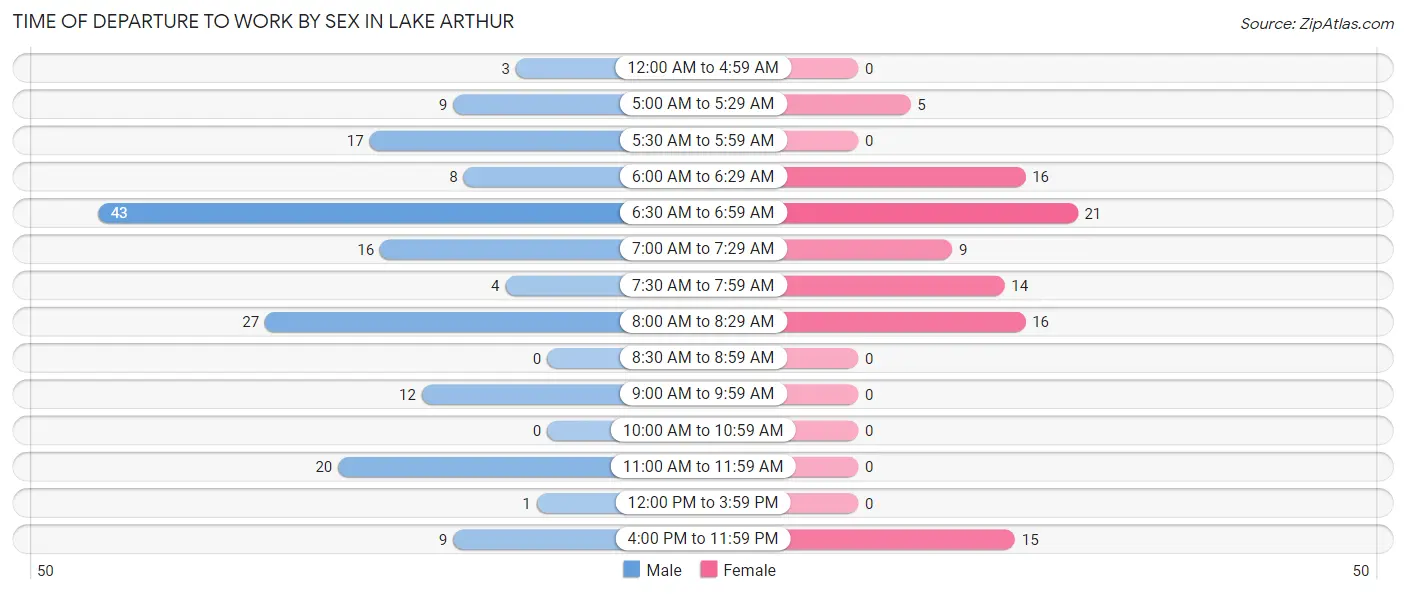
| Time of Departure | Male | Female |
| 12:00 AM to 4:59 AM | 3 (1.8%) | 0 (0.0%) |
| 5:00 AM to 5:29 AM | 9 (5.3%) | 5 (5.2%) |
| 5:30 AM to 5:59 AM | 17 (10.1%) | 0 (0.0%) |
| 6:00 AM to 6:29 AM | 8 (4.7%) | 16 (16.7%) |
| 6:30 AM to 6:59 AM | 43 (25.4%) | 21 (21.9%) |
| 7:00 AM to 7:29 AM | 16 (9.5%) | 9 (9.4%) |
| 7:30 AM to 7:59 AM | 4 (2.4%) | 14 (14.6%) |
| 8:00 AM to 8:29 AM | 27 (16.0%) | 16 (16.7%) |
| 8:30 AM to 8:59 AM | 0 (0.0%) | 0 (0.0%) |
| 9:00 AM to 9:59 AM | 12 (7.1%) | 0 (0.0%) |
| 10:00 AM to 10:59 AM | 0 (0.0%) | 0 (0.0%) |
| 11:00 AM to 11:59 AM | 20 (11.8%) | 0 (0.0%) |
| 12:00 PM to 3:59 PM | 1 (0.6%) | 0 (0.0%) |
| 4:00 PM to 11:59 PM | 9 (5.3%) | 15 (15.6%) |
| Total | 169 (100.0%) | 96 (100.0%) |
Housing Occupancy in Lake Arthur
Occupancy by Ownership in Lake Arthur
Of the total 154 dwellings in Lake Arthur, owner-occupied units account for 123 (79.9%), while renter-occupied units make up 31 (20.1%).
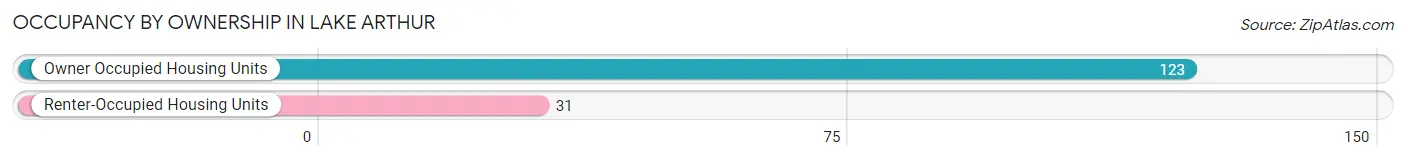
| Occupancy | # Housing Units | % Housing Units |
| Owner Occupied Housing Units | 123 | 79.9% |
| Renter-Occupied Housing Units | 31 | 20.1% |
| Total Occupied Housing Units | 154 | 100.0% |
Occupancy by Household Size in Lake Arthur
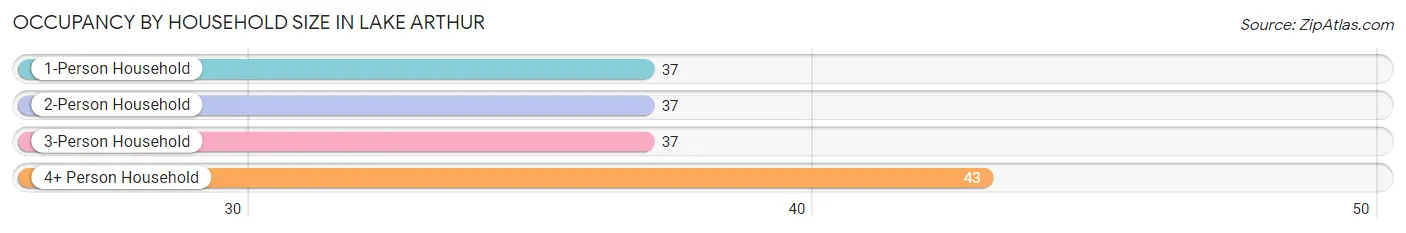
| Household Size | # Housing Units | % Housing Units |
| 1-Person Household | 37 | 24.0% |
| 2-Person Household | 37 | 24.0% |
| 3-Person Household | 37 | 24.0% |
| 4+ Person Household | 43 | 27.9% |
| Total Housing Units | 154 | 100.0% |
Occupancy by Ownership by Household Size in Lake Arthur
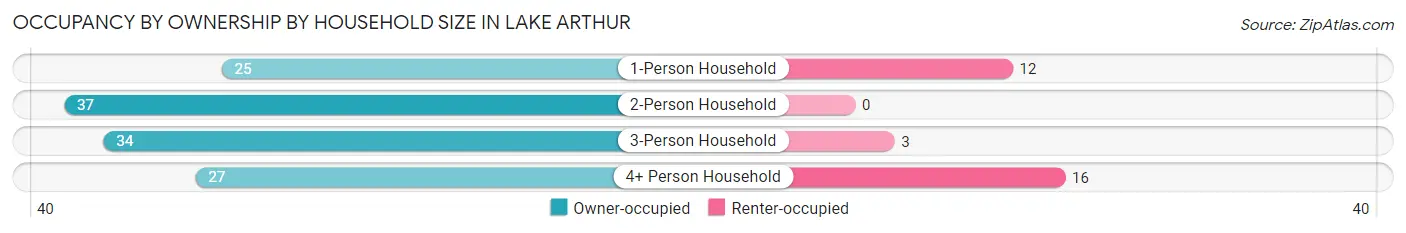
| Household Size | Owner-occupied | Renter-occupied |
| 1-Person Household | 25 (67.6%) | 12 (32.4%) |
| 2-Person Household | 37 (100.0%) | 0 (0.0%) |
| 3-Person Household | 34 (91.9%) | 3 (8.1%) |
| 4+ Person Household | 27 (62.8%) | 16 (37.2%) |
| Total Housing Units | 123 (79.9%) | 31 (20.1%) |
Occupancy by Educational Attainment in Lake Arthur
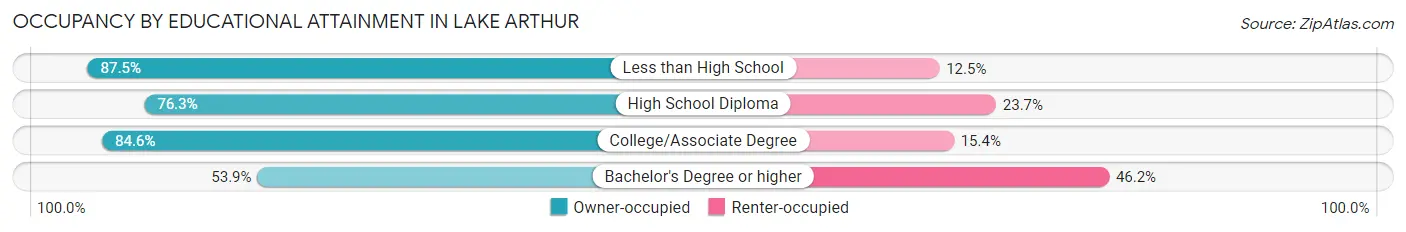
| Household Size | Owner-occupied | Renter-occupied |
| Less than High School | 49 (87.5%) | 7 (12.5%) |
| High School Diploma | 45 (76.3%) | 14 (23.7%) |
| College/Associate Degree | 22 (84.6%) | 4 (15.4%) |
| Bachelor's Degree or higher | 7 (53.8%) | 6 (46.2%) |
Occupancy by Age of Householder in Lake Arthur
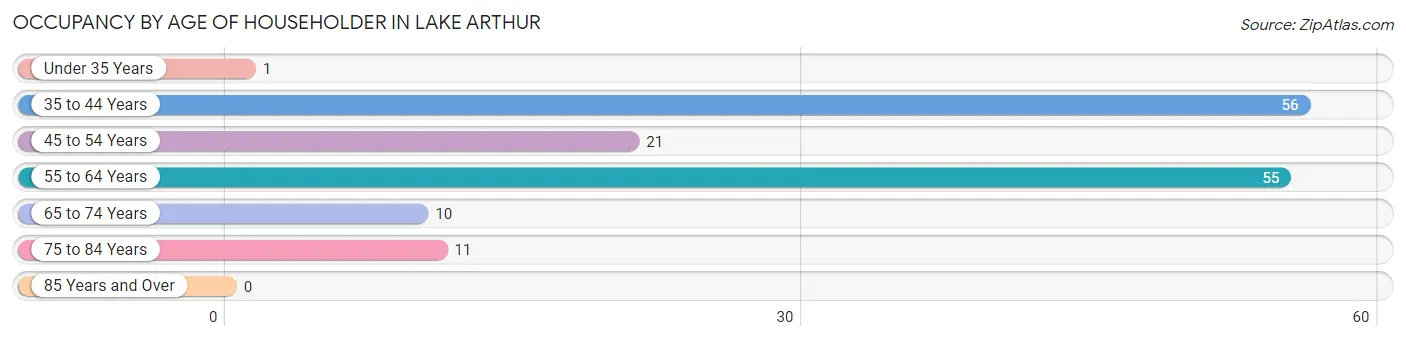
| Age Bracket | # Households | % Households |
| Under 35 Years | 1 | 0.6% |
| 35 to 44 Years | 56 | 36.4% |
| 45 to 54 Years | 21 | 13.6% |
| 55 to 64 Years | 55 | 35.7% |
| 65 to 74 Years | 10 | 6.5% |
| 75 to 84 Years | 11 | 7.1% |
| 85 Years and Over | 0 | 0.0% |
| Total | 154 | 100.0% |
Housing Finances in Lake Arthur
Median Income by Occupancy in Lake Arthur
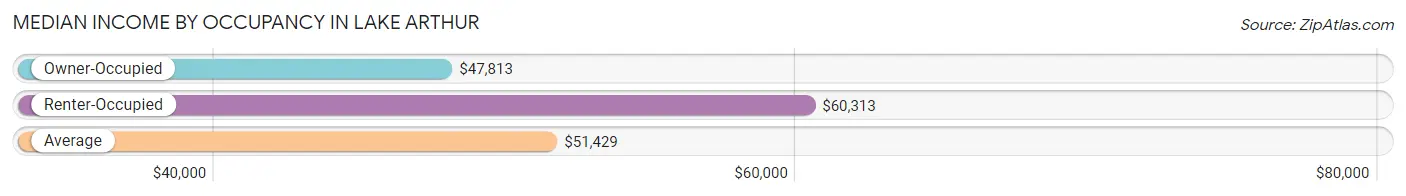
| Occupancy Type | # Households | Median Income |
| Owner-Occupied | 123 (79.9%) | $47,813 |
| Renter-Occupied | 31 (20.1%) | $60,313 |
| Average | 154 (100.0%) | $51,429 |
Occupancy by Householder Income Bracket in Lake Arthur
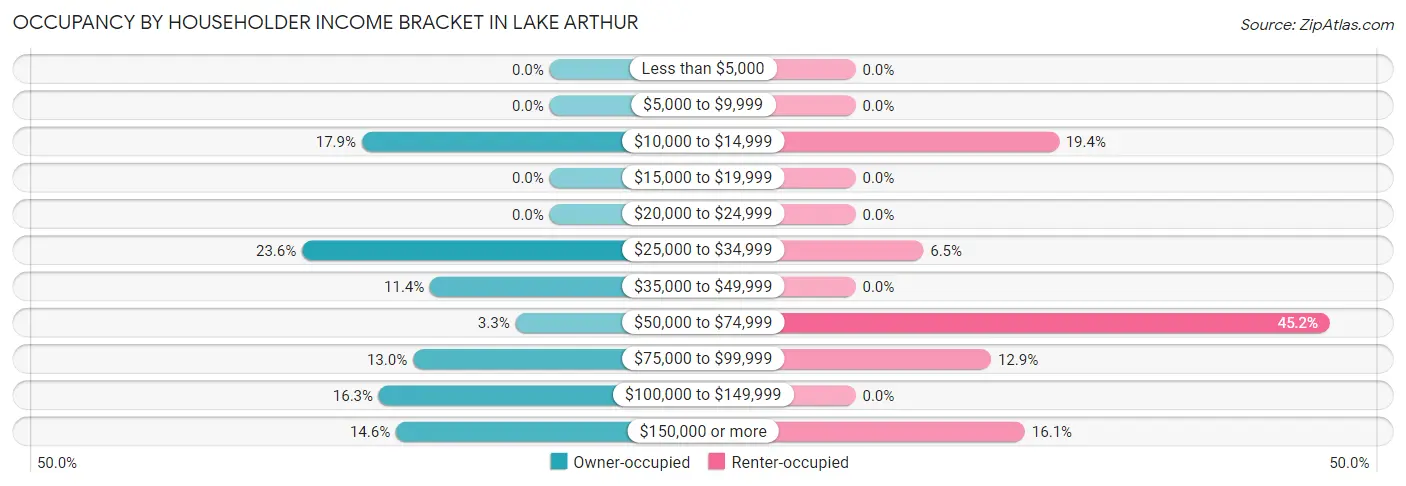
| Income Bracket | Owner-occupied | Renter-occupied |
| Less than $5,000 | 0 (0.0%) | 0 (0.0%) |
| $5,000 to $9,999 | 0 (0.0%) | 0 (0.0%) |
| $10,000 to $14,999 | 22 (17.9%) | 6 (19.4%) |
| $15,000 to $19,999 | 0 (0.0%) | 0 (0.0%) |
| $20,000 to $24,999 | 0 (0.0%) | 0 (0.0%) |
| $25,000 to $34,999 | 29 (23.6%) | 2 (6.5%) |
| $35,000 to $49,999 | 14 (11.4%) | 0 (0.0%) |
| $50,000 to $74,999 | 4 (3.3%) | 14 (45.2%) |
| $75,000 to $99,999 | 16 (13.0%) | 4 (12.9%) |
| $100,000 to $149,999 | 20 (16.3%) | 0 (0.0%) |
| $150,000 or more | 18 (14.6%) | 5 (16.1%) |
| Total | 123 (100.0%) | 31 (100.0%) |
Monthly Housing Cost Tiers in Lake Arthur
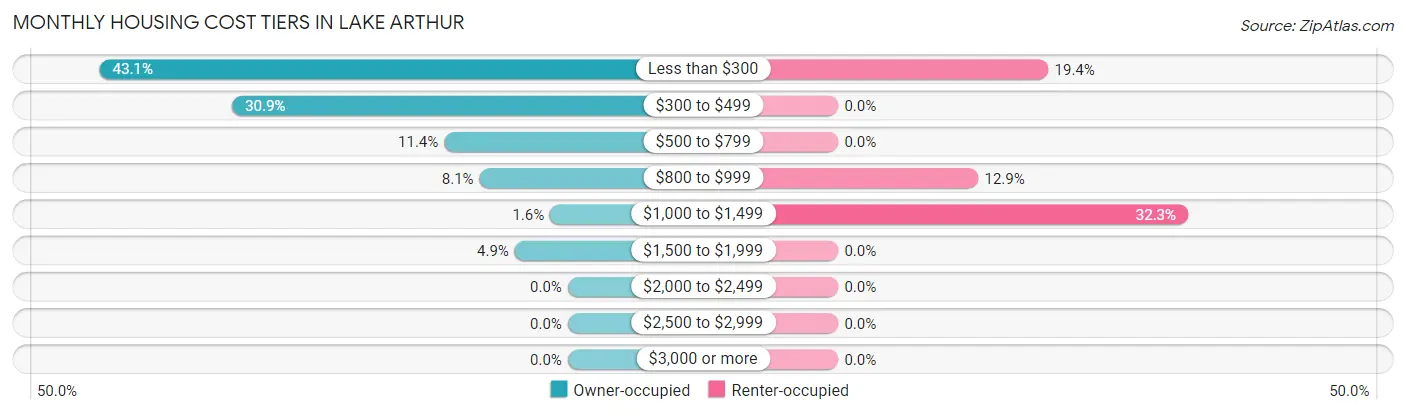
| Monthly Cost | Owner-occupied | Renter-occupied |
| Less than $300 | 53 (43.1%) | 6 (19.4%) |
| $300 to $499 | 38 (30.9%) | 0 (0.0%) |
| $500 to $799 | 14 (11.4%) | 0 (0.0%) |
| $800 to $999 | 10 (8.1%) | 4 (12.9%) |
| $1,000 to $1,499 | 2 (1.6%) | 10 (32.3%) |
| $1,500 to $1,999 | 6 (4.9%) | 0 (0.0%) |
| $2,000 to $2,499 | 0 (0.0%) | 0 (0.0%) |
| $2,500 to $2,999 | 0 (0.0%) | 0 (0.0%) |
| $3,000 or more | 0 (0.0%) | 0 (0.0%) |
| Total | 123 (100.0%) | 31 (100.0%) |
Physical Housing Characteristics in Lake Arthur
Housing Structures in Lake Arthur
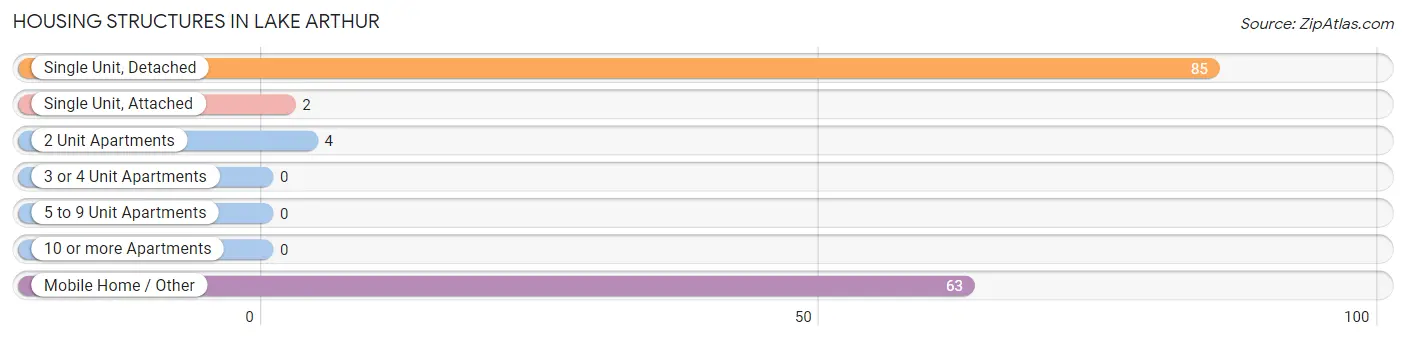
| Structure Type | # Housing Units | % Housing Units |
| Single Unit, Detached | 85 | 55.2% |
| Single Unit, Attached | 2 | 1.3% |
| 2 Unit Apartments | 4 | 2.6% |
| 3 or 4 Unit Apartments | 0 | 0.0% |
| 5 to 9 Unit Apartments | 0 | 0.0% |
| 10 or more Apartments | 0 | 0.0% |
| Mobile Home / Other | 63 | 40.9% |
| Total | 154 | 100.0% |
Housing Structures by Occupancy in Lake Arthur
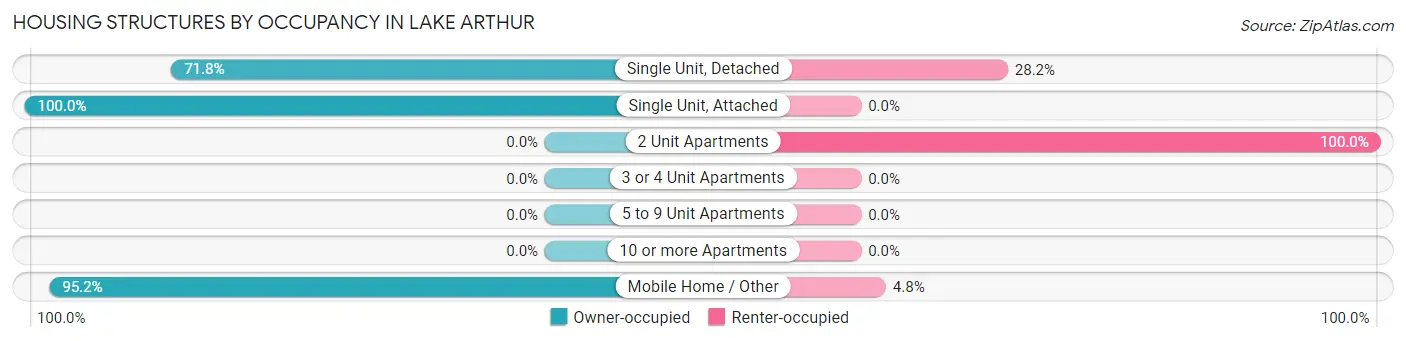
| Structure Type | Owner-occupied | Renter-occupied |
| Single Unit, Detached | 61 (71.8%) | 24 (28.2%) |
| Single Unit, Attached | 2 (100.0%) | 0 (0.0%) |
| 2 Unit Apartments | 0 (0.0%) | 4 (100.0%) |
| 3 or 4 Unit Apartments | 0 (0.0%) | 0 (0.0%) |
| 5 to 9 Unit Apartments | 0 (0.0%) | 0 (0.0%) |
| 10 or more Apartments | 0 (0.0%) | 0 (0.0%) |
| Mobile Home / Other | 60 (95.2%) | 3 (4.8%) |
| Total | 123 (79.9%) | 31 (20.1%) |
Housing Structures by Number of Rooms in Lake Arthur
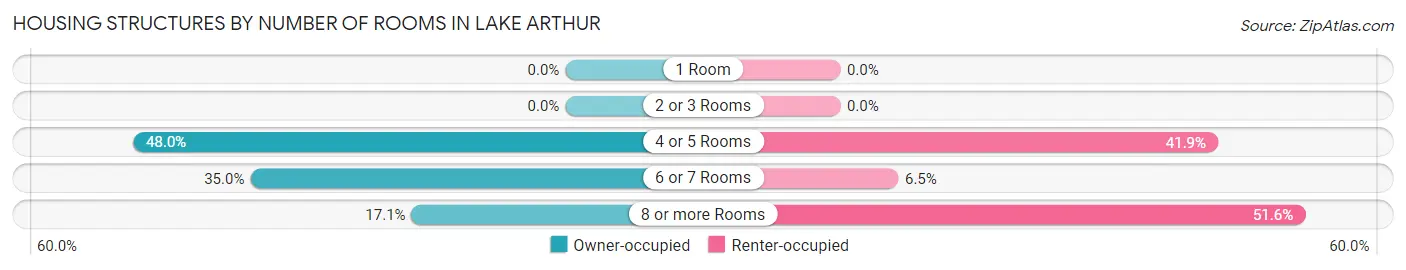
| Number of Rooms | Owner-occupied | Renter-occupied |
| 1 Room | 0 (0.0%) | 0 (0.0%) |
| 2 or 3 Rooms | 0 (0.0%) | 0 (0.0%) |
| 4 or 5 Rooms | 59 (48.0%) | 13 (41.9%) |
| 6 or 7 Rooms | 43 (35.0%) | 2 (6.5%) |
| 8 or more Rooms | 21 (17.1%) | 16 (51.6%) |
| Total | 123 (100.0%) | 31 (100.0%) |
Housing Structure by Heating Type in Lake Arthur
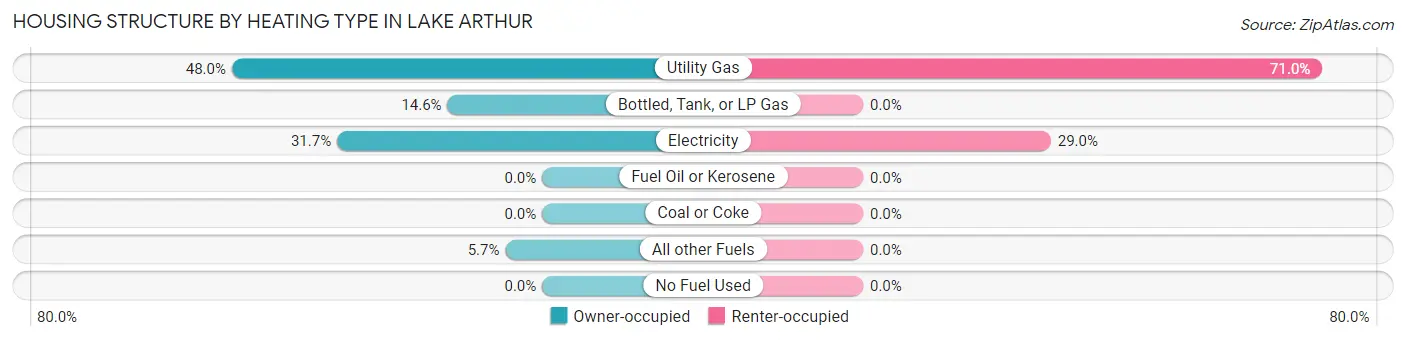
| Heating Type | Owner-occupied | Renter-occupied |
| Utility Gas | 59 (48.0%) | 22 (71.0%) |
| Bottled, Tank, or LP Gas | 18 (14.6%) | 0 (0.0%) |
| Electricity | 39 (31.7%) | 9 (29.0%) |
| Fuel Oil or Kerosene | 0 (0.0%) | 0 (0.0%) |
| Coal or Coke | 0 (0.0%) | 0 (0.0%) |
| All other Fuels | 7 (5.7%) | 0 (0.0%) |
| No Fuel Used | 0 (0.0%) | 0 (0.0%) |
| Total | 123 (100.0%) | 31 (100.0%) |
Household Vehicle Usage in Lake Arthur
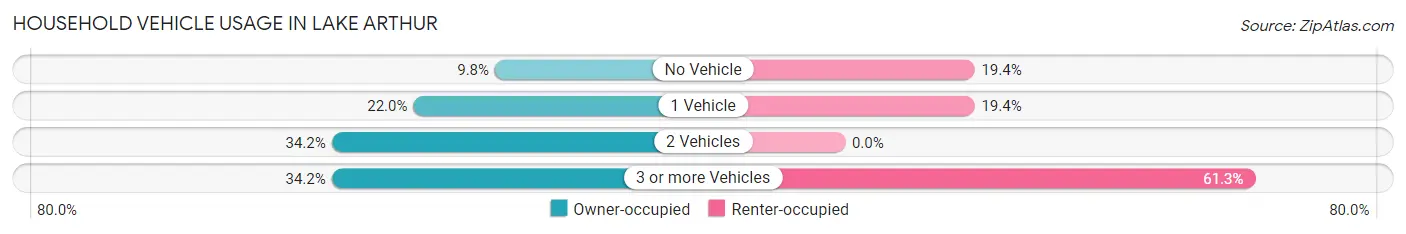
| Vehicles per Household | Owner-occupied | Renter-occupied |
| No Vehicle | 12 (9.8%) | 6 (19.4%) |
| 1 Vehicle | 27 (22.0%) | 6 (19.4%) |
| 2 Vehicles | 42 (34.2%) | 0 (0.0%) |
| 3 or more Vehicles | 42 (34.2%) | 19 (61.3%) |
| Total | 123 (100.0%) | 31 (100.0%) |
Real Estate & Mortgages in Lake Arthur
Real Estate and Mortgage Overview in Lake Arthur
| Characteristic | Without Mortgage | With Mortgage |
| Housing Units | 107 | 16 |
| Median Property Value | $64,200 | $96,700 |
| Median Household Income | $43,281 | $0 |
| Monthly Housing Costs | $303 | $0 |
| Real Estate Taxes | $260 | $0 |
Property Value by Mortgage Status in Lake Arthur
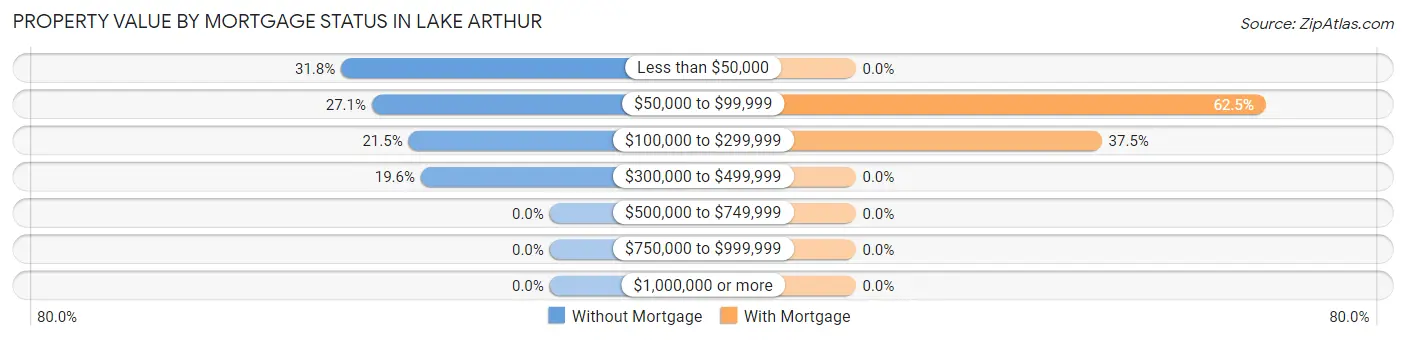
| Property Value | Without Mortgage | With Mortgage |
| Less than $50,000 | 34 (31.8%) | 0 (0.0%) |
| $50,000 to $99,999 | 29 (27.1%) | 10 (62.5%) |
| $100,000 to $299,999 | 23 (21.5%) | 6 (37.5%) |
| $300,000 to $499,999 | 21 (19.6%) | 0 (0.0%) |
| $500,000 to $749,999 | 0 (0.0%) | 0 (0.0%) |
| $750,000 to $999,999 | 0 (0.0%) | 0 (0.0%) |
| $1,000,000 or more | 0 (0.0%) | 0 (0.0%) |
| Total | 107 (100.0%) | 16 (100.0%) |
Household Income by Mortgage Status in Lake Arthur
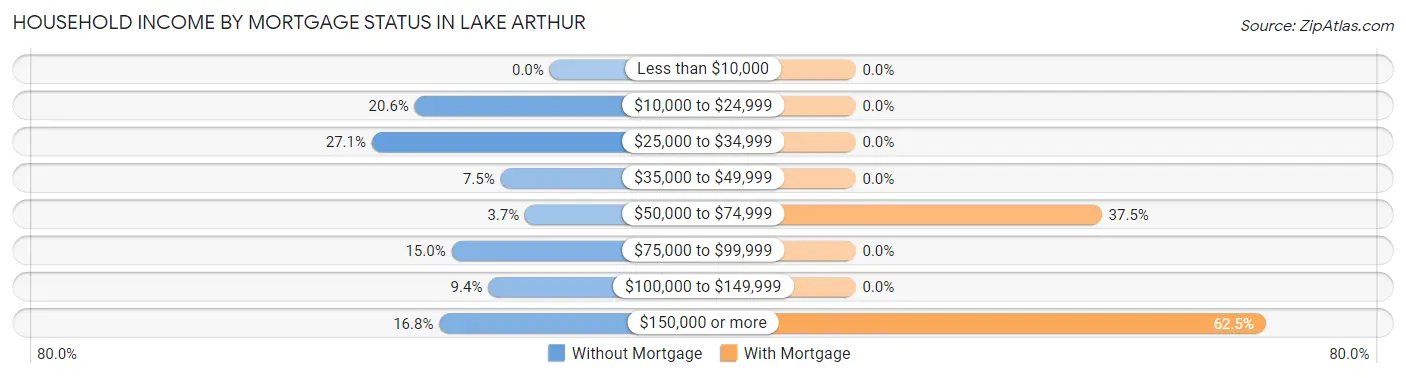
| Household Income | Without Mortgage | With Mortgage |
| Less than $10,000 | 0 (0.0%) | 0 (0.0%) |
| $10,000 to $24,999 | 22 (20.6%) | 0 (0.0%) |
| $25,000 to $34,999 | 29 (27.1%) | 0 (0.0%) |
| $35,000 to $49,999 | 8 (7.5%) | 0 (0.0%) |
| $50,000 to $74,999 | 4 (3.7%) | 6 (37.5%) |
| $75,000 to $99,999 | 16 (14.9%) | 0 (0.0%) |
| $100,000 to $149,999 | 10 (9.3%) | 0 (0.0%) |
| $150,000 or more | 18 (16.8%) | 10 (62.5%) |
| Total | 107 (100.0%) | 16 (100.0%) |
Property Value to Household Income Ratio in Lake Arthur
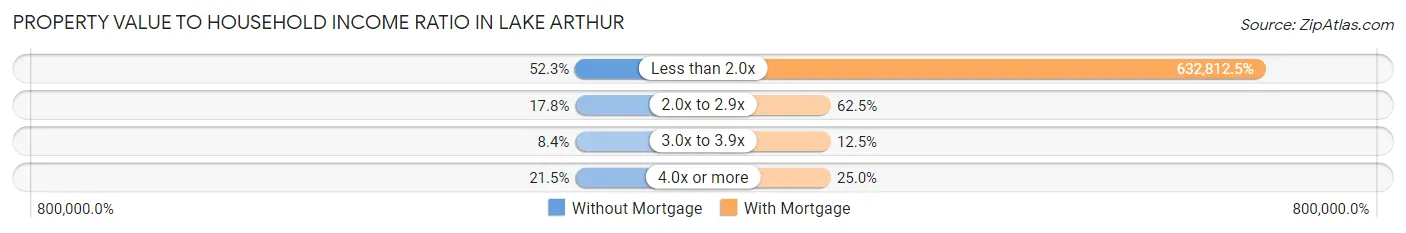
| Value-to-Income Ratio | Without Mortgage | With Mortgage |
| Less than 2.0x | 56 (52.3%) | 101,250 (632,812.5%) |
| 2.0x to 2.9x | 19 (17.8%) | 10 (62.5%) |
| 3.0x to 3.9x | 9 (8.4%) | 2 (12.5%) |
| 4.0x or more | 23 (21.5%) | 4 (25.0%) |
| Total | 107 (100.0%) | 16 (100.0%) |
Real Estate Taxes by Mortgage Status in Lake Arthur
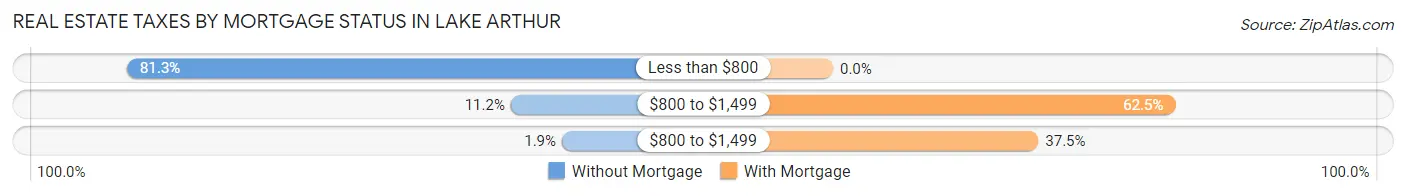
| Property Taxes | Without Mortgage | With Mortgage |
| Less than $800 | 87 (81.3%) | 0 (0.0%) |
| $800 to $1,499 | 12 (11.2%) | 10 (62.5%) |
| $800 to $1,499 | 2 (1.9%) | 6 (37.5%) |
| Total | 107 (100.0%) | 16 (100.0%) |
Health & Disability in Lake Arthur
Health Insurance Coverage by Age in Lake Arthur
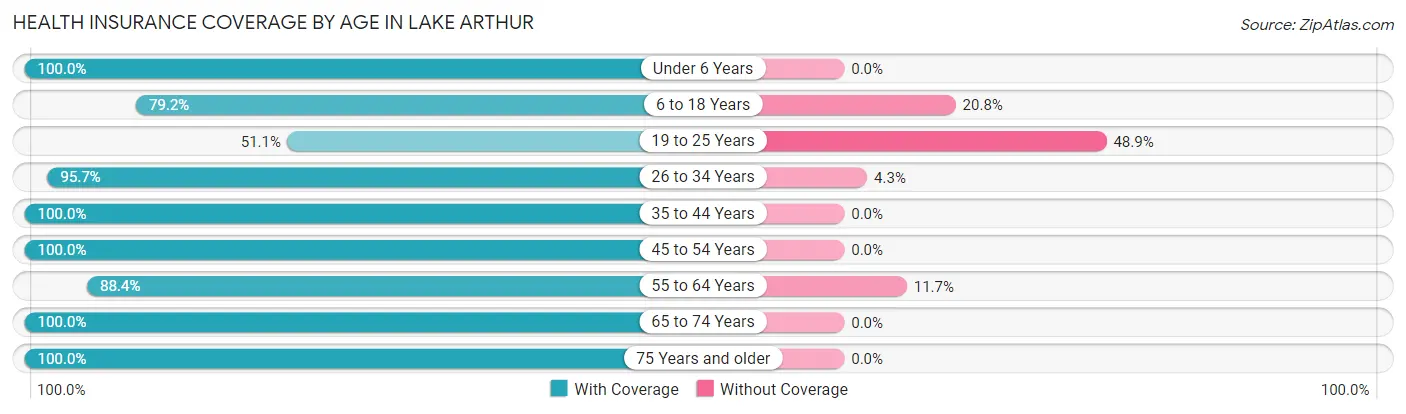
| Age Bracket | With Coverage | Without Coverage |
| Under 6 Years | 7 (100.0%) | 0 (0.0%) |
| 6 to 18 Years | 103 (79.2%) | 27 (20.8%) |
| 19 to 25 Years | 23 (51.1%) | 22 (48.9%) |
| 26 to 34 Years | 45 (95.7%) | 2 (4.3%) |
| 35 to 44 Years | 87 (100.0%) | 0 (0.0%) |
| 45 to 54 Years | 42 (100.0%) | 0 (0.0%) |
| 55 to 64 Years | 91 (88.3%) | 12 (11.7%) |
| 65 to 74 Years | 50 (100.0%) | 0 (0.0%) |
| 75 Years and older | 16 (100.0%) | 0 (0.0%) |
| Total | 464 (88.0%) | 63 (11.9%) |
Health Insurance Coverage by Citizenship Status in Lake Arthur
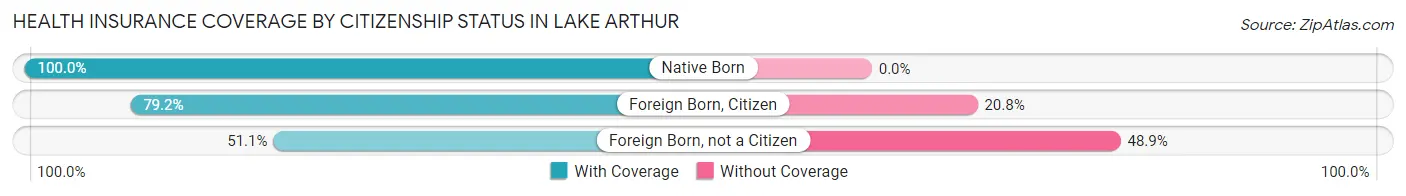
| Citizenship Status | With Coverage | Without Coverage |
| Native Born | 7 (100.0%) | 0 (0.0%) |
| Foreign Born, Citizen | 103 (79.2%) | 27 (20.8%) |
| Foreign Born, not a Citizen | 23 (51.1%) | 22 (48.9%) |
Health Insurance Coverage by Household Income in Lake Arthur
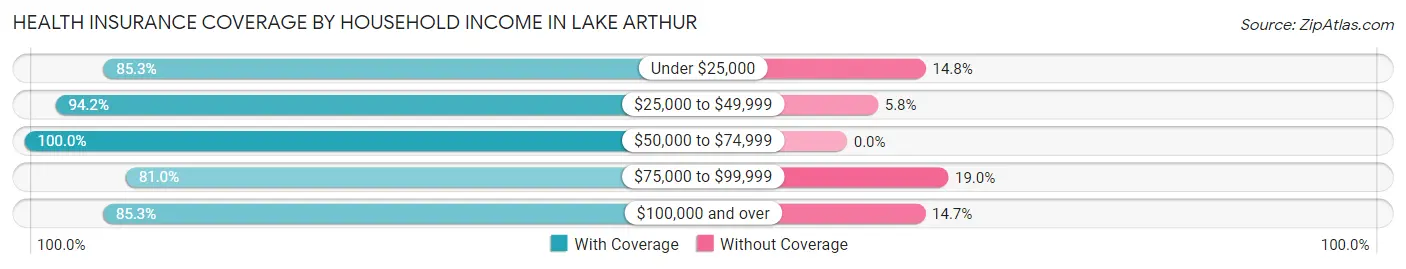
| Household Income | With Coverage | Without Coverage |
| Under $25,000 | 52 (85.3%) | 9 (14.7%) |
| $25,000 to $49,999 | 81 (94.2%) | 5 (5.8%) |
| $50,000 to $74,999 | 80 (100.0%) | 0 (0.0%) |
| $75,000 to $99,999 | 94 (81.0%) | 22 (19.0%) |
| $100,000 and over | 157 (85.3%) | 27 (14.7%) |
Public vs Private Health Insurance Coverage by Age in Lake Arthur
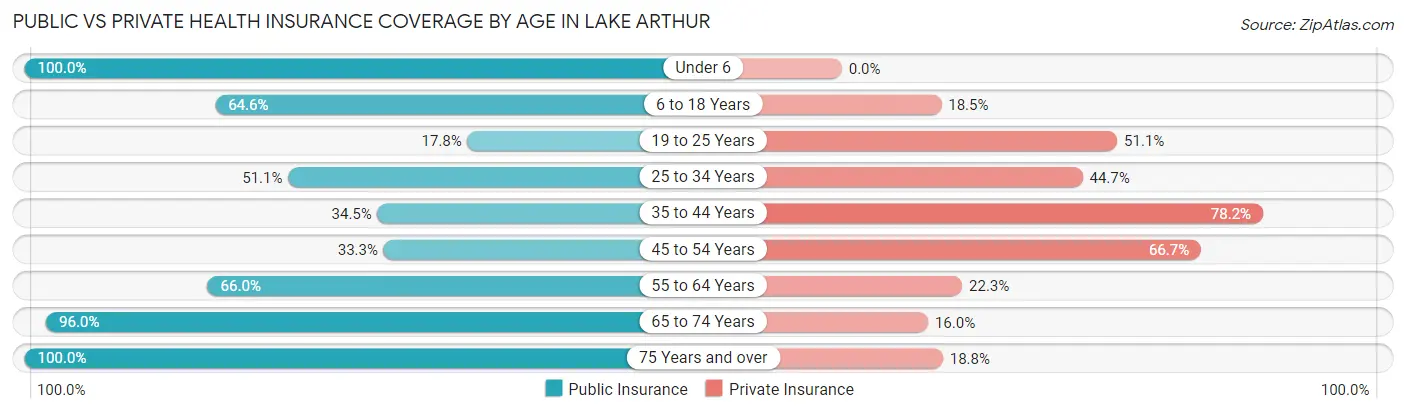
| Age Bracket | Public Insurance | Private Insurance |
| Under 6 | 7 (100.0%) | 0 (0.0%) |
| 6 to 18 Years | 84 (64.6%) | 24 (18.5%) |
| 19 to 25 Years | 8 (17.8%) | 23 (51.1%) |
| 25 to 34 Years | 24 (51.1%) | 21 (44.7%) |
| 35 to 44 Years | 30 (34.5%) | 68 (78.2%) |
| 45 to 54 Years | 14 (33.3%) | 28 (66.7%) |
| 55 to 64 Years | 68 (66.0%) | 23 (22.3%) |
| 65 to 74 Years | 48 (96.0%) | 8 (16.0%) |
| 75 Years and over | 16 (100.0%) | 3 (18.8%) |
| Total | 299 (56.7%) | 198 (37.6%) |
Disability Status by Sex by Age in Lake Arthur
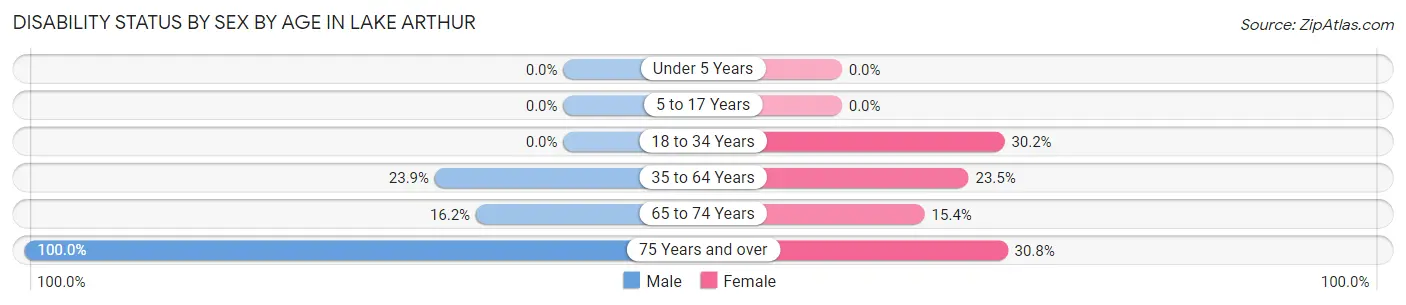
| Age Bracket | Male | Female |
| Under 5 Years | 0 (0.0%) | 0 (0.0%) |
| 5 to 17 Years | 0 (0.0%) | 0 (0.0%) |
| 18 to 34 Years | 0 (0.0%) | 16 (30.2%) |
| 35 to 64 Years | 31 (23.8%) | 24 (23.5%) |
| 65 to 74 Years | 6 (16.2%) | 2 (15.4%) |
| 75 Years and over | 3 (100.0%) | 4 (30.8%) |
Disability Class by Sex by Age in Lake Arthur
Disability Class: Hearing Difficulty
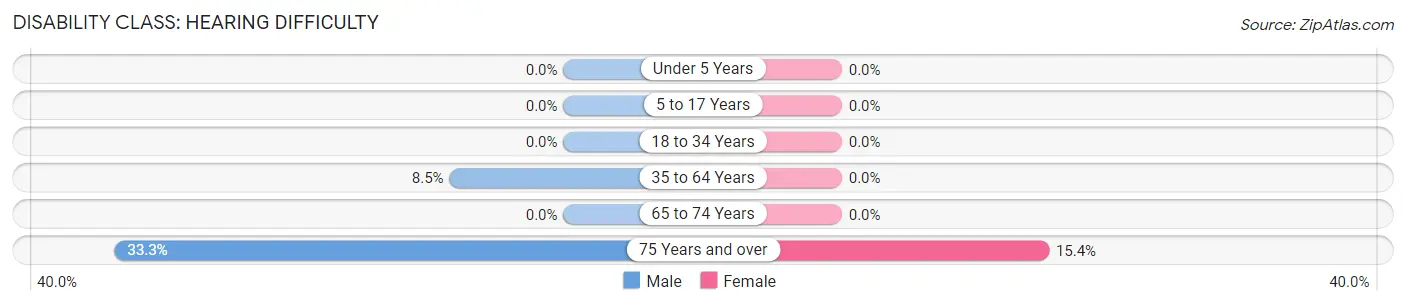
| Age Bracket | Male | Female |
| Under 5 Years | 0 (0.0%) | 0 (0.0%) |
| 5 to 17 Years | 0 (0.0%) | 0 (0.0%) |
| 18 to 34 Years | 0 (0.0%) | 0 (0.0%) |
| 35 to 64 Years | 11 (8.5%) | 0 (0.0%) |
| 65 to 74 Years | 0 (0.0%) | 0 (0.0%) |
| 75 Years and over | 1 (33.3%) | 2 (15.4%) |
Disability Class: Vision Difficulty
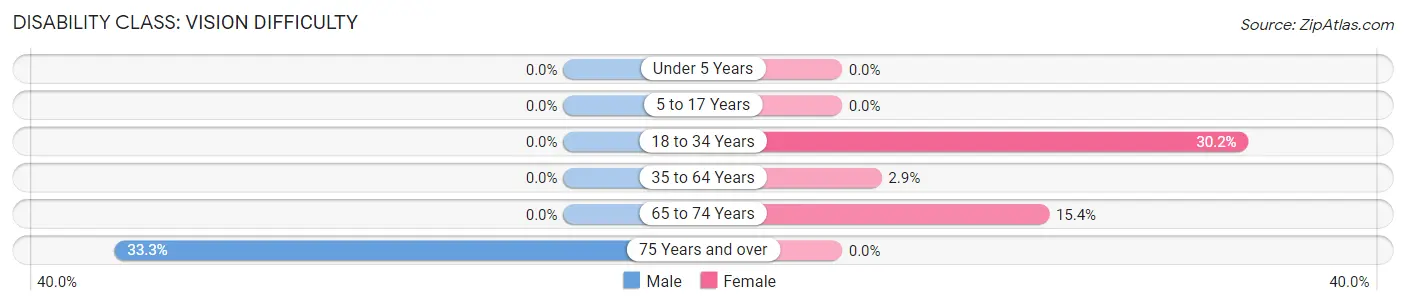
| Age Bracket | Male | Female |
| Under 5 Years | 0 (0.0%) | 0 (0.0%) |
| 5 to 17 Years | 0 (0.0%) | 0 (0.0%) |
| 18 to 34 Years | 0 (0.0%) | 16 (30.2%) |
| 35 to 64 Years | 0 (0.0%) | 3 (2.9%) |
| 65 to 74 Years | 0 (0.0%) | 2 (15.4%) |
| 75 Years and over | 1 (33.3%) | 0 (0.0%) |
Disability Class: Cognitive Difficulty
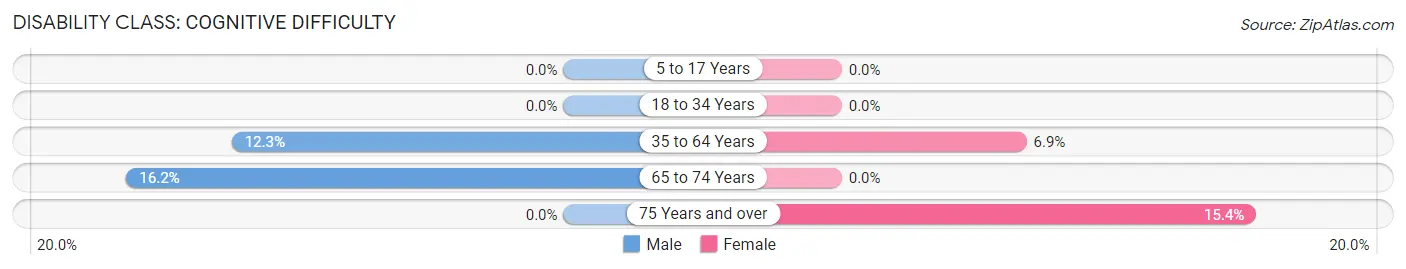
| Age Bracket | Male | Female |
| 5 to 17 Years | 0 (0.0%) | 0 (0.0%) |
| 18 to 34 Years | 0 (0.0%) | 0 (0.0%) |
| 35 to 64 Years | 16 (12.3%) | 7 (6.9%) |
| 65 to 74 Years | 6 (16.2%) | 0 (0.0%) |
| 75 Years and over | 0 (0.0%) | 2 (15.4%) |
Disability Class: Ambulatory Difficulty
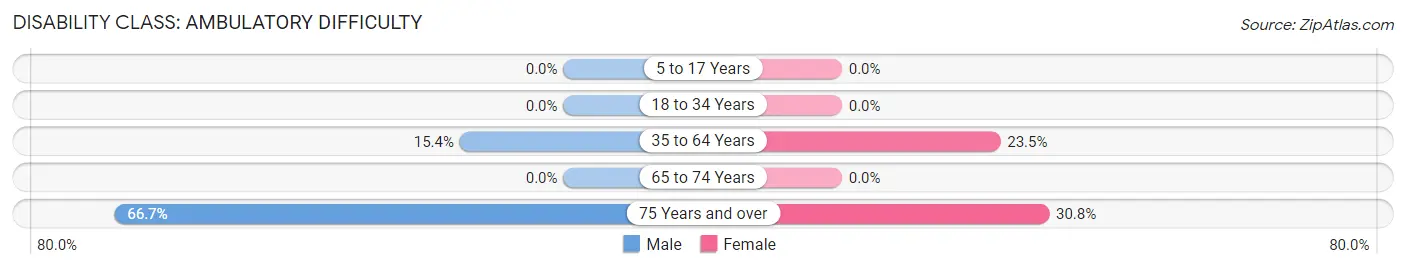
| Age Bracket | Male | Female |
| 5 to 17 Years | 0 (0.0%) | 0 (0.0%) |
| 18 to 34 Years | 0 (0.0%) | 0 (0.0%) |
| 35 to 64 Years | 20 (15.4%) | 24 (23.5%) |
| 65 to 74 Years | 0 (0.0%) | 0 (0.0%) |
| 75 Years and over | 2 (66.7%) | 4 (30.8%) |
Disability Class: Self-Care Difficulty
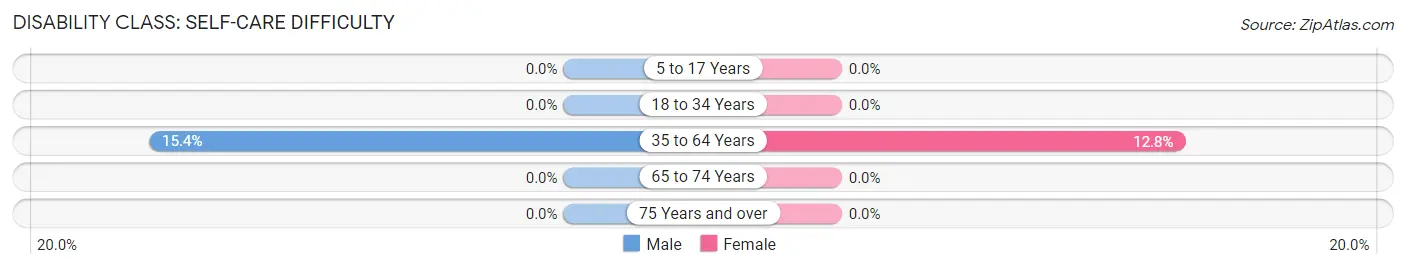
| Age Bracket | Male | Female |
| 5 to 17 Years | 0 (0.0%) | 0 (0.0%) |
| 18 to 34 Years | 0 (0.0%) | 0 (0.0%) |
| 35 to 64 Years | 20 (15.4%) | 13 (12.8%) |
| 65 to 74 Years | 0 (0.0%) | 0 (0.0%) |
| 75 Years and over | 0 (0.0%) | 0 (0.0%) |
Technology Access in Lake Arthur
Computing Device Access in Lake Arthur
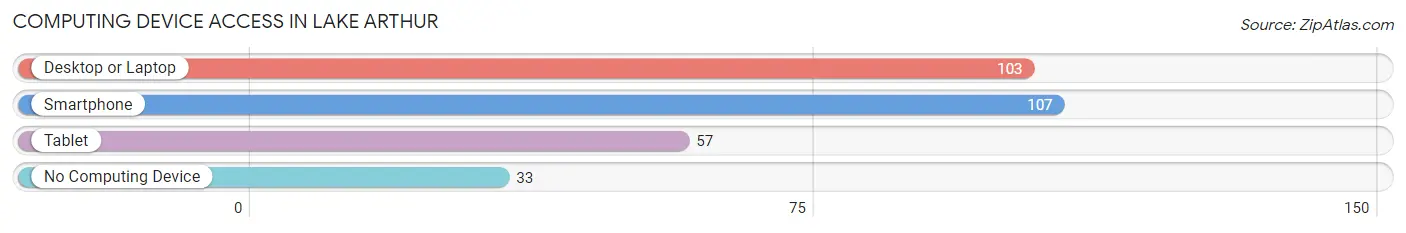
| Device Type | # Households | % Households |
| Desktop or Laptop | 103 | 66.9% |
| Smartphone | 107 | 69.5% |
| Tablet | 57 | 37.0% |
| No Computing Device | 33 | 21.4% |
| Total | 154 | 100.0% |
Internet Access in Lake Arthur
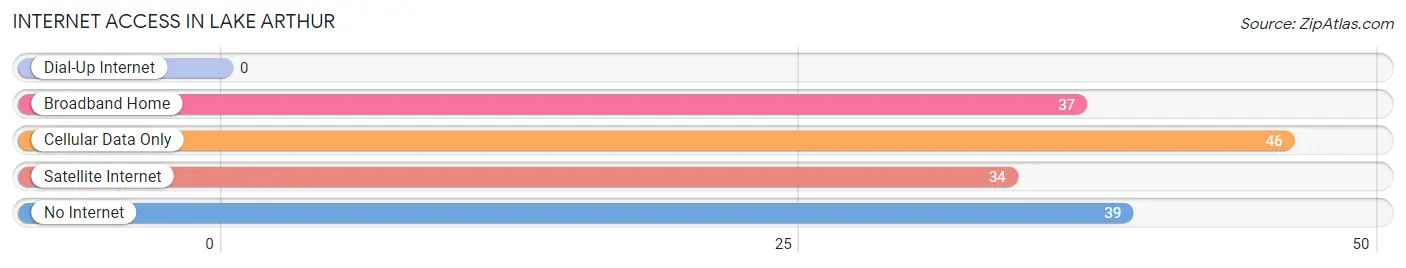
| Internet Type | # Households | % Households |
| Dial-Up Internet | 0 | 0.0% |
| Broadband Home | 37 | 24.0% |
| Cellular Data Only | 46 | 29.9% |
| Satellite Internet | 34 | 22.1% |
| No Internet | 39 | 25.3% |
| Total | 154 | 100.0% |
Lake Arthur Summary
Lake Arthur is a small village located in Chaves County, New Mexico. It is situated in the southeastern corner of the state, approximately 25 miles south of Roswell. The village is located on the banks of Lake Arthur, a man-made lake created in the 1950s. The lake is a popular destination for fishing, boating, and other recreational activities.
Geography
Lake Arthur is located in the southeastern corner of New Mexico, approximately 25 miles south of Roswell. The village is situated on the banks of Lake Arthur, a man-made lake created in the 1950s. The lake is a popular destination for fishing, boating, and other recreational activities. The village is surrounded by desert and grassland, with the nearest mountain range being the Sacramento Mountains to the west. The climate in the area is semi-arid, with hot summers and mild winters.
History
The area around Lake Arthur has been inhabited for thousands of years by Native American tribes, including the Mescalero Apache, Jicarilla Apache, and Comanche. The first European settlers arrived in the area in the late 1800s, and the village of Lake Arthur was established in the early 1900s. The village was named after the lake, which was created in the 1950s as part of a federal irrigation project.
Economy
The economy of Lake Arthur is largely based on agriculture and tourism. The village is home to several farms, which produce a variety of crops, including alfalfa, cotton, and corn. The lake is a popular destination for fishing, boating, and other recreational activities, and the village is home to several restaurants, hotels, and other tourist-oriented businesses.
Demographics
As of the 2010 census, the population of Lake Arthur was 1,093. The racial makeup of the village was 94.3% White, 0.7% African American, 0.7% Native American, 0.3% Asian, 0.1% Pacific Islander, and 3.0% from other races. The median household income was $30,938, and the median family income was $35,625. The per capita income was $14,945.
Conclusion
Lake Arthur is a small village located in Chaves County, New Mexico. It is situated in the southeastern corner of the state, approximately 25 miles south of Roswell. The village is located on the banks of Lake Arthur, a man-made lake created in the 1950s. The lake is a popular destination for fishing, boating, and other recreational activities. The economy of Lake Arthur is largely based on agriculture and tourism, and the village has a population of 1,093 as of the 2010 census.
Common Questions
What is Per Capita Income in Lake Arthur?
Per Capita income in Lake Arthur is $24,676.
What is the Median Family Income in Lake Arthur?
Median Family Income in Lake Arthur is $81,250.
What is the Median Household income in Lake Arthur?
Median Household Income in Lake Arthur is $51,429.
What is Income or Wage Gap in Lake Arthur?
Income or Wage Gap in Lake Arthur is 27.8%.
Women in Lake Arthur earn 72.2 cents for every dollar earned by a man.
What is Inequality or Gini Index in Lake Arthur?
Inequality or Gini Index in Lake Arthur is 0.47.
What is the Total Population of Lake Arthur?
Total Population of Lake Arthur is 527.
What is the Total Male Population of Lake Arthur?
Total Male Population of Lake Arthur is 310.
What is the Total Female Population of Lake Arthur?
Total Female Population of Lake Arthur is 217.
What is the Ratio of Males per 100 Females in Lake Arthur?
There are 142.86 Males per 100 Females in Lake Arthur.
What is the Ratio of Females per 100 Males in Lake Arthur?
There are 70.00 Females per 100 Males in Lake Arthur.
What is the Median Population Age in Lake Arthur?
Median Population Age in Lake Arthur is 38.1 Years.
What is the Average Family Size in Lake Arthur
Average Family Size in Lake Arthur is 3.9 People.
What is the Average Household Size in Lake Arthur
Average Household Size in Lake Arthur is 3.4 People.
How Large is the Labor Force in Lake Arthur?
There are 288 People in the Labor Forcein in Lake Arthur.
What is the Percentage of People in the Labor Force in Lake Arthur?
62.7% of People are in the Labor Force in Lake Arthur.
What is the Unemployment Rate in Lake Arthur?
Unemployment Rate in Lake Arthur is 4.5%.