La Madera, NM Map & Demographics
La Madera Map
La Madera Overview
$54,315
PER CAPITA INCOME
$141,875
AVG FAMILY INCOME
0.51
INEQUALITY / GINI INDEX
403
TOTAL POPULATION
198
MALE POPULATION
205
FEMALE POPULATION
96.59
MALES / 100 FEMALES
103.54
FEMALES / 100 MALES
56.8
MEDIAN AGE
2.2
AVG FAMILY SIZE
2.1
AVG HOUSEHOLD SIZE
123
LABOR FORCE [ PEOPLE ]
30.5%
PERCENT IN LABOR FORCE
30.1%
UNEMPLOYMENT RATE
La Madera Zip Codes
La Madera Area Codes
Income in La Madera
Income Overview in La Madera
| Characteristic | Number | Measure |
| Per Capita Income | 403 | $54,315 |
| Median Family Income | 146 | $141,875 |
| Mean Family Income | 146 | $127,386 |
| Median Household Income | 195 | $0 |
| Mean Household Income | 195 | $114,964 |
| Income Deficit | 146 | $0 |
| Wage / Income Gap (%) | 403 | 0.00% |
| Wage / Income Gap ($) | 403 | 100.00¢ per $1 |
| Gini / Inequality Index | 403 | 0.51 |
Earnings by Sex in La Madera
| Sex | Number | Average Earnings |
| Male | 72 (43.6%) | $0 |
| Female | 93 (56.4%) | $0 |
| Total | 165 (100.0%) | $0 |
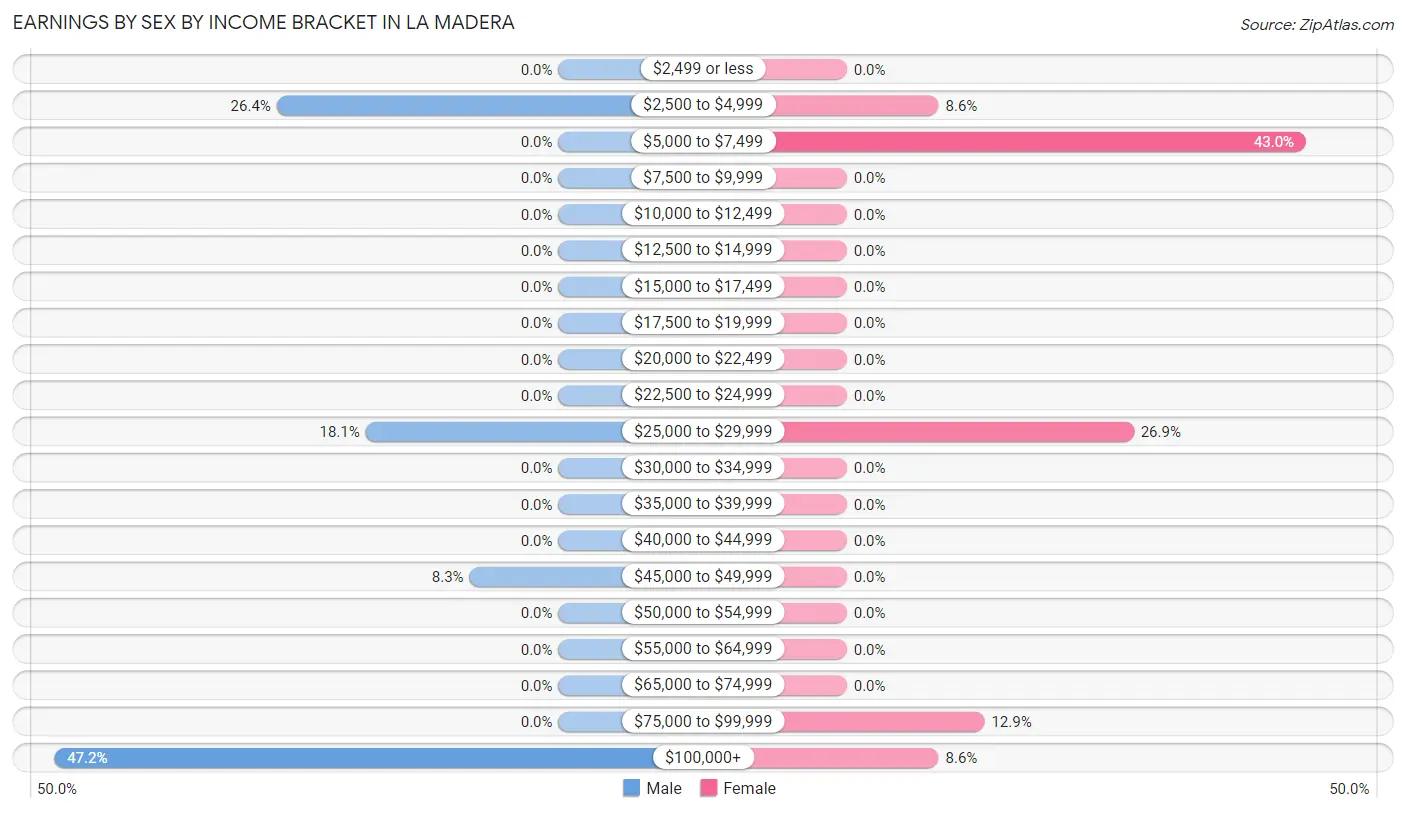
Earnings by Sex by Income Bracket in La Madera
The most common earnings brackets in La Madera are $100,000+ for men (34 | 47.2%) and $5,000 to $7,499 for women (40 | 43.0%).
| Income | Male | Female |
| $2,499 or less | 0 (0.0%) | 0 (0.0%) |
| $2,500 to $4,999 | 19 (26.4%) | 8 (8.6%) |
| $5,000 to $7,499 | 0 (0.0%) | 40 (43.0%) |
| $7,500 to $9,999 | 0 (0.0%) | 0 (0.0%) |
| $10,000 to $12,499 | 0 (0.0%) | 0 (0.0%) |
| $12,500 to $14,999 | 0 (0.0%) | 0 (0.0%) |
| $15,000 to $17,499 | 0 (0.0%) | 0 (0.0%) |
| $17,500 to $19,999 | 0 (0.0%) | 0 (0.0%) |
| $20,000 to $22,499 | 0 (0.0%) | 0 (0.0%) |
| $22,500 to $24,999 | 0 (0.0%) | 0 (0.0%) |
| $25,000 to $29,999 | 13 (18.1%) | 25 (26.9%) |
| $30,000 to $34,999 | 0 (0.0%) | 0 (0.0%) |
| $35,000 to $39,999 | 0 (0.0%) | 0 (0.0%) |
| $40,000 to $44,999 | 0 (0.0%) | 0 (0.0%) |
| $45,000 to $49,999 | 6 (8.3%) | 0 (0.0%) |
| $50,000 to $54,999 | 0 (0.0%) | 0 (0.0%) |
| $55,000 to $64,999 | 0 (0.0%) | 0 (0.0%) |
| $65,000 to $74,999 | 0 (0.0%) | 0 (0.0%) |
| $75,000 to $99,999 | 0 (0.0%) | 12 (12.9%) |
| $100,000+ | 34 (47.2%) | 8 (8.6%) |
| Total | 72 (100.0%) | 93 (100.0%) |
Earnings by Sex by Educational Attainment in La Madera
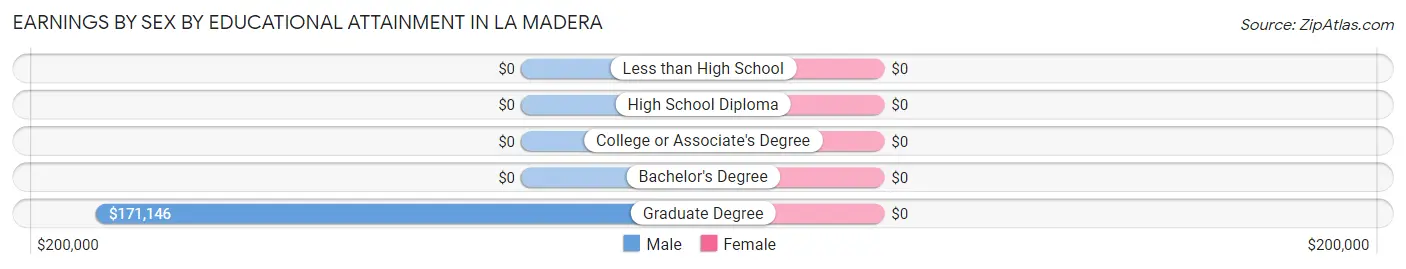
| Educational Attainment | Male Income | Female Income |
| Less than High School | - | - |
| High School Diploma | - | - |
| College or Associate's Degree | - | - |
| Bachelor's Degree | - | - |
| Graduate Degree | $171,146 | $0 |
| Total | - | - |
Family Income in La Madera
Family Income Brackets in La Madera
According to the La Madera family income data, there are 50 families falling into the $150,000 to $199,999 income range, which is the most common income bracket and makes up 34.3% of all families.
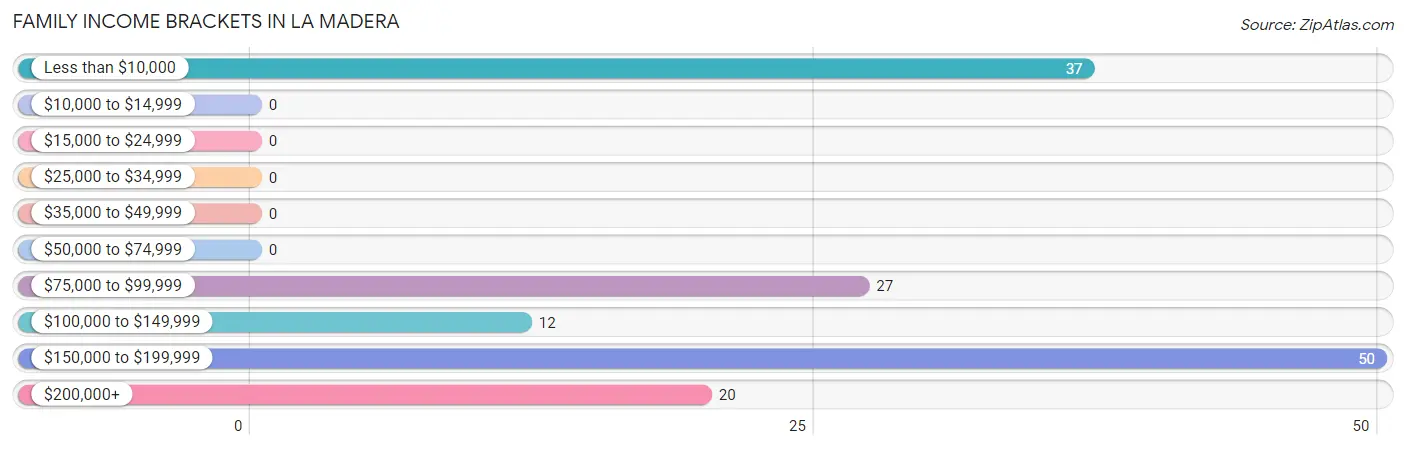
| Income Bracket | # Families | % Families |
| Less than $10,000 | 37 | 25.3% |
| $10,000 to $14,999 | 0 | 0.0% |
| $15,000 to $24,999 | 0 | 0.0% |
| $25,000 to $34,999 | 0 | 0.0% |
| $35,000 to $49,999 | 0 | 0.0% |
| $50,000 to $74,999 | 0 | 0.0% |
| $75,000 to $99,999 | 27 | 18.5% |
| $100,000 to $149,999 | 12 | 8.2% |
| $150,000 to $199,999 | 50 | 34.2% |
| $200,000+ | 20 | 13.7% |
Family Income by Famaliy Size in La Madera
2-person families (133 | 91.1%) account for the highest median family income in La Madera with $152,938 per family, while 2-person families (133 | 91.1%) have the highest median income of $76,469 per family member.
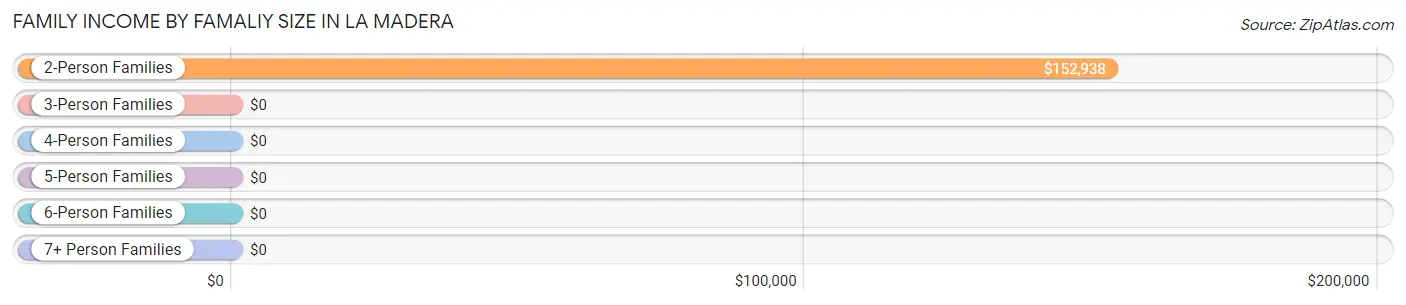
| Income Bracket | # Families | Median Income |
| 2-Person Families | 133 (91.1%) | $152,938 |
| 3-Person Families | 0 (0.0%) | $0 |
| 4-Person Families | 13 (8.9%) | $0 |
| 5-Person Families | 0 (0.0%) | $0 |
| 6-Person Families | 0 (0.0%) | $0 |
| 7+ Person Families | 0 (0.0%) | $0 |
| Total | 146 (100.0%) | $141,875 |
Family Income by Number of Earners in La Madera
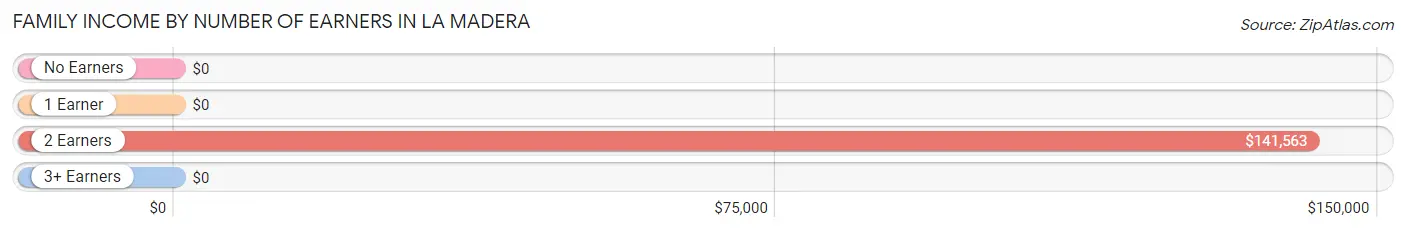
| Number of Earners | # Families | Median Income |
| No Earners | 93 (63.7%) | $0 |
| 1 Earner | 12 (8.2%) | $0 |
| 2 Earners | 41 (28.1%) | $141,563 |
| 3+ Earners | 0 (0.0%) | $0 |
| Total | 146 (100.0%) | $141,875 |
Household Income in La Madera
Household Income Brackets in La Madera
With 50 households falling in the category, the $150,000 to $199,999 income range is the most frequent in La Madera, accounting for 25.6% of all households.
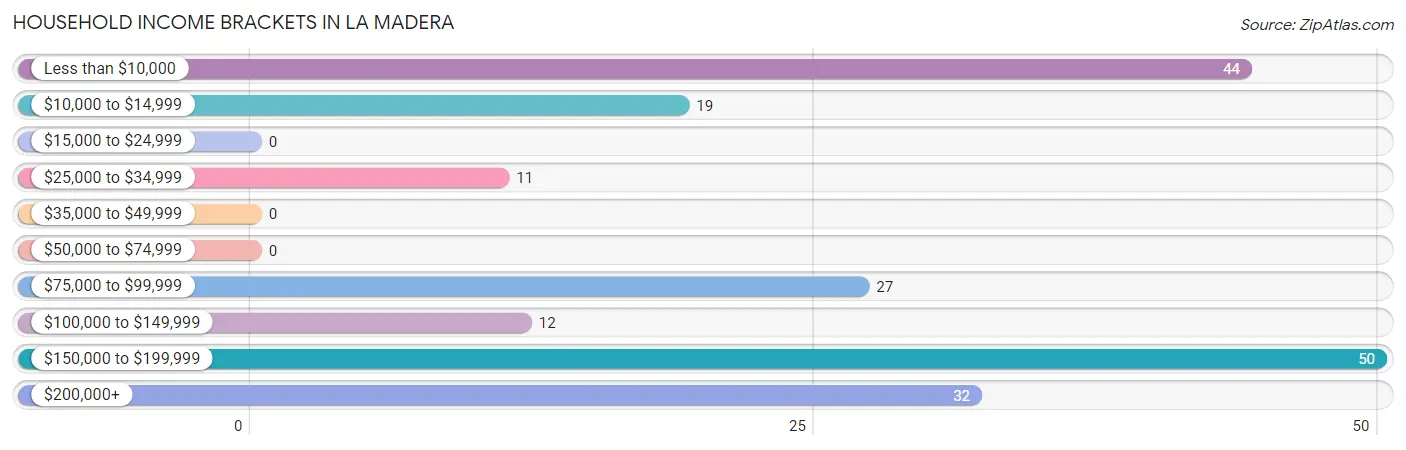
| Income Bracket | # Households | % Households |
| Less than $10,000 | 44 | 22.6% |
| $10,000 to $14,999 | 19 | 9.7% |
| $15,000 to $24,999 | 0 | 0.0% |
| $25,000 to $34,999 | 11 | 5.6% |
| $35,000 to $49,999 | 0 | 0.0% |
| $50,000 to $74,999 | 0 | 0.0% |
| $75,000 to $99,999 | 27 | 13.8% |
| $100,000 to $149,999 | 12 | 6.2% |
| $150,000 to $199,999 | 50 | 25.6% |
| $200,000+ | 32 | 16.4% |
Household Income by Householder Age in La Madera
The median household income in La Madera is $0, with the highest median household income of $153,813 found in the 65+ years age bracket for the primary householder. A total of 63 households (32.3%) fall into this category.
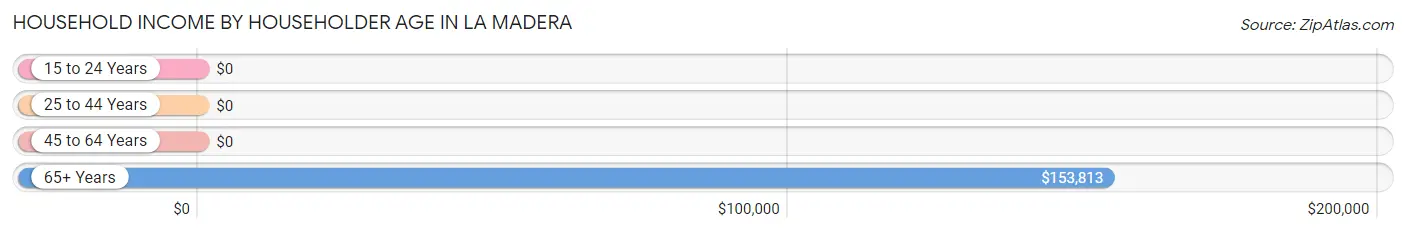
| Income Bracket | # Households | Median Income |
| 15 to 24 Years | 0 (0.0%) | $0 |
| 25 to 44 Years | 11 (5.6%) | $0 |
| 45 to 64 Years | 121 (62.1%) | $0 |
| 65+ Years | 63 (32.3%) | $153,813 |
| Total | 195 (100.0%) | $0 |
Poverty in La Madera
Income Below Poverty by Sex and Age in La Madera
With 33.8% poverty level for males and 29.8% for females among the residents of La Madera, 35 to 44 year old males and 45 to 54 year old females are the most vulnerable to poverty, with 11 males (100.0%) and 54 females (73.0%) in their respective age groups living below the poverty level.
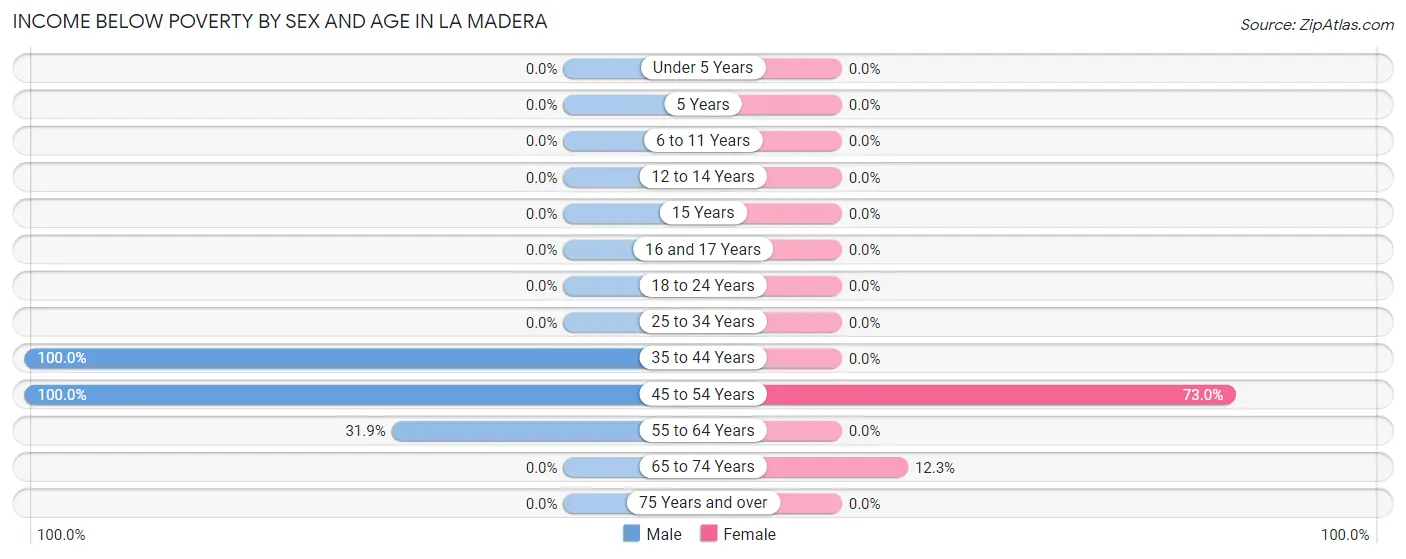
| Age Bracket | Male | Female |
| Under 5 Years | 0 (0.0%) | 0 (0.0%) |
| 5 Years | 0 (0.0%) | 0 (0.0%) |
| 6 to 11 Years | 0 (0.0%) | 0 (0.0%) |
| 12 to 14 Years | 0 (0.0%) | 0 (0.0%) |
| 15 Years | 0 (0.0%) | 0 (0.0%) |
| 16 and 17 Years | 0 (0.0%) | 0 (0.0%) |
| 18 to 24 Years | 0 (0.0%) | 0 (0.0%) |
| 25 to 34 Years | 0 (0.0%) | 0 (0.0%) |
| 35 to 44 Years | 11 (100.0%) | 0 (0.0%) |
| 45 to 54 Years | 19 (100.0%) | 54 (73.0%) |
| 55 to 64 Years | 37 (31.9%) | 0 (0.0%) |
| 65 to 74 Years | 0 (0.0%) | 7 (12.3%) |
| 75 Years and over | 0 (0.0%) | 0 (0.0%) |
| Total | 67 (33.8%) | 61 (29.8%) |
Income Above Poverty by Sex and Age in La Madera
According to the poverty statistics in La Madera, males aged 16 and 17 years and females aged 18 to 24 years are the age groups that are most secure financially, with 100.0% of males and 100.0% of females in these age groups living above the poverty line.
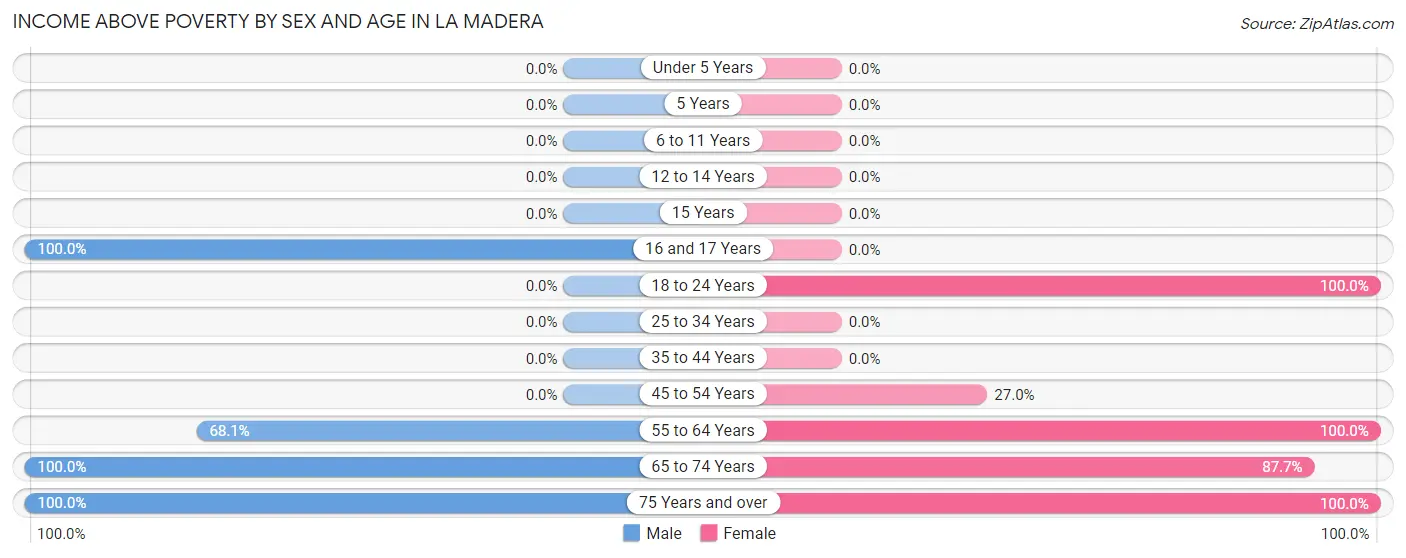
| Age Bracket | Male | Female |
| Under 5 Years | 0 (0.0%) | 0 (0.0%) |
| 5 Years | 0 (0.0%) | 0 (0.0%) |
| 6 to 11 Years | 0 (0.0%) | 0 (0.0%) |
| 12 to 14 Years | 0 (0.0%) | 0 (0.0%) |
| 15 Years | 0 (0.0%) | 0 (0.0%) |
| 16 and 17 Years | 14 (100.0%) | 0 (0.0%) |
| 18 to 24 Years | 0 (0.0%) | 22 (100.0%) |
| 25 to 34 Years | 0 (0.0%) | 0 (0.0%) |
| 35 to 44 Years | 0 (0.0%) | 0 (0.0%) |
| 45 to 54 Years | 0 (0.0%) | 20 (27.0%) |
| 55 to 64 Years | 79 (68.1%) | 39 (100.0%) |
| 65 to 74 Years | 19 (100.0%) | 50 (87.7%) |
| 75 Years and over | 19 (100.0%) | 13 (100.0%) |
| Total | 131 (66.2%) | 144 (70.2%) |
Income Below Poverty Among Married-Couple Families in La Madera
The poverty statistics for married-couple families in La Madera show that 25.3% or 37 of the total 146 families live below the poverty line. Families with no children have the highest poverty rate of 27.8%, comprising of 37 families. On the other hand, families with 1 or 2 children have the lowest poverty rate of 0.0%, which includes 0 families.
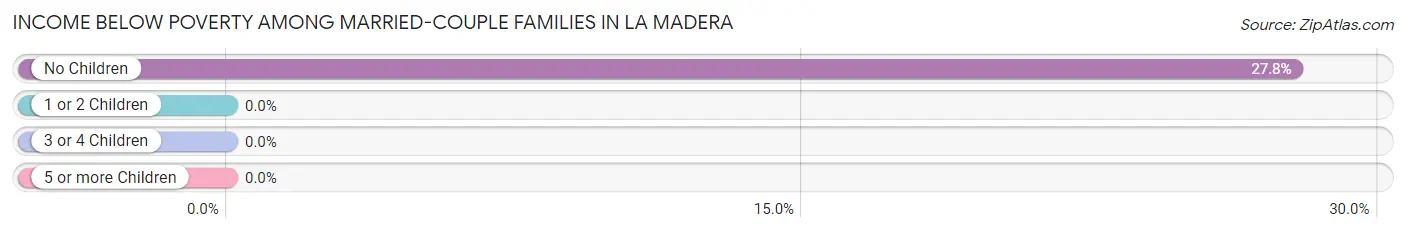
| Children | Above Poverty | Below Poverty |
| No Children | 96 (72.2%) | 37 (27.8%) |
| 1 or 2 Children | 13 (100.0%) | 0 (0.0%) |
| 3 or 4 Children | 0 (0.0%) | 0 (0.0%) |
| 5 or more Children | 0 (0.0%) | 0 (0.0%) |
| Total | 109 (74.7%) | 37 (25.3%) |
Income Below Poverty Among Single-Parent Households in La Madera
| Children | Single Father | Single Mother |
| No Children | 0 (0.0%) | 0 (0.0%) |
| 1 or 2 Children | 0 (0.0%) | 0 (0.0%) |
| 3 or 4 Children | 0 (0.0%) | 0 (0.0%) |
| 5 or more Children | 0 (0.0%) | 0 (0.0%) |
| Total | 0 (0.0%) | 0 (0.0%) |
Income Below Poverty Among Married-Couple vs Single-Parent Households in La Madera
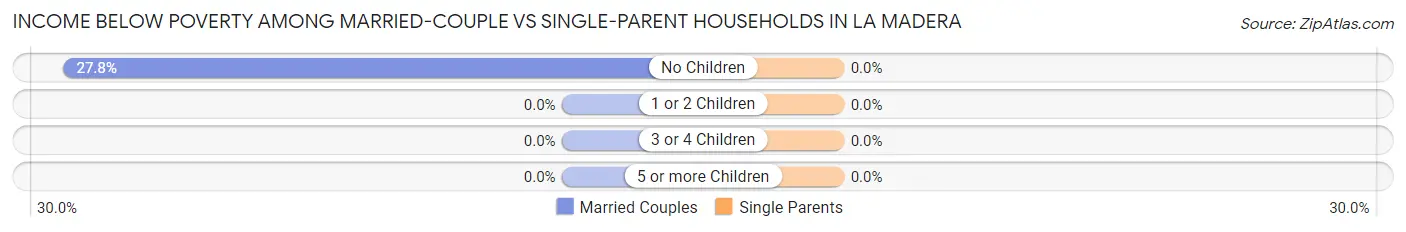
| Children | Married-Couple Families | Single-Parent Households |
| No Children | 37 (27.8%) | 0 (0.0%) |
| 1 or 2 Children | 0 (0.0%) | 0 (0.0%) |
| 3 or 4 Children | 0 (0.0%) | 0 (0.0%) |
| 5 or more Children | 0 (0.0%) | 0 (0.0%) |
| Total | 37 (25.3%) | 0 (0.0%) |
Race in La Madera
The most populous races in La Madera are White / Caucasian (330 | 81.9%), Hispanic or Latino (110 | 27.3%), and Two or more Races (73 | 18.1%).
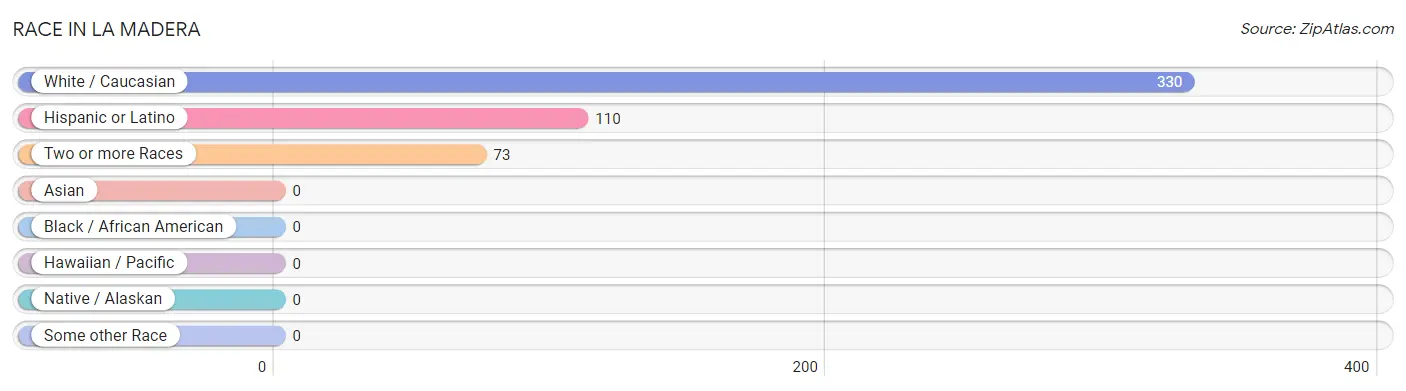
| Race | # Population | % Population |
| Asian | 0 | 0.0% |
| Black / African American | 0 | 0.0% |
| Hawaiian / Pacific | 0 | 0.0% |
| Hispanic or Latino | 110 | 27.3% |
| Native / Alaskan | 0 | 0.0% |
| White / Caucasian | 330 | 81.9% |
| Two or more Races | 73 | 18.1% |
| Some other Race | 0 | 0.0% |
| Total | 403 | 100.0% |
Ancestry in La Madera
The most populous ancestries reported in La Madera are American (105 | 26.1%), Spanish (73 | 18.1%), English (62 | 15.4%), German (45 | 11.2%), and Mexican (37 | 9.2%), together accounting for 79.9% of all La Madera residents.
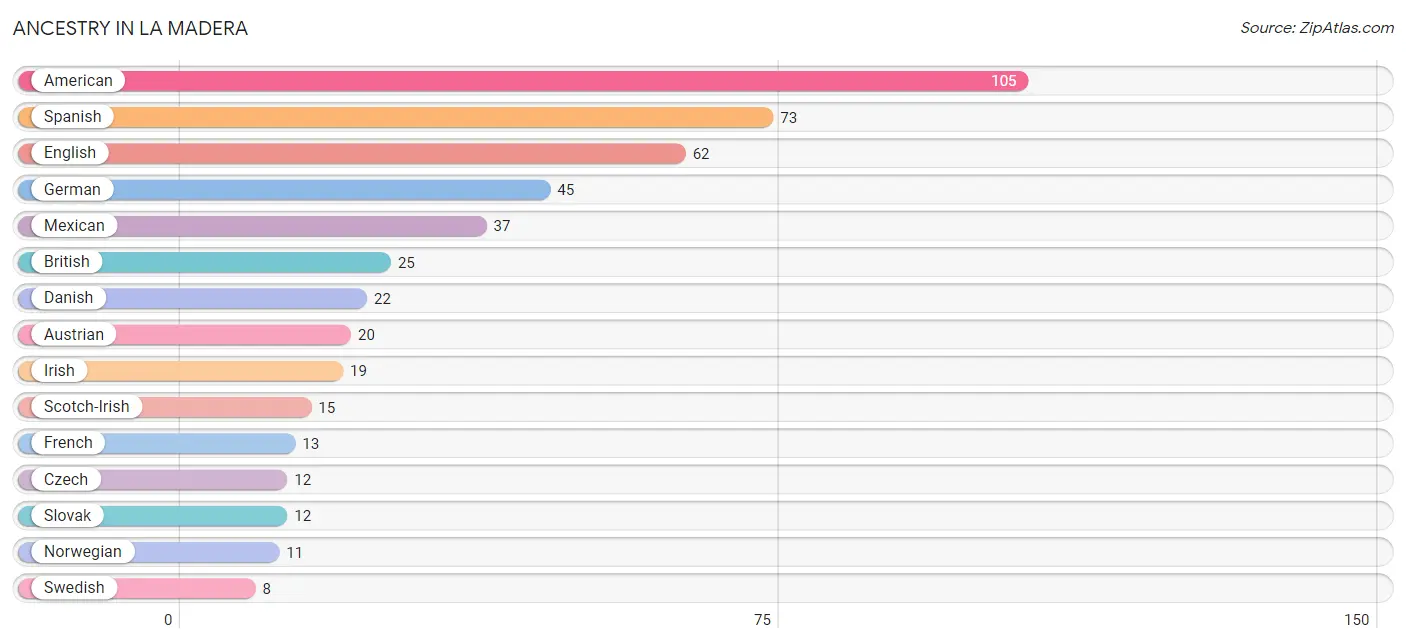
| Ancestry | # Population | % Population |
| American | 105 | 26.1% |
| Austrian | 20 | 5.0% |
| British | 25 | 6.2% |
| Canadian | 5 | 1.2% |
| Czech | 12 | 3.0% |
| Danish | 22 | 5.5% |
| English | 62 | 15.4% |
| French | 13 | 3.2% |
| German | 45 | 11.2% |
| Irish | 19 | 4.7% |
| Mexican | 37 | 9.2% |
| Norwegian | 11 | 2.7% |
| Scotch-Irish | 15 | 3.7% |
| Slovak | 12 | 3.0% |
| Spanish | 73 | 18.1% |
| Swedish | 8 | 2.0% | View All 16 Rows |
Immigrants in La Madera

| Immigration Origin | # Population | % Population | View All 0 Rows |
Sex and Age in La Madera
Sex and Age in La Madera
The most populous age groups in La Madera are 55 to 59 Years (89 | 45.0%) for men and 50 to 54 Years (56 | 27.3%) for women.
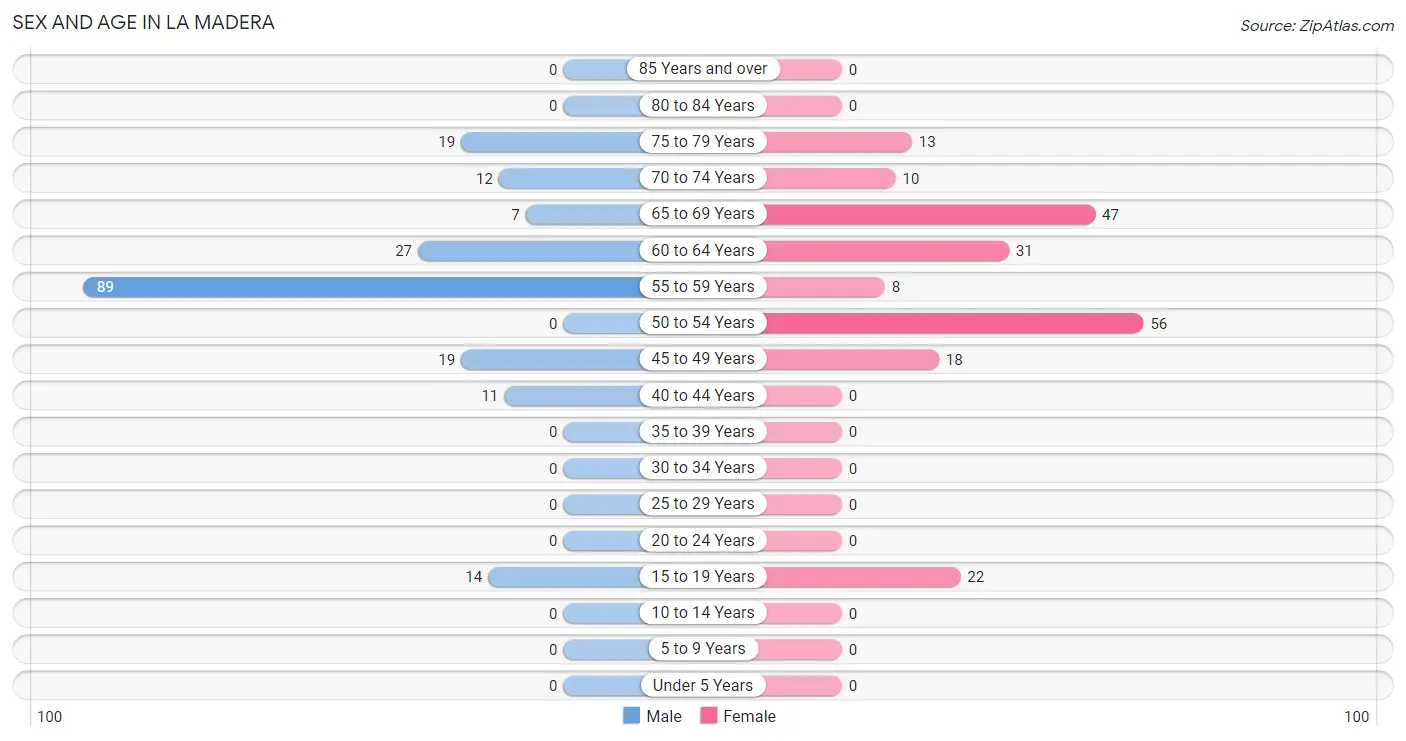
| Age Bracket | Male | Female |
| Under 5 Years | 0 (0.0%) | 0 (0.0%) |
| 5 to 9 Years | 0 (0.0%) | 0 (0.0%) |
| 10 to 14 Years | 0 (0.0%) | 0 (0.0%) |
| 15 to 19 Years | 14 (7.1%) | 22 (10.7%) |
| 20 to 24 Years | 0 (0.0%) | 0 (0.0%) |
| 25 to 29 Years | 0 (0.0%) | 0 (0.0%) |
| 30 to 34 Years | 0 (0.0%) | 0 (0.0%) |
| 35 to 39 Years | 0 (0.0%) | 0 (0.0%) |
| 40 to 44 Years | 11 (5.6%) | 0 (0.0%) |
| 45 to 49 Years | 19 (9.6%) | 18 (8.8%) |
| 50 to 54 Years | 0 (0.0%) | 56 (27.3%) |
| 55 to 59 Years | 89 (45.0%) | 8 (3.9%) |
| 60 to 64 Years | 27 (13.6%) | 31 (15.1%) |
| 65 to 69 Years | 7 (3.5%) | 47 (22.9%) |
| 70 to 74 Years | 12 (6.1%) | 10 (4.9%) |
| 75 to 79 Years | 19 (9.6%) | 13 (6.3%) |
| 80 to 84 Years | 0 (0.0%) | 0 (0.0%) |
| 85 Years and over | 0 (0.0%) | 0 (0.0%) |
| Total | 198 (100.0%) | 205 (100.0%) |
Families and Households in La Madera
Median Family Size in La Madera
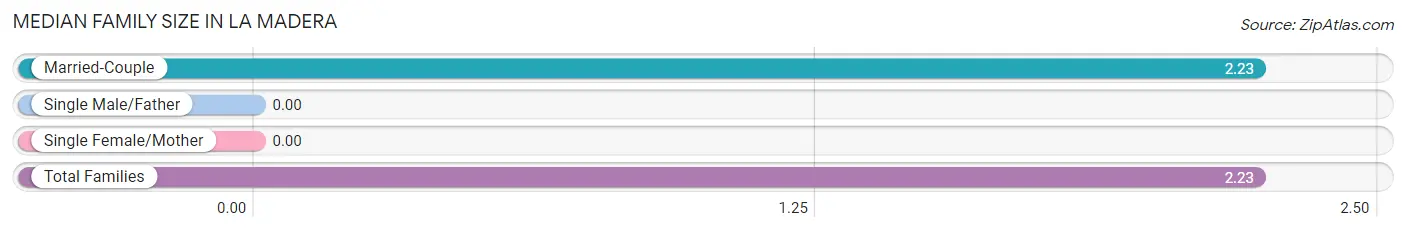
| Family Type | # Families | Family Size |
| Married-Couple | 146 (100.0%) | 2.23 |
| Single Male/Father | 0 (0.0%) | - |
| Single Female/Mother | 0 (0.0%) | - |
| Total Families | 146 (100.0%) | 2.23 |
Median Household Size in La Madera
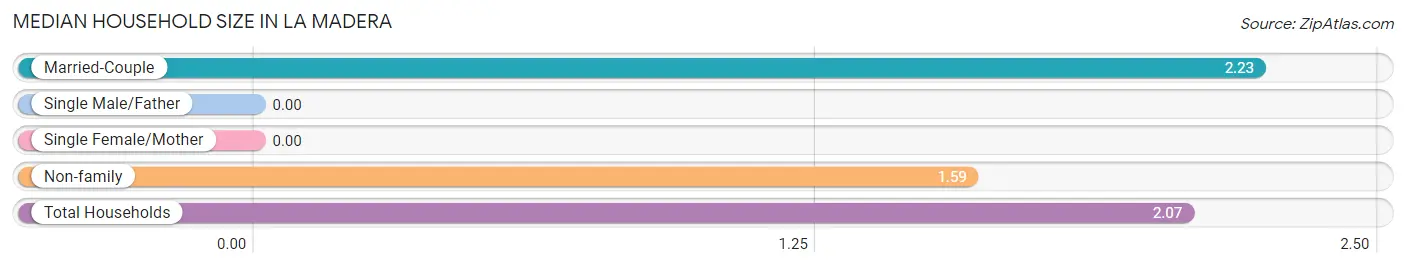
| Household Type | # Households | Household Size |
| Married-Couple | 146 (74.9%) | 2.23 |
| Single Male/Father | 0 (0.0%) | - |
| Single Female/Mother | 0 (0.0%) | - |
| Non-family | 49 (25.1%) | 1.59 |
| Total Households | 195 (100.0%) | 2.07 |
Household Size by Marriage Status in La Madera
Out of a total of 195 households in La Madera, 146 (74.9%) are family households, while 49 (25.1%) are nonfamily households. The most numerous type of family households are 2-person households, comprising 133, and the most common type of nonfamily households are 2-person households, comprising 30.
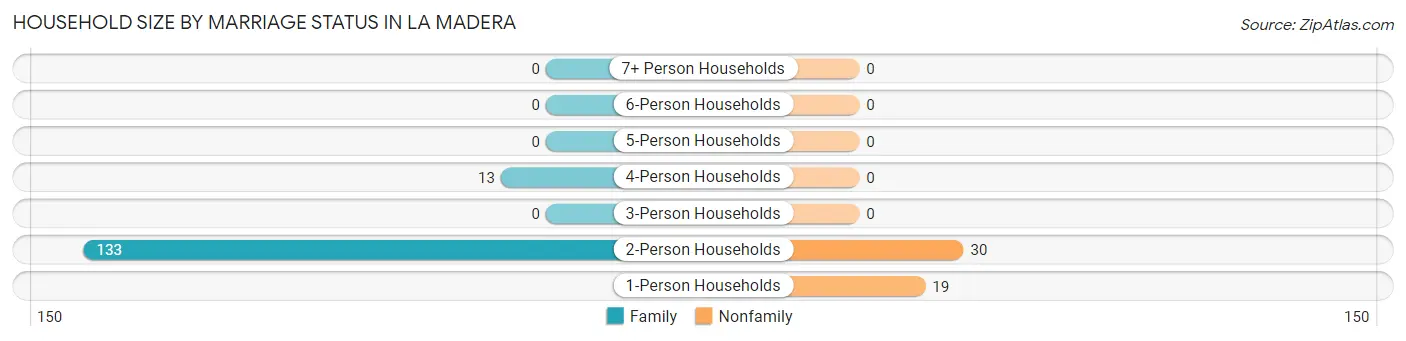
| Household Size | Family Households | Nonfamily Households |
| 1-Person Households | - | 19 (9.7%) |
| 2-Person Households | 133 (68.2%) | 30 (15.4%) |
| 3-Person Households | 0 (0.0%) | 0 (0.0%) |
| 4-Person Households | 13 (6.7%) | 0 (0.0%) |
| 5-Person Households | 0 (0.0%) | 0 (0.0%) |
| 6-Person Households | 0 (0.0%) | 0 (0.0%) |
| 7+ Person Households | 0 (0.0%) | 0 (0.0%) |
| Total | 146 (74.9%) | 49 (25.1%) |
Female Fertility in La Madera
Fertility by Age in La Madera
| Age Bracket | Women with Births | Births / 1,000 Women |
| 15 to 19 years | 0 (0.0%) | 0.0 |
| 20 to 34 years | 0 (0.0%) | 0.0 |
| 35 to 50 years | 0 (0.0%) | 0.0 |
| Total | 0 (0.0%) | 0.0 |
Fertility by Age by Marriage Status in La Madera
| Age Bracket | Married | Unmarried |
| 15 to 19 years | 0 (0.0%) | 0 (0.0%) |
| 20 to 34 years | 0 (0.0%) | 0 (0.0%) |
| 35 to 50 years | 0 (0.0%) | 0 (0.0%) |
| Total | 0 (0.0%) | 0 (0.0%) |
Fertility by Education in La Madera
| Educational Attainment | Women with Births | Births / 1,000 Women |
| Less than High School | 0 (0.0%) | 0.0 |
| High School Diploma | 0 (0.0%) | 0.0 |
| College or Associate's Degree | 0 (0.0%) | 0.0 |
| Bachelor's Degree | 0 (0.0%) | 0.0 |
| Graduate Degree | 0 (0.0%) | 0.0 |
| Total | 0 (0.0%) | 0.0 |
Fertility by Education by Marriage Status in La Madera
| Educational Attainment | Married | Unmarried |
| Less than High School | 0 (0.0%) | 0 (0.0%) |
| High School Diploma | 0 (0.0%) | 0 (0.0%) |
| College or Associate's Degree | 0 (0.0%) | 0 (0.0%) |
| Bachelor's Degree | 0 (0.0%) | 0 (0.0%) |
| Graduate Degree | 0 (0.0%) | 0 (0.0%) |
| Total | 0 (0.0%) | 0 (0.0%) |
Employment Characteristics in La Madera
Employment by Class of Employer in La Madera
Among the 86 employed individuals in La Madera, private company employees (58 | 67.4%), federal government employees (20 | 23.3%), and local government employees (8 | 9.3%) make up the most common classes of employment.
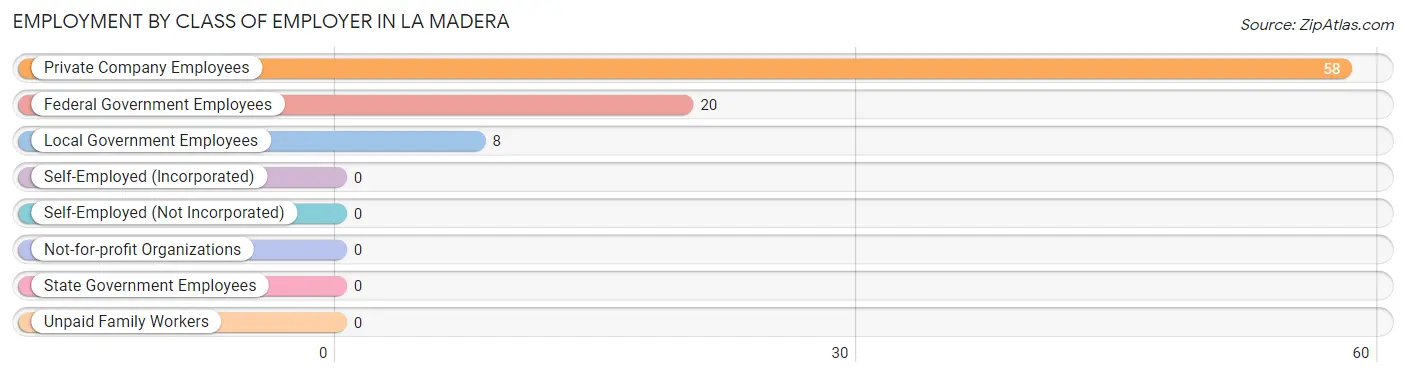
| Employer Class | # Employees | % Employees |
| Private Company Employees | 58 | 67.4% |
| Self-Employed (Incorporated) | 0 | 0.0% |
| Self-Employed (Not Incorporated) | 0 | 0.0% |
| Not-for-profit Organizations | 0 | 0.0% |
| Local Government Employees | 8 | 9.3% |
| State Government Employees | 0 | 0.0% |
| Federal Government Employees | 20 | 23.3% |
| Unpaid Family Workers | 0 | 0.0% |
| Total | 86 | 100.0% |
Employment Status by Age in La Madera
According to the labor force statistics for La Madera, out of the total population over 16 years of age (403), 30.5% or 123 individuals are in the labor force, with 30.1% or 37 of them unemployed. The age group with the highest labor force participation rate is 16 to 19 years, with 61.1% or 22 individuals in the labor force. Within the labor force, the 45 to 54 years age range has the highest percentage of unemployed individuals, with 72.5% or 37 of them being unemployed.
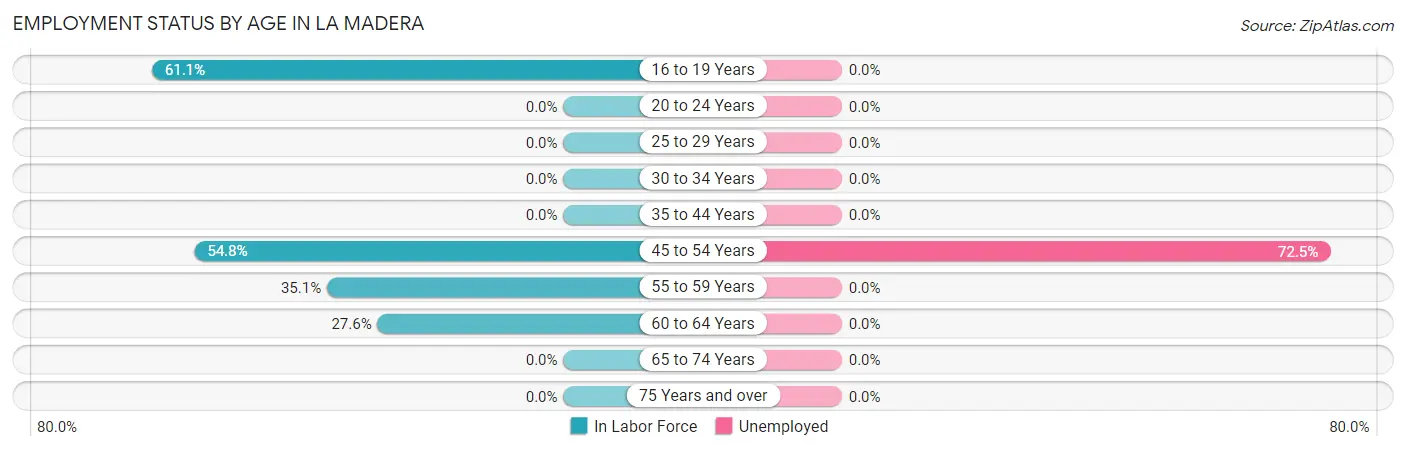
| Age Bracket | In Labor Force | Unemployed |
| 16 to 19 Years | 22 (61.1%) | 0 (0.0%) |
| 20 to 24 Years | 0 (0.0%) | 0 (0.0%) |
| 25 to 29 Years | 0 (0.0%) | 0 (0.0%) |
| 30 to 34 Years | 0 (0.0%) | 0 (0.0%) |
| 35 to 44 Years | 0 (0.0%) | 0 (0.0%) |
| 45 to 54 Years | 51 (54.8%) | 37 (72.5%) |
| 55 to 59 Years | 34 (35.1%) | 0 (0.0%) |
| 60 to 64 Years | 16 (27.6%) | 0 (0.0%) |
| 65 to 74 Years | 0 (0.0%) | 0 (0.0%) |
| 75 Years and over | 0 (0.0%) | 0 (0.0%) |
| Total | 123 (30.5%) | 37 (30.1%) |
Employment Status by Educational Attainment in La Madera
According to labor force statistics for La Madera, 39.0% of individuals (101) out of the total population between 25 and 64 years of age (259) are in the labor force, with 36.6% or 37 of them being unemployed. The group with the highest labor force participation rate are those with the educational attainment of college / associate degree, with 100.0% or 51 individuals in the labor force. Within the labor force, individuals with college / associate degree education have the highest percentage of unemployment, with 72.5% or 37 of them being unemployed.
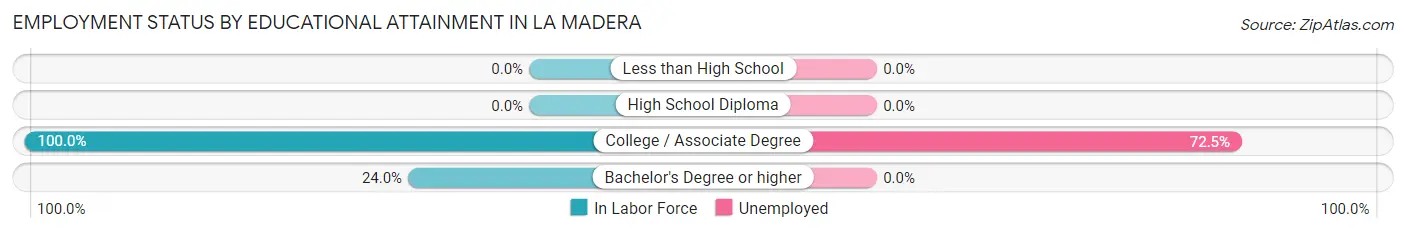
| Educational Attainment | In Labor Force | Unemployed |
| Less than High School | 0 (0.0%) | 0 (0.0%) |
| High School Diploma | 0 (0.0%) | 0 (0.0%) |
| College / Associate Degree | 51 (100.0%) | 37 (72.5%) |
| Bachelor's Degree or higher | 50 (24.0%) | 0 (0.0%) |
| Total | 101 (39.0%) | 95 (36.6%) |
Employment Occupations by Sex in La Madera
Management, Business, Science and Arts Occupations
The most common Management, Business, Science and Arts occupations in La Madera are Computers, Engineering & Science (34 | 39.5%), Architecture & Engineering (25 | 29.1%), Computers & Mathematics (9 | 10.5%), Management (8 | 9.3%), and Community & Social Service (8 | 9.3%).
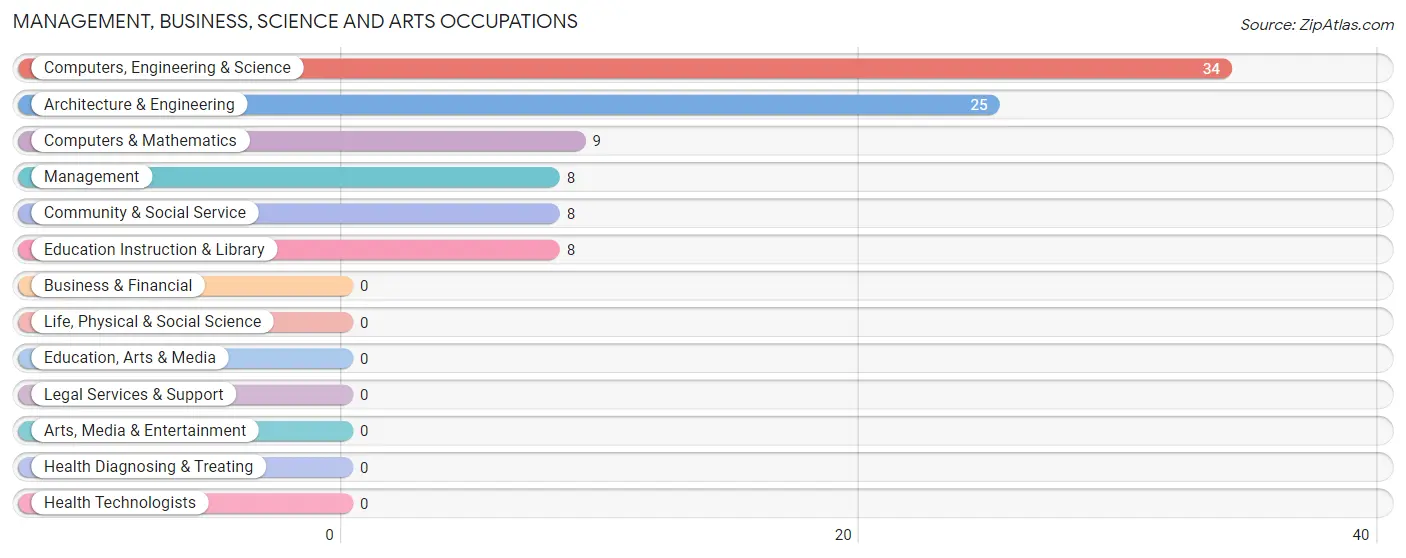
Management, Business, Science and Arts Occupations by Sex
Within the Management, Business, Science and Arts occupations in La Madera, the most male-oriented occupations are Computers, Engineering & Science (100.0%), Computers & Mathematics (100.0%), and Architecture & Engineering (100.0%), while the most female-oriented occupations are Management (100.0%), Community & Social Service (100.0%), and Education Instruction & Library (100.0%).
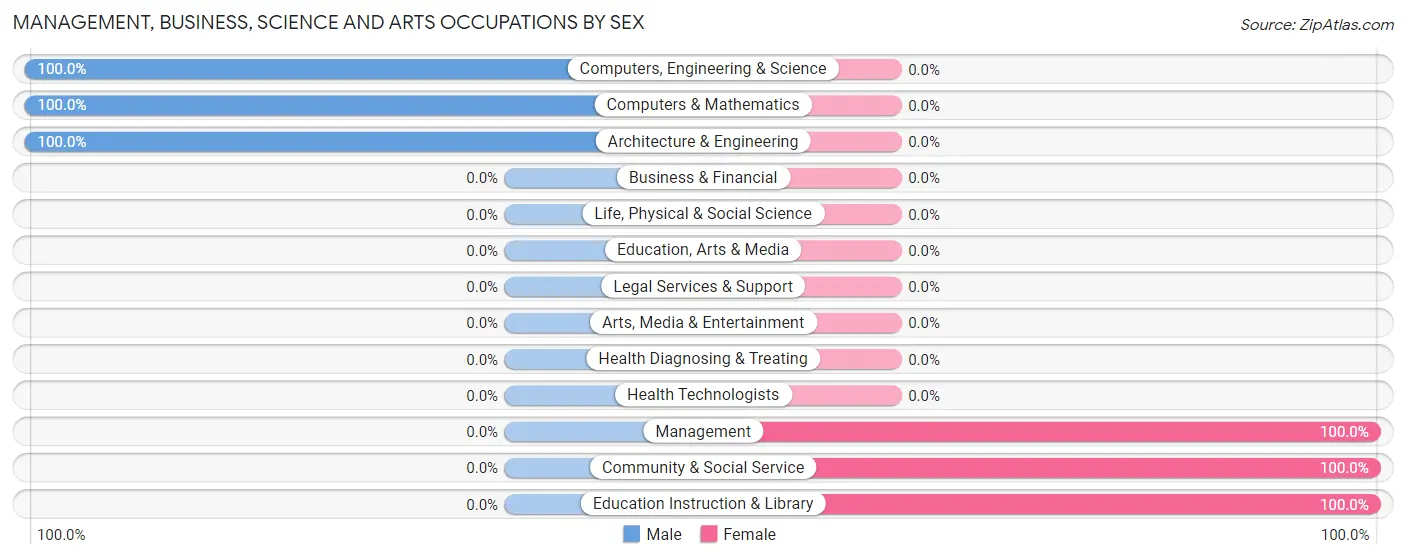
| Occupation | Male | Female |
| Management | 0 (0.0%) | 8 (100.0%) |
| Business & Financial | 0 (0.0%) | 0 (0.0%) |
| Computers, Engineering & Science | 34 (100.0%) | 0 (0.0%) |
| Computers & Mathematics | 9 (100.0%) | 0 (0.0%) |
| Architecture & Engineering | 25 (100.0%) | 0 (0.0%) |
| Life, Physical & Social Science | 0 (0.0%) | 0 (0.0%) |
| Community & Social Service | 0 (0.0%) | 8 (100.0%) |
| Education, Arts & Media | 0 (0.0%) | 0 (0.0%) |
| Legal Services & Support | 0 (0.0%) | 0 (0.0%) |
| Education Instruction & Library | 0 (0.0%) | 8 (100.0%) |
| Arts, Media & Entertainment | 0 (0.0%) | 0 (0.0%) |
| Health Diagnosing & Treating | 0 (0.0%) | 0 (0.0%) |
| Health Technologists | 0 (0.0%) | 0 (0.0%) |
| Total (Category) | 34 (68.0%) | 16 (32.0%) |
| Total (Overall) | 34 (39.5%) | 52 (60.5%) |
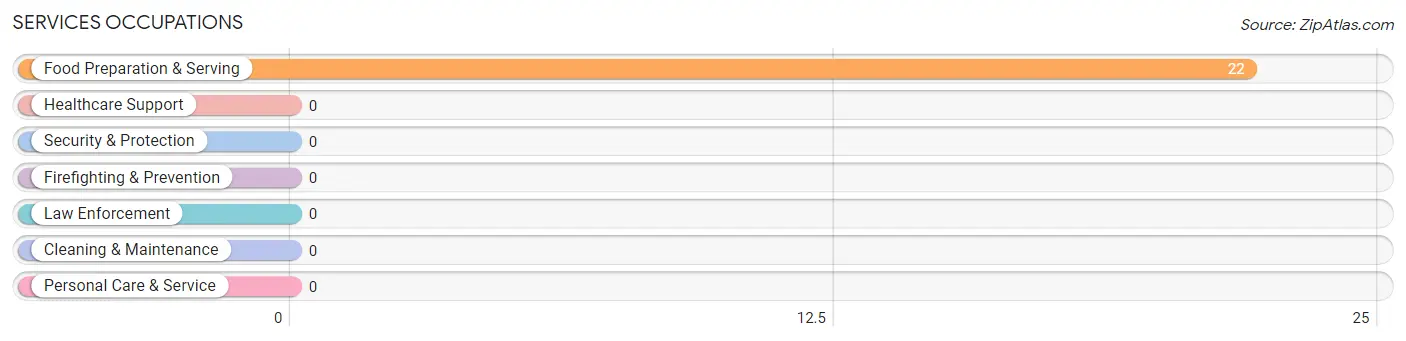
Services Occupations
The most common Services occupations in La Madera are , and Food Preparation & Serving (22 | 25.6%).
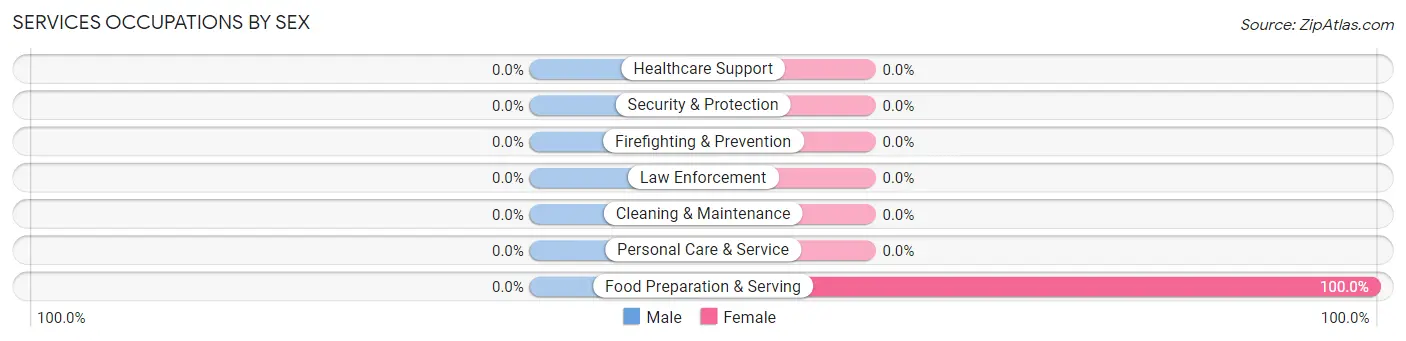
Services Occupations by Sex
| Occupation | Male | Female |
| Healthcare Support | 0 (0.0%) | 0 (0.0%) |
| Security & Protection | 0 (0.0%) | 0 (0.0%) |
| Firefighting & Prevention | 0 (0.0%) | 0 (0.0%) |
| Law Enforcement | 0 (0.0%) | 0 (0.0%) |
| Food Preparation & Serving | 0 (0.0%) | 22 (100.0%) |
| Cleaning & Maintenance | 0 (0.0%) | 0 (0.0%) |
| Personal Care & Service | 0 (0.0%) | 0 (0.0%) |
| Total (Category) | 0 (0.0%) | 22 (100.0%) |
| Total (Overall) | 34 (39.5%) | 52 (60.5%) |
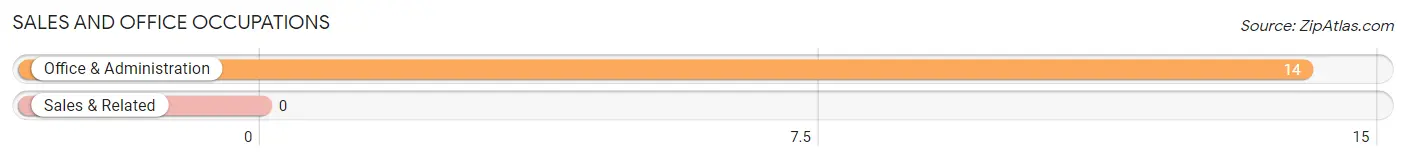
Sales and Office Occupations
The most common Sales and Office occupations in La Madera are , and Office & Administration (14 | 16.3%).
Sales and Office Occupations by Sex
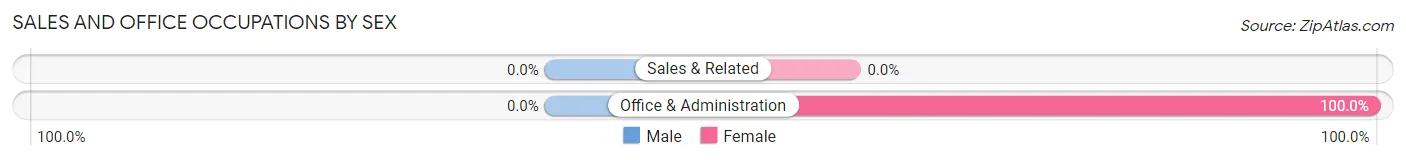
| Occupation | Male | Female |
| Sales & Related | 0 (0.0%) | 0 (0.0%) |
| Office & Administration | 0 (0.0%) | 14 (100.0%) |
| Total (Category) | 0 (0.0%) | 14 (100.0%) |
| Total (Overall) | 34 (39.5%) | 52 (60.5%) |
Natural Resources, Construction and Maintenance Occupations
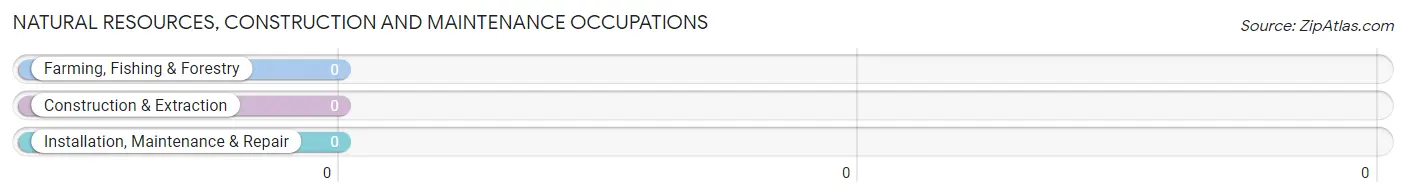
Natural Resources, Construction and Maintenance Occupations by Sex

| Occupation | Male | Female |
| Farming, Fishing & Forestry | 0 (0.0%) | 0 (0.0%) |
| Construction & Extraction | 0 (0.0%) | 0 (0.0%) |
| Installation, Maintenance & Repair | 0 (0.0%) | 0 (0.0%) |
| Total (Category) | 0 (0.0%) | 0 (0.0%) |
| Total (Overall) | 34 (39.5%) | 52 (60.5%) |
Production, Transportation and Moving Occupations
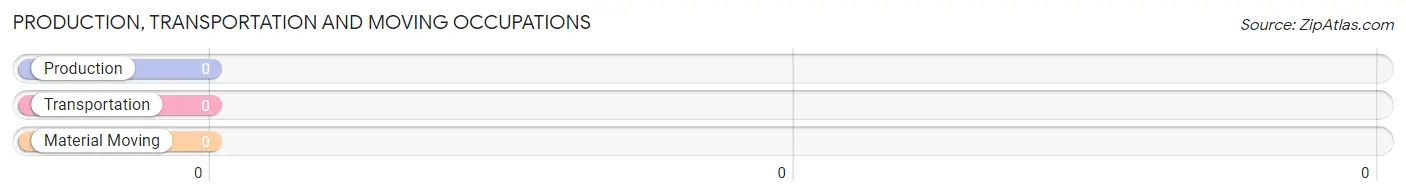
Production, Transportation and Moving Occupations by Sex
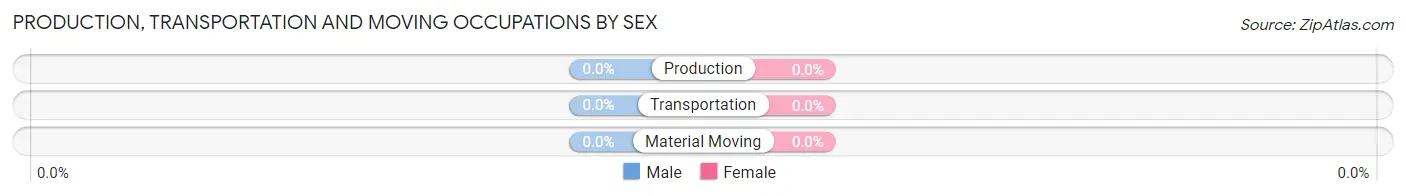
| Occupation | Male | Female |
| Production | 0 (0.0%) | 0 (0.0%) |
| Transportation | 0 (0.0%) | 0 (0.0%) |
| Material Moving | 0 (0.0%) | 0 (0.0%) |
| Total (Category) | 0 (0.0%) | 0 (0.0%) |
| Total (Overall) | 34 (39.5%) | 52 (60.5%) |
Employment Industries by Sex in La Madera
Employment Industries in La Madera
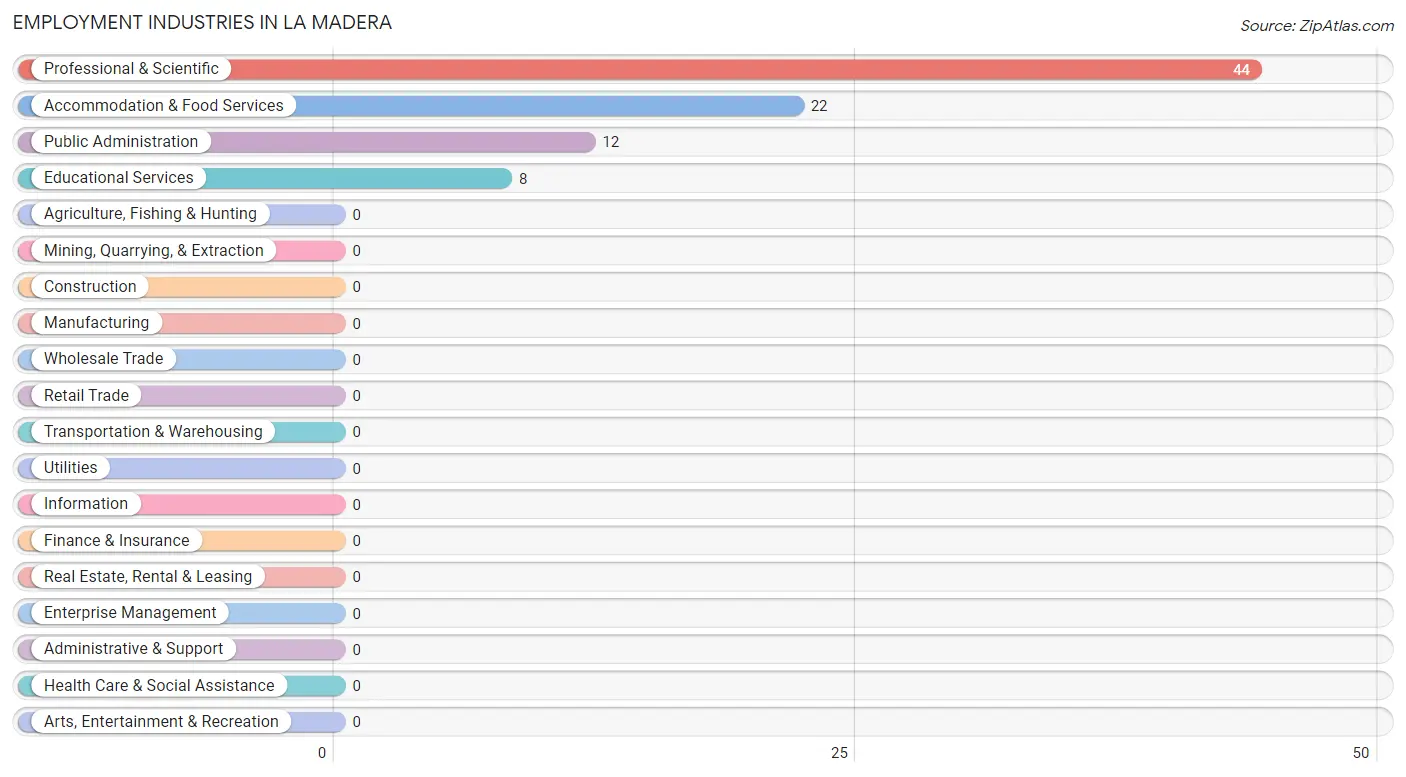
The major employment industries in La Madera include Professional & Scientific (44 | 51.2%), Accommodation & Food Services (22 | 25.6%), Public Administration (12 | 14.0%), and Educational Services (8 | 9.3%).
Employment Industries by Sex in La Madera
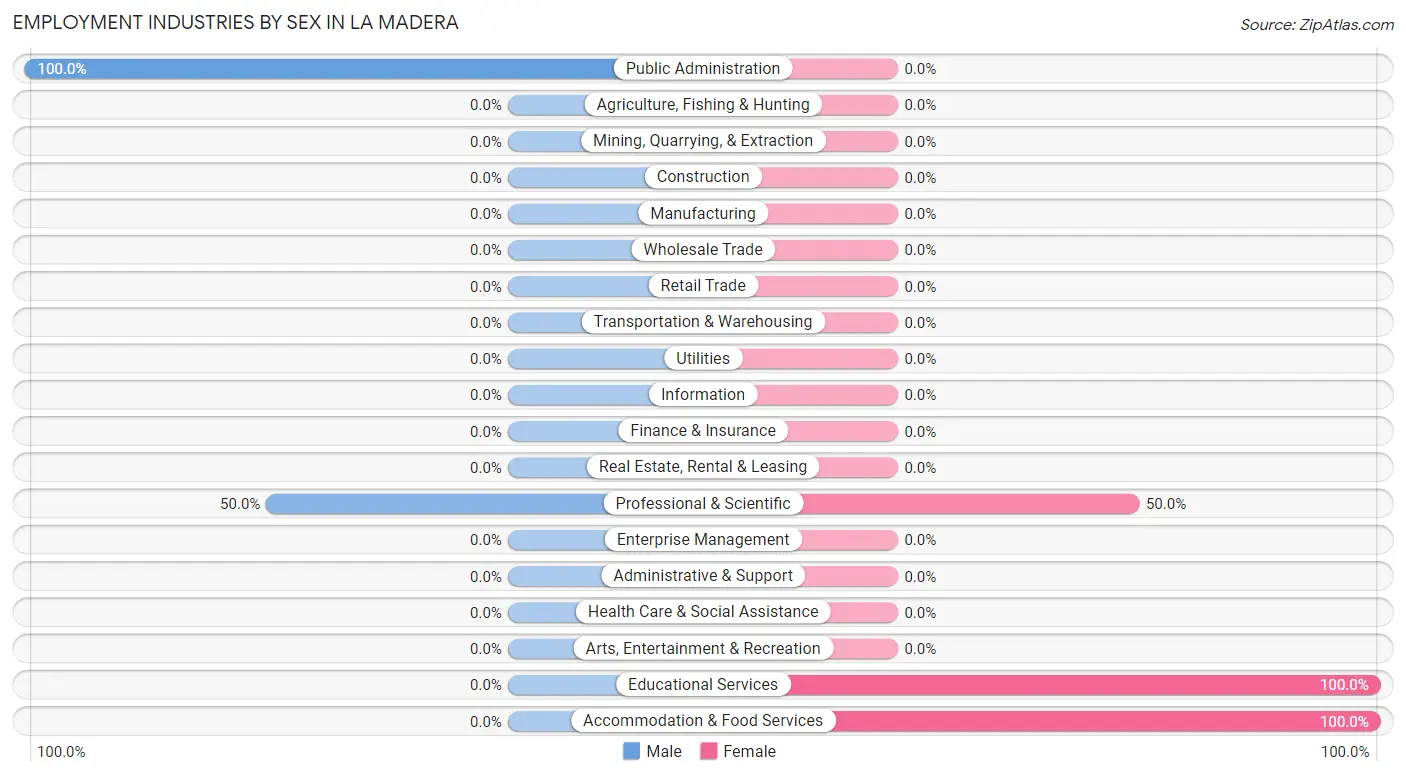
The La Madera industries that see more men than women are Public Administration (100.0%), and Professional & Scientific (50.0%), whereas the industries that tend to have a higher number of women are Educational Services (100.0%), Accommodation & Food Services (100.0%), and Professional & Scientific (50.0%).
| Industry | Male | Female |
| Agriculture, Fishing & Hunting | 0 (0.0%) | 0 (0.0%) |
| Mining, Quarrying, & Extraction | 0 (0.0%) | 0 (0.0%) |
| Construction | 0 (0.0%) | 0 (0.0%) |
| Manufacturing | 0 (0.0%) | 0 (0.0%) |
| Wholesale Trade | 0 (0.0%) | 0 (0.0%) |
| Retail Trade | 0 (0.0%) | 0 (0.0%) |
| Transportation & Warehousing | 0 (0.0%) | 0 (0.0%) |
| Utilities | 0 (0.0%) | 0 (0.0%) |
| Information | 0 (0.0%) | 0 (0.0%) |
| Finance & Insurance | 0 (0.0%) | 0 (0.0%) |
| Real Estate, Rental & Leasing | 0 (0.0%) | 0 (0.0%) |
| Professional & Scientific | 22 (50.0%) | 22 (50.0%) |
| Enterprise Management | 0 (0.0%) | 0 (0.0%) |
| Administrative & Support | 0 (0.0%) | 0 (0.0%) |
| Educational Services | 0 (0.0%) | 8 (100.0%) |
| Health Care & Social Assistance | 0 (0.0%) | 0 (0.0%) |
| Arts, Entertainment & Recreation | 0 (0.0%) | 0 (0.0%) |
| Accommodation & Food Services | 0 (0.0%) | 22 (100.0%) |
| Public Administration | 12 (100.0%) | 0 (0.0%) |
| Total | 34 (39.5%) | 52 (60.5%) |
Education in La Madera
School Enrollment in La Madera
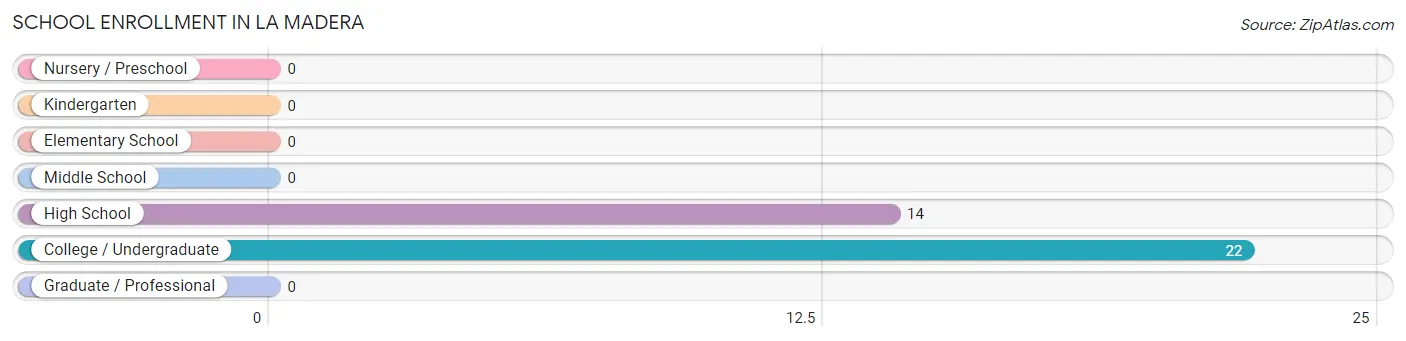
The most common levels of schooling among the 36 students in La Madera are college / undergraduate (22 | 61.1%), and high school (14 | 38.9%).
| School Level | # Students | % Students |
| Nursery / Preschool | 0 | 0.0% |
| Kindergarten | 0 | 0.0% |
| Elementary School | 0 | 0.0% |
| Middle School | 0 | 0.0% |
| High School | 14 | 38.9% |
| College / Undergraduate | 22 | 61.1% |
| Graduate / Professional | 0 | 0.0% |
| Total | 36 | 100.0% |
School Enrollment by Age by Funding Source in La Madera
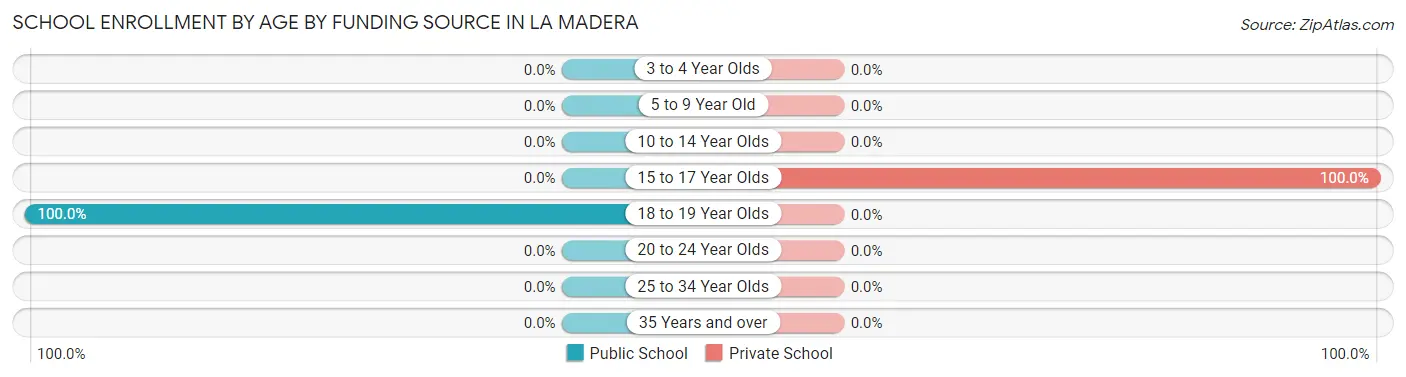
Out of a total of 36 students who are enrolled in schools in La Madera, 14 (38.9%) attend a private institution, while the remaining 22 (61.1%) are enrolled in public schools. The age group of 15 to 17 year olds has the highest likelihood of being enrolled in private schools, with 14 (100.0% in the age bracket) enrolled. Conversely, the age group of 18 to 19 year olds has the lowest likelihood of being enrolled in a private school, with 22 (100.0% in the age bracket) attending a public institution.
| Age Bracket | Public School | Private School |
| 3 to 4 Year Olds | 0 (0.0%) | 0 (0.0%) |
| 5 to 9 Year Old | 0 (0.0%) | 0 (0.0%) |
| 10 to 14 Year Olds | 0 (0.0%) | 0 (0.0%) |
| 15 to 17 Year Olds | 0 (0.0%) | 14 (100.0%) |
| 18 to 19 Year Olds | 22 (100.0%) | 0 (0.0%) |
| 20 to 24 Year Olds | 0 (0.0%) | 0 (0.0%) |
| 25 to 34 Year Olds | 0 (0.0%) | 0 (0.0%) |
| 35 Years and over | 0 (0.0%) | 0 (0.0%) |
| Total | 22 (61.1%) | 14 (38.9%) |
Educational Attainment by Field of Study in La Madera
Bio, nature & agricultural (116 | 34.6%), engineering (65 | 19.4%), science & technology (38 | 11.3%), business (23 | 6.9%), and arts & humanities (20 | 6.0%) are the most common fields of study among 335 individuals in La Madera who have obtained a bachelor's degree or higher.
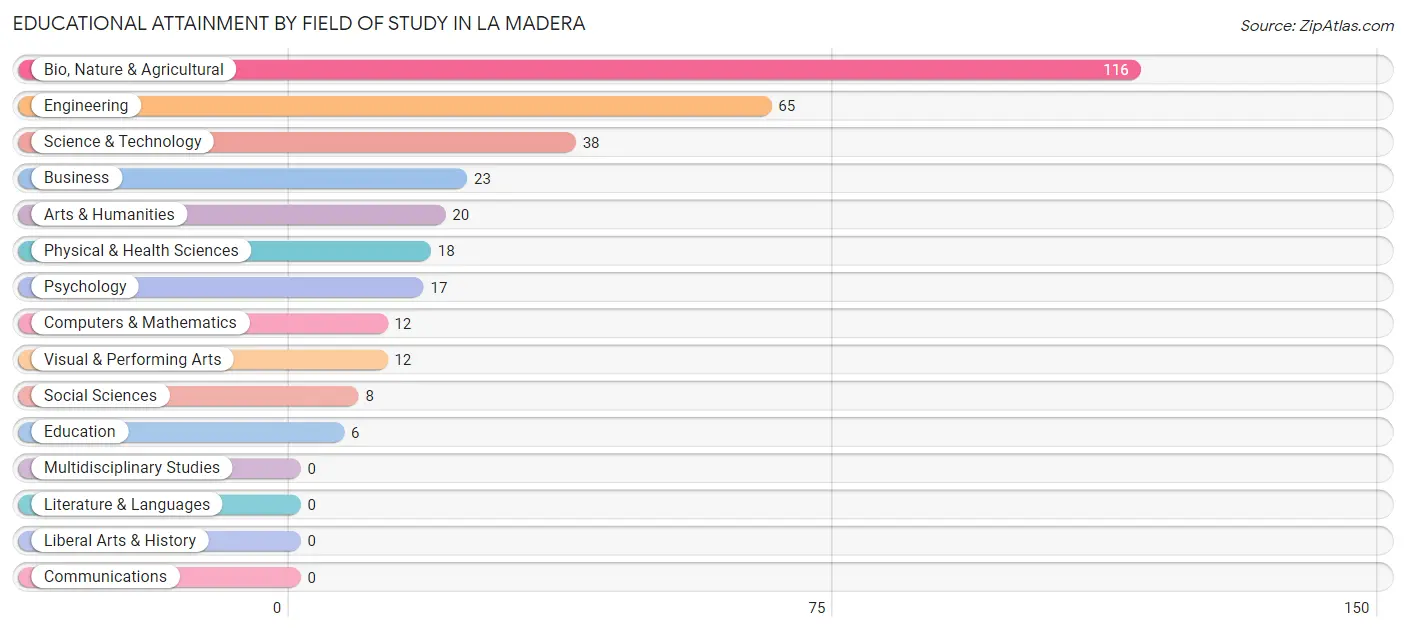
| Field of Study | # Graduates | % Graduates |
| Computers & Mathematics | 12 | 3.6% |
| Bio, Nature & Agricultural | 116 | 34.6% |
| Physical & Health Sciences | 18 | 5.4% |
| Psychology | 17 | 5.1% |
| Social Sciences | 8 | 2.4% |
| Engineering | 65 | 19.4% |
| Multidisciplinary Studies | 0 | 0.0% |
| Science & Technology | 38 | 11.3% |
| Business | 23 | 6.9% |
| Education | 6 | 1.8% |
| Literature & Languages | 0 | 0.0% |
| Liberal Arts & History | 0 | 0.0% |
| Visual & Performing Arts | 12 | 3.6% |
| Communications | 0 | 0.0% |
| Arts & Humanities | 20 | 6.0% |
| Total | 335 | 100.0% |
Transportation & Commute in La Madera
Vehicle Availability by Sex in La Madera
The most prevalent vehicle ownership categories in La Madera are males with 2 vehicles (13, accounting for 38.2%) and females with 2 vehicles (8, making up 25.0%).
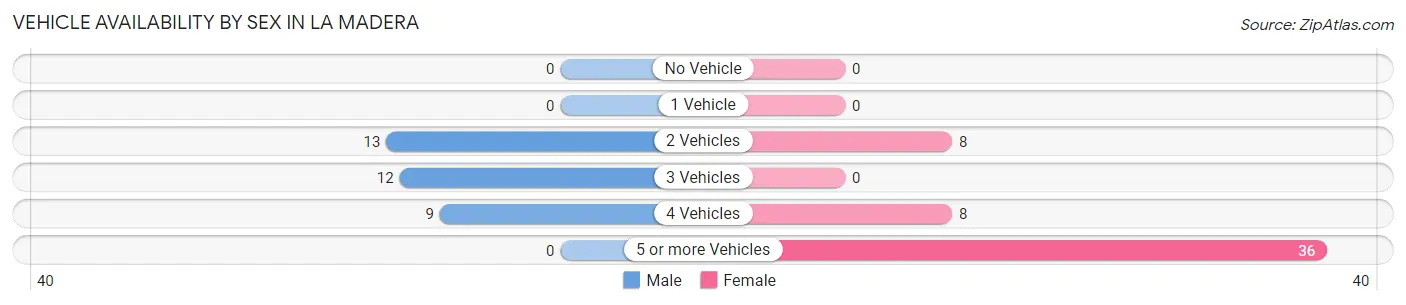
| Vehicles Available | Male | Female |
| No Vehicle | 0 (0.0%) | 0 (0.0%) |
| 1 Vehicle | 0 (0.0%) | 0 (0.0%) |
| 2 Vehicles | 13 (38.2%) | 8 (15.4%) |
| 3 Vehicles | 12 (35.3%) | 0 (0.0%) |
| 4 Vehicles | 9 (26.5%) | 8 (15.4%) |
| 5 or more Vehicles | 0 (0.0%) | 36 (69.2%) |
| Total | 34 (100.0%) | 52 (100.0%) |
Commute Time in La Madera
The most frequently occuring commute durations in La Madera are 45 to 59 minutes (44 commuters, 54.3%), 35 to 39 minutes (29 commuters, 35.8%), and 30 to 34 minutes (8 commuters, 9.9%).
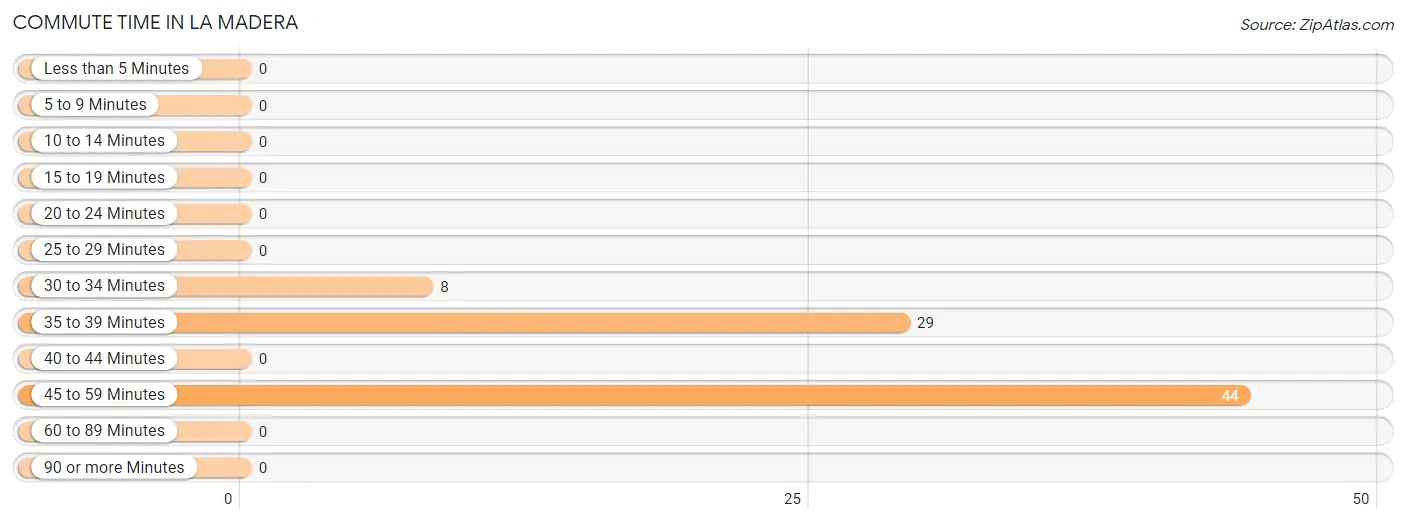
| Commute Time | # Commuters | % Commuters |
| Less than 5 Minutes | 0 | 0.0% |
| 5 to 9 Minutes | 0 | 0.0% |
| 10 to 14 Minutes | 0 | 0.0% |
| 15 to 19 Minutes | 0 | 0.0% |
| 20 to 24 Minutes | 0 | 0.0% |
| 25 to 29 Minutes | 0 | 0.0% |
| 30 to 34 Minutes | 8 | 9.9% |
| 35 to 39 Minutes | 29 | 35.8% |
| 40 to 44 Minutes | 0 | 0.0% |
| 45 to 59 Minutes | 44 | 54.3% |
| 60 to 89 Minutes | 0 | 0.0% |
| 90 or more Minutes | 0 | 0.0% |
Commute Time by Sex in La Madera
The most common commute times in La Madera are 35 to 39 minutes (21 commuters, 72.4%) for males and 45 to 59 minutes (44 commuters, 84.6%) for females.
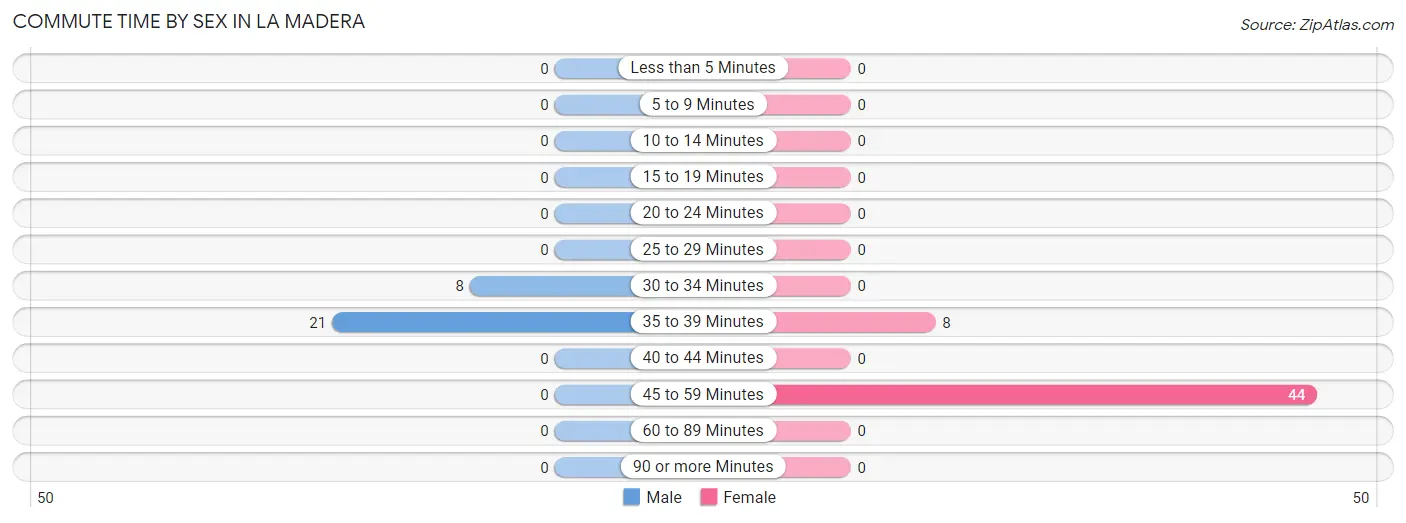
| Commute Time | Male | Female |
| Less than 5 Minutes | 0 (0.0%) | 0 (0.0%) |
| 5 to 9 Minutes | 0 (0.0%) | 0 (0.0%) |
| 10 to 14 Minutes | 0 (0.0%) | 0 (0.0%) |
| 15 to 19 Minutes | 0 (0.0%) | 0 (0.0%) |
| 20 to 24 Minutes | 0 (0.0%) | 0 (0.0%) |
| 25 to 29 Minutes | 0 (0.0%) | 0 (0.0%) |
| 30 to 34 Minutes | 8 (27.6%) | 0 (0.0%) |
| 35 to 39 Minutes | 21 (72.4%) | 8 (15.4%) |
| 40 to 44 Minutes | 0 (0.0%) | 0 (0.0%) |
| 45 to 59 Minutes | 0 (0.0%) | 44 (84.6%) |
| 60 to 89 Minutes | 0 (0.0%) | 0 (0.0%) |
| 90 or more Minutes | 0 (0.0%) | 0 (0.0%) |
Time of Departure to Work by Sex in La Madera
The most frequent times of departure to work in La Madera are 7:00 AM to 7:29 AM (29, 100.0%) for males and 10:00 AM to 10:59 AM (22, 42.3%) for females.
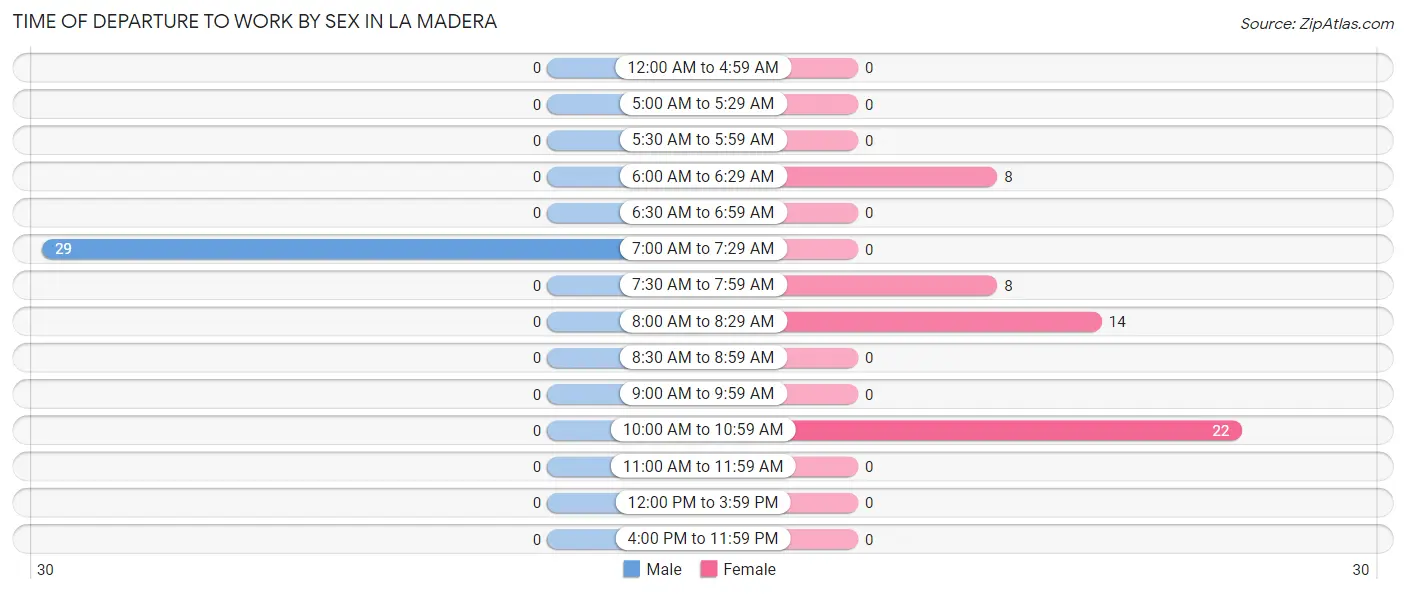
| Time of Departure | Male | Female |
| 12:00 AM to 4:59 AM | 0 (0.0%) | 0 (0.0%) |
| 5:00 AM to 5:29 AM | 0 (0.0%) | 0 (0.0%) |
| 5:30 AM to 5:59 AM | 0 (0.0%) | 0 (0.0%) |
| 6:00 AM to 6:29 AM | 0 (0.0%) | 8 (15.4%) |
| 6:30 AM to 6:59 AM | 0 (0.0%) | 0 (0.0%) |
| 7:00 AM to 7:29 AM | 29 (100.0%) | 0 (0.0%) |
| 7:30 AM to 7:59 AM | 0 (0.0%) | 8 (15.4%) |
| 8:00 AM to 8:29 AM | 0 (0.0%) | 14 (26.9%) |
| 8:30 AM to 8:59 AM | 0 (0.0%) | 0 (0.0%) |
| 9:00 AM to 9:59 AM | 0 (0.0%) | 0 (0.0%) |
| 10:00 AM to 10:59 AM | 0 (0.0%) | 22 (42.3%) |
| 11:00 AM to 11:59 AM | 0 (0.0%) | 0 (0.0%) |
| 12:00 PM to 3:59 PM | 0 (0.0%) | 0 (0.0%) |
| 4:00 PM to 11:59 PM | 0 (0.0%) | 0 (0.0%) |
| Total | 29 (100.0%) | 52 (100.0%) |
Housing Occupancy in La Madera
Occupancy by Ownership in La Madera
Of the total 195 dwellings in La Madera, owner-occupied units account for 195 (100.0%), while renter-occupied units make up 0 (0.0%).
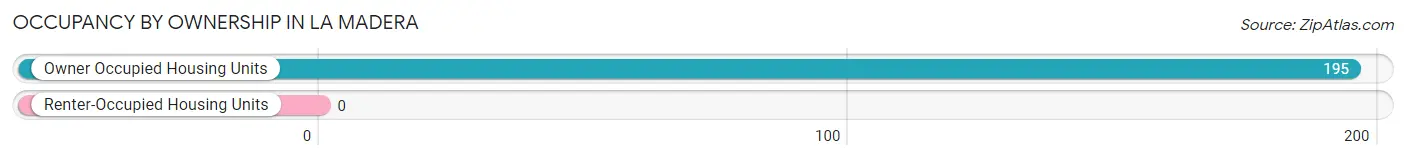
| Occupancy | # Housing Units | % Housing Units |
| Owner Occupied Housing Units | 195 | 100.0% |
| Renter-Occupied Housing Units | 0 | 0.0% |
| Total Occupied Housing Units | 195 | 100.0% |
Occupancy by Household Size in La Madera
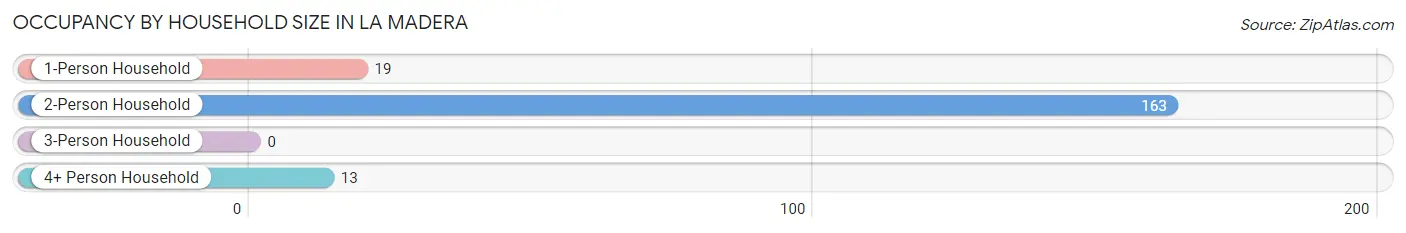
| Household Size | # Housing Units | % Housing Units |
| 1-Person Household | 19 | 9.7% |
| 2-Person Household | 163 | 83.6% |
| 3-Person Household | 0 | 0.0% |
| 4+ Person Household | 13 | 6.7% |
| Total Housing Units | 195 | 100.0% |
Occupancy by Ownership by Household Size in La Madera
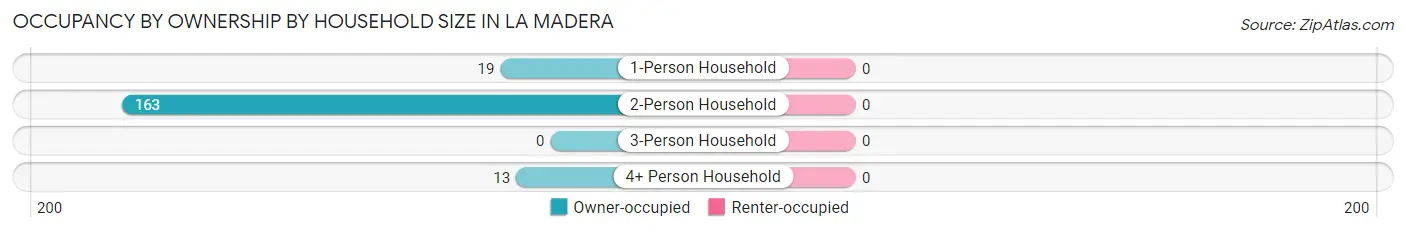
| Household Size | Owner-occupied | Renter-occupied |
| 1-Person Household | 19 (100.0%) | 0 (0.0%) |
| 2-Person Household | 163 (100.0%) | 0 (0.0%) |
| 3-Person Household | 0 (0.0%) | 0 (0.0%) |
| 4+ Person Household | 13 (100.0%) | 0 (0.0%) |
| Total Housing Units | 195 (100.0%) | 0 (0.0%) |
Occupancy by Educational Attainment in La Madera
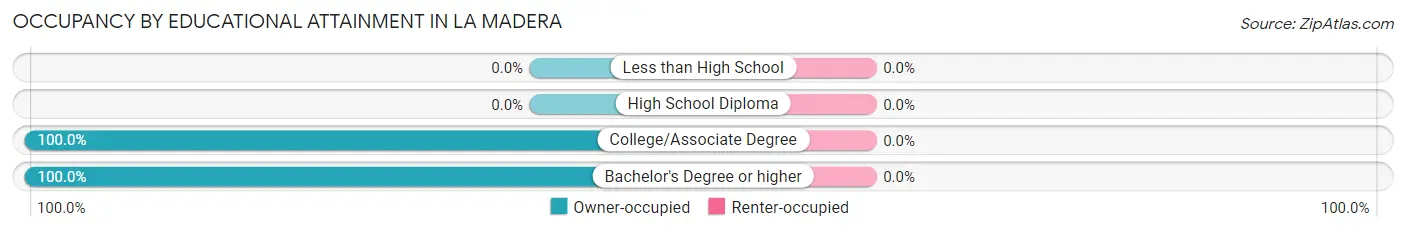
| Household Size | Owner-occupied | Renter-occupied |
| Less than High School | 0 (0.0%) | 0 (0.0%) |
| High School Diploma | 0 (0.0%) | 0 (0.0%) |
| College/Associate Degree | 29 (100.0%) | 0 (0.0%) |
| Bachelor's Degree or higher | 166 (100.0%) | 0 (0.0%) |
Occupancy by Age of Householder in La Madera
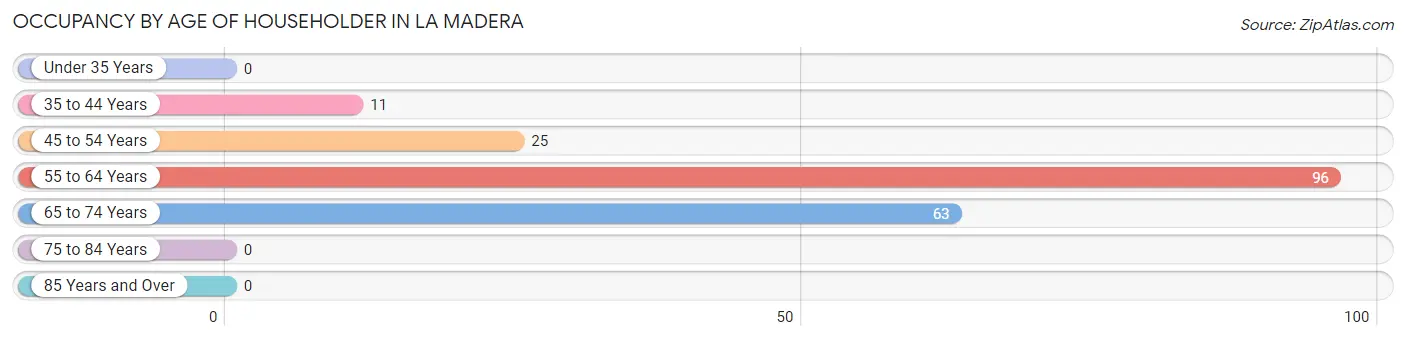
| Age Bracket | # Households | % Households |
| Under 35 Years | 0 | 0.0% |
| 35 to 44 Years | 11 | 5.6% |
| 45 to 54 Years | 25 | 12.8% |
| 55 to 64 Years | 96 | 49.2% |
| 65 to 74 Years | 63 | 32.3% |
| 75 to 84 Years | 0 | 0.0% |
| 85 Years and Over | 0 | 0.0% |
| Total | 195 | 100.0% |
Housing Finances in La Madera
Median Income by Occupancy in La Madera
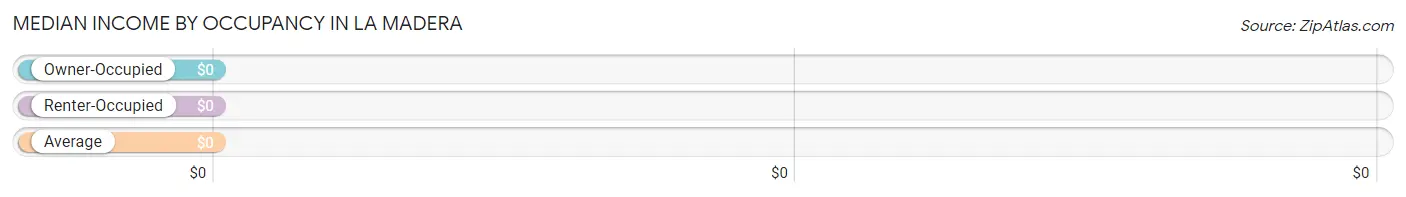
| Occupancy Type | # Households | Median Income |
| Owner-Occupied | 195 (100.0%) | $0 |
| Renter-Occupied | 0 (0.0%) | $0 |
| Average | 195 (100.0%) | $0 |
Occupancy by Householder Income Bracket in La Madera
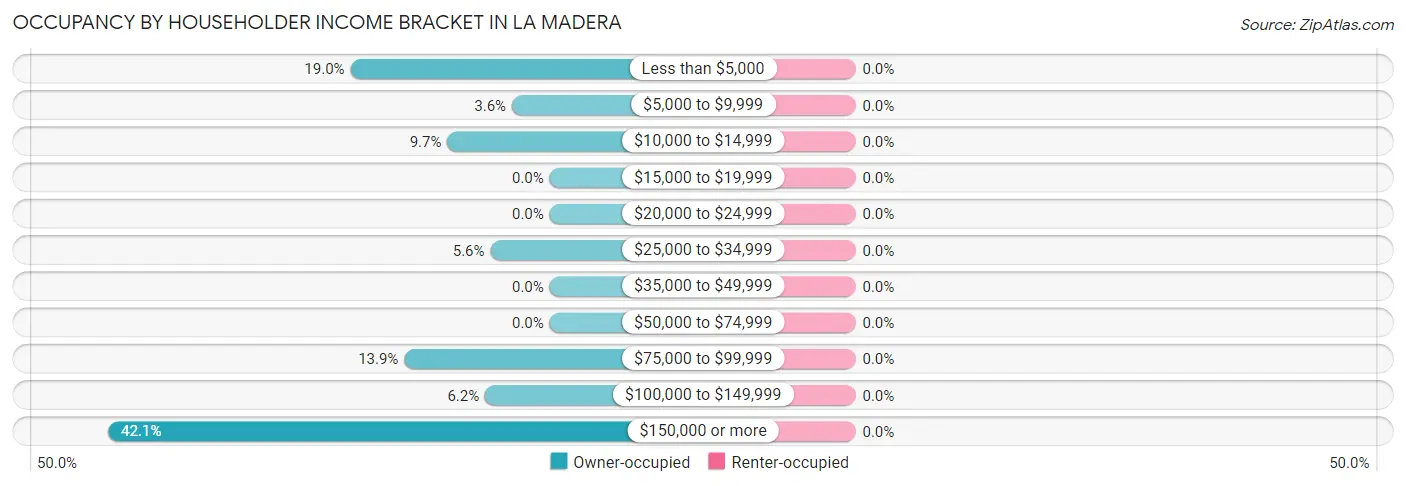
| Income Bracket | Owner-occupied | Renter-occupied |
| Less than $5,000 | 37 (19.0%) | 0 (0.0%) |
| $5,000 to $9,999 | 7 (3.6%) | 0 (0.0%) |
| $10,000 to $14,999 | 19 (9.7%) | 0 (0.0%) |
| $15,000 to $19,999 | 0 (0.0%) | 0 (0.0%) |
| $20,000 to $24,999 | 0 (0.0%) | 0 (0.0%) |
| $25,000 to $34,999 | 11 (5.6%) | 0 (0.0%) |
| $35,000 to $49,999 | 0 (0.0%) | 0 (0.0%) |
| $50,000 to $74,999 | 0 (0.0%) | 0 (0.0%) |
| $75,000 to $99,999 | 27 (13.9%) | 0 (0.0%) |
| $100,000 to $149,999 | 12 (6.1%) | 0 (0.0%) |
| $150,000 or more | 82 (42.0%) | 0 (0.0%) |
| Total | 195 (100.0%) | 0 (0.0%) |
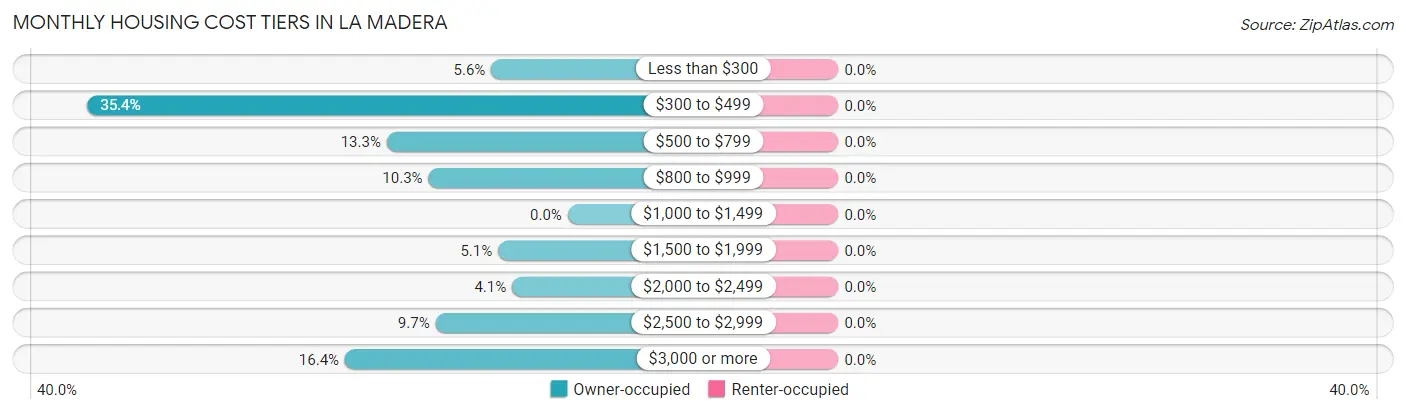
Monthly Housing Cost Tiers in La Madera
| Monthly Cost | Owner-occupied | Renter-occupied |
| Less than $300 | 11 (5.6%) | 0 (0.0%) |
| $300 to $499 | 69 (35.4%) | 0 (0.0%) |
| $500 to $799 | 26 (13.3%) | 0 (0.0%) |
| $800 to $999 | 20 (10.3%) | 0 (0.0%) |
| $1,000 to $1,499 | 0 (0.0%) | 0 (0.0%) |
| $1,500 to $1,999 | 10 (5.1%) | 0 (0.0%) |
| $2,000 to $2,499 | 8 (4.1%) | 0 (0.0%) |
| $2,500 to $2,999 | 19 (9.7%) | 0 (0.0%) |
| $3,000 or more | 32 (16.4%) | 0 (0.0%) |
| Total | 195 (100.0%) | 0 (0.0%) |
Physical Housing Characteristics in La Madera
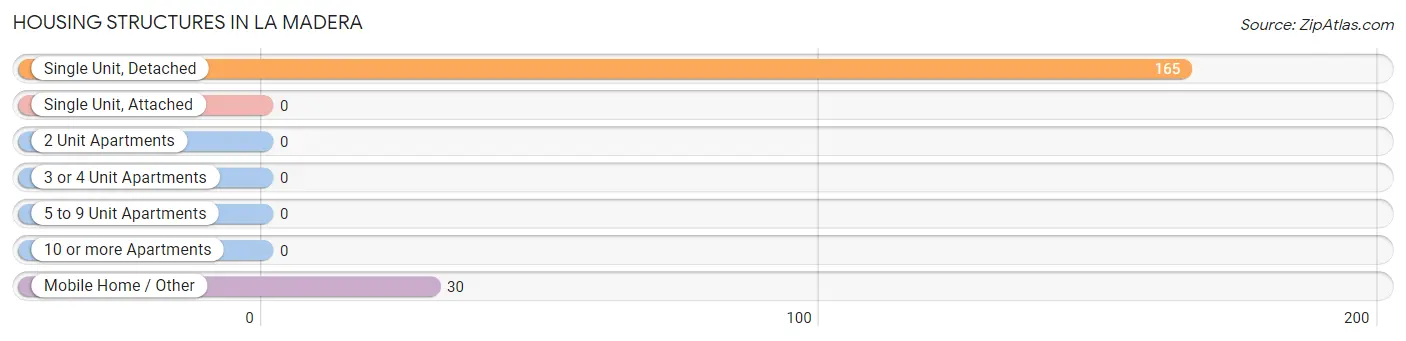
Housing Structures in La Madera
| Structure Type | # Housing Units | % Housing Units |
| Single Unit, Detached | 165 | 84.6% |
| Single Unit, Attached | 0 | 0.0% |
| 2 Unit Apartments | 0 | 0.0% |
| 3 or 4 Unit Apartments | 0 | 0.0% |
| 5 to 9 Unit Apartments | 0 | 0.0% |
| 10 or more Apartments | 0 | 0.0% |
| Mobile Home / Other | 30 | 15.4% |
| Total | 195 | 100.0% |
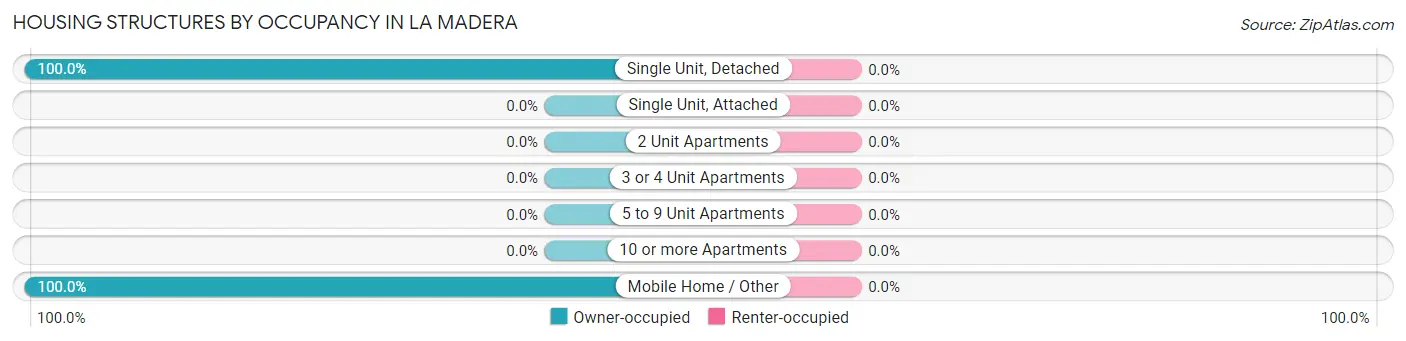
Housing Structures by Occupancy in La Madera
| Structure Type | Owner-occupied | Renter-occupied |
| Single Unit, Detached | 165 (100.0%) | 0 (0.0%) |
| Single Unit, Attached | 0 (0.0%) | 0 (0.0%) |
| 2 Unit Apartments | 0 (0.0%) | 0 (0.0%) |
| 3 or 4 Unit Apartments | 0 (0.0%) | 0 (0.0%) |
| 5 to 9 Unit Apartments | 0 (0.0%) | 0 (0.0%) |
| 10 or more Apartments | 0 (0.0%) | 0 (0.0%) |
| Mobile Home / Other | 30 (100.0%) | 0 (0.0%) |
| Total | 195 (100.0%) | 0 (0.0%) |
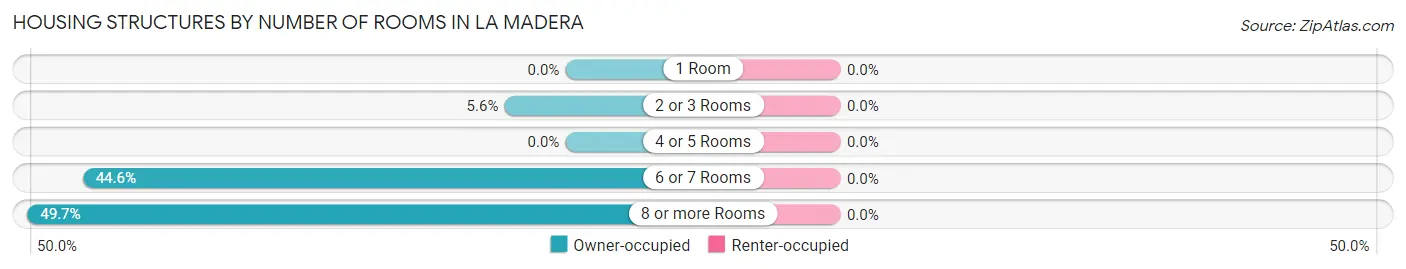
Housing Structures by Number of Rooms in La Madera
| Number of Rooms | Owner-occupied | Renter-occupied |
| 1 Room | 0 (0.0%) | 0 (0.0%) |
| 2 or 3 Rooms | 11 (5.6%) | 0 (0.0%) |
| 4 or 5 Rooms | 0 (0.0%) | 0 (0.0%) |
| 6 or 7 Rooms | 87 (44.6%) | 0 (0.0%) |
| 8 or more Rooms | 97 (49.7%) | 0 (0.0%) |
| Total | 195 (100.0%) | 0 (0.0%) |
Housing Structure by Heating Type in La Madera
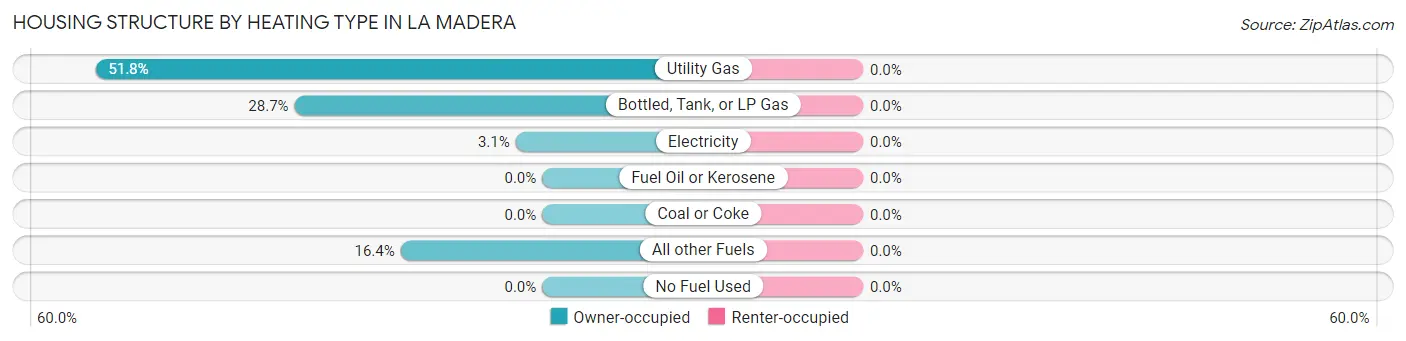
| Heating Type | Owner-occupied | Renter-occupied |
| Utility Gas | 101 (51.8%) | 0 (0.0%) |
| Bottled, Tank, or LP Gas | 56 (28.7%) | 0 (0.0%) |
| Electricity | 6 (3.1%) | 0 (0.0%) |
| Fuel Oil or Kerosene | 0 (0.0%) | 0 (0.0%) |
| Coal or Coke | 0 (0.0%) | 0 (0.0%) |
| All other Fuels | 32 (16.4%) | 0 (0.0%) |
| No Fuel Used | 0 (0.0%) | 0 (0.0%) |
| Total | 195 (100.0%) | 0 (0.0%) |
Household Vehicle Usage in La Madera
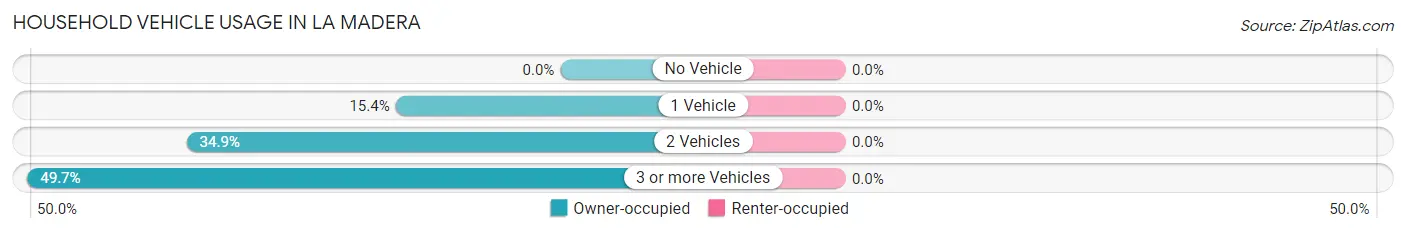
| Vehicles per Household | Owner-occupied | Renter-occupied |
| No Vehicle | 0 (0.0%) | 0 (0.0%) |
| 1 Vehicle | 30 (15.4%) | 0 (0.0%) |
| 2 Vehicles | 68 (34.9%) | 0 (0.0%) |
| 3 or more Vehicles | 97 (49.7%) | 0 (0.0%) |
| Total | 195 (100.0%) | 0 (0.0%) |
Real Estate & Mortgages in La Madera
Real Estate and Mortgage Overview in La Madera
| Characteristic | Without Mortgage | With Mortgage |
| Housing Units | 126 | 69 |
| Median Property Value | $590,900 | $820,300 |
| Median Household Income | - | - |
| Monthly Housing Costs | $466 | $32 |
| Real Estate Taxes | $2,660 | $0 |
Property Value by Mortgage Status in La Madera
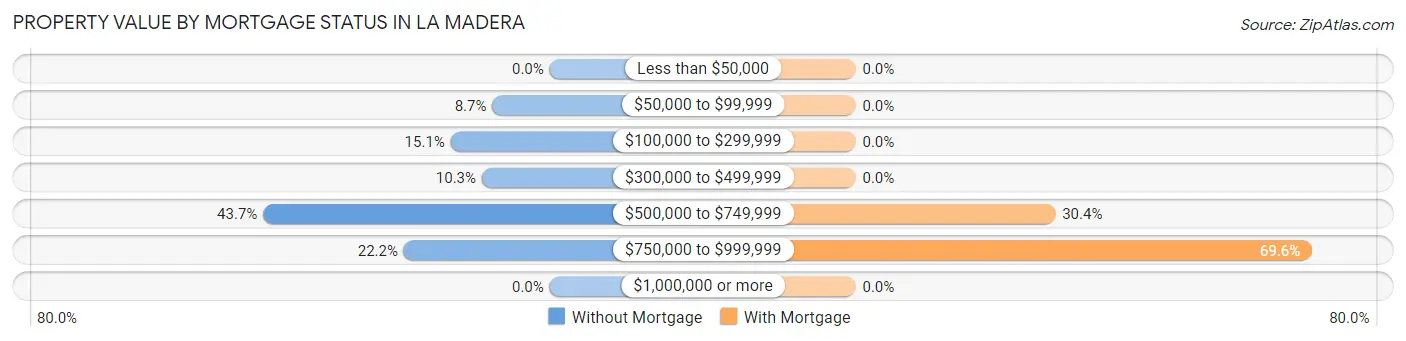
| Property Value | Without Mortgage | With Mortgage |
| Less than $50,000 | 0 (0.0%) | 0 (0.0%) |
| $50,000 to $99,999 | 11 (8.7%) | 0 (0.0%) |
| $100,000 to $299,999 | 19 (15.1%) | 0 (0.0%) |
| $300,000 to $499,999 | 13 (10.3%) | 0 (0.0%) |
| $500,000 to $749,999 | 55 (43.6%) | 21 (30.4%) |
| $750,000 to $999,999 | 28 (22.2%) | 48 (69.6%) |
| $1,000,000 or more | 0 (0.0%) | 0 (0.0%) |
| Total | 126 (100.0%) | 69 (100.0%) |
Household Income by Mortgage Status in La Madera
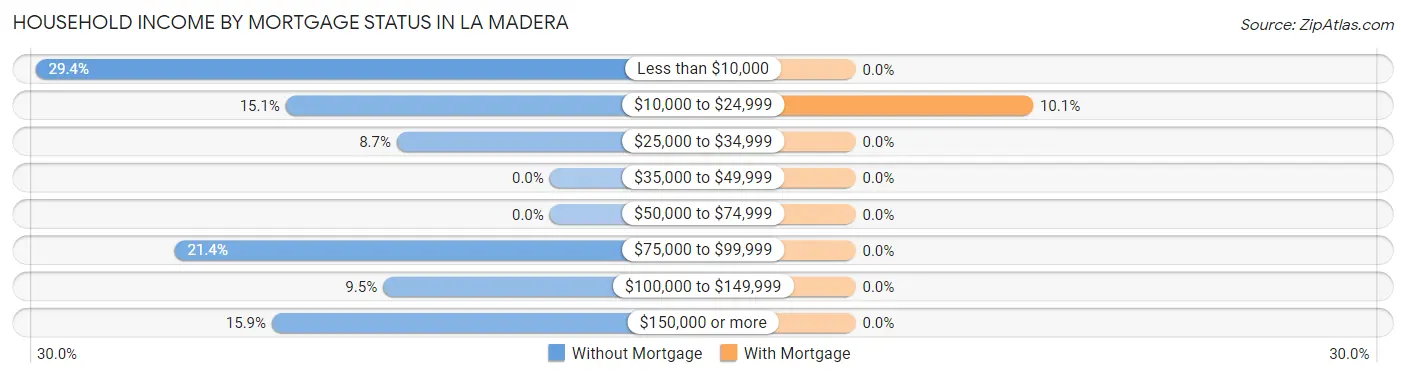
| Household Income | Without Mortgage | With Mortgage |
| Less than $10,000 | 37 (29.4%) | 0 (0.0%) |
| $10,000 to $24,999 | 19 (15.1%) | 7 (10.1%) |
| $25,000 to $34,999 | 11 (8.7%) | 0 (0.0%) |
| $35,000 to $49,999 | 0 (0.0%) | 0 (0.0%) |
| $50,000 to $74,999 | 0 (0.0%) | 0 (0.0%) |
| $75,000 to $99,999 | 27 (21.4%) | 0 (0.0%) |
| $100,000 to $149,999 | 12 (9.5%) | 0 (0.0%) |
| $150,000 or more | 20 (15.9%) | 0 (0.0%) |
| Total | 126 (100.0%) | 69 (100.0%) |
Property Value to Household Income Ratio in La Madera
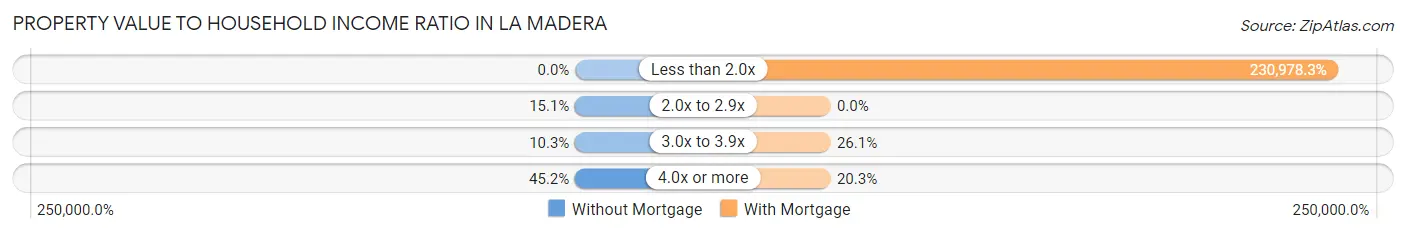
| Value-to-Income Ratio | Without Mortgage | With Mortgage |
| Less than 2.0x | 0 (0.0%) | 159,375 (230,978.3%) |
| 2.0x to 2.9x | 19 (15.1%) | 0 (0.0%) |
| 3.0x to 3.9x | 13 (10.3%) | 18 (26.1%) |
| 4.0x or more | 57 (45.2%) | 14 (20.3%) |
| Total | 126 (100.0%) | 69 (100.0%) |
Real Estate Taxes by Mortgage Status in La Madera
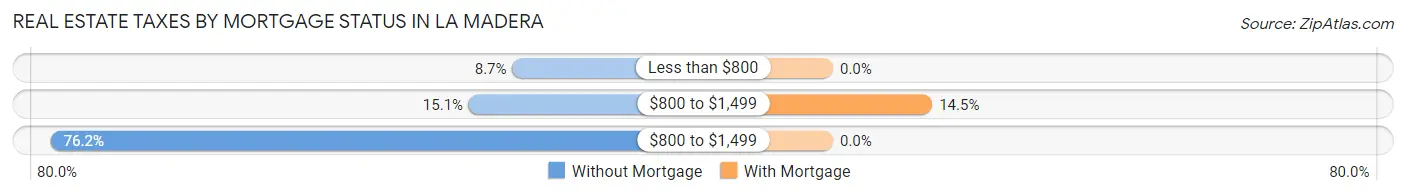
| Property Taxes | Without Mortgage | With Mortgage |
| Less than $800 | 11 (8.7%) | 0 (0.0%) |
| $800 to $1,499 | 19 (15.1%) | 10 (14.5%) |
| $800 to $1,499 | 96 (76.2%) | 0 (0.0%) |
| Total | 126 (100.0%) | 69 (100.0%) |
Health & Disability in La Madera
Health Insurance Coverage by Age in La Madera
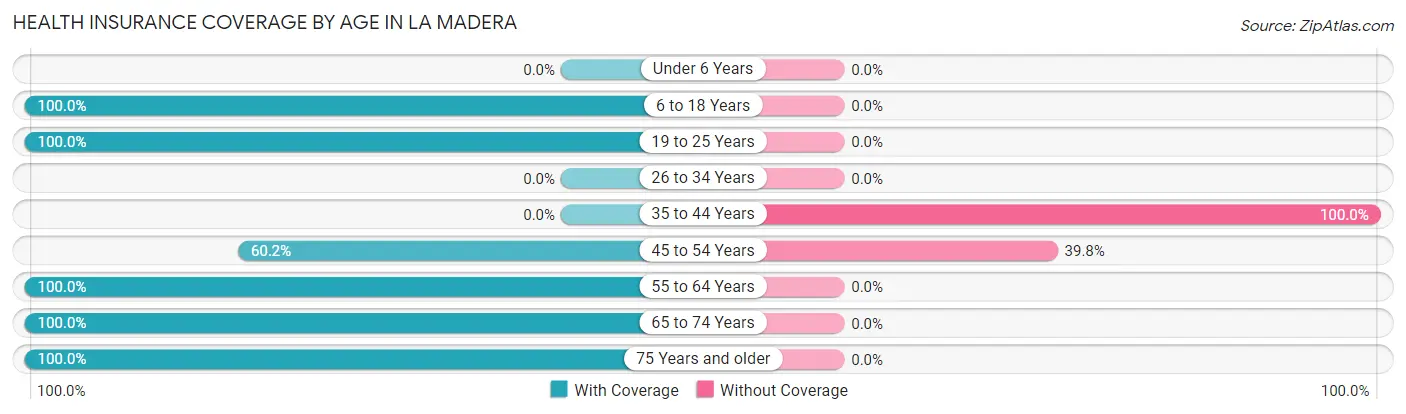
| Age Bracket | With Coverage | Without Coverage |
| Under 6 Years | 0 (0.0%) | 0 (0.0%) |
| 6 to 18 Years | 14 (100.0%) | 0 (0.0%) |
| 19 to 25 Years | 22 (100.0%) | 0 (0.0%) |
| 26 to 34 Years | 0 (0.0%) | 0 (0.0%) |
| 35 to 44 Years | 0 (0.0%) | 11 (100.0%) |
| 45 to 54 Years | 56 (60.2%) | 37 (39.8%) |
| 55 to 64 Years | 155 (100.0%) | 0 (0.0%) |
| 65 to 74 Years | 76 (100.0%) | 0 (0.0%) |
| 75 Years and older | 32 (100.0%) | 0 (0.0%) |
| Total | 355 (88.1%) | 48 (11.9%) |
Health Insurance Coverage by Citizenship Status in La Madera
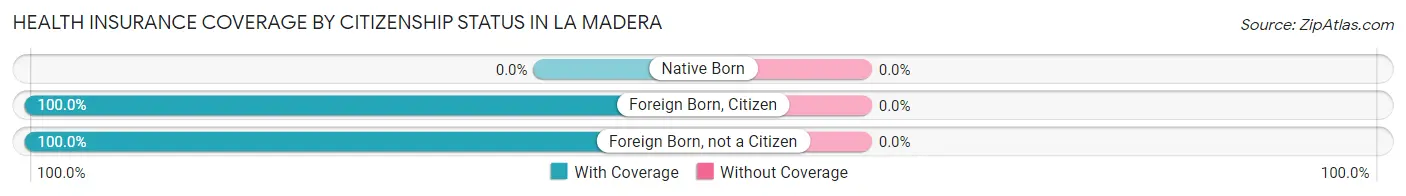
| Citizenship Status | With Coverage | Without Coverage |
| Native Born | 0 (0.0%) | 0 (0.0%) |
| Foreign Born, Citizen | 14 (100.0%) | 0 (0.0%) |
| Foreign Born, not a Citizen | 22 (100.0%) | 0 (0.0%) |
Health Insurance Coverage by Household Income in La Madera
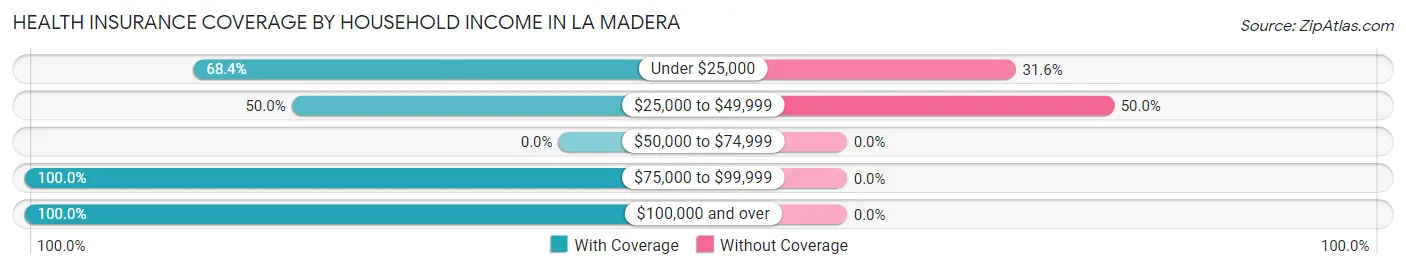
| Household Income | With Coverage | Without Coverage |
| Under $25,000 | 80 (68.4%) | 37 (31.6%) |
| $25,000 to $49,999 | 11 (50.0%) | 11 (50.0%) |
| $50,000 to $74,999 | 0 (0.0%) | 0 (0.0%) |
| $75,000 to $99,999 | 93 (100.0%) | 0 (0.0%) |
| $100,000 and over | 171 (100.0%) | 0 (0.0%) |
Public vs Private Health Insurance Coverage by Age in La Madera
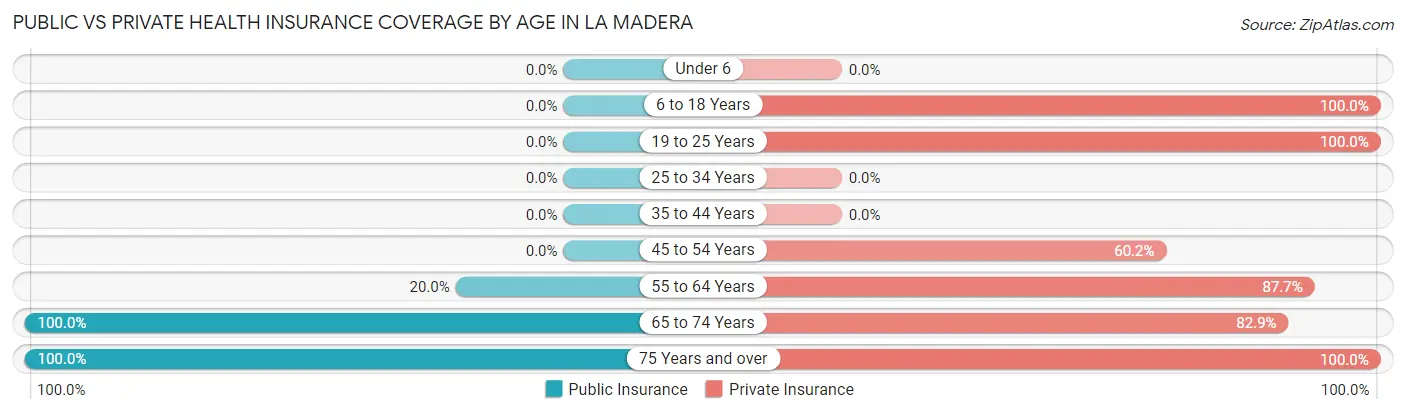
| Age Bracket | Public Insurance | Private Insurance |
| Under 6 | 0 (0.0%) | 0 (0.0%) |
| 6 to 18 Years | 0 (0.0%) | 14 (100.0%) |
| 19 to 25 Years | 0 (0.0%) | 22 (100.0%) |
| 25 to 34 Years | 0 (0.0%) | 0 (0.0%) |
| 35 to 44 Years | 0 (0.0%) | 0 (0.0%) |
| 45 to 54 Years | 0 (0.0%) | 56 (60.2%) |
| 55 to 64 Years | 31 (20.0%) | 136 (87.7%) |
| 65 to 74 Years | 76 (100.0%) | 63 (82.9%) |
| 75 Years and over | 32 (100.0%) | 32 (100.0%) |
| Total | 139 (34.5%) | 323 (80.1%) |
Disability Status by Sex by Age in La Madera

| Age Bracket | Male | Female |
| Under 5 Years | 0 (0.0%) | 0 (0.0%) |
| 5 to 17 Years | 0 (0.0%) | 0 (0.0%) |
| 18 to 34 Years | 0 (0.0%) | 0 (0.0%) |
| 35 to 64 Years | 0 (0.0%) | 0 (0.0%) |
| 65 to 74 Years | 0 (0.0%) | 0 (0.0%) |
| 75 Years and over | 10 (52.6%) | 0 (0.0%) |
Disability Class by Sex by Age in La Madera
Disability Class: Hearing Difficulty
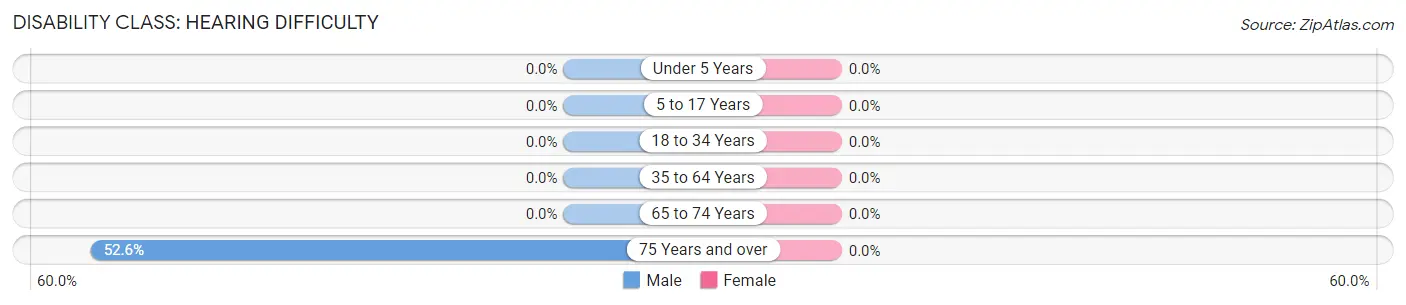
| Age Bracket | Male | Female |
| Under 5 Years | 0 (0.0%) | 0 (0.0%) |
| 5 to 17 Years | 0 (0.0%) | 0 (0.0%) |
| 18 to 34 Years | 0 (0.0%) | 0 (0.0%) |
| 35 to 64 Years | 0 (0.0%) | 0 (0.0%) |
| 65 to 74 Years | 0 (0.0%) | 0 (0.0%) |
| 75 Years and over | 10 (52.6%) | 0 (0.0%) |
Disability Class: Vision Difficulty
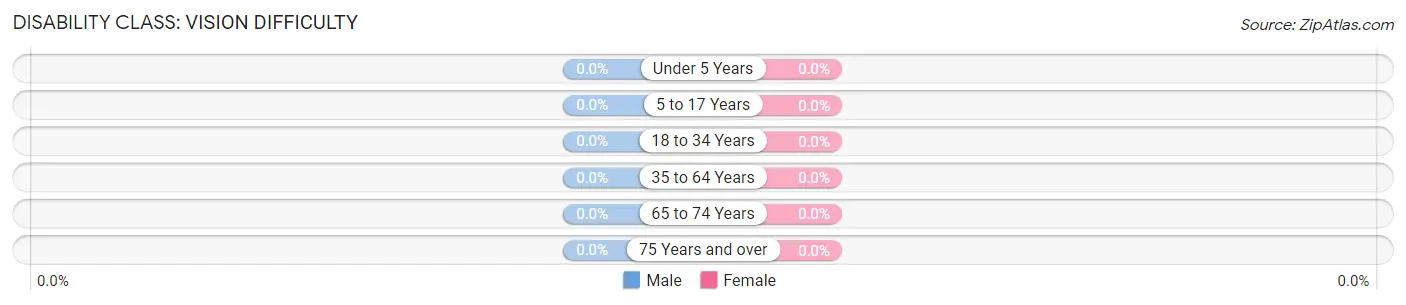
| Age Bracket | Male | Female |
| Under 5 Years | 0 (0.0%) | 0 (0.0%) |
| 5 to 17 Years | 0 (0.0%) | 0 (0.0%) |
| 18 to 34 Years | 0 (0.0%) | 0 (0.0%) |
| 35 to 64 Years | 0 (0.0%) | 0 (0.0%) |
| 65 to 74 Years | 0 (0.0%) | 0 (0.0%) |
| 75 Years and over | 0 (0.0%) | 0 (0.0%) |
Disability Class: Cognitive Difficulty

| Age Bracket | Male | Female |
| 5 to 17 Years | 0 (0.0%) | 0 (0.0%) |
| 18 to 34 Years | 0 (0.0%) | 0 (0.0%) |
| 35 to 64 Years | 0 (0.0%) | 0 (0.0%) |
| 65 to 74 Years | 0 (0.0%) | 0 (0.0%) |
| 75 Years and over | 10 (52.6%) | 0 (0.0%) |
Disability Class: Ambulatory Difficulty

| Age Bracket | Male | Female |
| 5 to 17 Years | 0 (0.0%) | 0 (0.0%) |
| 18 to 34 Years | 0 (0.0%) | 0 (0.0%) |
| 35 to 64 Years | 0 (0.0%) | 0 (0.0%) |
| 65 to 74 Years | 0 (0.0%) | 0 (0.0%) |
| 75 Years and over | 10 (52.6%) | 0 (0.0%) |
Disability Class: Self-Care Difficulty
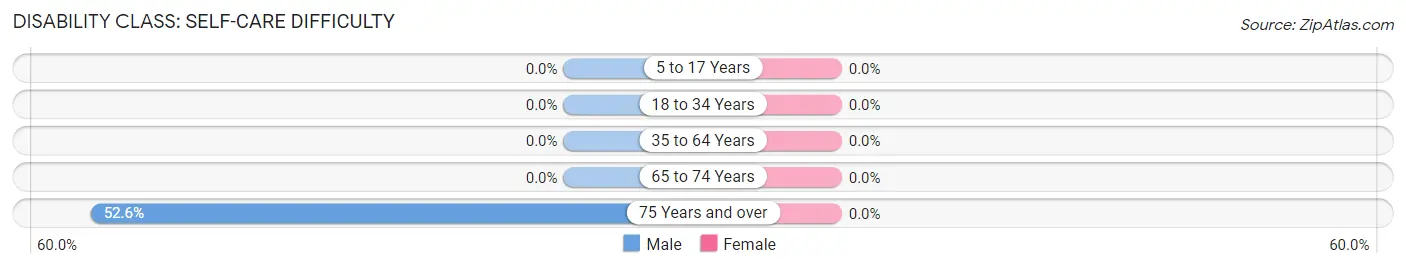
| Age Bracket | Male | Female |
| 5 to 17 Years | 0 (0.0%) | 0 (0.0%) |
| 18 to 34 Years | 0 (0.0%) | 0 (0.0%) |
| 35 to 64 Years | 0 (0.0%) | 0 (0.0%) |
| 65 to 74 Years | 0 (0.0%) | 0 (0.0%) |
| 75 Years and over | 10 (52.6%) | 0 (0.0%) |
Technology Access in La Madera
Computing Device Access in La Madera
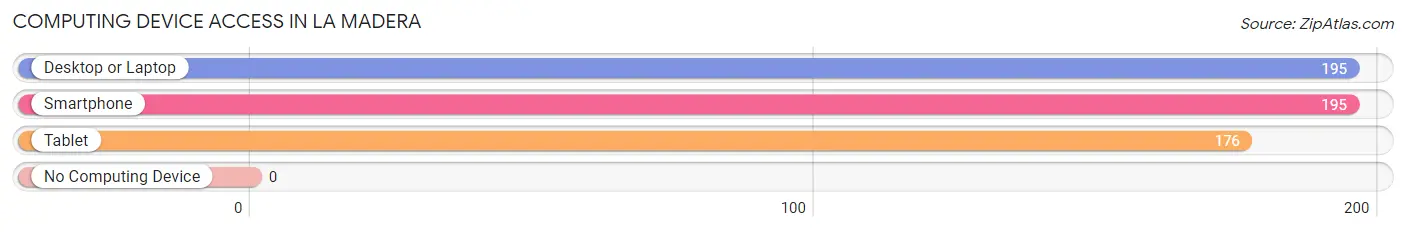
| Device Type | # Households | % Households |
| Desktop or Laptop | 195 | 100.0% |
| Smartphone | 195 | 100.0% |
| Tablet | 176 | 90.3% |
| No Computing Device | 0 | 0.0% |
| Total | 195 | 100.0% |
Internet Access in La Madera
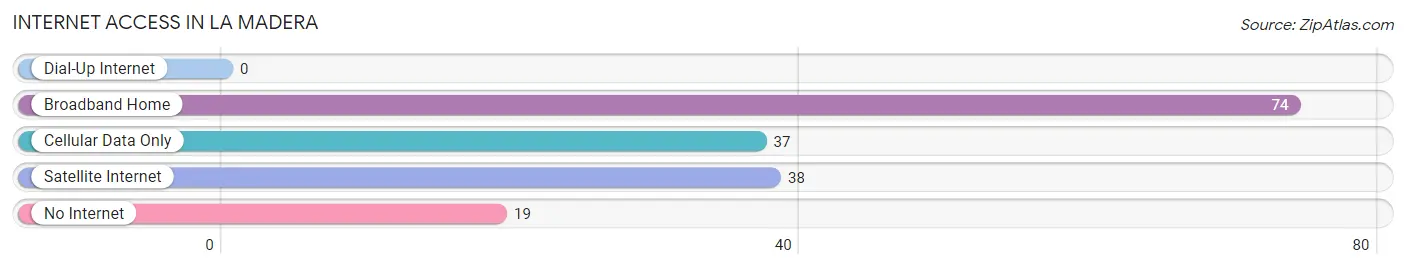
| Internet Type | # Households | % Households |
| Dial-Up Internet | 0 | 0.0% |
| Broadband Home | 74 | 38.0% |
| Cellular Data Only | 37 | 19.0% |
| Satellite Internet | 38 | 19.5% |
| No Internet | 19 | 9.7% |
| Total | 195 | 100.0% |
La Madera Summary
Madera, New Mexico is a small town located in the Chihuahuan Desert of the southwestern United States. It is situated in the northern part of the state, approximately 30 miles south of the state capital, Santa Fe. The town is located in the county of Sierra, and is part of the Las Cruces Metropolitan Statistical Area.
History
The area that is now Madera was originally inhabited by the Mescalero Apache, who were later displaced by the Spanish in the late 1700s. The town was founded in 1881 by a group of settlers from the nearby town of Las Cruces. The settlers named the town after the nearby Madera Creek, which was named for the abundance of wood in the area.
The town quickly grew, and by the early 1900s, it had become a bustling center of commerce and industry. The town was home to several businesses, including a general store, a hotel, a blacksmith shop, and a saloon. The town also had a post office, a school, and a church.
In the early 1900s, Madera was a major stop on the Santa Fe Trail, and the town was a popular destination for travelers. The town was also home to several ranches, and the area was known for its cattle and sheep.
Geography
Madera is located in the Chihuahuan Desert of the southwestern United States. The town is situated in the northern part of the state, approximately 30 miles south of the state capital, Santa Fe. The town is located in the county of Sierra, and is part of the Las Cruces Metropolitan Statistical Area.
The town is situated at an elevation of 4,400 feet, and is surrounded by the Chihuahuan Desert. The area is characterized by hot, dry summers and mild winters. The average annual temperature is around 70 degrees Fahrenheit, and the average annual precipitation is around 10 inches.
Economy
Madera’s economy is largely based on agriculture and ranching. The town is home to several ranches, and the area is known for its cattle and sheep. The town is also home to several businesses, including a general store, a hotel, a blacksmith shop, and a saloon.
The town is also home to several manufacturing companies, including a furniture factory and a plastics factory. The town is also home to several small businesses, including restaurants, shops, and other services.
Demographics
As of the 2010 census, the population of Madera was 1,845. The town is predominantly Hispanic, with over 90% of the population identifying as Hispanic or Latino. The median household income is around $30,000, and the median home value is around $90,000.
The town is served by the Madera Unified School District, which includes two elementary schools, one middle school, and one high school. The town is also home to several churches, including the Church of Jesus Christ of Latter-day Saints, the Catholic Church, and the United Methodist Church.
Conclusion
Madera, New Mexico is a small town located in the Chihuahuan Desert of the southwestern United States. It is situated in the northern part of the state, approximately 30 miles south of the state capital, Santa Fe. The town was founded in 1881 by a group of settlers from the nearby town of Las Cruces, and quickly grew into a bustling center of commerce and industry. The town’s economy is largely based on agriculture and ranching, and the town is home to several businesses, manufacturing companies, and small businesses. The town is predominantly Hispanic, with over 90% of the population identifying as Hispanic or Latino. Madera is served by the Madera Unified School District, and is home to several churches.
Common Questions
What is Per Capita Income in La Madera?
Per Capita income in La Madera is $54,315.
What is the Median Family Income in La Madera?
Median Family Income in La Madera is $141,875.
What is Inequality or Gini Index in La Madera?
Inequality or Gini Index in La Madera is 0.51.
What is the Total Population of La Madera?
Total Population of La Madera is 403.
What is the Total Male Population of La Madera?
Total Male Population of La Madera is 198.
What is the Total Female Population of La Madera?
Total Female Population of La Madera is 205.
What is the Ratio of Males per 100 Females in La Madera?
There are 96.59 Males per 100 Females in La Madera.
What is the Ratio of Females per 100 Males in La Madera?
There are 103.54 Females per 100 Males in La Madera.
What is the Median Population Age in La Madera?
Median Population Age in La Madera is 56.8 Years.
What is the Average Family Size in La Madera
Average Family Size in La Madera is 2.2 People.
What is the Average Household Size in La Madera
Average Household Size in La Madera is 2.1 People.
How Large is the Labor Force in La Madera?
There are 123 People in the Labor Forcein in La Madera.
What is the Percentage of People in the Labor Force in La Madera?
30.5% of People are in the Labor Force in La Madera.
What is the Unemployment Rate in La Madera?
Unemployment Rate in La Madera is 30.1%.