Jal, NM Map & Demographics
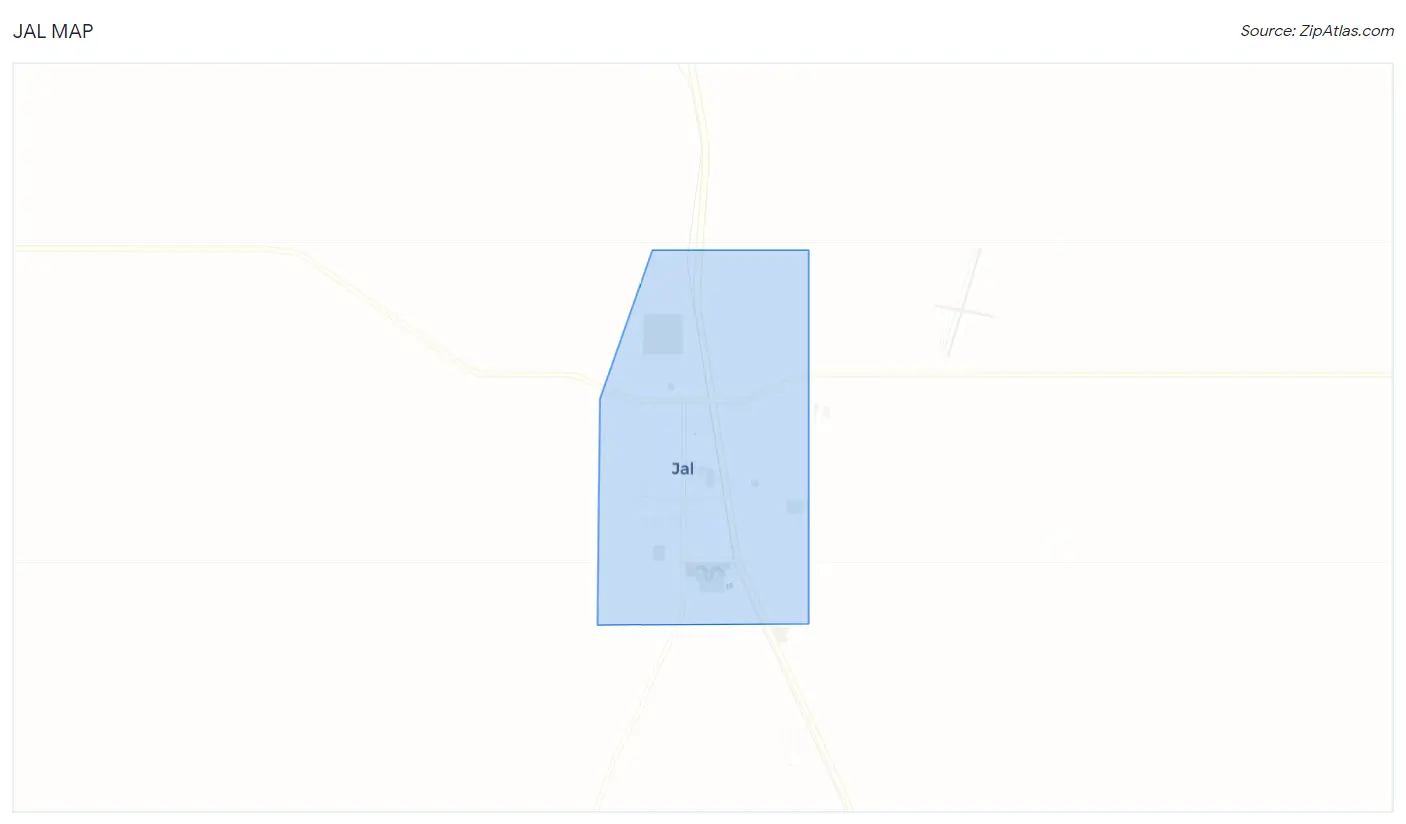
Jal Map
Jal Overview
$25,962
PER CAPITA INCOME
$58,410
AVG FAMILY INCOME
$56,731
AVG HOUSEHOLD INCOME
43.9%
WAGE / INCOME GAP [ % ]
56.1¢/ $1
WAGE / INCOME GAP [ $ ]
0.46
INEQUALITY / GINI INDEX
2,258
TOTAL POPULATION
1,048
MALE POPULATION
1,210
FEMALE POPULATION
86.61
MALES / 100 FEMALES
115.46
FEMALES / 100 MALES
39.5
MEDIAN AGE
3.1
AVG FAMILY SIZE
2.8
AVG HOUSEHOLD SIZE
1,047
LABOR FORCE [ PEOPLE ]
59.3%
PERCENT IN LABOR FORCE
13.9%
UNEMPLOYMENT RATE
Jal Zip Codes
Jal Area Codes
Income in Jal
Income Overview in Jal
Per Capita Income in Jal is $25,962, while median incomes of families and households are $58,410 and $56,731 respectively.
| Characteristic | Number | Measure |
| Per Capita Income | 2,258 | $25,962 |
| Median Family Income | 613 | $58,410 |
| Mean Family Income | 613 | $69,782 |
| Median Household Income | 822 | $56,731 |
| Mean Household Income | 822 | $64,947 |
| Income Deficit | 613 | $0 |
| Wage / Income Gap (%) | 2,258 | 43.86% |
| Wage / Income Gap ($) | 2,258 | 56.14¢ per $1 |
| Gini / Inequality Index | 2,258 | 0.46 |
Earnings by Sex in Jal
Average Earnings in Jal are $55,403, $59,558 for men and $33,438 for women, a difference of 43.9%.
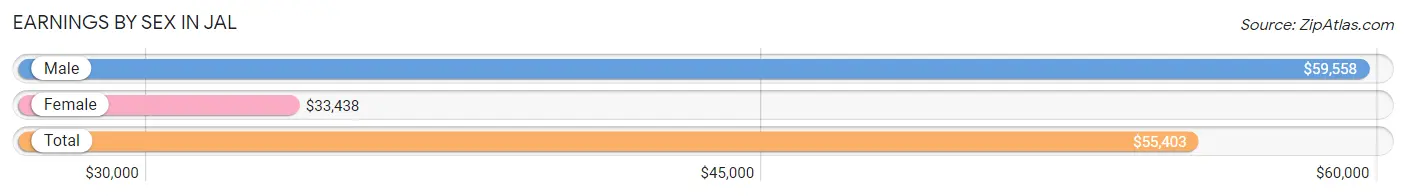
| Sex | Number | Average Earnings |
| Male | 623 (61.1%) | $59,558 |
| Female | 397 (38.9%) | $33,438 |
| Total | 1,020 (100.0%) | $55,403 |
Earnings by Sex by Income Bracket in Jal
The most common earnings brackets in Jal are $55,000 to $64,999 for men (162 | 26.0%) and $65,000 to $74,999 for women (86 | 21.7%).
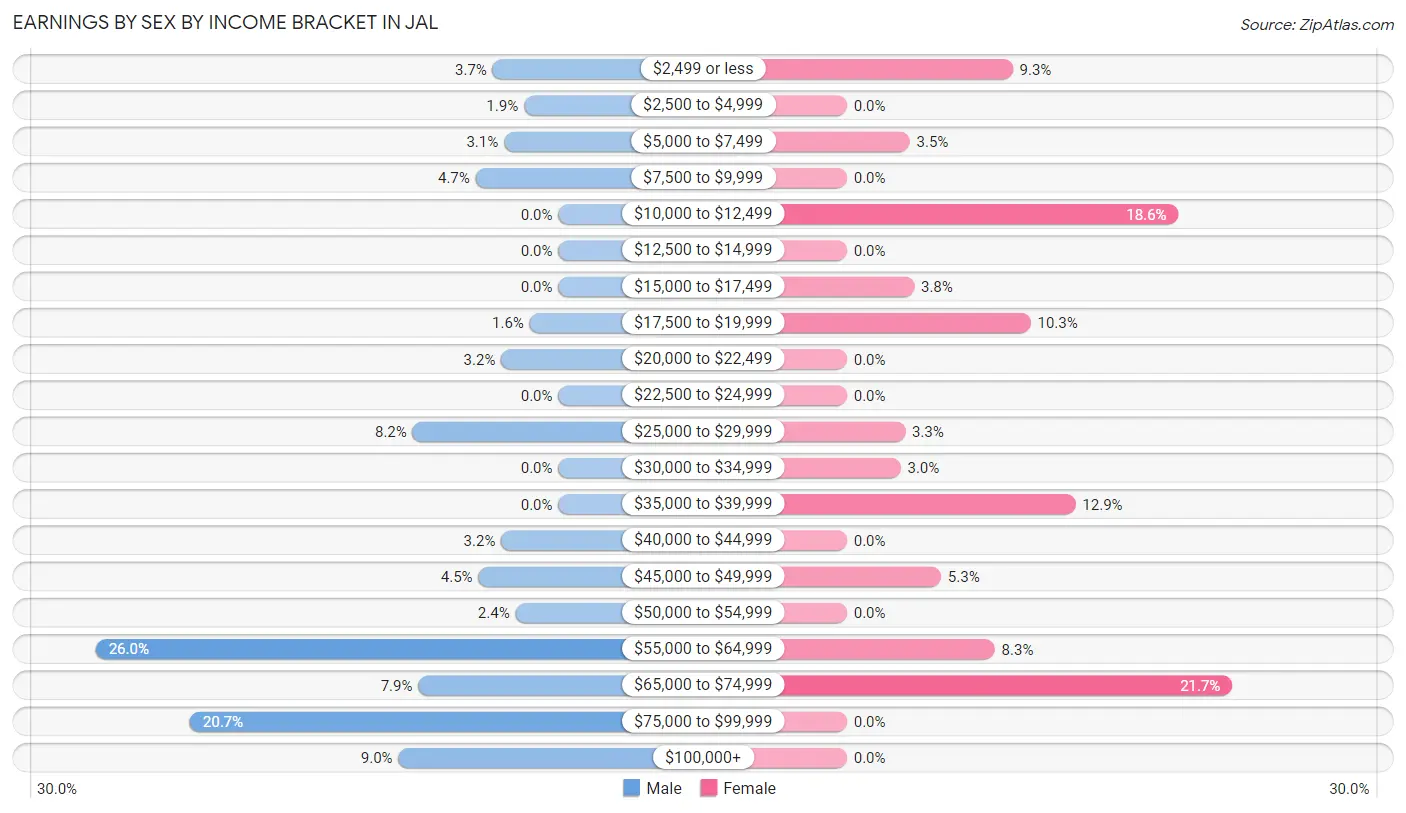
| Income | Male | Female |
| $2,499 or less | 23 (3.7%) | 37 (9.3%) |
| $2,500 to $4,999 | 12 (1.9%) | 0 (0.0%) |
| $5,000 to $7,499 | 19 (3.0%) | 14 (3.5%) |
| $7,500 to $9,999 | 29 (4.6%) | 0 (0.0%) |
| $10,000 to $12,499 | 0 (0.0%) | 74 (18.6%) |
| $12,500 to $14,999 | 0 (0.0%) | 0 (0.0%) |
| $15,000 to $17,499 | 0 (0.0%) | 15 (3.8%) |
| $17,500 to $19,999 | 10 (1.6%) | 41 (10.3%) |
| $20,000 to $22,499 | 20 (3.2%) | 0 (0.0%) |
| $22,500 to $24,999 | 0 (0.0%) | 0 (0.0%) |
| $25,000 to $29,999 | 51 (8.2%) | 13 (3.3%) |
| $30,000 to $34,999 | 0 (0.0%) | 12 (3.0%) |
| $35,000 to $39,999 | 0 (0.0%) | 51 (12.9%) |
| $40,000 to $44,999 | 20 (3.2%) | 0 (0.0%) |
| $45,000 to $49,999 | 28 (4.5%) | 21 (5.3%) |
| $50,000 to $54,999 | 15 (2.4%) | 0 (0.0%) |
| $55,000 to $64,999 | 162 (26.0%) | 33 (8.3%) |
| $65,000 to $74,999 | 49 (7.9%) | 86 (21.7%) |
| $75,000 to $99,999 | 129 (20.7%) | 0 (0.0%) |
| $100,000+ | 56 (9.0%) | 0 (0.0%) |
| Total | 623 (100.0%) | 397 (100.0%) |
Earnings by Sex by Educational Attainment in Jal
Average earnings in Jal are $59,726 for men and $35,179 for women, a difference of 41.1%. Men with an educational attainment of less than high school enjoy the highest average annual earnings of $59,512, while those with high school diploma education earn the least with $47,266. Women with an educational attainment of high school diploma earn the most with the average annual earnings of $35,625, while those with high school diploma education have the smallest earnings of $35,625.
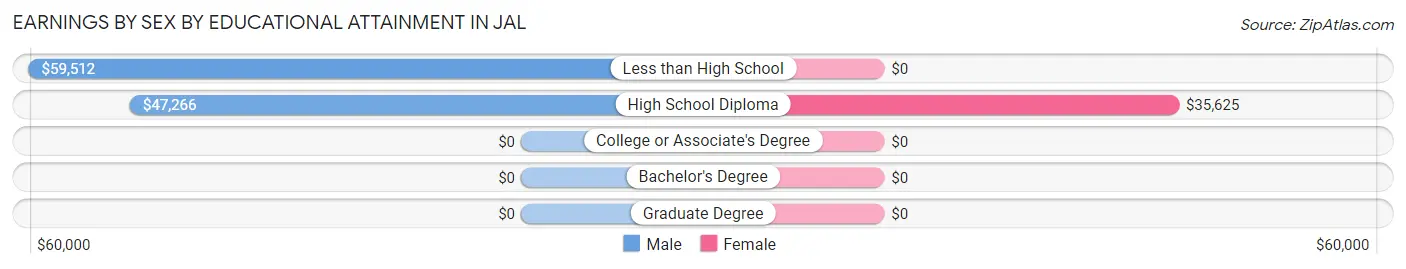
| Educational Attainment | Male Income | Female Income |
| Less than High School | $59,512 | $0 |
| High School Diploma | $47,266 | $35,625 |
| College or Associate's Degree | - | - |
| Bachelor's Degree | - | - |
| Graduate Degree | - | - |
| Total | $59,726 | $35,179 |
Family Income in Jal
Family Income Brackets in Jal
According to the Jal family income data, there are 177 families falling into the $50,000 to $74,999 income range, which is the most common income bracket and makes up 28.9% of all families. Conversely, the $200,000+ income bracket is the least frequent group with only 11 families (1.8%) belonging to this category.
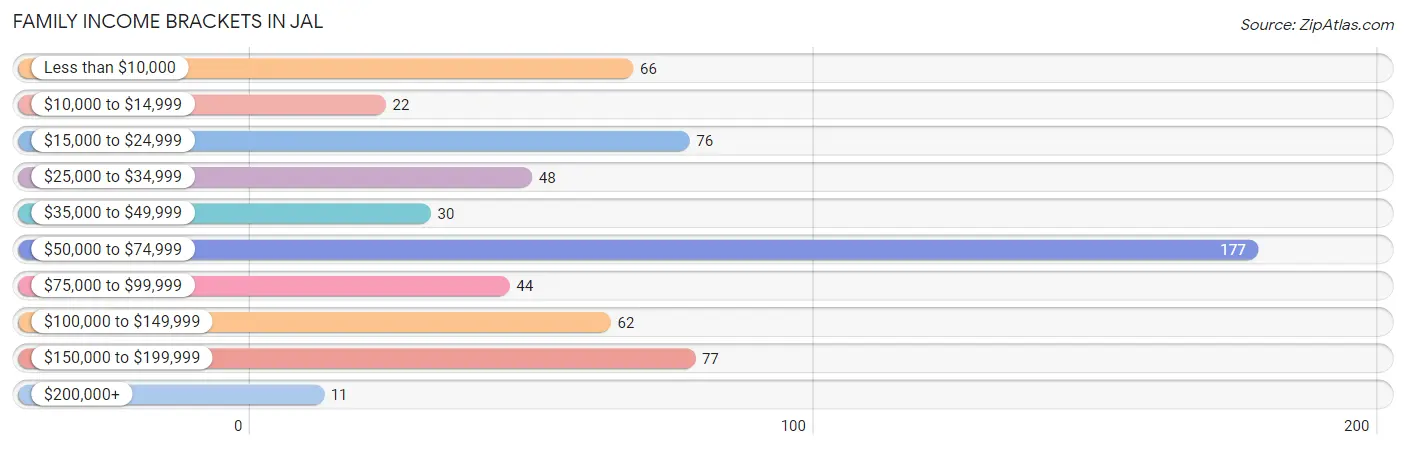
| Income Bracket | # Families | % Families |
| Less than $10,000 | 66 | 10.8% |
| $10,000 to $14,999 | 22 | 3.6% |
| $15,000 to $24,999 | 76 | 12.4% |
| $25,000 to $34,999 | 48 | 7.8% |
| $35,000 to $49,999 | 30 | 4.9% |
| $50,000 to $74,999 | 177 | 28.9% |
| $75,000 to $99,999 | 44 | 7.2% |
| $100,000 to $149,999 | 62 | 10.1% |
| $150,000 to $199,999 | 77 | 12.6% |
| $200,000+ | 11 | 1.8% |
Family Income by Famaliy Size in Jal
5-person families (52 | 8.5%) account for the highest median family income in Jal with $83,750 per family, while 2-person families (373 | 60.9%) have the highest median income of $28,778 per family member.
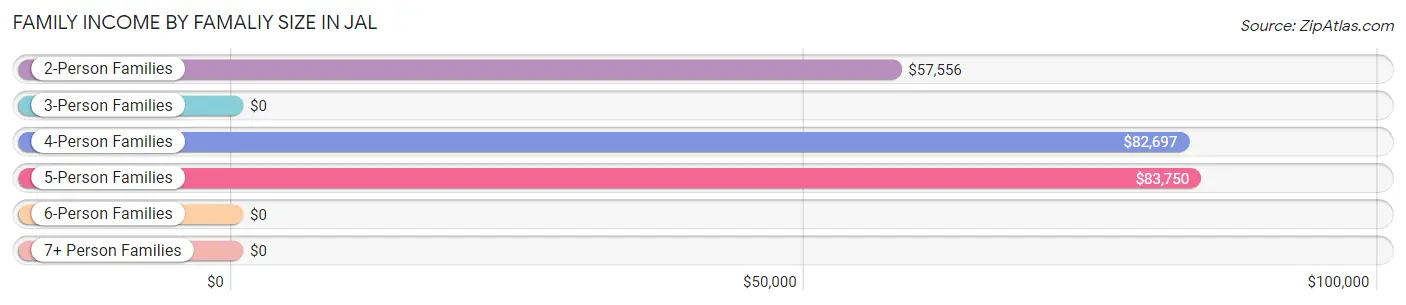
| Income Bracket | # Families | Median Income |
| 2-Person Families | 373 (60.9%) | $57,556 |
| 3-Person Families | 85 (13.9%) | $0 |
| 4-Person Families | 89 (14.5%) | $82,697 |
| 5-Person Families | 52 (8.5%) | $83,750 |
| 6-Person Families | 0 (0.0%) | $0 |
| 7+ Person Families | 14 (2.3%) | $0 |
| Total | 613 (100.0%) | $58,410 |
Family Income by Number of Earners in Jal
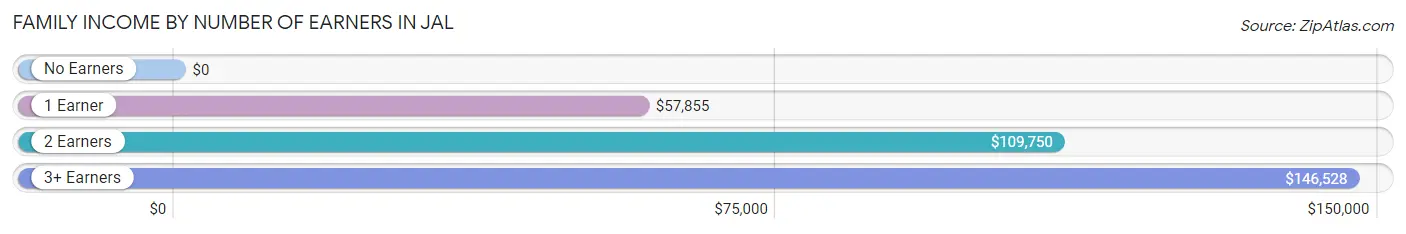
| Number of Earners | # Families | Median Income |
| No Earners | 131 (21.4%) | $0 |
| 1 Earner | 289 (47.1%) | $57,855 |
| 2 Earners | 151 (24.6%) | $109,750 |
| 3+ Earners | 42 (6.9%) | $146,528 |
| Total | 613 (100.0%) | $58,410 |
Household Income in Jal
Household Income Brackets in Jal
With 209 households falling in the category, the $50,000 to $74,999 income range is the most frequent in Jal, accounting for 25.4% of all households. In contrast, only 11 households (1.3%) fall into the $200,000+ income bracket, making it the least populous group.
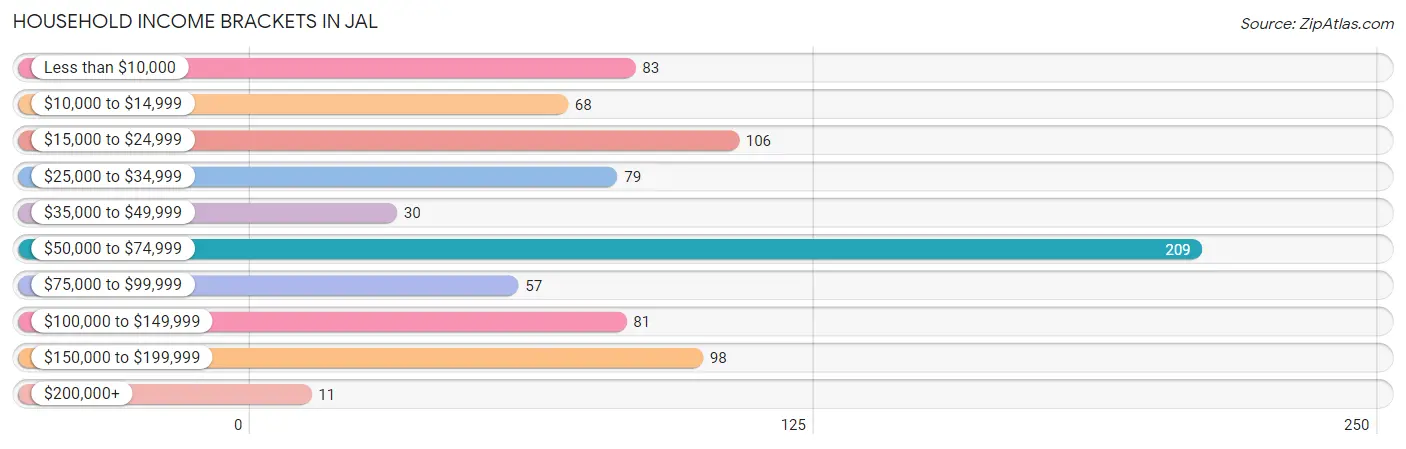
| Income Bracket | # Households | % Households |
| Less than $10,000 | 83 | 10.1% |
| $10,000 to $14,999 | 68 | 8.3% |
| $15,000 to $24,999 | 106 | 12.9% |
| $25,000 to $34,999 | 79 | 9.6% |
| $35,000 to $49,999 | 30 | 3.6% |
| $50,000 to $74,999 | 209 | 25.4% |
| $75,000 to $99,999 | 57 | 6.9% |
| $100,000 to $149,999 | 81 | 9.9% |
| $150,000 to $199,999 | 98 | 11.9% |
| $200,000+ | 11 | 1.3% |
Household Income by Householder Age in Jal
The median household income in Jal is $56,731, with the highest median household income of $83,203 found in the 25 to 44 years age bracket for the primary householder. A total of 264 households (32.1%) fall into this category.
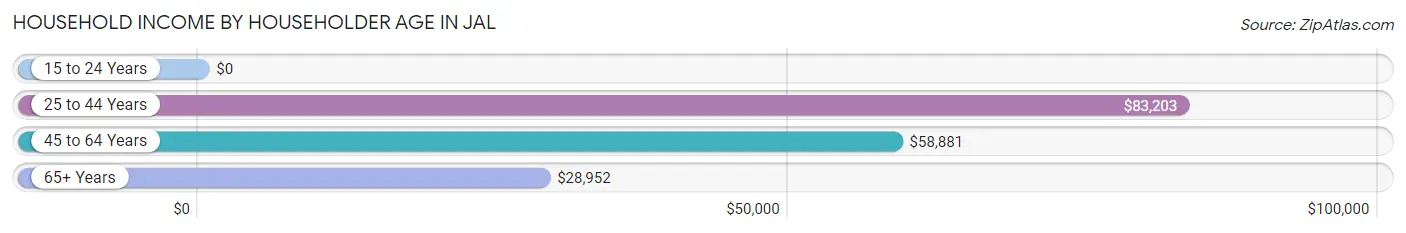
| Income Bracket | # Households | Median Income |
| 15 to 24 Years | 0 (0.0%) | $0 |
| 25 to 44 Years | 264 (32.1%) | $83,203 |
| 45 to 64 Years | 328 (39.9%) | $58,881 |
| 65+ Years | 230 (28.0%) | $28,952 |
| Total | 822 (100.0%) | $56,731 |
Poverty in Jal
Income Below Poverty by Sex and Age in Jal
With 15.2% poverty level for males and 35.4% for females among the residents of Jal, 15 year old males and 15 year old females are the most vulnerable to poverty, with 14 males (100.0%) and 99 females (100.0%) in their respective age groups living below the poverty level.
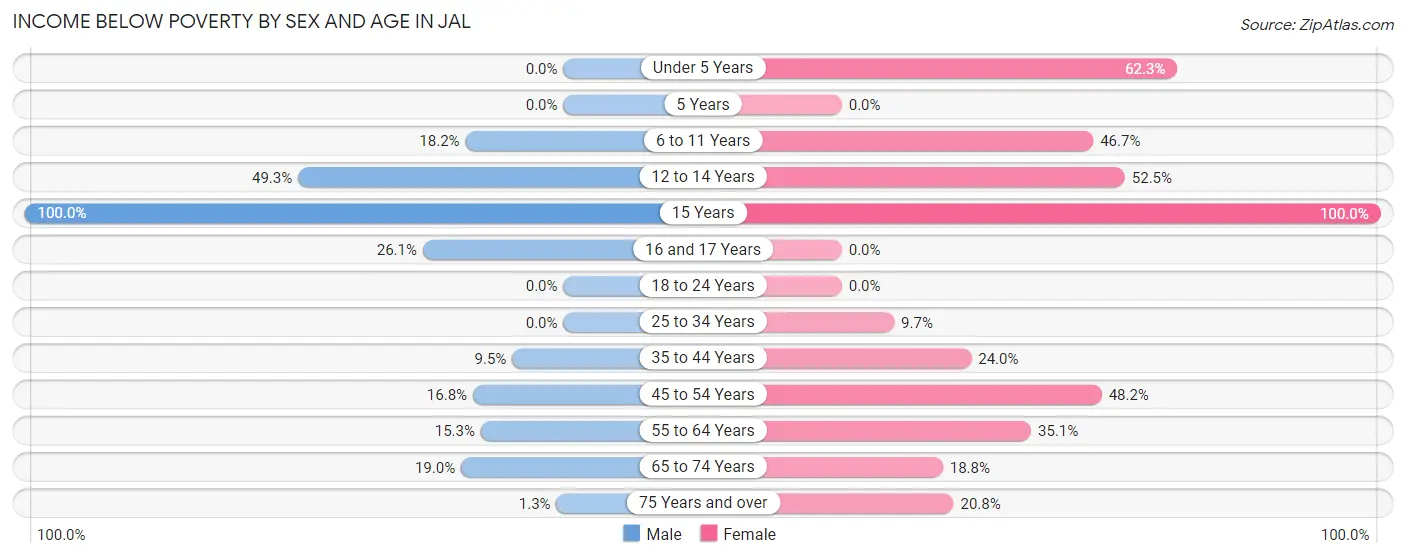
| Age Bracket | Male | Female |
| Under 5 Years | 0 (0.0%) | 33 (62.3%) |
| 5 Years | 0 (0.0%) | 0 (0.0%) |
| 6 to 11 Years | 12 (18.2%) | 28 (46.7%) |
| 12 to 14 Years | 33 (49.2%) | 62 (52.5%) |
| 15 Years | 14 (100.0%) | 99 (100.0%) |
| 16 and 17 Years | 12 (26.1%) | 0 (0.0%) |
| 18 to 24 Years | 0 (0.0%) | 0 (0.0%) |
| 25 to 34 Years | 0 (0.0%) | 14 (9.7%) |
| 35 to 44 Years | 23 (9.5%) | 25 (24.0%) |
| 45 to 54 Years | 22 (16.8%) | 82 (48.2%) |
| 55 to 64 Years | 23 (15.3%) | 52 (35.1%) |
| 65 to 74 Years | 19 (19.0%) | 12 (18.8%) |
| 75 Years and over | 1 (1.3%) | 22 (20.7%) |
| Total | 159 (15.2%) | 429 (35.4%) |
Income Above Poverty by Sex and Age in Jal
According to the poverty statistics in Jal, males aged 18 to 24 years and females aged 5 years are the age groups that are most secure financially, with 100.0% of males and 100.0% of females in these age groups living above the poverty line.
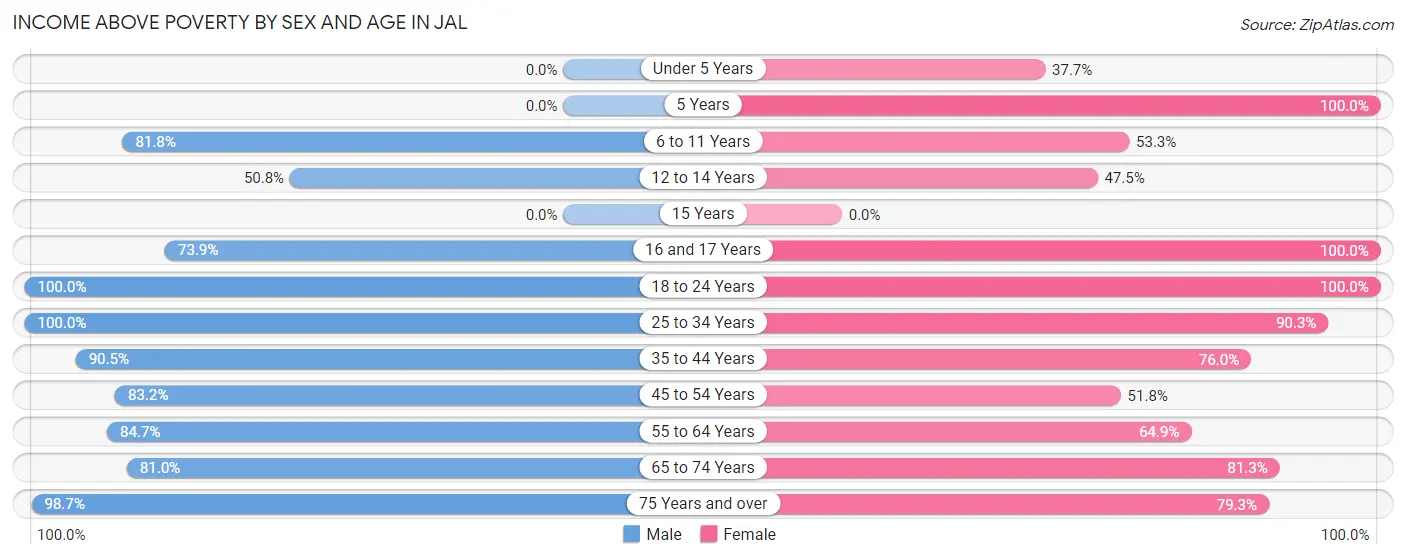
| Age Bracket | Male | Female |
| Under 5 Years | 0 (0.0%) | 20 (37.7%) |
| 5 Years | 0 (0.0%) | 16 (100.0%) |
| 6 to 11 Years | 54 (81.8%) | 32 (53.3%) |
| 12 to 14 Years | 34 (50.7%) | 56 (47.5%) |
| 15 Years | 0 (0.0%) | 0 (0.0%) |
| 16 and 17 Years | 34 (73.9%) | 62 (100.0%) |
| 18 to 24 Years | 110 (100.0%) | 66 (100.0%) |
| 25 to 34 Years | 44 (100.0%) | 130 (90.3%) |
| 35 to 44 Years | 219 (90.5%) | 79 (76.0%) |
| 45 to 54 Years | 109 (83.2%) | 88 (51.8%) |
| 55 to 64 Years | 127 (84.7%) | 96 (64.9%) |
| 65 to 74 Years | 81 (81.0%) | 52 (81.2%) |
| 75 Years and over | 77 (98.7%) | 84 (79.2%) |
| Total | 889 (84.8%) | 781 (64.5%) |
Income Below Poverty Among Married-Couple Families in Jal
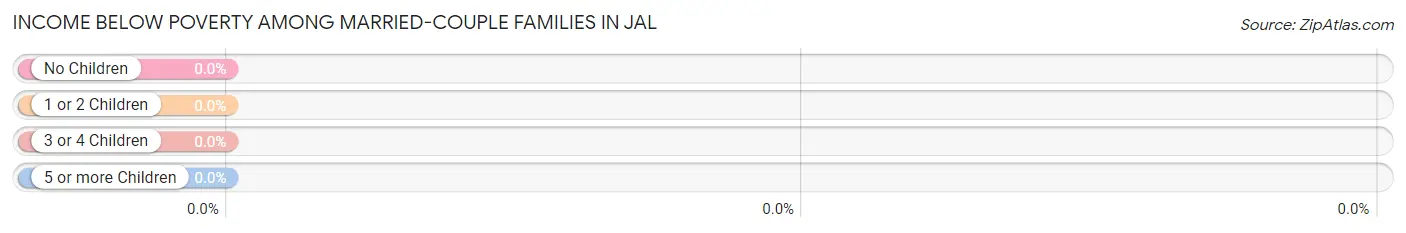
| Children | Above Poverty | Below Poverty |
| No Children | 322 (100.0%) | 0 (0.0%) |
| 1 or 2 Children | 55 (100.0%) | 0 (0.0%) |
| 3 or 4 Children | 29 (100.0%) | 0 (0.0%) |
| 5 or more Children | 0 (0.0%) | 0 (0.0%) |
| Total | 406 (100.0%) | 0 (0.0%) |
Income Below Poverty Among Single-Parent Households in Jal
According to the poverty data in Jal, 100.0% or 21 single-father households and 52.7% or 98 single-mother households are living below the poverty line. Among single-father households, those with no children have the highest poverty rate, with 1 households (100.0%) experiencing poverty. Likewise, among single-mother households, those with 3 or 4 children have the highest poverty rate, with 11 households (100.0%) falling below the poverty line.
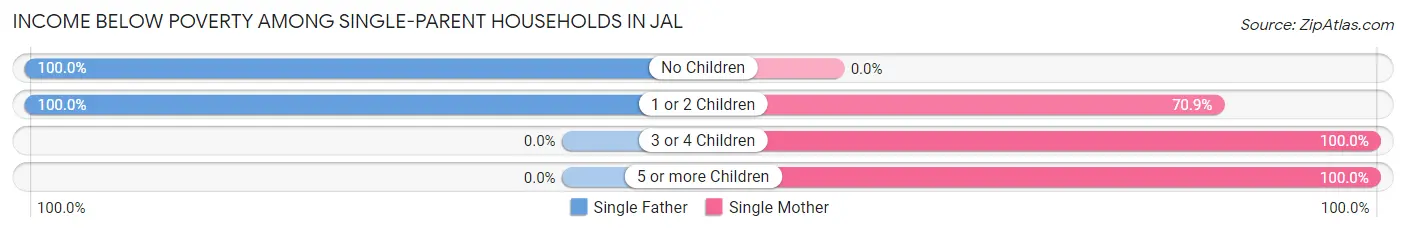
| Children | Single Father | Single Mother |
| No Children | 1 (100.0%) | 0 (0.0%) |
| 1 or 2 Children | 20 (100.0%) | 73 (70.9%) |
| 3 or 4 Children | 0 (0.0%) | 11 (100.0%) |
| 5 or more Children | 0 (0.0%) | 14 (100.0%) |
| Total | 21 (100.0%) | 98 (52.7%) |
Income Below Poverty Among Married-Couple vs Single-Parent Households in Jal
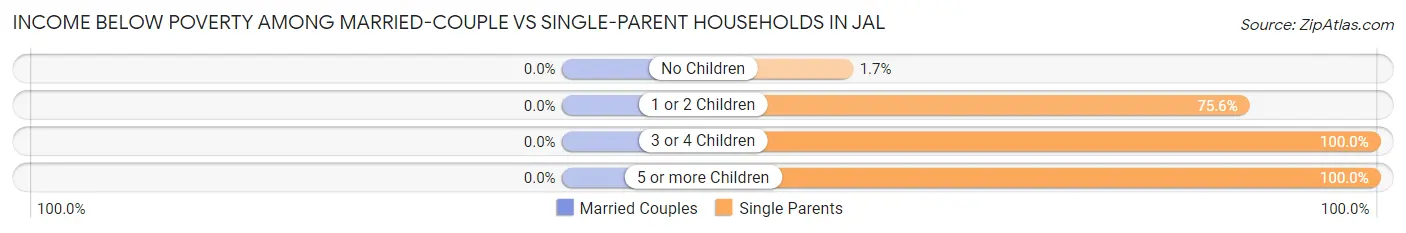
| Children | Married-Couple Families | Single-Parent Households |
| No Children | 0 (0.0%) | 1 (1.7%) |
| 1 or 2 Children | 0 (0.0%) | 93 (75.6%) |
| 3 or 4 Children | 0 (0.0%) | 11 (100.0%) |
| 5 or more Children | 0 (0.0%) | 14 (100.0%) |
| Total | 0 (0.0%) | 119 (57.5%) |
Race in Jal
The most populous races in Jal are White / Caucasian (1,712 | 75.8%), Hispanic or Latino (1,270 | 56.2%), and Two or more Races (394 | 17.4%).
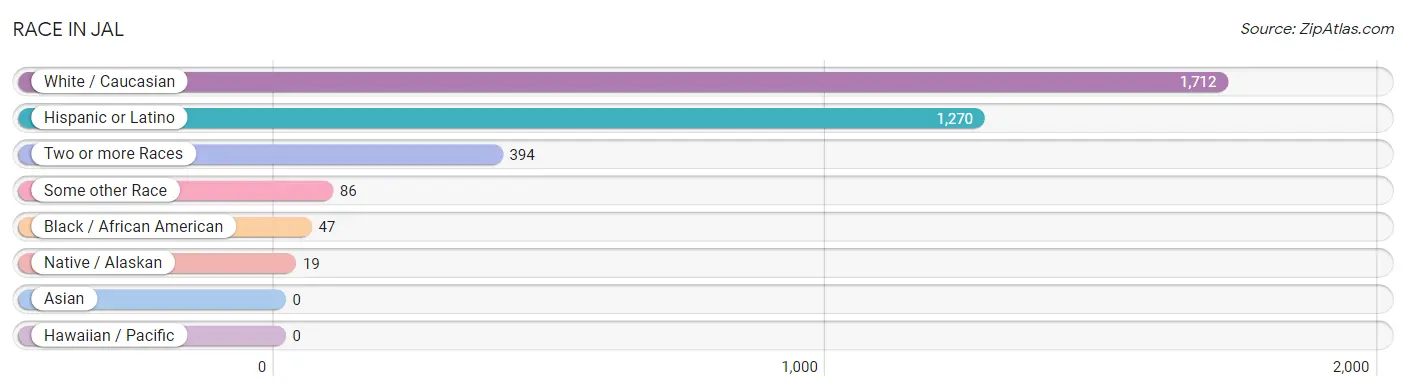
| Race | # Population | % Population |
| Asian | 0 | 0.0% |
| Black / African American | 47 | 2.1% |
| Hawaiian / Pacific | 0 | 0.0% |
| Hispanic or Latino | 1,270 | 56.2% |
| Native / Alaskan | 19 | 0.8% |
| White / Caucasian | 1,712 | 75.8% |
| Two or more Races | 394 | 17.4% |
| Some other Race | 86 | 3.8% |
| Total | 2,258 | 100.0% |
Ancestry in Jal
The most populous ancestries reported in Jal are Mexican (1,211 | 53.6%), English (230 | 10.2%), Irish (158 | 7.0%), German (122 | 5.4%), and Scottish (61 | 2.7%), together accounting for 78.9% of all Jal residents.
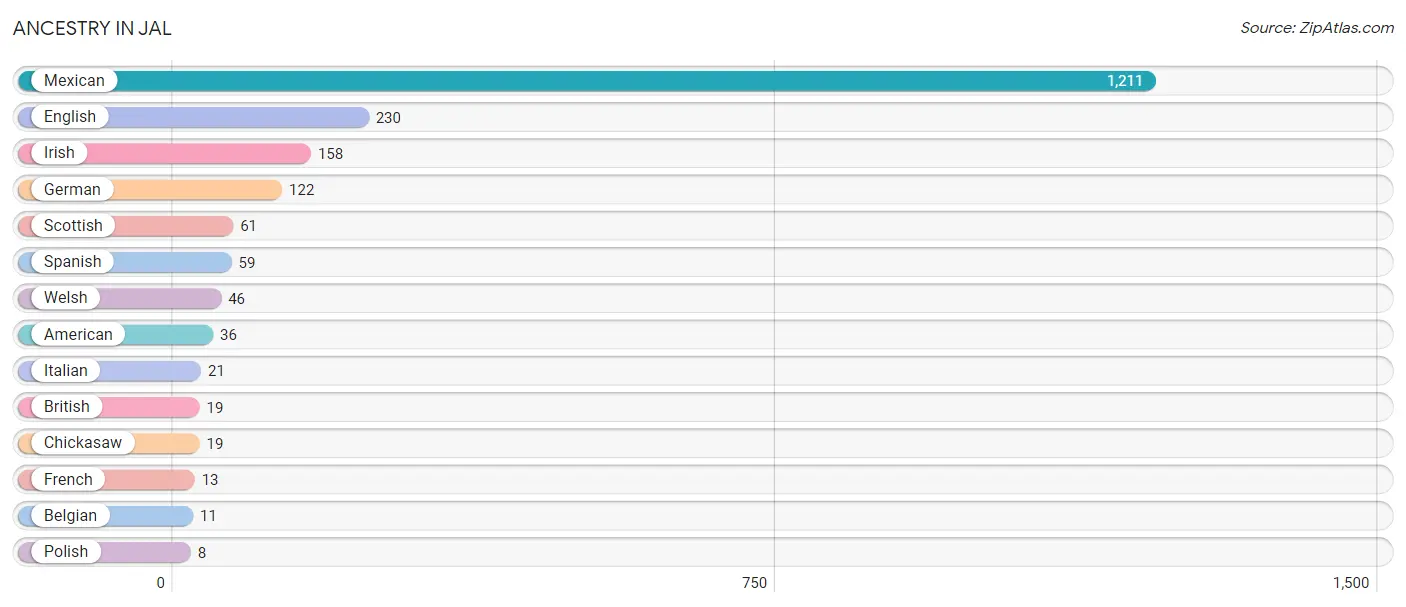
| Ancestry | # Population | % Population |
| American | 36 | 1.6% |
| Belgian | 11 | 0.5% |
| British | 19 | 0.8% |
| Chickasaw | 19 | 0.8% |
| English | 230 | 10.2% |
| French | 13 | 0.6% |
| German | 122 | 5.4% |
| Irish | 158 | 7.0% |
| Italian | 21 | 0.9% |
| Mexican | 1,211 | 53.6% |
| Polish | 8 | 0.4% |
| Scottish | 61 | 2.7% |
| Spanish | 59 | 2.6% |
| Welsh | 46 | 2.0% | View All 14 Rows |
Immigrants in Jal
The most numerous immigrant groups reported in Jal came from Central America (455 | 20.2%), Latin America (455 | 20.2%), Mexico (455 | 20.2%), Europe (4 | 0.2%), and Germany (4 | 0.2%), together accounting for 60.8% of all Jal residents.
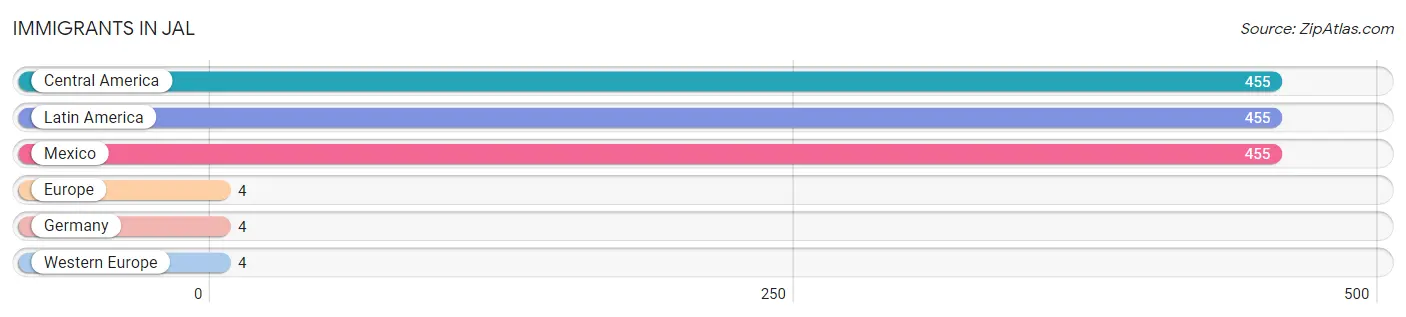
| Immigration Origin | # Population | % Population |
| Central America | 455 | 20.2% |
| Europe | 4 | 0.2% |
| Germany | 4 | 0.2% |
| Latin America | 455 | 20.2% |
| Mexico | 455 | 20.2% |
| Western Europe | 4 | 0.2% | View All 6 Rows |
Sex and Age in Jal
Sex and Age in Jal
The most populous age groups in Jal are 35 to 39 Years (157 | 15.0%) for men and 15 to 19 Years (181 | 15.0%) for women.
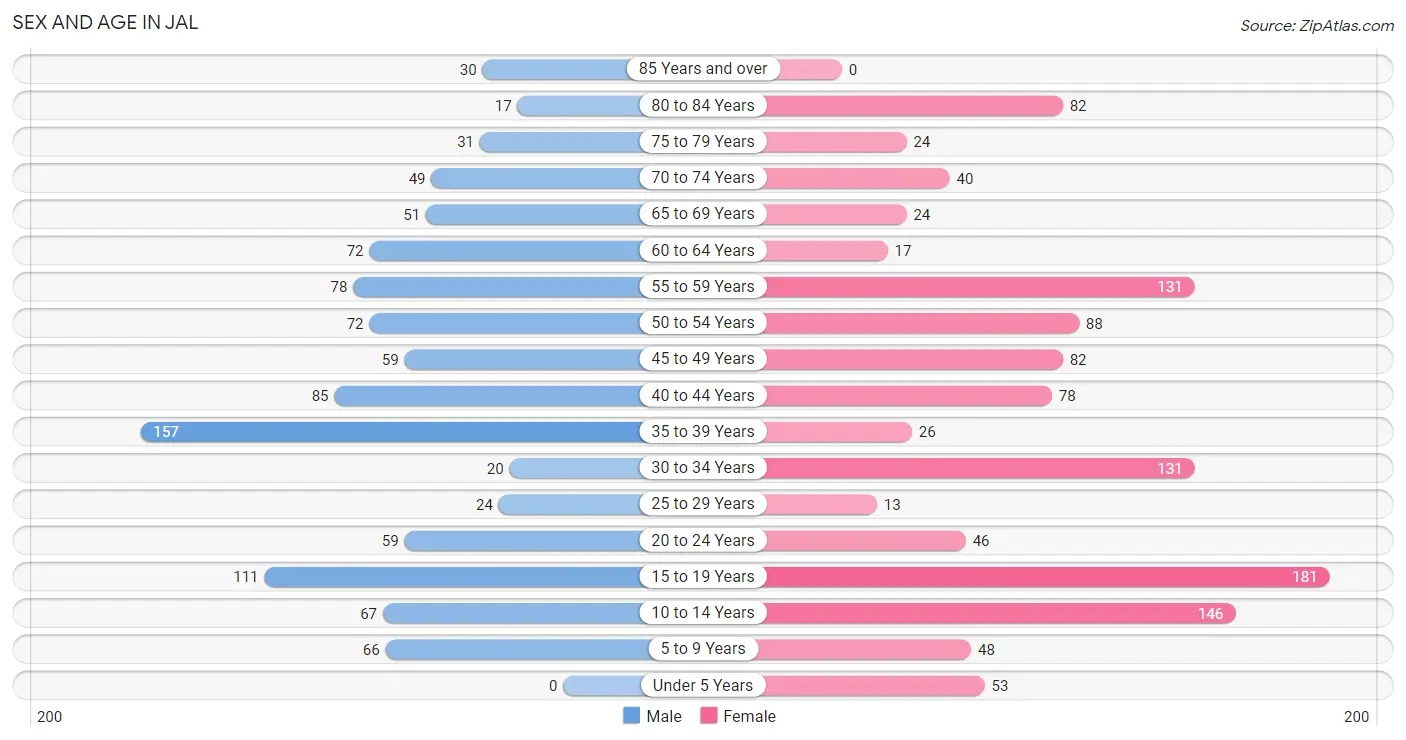
| Age Bracket | Male | Female |
| Under 5 Years | 0 (0.0%) | 53 (4.4%) |
| 5 to 9 Years | 66 (6.3%) | 48 (4.0%) |
| 10 to 14 Years | 67 (6.4%) | 146 (12.1%) |
| 15 to 19 Years | 111 (10.6%) | 181 (15.0%) |
| 20 to 24 Years | 59 (5.6%) | 46 (3.8%) |
| 25 to 29 Years | 24 (2.3%) | 13 (1.1%) |
| 30 to 34 Years | 20 (1.9%) | 131 (10.8%) |
| 35 to 39 Years | 157 (15.0%) | 26 (2.1%) |
| 40 to 44 Years | 85 (8.1%) | 78 (6.5%) |
| 45 to 49 Years | 59 (5.6%) | 82 (6.8%) |
| 50 to 54 Years | 72 (6.9%) | 88 (7.3%) |
| 55 to 59 Years | 78 (7.4%) | 131 (10.8%) |
| 60 to 64 Years | 72 (6.9%) | 17 (1.4%) |
| 65 to 69 Years | 51 (4.9%) | 24 (2.0%) |
| 70 to 74 Years | 49 (4.7%) | 40 (3.3%) |
| 75 to 79 Years | 31 (3.0%) | 24 (2.0%) |
| 80 to 84 Years | 17 (1.6%) | 82 (6.8%) |
| 85 Years and over | 30 (2.9%) | 0 (0.0%) |
| Total | 1,048 (100.0%) | 1,210 (100.0%) |
Families and Households in Jal
Median Family Size in Jal
The median family size in Jal is 3.11 persons per family, with single female/mother families (186 | 30.3%) accounting for the largest median family size of 3.45 persons per family. On the other hand, single male/father families (21 | 3.4%) represent the smallest median family size with 2.52 persons per family.
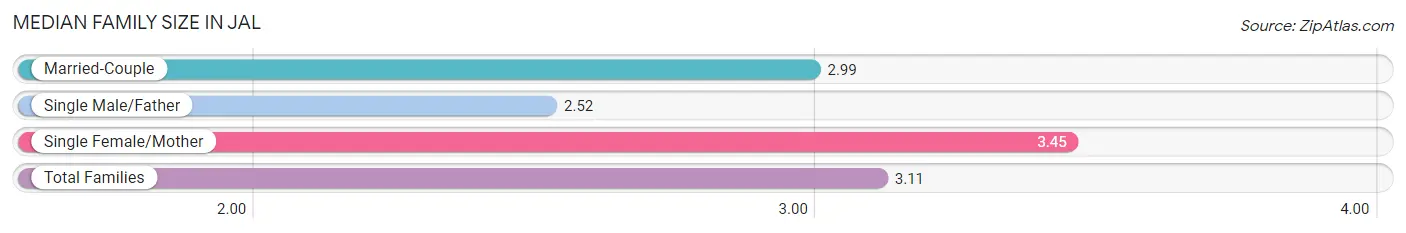
| Family Type | # Families | Family Size |
| Married-Couple | 406 (66.2%) | 2.99 |
| Single Male/Father | 21 (3.4%) | 2.52 |
| Single Female/Mother | 186 (30.3%) | 3.45 |
| Total Families | 613 (100.0%) | 3.11 |
Median Household Size in Jal
The median household size in Jal is 2.75 persons per household, with single male/father households (21 | 2.5%) accounting for the largest median household size of 3.67 persons per household. non-family households (209 | 25.4%) represent the smallest median household size with 1.40 persons per household.
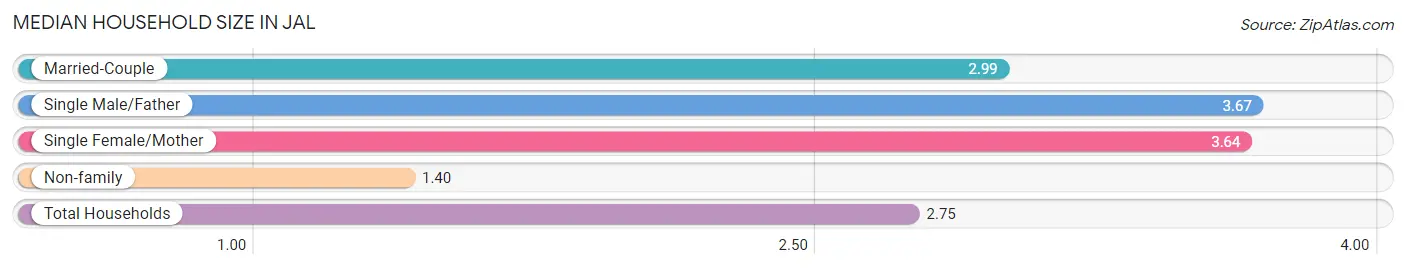
| Household Type | # Households | Household Size |
| Married-Couple | 406 (49.4%) | 2.99 |
| Single Male/Father | 21 (2.5%) | 3.67 |
| Single Female/Mother | 186 (22.6%) | 3.64 |
| Non-family | 209 (25.4%) | 1.40 |
| Total Households | 822 (100.0%) | 2.75 |
Household Size by Marriage Status in Jal
Out of a total of 822 households in Jal, 613 (74.6%) are family households, while 209 (25.4%) are nonfamily households. The most numerous type of family households are 2-person households, comprising 353, and the most common type of nonfamily households are 1-person households, comprising 165.
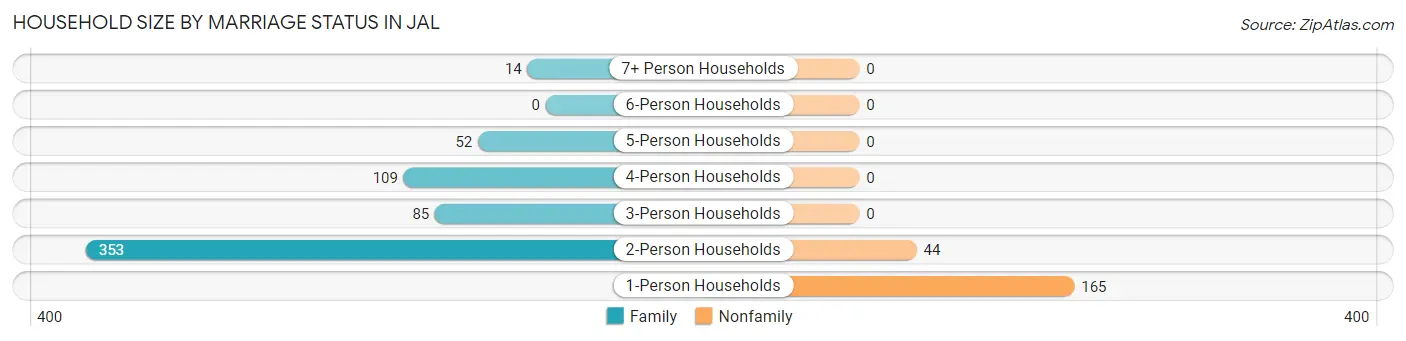
| Household Size | Family Households | Nonfamily Households |
| 1-Person Households | - | 165 (20.1%) |
| 2-Person Households | 353 (42.9%) | 44 (5.3%) |
| 3-Person Households | 85 (10.3%) | 0 (0.0%) |
| 4-Person Households | 109 (13.3%) | 0 (0.0%) |
| 5-Person Households | 52 (6.3%) | 0 (0.0%) |
| 6-Person Households | 0 (0.0%) | 0 (0.0%) |
| 7+ Person Households | 14 (1.7%) | 0 (0.0%) |
| Total | 613 (74.6%) | 209 (25.4%) |
Female Fertility in Jal
Fertility by Age in Jal
Average fertility rate in Jal is 23.0 births per 1,000 women. Women in the age bracket of 35 to 50 years have the highest fertility rate with 58.0 births per 1,000 women. Women in the age bracket of 35 to 50 years acount for 100.0% of all women with births.
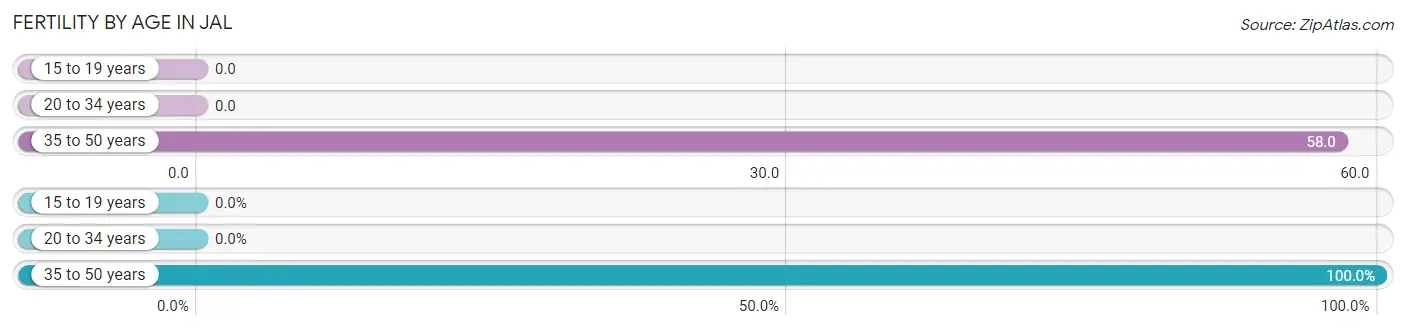
| Age Bracket | Women with Births | Births / 1,000 Women |
| 15 to 19 years | 0 (0.0%) | 0.0 |
| 20 to 34 years | 0 (0.0%) | 0.0 |
| 35 to 50 years | 14 (100.0%) | 58.0 |
| Total | 14 (100.0%) | 23.0 |
Fertility by Age by Marriage Status in Jal
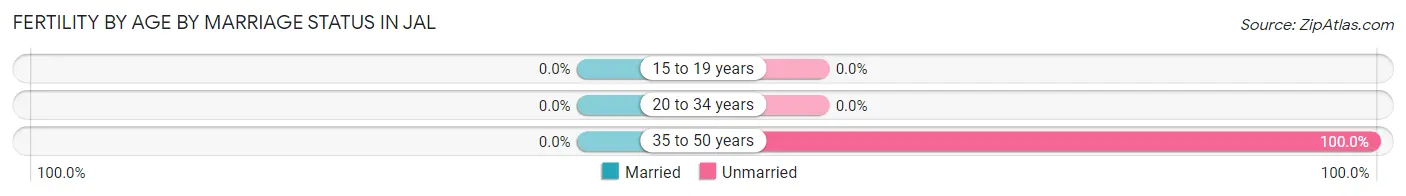
| Age Bracket | Married | Unmarried |
| 15 to 19 years | 0 (0.0%) | 0 (0.0%) |
| 20 to 34 years | 0 (0.0%) | 0 (0.0%) |
| 35 to 50 years | 0 (0.0%) | 14 (100.0%) |
| Total | 0 (0.0%) | 14 (100.0%) |
Fertility by Education in Jal
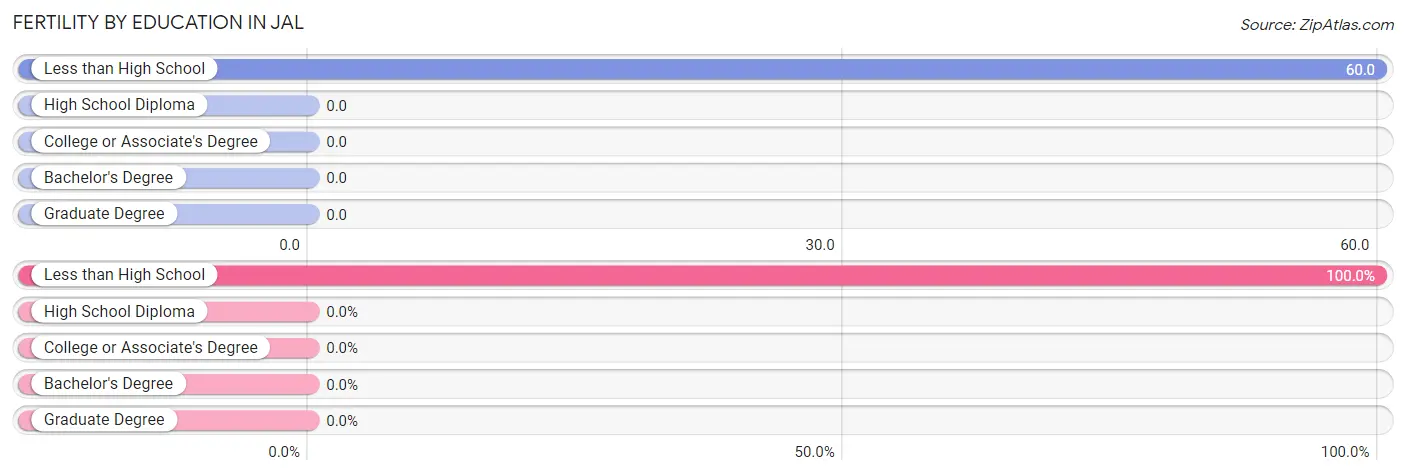
| Educational Attainment | Women with Births | Births / 1,000 Women |
| Less than High School | 14 (100.0%) | 60.0 |
| High School Diploma | 0 (0.0%) | 0.0 |
| College or Associate's Degree | 0 (0.0%) | 0.0 |
| Bachelor's Degree | 0 (0.0%) | 0.0 |
| Graduate Degree | 0 (0.0%) | 0.0 |
| Total | 14 (100.0%) | 23.0 |
Fertility by Education by Marriage Status in Jal
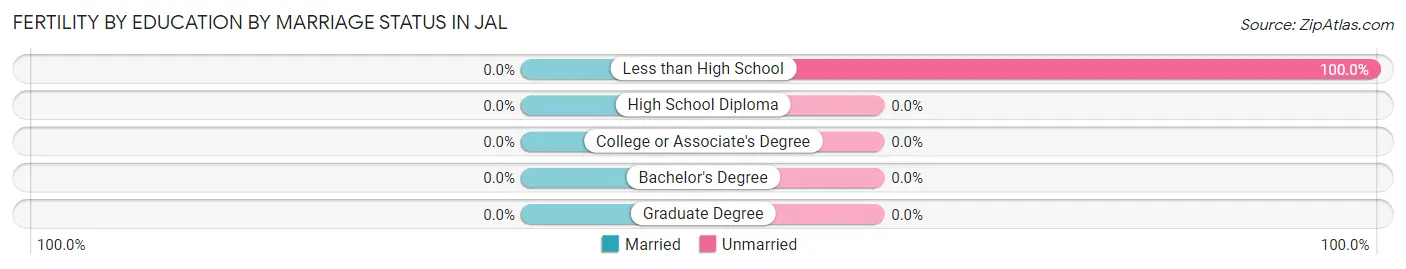
| Educational Attainment | Married | Unmarried |
| Less than High School | 0 (0.0%) | 14 (100.0%) |
| High School Diploma | 0 (0.0%) | 0 (0.0%) |
| College or Associate's Degree | 0 (0.0%) | 0 (0.0%) |
| Bachelor's Degree | 0 (0.0%) | 0 (0.0%) |
| Graduate Degree | 0 (0.0%) | 0 (0.0%) |
| Total | 0 (0.0%) | 14 (100.0%) |
Employment Characteristics in Jal
Employment by Class of Employer in Jal
Among the 901 employed individuals in Jal, private company employees (642 | 71.3%), local government employees (163 | 18.1%), and self-employed (not incorporated) (43 | 4.8%) make up the most common classes of employment.
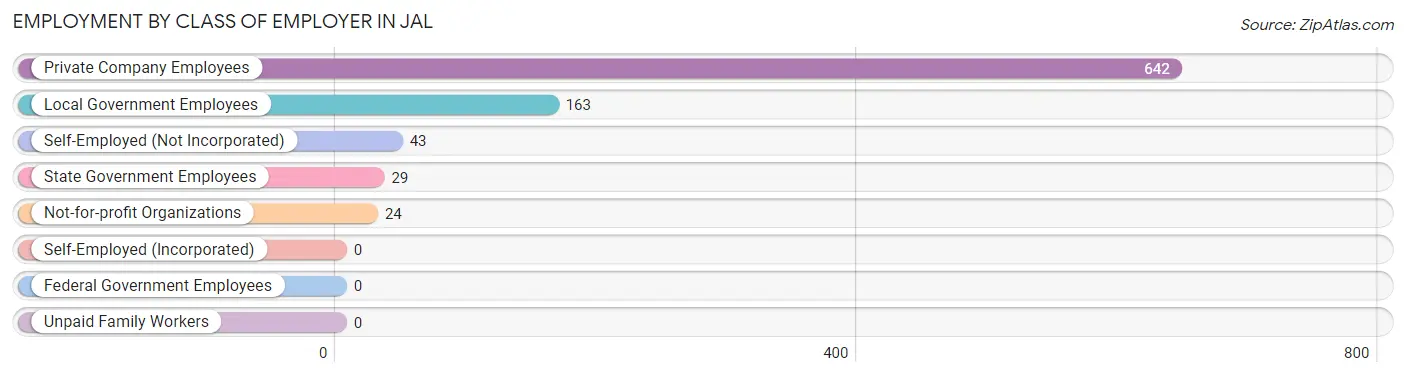
| Employer Class | # Employees | % Employees |
| Private Company Employees | 642 | 71.3% |
| Self-Employed (Incorporated) | 0 | 0.0% |
| Self-Employed (Not Incorporated) | 43 | 4.8% |
| Not-for-profit Organizations | 24 | 2.7% |
| Local Government Employees | 163 | 18.1% |
| State Government Employees | 29 | 3.2% |
| Federal Government Employees | 0 | 0.0% |
| Unpaid Family Workers | 0 | 0.0% |
| Total | 901 | 100.0% |
Employment Status by Age in Jal
According to the labor force statistics for Jal, out of the total population over 16 years of age (1,765), 59.3% or 1,047 individuals are in the labor force, with 13.9% or 146 of them unemployed. The age group with the highest labor force participation rate is 60 to 64 years, with 100.0% or 89 individuals in the labor force. Within the labor force, the 16 to 19 years age range has the highest percentage of unemployed individuals, with 62.5% or 20 of them being unemployed.
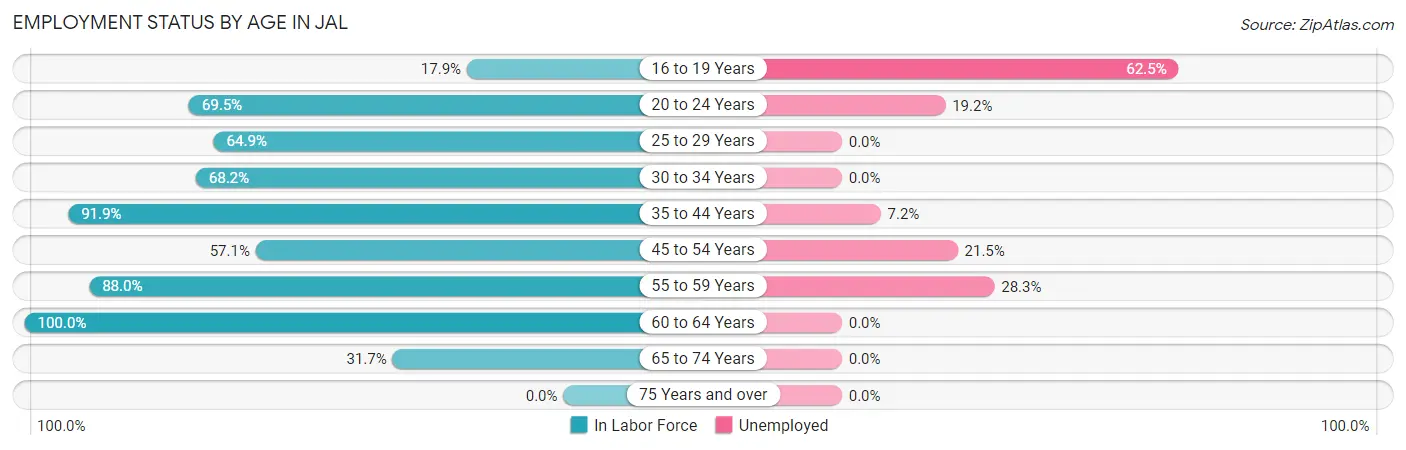
| Age Bracket | In Labor Force | Unemployed |
| 16 to 19 Years | 32 (17.9%) | 20 (62.5%) |
| 20 to 24 Years | 73 (69.5%) | 14 (19.2%) |
| 25 to 29 Years | 24 (64.9%) | 0 (0.0%) |
| 30 to 34 Years | 103 (68.2%) | 0 (0.0%) |
| 35 to 44 Years | 318 (91.9%) | 23 (7.2%) |
| 45 to 54 Years | 172 (57.1%) | 37 (21.5%) |
| 55 to 59 Years | 184 (88.0%) | 52 (28.3%) |
| 60 to 64 Years | 89 (100.0%) | 0 (0.0%) |
| 65 to 74 Years | 52 (31.7%) | 0 (0.0%) |
| 75 Years and over | 0 (0.0%) | 0 (0.0%) |
| Total | 1,047 (59.3%) | 146 (13.9%) |
Employment Status by Educational Attainment in Jal
According to labor force statistics for Jal, 78.6% of individuals (891) out of the total population between 25 and 64 years of age (1,133) are in the labor force, with 12.6% or 112 of them being unemployed. The group with the highest labor force participation rate are those with the educational attainment of bachelor's degree or higher, with 100.0% or 182 individuals in the labor force. Within the labor force, individuals with less than high school education have the highest percentage of unemployment, with 24.3% or 52 of them being unemployed.
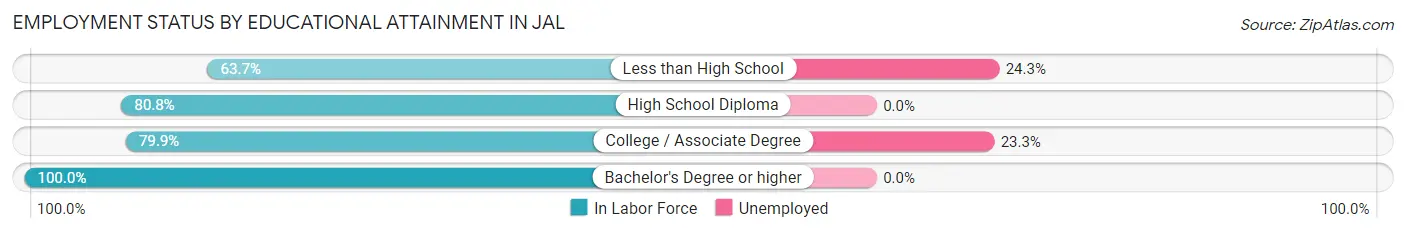
| Educational Attainment | In Labor Force | Unemployed |
| Less than High School | 214 (63.7%) | 82 (24.3%) |
| High School Diploma | 236 (80.8%) | 0 (0.0%) |
| College / Associate Degree | 258 (79.9%) | 75 (23.3%) |
| Bachelor's Degree or higher | 182 (100.0%) | 0 (0.0%) |
| Total | 891 (78.6%) | 143 (12.6%) |
Employment Occupations by Sex in Jal
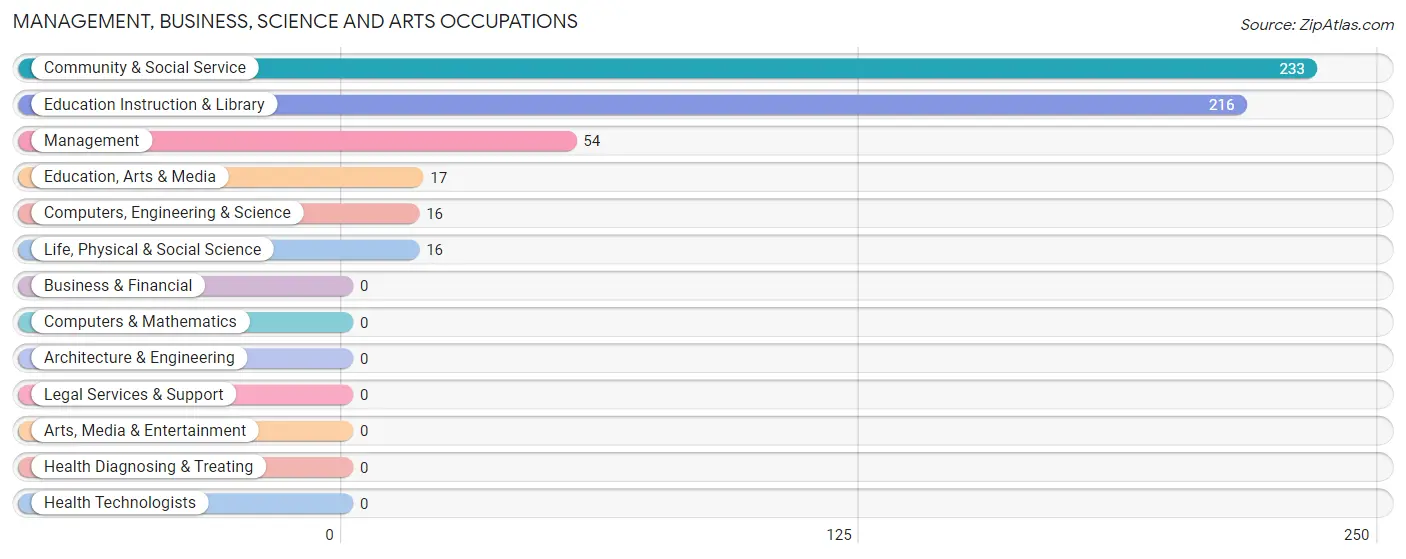
Management, Business, Science and Arts Occupations
The most common Management, Business, Science and Arts occupations in Jal are Community & Social Service (233 | 25.9%), Education Instruction & Library (216 | 24.0%), Management (54 | 6.0%), Education, Arts & Media (17 | 1.9%), and Computers, Engineering & Science (16 | 1.8%).
Management, Business, Science and Arts Occupations by Sex
Within the Management, Business, Science and Arts occupations in Jal, the most male-oriented occupations are Computers, Engineering & Science (100.0%), Life, Physical & Social Science (100.0%), and Management (74.1%), while the most female-oriented occupations are Education, Arts & Media (100.0%), Community & Social Service (52.8%), and Education Instruction & Library (49.1%).
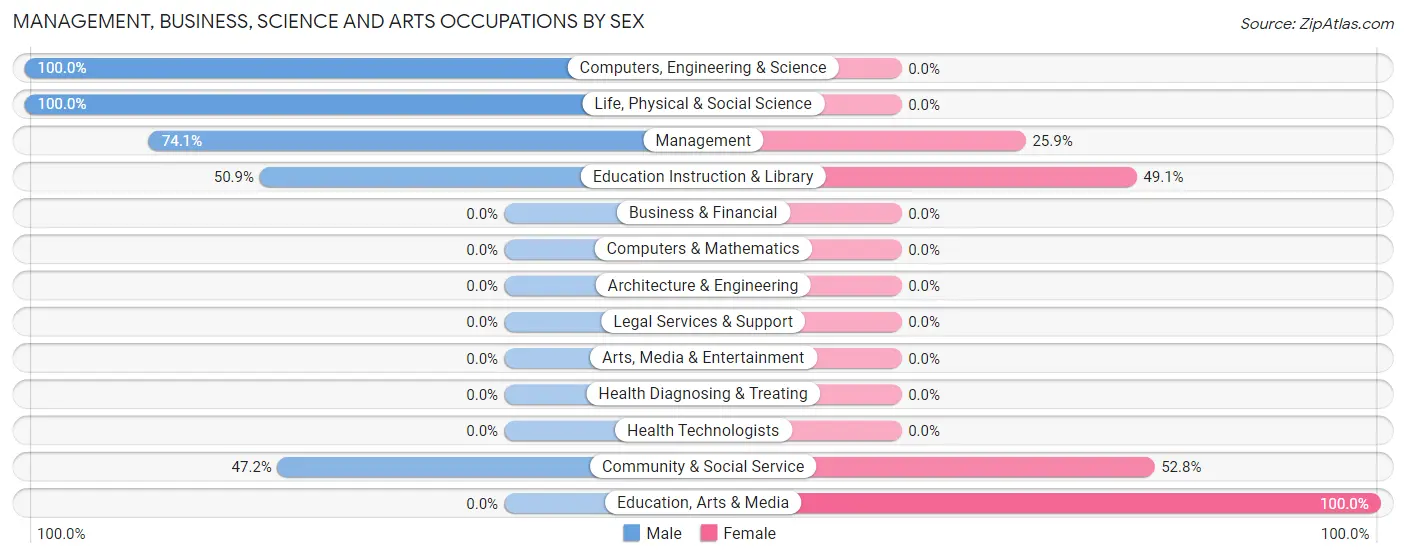
| Occupation | Male | Female |
| Management | 40 (74.1%) | 14 (25.9%) |
| Business & Financial | 0 (0.0%) | 0 (0.0%) |
| Computers, Engineering & Science | 16 (100.0%) | 0 (0.0%) |
| Computers & Mathematics | 0 (0.0%) | 0 (0.0%) |
| Architecture & Engineering | 0 (0.0%) | 0 (0.0%) |
| Life, Physical & Social Science | 16 (100.0%) | 0 (0.0%) |
| Community & Social Service | 110 (47.2%) | 123 (52.8%) |
| Education, Arts & Media | 0 (0.0%) | 17 (100.0%) |
| Legal Services & Support | 0 (0.0%) | 0 (0.0%) |
| Education Instruction & Library | 110 (50.9%) | 106 (49.1%) |
| Arts, Media & Entertainment | 0 (0.0%) | 0 (0.0%) |
| Health Diagnosing & Treating | 0 (0.0%) | 0 (0.0%) |
| Health Technologists | 0 (0.0%) | 0 (0.0%) |
| Total (Category) | 166 (54.8%) | 137 (45.2%) |
| Total (Overall) | 623 (69.2%) | 278 (30.8%) |
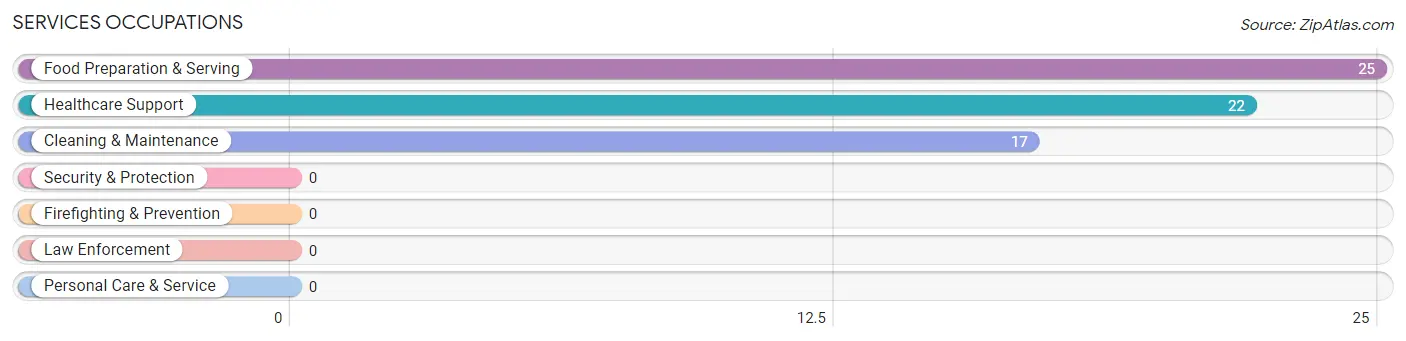
Services Occupations
The most common Services occupations in Jal are Food Preparation & Serving (25 | 2.8%), Healthcare Support (22 | 2.4%), and Cleaning & Maintenance (17 | 1.9%).
Services Occupations by Sex
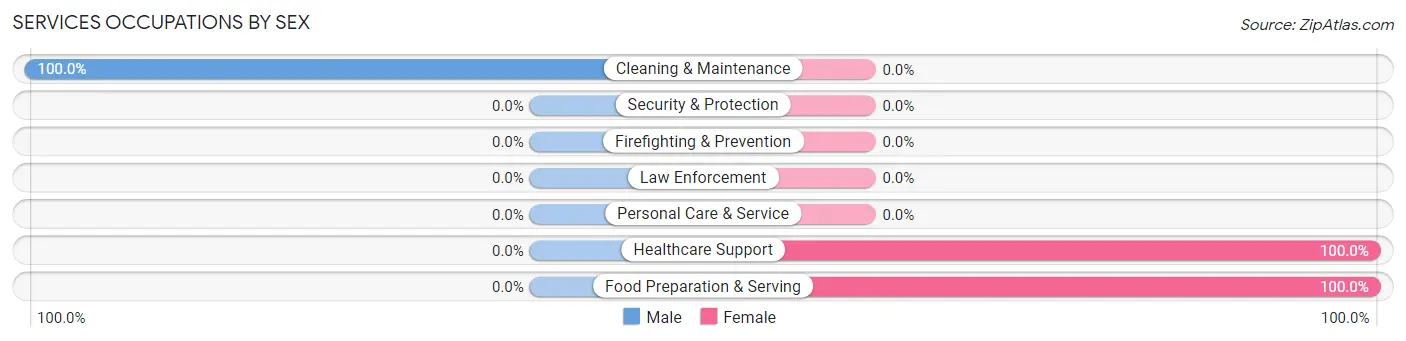
| Occupation | Male | Female |
| Healthcare Support | 0 (0.0%) | 22 (100.0%) |
| Security & Protection | 0 (0.0%) | 0 (0.0%) |
| Firefighting & Prevention | 0 (0.0%) | 0 (0.0%) |
| Law Enforcement | 0 (0.0%) | 0 (0.0%) |
| Food Preparation & Serving | 0 (0.0%) | 25 (100.0%) |
| Cleaning & Maintenance | 17 (100.0%) | 0 (0.0%) |
| Personal Care & Service | 0 (0.0%) | 0 (0.0%) |
| Total (Category) | 17 (26.6%) | 47 (73.4%) |
| Total (Overall) | 623 (69.2%) | 278 (30.8%) |
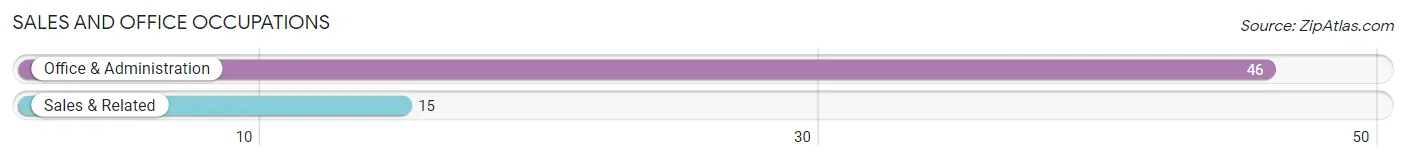
Sales and Office Occupations
The most common Sales and Office occupations in Jal are Office & Administration (46 | 5.1%), and Sales & Related (15 | 1.7%).
Sales and Office Occupations by Sex
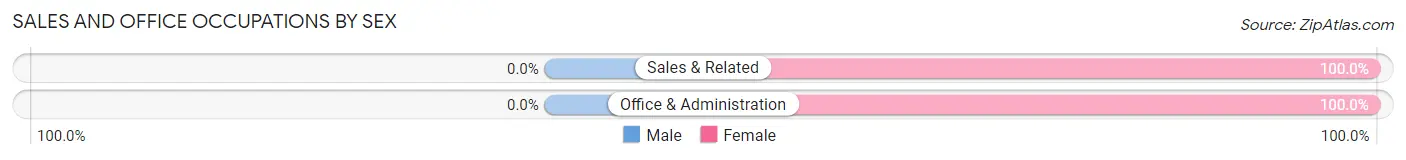
| Occupation | Male | Female |
| Sales & Related | 0 (0.0%) | 15 (100.0%) |
| Office & Administration | 0 (0.0%) | 46 (100.0%) |
| Total (Category) | 0 (0.0%) | 61 (100.0%) |
| Total (Overall) | 623 (69.2%) | 278 (30.8%) |
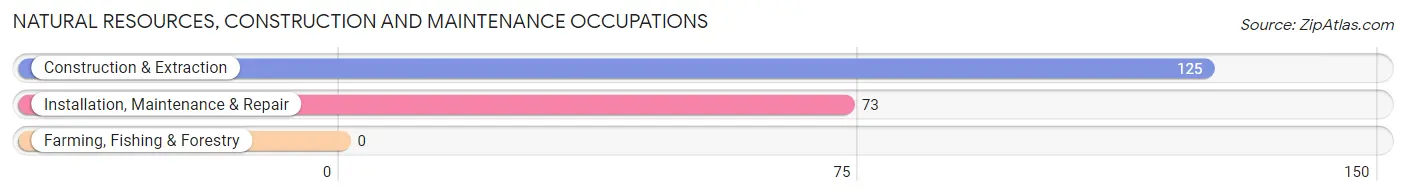
Natural Resources, Construction and Maintenance Occupations
The most common Natural Resources, Construction and Maintenance occupations in Jal are Construction & Extraction (125 | 13.9%), and Installation, Maintenance & Repair (73 | 8.1%).
Natural Resources, Construction and Maintenance Occupations by Sex
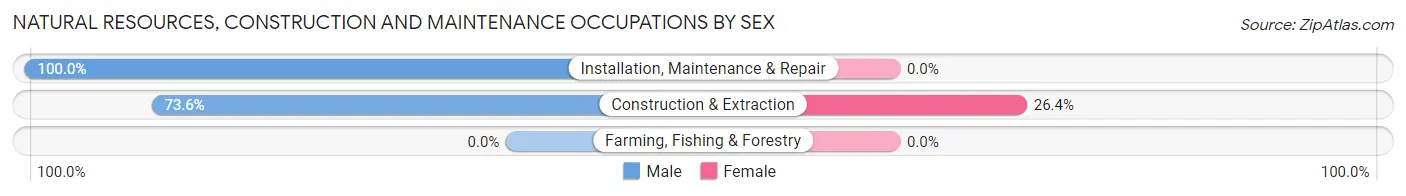
| Occupation | Male | Female |
| Farming, Fishing & Forestry | 0 (0.0%) | 0 (0.0%) |
| Construction & Extraction | 92 (73.6%) | 33 (26.4%) |
| Installation, Maintenance & Repair | 73 (100.0%) | 0 (0.0%) |
| Total (Category) | 165 (83.3%) | 33 (16.7%) |
| Total (Overall) | 623 (69.2%) | 278 (30.8%) |
Production, Transportation and Moving Occupations
The most common Production, Transportation and Moving occupations in Jal are Transportation (169 | 18.8%), Production (66 | 7.3%), and Material Moving (40 | 4.4%).
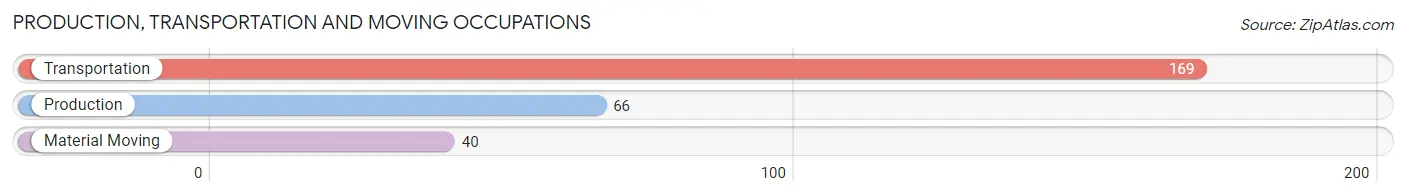
Production, Transportation and Moving Occupations by Sex
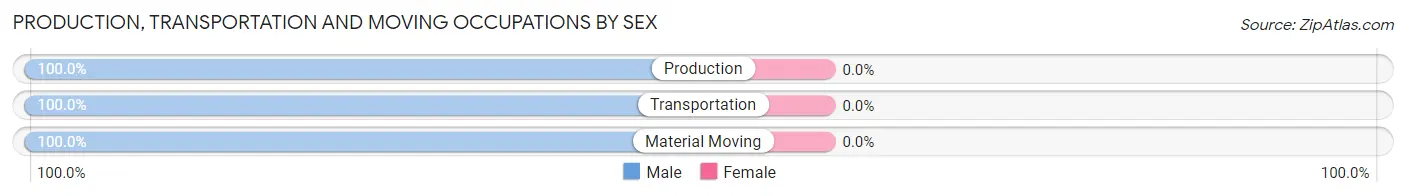
| Occupation | Male | Female |
| Production | 66 (100.0%) | 0 (0.0%) |
| Transportation | 169 (100.0%) | 0 (0.0%) |
| Material Moving | 40 (100.0%) | 0 (0.0%) |
| Total (Category) | 275 (100.0%) | 0 (0.0%) |
| Total (Overall) | 623 (69.2%) | 278 (30.8%) |
Employment Industries by Sex in Jal
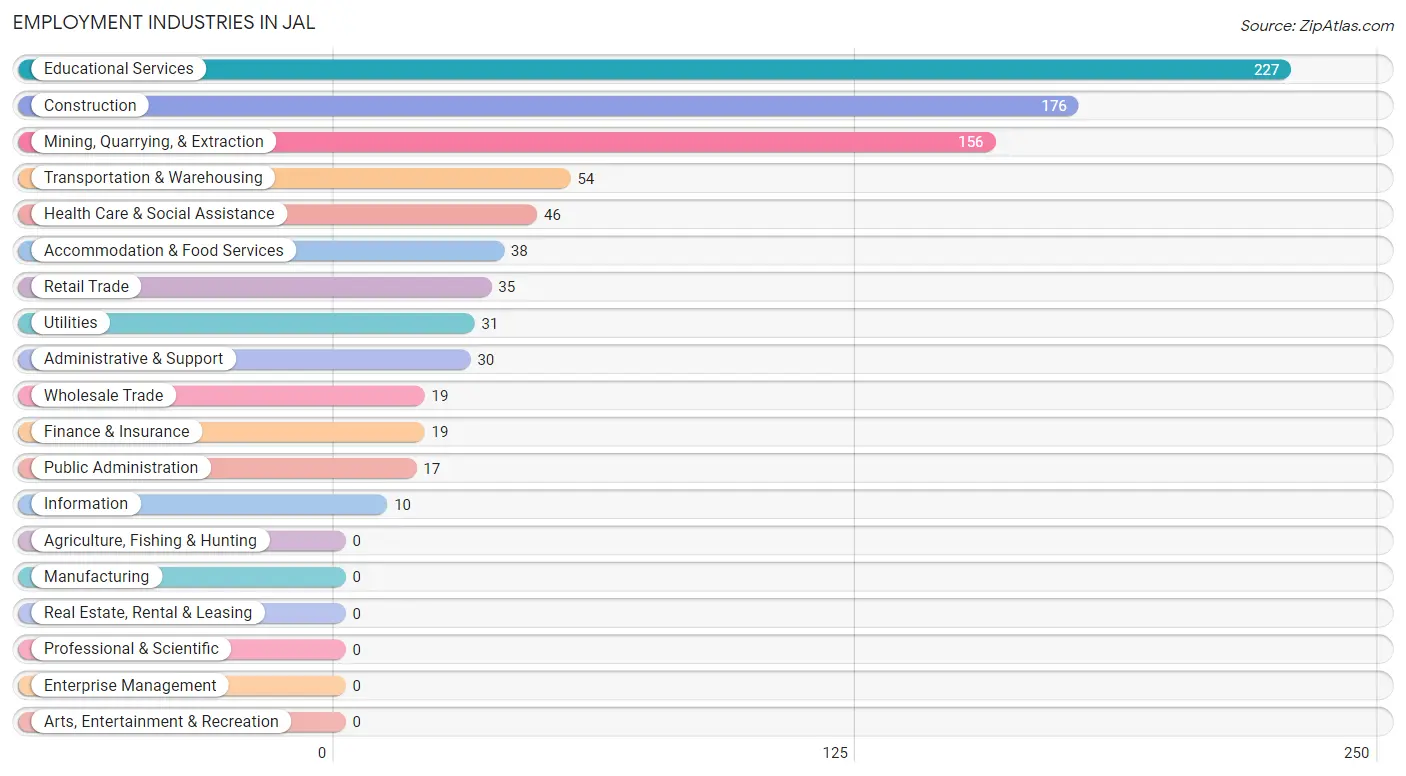
Employment Industries in Jal
The major employment industries in Jal include Educational Services (227 | 25.2%), Construction (176 | 19.5%), Mining, Quarrying, & Extraction (156 | 17.3%), Transportation & Warehousing (54 | 6.0%), and Health Care & Social Assistance (46 | 5.1%).
Employment Industries by Sex in Jal
The Jal industries that see more men than women are Mining, Quarrying, & Extraction (100.0%), Wholesale Trade (100.0%), and Transportation & Warehousing (100.0%), whereas the industries that tend to have a higher number of women are Finance & Insurance (100.0%), Accommodation & Food Services (100.0%), and Public Administration (100.0%).
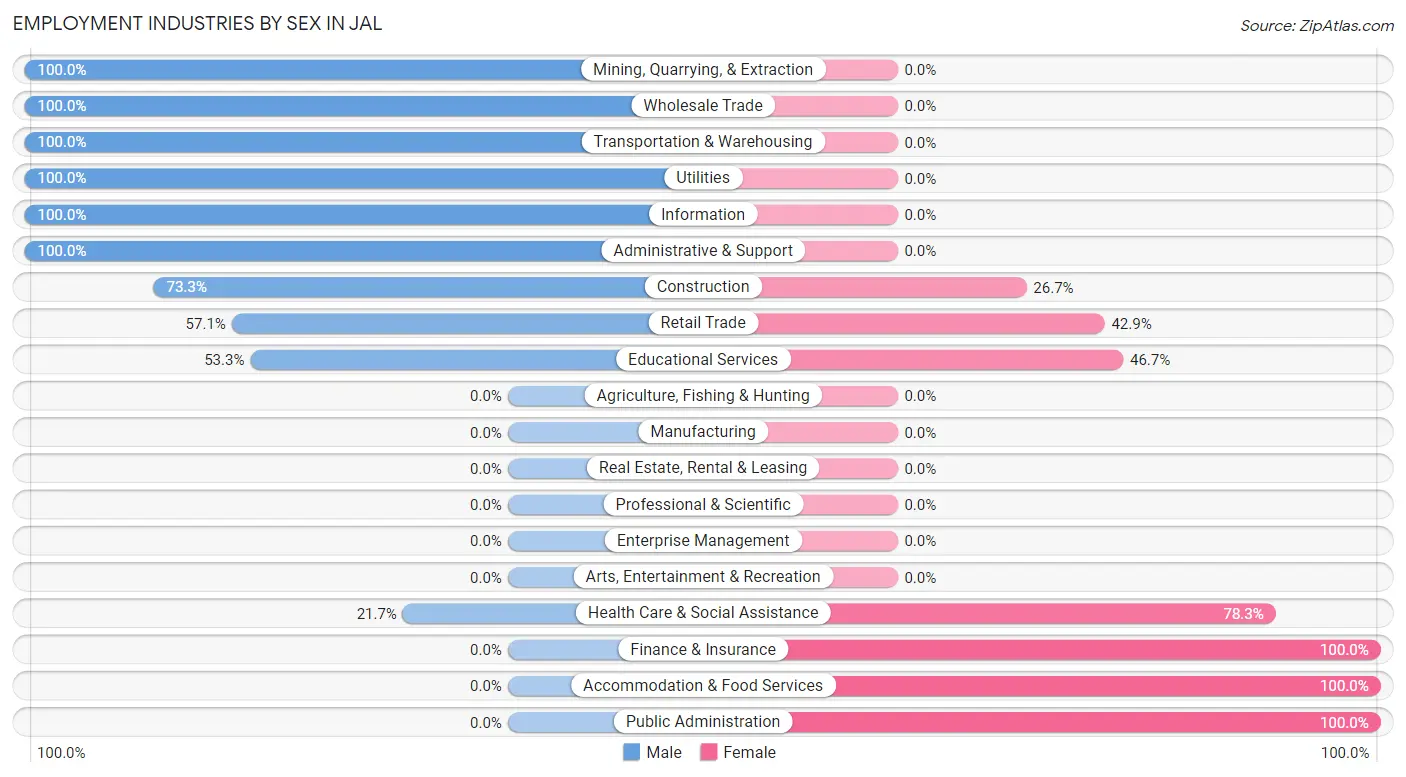
| Industry | Male | Female |
| Agriculture, Fishing & Hunting | 0 (0.0%) | 0 (0.0%) |
| Mining, Quarrying, & Extraction | 156 (100.0%) | 0 (0.0%) |
| Construction | 129 (73.3%) | 47 (26.7%) |
| Manufacturing | 0 (0.0%) | 0 (0.0%) |
| Wholesale Trade | 19 (100.0%) | 0 (0.0%) |
| Retail Trade | 20 (57.1%) | 15 (42.9%) |
| Transportation & Warehousing | 54 (100.0%) | 0 (0.0%) |
| Utilities | 31 (100.0%) | 0 (0.0%) |
| Information | 10 (100.0%) | 0 (0.0%) |
| Finance & Insurance | 0 (0.0%) | 19 (100.0%) |
| Real Estate, Rental & Leasing | 0 (0.0%) | 0 (0.0%) |
| Professional & Scientific | 0 (0.0%) | 0 (0.0%) |
| Enterprise Management | 0 (0.0%) | 0 (0.0%) |
| Administrative & Support | 30 (100.0%) | 0 (0.0%) |
| Educational Services | 121 (53.3%) | 106 (46.7%) |
| Health Care & Social Assistance | 10 (21.7%) | 36 (78.3%) |
| Arts, Entertainment & Recreation | 0 (0.0%) | 0 (0.0%) |
| Accommodation & Food Services | 0 (0.0%) | 38 (100.0%) |
| Public Administration | 0 (0.0%) | 17 (100.0%) |
| Total | 623 (69.2%) | 278 (30.8%) |
Education in Jal
School Enrollment in Jal
The most common levels of schooling among the 613 students in Jal are high school (235 | 38.3%), middle school (163 | 26.6%), and college / undergraduate (86 | 14.0%).
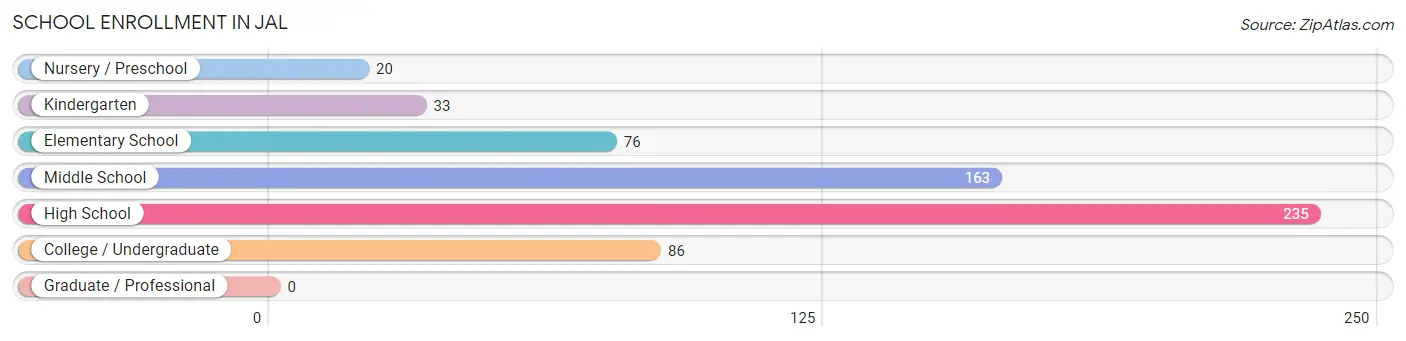
| School Level | # Students | % Students |
| Nursery / Preschool | 20 | 3.3% |
| Kindergarten | 33 | 5.4% |
| Elementary School | 76 | 12.4% |
| Middle School | 163 | 26.6% |
| High School | 235 | 38.3% |
| College / Undergraduate | 86 | 14.0% |
| Graduate / Professional | 0 | 0.0% |
| Total | 613 | 100.0% |
School Enrollment by Age by Funding Source in Jal
Out of a total of 613 students who are enrolled in schools in Jal, 74 (12.1%) attend a private institution, while the remaining 539 (87.9%) are enrolled in public schools. The age group of 15 to 17 year olds has the highest likelihood of being enrolled in private schools, with 74 (33.5% in the age bracket) enrolled. Conversely, the age group of 3 to 4 year olds has the lowest likelihood of being enrolled in a private school, with 20 (100.0% in the age bracket) attending a public institution.
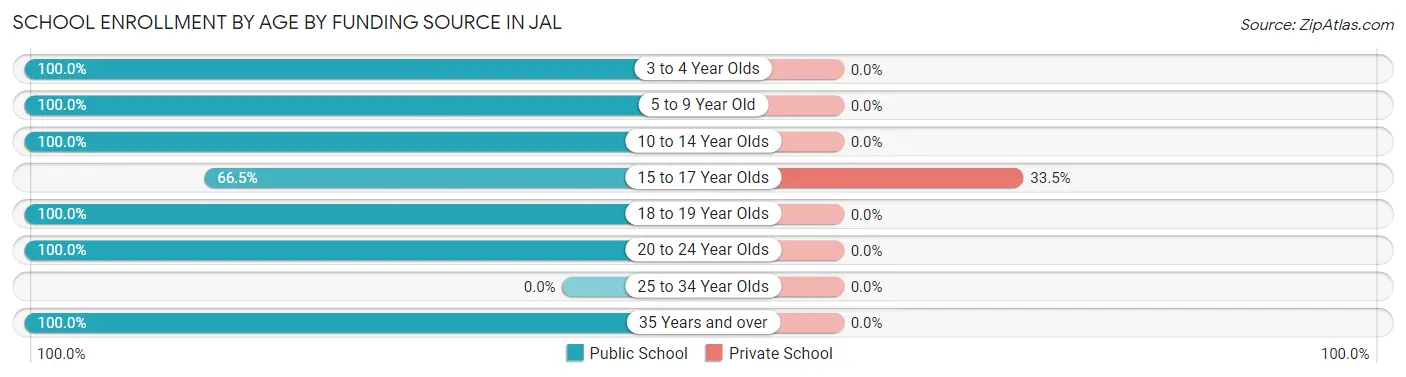
| Age Bracket | Public School | Private School |
| 3 to 4 Year Olds | 20 (100.0%) | 0 (0.0%) |
| 5 to 9 Year Old | 97 (100.0%) | 0 (0.0%) |
| 10 to 14 Year Olds | 182 (100.0%) | 0 (0.0%) |
| 15 to 17 Year Olds | 147 (66.5%) | 74 (33.5%) |
| 18 to 19 Year Olds | 39 (100.0%) | 0 (0.0%) |
| 20 to 24 Year Olds | 32 (100.0%) | 0 (0.0%) |
| 25 to 34 Year Olds | 0 (0.0%) | 0 (0.0%) |
| 35 Years and over | 22 (100.0%) | 0 (0.0%) |
| Total | 539 (87.9%) | 74 (12.1%) |
Educational Attainment by Field of Study in Jal
Arts & humanities (132 | 60.3%), education (49 | 22.4%), business (33 | 15.1%), and liberal arts & history (5 | 2.3%) are the most common fields of study among 219 individuals in Jal who have obtained a bachelor's degree or higher.
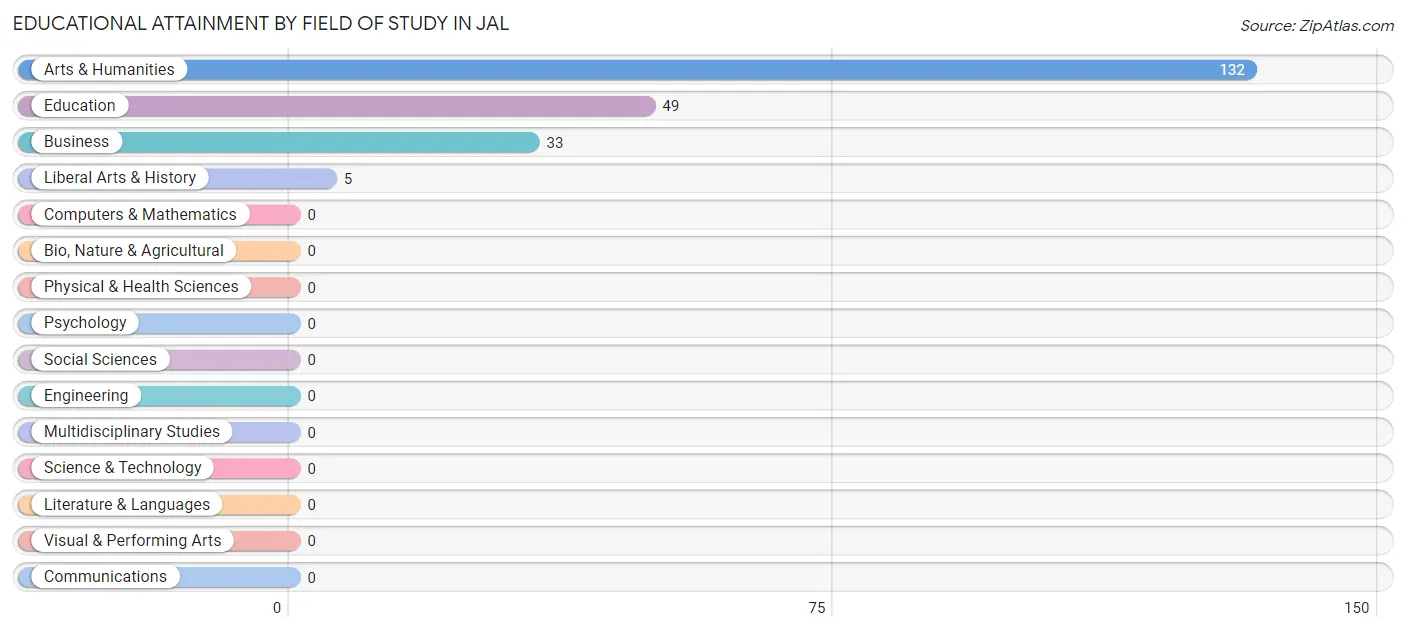
| Field of Study | # Graduates | % Graduates |
| Computers & Mathematics | 0 | 0.0% |
| Bio, Nature & Agricultural | 0 | 0.0% |
| Physical & Health Sciences | 0 | 0.0% |
| Psychology | 0 | 0.0% |
| Social Sciences | 0 | 0.0% |
| Engineering | 0 | 0.0% |
| Multidisciplinary Studies | 0 | 0.0% |
| Science & Technology | 0 | 0.0% |
| Business | 33 | 15.1% |
| Education | 49 | 22.4% |
| Literature & Languages | 0 | 0.0% |
| Liberal Arts & History | 5 | 2.3% |
| Visual & Performing Arts | 0 | 0.0% |
| Communications | 0 | 0.0% |
| Arts & Humanities | 132 | 60.3% |
| Total | 219 | 100.0% |
Transportation & Commute in Jal
Vehicle Availability by Sex in Jal
The most prevalent vehicle ownership categories in Jal are males with 2 vehicles (328, accounting for 52.6%) and females with 2 vehicles (190, making up 118.0%).
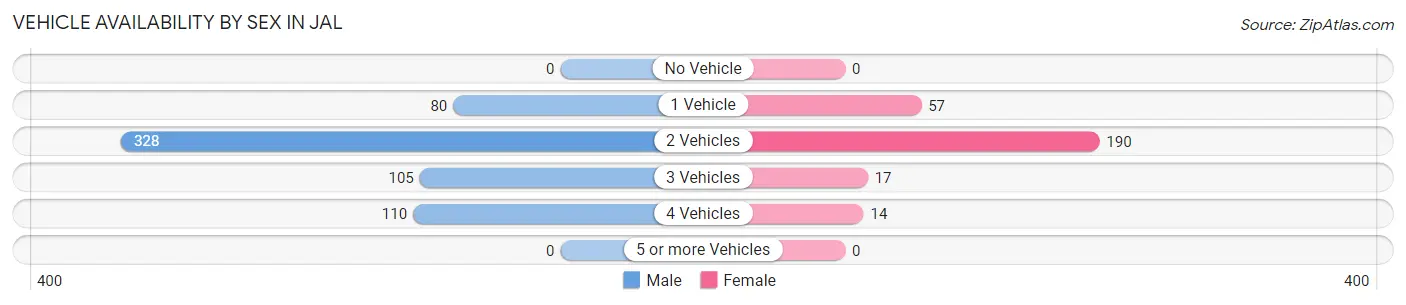
| Vehicles Available | Male | Female |
| No Vehicle | 0 (0.0%) | 0 (0.0%) |
| 1 Vehicle | 80 (12.8%) | 57 (20.5%) |
| 2 Vehicles | 328 (52.6%) | 190 (68.3%) |
| 3 Vehicles | 105 (16.9%) | 17 (6.1%) |
| 4 Vehicles | 110 (17.7%) | 14 (5.0%) |
| 5 or more Vehicles | 0 (0.0%) | 0 (0.0%) |
| Total | 623 (100.0%) | 278 (100.0%) |
Commute Time in Jal
The most frequently occuring commute durations in Jal are 5 to 9 minutes (424 commuters, 51.7%), 30 to 34 minutes (146 commuters, 17.8%), and 45 to 59 minutes (95 commuters, 11.6%).
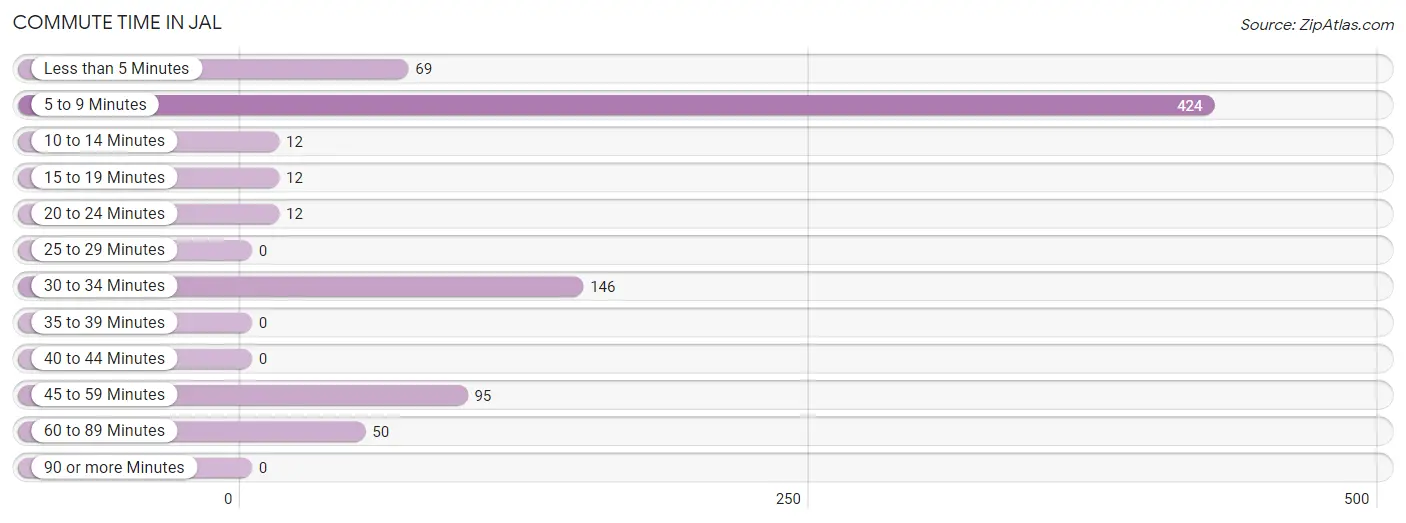
| Commute Time | # Commuters | % Commuters |
| Less than 5 Minutes | 69 | 8.4% |
| 5 to 9 Minutes | 424 | 51.7% |
| 10 to 14 Minutes | 12 | 1.5% |
| 15 to 19 Minutes | 12 | 1.5% |
| 20 to 24 Minutes | 12 | 1.5% |
| 25 to 29 Minutes | 0 | 0.0% |
| 30 to 34 Minutes | 146 | 17.8% |
| 35 to 39 Minutes | 0 | 0.0% |
| 40 to 44 Minutes | 0 | 0.0% |
| 45 to 59 Minutes | 95 | 11.6% |
| 60 to 89 Minutes | 50 | 6.1% |
| 90 or more Minutes | 0 | 0.0% |
Commute Time by Sex in Jal
The most common commute times in Jal are 5 to 9 minutes (265 commuters, 45.6%) for males and 5 to 9 minutes (159 commuters, 66.5%) for females.
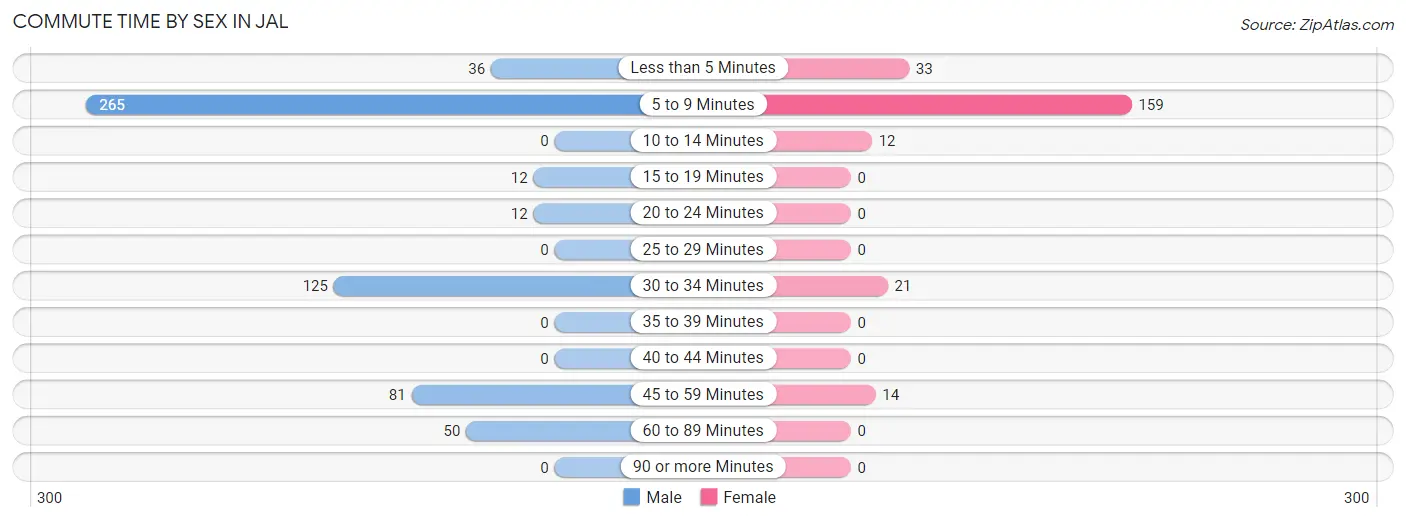
| Commute Time | Male | Female |
| Less than 5 Minutes | 36 (6.2%) | 33 (13.8%) |
| 5 to 9 Minutes | 265 (45.6%) | 159 (66.5%) |
| 10 to 14 Minutes | 0 (0.0%) | 12 (5.0%) |
| 15 to 19 Minutes | 12 (2.1%) | 0 (0.0%) |
| 20 to 24 Minutes | 12 (2.1%) | 0 (0.0%) |
| 25 to 29 Minutes | 0 (0.0%) | 0 (0.0%) |
| 30 to 34 Minutes | 125 (21.5%) | 21 (8.8%) |
| 35 to 39 Minutes | 0 (0.0%) | 0 (0.0%) |
| 40 to 44 Minutes | 0 (0.0%) | 0 (0.0%) |
| 45 to 59 Minutes | 81 (13.9%) | 14 (5.9%) |
| 60 to 89 Minutes | 50 (8.6%) | 0 (0.0%) |
| 90 or more Minutes | 0 (0.0%) | 0 (0.0%) |
Time of Departure to Work by Sex in Jal
The most frequent times of departure to work in Jal are 5:00 AM to 5:29 AM (155, 26.7%) for males and 8:00 AM to 8:29 AM (69, 28.9%) for females.
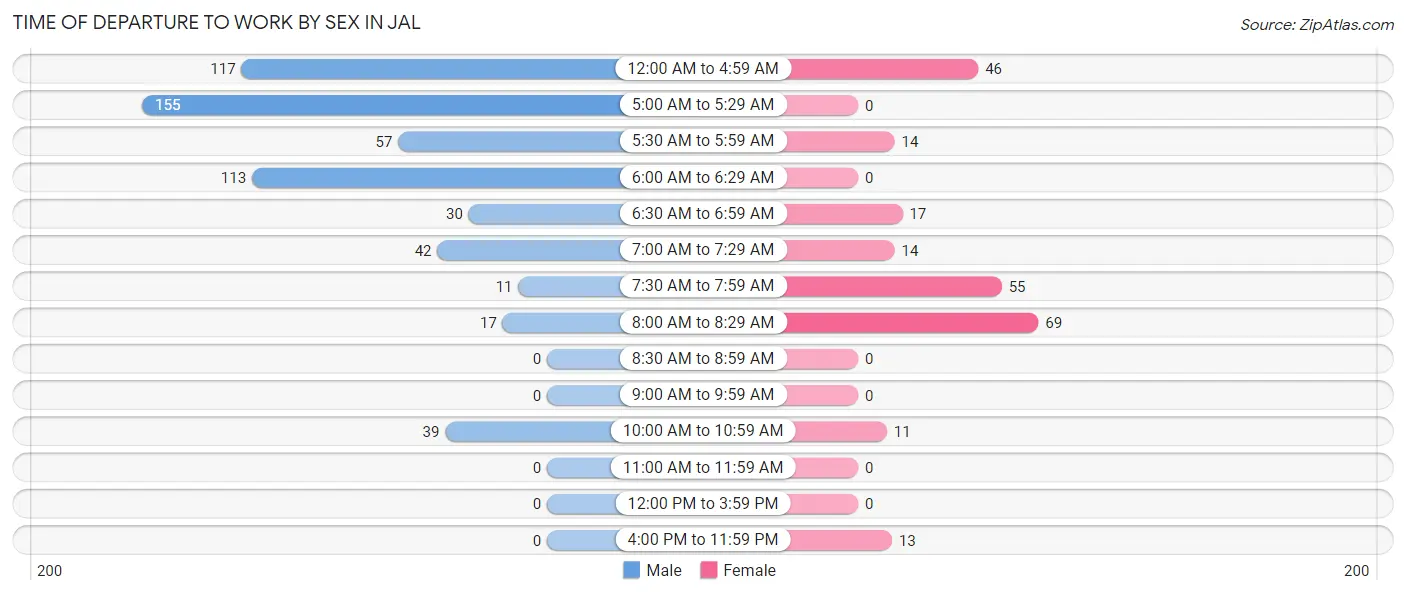
| Time of Departure | Male | Female |
| 12:00 AM to 4:59 AM | 117 (20.1%) | 46 (19.3%) |
| 5:00 AM to 5:29 AM | 155 (26.7%) | 0 (0.0%) |
| 5:30 AM to 5:59 AM | 57 (9.8%) | 14 (5.9%) |
| 6:00 AM to 6:29 AM | 113 (19.5%) | 0 (0.0%) |
| 6:30 AM to 6:59 AM | 30 (5.2%) | 17 (7.1%) |
| 7:00 AM to 7:29 AM | 42 (7.2%) | 14 (5.9%) |
| 7:30 AM to 7:59 AM | 11 (1.9%) | 55 (23.0%) |
| 8:00 AM to 8:29 AM | 17 (2.9%) | 69 (28.9%) |
| 8:30 AM to 8:59 AM | 0 (0.0%) | 0 (0.0%) |
| 9:00 AM to 9:59 AM | 0 (0.0%) | 0 (0.0%) |
| 10:00 AM to 10:59 AM | 39 (6.7%) | 11 (4.6%) |
| 11:00 AM to 11:59 AM | 0 (0.0%) | 0 (0.0%) |
| 12:00 PM to 3:59 PM | 0 (0.0%) | 0 (0.0%) |
| 4:00 PM to 11:59 PM | 0 (0.0%) | 13 (5.4%) |
| Total | 581 (100.0%) | 239 (100.0%) |
Housing Occupancy in Jal
Occupancy by Ownership in Jal
Of the total 822 dwellings in Jal, owner-occupied units account for 583 (70.9%), while renter-occupied units make up 239 (29.1%).
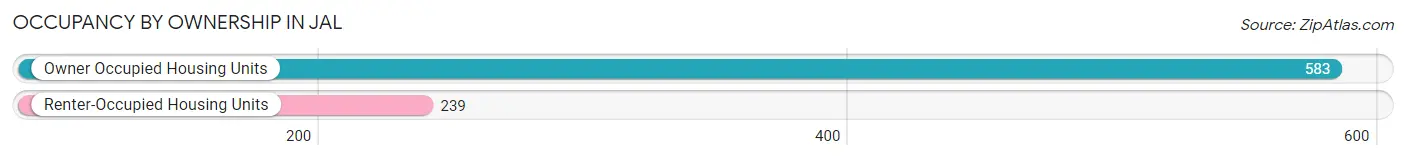
| Occupancy | # Housing Units | % Housing Units |
| Owner Occupied Housing Units | 583 | 70.9% |
| Renter-Occupied Housing Units | 239 | 29.1% |
| Total Occupied Housing Units | 822 | 100.0% |
Occupancy by Household Size in Jal
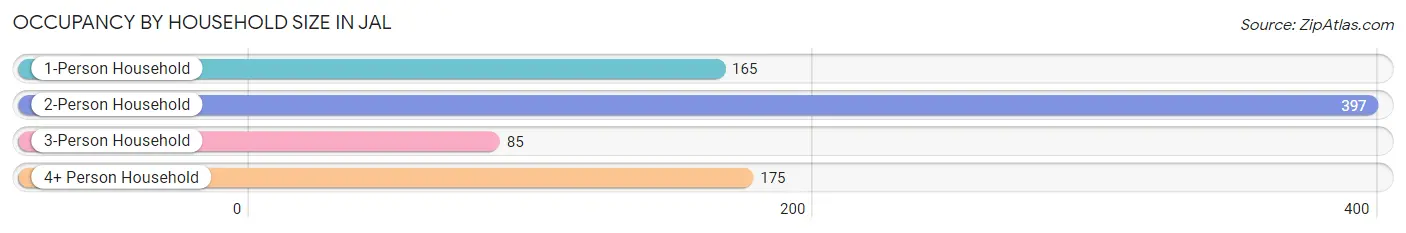
| Household Size | # Housing Units | % Housing Units |
| 1-Person Household | 165 | 20.1% |
| 2-Person Household | 397 | 48.3% |
| 3-Person Household | 85 | 10.3% |
| 4+ Person Household | 175 | 21.3% |
| Total Housing Units | 822 | 100.0% |
Occupancy by Ownership by Household Size in Jal
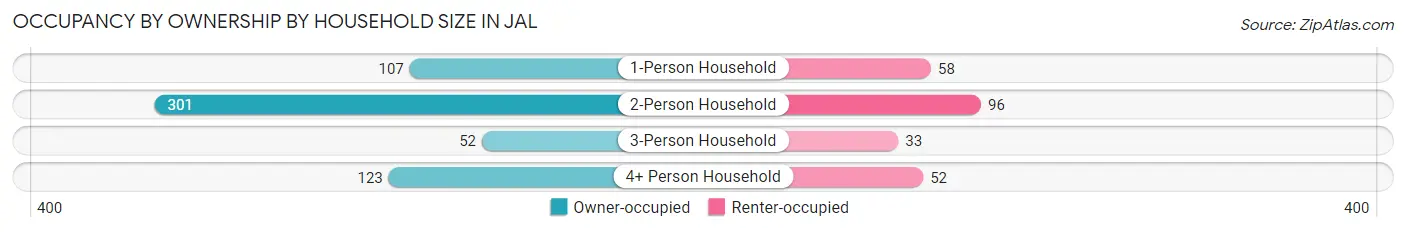
| Household Size | Owner-occupied | Renter-occupied |
| 1-Person Household | 107 (64.8%) | 58 (35.1%) |
| 2-Person Household | 301 (75.8%) | 96 (24.2%) |
| 3-Person Household | 52 (61.2%) | 33 (38.8%) |
| 4+ Person Household | 123 (70.3%) | 52 (29.7%) |
| Total Housing Units | 583 (70.9%) | 239 (29.1%) |
Occupancy by Educational Attainment in Jal
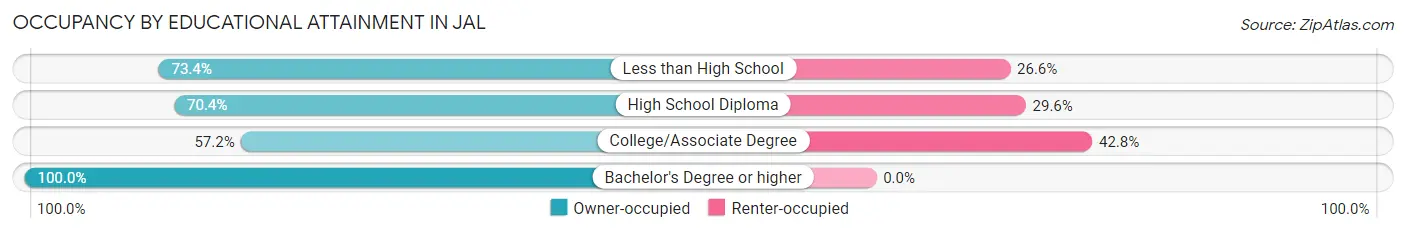
| Household Size | Owner-occupied | Renter-occupied |
| Less than High School | 188 (73.4%) | 68 (26.6%) |
| High School Diploma | 152 (70.4%) | 64 (29.6%) |
| College/Associate Degree | 143 (57.2%) | 107 (42.8%) |
| Bachelor's Degree or higher | 100 (100.0%) | 0 (0.0%) |
Occupancy by Age of Householder in Jal
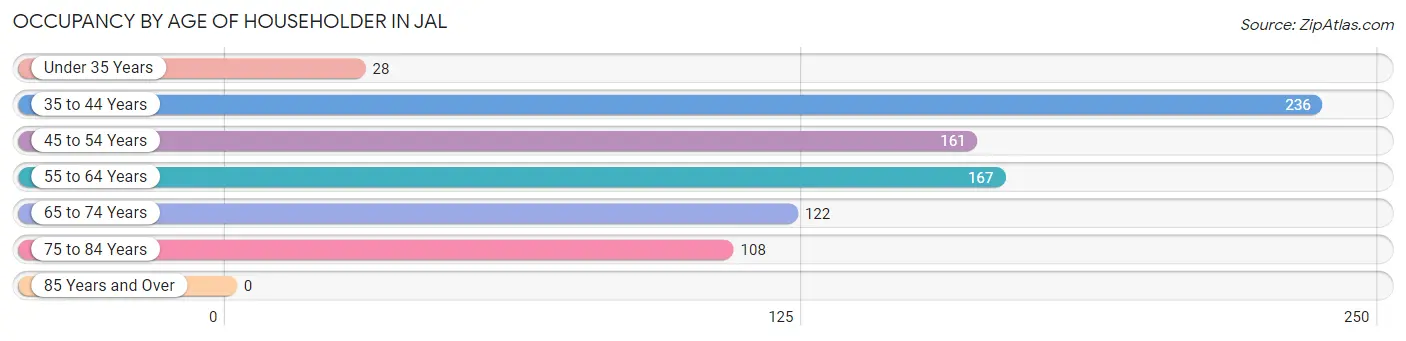
| Age Bracket | # Households | % Households |
| Under 35 Years | 28 | 3.4% |
| 35 to 44 Years | 236 | 28.7% |
| 45 to 54 Years | 161 | 19.6% |
| 55 to 64 Years | 167 | 20.3% |
| 65 to 74 Years | 122 | 14.8% |
| 75 to 84 Years | 108 | 13.1% |
| 85 Years and Over | 0 | 0.0% |
| Total | 822 | 100.0% |
Housing Finances in Jal
Median Income by Occupancy in Jal
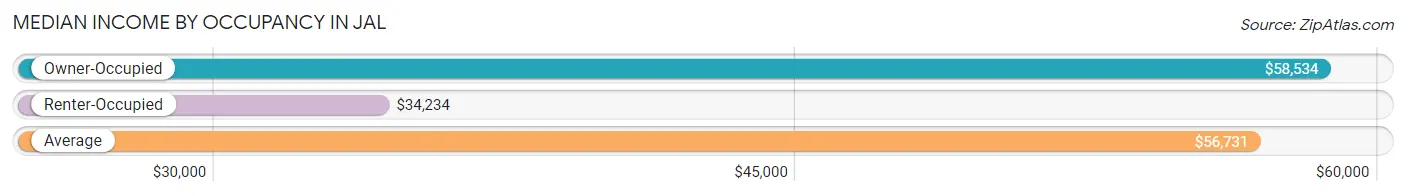
| Occupancy Type | # Households | Median Income |
| Owner-Occupied | 583 (70.9%) | $58,534 |
| Renter-Occupied | 239 (29.1%) | $34,234 |
| Average | 822 (100.0%) | $56,731 |
Occupancy by Householder Income Bracket in Jal
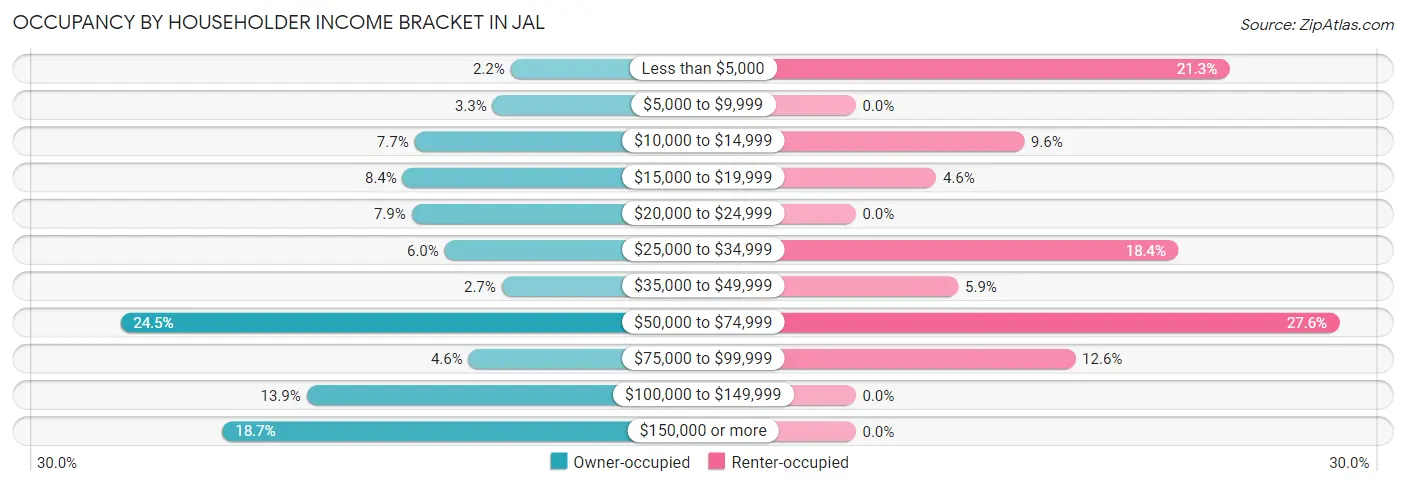
| Income Bracket | Owner-occupied | Renter-occupied |
| Less than $5,000 | 13 (2.2%) | 51 (21.3%) |
| $5,000 to $9,999 | 19 (3.3%) | 0 (0.0%) |
| $10,000 to $14,999 | 45 (7.7%) | 23 (9.6%) |
| $15,000 to $19,999 | 49 (8.4%) | 11 (4.6%) |
| $20,000 to $24,999 | 46 (7.9%) | 0 (0.0%) |
| $25,000 to $34,999 | 35 (6.0%) | 44 (18.4%) |
| $35,000 to $49,999 | 16 (2.7%) | 14 (5.9%) |
| $50,000 to $74,999 | 143 (24.5%) | 66 (27.6%) |
| $75,000 to $99,999 | 27 (4.6%) | 30 (12.6%) |
| $100,000 to $149,999 | 81 (13.9%) | 0 (0.0%) |
| $150,000 or more | 109 (18.7%) | 0 (0.0%) |
| Total | 583 (100.0%) | 239 (100.0%) |
Monthly Housing Cost Tiers in Jal
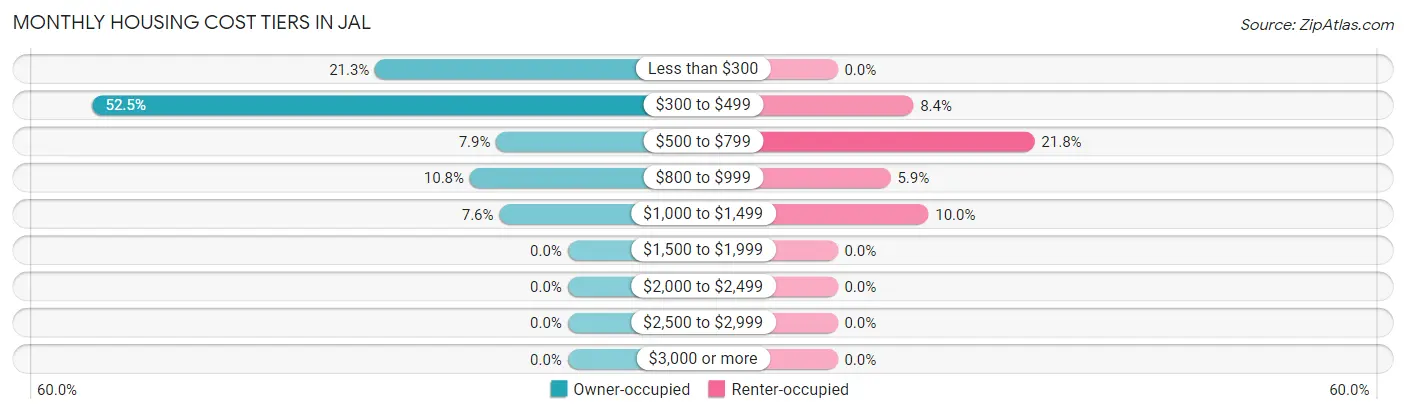
| Monthly Cost | Owner-occupied | Renter-occupied |
| Less than $300 | 124 (21.3%) | 0 (0.0%) |
| $300 to $499 | 306 (52.5%) | 20 (8.4%) |
| $500 to $799 | 46 (7.9%) | 52 (21.8%) |
| $800 to $999 | 63 (10.8%) | 14 (5.9%) |
| $1,000 to $1,499 | 44 (7.5%) | 24 (10.0%) |
| $1,500 to $1,999 | 0 (0.0%) | 0 (0.0%) |
| $2,000 to $2,499 | 0 (0.0%) | 0 (0.0%) |
| $2,500 to $2,999 | 0 (0.0%) | 0 (0.0%) |
| $3,000 or more | 0 (0.0%) | 0 (0.0%) |
| Total | 583 (100.0%) | 239 (100.0%) |
Physical Housing Characteristics in Jal
Housing Structures in Jal
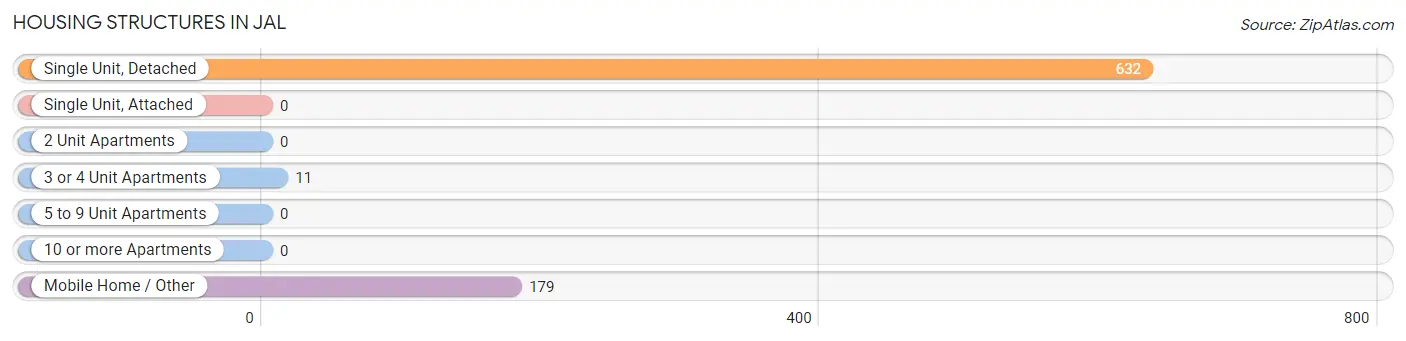
| Structure Type | # Housing Units | % Housing Units |
| Single Unit, Detached | 632 | 76.9% |
| Single Unit, Attached | 0 | 0.0% |
| 2 Unit Apartments | 0 | 0.0% |
| 3 or 4 Unit Apartments | 11 | 1.3% |
| 5 to 9 Unit Apartments | 0 | 0.0% |
| 10 or more Apartments | 0 | 0.0% |
| Mobile Home / Other | 179 | 21.8% |
| Total | 822 | 100.0% |
Housing Structures by Occupancy in Jal
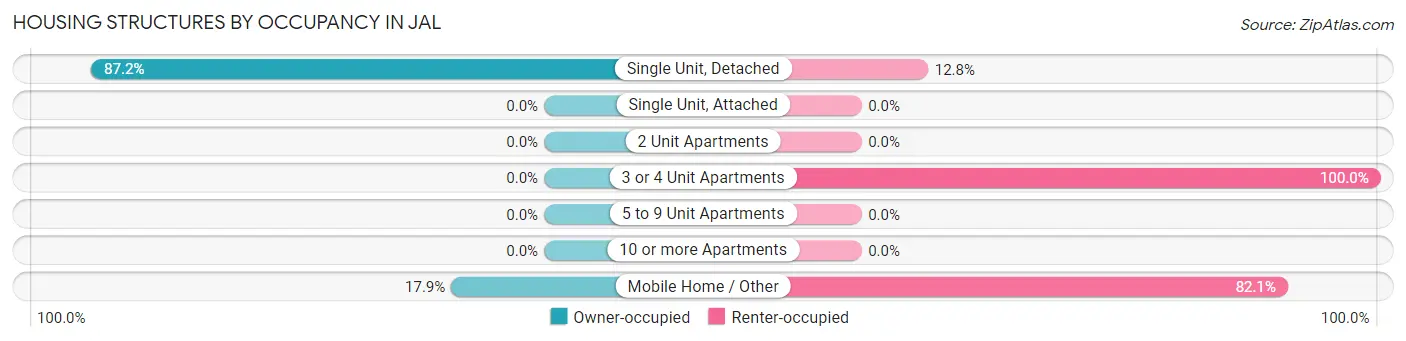
| Structure Type | Owner-occupied | Renter-occupied |
| Single Unit, Detached | 551 (87.2%) | 81 (12.8%) |
| Single Unit, Attached | 0 (0.0%) | 0 (0.0%) |
| 2 Unit Apartments | 0 (0.0%) | 0 (0.0%) |
| 3 or 4 Unit Apartments | 0 (0.0%) | 11 (100.0%) |
| 5 to 9 Unit Apartments | 0 (0.0%) | 0 (0.0%) |
| 10 or more Apartments | 0 (0.0%) | 0 (0.0%) |
| Mobile Home / Other | 32 (17.9%) | 147 (82.1%) |
| Total | 583 (70.9%) | 239 (29.1%) |
Housing Structures by Number of Rooms in Jal
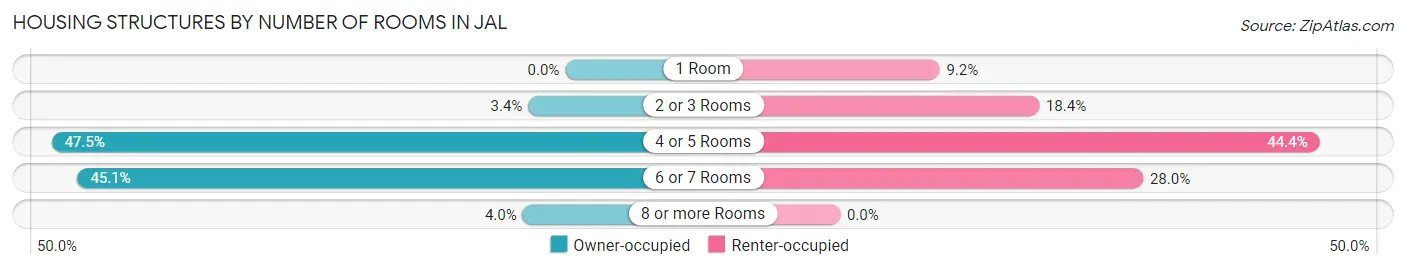
| Number of Rooms | Owner-occupied | Renter-occupied |
| 1 Room | 0 (0.0%) | 22 (9.2%) |
| 2 or 3 Rooms | 20 (3.4%) | 44 (18.4%) |
| 4 or 5 Rooms | 277 (47.5%) | 106 (44.4%) |
| 6 or 7 Rooms | 263 (45.1%) | 67 (28.0%) |
| 8 or more Rooms | 23 (4.0%) | 0 (0.0%) |
| Total | 583 (100.0%) | 239 (100.0%) |
Housing Structure by Heating Type in Jal
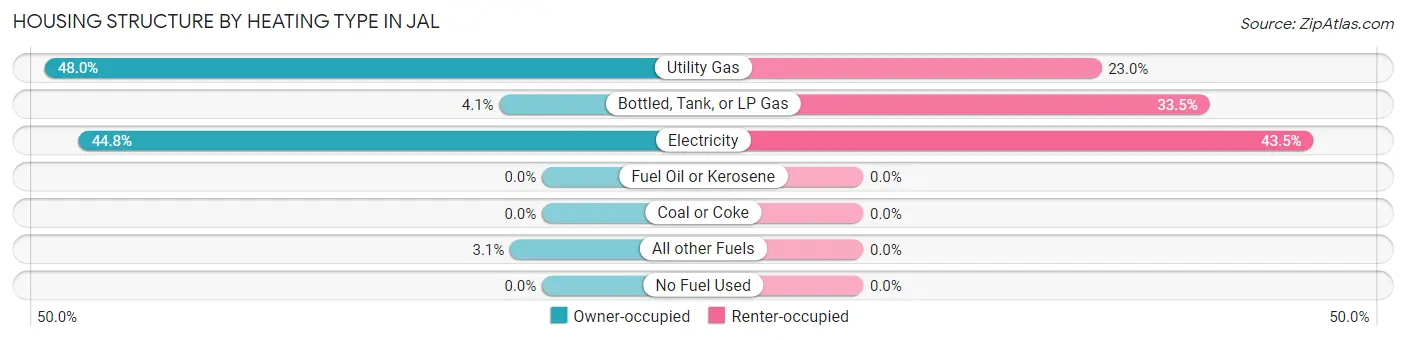
| Heating Type | Owner-occupied | Renter-occupied |
| Utility Gas | 280 (48.0%) | 55 (23.0%) |
| Bottled, Tank, or LP Gas | 24 (4.1%) | 80 (33.5%) |
| Electricity | 261 (44.8%) | 104 (43.5%) |
| Fuel Oil or Kerosene | 0 (0.0%) | 0 (0.0%) |
| Coal or Coke | 0 (0.0%) | 0 (0.0%) |
| All other Fuels | 18 (3.1%) | 0 (0.0%) |
| No Fuel Used | 0 (0.0%) | 0 (0.0%) |
| Total | 583 (100.0%) | 239 (100.0%) |
Household Vehicle Usage in Jal
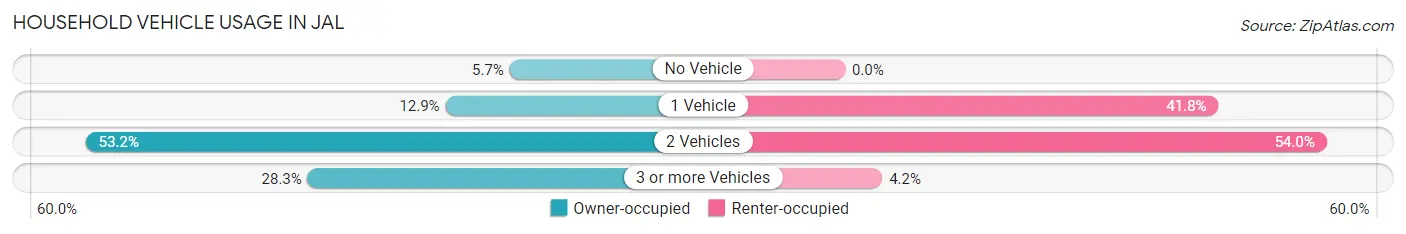
| Vehicles per Household | Owner-occupied | Renter-occupied |
| No Vehicle | 33 (5.7%) | 0 (0.0%) |
| 1 Vehicle | 75 (12.9%) | 100 (41.8%) |
| 2 Vehicles | 310 (53.2%) | 129 (54.0%) |
| 3 or more Vehicles | 165 (28.3%) | 10 (4.2%) |
| Total | 583 (100.0%) | 239 (100.0%) |
Real Estate & Mortgages in Jal
Real Estate and Mortgage Overview in Jal
| Characteristic | Without Mortgage | With Mortgage |
| Housing Units | 508 | 75 |
| Median Property Value | $115,800 | $107,900 |
| Median Household Income | $57,747 | $0 |
| Monthly Housing Costs | $384 | $0 |
| Real Estate Taxes | $339 | $0 |
Property Value by Mortgage Status in Jal
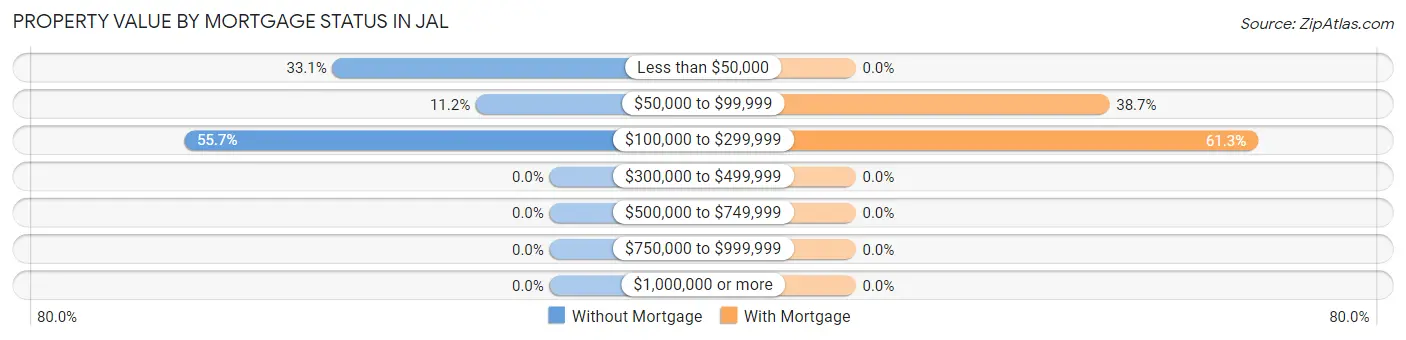
| Property Value | Without Mortgage | With Mortgage |
| Less than $50,000 | 168 (33.1%) | 0 (0.0%) |
| $50,000 to $99,999 | 57 (11.2%) | 29 (38.7%) |
| $100,000 to $299,999 | 283 (55.7%) | 46 (61.3%) |
| $300,000 to $499,999 | 0 (0.0%) | 0 (0.0%) |
| $500,000 to $749,999 | 0 (0.0%) | 0 (0.0%) |
| $750,000 to $999,999 | 0 (0.0%) | 0 (0.0%) |
| $1,000,000 or more | 0 (0.0%) | 0 (0.0%) |
| Total | 508 (100.0%) | 75 (100.0%) |
Household Income by Mortgage Status in Jal
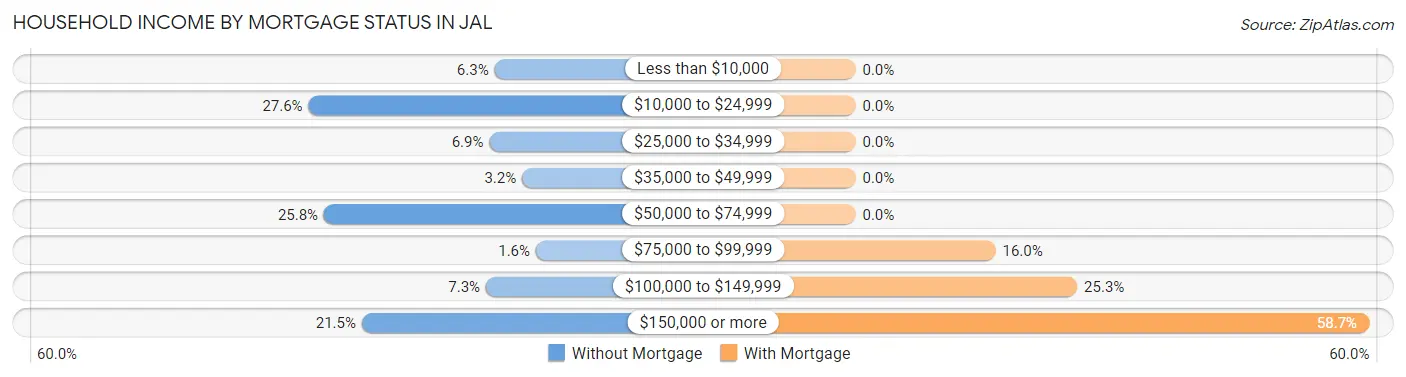
| Household Income | Without Mortgage | With Mortgage |
| Less than $10,000 | 32 (6.3%) | 0 (0.0%) |
| $10,000 to $24,999 | 140 (27.6%) | 0 (0.0%) |
| $25,000 to $34,999 | 35 (6.9%) | 0 (0.0%) |
| $35,000 to $49,999 | 16 (3.2%) | 0 (0.0%) |
| $50,000 to $74,999 | 131 (25.8%) | 0 (0.0%) |
| $75,000 to $99,999 | 8 (1.6%) | 12 (16.0%) |
| $100,000 to $149,999 | 37 (7.3%) | 19 (25.3%) |
| $150,000 or more | 109 (21.5%) | 44 (58.7%) |
| Total | 508 (100.0%) | 75 (100.0%) |
Property Value to Household Income Ratio in Jal
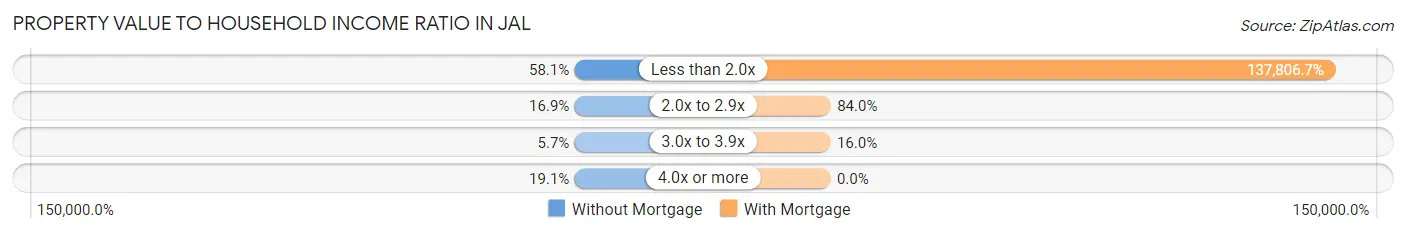
| Value-to-Income Ratio | Without Mortgage | With Mortgage |
| Less than 2.0x | 295 (58.1%) | 103,355 (137,806.7%) |
| 2.0x to 2.9x | 86 (16.9%) | 63 (84.0%) |
| 3.0x to 3.9x | 29 (5.7%) | 12 (16.0%) |
| 4.0x or more | 97 (19.1%) | 0 (0.0%) |
| Total | 508 (100.0%) | 75 (100.0%) |
Real Estate Taxes by Mortgage Status in Jal
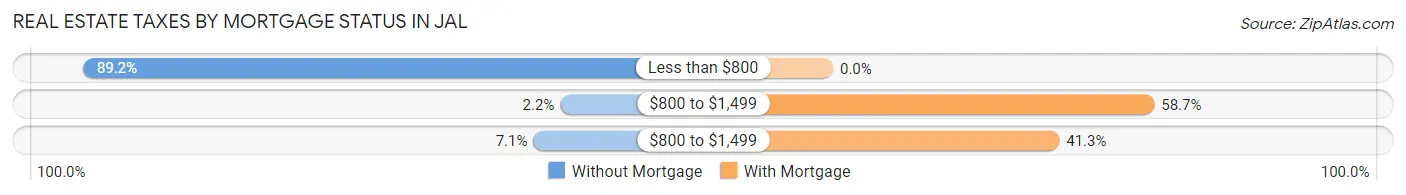
| Property Taxes | Without Mortgage | With Mortgage |
| Less than $800 | 453 (89.2%) | 0 (0.0%) |
| $800 to $1,499 | 11 (2.2%) | 44 (58.7%) |
| $800 to $1,499 | 36 (7.1%) | 31 (41.3%) |
| Total | 508 (100.0%) | 75 (100.0%) |
Health & Disability in Jal
Health Insurance Coverage by Age in Jal
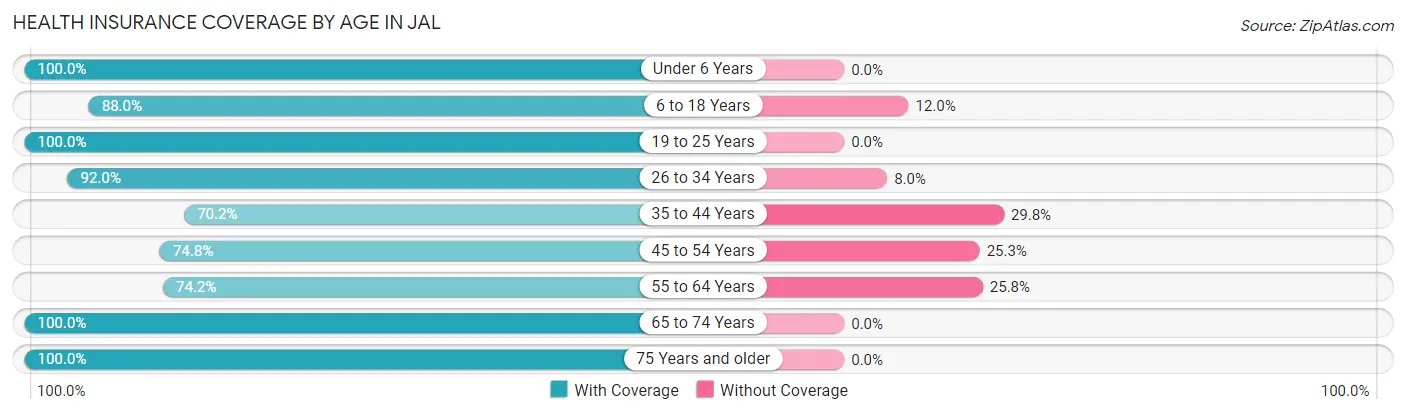
| Age Bracket | With Coverage | Without Coverage |
| Under 6 Years | 69 (100.0%) | 0 (0.0%) |
| 6 to 18 Years | 485 (88.0%) | 66 (12.0%) |
| 19 to 25 Years | 170 (100.0%) | 0 (0.0%) |
| 26 to 34 Years | 161 (92.0%) | 14 (8.0%) |
| 35 to 44 Years | 243 (70.2%) | 103 (29.8%) |
| 45 to 54 Years | 225 (74.8%) | 76 (25.3%) |
| 55 to 64 Years | 221 (74.2%) | 77 (25.8%) |
| 65 to 74 Years | 164 (100.0%) | 0 (0.0%) |
| 75 Years and older | 184 (100.0%) | 0 (0.0%) |
| Total | 1,922 (85.1%) | 336 (14.9%) |
Health Insurance Coverage by Citizenship Status in Jal
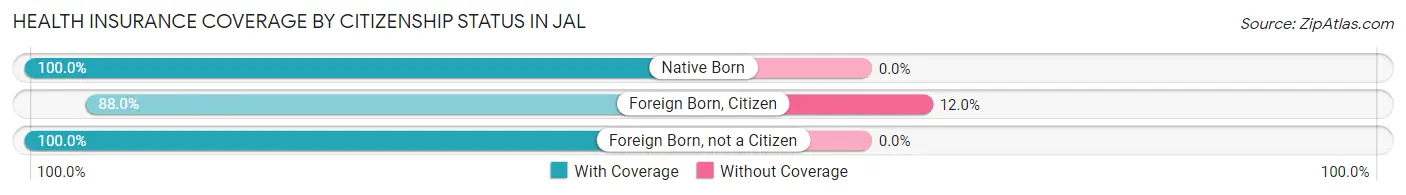
| Citizenship Status | With Coverage | Without Coverage |
| Native Born | 69 (100.0%) | 0 (0.0%) |
| Foreign Born, Citizen | 485 (88.0%) | 66 (12.0%) |
| Foreign Born, not a Citizen | 170 (100.0%) | 0 (0.0%) |
Health Insurance Coverage by Household Income in Jal
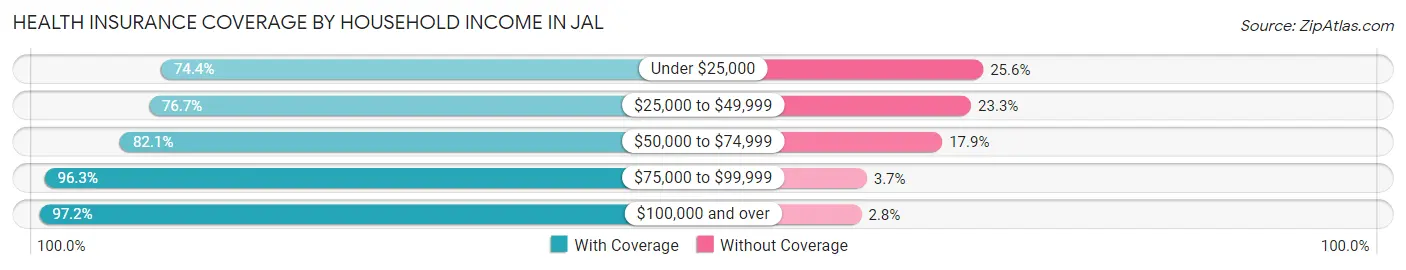
| Household Income | With Coverage | Without Coverage |
| Under $25,000 | 431 (74.4%) | 148 (25.6%) |
| $25,000 to $49,999 | 158 (76.7%) | 48 (23.3%) |
| $50,000 to $74,999 | 528 (82.1%) | 115 (17.9%) |
| $75,000 to $99,999 | 206 (96.3%) | 8 (3.7%) |
| $100,000 and over | 599 (97.2%) | 17 (2.8%) |
Public vs Private Health Insurance Coverage by Age in Jal
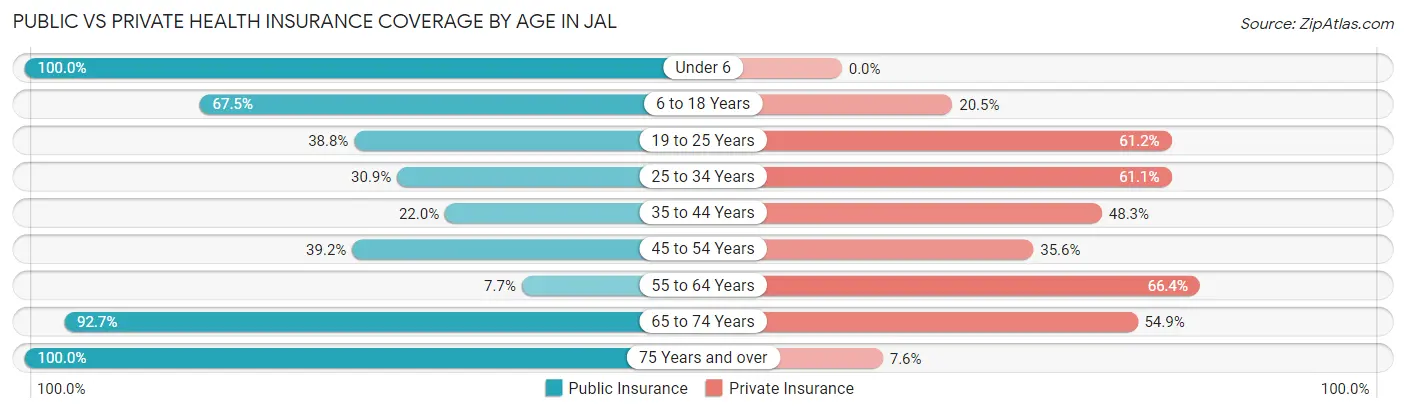
| Age Bracket | Public Insurance | Private Insurance |
| Under 6 | 69 (100.0%) | 0 (0.0%) |
| 6 to 18 Years | 372 (67.5%) | 113 (20.5%) |
| 19 to 25 Years | 66 (38.8%) | 104 (61.2%) |
| 25 to 34 Years | 54 (30.9%) | 107 (61.1%) |
| 35 to 44 Years | 76 (22.0%) | 167 (48.3%) |
| 45 to 54 Years | 118 (39.2%) | 107 (35.5%) |
| 55 to 64 Years | 23 (7.7%) | 198 (66.4%) |
| 65 to 74 Years | 152 (92.7%) | 90 (54.9%) |
| 75 Years and over | 184 (100.0%) | 14 (7.6%) |
| Total | 1,114 (49.3%) | 900 (39.9%) |
Disability Status by Sex by Age in Jal
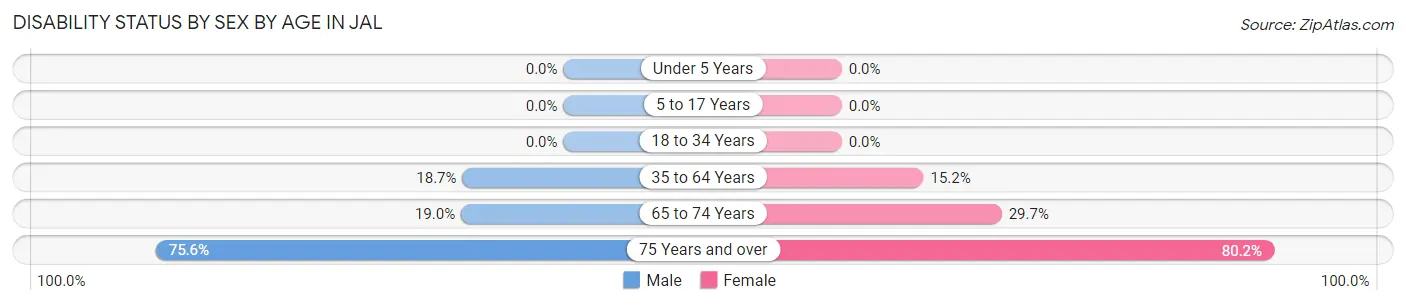
| Age Bracket | Male | Female |
| Under 5 Years | 0 (0.0%) | 0 (0.0%) |
| 5 to 17 Years | 0 (0.0%) | 0 (0.0%) |
| 18 to 34 Years | 0 (0.0%) | 0 (0.0%) |
| 35 to 64 Years | 98 (18.7%) | 64 (15.2%) |
| 65 to 74 Years | 19 (19.0%) | 19 (29.7%) |
| 75 Years and over | 59 (75.6%) | 85 (80.2%) |
Disability Class by Sex by Age in Jal
Disability Class: Hearing Difficulty
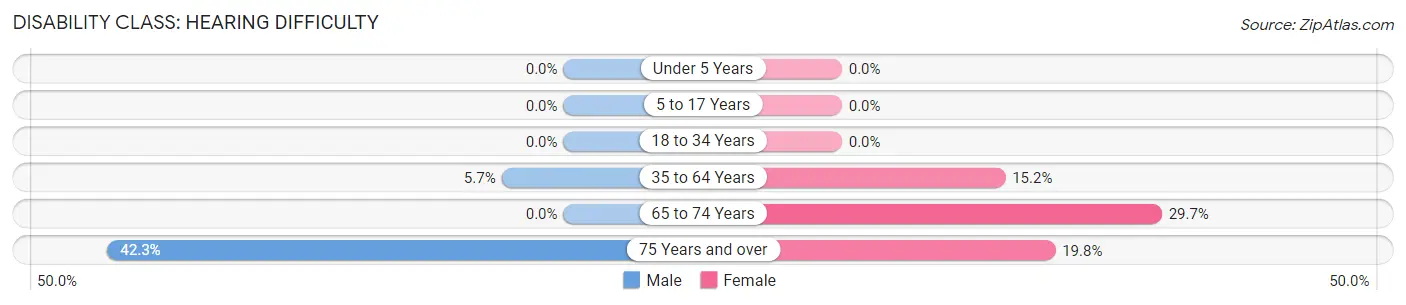
| Age Bracket | Male | Female |
| Under 5 Years | 0 (0.0%) | 0 (0.0%) |
| 5 to 17 Years | 0 (0.0%) | 0 (0.0%) |
| 18 to 34 Years | 0 (0.0%) | 0 (0.0%) |
| 35 to 64 Years | 30 (5.7%) | 64 (15.2%) |
| 65 to 74 Years | 0 (0.0%) | 19 (29.7%) |
| 75 Years and over | 33 (42.3%) | 21 (19.8%) |
Disability Class: Vision Difficulty
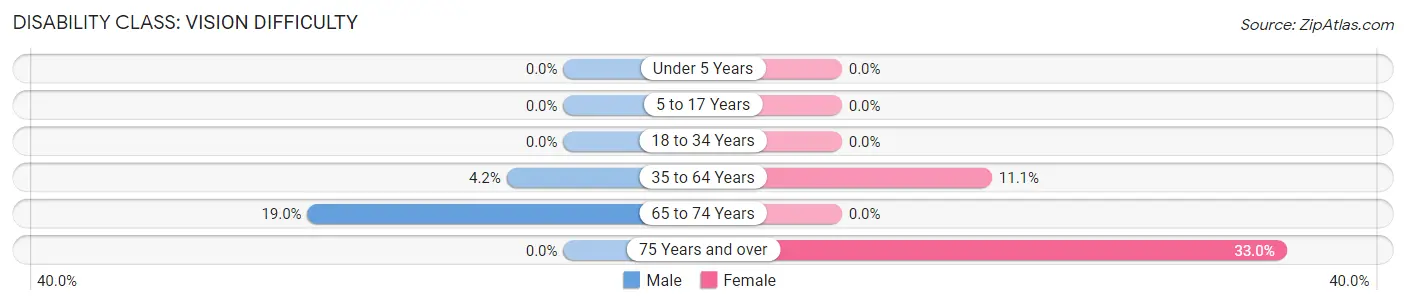
| Age Bracket | Male | Female |
| Under 5 Years | 0 (0.0%) | 0 (0.0%) |
| 5 to 17 Years | 0 (0.0%) | 0 (0.0%) |
| 18 to 34 Years | 0 (0.0%) | 0 (0.0%) |
| 35 to 64 Years | 22 (4.2%) | 47 (11.1%) |
| 65 to 74 Years | 19 (19.0%) | 0 (0.0%) |
| 75 Years and over | 0 (0.0%) | 35 (33.0%) |
Disability Class: Cognitive Difficulty
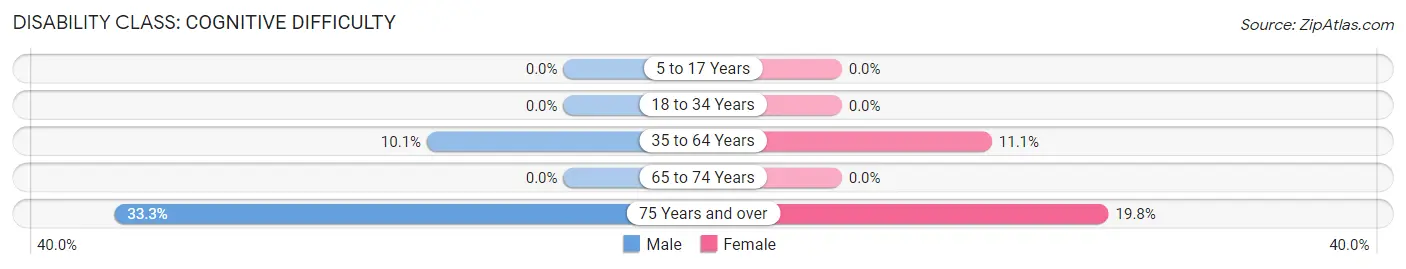
| Age Bracket | Male | Female |
| 5 to 17 Years | 0 (0.0%) | 0 (0.0%) |
| 18 to 34 Years | 0 (0.0%) | 0 (0.0%) |
| 35 to 64 Years | 53 (10.1%) | 47 (11.1%) |
| 65 to 74 Years | 0 (0.0%) | 0 (0.0%) |
| 75 Years and over | 26 (33.3%) | 21 (19.8%) |
Disability Class: Ambulatory Difficulty
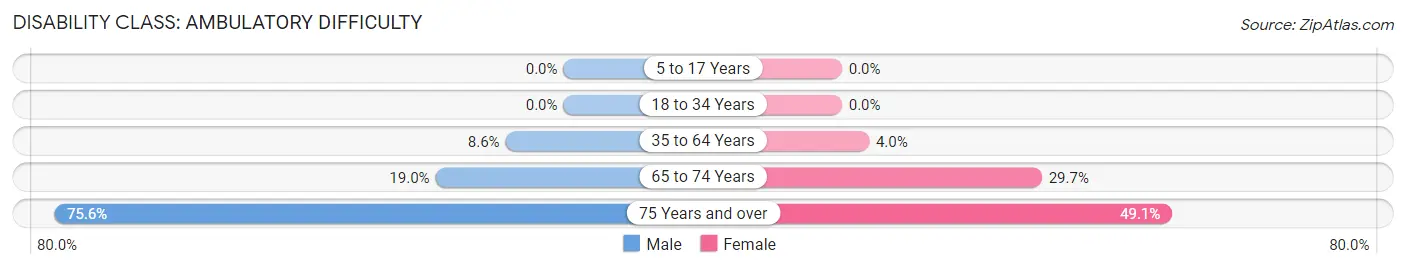
| Age Bracket | Male | Female |
| 5 to 17 Years | 0 (0.0%) | 0 (0.0%) |
| 18 to 34 Years | 0 (0.0%) | 0 (0.0%) |
| 35 to 64 Years | 45 (8.6%) | 17 (4.0%) |
| 65 to 74 Years | 19 (19.0%) | 19 (29.7%) |
| 75 Years and over | 59 (75.6%) | 52 (49.1%) |
Disability Class: Self-Care Difficulty
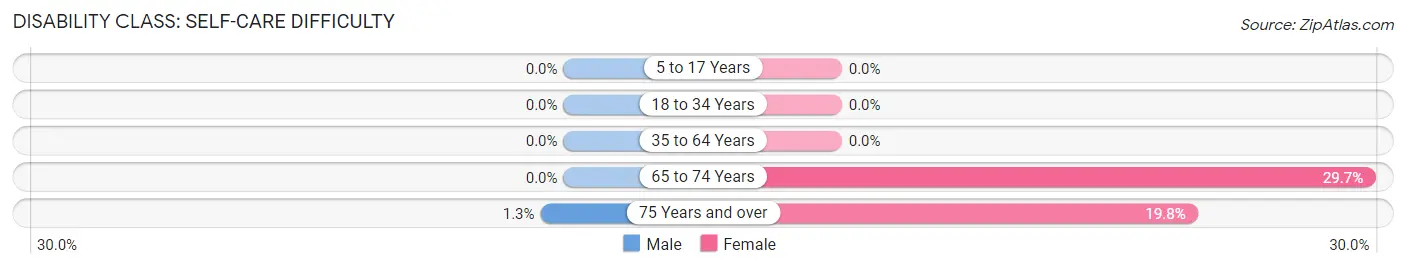
| Age Bracket | Male | Female |
| 5 to 17 Years | 0 (0.0%) | 0 (0.0%) |
| 18 to 34 Years | 0 (0.0%) | 0 (0.0%) |
| 35 to 64 Years | 0 (0.0%) | 0 (0.0%) |
| 65 to 74 Years | 0 (0.0%) | 19 (29.7%) |
| 75 Years and over | 1 (1.3%) | 21 (19.8%) |
Technology Access in Jal
Computing Device Access in Jal
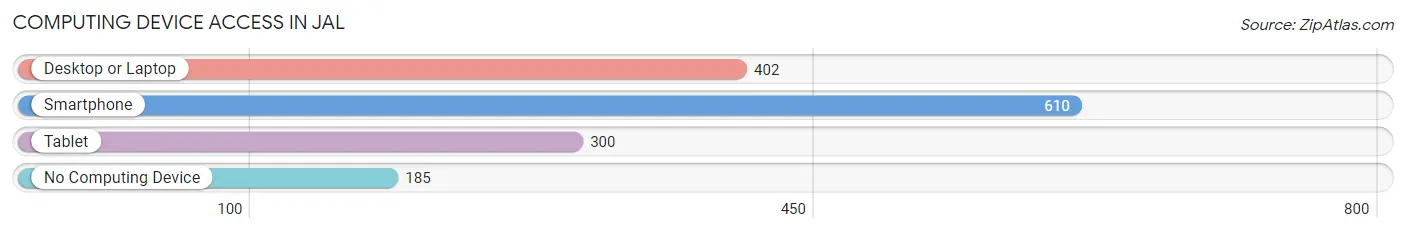
| Device Type | # Households | % Households |
| Desktop or Laptop | 402 | 48.9% |
| Smartphone | 610 | 74.2% |
| Tablet | 300 | 36.5% |
| No Computing Device | 185 | 22.5% |
| Total | 822 | 100.0% |
Internet Access in Jal
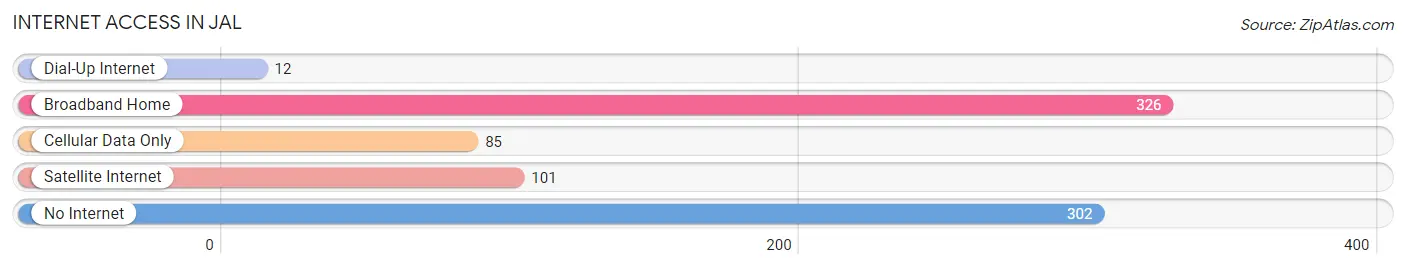
| Internet Type | # Households | % Households |
| Dial-Up Internet | 12 | 1.5% |
| Broadband Home | 326 | 39.7% |
| Cellular Data Only | 85 | 10.3% |
| Satellite Internet | 101 | 12.3% |
| No Internet | 302 | 36.7% |
| Total | 822 | 100.0% |
Jal Summary
Jal is a city located in the southeastern corner of New Mexico, United States. It is the county seat of Lea County and is situated in the southeastern part of the state, near the Texas border. The city is located in the Chihuahuan Desert and is surrounded by the Guadalupe Mountains. The city has a population of approximately 11,000 people and is the largest city in Lea County.
History
Jal was founded in 1906 by the Santa Fe Railway. The city was named after the Spanish word for “honey”, which was used to describe the area’s abundant wildflowers. The city was originally a stop on the Santa Fe Railway, and it quickly grew into a small town. In the early 1900s, the city was a major hub for the oil and gas industry, and it was also a major center for ranching and farming.
Geography
Jal is located in the southeastern corner of New Mexico, near the Texas border. The city is situated in the Chihuahuan Desert and is surrounded by the Guadalupe Mountains. The city has an elevation of 3,845 feet and is located at the intersection of U.S. Route 62 and U.S. Route 180. The city is located approximately 90 miles from El Paso, Texas and approximately 200 miles from Albuquerque, New Mexico.
Economy
Jal’s economy is largely based on the oil and gas industry, as well as ranching and farming. The city is home to several oil and gas companies, including Chevron, ConocoPhillips, and Occidental Petroleum. The city is also home to several large ranches, including the J.B. White Ranch and the J.C. White Ranch. The city is also home to several manufacturing companies, including the Jal Manufacturing Company and the Jal Plastics Company.
Demographics
As of the 2010 census, the population of Jal was 11,039. The racial makeup of the city was 75.3% White, 0.9% African American, 0.7% Native American, 0.3% Asian, 0.1% Pacific Islander, 19.7% from other races, and 3.0% from two or more races. Hispanic or Latino of any race were 44.2% of the population. The median household income in Jal was $35,945, and the median family income was $41,944. The per capita income in Jal was $17,845.
Jal is a small city with a rich history and a diverse economy. The city is home to several oil and gas companies, ranches, and manufacturing companies. The city has a population of approximately 11,000 people and is the largest city in Lea County. The city is located in the Chihuahuan Desert and is surrounded by the Guadalupe Mountains. The city has a diverse population, with a majority of the population being Hispanic or Latino. The city has a median household income of $35,945 and a median family income of $41,944.
Common Questions
What is Per Capita Income in Jal?
Per Capita income in Jal is $25,962.
What is the Median Family Income in Jal?
Median Family Income in Jal is $58,410.
What is the Median Household income in Jal?
Median Household Income in Jal is $56,731.
What is Income or Wage Gap in Jal?
Income or Wage Gap in Jal is 43.9%.
Women in Jal earn 56.1 cents for every dollar earned by a man.
What is Inequality or Gini Index in Jal?
Inequality or Gini Index in Jal is 0.46.
What is the Total Population of Jal?
Total Population of Jal is 2,258.
What is the Total Male Population of Jal?
Total Male Population of Jal is 1,048.
What is the Total Female Population of Jal?
Total Female Population of Jal is 1,210.
What is the Ratio of Males per 100 Females in Jal?
There are 86.61 Males per 100 Females in Jal.
What is the Ratio of Females per 100 Males in Jal?
There are 115.46 Females per 100 Males in Jal.
What is the Median Population Age in Jal?
Median Population Age in Jal is 39.5 Years.
What is the Average Family Size in Jal
Average Family Size in Jal is 3.1 People.
What is the Average Household Size in Jal
Average Household Size in Jal is 2.8 People.
How Large is the Labor Force in Jal?
There are 1,047 People in the Labor Forcein in Jal.
What is the Percentage of People in the Labor Force in Jal?
59.3% of People are in the Labor Force in Jal.
What is the Unemployment Rate in Jal?
Unemployment Rate in Jal is 13.9%.