Grants, NM Map & Demographics
Grants Map
Grants Overview
$26,873
PER CAPITA INCOME
$66,729
AVG FAMILY INCOME
$55,631
AVG HOUSEHOLD INCOME
19.7%
WAGE / INCOME GAP [ % ]
80.3¢/ $1
WAGE / INCOME GAP [ $ ]
$11,393
FAMILY INCOME DEFICIT
0.43
INEQUALITY / GINI INDEX
9,177
TOTAL POPULATION
4,775
MALE POPULATION
4,402
FEMALE POPULATION
108.47
MALES / 100 FEMALES
92.19
FEMALES / 100 MALES
33.2
MEDIAN AGE
3.6
AVG FAMILY SIZE
2.9
AVG HOUSEHOLD SIZE
3,413
LABOR FORCE [ PEOPLE ]
48.2%
PERCENT IN LABOR FORCE
4.5%
UNEMPLOYMENT RATE
Grants Zip Codes
Grants Area Codes
Income in Grants
Income Overview in Grants
Per Capita Income in Grants is $26,873, while median incomes of families and households are $66,729 and $55,631 respectively.
| Characteristic | Number | Measure |
| Per Capita Income | 9,177 | $26,873 |
| Median Family Income | 1,915 | $66,729 |
| Mean Family Income | 1,915 | $74,794 |
| Median Household Income | 2,924 | $55,631 |
| Mean Household Income | 2,924 | $69,049 |
| Income Deficit | 1,915 | $11,393 |
| Wage / Income Gap (%) | 9,177 | 19.69% |
| Wage / Income Gap ($) | 9,177 | 80.31¢ per $1 |
| Gini / Inequality Index | 9,177 | 0.43 |
Earnings by Sex in Grants
Average Earnings in Grants are $35,905, $40,861 for men and $32,816 for women, a difference of 19.7%.
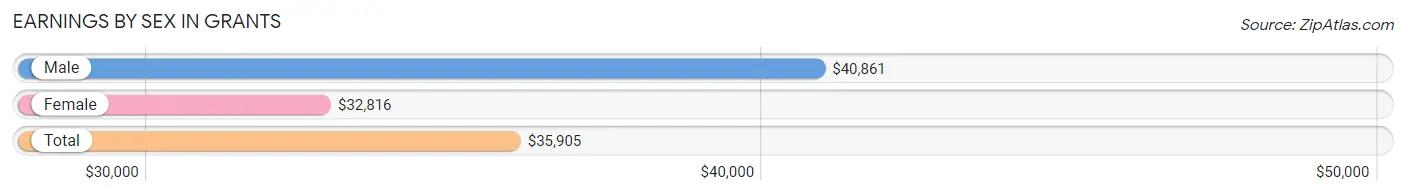
| Sex | Number | Average Earnings |
| Male | 2,423 (59.2%) | $40,861 |
| Female | 1,670 (40.8%) | $32,816 |
| Total | 4,093 (100.0%) | $35,905 |
Earnings by Sex by Income Bracket in Grants
The most common earnings brackets in Grants are $100,000+ for men (384 | 15.9%) and $75,000 to $99,999 for women (208 | 12.5%).
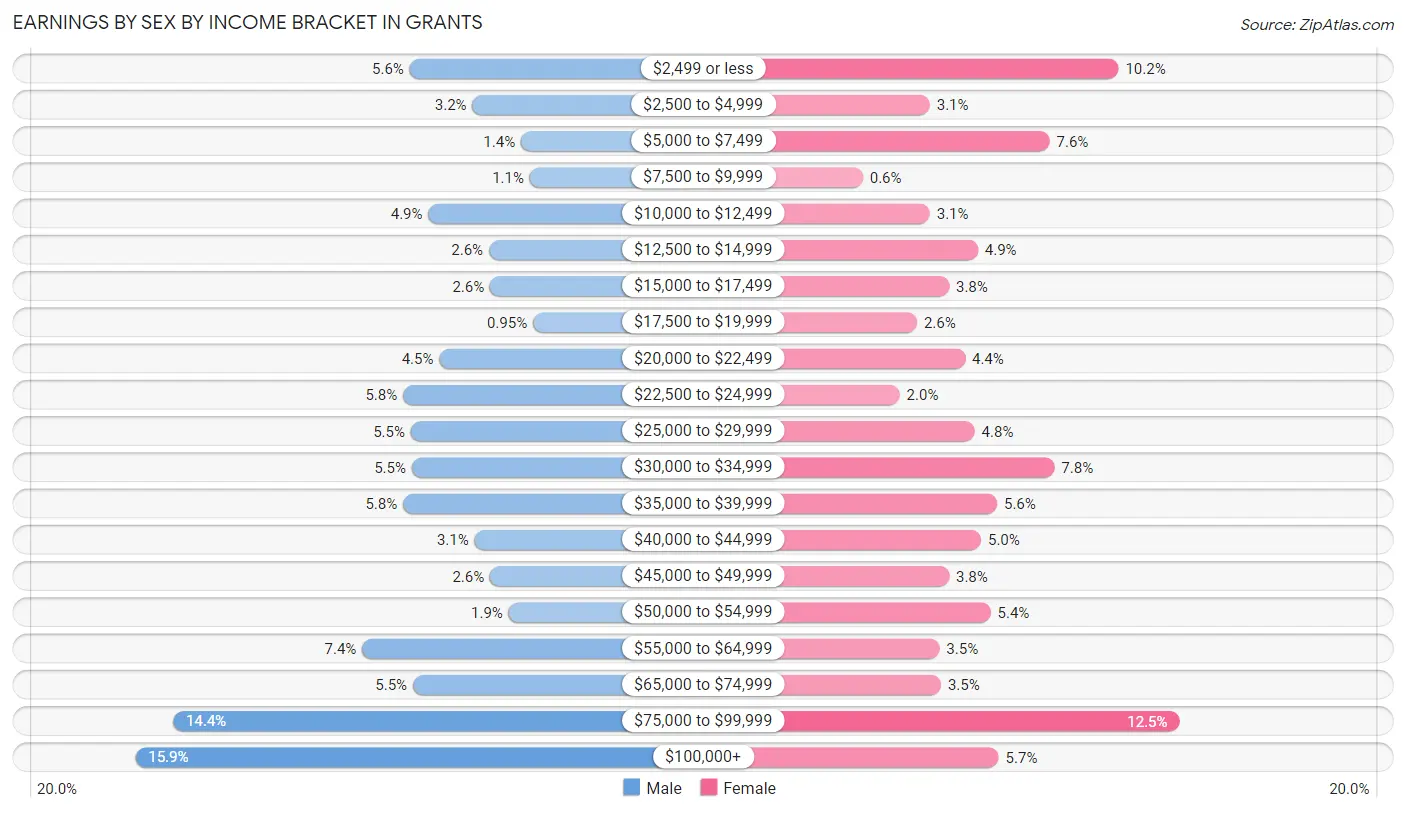
| Income | Male | Female |
| $2,499 or less | 135 (5.6%) | 170 (10.2%) |
| $2,500 to $4,999 | 78 (3.2%) | 52 (3.1%) |
| $5,000 to $7,499 | 34 (1.4%) | 127 (7.6%) |
| $7,500 to $9,999 | 26 (1.1%) | 10 (0.6%) |
| $10,000 to $12,499 | 118 (4.9%) | 52 (3.1%) |
| $12,500 to $14,999 | 63 (2.6%) | 82 (4.9%) |
| $15,000 to $17,499 | 62 (2.6%) | 64 (3.8%) |
| $17,500 to $19,999 | 23 (0.9%) | 44 (2.6%) |
| $20,000 to $22,499 | 108 (4.5%) | 74 (4.4%) |
| $22,500 to $24,999 | 141 (5.8%) | 33 (2.0%) |
| $25,000 to $29,999 | 134 (5.5%) | 80 (4.8%) |
| $30,000 to $34,999 | 133 (5.5%) | 130 (7.8%) |
| $35,000 to $39,999 | 141 (5.8%) | 94 (5.6%) |
| $40,000 to $44,999 | 76 (3.1%) | 84 (5.0%) |
| $45,000 to $49,999 | 62 (2.6%) | 64 (3.8%) |
| $50,000 to $54,999 | 45 (1.9%) | 90 (5.4%) |
| $55,000 to $64,999 | 178 (7.3%) | 58 (3.5%) |
| $65,000 to $74,999 | 132 (5.4%) | 59 (3.5%) |
| $75,000 to $99,999 | 350 (14.4%) | 208 (12.5%) |
| $100,000+ | 384 (15.9%) | 95 (5.7%) |
| Total | 2,423 (100.0%) | 1,670 (100.0%) |
Earnings by Sex by Educational Attainment in Grants
Average earnings in Grants are $52,589 for men and $35,968 for women, a difference of 31.6%. Men with an educational attainment of graduate degree enjoy the highest average annual earnings of $116,165, while those with less than high school education earn the least with $20,191. Women with an educational attainment of bachelor's degree earn the most with the average annual earnings of $90,721, while those with less than high school education have the smallest earnings of $12,857.
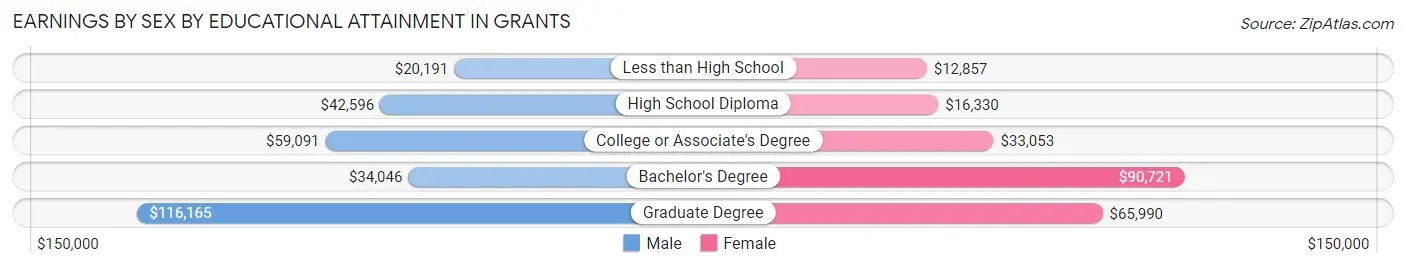
| Educational Attainment | Male Income | Female Income |
| Less than High School | $20,191 | $12,857 |
| High School Diploma | $42,596 | $16,330 |
| College or Associate's Degree | $59,091 | $33,053 |
| Bachelor's Degree | $34,046 | $90,721 |
| Graduate Degree | $116,165 | $65,990 |
| Total | $52,589 | $35,968 |
Family Income in Grants
Family Income Brackets in Grants
According to the Grants family income data, there are 335 families falling into the $50,000 to $74,999 income range, which is the most common income bracket and makes up 17.5% of all families. Conversely, the $200,000+ income bracket is the least frequent group with only 29 families (1.5%) belonging to this category.
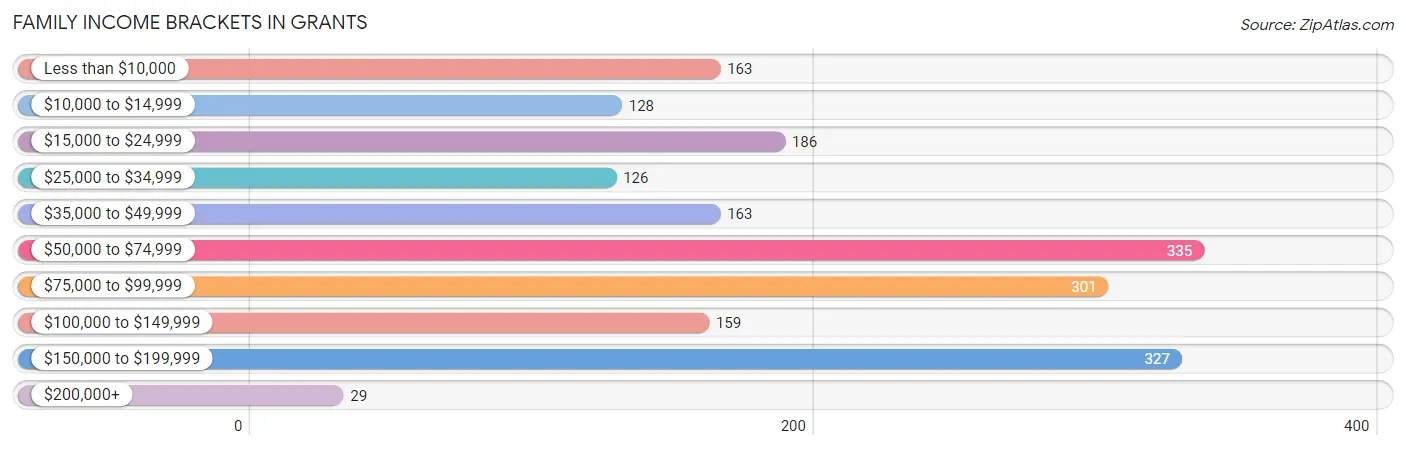
| Income Bracket | # Families | % Families |
| Less than $10,000 | 163 | 8.5% |
| $10,000 to $14,999 | 128 | 6.7% |
| $15,000 to $24,999 | 186 | 9.7% |
| $25,000 to $34,999 | 126 | 6.6% |
| $35,000 to $49,999 | 163 | 8.5% |
| $50,000 to $74,999 | 335 | 17.5% |
| $75,000 to $99,999 | 301 | 15.7% |
| $100,000 to $149,999 | 159 | 8.3% |
| $150,000 to $199,999 | 327 | 17.1% |
| $200,000+ | 29 | 1.5% |
Family Income by Famaliy Size in Grants
5-person families (284 | 14.8%) account for the highest median family income in Grants with $76,574 per family, while 2-person families (1,024 | 53.5%) have the highest median income of $34,486 per family member.
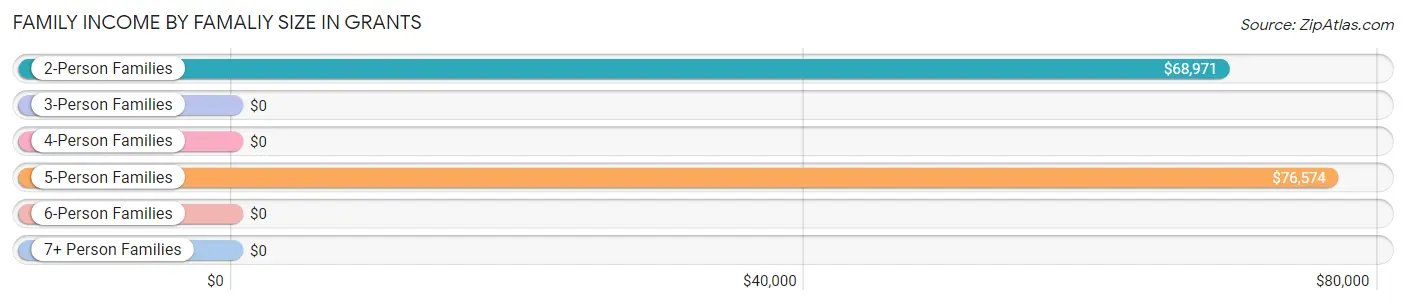
| Income Bracket | # Families | Median Income |
| 2-Person Families | 1,024 (53.5%) | $68,971 |
| 3-Person Families | 337 (17.6%) | $0 |
| 4-Person Families | 188 (9.8%) | $0 |
| 5-Person Families | 284 (14.8%) | $76,574 |
| 6-Person Families | 82 (4.3%) | $0 |
| 7+ Person Families | 0 (0.0%) | $0 |
| Total | 1,915 (100.0%) | $66,729 |
Family Income by Number of Earners in Grants
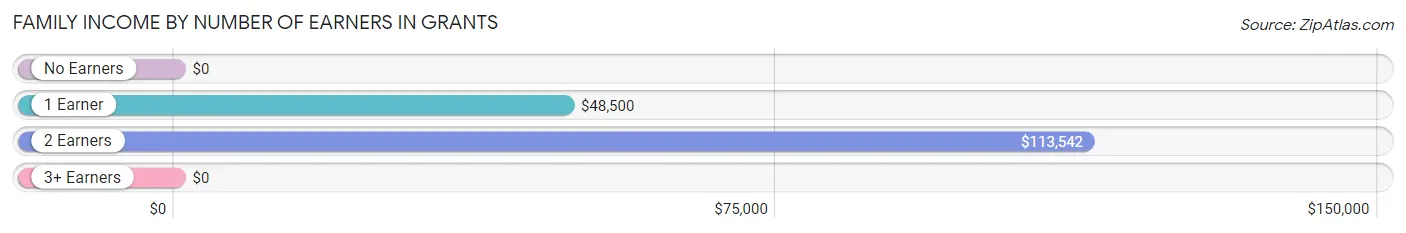
| Number of Earners | # Families | Median Income |
| No Earners | 388 (20.3%) | $0 |
| 1 Earner | 796 (41.6%) | $48,500 |
| 2 Earners | 658 (34.4%) | $113,542 |
| 3+ Earners | 73 (3.8%) | $0 |
| Total | 1,915 (100.0%) | $66,729 |
Household Income in Grants
Household Income Brackets in Grants
With 480 households falling in the category, the $50,000 to $74,999 income range is the most frequent in Grants, accounting for 16.4% of all households. In contrast, only 47 households (1.6%) fall into the $200,000+ income bracket, making it the least populous group.
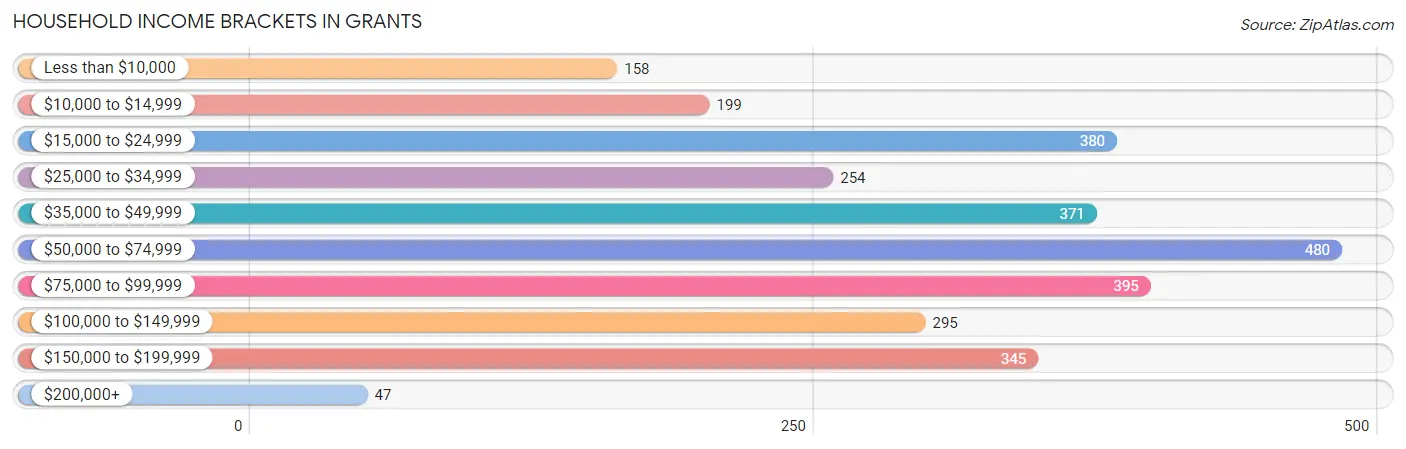
| Income Bracket | # Households | % Households |
| Less than $10,000 | 158 | 5.4% |
| $10,000 to $14,999 | 199 | 6.8% |
| $15,000 to $24,999 | 380 | 13.0% |
| $25,000 to $34,999 | 254 | 8.7% |
| $35,000 to $49,999 | 371 | 12.7% |
| $50,000 to $74,999 | 480 | 16.4% |
| $75,000 to $99,999 | 395 | 13.5% |
| $100,000 to $149,999 | 295 | 10.1% |
| $150,000 to $199,999 | 345 | 11.8% |
| $200,000+ | 47 | 1.6% |
Household Income by Householder Age in Grants
The median household income in Grants is $55,631, with the highest median household income of $85,000 found in the 25 to 44 years age bracket for the primary householder. A total of 1,128 households (38.6%) fall into this category. Meanwhile, the 15 to 24 years age bracket for the primary householder has the lowest median household income of $23,984, with 121 households (4.1%) in this group.
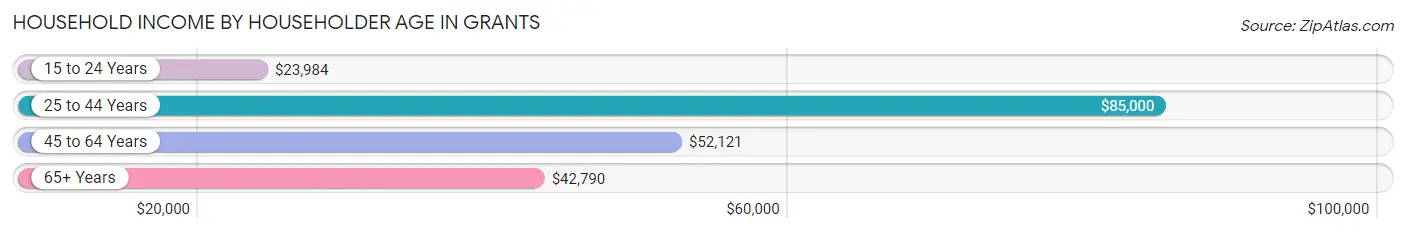
| Income Bracket | # Households | Median Income |
| 15 to 24 Years | 121 (4.1%) | $23,984 |
| 25 to 44 Years | 1,128 (38.6%) | $85,000 |
| 45 to 64 Years | 876 (30.0%) | $52,121 |
| 65+ Years | 799 (27.3%) | $42,790 |
| Total | 2,924 (100.0%) | $55,631 |
Poverty in Grants
Income Below Poverty by Sex and Age in Grants
With 29.1% poverty level for males and 30.3% for females among the residents of Grants, 5 year old males and under 5 year old females are the most vulnerable to poverty, with 68 males (66.7%) and 115 females (57.5%) in their respective age groups living below the poverty level.
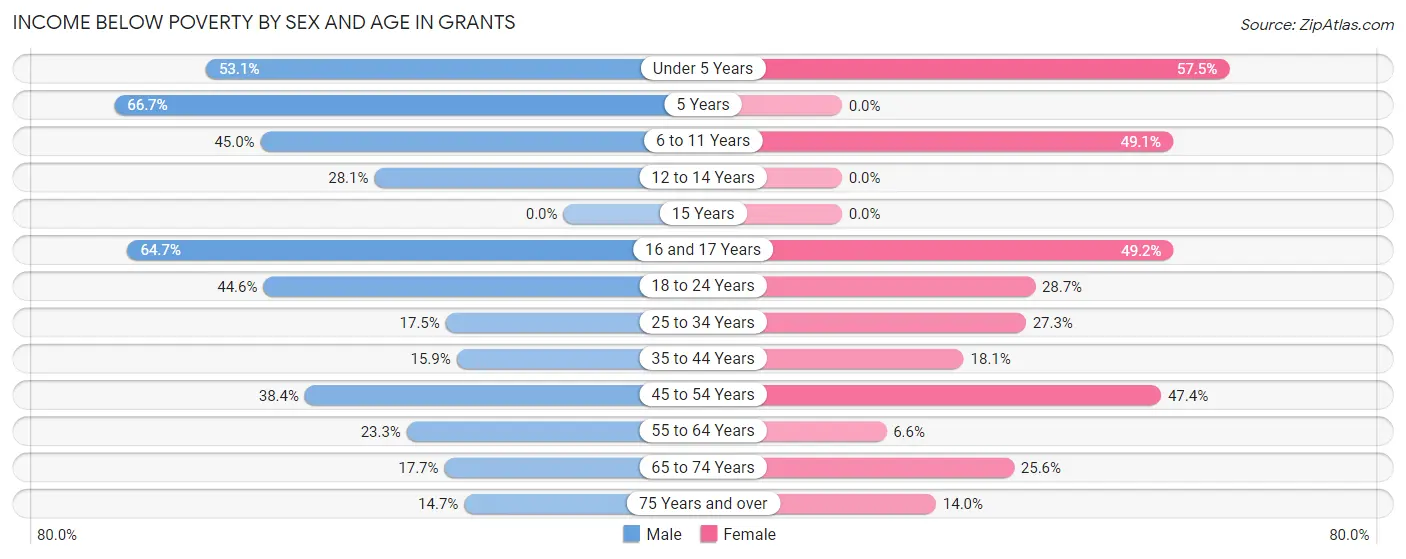
| Age Bracket | Male | Female |
| Under 5 Years | 260 (53.1%) | 115 (57.5%) |
| 5 Years | 68 (66.7%) | 0 (0.0%) |
| 6 to 11 Years | 139 (45.0%) | 372 (49.1%) |
| 12 to 14 Years | 16 (28.1%) | 0 (0.0%) |
| 15 Years | 0 (0.0%) | 0 (0.0%) |
| 16 and 17 Years | 11 (64.7%) | 64 (49.2%) |
| 18 to 24 Years | 168 (44.6%) | 115 (28.7%) |
| 25 to 34 Years | 133 (17.5%) | 213 (27.3%) |
| 35 to 44 Years | 118 (15.9%) | 53 (18.1%) |
| 45 to 54 Years | 86 (38.4%) | 210 (47.4%) |
| 55 to 64 Years | 100 (23.3%) | 30 (6.6%) |
| 65 to 74 Years | 38 (17.7%) | 93 (25.6%) |
| 75 Years and over | 52 (14.7%) | 44 (14.0%) |
| Total | 1,189 (29.1%) | 1,309 (30.3%) |
Income Above Poverty by Sex and Age in Grants
According to the poverty statistics in Grants, males aged 75 years and over and females aged 12 to 14 years are the age groups that are most secure financially, with 85.3% of males and 100.0% of females in these age groups living above the poverty line.
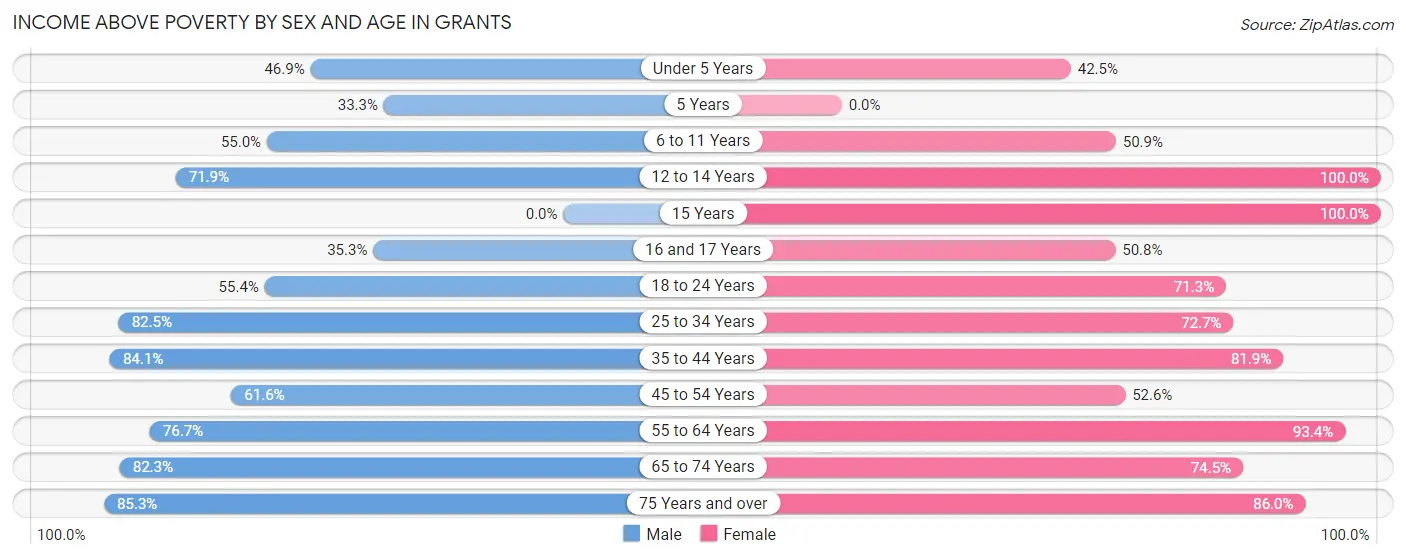
| Age Bracket | Male | Female |
| Under 5 Years | 230 (46.9%) | 85 (42.5%) |
| 5 Years | 34 (33.3%) | 0 (0.0%) |
| 6 to 11 Years | 170 (55.0%) | 385 (50.9%) |
| 12 to 14 Years | 41 (71.9%) | 148 (100.0%) |
| 15 Years | 0 (0.0%) | 33 (100.0%) |
| 16 and 17 Years | 6 (35.3%) | 66 (50.8%) |
| 18 to 24 Years | 209 (55.4%) | 286 (71.3%) |
| 25 to 34 Years | 628 (82.5%) | 567 (72.7%) |
| 35 to 44 Years | 626 (84.1%) | 240 (81.9%) |
| 45 to 54 Years | 138 (61.6%) | 233 (52.6%) |
| 55 to 64 Years | 330 (76.7%) | 425 (93.4%) |
| 65 to 74 Years | 177 (82.3%) | 271 (74.5%) |
| 75 Years and over | 301 (85.3%) | 271 (86.0%) |
| Total | 2,890 (70.9%) | 3,010 (69.7%) |
Income Below Poverty Among Married-Couple Families in Grants
The poverty statistics for married-couple families in Grants show that 13.4% or 179 of the total 1,339 families live below the poverty line. Families with 3 or 4 children have the highest poverty rate of 24.4%, comprising of 41 families. On the other hand, families with no children have the lowest poverty rate of 11.5%, which includes 103 families.
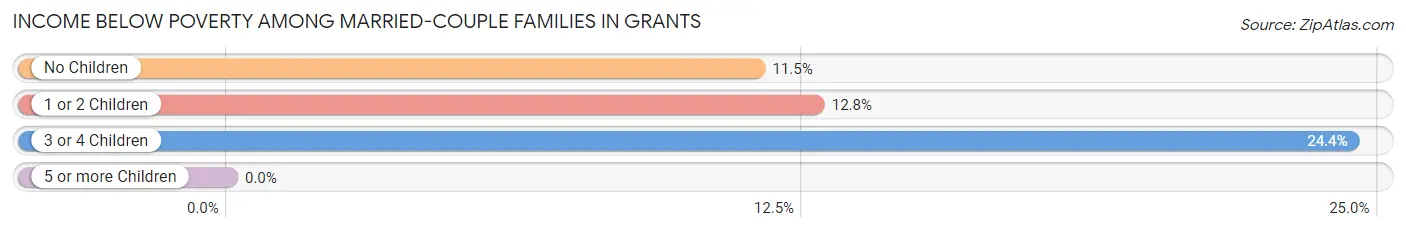
| Children | Above Poverty | Below Poverty |
| No Children | 794 (88.5%) | 103 (11.5%) |
| 1 or 2 Children | 239 (87.2%) | 35 (12.8%) |
| 3 or 4 Children | 127 (75.6%) | 41 (24.4%) |
| 5 or more Children | 0 (0.0%) | 0 (0.0%) |
| Total | 1,160 (86.6%) | 179 (13.4%) |
Income Below Poverty Among Single-Parent Households in Grants
According to the poverty data in Grants, 47.7% or 84 single-father households and 65.2% or 261 single-mother households are living below the poverty line. Among single-father households, those with 3 or 4 children have the highest poverty rate, with 42 households (100.0%) experiencing poverty. Likewise, among single-mother households, those with 3 or 4 children have the highest poverty rate, with 47 households (94.0%) falling below the poverty line.
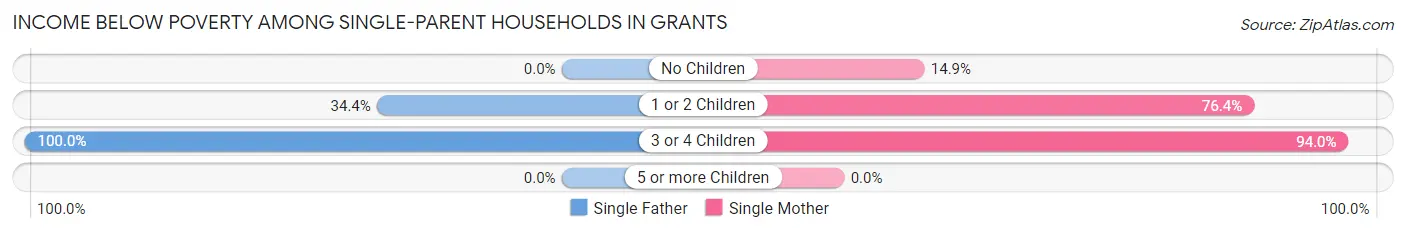
| Children | Single Father | Single Mother |
| No Children | 0 (0.0%) | 13 (14.9%) |
| 1 or 2 Children | 42 (34.4%) | 201 (76.4%) |
| 3 or 4 Children | 42 (100.0%) | 47 (94.0%) |
| 5 or more Children | 0 (0.0%) | 0 (0.0%) |
| Total | 84 (47.7%) | 261 (65.2%) |
Income Below Poverty Among Married-Couple vs Single-Parent Households in Grants
The poverty data for Grants shows that 179 of the married-couple family households (13.4%) and 345 of the single-parent households (59.9%) are living below the poverty level. Within the married-couple family households, those with 3 or 4 children have the highest poverty rate, with 41 households (24.4%) falling below the poverty line. Among the single-parent households, those with 3 or 4 children have the highest poverty rate, with 89 household (96.7%) living below poverty.
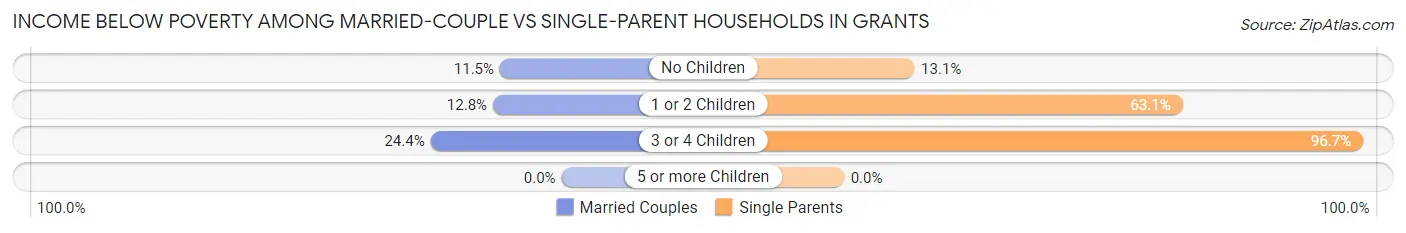
| Children | Married-Couple Families | Single-Parent Households |
| No Children | 103 (11.5%) | 13 (13.1%) |
| 1 or 2 Children | 35 (12.8%) | 243 (63.1%) |
| 3 or 4 Children | 41 (24.4%) | 89 (96.7%) |
| 5 or more Children | 0 (0.0%) | 0 (0.0%) |
| Total | 179 (13.4%) | 345 (59.9%) |
Race in Grants
The most populous races in Grants are White / Caucasian (5,442 | 59.3%), Hispanic or Latino (5,286 | 57.6%), and Native / Alaskan (1,363 | 14.8%).
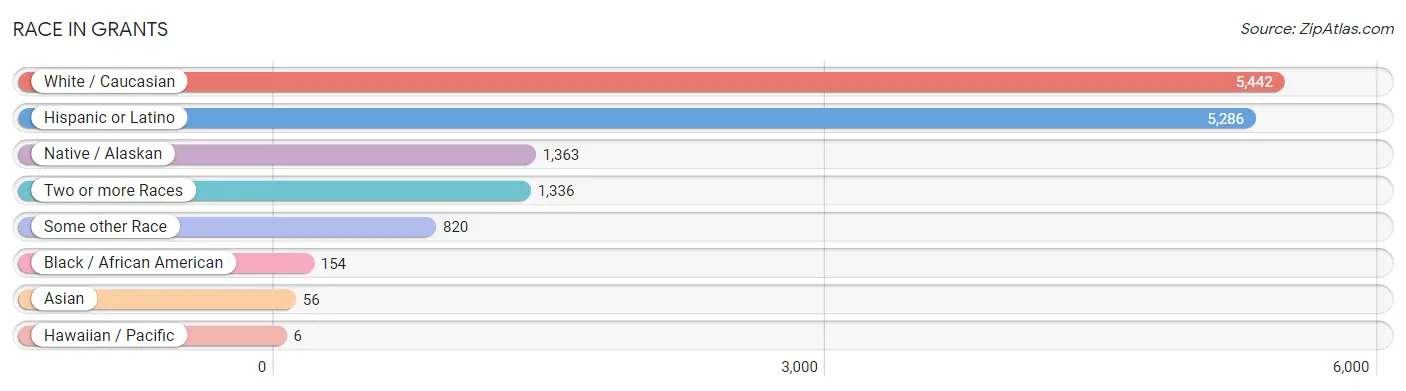
| Race | # Population | % Population |
| Asian | 56 | 0.6% |
| Black / African American | 154 | 1.7% |
| Hawaiian / Pacific | 6 | 0.1% |
| Hispanic or Latino | 5,286 | 57.6% |
| Native / Alaskan | 1,363 | 14.8% |
| White / Caucasian | 5,442 | 59.3% |
| Two or more Races | 1,336 | 14.6% |
| Some other Race | 820 | 8.9% |
| Total | 9,177 | 100.0% |
Ancestry in Grants
The most populous ancestries reported in Grants are Mexican (2,522 | 27.5%), Navajo (939 | 10.2%), Spaniard (656 | 7.1%), Spanish (495 | 5.4%), and English (426 | 4.6%), together accounting for 54.9% of all Grants residents.
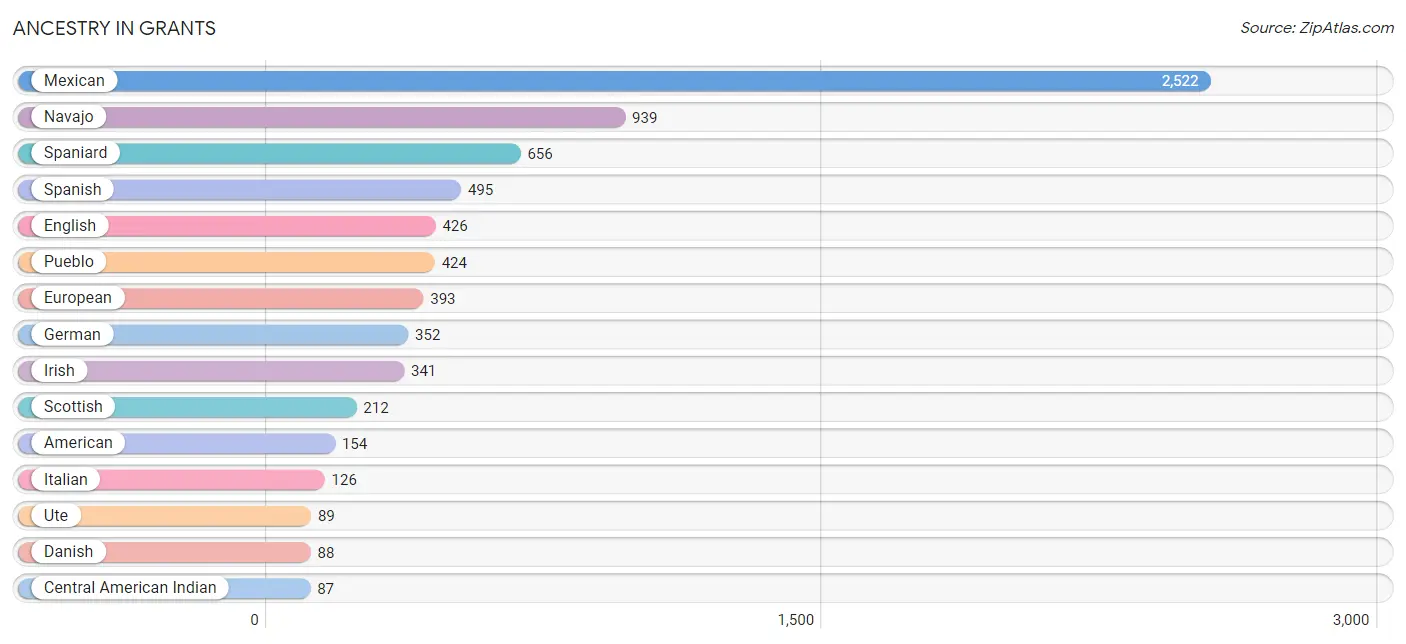
| Ancestry | # Population | % Population |
| African | 6 | 0.1% |
| American | 154 | 1.7% |
| Arab | 24 | 0.3% |
| Bhutanese | 6 | 0.1% |
| British | 31 | 0.3% |
| Canadian | 11 | 0.1% |
| Central American | 64 | 0.7% |
| Central American Indian | 87 | 0.9% |
| Cherokee | 45 | 0.5% |
| Chippewa | 6 | 0.1% |
| Choctaw | 7 | 0.1% |
| Creek | 18 | 0.2% |
| Cuban | 14 | 0.2% |
| Czech | 8 | 0.1% |
| Czechoslovakian | 10 | 0.1% |
| Danish | 88 | 1.0% |
| Dutch | 20 | 0.2% |
| Eastern European | 45 | 0.5% |
| English | 426 | 4.6% |
| European | 393 | 4.3% |
| Finnish | 10 | 0.1% |
| French | 33 | 0.4% |
| French Canadian | 1 | 0.0% |
| German | 352 | 3.8% |
| Greek | 37 | 0.4% |
| Haitian | 8 | 0.1% |
| Honduran | 64 | 0.7% |
| Hungarian | 6 | 0.1% |
| Indian (Asian) | 11 | 0.1% |
| Irish | 341 | 3.7% |
| Italian | 126 | 1.4% |
| Jamaican | 9 | 0.1% |
| Korean | 43 | 0.5% |
| Lebanese | 24 | 0.3% |
| Menominee | 4 | 0.0% |
| Mexican | 2,522 | 27.5% |
| Navajo | 939 | 10.2% |
| Norwegian | 19 | 0.2% |
| Paiute | 8 | 0.1% |
| Polish | 80 | 0.9% |
| Portuguese | 11 | 0.1% |
| Pueblo | 424 | 4.6% |
| Puerto Rican | 39 | 0.4% |
| Russian | 3 | 0.0% |
| Scandinavian | 29 | 0.3% |
| Scotch-Irish | 29 | 0.3% |
| Scottish | 212 | 2.3% |
| Sioux | 23 | 0.3% |
| Slavic | 11 | 0.1% |
| Spaniard | 656 | 7.1% |
| Spanish | 495 | 5.4% |
| Spanish American | 72 | 0.8% |
| Sri Lankan | 44 | 0.5% |
| Subsaharan African | 6 | 0.1% |
| Swedish | 44 | 0.5% |
| Ute | 89 | 1.0% |
| Welsh | 58 | 0.6% | View All 57 Rows |
Immigrants in Grants
The most numerous immigrant groups reported in Grants came from Latin America (589 | 6.4%), Central America (574 | 6.2%), Mexico (531 | 5.8%), Asia (56 | 0.6%), and South Eastern Asia (56 | 0.6%), together accounting for 19.7% of all Grants residents.
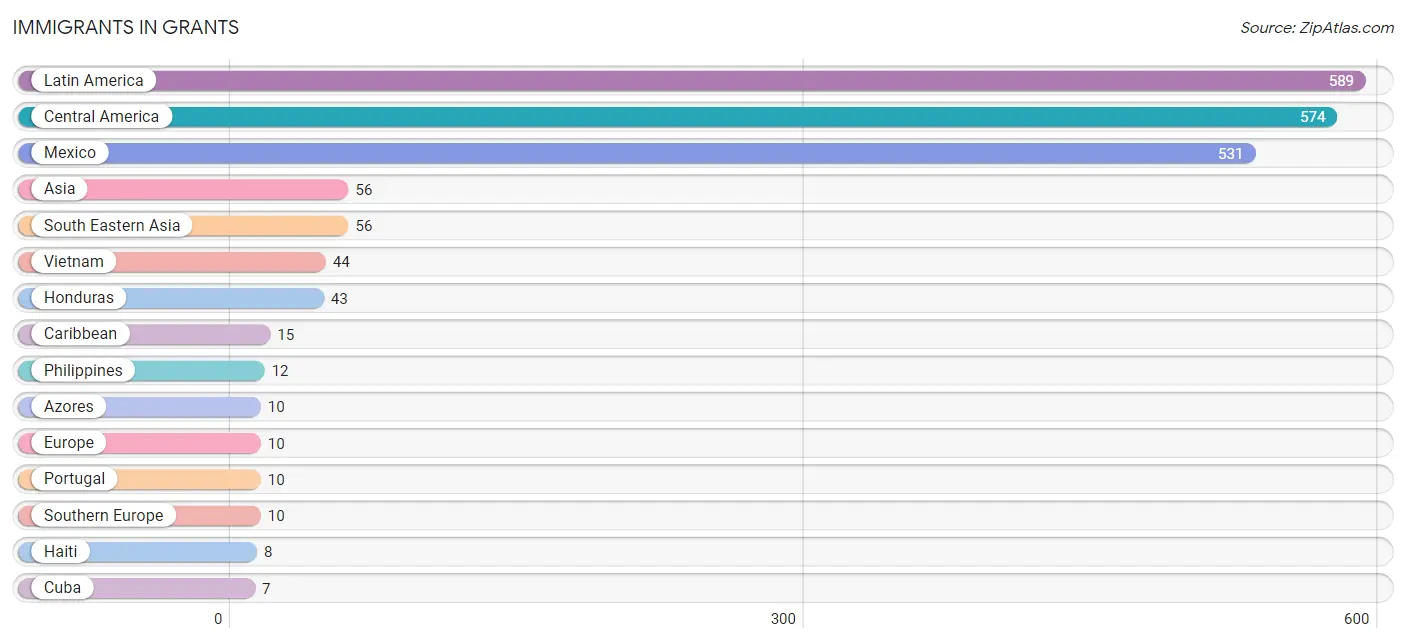
| Immigration Origin | # Population | % Population |
| Asia | 56 | 0.6% |
| Azores | 10 | 0.1% |
| Caribbean | 15 | 0.2% |
| Central America | 574 | 6.2% |
| Cuba | 7 | 0.1% |
| Europe | 10 | 0.1% |
| Haiti | 8 | 0.1% |
| Honduras | 43 | 0.5% |
| Latin America | 589 | 6.4% |
| Mexico | 531 | 5.8% |
| Micronesia | 6 | 0.1% |
| Oceania | 6 | 0.1% |
| Philippines | 12 | 0.1% |
| Portugal | 10 | 0.1% |
| South Eastern Asia | 56 | 0.6% |
| Southern Europe | 10 | 0.1% |
| Vietnam | 44 | 0.5% | View All 17 Rows |
Sex and Age in Grants
Sex and Age in Grants
The most populous age groups in Grants are 40 to 44 Years (586 | 12.3%) for men and 5 to 9 Years (592 | 13.5%) for women.
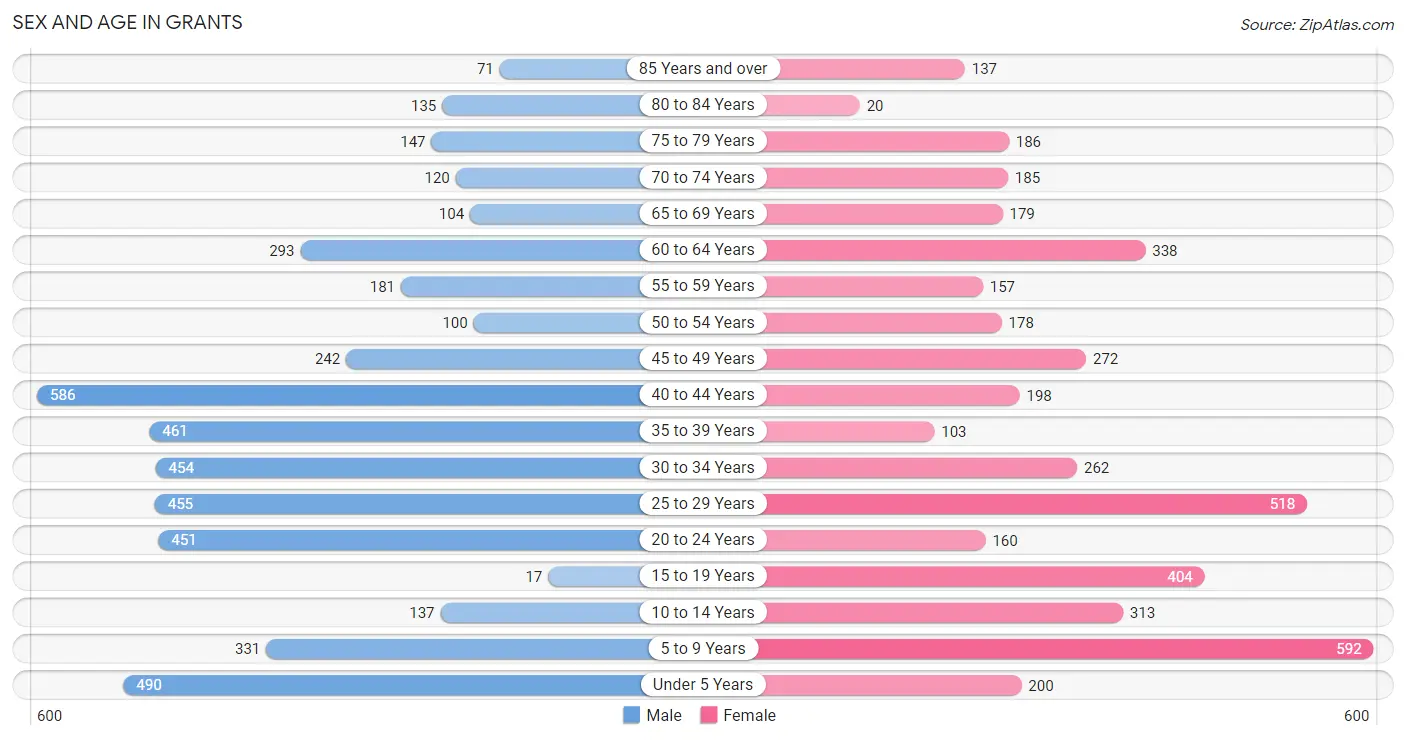
| Age Bracket | Male | Female |
| Under 5 Years | 490 (10.3%) | 200 (4.5%) |
| 5 to 9 Years | 331 (6.9%) | 592 (13.5%) |
| 10 to 14 Years | 137 (2.9%) | 313 (7.1%) |
| 15 to 19 Years | 17 (0.4%) | 404 (9.2%) |
| 20 to 24 Years | 451 (9.5%) | 160 (3.6%) |
| 25 to 29 Years | 455 (9.5%) | 518 (11.8%) |
| 30 to 34 Years | 454 (9.5%) | 262 (5.9%) |
| 35 to 39 Years | 461 (9.7%) | 103 (2.3%) |
| 40 to 44 Years | 586 (12.3%) | 198 (4.5%) |
| 45 to 49 Years | 242 (5.1%) | 272 (6.2%) |
| 50 to 54 Years | 100 (2.1%) | 178 (4.0%) |
| 55 to 59 Years | 181 (3.8%) | 157 (3.6%) |
| 60 to 64 Years | 293 (6.1%) | 338 (7.7%) |
| 65 to 69 Years | 104 (2.2%) | 179 (4.1%) |
| 70 to 74 Years | 120 (2.5%) | 185 (4.2%) |
| 75 to 79 Years | 147 (3.1%) | 186 (4.2%) |
| 80 to 84 Years | 135 (2.8%) | 20 (0.4%) |
| 85 Years and over | 71 (1.5%) | 137 (3.1%) |
| Total | 4,775 (100.0%) | 4,402 (100.0%) |
Families and Households in Grants
Median Family Size in Grants
The median family size in Grants is 3.57 persons per family, with single female/mother families (400 | 20.9%) accounting for the largest median family size of 3.89 persons per family. On the other hand, single male/father families (176 | 9.2%) represent the smallest median family size with 3.36 persons per family.
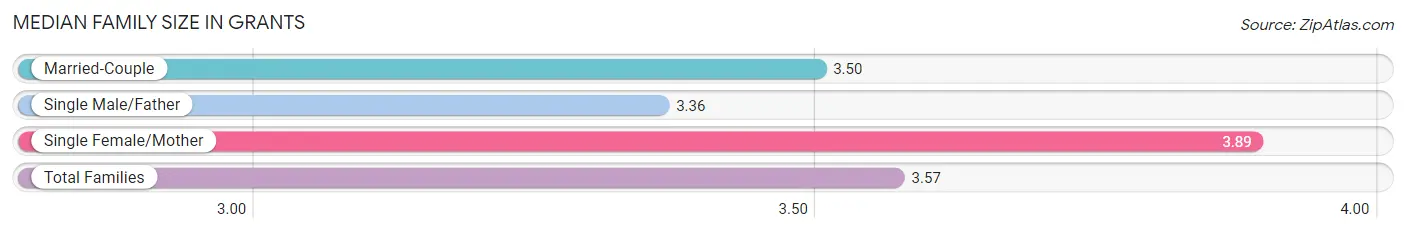
| Family Type | # Families | Family Size |
| Married-Couple | 1,339 (69.9%) | 3.50 |
| Single Male/Father | 176 (9.2%) | 3.36 |
| Single Female/Mother | 400 (20.9%) | 3.89 |
| Total Families | 1,915 (100.0%) | 3.57 |
Median Household Size in Grants
The median household size in Grants is 2.85 persons per household, with single female/mother households (400 | 13.7%) accounting for the largest median household size of 4.41 persons per household. non-family households (1,009 | 34.5%) represent the smallest median household size with 1.21 persons per household.
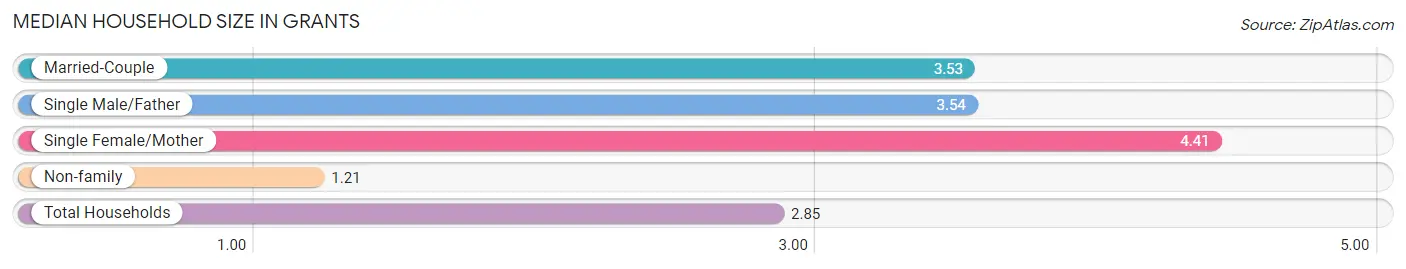
| Household Type | # Households | Household Size |
| Married-Couple | 1,339 (45.8%) | 3.53 |
| Single Male/Father | 176 (6.0%) | 3.54 |
| Single Female/Mother | 400 (13.7%) | 4.41 |
| Non-family | 1,009 (34.5%) | 1.21 |
| Total Households | 2,924 (100.0%) | 2.85 |
Household Size by Marriage Status in Grants
Out of a total of 2,924 households in Grants, 1,915 (65.5%) are family households, while 1,009 (34.5%) are nonfamily households. The most numerous type of family households are 2-person households, comprising 940, and the most common type of nonfamily households are 1-person households, comprising 816.
| Household Size | Family Households | Nonfamily Households |
| 1-Person Households | - | 816 (27.9%) |
| 2-Person Households | 940 (32.2%) | 193 (6.6%) |
| 3-Person Households | 246 (8.4%) | 0 (0.0%) |
| 4-Person Households | 316 (10.8%) | 0 (0.0%) |
| 5-Person Households | 331 (11.3%) | 0 (0.0%) |
| 6-Person Households | 82 (2.8%) | 0 (0.0%) |
| 7+ Person Households | 0 (0.0%) | 0 (0.0%) |
| Total | 1,915 (65.5%) | 1,009 (34.5%) |
Female Fertility in Grants
Fertility by Age in Grants
Average fertility rate in Grants is 101.0 births per 1,000 women. Women in the age bracket of 20 to 34 years have the highest fertility rate with 189.0 births per 1,000 women. Women in the age bracket of 20 to 34 years acount for 91.7% of all women with births.
| Age Bracket | Women with Births | Births / 1,000 Women |
| 15 to 19 years | 16 (8.3%) | 40.0 |
| 20 to 34 years | 178 (91.7%) | 189.0 |
| 35 to 50 years | 0 (0.0%) | 0.0 |
| Total | 194 (100.0%) | 101.0 |
Fertility by Age by Marriage Status in Grants
46.9% of women with births (194) in Grants are married. The highest percentage of unmarried women with births falls into 15 to 19 years age bracket with 100.0% of them unmarried at the time of birth, while the lowest percentage of unmarried women with births belong to 20 to 34 years age bracket with 48.9% of them unmarried.
| Age Bracket | Married | Unmarried |
| 15 to 19 years | 0 (0.0%) | 16 (100.0%) |
| 20 to 34 years | 91 (51.1%) | 87 (48.9%) |
| 35 to 50 years | 0 (0.0%) | 0 (0.0%) |
| Total | 91 (46.9%) | 103 (53.1%) |
Fertility by Education in Grants
| Educational Attainment | Women with Births | Births / 1,000 Women |
| Less than High School | 0 (0.0%) | 0.0 |
| High School Diploma | 80 (41.2%) | 202.0 |
| College or Associate's Degree | 89 (45.9%) | 131.0 |
| Bachelor's Degree | 25 (12.9%) | 95.0 |
| Graduate Degree | 0 (0.0%) | 0.0 |
| Total | 194 (100.0%) | 101.0 |
Fertility by Education by Marriage Status in Grants
53.1% of women with births in Grants are unmarried. Women with the educational attainment of bachelor's degree are most likely to be married with 100.0% of them married at childbirth, while women with the educational attainment of high school diploma are least likely to be married with 61.3% of them unmarried at childbirth.
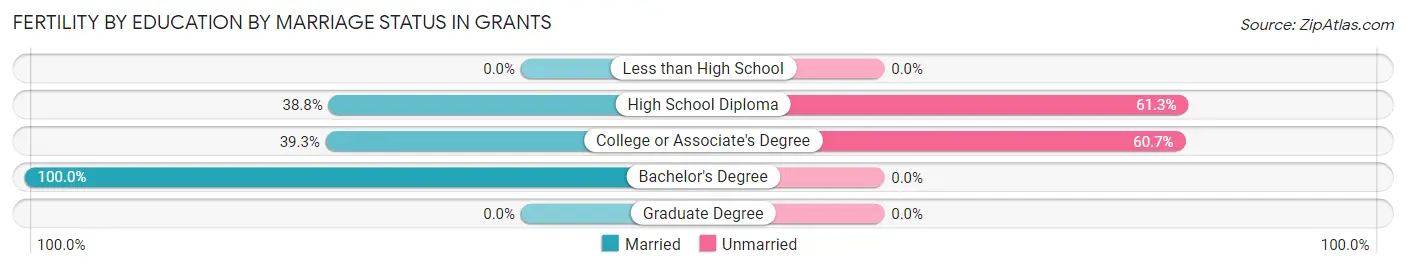
| Educational Attainment | Married | Unmarried |
| Less than High School | 0 (0.0%) | 0 (0.0%) |
| High School Diploma | 31 (38.8%) | 49 (61.3%) |
| College or Associate's Degree | 35 (39.3%) | 54 (60.7%) |
| Bachelor's Degree | 25 (100.0%) | 0 (0.0%) |
| Graduate Degree | 0 (0.0%) | 0 (0.0%) |
| Total | 91 (46.9%) | 103 (53.1%) |
Employment Characteristics in Grants
Employment by Class of Employer in Grants
Among the 3,217 employed individuals in Grants, private company employees (1,778 | 55.3%), not-for-profit organizations (319 | 9.9%), and local government employees (316 | 9.8%) make up the most common classes of employment.
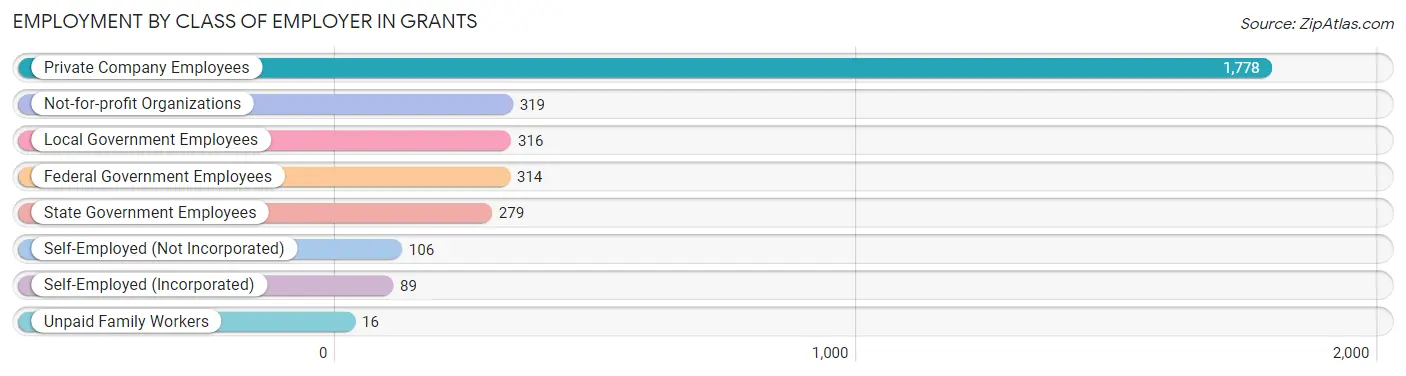
| Employer Class | # Employees | % Employees |
| Private Company Employees | 1,778 | 55.3% |
| Self-Employed (Incorporated) | 89 | 2.8% |
| Self-Employed (Not Incorporated) | 106 | 3.3% |
| Not-for-profit Organizations | 319 | 9.9% |
| Local Government Employees | 316 | 9.8% |
| State Government Employees | 279 | 8.7% |
| Federal Government Employees | 314 | 9.8% |
| Unpaid Family Workers | 16 | 0.5% |
| Total | 3,217 | 100.0% |
Employment Status by Age in Grants
According to the labor force statistics for Grants, out of the total population over 16 years of age (7,081), 48.2% or 3,413 individuals are in the labor force, with 4.5% or 154 of them unemployed. The age group with the highest labor force participation rate is 30 to 34 years, with 82.1% or 588 individuals in the labor force. Within the labor force, the 45 to 54 years age range has the highest percentage of unemployed individuals, with 10.3% or 29 of them being unemployed.
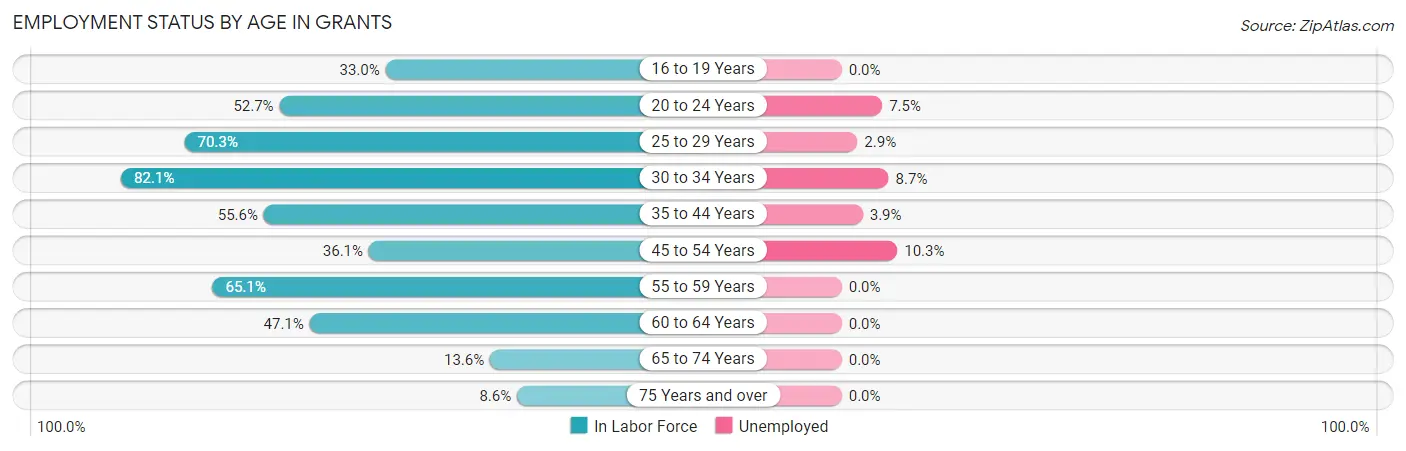
| Age Bracket | In Labor Force | Unemployed |
| 16 to 19 Years | 128 (33.0%) | 0 (0.0%) |
| 20 to 24 Years | 322 (52.7%) | 24 (7.5%) |
| 25 to 29 Years | 684 (70.3%) | 20 (2.9%) |
| 30 to 34 Years | 588 (82.1%) | 51 (8.7%) |
| 35 to 44 Years | 749 (55.6%) | 29 (3.9%) |
| 45 to 54 Years | 286 (36.1%) | 29 (10.3%) |
| 55 to 59 Years | 220 (65.1%) | 0 (0.0%) |
| 60 to 64 Years | 297 (47.1%) | 0 (0.0%) |
| 65 to 74 Years | 80 (13.6%) | 0 (0.0%) |
| 75 Years and over | 60 (8.6%) | 0 (0.0%) |
| Total | 3,413 (48.2%) | 154 (4.5%) |
Employment Status by Educational Attainment in Grants
According to labor force statistics for Grants, 58.9% of individuals (2,826) out of the total population between 25 and 64 years of age (4,798) are in the labor force, with 4.6% or 130 of them being unemployed. The group with the highest labor force participation rate are those with the educational attainment of bachelor's degree or higher, with 88.9% or 967 individuals in the labor force. Within the labor force, individuals with less than high school education have the highest percentage of unemployment, with 7.5% or 17 of them being unemployed.
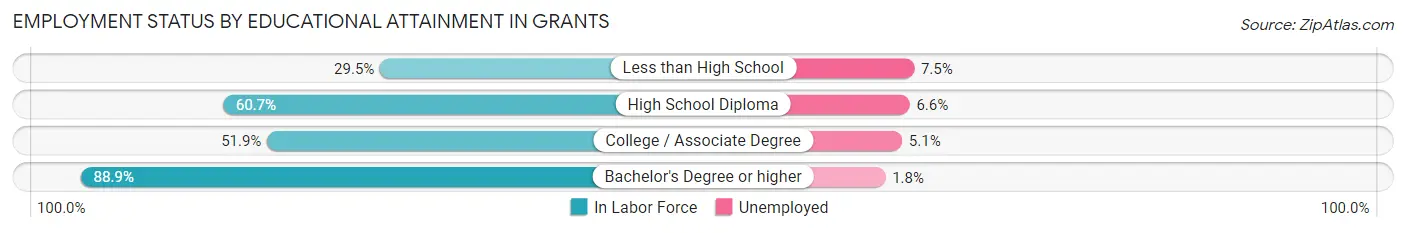
| Educational Attainment | In Labor Force | Unemployed |
| Less than High School | 228 (29.5%) | 58 (7.5%) |
| High School Diploma | 730 (60.7%) | 79 (6.6%) |
| College / Associate Degree | 900 (51.9%) | 88 (5.1%) |
| Bachelor's Degree or higher | 967 (88.9%) | 20 (1.8%) |
| Total | 2,826 (58.9%) | 221 (4.6%) |
Employment Occupations by Sex in Grants
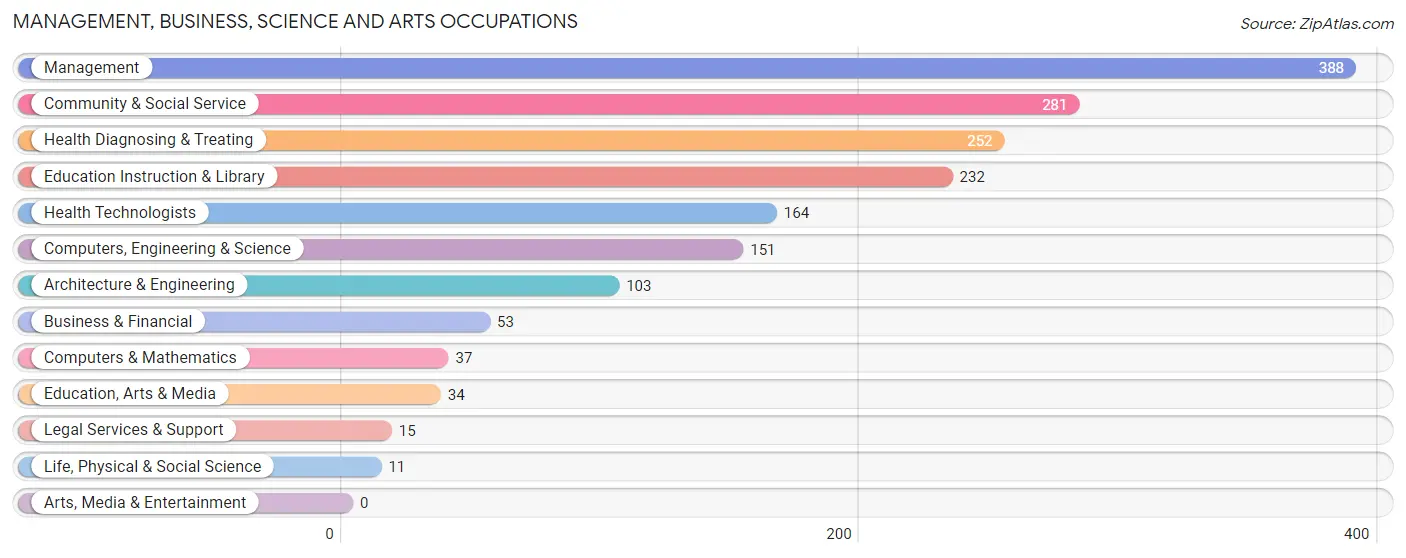
Management, Business, Science and Arts Occupations
The most common Management, Business, Science and Arts occupations in Grants are Management (388 | 11.9%), Community & Social Service (281 | 8.6%), Health Diagnosing & Treating (252 | 7.8%), Education Instruction & Library (232 | 7.1%), and Health Technologists (164 | 5.1%).
Management, Business, Science and Arts Occupations by Sex
Within the Management, Business, Science and Arts occupations in Grants, the most male-oriented occupations are Computers, Engineering & Science (100.0%), Computers & Mathematics (100.0%), and Architecture & Engineering (100.0%), while the most female-oriented occupations are Education Instruction & Library (85.3%), Community & Social Service (78.6%), and Health Diagnosing & Treating (73.8%).
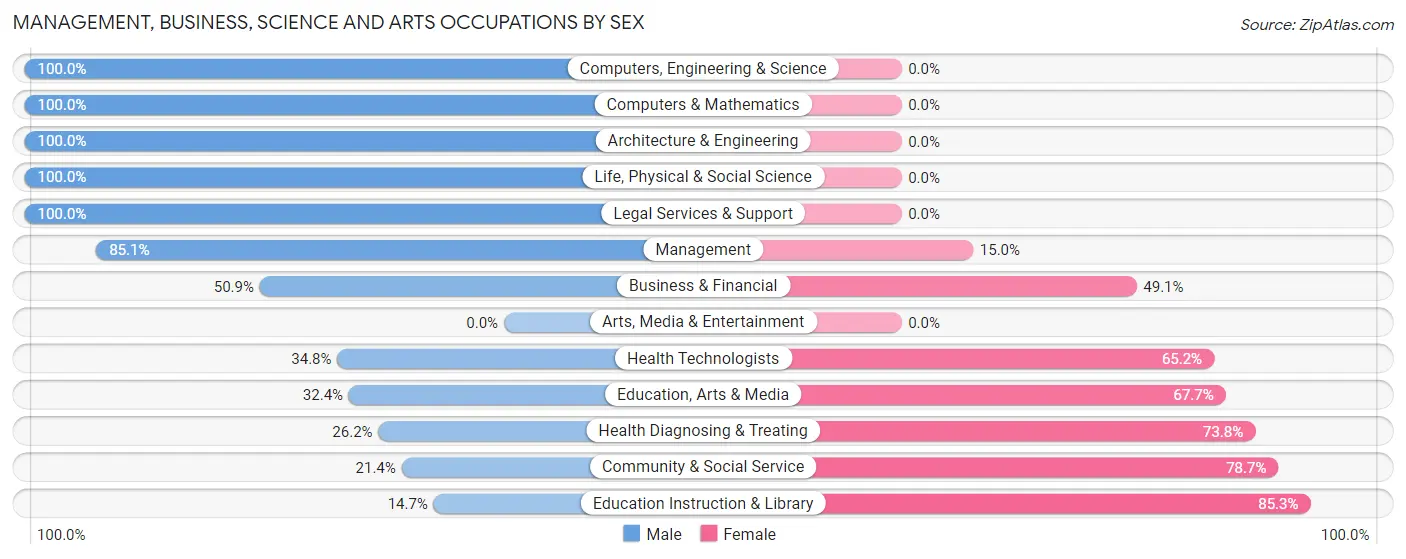
| Occupation | Male | Female |
| Management | 330 (85.1%) | 58 (14.9%) |
| Business & Financial | 27 (50.9%) | 26 (49.1%) |
| Computers, Engineering & Science | 151 (100.0%) | 0 (0.0%) |
| Computers & Mathematics | 37 (100.0%) | 0 (0.0%) |
| Architecture & Engineering | 103 (100.0%) | 0 (0.0%) |
| Life, Physical & Social Science | 11 (100.0%) | 0 (0.0%) |
| Community & Social Service | 60 (21.3%) | 221 (78.6%) |
| Education, Arts & Media | 11 (32.4%) | 23 (67.6%) |
| Legal Services & Support | 15 (100.0%) | 0 (0.0%) |
| Education Instruction & Library | 34 (14.7%) | 198 (85.3%) |
| Arts, Media & Entertainment | 0 (0.0%) | 0 (0.0%) |
| Health Diagnosing & Treating | 66 (26.2%) | 186 (73.8%) |
| Health Technologists | 57 (34.8%) | 107 (65.2%) |
| Total (Category) | 634 (56.4%) | 491 (43.6%) |
| Total (Overall) | 1,736 (53.4%) | 1,512 (46.6%) |
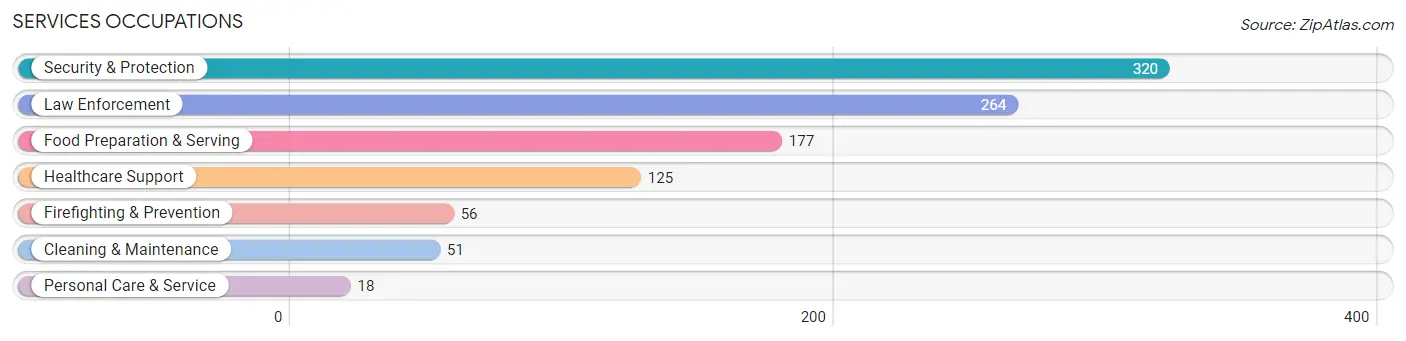
Services Occupations
The most common Services occupations in Grants are Security & Protection (320 | 9.9%), Law Enforcement (264 | 8.1%), Food Preparation & Serving (177 | 5.4%), Healthcare Support (125 | 3.8%), and Firefighting & Prevention (56 | 1.7%).
Services Occupations by Sex
Within the Services occupations in Grants, the most male-oriented occupations are Firefighting & Prevention (100.0%), Cleaning & Maintenance (100.0%), and Security & Protection (75.6%), while the most female-oriented occupations are Healthcare Support (100.0%), Personal Care & Service (100.0%), and Food Preparation & Serving (52.0%).
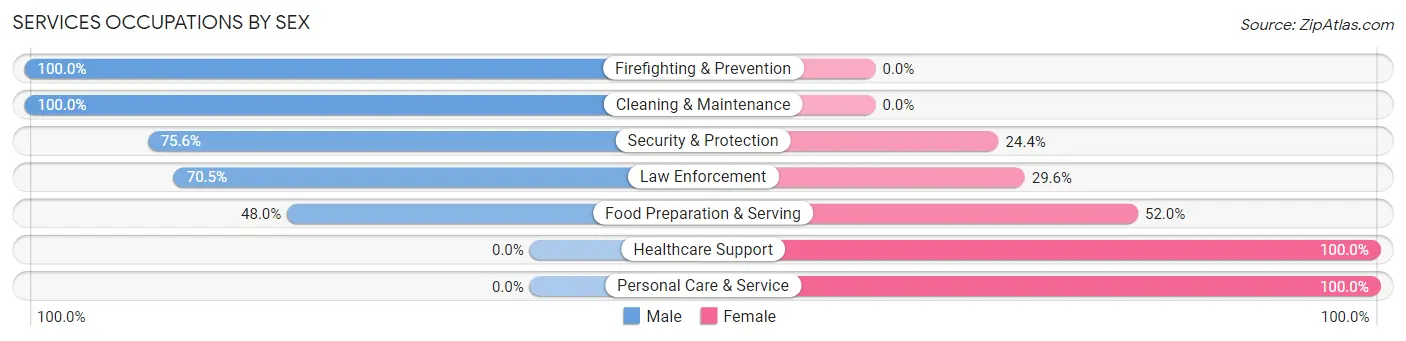
| Occupation | Male | Female |
| Healthcare Support | 0 (0.0%) | 125 (100.0%) |
| Security & Protection | 242 (75.6%) | 78 (24.4%) |
| Firefighting & Prevention | 56 (100.0%) | 0 (0.0%) |
| Law Enforcement | 186 (70.5%) | 78 (29.5%) |
| Food Preparation & Serving | 85 (48.0%) | 92 (52.0%) |
| Cleaning & Maintenance | 51 (100.0%) | 0 (0.0%) |
| Personal Care & Service | 0 (0.0%) | 18 (100.0%) |
| Total (Category) | 378 (54.7%) | 313 (45.3%) |
| Total (Overall) | 1,736 (53.4%) | 1,512 (46.6%) |
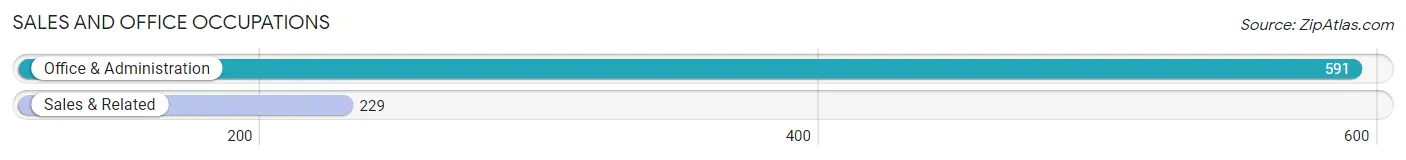
Sales and Office Occupations
The most common Sales and Office occupations in Grants are Office & Administration (591 | 18.2%), and Sales & Related (229 | 7.0%).
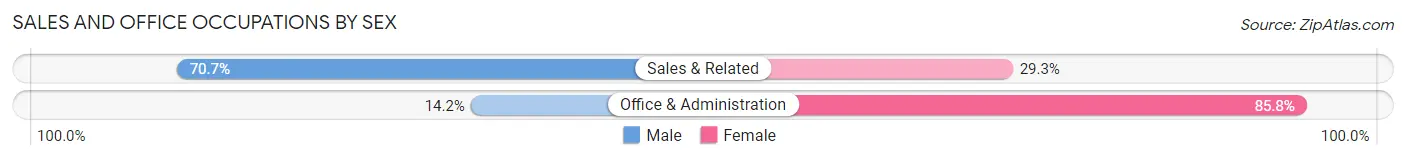
Sales and Office Occupations by Sex
| Occupation | Male | Female |
| Sales & Related | 162 (70.7%) | 67 (29.3%) |
| Office & Administration | 84 (14.2%) | 507 (85.8%) |
| Total (Category) | 246 (30.0%) | 574 (70.0%) |
| Total (Overall) | 1,736 (53.4%) | 1,512 (46.6%) |
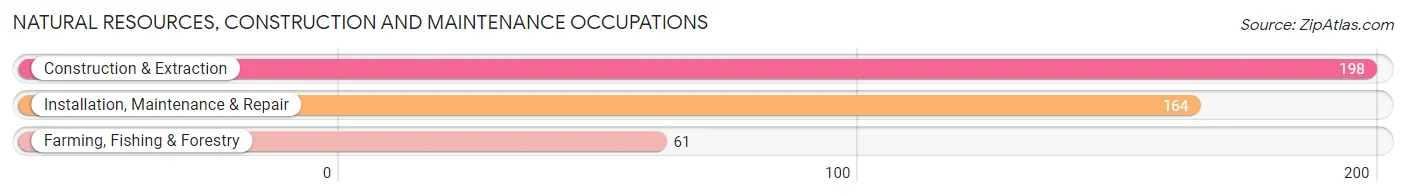
Natural Resources, Construction and Maintenance Occupations
The most common Natural Resources, Construction and Maintenance occupations in Grants are Construction & Extraction (198 | 6.1%), Installation, Maintenance & Repair (164 | 5.1%), and Farming, Fishing & Forestry (61 | 1.9%).
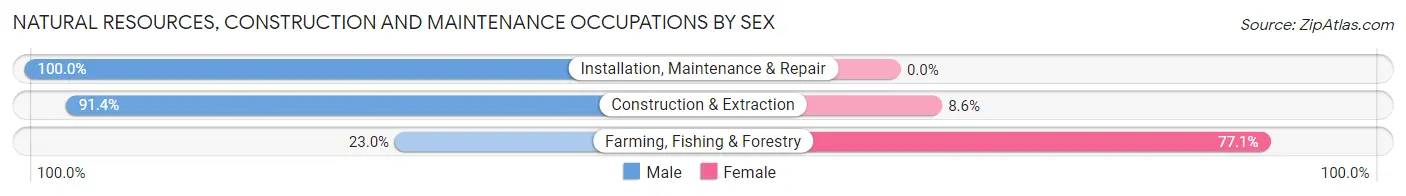
Natural Resources, Construction and Maintenance Occupations by Sex
| Occupation | Male | Female |
| Farming, Fishing & Forestry | 14 (23.0%) | 47 (77.0%) |
| Construction & Extraction | 181 (91.4%) | 17 (8.6%) |
| Installation, Maintenance & Repair | 164 (100.0%) | 0 (0.0%) |
| Total (Category) | 359 (84.9%) | 64 (15.1%) |
| Total (Overall) | 1,736 (53.4%) | 1,512 (46.6%) |
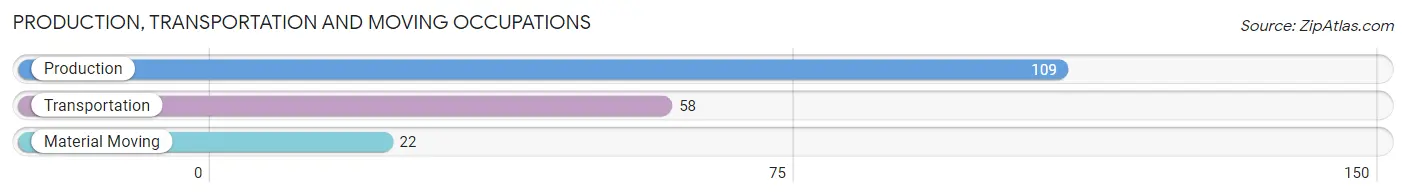
Production, Transportation and Moving Occupations
The most common Production, Transportation and Moving occupations in Grants are Production (109 | 3.4%), Transportation (58 | 1.8%), and Material Moving (22 | 0.7%).
Production, Transportation and Moving Occupations by Sex
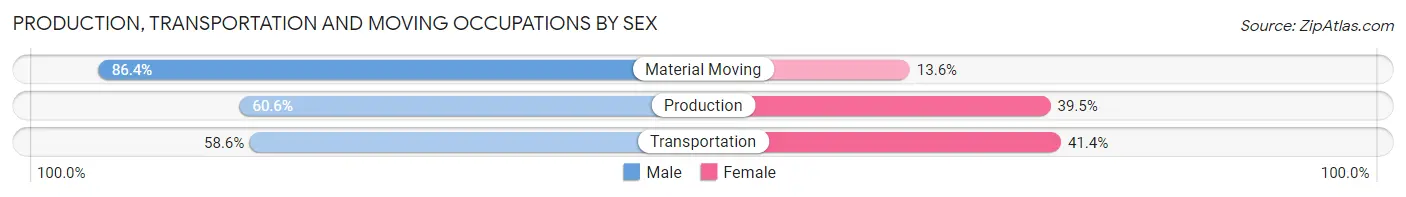
| Occupation | Male | Female |
| Production | 66 (60.6%) | 43 (39.5%) |
| Transportation | 34 (58.6%) | 24 (41.4%) |
| Material Moving | 19 (86.4%) | 3 (13.6%) |
| Total (Category) | 119 (63.0%) | 70 (37.0%) |
| Total (Overall) | 1,736 (53.4%) | 1,512 (46.6%) |
Employment Industries by Sex in Grants
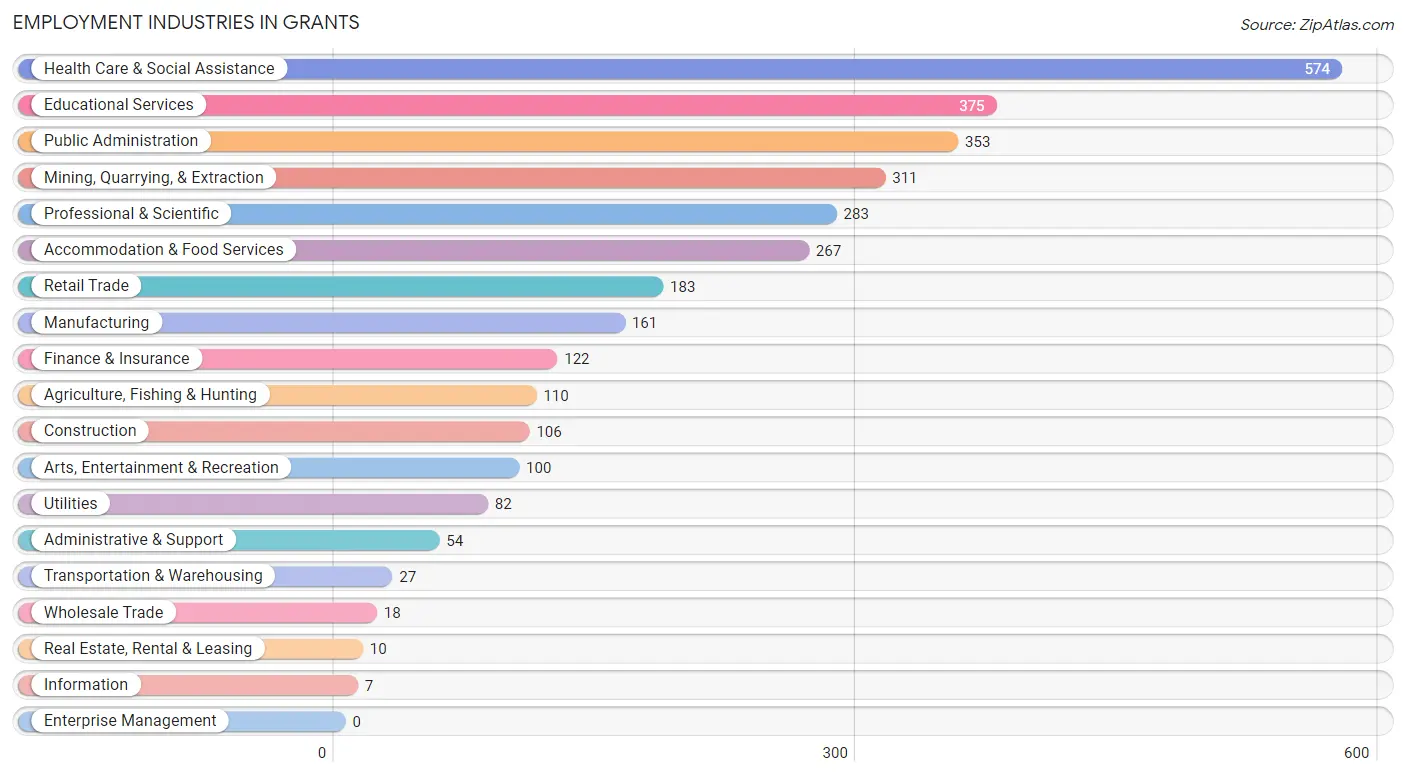
Employment Industries in Grants
The major employment industries in Grants include Health Care & Social Assistance (574 | 17.7%), Educational Services (375 | 11.6%), Public Administration (353 | 10.9%), Mining, Quarrying, & Extraction (311 | 9.6%), and Professional & Scientific (283 | 8.7%).
Employment Industries by Sex in Grants
The Grants industries that see more men than women are Construction (100.0%), Transportation & Warehousing (100.0%), and Utilities (100.0%), whereas the industries that tend to have a higher number of women are Wholesale Trade (100.0%), Real Estate, Rental & Leasing (100.0%), and Health Care & Social Assistance (88.3%).
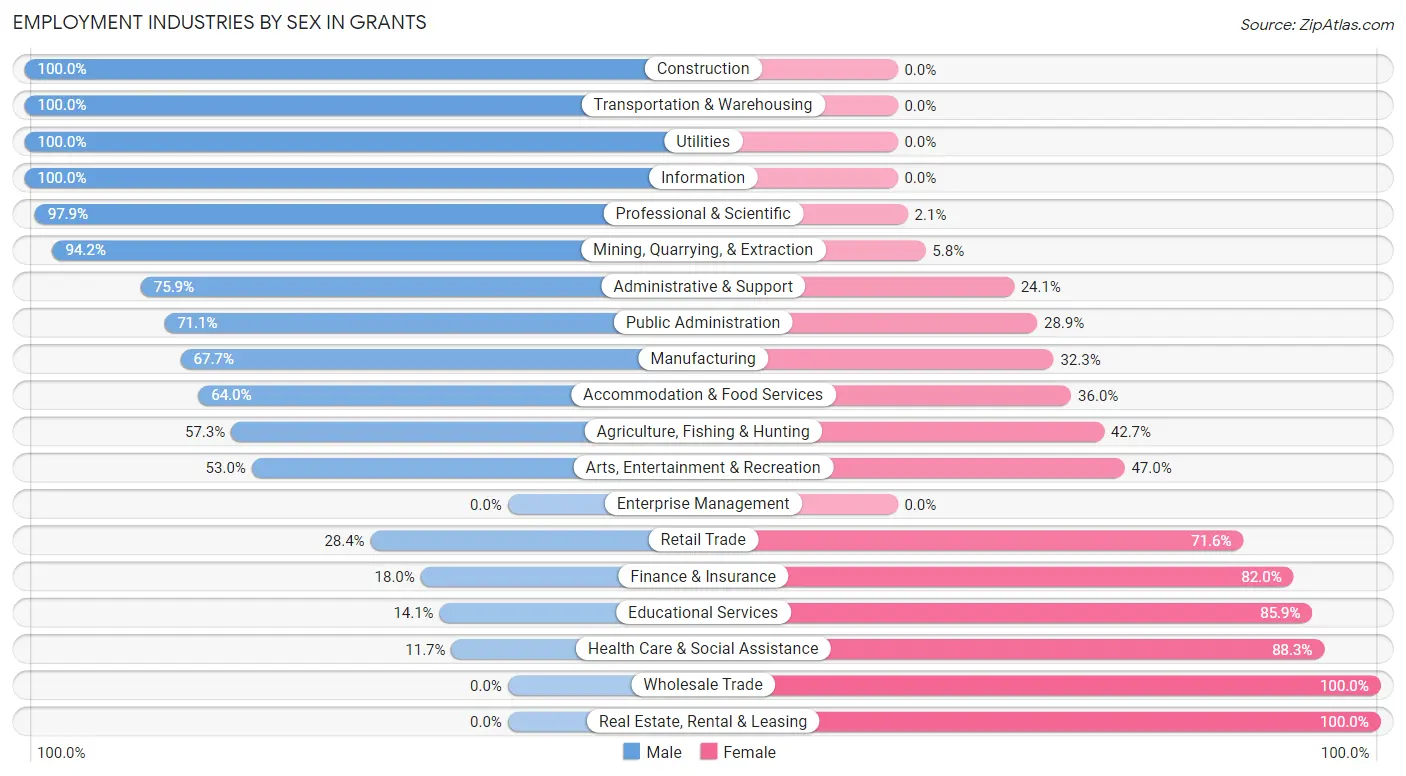
| Industry | Male | Female |
| Agriculture, Fishing & Hunting | 63 (57.3%) | 47 (42.7%) |
| Mining, Quarrying, & Extraction | 293 (94.2%) | 18 (5.8%) |
| Construction | 106 (100.0%) | 0 (0.0%) |
| Manufacturing | 109 (67.7%) | 52 (32.3%) |
| Wholesale Trade | 0 (0.0%) | 18 (100.0%) |
| Retail Trade | 52 (28.4%) | 131 (71.6%) |
| Transportation & Warehousing | 27 (100.0%) | 0 (0.0%) |
| Utilities | 82 (100.0%) | 0 (0.0%) |
| Information | 7 (100.0%) | 0 (0.0%) |
| Finance & Insurance | 22 (18.0%) | 100 (82.0%) |
| Real Estate, Rental & Leasing | 0 (0.0%) | 10 (100.0%) |
| Professional & Scientific | 277 (97.9%) | 6 (2.1%) |
| Enterprise Management | 0 (0.0%) | 0 (0.0%) |
| Administrative & Support | 41 (75.9%) | 13 (24.1%) |
| Educational Services | 53 (14.1%) | 322 (85.9%) |
| Health Care & Social Assistance | 67 (11.7%) | 507 (88.3%) |
| Arts, Entertainment & Recreation | 53 (53.0%) | 47 (47.0%) |
| Accommodation & Food Services | 171 (64.0%) | 96 (36.0%) |
| Public Administration | 251 (71.1%) | 102 (28.9%) |
| Total | 1,736 (53.4%) | 1,512 (46.6%) |
Education in Grants
School Enrollment in Grants
The most common levels of schooling among the 2,213 students in Grants are elementary school (514 | 23.2%), college / undergraduate (496 | 22.4%), and middle school (425 | 19.2%).
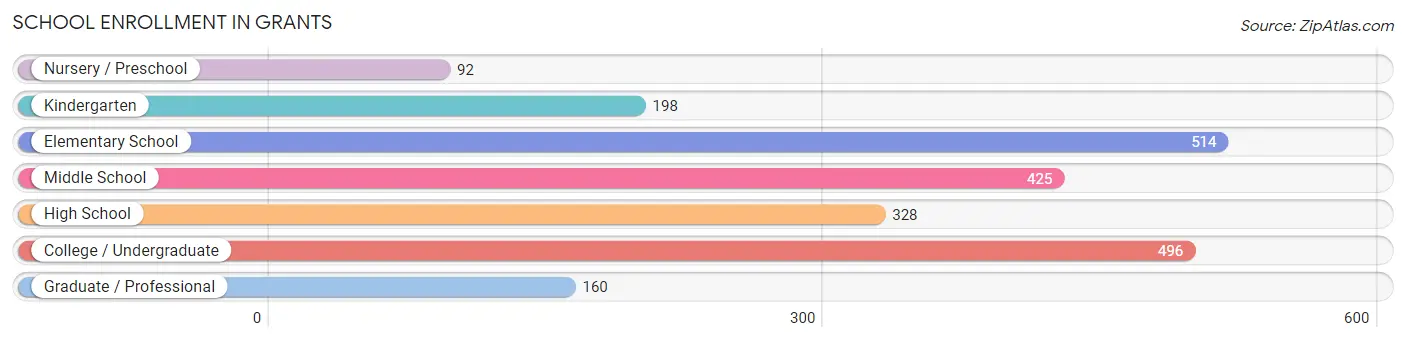
| School Level | # Students | % Students |
| Nursery / Preschool | 92 | 4.2% |
| Kindergarten | 198 | 8.9% |
| Elementary School | 514 | 23.2% |
| Middle School | 425 | 19.2% |
| High School | 328 | 14.8% |
| College / Undergraduate | 496 | 22.4% |
| Graduate / Professional | 160 | 7.2% |
| Total | 2,213 | 100.0% |
School Enrollment by Age by Funding Source in Grants
Out of a total of 2,213 students who are enrolled in schools in Grants, 168 (7.6%) attend a private institution, while the remaining 2,045 (92.4%) are enrolled in public schools. The age group of 25 to 34 year olds has the highest likelihood of being enrolled in private schools, with 76 (50.3% in the age bracket) enrolled. Conversely, the age group of 3 to 4 year olds has the lowest likelihood of being enrolled in a private school, with 76 (100.0% in the age bracket) attending a public institution.
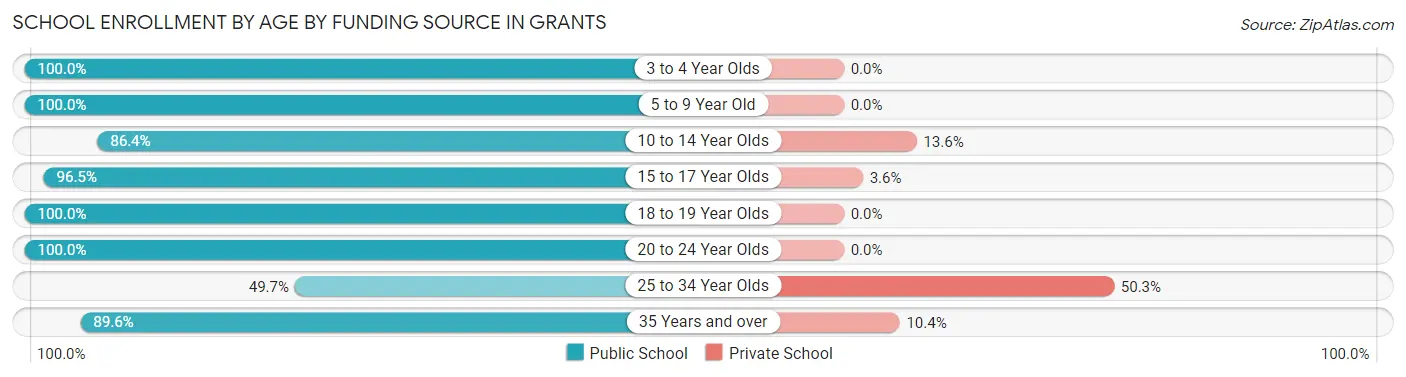
| Age Bracket | Public School | Private School |
| 3 to 4 Year Olds | 76 (100.0%) | 0 (0.0%) |
| 5 to 9 Year Old | 688 (100.0%) | 0 (0.0%) |
| 10 to 14 Year Olds | 389 (86.4%) | 61 (13.6%) |
| 15 to 17 Year Olds | 163 (96.5%) | 6 (3.5%) |
| 18 to 19 Year Olds | 225 (100.0%) | 0 (0.0%) |
| 20 to 24 Year Olds | 204 (100.0%) | 0 (0.0%) |
| 25 to 34 Year Olds | 75 (49.7%) | 76 (50.3%) |
| 35 Years and over | 224 (89.6%) | 26 (10.4%) |
| Total | 2,045 (92.4%) | 168 (7.6%) |
Educational Attainment by Field of Study in Grants
Business (465 | 35.7%), science & technology (189 | 14.5%), education (170 | 13.0%), liberal arts & history (92 | 7.1%), and social sciences (90 | 6.9%) are the most common fields of study among 1,304 individuals in Grants who have obtained a bachelor's degree or higher.
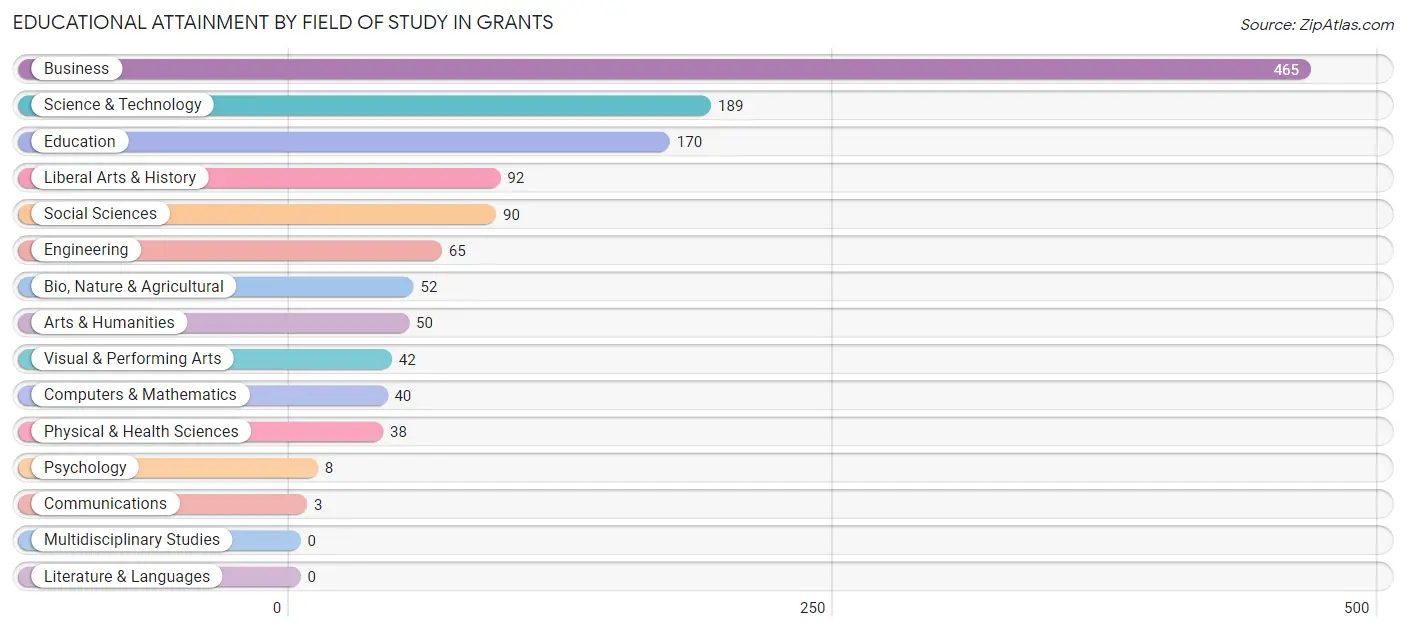
| Field of Study | # Graduates | % Graduates |
| Computers & Mathematics | 40 | 3.1% |
| Bio, Nature & Agricultural | 52 | 4.0% |
| Physical & Health Sciences | 38 | 2.9% |
| Psychology | 8 | 0.6% |
| Social Sciences | 90 | 6.9% |
| Engineering | 65 | 5.0% |
| Multidisciplinary Studies | 0 | 0.0% |
| Science & Technology | 189 | 14.5% |
| Business | 465 | 35.7% |
| Education | 170 | 13.0% |
| Literature & Languages | 0 | 0.0% |
| Liberal Arts & History | 92 | 7.1% |
| Visual & Performing Arts | 42 | 3.2% |
| Communications | 3 | 0.2% |
| Arts & Humanities | 50 | 3.8% |
| Total | 1,304 | 100.0% |
Transportation & Commute in Grants
Vehicle Availability by Sex in Grants
The most prevalent vehicle ownership categories in Grants are males with 2 vehicles (589, accounting for 34.3%) and females with 2 vehicles (377, making up 40.5%).
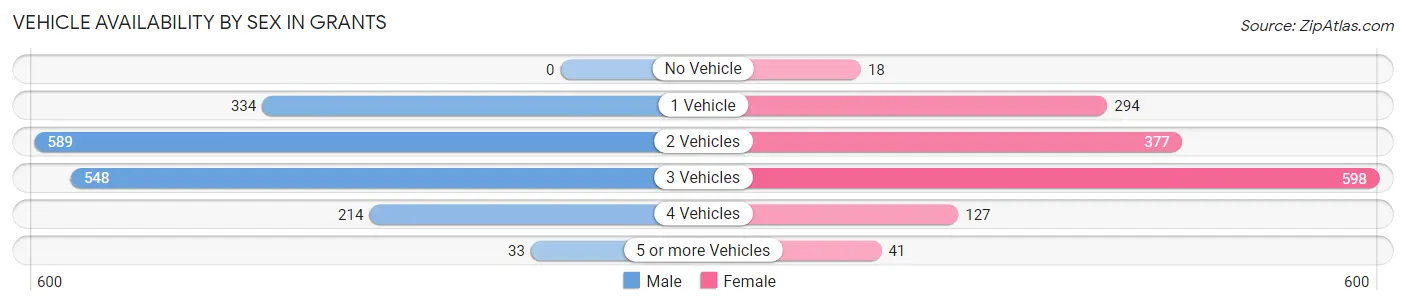
| Vehicles Available | Male | Female |
| No Vehicle | 0 (0.0%) | 18 (1.2%) |
| 1 Vehicle | 334 (19.4%) | 294 (20.2%) |
| 2 Vehicles | 589 (34.3%) | 377 (25.9%) |
| 3 Vehicles | 548 (31.9%) | 598 (41.1%) |
| 4 Vehicles | 214 (12.5%) | 127 (8.7%) |
| 5 or more Vehicles | 33 (1.9%) | 41 (2.8%) |
| Total | 1,718 (100.0%) | 1,455 (100.0%) |
Commute Time in Grants
The most frequently occuring commute durations in Grants are 5 to 9 minutes (1,107 commuters, 38.2%), 10 to 14 minutes (526 commuters, 18.1%), and 45 to 59 minutes (457 commuters, 15.8%).
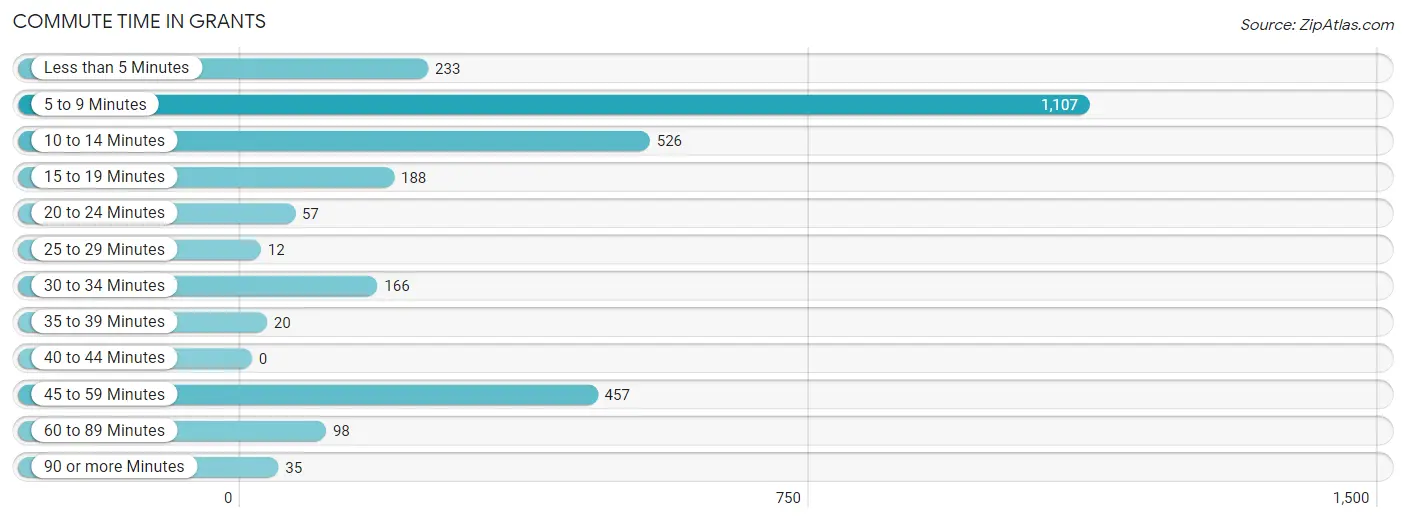
| Commute Time | # Commuters | % Commuters |
| Less than 5 Minutes | 233 | 8.0% |
| 5 to 9 Minutes | 1,107 | 38.2% |
| 10 to 14 Minutes | 526 | 18.1% |
| 15 to 19 Minutes | 188 | 6.5% |
| 20 to 24 Minutes | 57 | 2.0% |
| 25 to 29 Minutes | 12 | 0.4% |
| 30 to 34 Minutes | 166 | 5.7% |
| 35 to 39 Minutes | 20 | 0.7% |
| 40 to 44 Minutes | 0 | 0.0% |
| 45 to 59 Minutes | 457 | 15.8% |
| 60 to 89 Minutes | 98 | 3.4% |
| 90 or more Minutes | 35 | 1.2% |
Commute Time by Sex in Grants
The most common commute times in Grants are 5 to 9 minutes (462 commuters, 28.4%) for males and 5 to 9 minutes (645 commuters, 50.8%) for females.
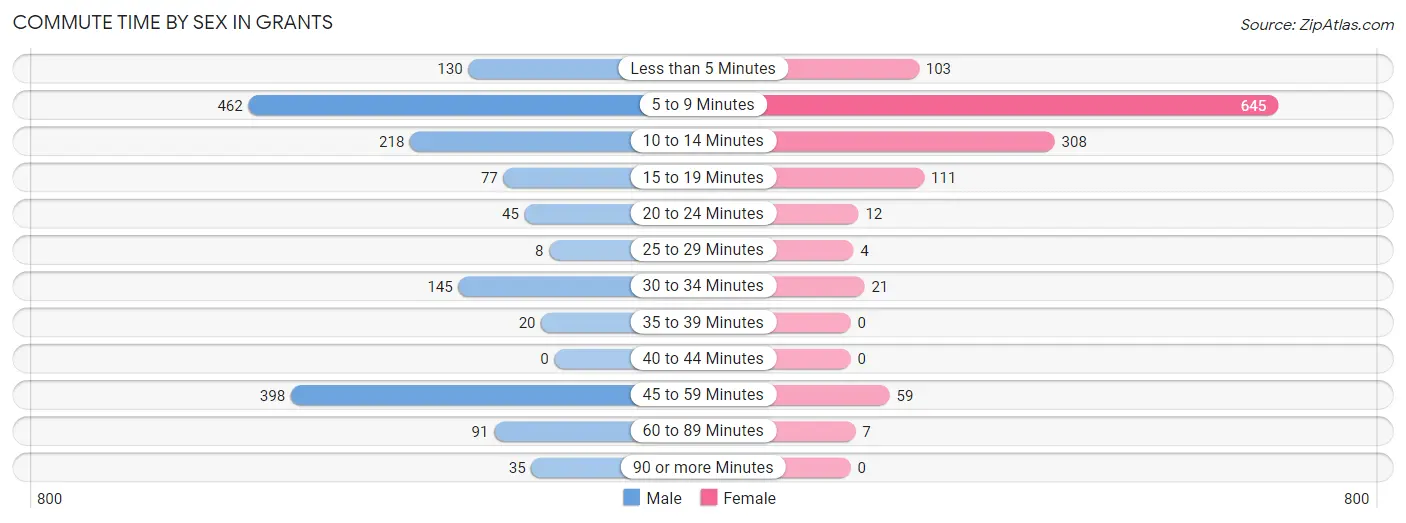
| Commute Time | Male | Female |
| Less than 5 Minutes | 130 (8.0%) | 103 (8.1%) |
| 5 to 9 Minutes | 462 (28.4%) | 645 (50.8%) |
| 10 to 14 Minutes | 218 (13.4%) | 308 (24.2%) |
| 15 to 19 Minutes | 77 (4.7%) | 111 (8.7%) |
| 20 to 24 Minutes | 45 (2.8%) | 12 (0.9%) |
| 25 to 29 Minutes | 8 (0.5%) | 4 (0.3%) |
| 30 to 34 Minutes | 145 (8.9%) | 21 (1.7%) |
| 35 to 39 Minutes | 20 (1.2%) | 0 (0.0%) |
| 40 to 44 Minutes | 0 (0.0%) | 0 (0.0%) |
| 45 to 59 Minutes | 398 (24.4%) | 59 (4.6%) |
| 60 to 89 Minutes | 91 (5.6%) | 7 (0.5%) |
| 90 or more Minutes | 35 (2.1%) | 0 (0.0%) |
Time of Departure to Work by Sex in Grants
The most frequent times of departure to work in Grants are 7:00 AM to 7:29 AM (291, 17.9%) for males and 7:30 AM to 7:59 AM (463, 36.5%) for females.
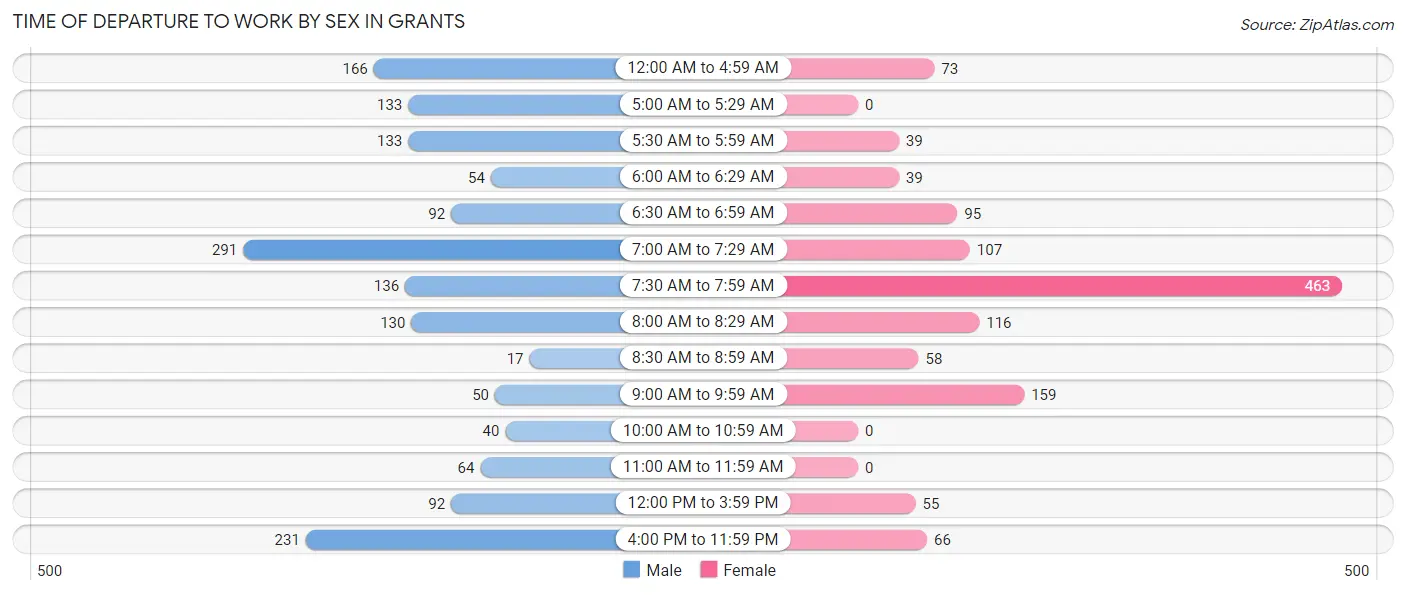
| Time of Departure | Male | Female |
| 12:00 AM to 4:59 AM | 166 (10.2%) | 73 (5.8%) |
| 5:00 AM to 5:29 AM | 133 (8.2%) | 0 (0.0%) |
| 5:30 AM to 5:59 AM | 133 (8.2%) | 39 (3.1%) |
| 6:00 AM to 6:29 AM | 54 (3.3%) | 39 (3.1%) |
| 6:30 AM to 6:59 AM | 92 (5.7%) | 95 (7.5%) |
| 7:00 AM to 7:29 AM | 291 (17.9%) | 107 (8.4%) |
| 7:30 AM to 7:59 AM | 136 (8.4%) | 463 (36.5%) |
| 8:00 AM to 8:29 AM | 130 (8.0%) | 116 (9.1%) |
| 8:30 AM to 8:59 AM | 17 (1.0%) | 58 (4.6%) |
| 9:00 AM to 9:59 AM | 50 (3.1%) | 159 (12.5%) |
| 10:00 AM to 10:59 AM | 40 (2.5%) | 0 (0.0%) |
| 11:00 AM to 11:59 AM | 64 (3.9%) | 0 (0.0%) |
| 12:00 PM to 3:59 PM | 92 (5.7%) | 55 (4.3%) |
| 4:00 PM to 11:59 PM | 231 (14.2%) | 66 (5.2%) |
| Total | 1,629 (100.0%) | 1,270 (100.0%) |
Housing Occupancy in Grants
Occupancy by Ownership in Grants
Of the total 2,924 dwellings in Grants, owner-occupied units account for 1,800 (61.6%), while renter-occupied units make up 1,124 (38.4%).
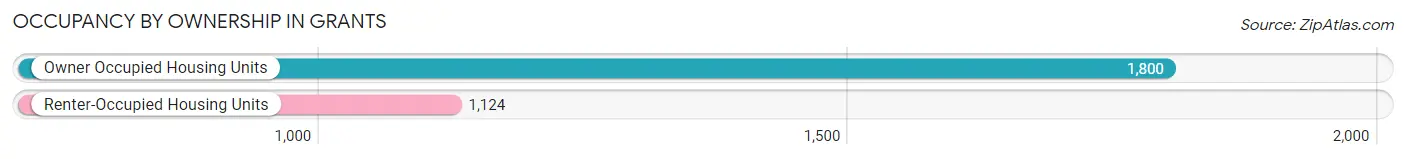
| Occupancy | # Housing Units | % Housing Units |
| Owner Occupied Housing Units | 1,800 | 61.6% |
| Renter-Occupied Housing Units | 1,124 | 38.4% |
| Total Occupied Housing Units | 2,924 | 100.0% |
Occupancy by Household Size in Grants
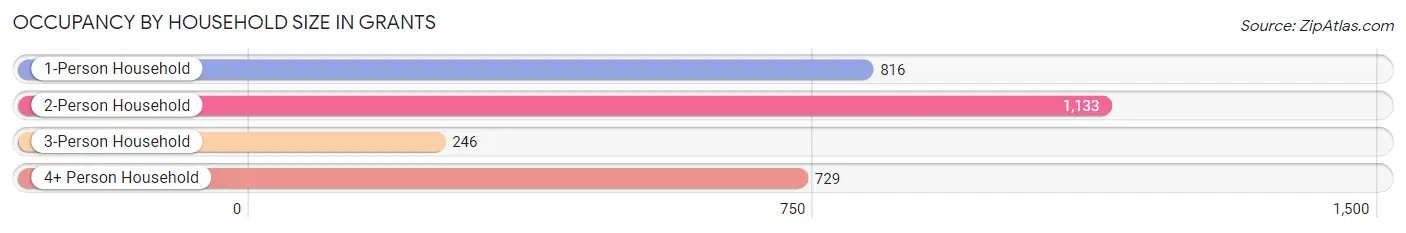
| Household Size | # Housing Units | % Housing Units |
| 1-Person Household | 816 | 27.9% |
| 2-Person Household | 1,133 | 38.8% |
| 3-Person Household | 246 | 8.4% |
| 4+ Person Household | 729 | 24.9% |
| Total Housing Units | 2,924 | 100.0% |
Occupancy by Ownership by Household Size in Grants
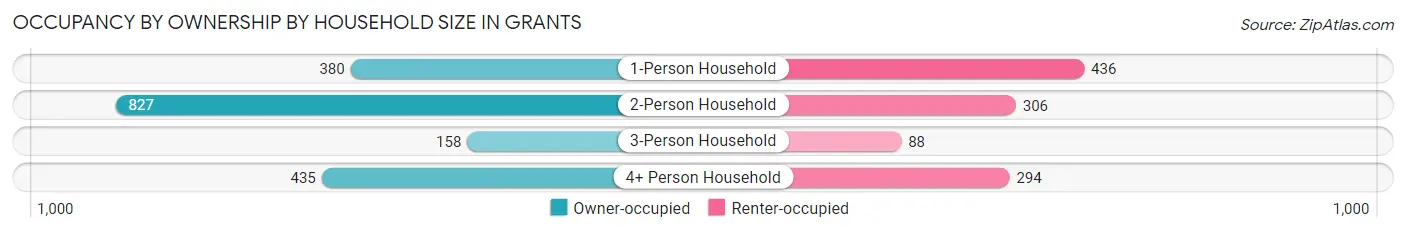
| Household Size | Owner-occupied | Renter-occupied |
| 1-Person Household | 380 (46.6%) | 436 (53.4%) |
| 2-Person Household | 827 (73.0%) | 306 (27.0%) |
| 3-Person Household | 158 (64.2%) | 88 (35.8%) |
| 4+ Person Household | 435 (59.7%) | 294 (40.3%) |
| Total Housing Units | 1,800 (61.6%) | 1,124 (38.4%) |
Occupancy by Educational Attainment in Grants
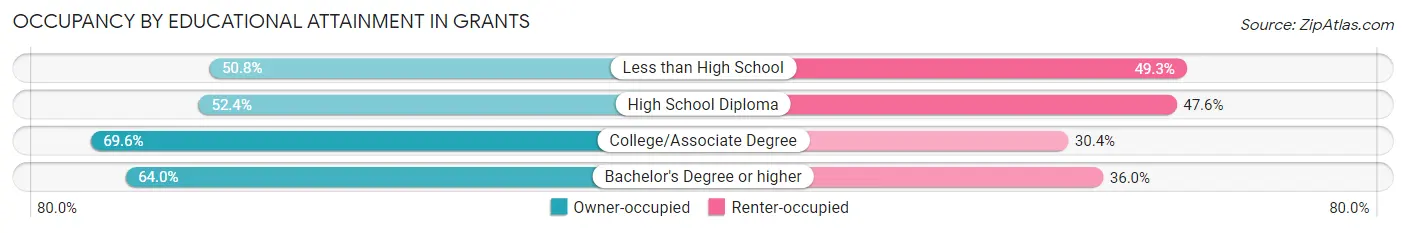
| Household Size | Owner-occupied | Renter-occupied |
| Less than High School | 204 (50.7%) | 198 (49.2%) |
| High School Diploma | 371 (52.4%) | 337 (47.6%) |
| College/Associate Degree | 794 (69.6%) | 347 (30.4%) |
| Bachelor's Degree or higher | 431 (64.0%) | 242 (36.0%) |
Occupancy by Age of Householder in Grants
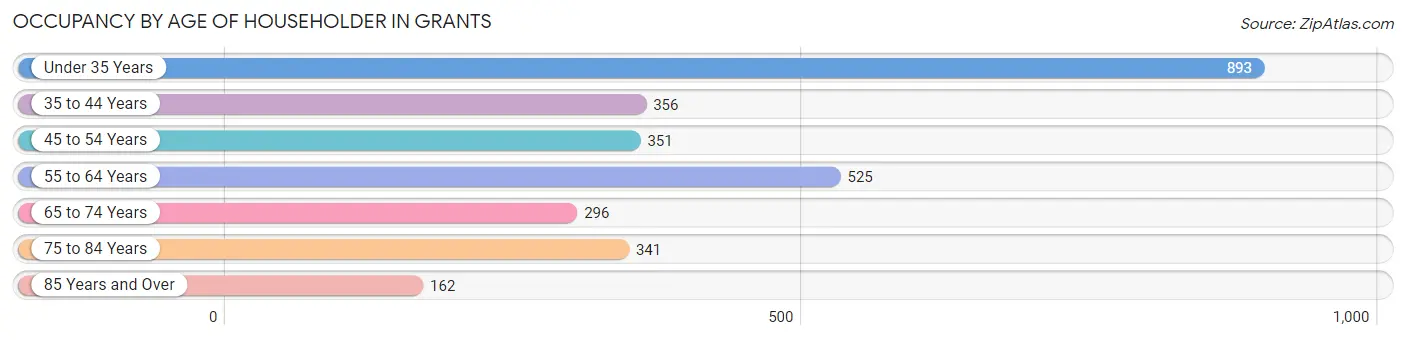
| Age Bracket | # Households | % Households |
| Under 35 Years | 893 | 30.5% |
| 35 to 44 Years | 356 | 12.2% |
| 45 to 54 Years | 351 | 12.0% |
| 55 to 64 Years | 525 | 17.9% |
| 65 to 74 Years | 296 | 10.1% |
| 75 to 84 Years | 341 | 11.7% |
| 85 Years and Over | 162 | 5.5% |
| Total | 2,924 | 100.0% |
Housing Finances in Grants
Median Income by Occupancy in Grants
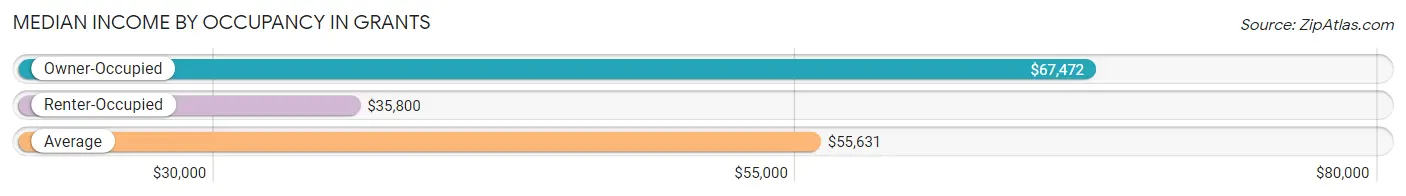
| Occupancy Type | # Households | Median Income |
| Owner-Occupied | 1,800 (61.6%) | $67,472 |
| Renter-Occupied | 1,124 (38.4%) | $35,800 |
| Average | 2,924 (100.0%) | $55,631 |
Occupancy by Householder Income Bracket in Grants
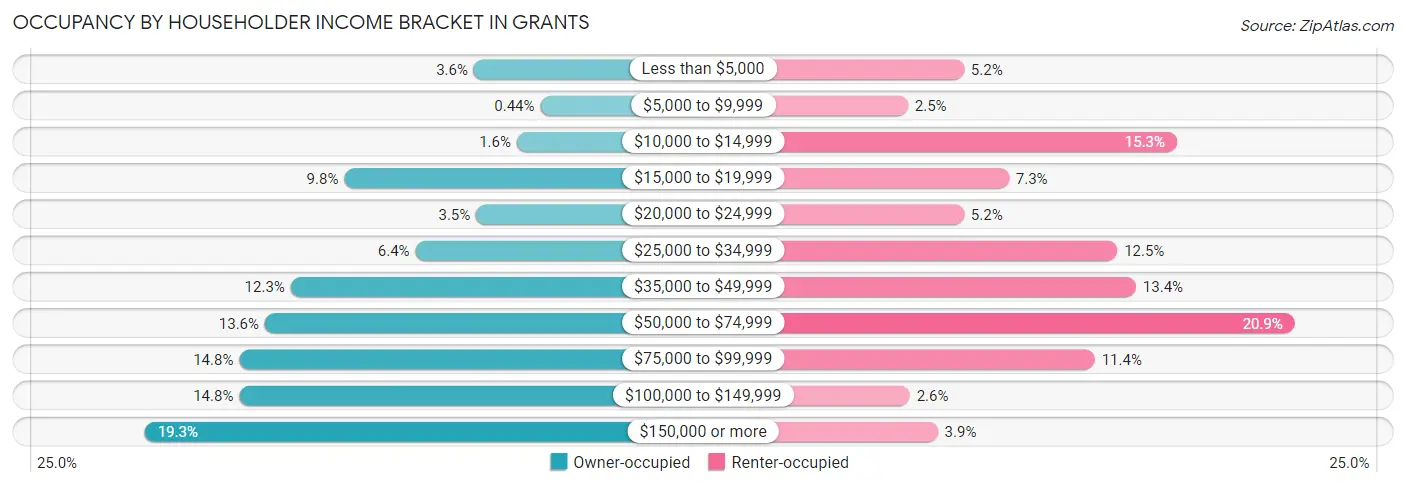
| Income Bracket | Owner-occupied | Renter-occupied |
| Less than $5,000 | 65 (3.6%) | 58 (5.2%) |
| $5,000 to $9,999 | 8 (0.4%) | 28 (2.5%) |
| $10,000 to $14,999 | 28 (1.6%) | 172 (15.3%) |
| $15,000 to $19,999 | 176 (9.8%) | 82 (7.3%) |
| $20,000 to $24,999 | 63 (3.5%) | 58 (5.2%) |
| $25,000 to $34,999 | 115 (6.4%) | 140 (12.5%) |
| $35,000 to $49,999 | 222 (12.3%) | 150 (13.4%) |
| $50,000 to $74,999 | 244 (13.6%) | 235 (20.9%) |
| $75,000 to $99,999 | 266 (14.8%) | 128 (11.4%) |
| $100,000 to $149,999 | 266 (14.8%) | 29 (2.6%) |
| $150,000 or more | 347 (19.3%) | 44 (3.9%) |
| Total | 1,800 (100.0%) | 1,124 (100.0%) |
Monthly Housing Cost Tiers in Grants
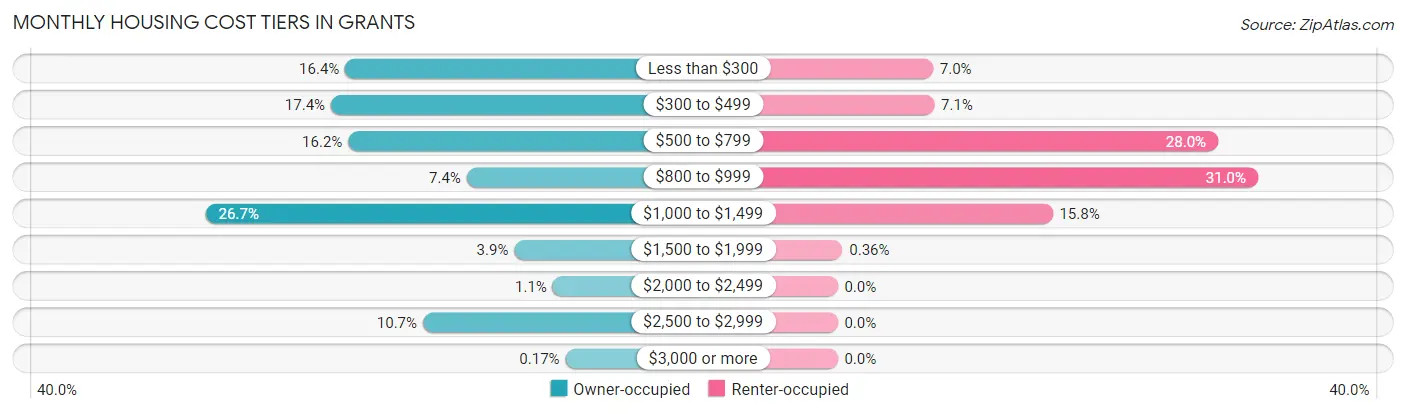
| Monthly Cost | Owner-occupied | Renter-occupied |
| Less than $300 | 295 (16.4%) | 79 (7.0%) |
| $300 to $499 | 314 (17.4%) | 80 (7.1%) |
| $500 to $799 | 291 (16.2%) | 315 (28.0%) |
| $800 to $999 | 134 (7.4%) | 348 (31.0%) |
| $1,000 to $1,499 | 480 (26.7%) | 178 (15.8%) |
| $1,500 to $1,999 | 71 (3.9%) | 4 (0.4%) |
| $2,000 to $2,499 | 20 (1.1%) | 0 (0.0%) |
| $2,500 to $2,999 | 192 (10.7%) | 0 (0.0%) |
| $3,000 or more | 3 (0.2%) | 0 (0.0%) |
| Total | 1,800 (100.0%) | 1,124 (100.0%) |
Physical Housing Characteristics in Grants
Housing Structures in Grants
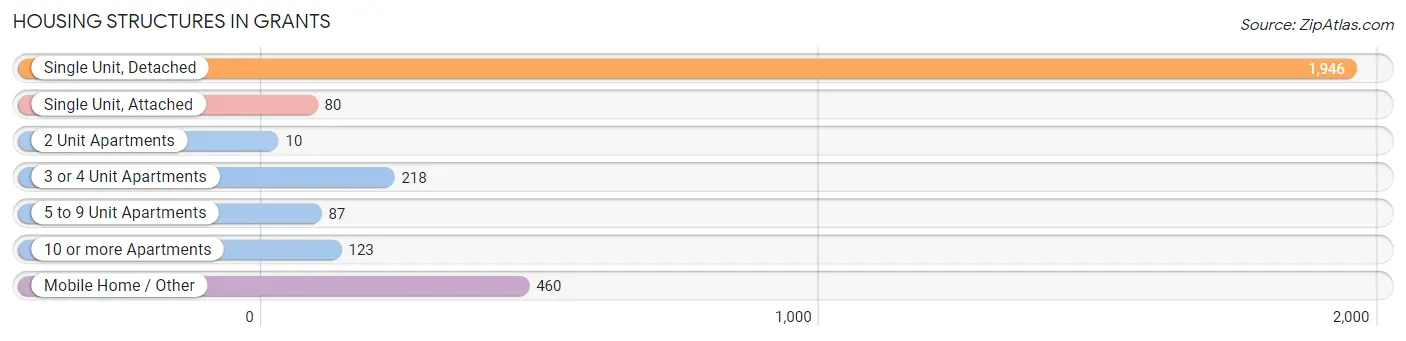
| Structure Type | # Housing Units | % Housing Units |
| Single Unit, Detached | 1,946 | 66.5% |
| Single Unit, Attached | 80 | 2.7% |
| 2 Unit Apartments | 10 | 0.3% |
| 3 or 4 Unit Apartments | 218 | 7.5% |
| 5 to 9 Unit Apartments | 87 | 3.0% |
| 10 or more Apartments | 123 | 4.2% |
| Mobile Home / Other | 460 | 15.7% |
| Total | 2,924 | 100.0% |
Housing Structures by Occupancy in Grants
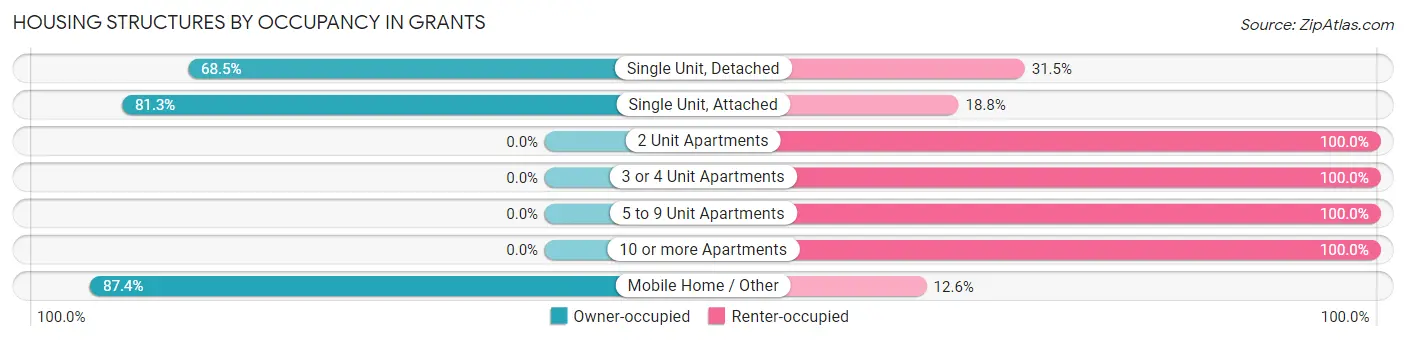
| Structure Type | Owner-occupied | Renter-occupied |
| Single Unit, Detached | 1,333 (68.5%) | 613 (31.5%) |
| Single Unit, Attached | 65 (81.2%) | 15 (18.8%) |
| 2 Unit Apartments | 0 (0.0%) | 10 (100.0%) |
| 3 or 4 Unit Apartments | 0 (0.0%) | 218 (100.0%) |
| 5 to 9 Unit Apartments | 0 (0.0%) | 87 (100.0%) |
| 10 or more Apartments | 0 (0.0%) | 123 (100.0%) |
| Mobile Home / Other | 402 (87.4%) | 58 (12.6%) |
| Total | 1,800 (61.6%) | 1,124 (38.4%) |
Housing Structures by Number of Rooms in Grants
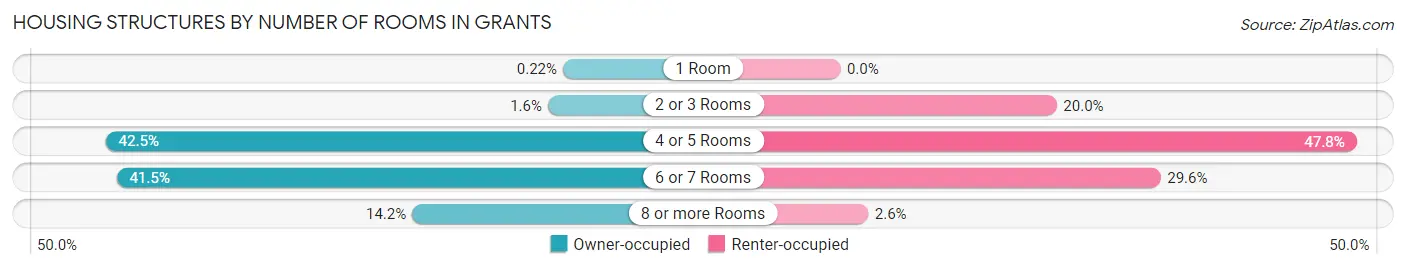
| Number of Rooms | Owner-occupied | Renter-occupied |
| 1 Room | 4 (0.2%) | 0 (0.0%) |
| 2 or 3 Rooms | 29 (1.6%) | 225 (20.0%) |
| 4 or 5 Rooms | 765 (42.5%) | 537 (47.8%) |
| 6 or 7 Rooms | 747 (41.5%) | 333 (29.6%) |
| 8 or more Rooms | 255 (14.2%) | 29 (2.6%) |
| Total | 1,800 (100.0%) | 1,124 (100.0%) |
Housing Structure by Heating Type in Grants
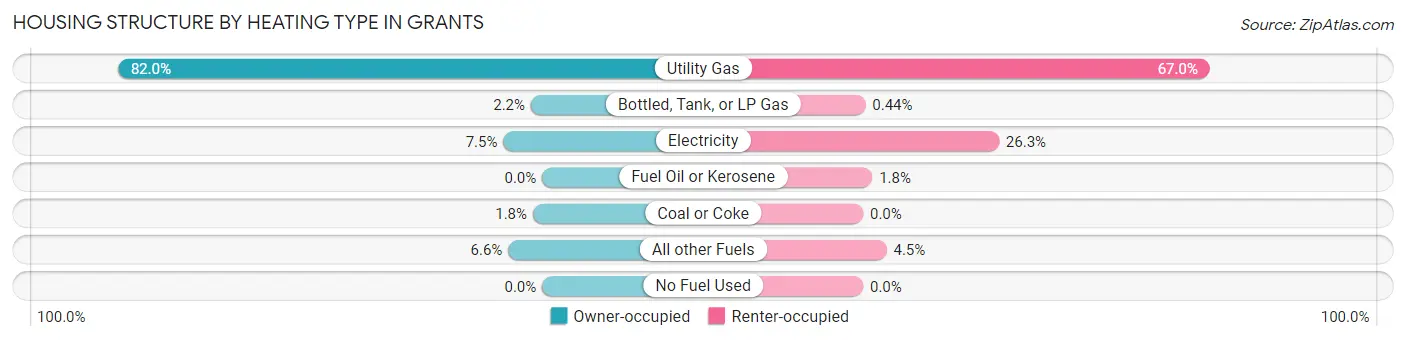
| Heating Type | Owner-occupied | Renter-occupied |
| Utility Gas | 1,476 (82.0%) | 753 (67.0%) |
| Bottled, Tank, or LP Gas | 39 (2.2%) | 5 (0.4%) |
| Electricity | 135 (7.5%) | 295 (26.3%) |
| Fuel Oil or Kerosene | 0 (0.0%) | 20 (1.8%) |
| Coal or Coke | 32 (1.8%) | 0 (0.0%) |
| All other Fuels | 118 (6.6%) | 51 (4.5%) |
| No Fuel Used | 0 (0.0%) | 0 (0.0%) |
| Total | 1,800 (100.0%) | 1,124 (100.0%) |
Household Vehicle Usage in Grants
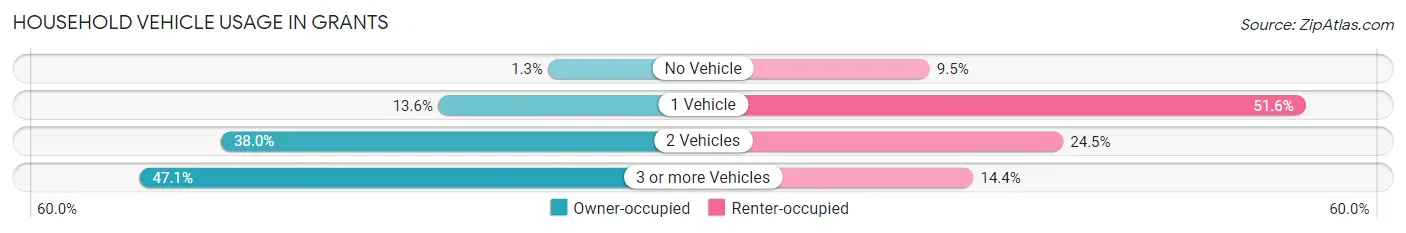
| Vehicles per Household | Owner-occupied | Renter-occupied |
| No Vehicle | 23 (1.3%) | 107 (9.5%) |
| 1 Vehicle | 245 (13.6%) | 580 (51.6%) |
| 2 Vehicles | 684 (38.0%) | 275 (24.5%) |
| 3 or more Vehicles | 848 (47.1%) | 162 (14.4%) |
| Total | 1,800 (100.0%) | 1,124 (100.0%) |
Real Estate & Mortgages in Grants
Real Estate and Mortgage Overview in Grants
| Characteristic | Without Mortgage | With Mortgage |
| Housing Units | 928 | 872 |
| Median Property Value | $103,700 | $179,000 |
| Median Household Income | $55,089 | $313 |
| Monthly Housing Costs | $400 | $3 |
| Real Estate Taxes | $996 | $30 |
Property Value by Mortgage Status in Grants
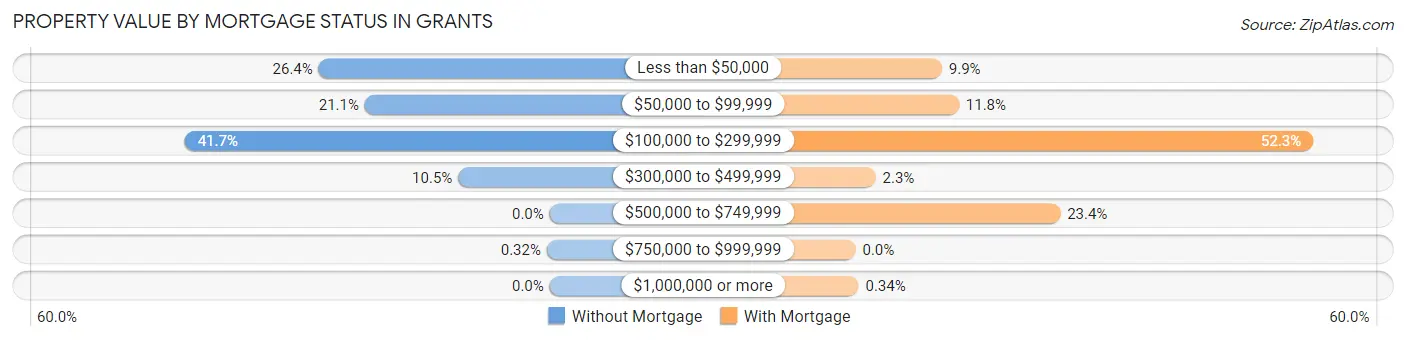
| Property Value | Without Mortgage | With Mortgage |
| Less than $50,000 | 245 (26.4%) | 86 (9.9%) |
| $50,000 to $99,999 | 196 (21.1%) | 103 (11.8%) |
| $100,000 to $299,999 | 387 (41.7%) | 456 (52.3%) |
| $300,000 to $499,999 | 97 (10.4%) | 20 (2.3%) |
| $500,000 to $749,999 | 0 (0.0%) | 204 (23.4%) |
| $750,000 to $999,999 | 3 (0.3%) | 0 (0.0%) |
| $1,000,000 or more | 0 (0.0%) | 3 (0.3%) |
| Total | 928 (100.0%) | 872 (100.0%) |
Household Income by Mortgage Status in Grants
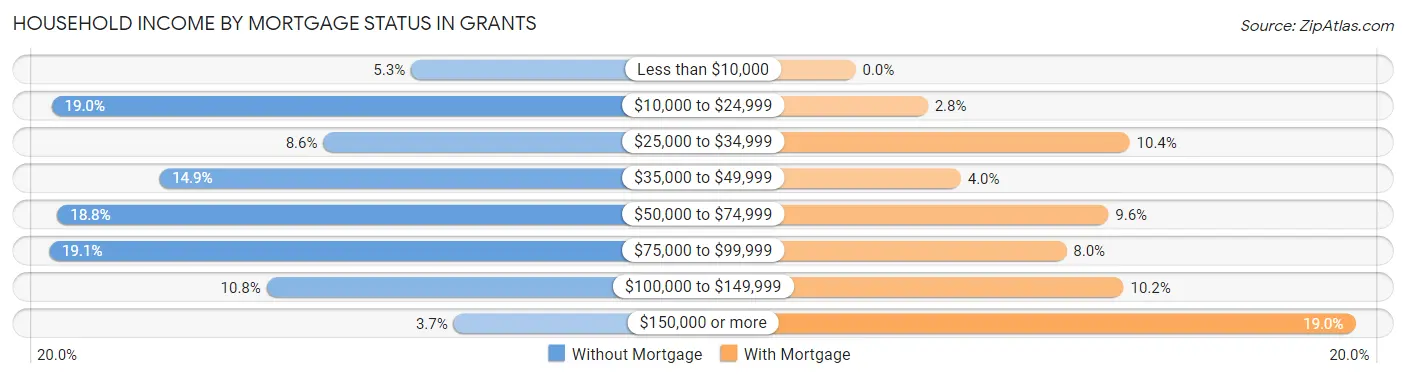
| Household Income | Without Mortgage | With Mortgage |
| Less than $10,000 | 49 (5.3%) | 0 (0.0%) |
| $10,000 to $24,999 | 176 (19.0%) | 24 (2.8%) |
| $25,000 to $34,999 | 80 (8.6%) | 91 (10.4%) |
| $35,000 to $49,999 | 138 (14.9%) | 35 (4.0%) |
| $50,000 to $74,999 | 174 (18.8%) | 84 (9.6%) |
| $75,000 to $99,999 | 177 (19.1%) | 70 (8.0%) |
| $100,000 to $149,999 | 100 (10.8%) | 89 (10.2%) |
| $150,000 or more | 34 (3.7%) | 166 (19.0%) |
| Total | 928 (100.0%) | 872 (100.0%) |
Property Value to Household Income Ratio in Grants
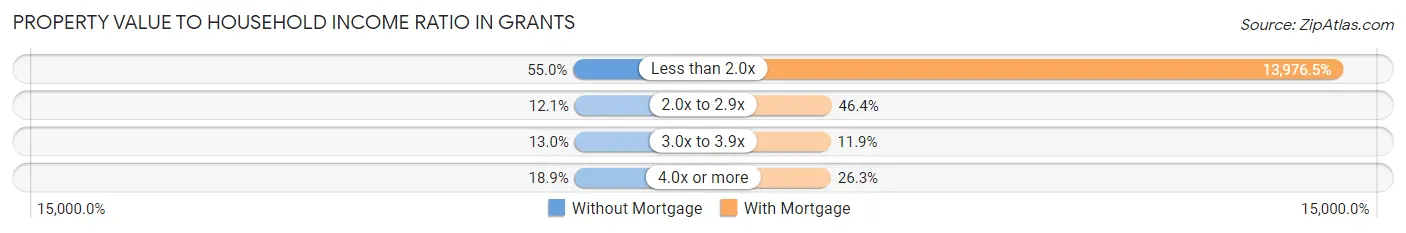
| Value-to-Income Ratio | Without Mortgage | With Mortgage |
| Less than 2.0x | 510 (55.0%) | 121,875 (13,976.5%) |
| 2.0x to 2.9x | 112 (12.1%) | 405 (46.4%) |
| 3.0x to 3.9x | 121 (13.0%) | 104 (11.9%) |
| 4.0x or more | 175 (18.9%) | 229 (26.3%) |
| Total | 928 (100.0%) | 872 (100.0%) |
Real Estate Taxes by Mortgage Status in Grants
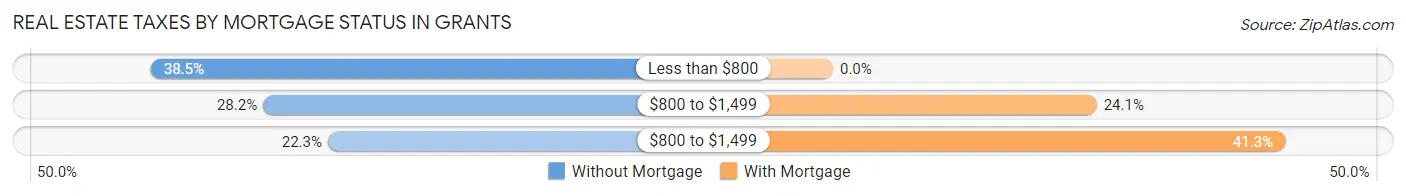
| Property Taxes | Without Mortgage | With Mortgage |
| Less than $800 | 357 (38.5%) | 0 (0.0%) |
| $800 to $1,499 | 262 (28.2%) | 210 (24.1%) |
| $800 to $1,499 | 207 (22.3%) | 360 (41.3%) |
| Total | 928 (100.0%) | 872 (100.0%) |
Health & Disability in Grants
Health Insurance Coverage by Age in Grants
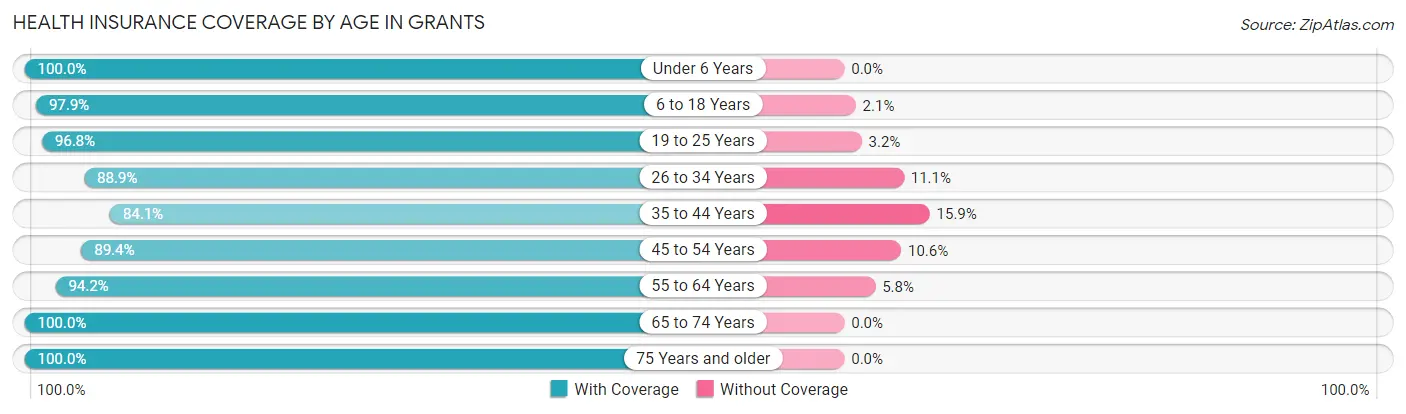
| Age Bracket | With Coverage | Without Coverage |
| Under 6 Years | 792 (100.0%) | 0 (0.0%) |
| 6 to 18 Years | 1,613 (97.9%) | 35 (2.1%) |
| 19 to 25 Years | 631 (96.8%) | 21 (3.2%) |
| 26 to 34 Years | 1,307 (88.9%) | 163 (11.1%) |
| 35 to 44 Years | 872 (84.1%) | 165 (15.9%) |
| 45 to 54 Years | 583 (89.4%) | 69 (10.6%) |
| 55 to 64 Years | 834 (94.2%) | 51 (5.8%) |
| 65 to 74 Years | 579 (100.0%) | 0 (0.0%) |
| 75 Years and older | 668 (100.0%) | 0 (0.0%) |
| Total | 7,879 (94.0%) | 504 (6.0%) |
Health Insurance Coverage by Citizenship Status in Grants
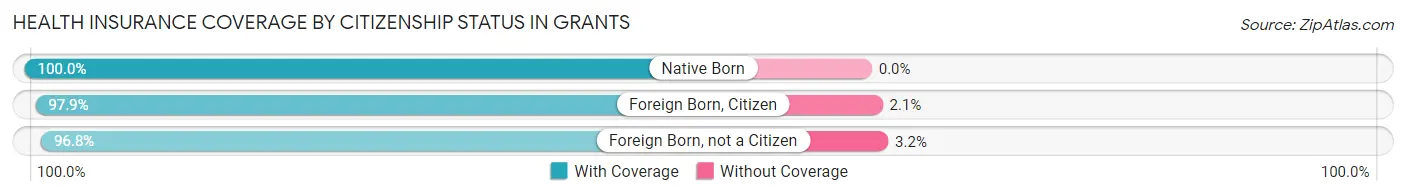
| Citizenship Status | With Coverage | Without Coverage |
| Native Born | 792 (100.0%) | 0 (0.0%) |
| Foreign Born, Citizen | 1,613 (97.9%) | 35 (2.1%) |
| Foreign Born, not a Citizen | 631 (96.8%) | 21 (3.2%) |
Health Insurance Coverage by Household Income in Grants
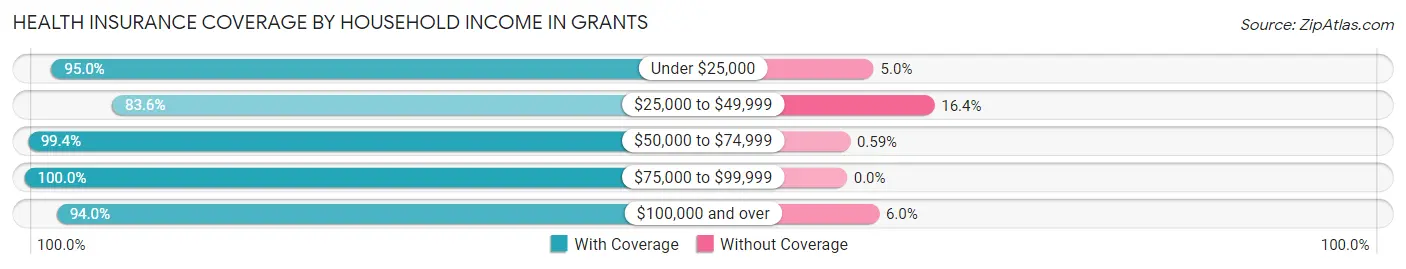
| Household Income | With Coverage | Without Coverage |
| Under $25,000 | 1,756 (95.0%) | 93 (5.0%) |
| $25,000 to $49,999 | 1,362 (83.6%) | 267 (16.4%) |
| $50,000 to $74,999 | 1,178 (99.4%) | 7 (0.6%) |
| $75,000 to $99,999 | 1,378 (100.0%) | 0 (0.0%) |
| $100,000 and over | 2,135 (94.0%) | 137 (6.0%) |
Public vs Private Health Insurance Coverage by Age in Grants
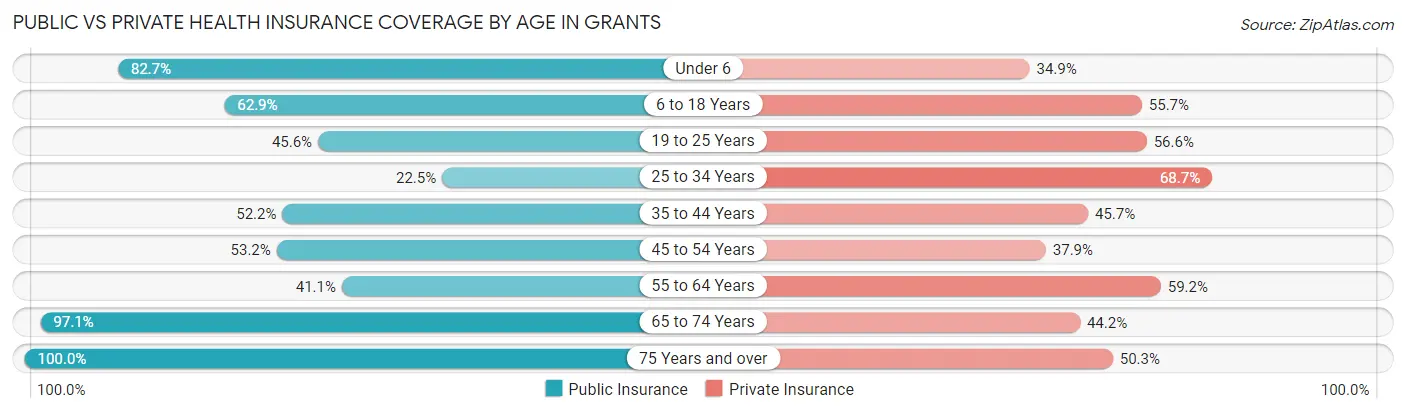
| Age Bracket | Public Insurance | Private Insurance |
| Under 6 | 655 (82.7%) | 276 (34.8%) |
| 6 to 18 Years | 1,037 (62.9%) | 918 (55.7%) |
| 19 to 25 Years | 297 (45.6%) | 369 (56.6%) |
| 25 to 34 Years | 331 (22.5%) | 1,010 (68.7%) |
| 35 to 44 Years | 541 (52.2%) | 474 (45.7%) |
| 45 to 54 Years | 347 (53.2%) | 247 (37.9%) |
| 55 to 64 Years | 364 (41.1%) | 524 (59.2%) |
| 65 to 74 Years | 562 (97.1%) | 256 (44.2%) |
| 75 Years and over | 668 (100.0%) | 336 (50.3%) |
| Total | 4,802 (57.3%) | 4,410 (52.6%) |
Disability Status by Sex by Age in Grants
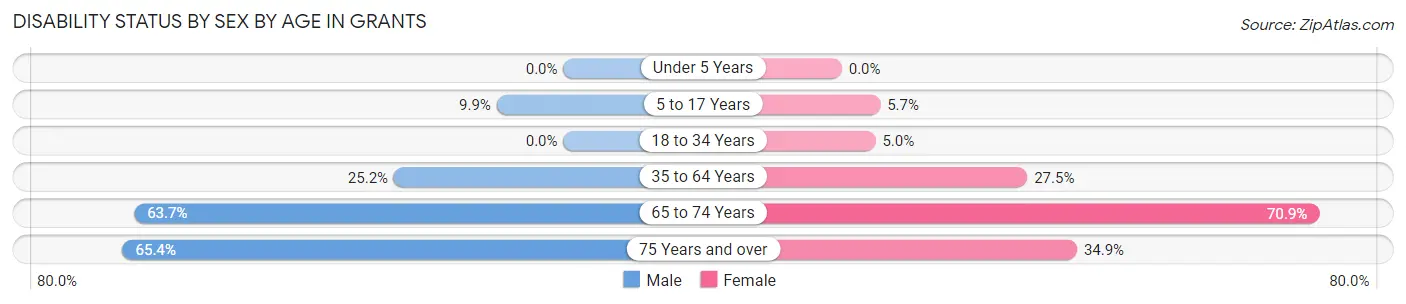
| Age Bracket | Male | Female |
| Under 5 Years | 0 (0.0%) | 0 (0.0%) |
| 5 to 17 Years | 48 (9.9%) | 61 (5.7%) |
| 18 to 34 Years | 0 (0.0%) | 59 (5.0%) |
| 35 to 64 Years | 348 (25.2%) | 328 (27.5%) |
| 65 to 74 Years | 137 (63.7%) | 258 (70.9%) |
| 75 Years and over | 231 (65.4%) | 110 (34.9%) |
Disability Class by Sex by Age in Grants
Disability Class: Hearing Difficulty
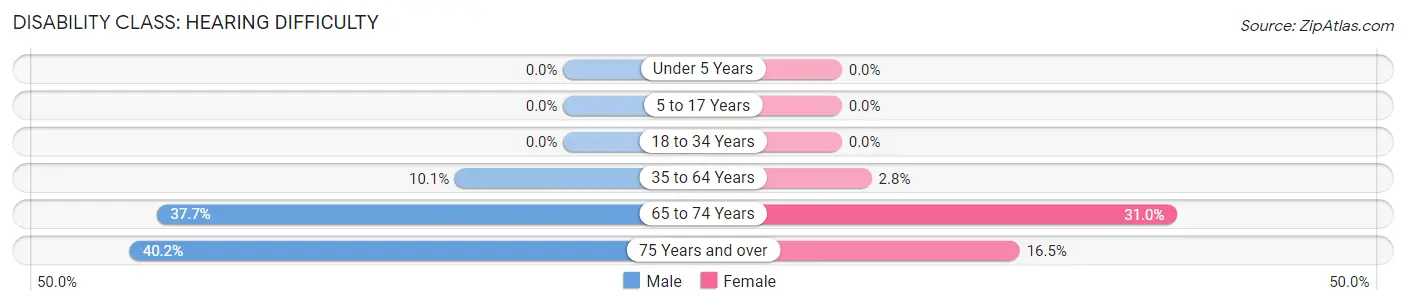
| Age Bracket | Male | Female |
| Under 5 Years | 0 (0.0%) | 0 (0.0%) |
| 5 to 17 Years | 0 (0.0%) | 0 (0.0%) |
| 18 to 34 Years | 0 (0.0%) | 0 (0.0%) |
| 35 to 64 Years | 139 (10.1%) | 33 (2.8%) |
| 65 to 74 Years | 81 (37.7%) | 113 (31.0%) |
| 75 Years and over | 142 (40.2%) | 52 (16.5%) |
Disability Class: Vision Difficulty
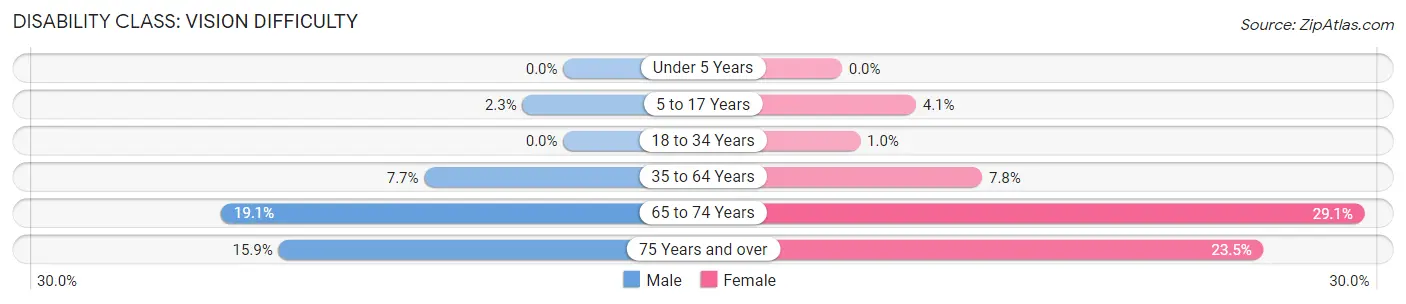
| Age Bracket | Male | Female |
| Under 5 Years | 0 (0.0%) | 0 (0.0%) |
| 5 to 17 Years | 11 (2.3%) | 44 (4.1%) |
| 18 to 34 Years | 0 (0.0%) | 12 (1.0%) |
| 35 to 64 Years | 107 (7.7%) | 93 (7.8%) |
| 65 to 74 Years | 41 (19.1%) | 106 (29.1%) |
| 75 Years and over | 56 (15.9%) | 74 (23.5%) |
Disability Class: Cognitive Difficulty
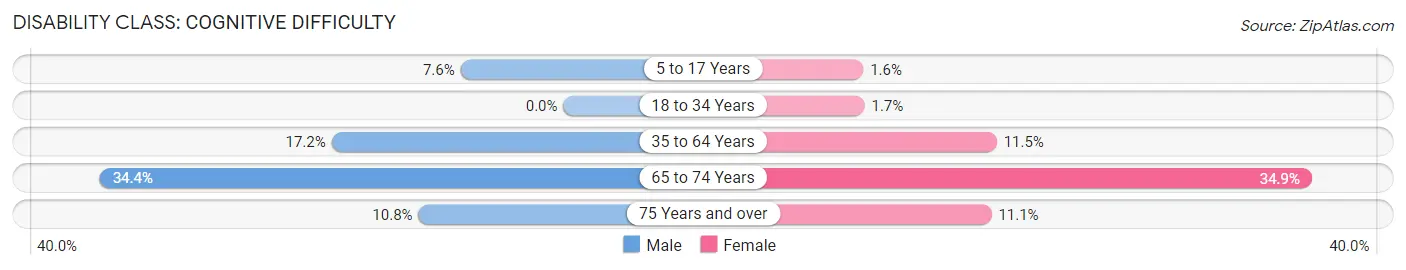
| Age Bracket | Male | Female |
| 5 to 17 Years | 37 (7.6%) | 17 (1.6%) |
| 18 to 34 Years | 0 (0.0%) | 20 (1.7%) |
| 35 to 64 Years | 238 (17.2%) | 137 (11.5%) |
| 65 to 74 Years | 74 (34.4%) | 127 (34.9%) |
| 75 Years and over | 38 (10.8%) | 35 (11.1%) |
Disability Class: Ambulatory Difficulty
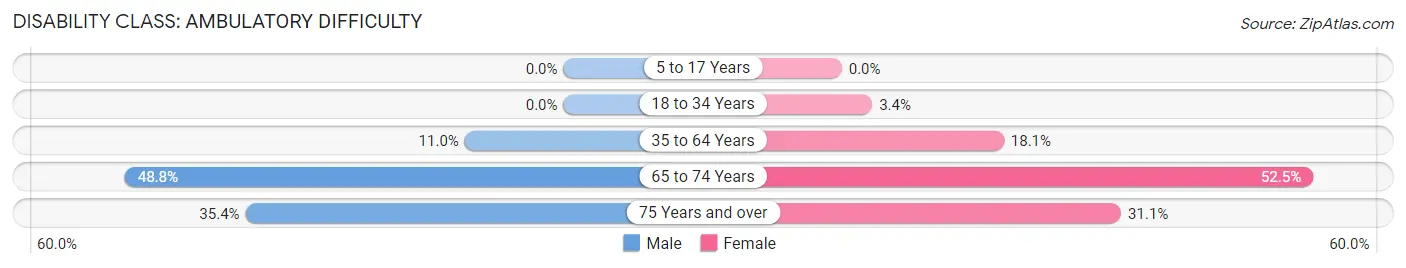
| Age Bracket | Male | Female |
| 5 to 17 Years | 0 (0.0%) | 0 (0.0%) |
| 18 to 34 Years | 0 (0.0%) | 40 (3.4%) |
| 35 to 64 Years | 152 (11.0%) | 215 (18.0%) |
| 65 to 74 Years | 105 (48.8%) | 191 (52.5%) |
| 75 Years and over | 125 (35.4%) | 98 (31.1%) |
Disability Class: Self-Care Difficulty
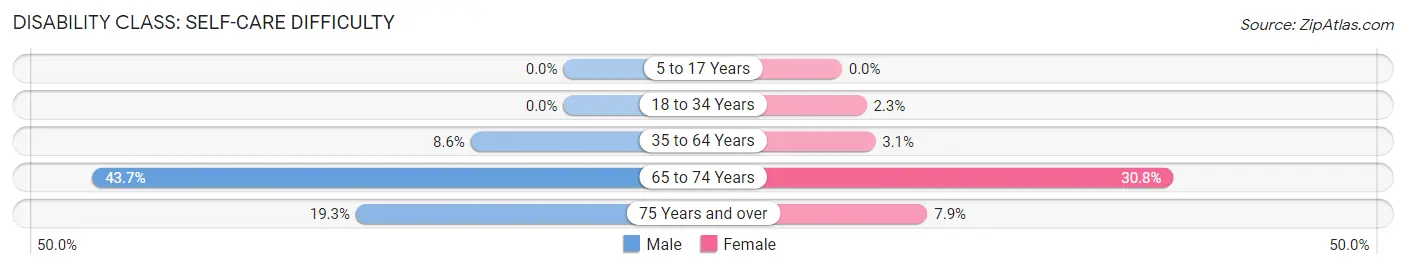
| Age Bracket | Male | Female |
| 5 to 17 Years | 0 (0.0%) | 0 (0.0%) |
| 18 to 34 Years | 0 (0.0%) | 27 (2.3%) |
| 35 to 64 Years | 119 (8.6%) | 37 (3.1%) |
| 65 to 74 Years | 94 (43.7%) | 112 (30.8%) |
| 75 Years and over | 68 (19.3%) | 25 (7.9%) |
Technology Access in Grants
Computing Device Access in Grants
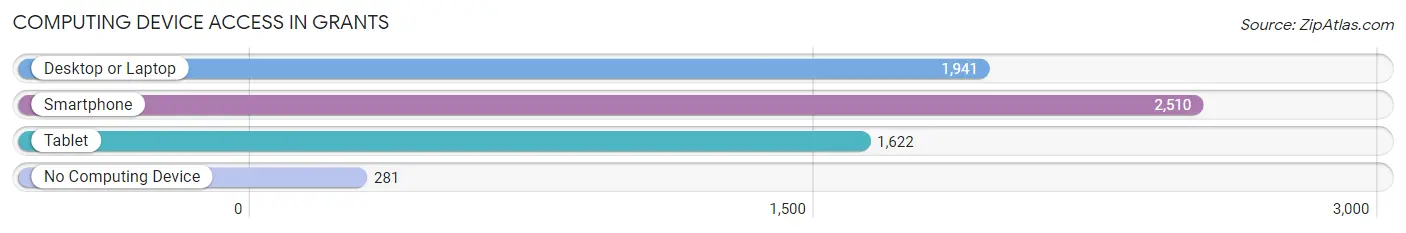
| Device Type | # Households | % Households |
| Desktop or Laptop | 1,941 | 66.4% |
| Smartphone | 2,510 | 85.8% |
| Tablet | 1,622 | 55.5% |
| No Computing Device | 281 | 9.6% |
| Total | 2,924 | 100.0% |
Internet Access in Grants
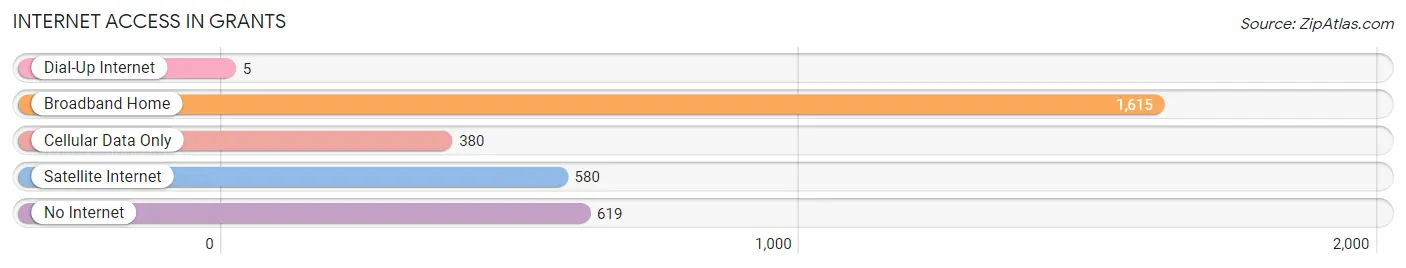
| Internet Type | # Households | % Households |
| Dial-Up Internet | 5 | 0.2% |
| Broadband Home | 1,615 | 55.2% |
| Cellular Data Only | 380 | 13.0% |
| Satellite Internet | 580 | 19.8% |
| No Internet | 619 | 21.2% |
| Total | 2,924 | 100.0% |
Grants Summary
Grants, New Mexico is a city located in the western part of the state, in Cibola County. It is the county seat and the largest city in the county. The city is located at the intersection of Interstate 40 and U.S. Route 180, and is about 60 miles west of Albuquerque. The city was founded in 1868 and was named after General Ulysses S. Grant.
Geography
Grants is located in the western part of New Mexico, in the Cibola Valley. The city is situated at an elevation of 6,400 feet above sea level. The city is surrounded by the Zuni Mountains to the north, the San Mateo Mountains to the east, and the San Mateo Volcanic Field to the south. The city is located at the intersection of Interstate 40 and U.S. Route 180, and is about 60 miles west of Albuquerque.
Climate
Grants has a semi-arid climate, with hot summers and cold winters. The average high temperature in July is 90°F, and the average low temperature in January is 19°F. The average annual precipitation is 11.5 inches.
Demographics
As of the 2010 census, the population of Grants was 9,182. The racial makeup of the city was 63.3% White, 0.9% African American, 2.2% Native American, 0.7% Asian, 0.1% Pacific Islander, 29.3% from other races, and 3.5% from two or more races. Hispanic or Latino of any race were 57.2% of the population.
Economy
Grants is the economic center of Cibola County. The city is home to several major employers, including the Grants-Cibola County Airport, the Grants-Cibola County Hospital, and the Grants-Cibola County Schools. The city is also home to several retail stores, restaurants, and other businesses.
The city is also home to the Grants Mining District, which is the largest uranium mining district in the United States. The district is home to several uranium mines, and is a major source of employment for the city.
History
Grants was founded in 1868 and was named after General Ulysses S. Grant. The city was originally a stop on the Atlantic and Pacific Railroad, and was a major shipping point for cattle and sheep. The city was incorporated in 1901.
In the early 20th century, the city was a major center for uranium mining. The city was home to several uranium mines, and was a major source of employment for the city. The uranium mining industry declined in the late 20th century, and the city has since diversified its economy.
Today, Grants is a thriving city with a diverse economy. The city is home to several major employers, and is a major center for tourism in the region. The city is also home to several retail stores, restaurants, and other businesses.
Common Questions
What is Per Capita Income in Grants?
Per Capita income in Grants is $26,873.
What is the Median Family Income in Grants?
Median Family Income in Grants is $66,729.
What is the Median Household income in Grants?
Median Household Income in Grants is $55,631.
What is Income or Wage Gap in Grants?
Income or Wage Gap in Grants is 19.7%.
Women in Grants earn 80.3 cents for every dollar earned by a man.
What is Family Income Deficit in Grants?
Family Income Deficit in Grants is $11,393.
Families that are below poverty line in Grants earn $11,393 less on average than the poverty threshold level.
What is Inequality or Gini Index in Grants?
Inequality or Gini Index in Grants is 0.43.
What is the Total Population of Grants?
Total Population of Grants is 9,177.
What is the Total Male Population of Grants?
Total Male Population of Grants is 4,775.
What is the Total Female Population of Grants?
Total Female Population of Grants is 4,402.
What is the Ratio of Males per 100 Females in Grants?
There are 108.47 Males per 100 Females in Grants.
What is the Ratio of Females per 100 Males in Grants?
There are 92.19 Females per 100 Males in Grants.
What is the Median Population Age in Grants?
Median Population Age in Grants is 33.2 Years.
What is the Average Family Size in Grants
Average Family Size in Grants is 3.6 People.
What is the Average Household Size in Grants
Average Household Size in Grants is 2.9 People.
How Large is the Labor Force in Grants?
There are 3,413 People in the Labor Forcein in Grants.
What is the Percentage of People in the Labor Force in Grants?
48.2% of People are in the Labor Force in Grants.
What is the Unemployment Rate in Grants?
Unemployment Rate in Grants is 4.5%.