Glorieta, NM Map & Demographics
Glorieta Map
Glorieta Overview
$46,878
PER CAPITA INCOME
$46,394
AVG HOUSEHOLD INCOME
35.2%
WAGE / INCOME GAP [ % ]
64.8¢/ $1
WAGE / INCOME GAP [ $ ]
0.44
INEQUALITY / GINI INDEX
549
TOTAL POPULATION
266
MALE POPULATION
283
FEMALE POPULATION
93.99
MALES / 100 FEMALES
106.39
FEMALES / 100 MALES
39.7
MEDIAN AGE
2.2
AVG FAMILY SIZE
1.7
AVG HOUSEHOLD SIZE
386
LABOR FORCE [ PEOPLE ]
75.0%
PERCENT IN LABOR FORCE
34.7%
UNEMPLOYMENT RATE
Glorieta Zip Codes
Glorieta Area Codes
Income in Glorieta
Income Overview in Glorieta
| Characteristic | Number | Measure |
| Per Capita Income | 549 | $46,878 |
| Median Family Income | 192 | $0 |
| Mean Family Income | 192 | $101,161 |
| Median Household Income | 316 | $46,394 |
| Mean Household Income | 316 | $76,980 |
| Income Deficit | 192 | $0 |
| Wage / Income Gap (%) | 549 | 35.17% |
| Wage / Income Gap ($) | 549 | 64.83¢ per $1 |
| Gini / Inequality Index | 549 | 0.44 |
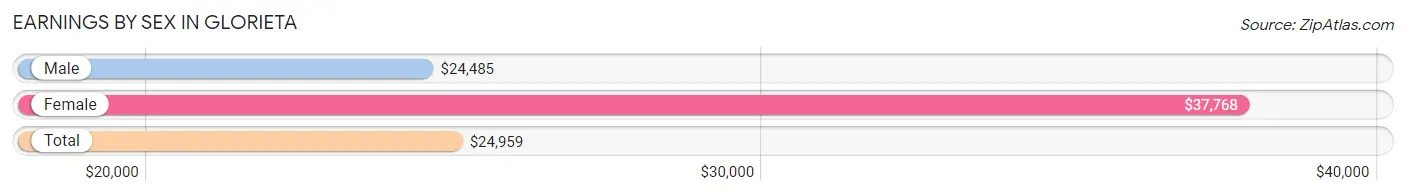
Earnings by Sex in Glorieta
Average Earnings in Glorieta are $24,959, $24,485 for men and $37,768 for women, a difference of 35.2%.
| Sex | Number | Average Earnings |
| Male | 207 (53.6%) | $24,485 |
| Female | 179 (46.4%) | $37,768 |
| Total | 386 (100.0%) | $24,959 |
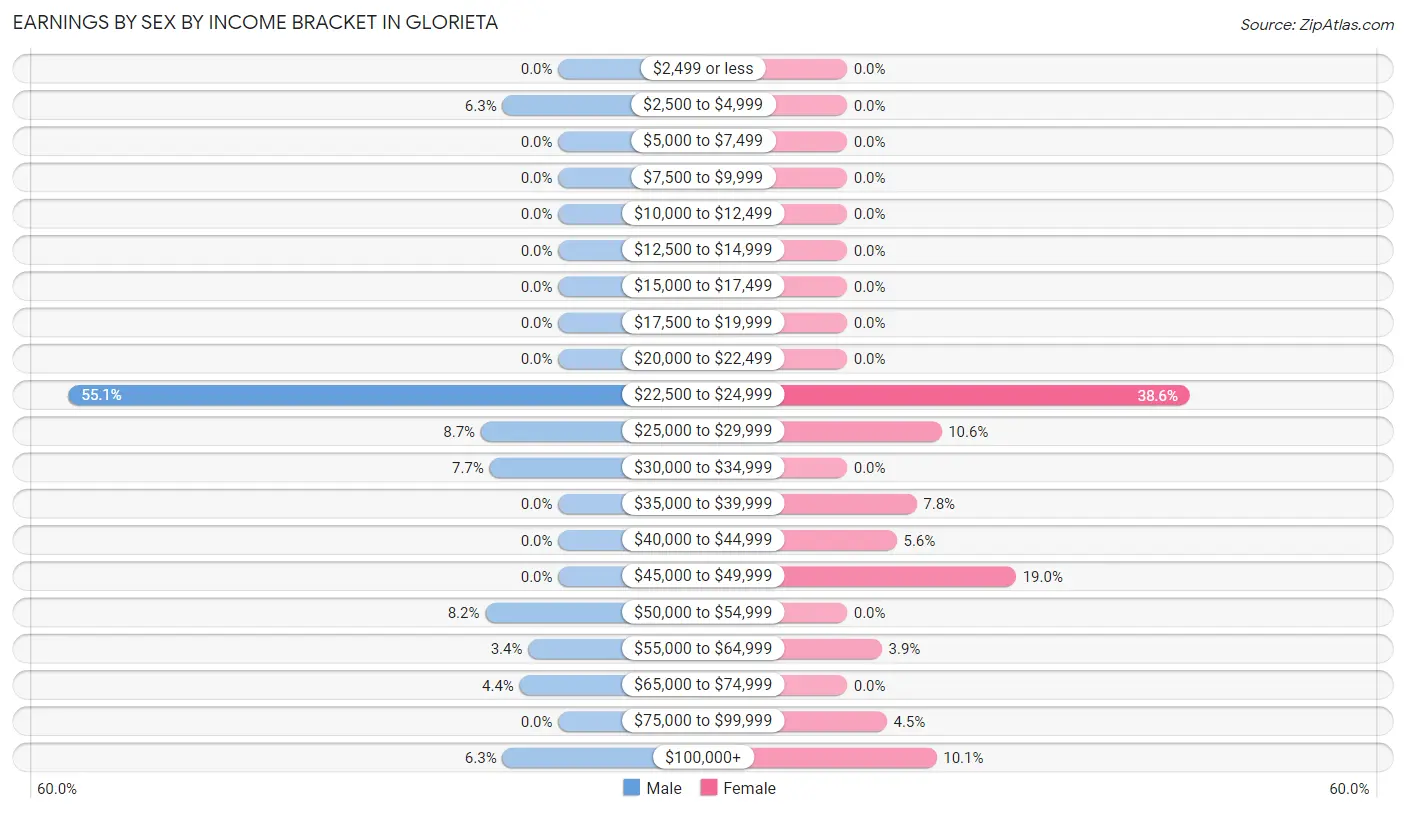
Earnings by Sex by Income Bracket in Glorieta
The most common earnings brackets in Glorieta are $22,500 to $24,999 for men (114 | 55.1%) and $22,500 to $24,999 for women (69 | 38.6%).
| Income | Male | Female |
| $2,499 or less | 0 (0.0%) | 0 (0.0%) |
| $2,500 to $4,999 | 13 (6.3%) | 0 (0.0%) |
| $5,000 to $7,499 | 0 (0.0%) | 0 (0.0%) |
| $7,500 to $9,999 | 0 (0.0%) | 0 (0.0%) |
| $10,000 to $12,499 | 0 (0.0%) | 0 (0.0%) |
| $12,500 to $14,999 | 0 (0.0%) | 0 (0.0%) |
| $15,000 to $17,499 | 0 (0.0%) | 0 (0.0%) |
| $17,500 to $19,999 | 0 (0.0%) | 0 (0.0%) |
| $20,000 to $22,499 | 0 (0.0%) | 0 (0.0%) |
| $22,500 to $24,999 | 114 (55.1%) | 69 (38.6%) |
| $25,000 to $29,999 | 18 (8.7%) | 19 (10.6%) |
| $30,000 to $34,999 | 16 (7.7%) | 0 (0.0%) |
| $35,000 to $39,999 | 0 (0.0%) | 14 (7.8%) |
| $40,000 to $44,999 | 0 (0.0%) | 10 (5.6%) |
| $45,000 to $49,999 | 0 (0.0%) | 34 (19.0%) |
| $50,000 to $54,999 | 17 (8.2%) | 0 (0.0%) |
| $55,000 to $64,999 | 7 (3.4%) | 7 (3.9%) |
| $65,000 to $74,999 | 9 (4.3%) | 0 (0.0%) |
| $75,000 to $99,999 | 0 (0.0%) | 8 (4.5%) |
| $100,000+ | 13 (6.3%) | 18 (10.1%) |
| Total | 207 (100.0%) | 179 (100.0%) |
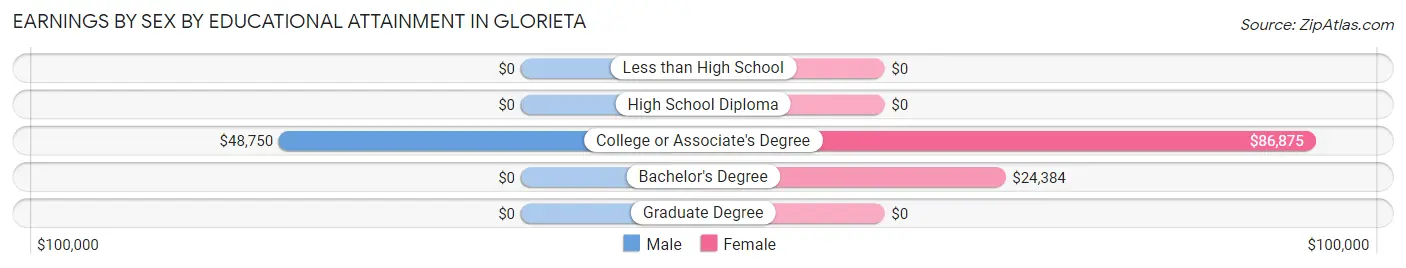
Earnings by Sex by Educational Attainment in Glorieta
| Educational Attainment | Male Income | Female Income |
| Less than High School | - | - |
| High School Diploma | - | - |
| College or Associate's Degree | $48,750 | $86,875 |
| Bachelor's Degree | - | - |
| Graduate Degree | - | - |
| Total | - | - |
Family Income in Glorieta
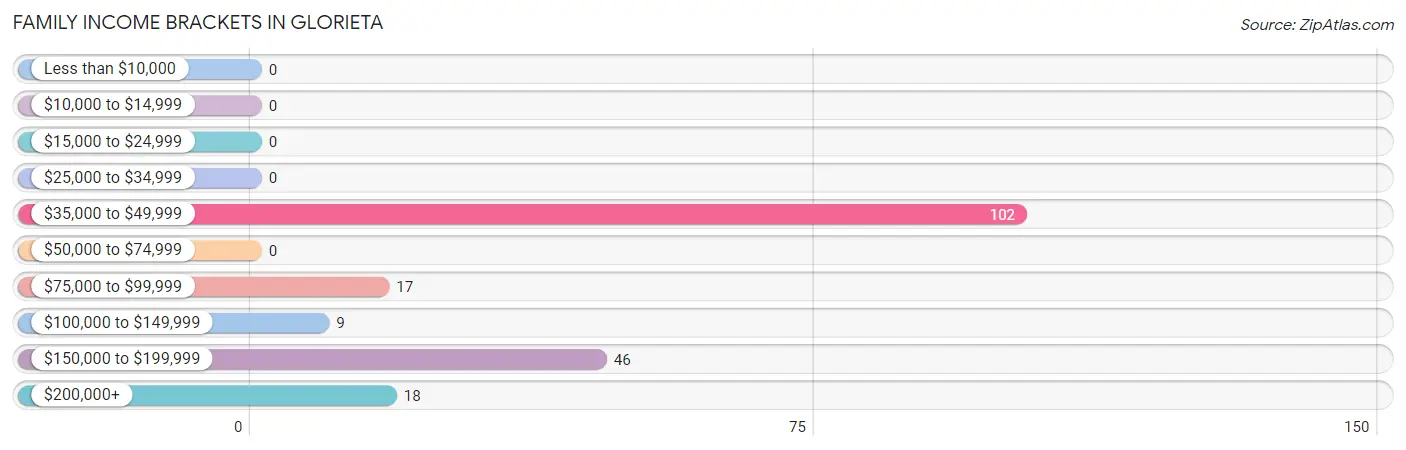
Family Income Brackets in Glorieta
According to the Glorieta family income data, there are 102 families falling into the $35,000 to $49,999 income range, which is the most common income bracket and makes up 53.1% of all families.
| Income Bracket | # Families | % Families |
| Less than $10,000 | 0 | 0.0% |
| $10,000 to $14,999 | 0 | 0.0% |
| $15,000 to $24,999 | 0 | 0.0% |
| $25,000 to $34,999 | 0 | 0.0% |
| $35,000 to $49,999 | 102 | 53.1% |
| $50,000 to $74,999 | 0 | 0.0% |
| $75,000 to $99,999 | 17 | 8.9% |
| $100,000 to $149,999 | 9 | 4.7% |
| $150,000 to $199,999 | 46 | 24.0% |
| $200,000+ | 18 | 9.4% |
Family Income by Famaliy Size in Glorieta
| Income Bracket | # Families | Median Income |
| 2-Person Families | 161 (83.9%) | $0 |
| 3-Person Families | 14 (7.3%) | $0 |
| 4-Person Families | 17 (8.8%) | $0 |
| 5-Person Families | 0 (0.0%) | $0 |
| 6-Person Families | 0 (0.0%) | $0 |
| 7+ Person Families | 0 (0.0%) | $0 |
| Total | 192 (100.0%) | $0 |
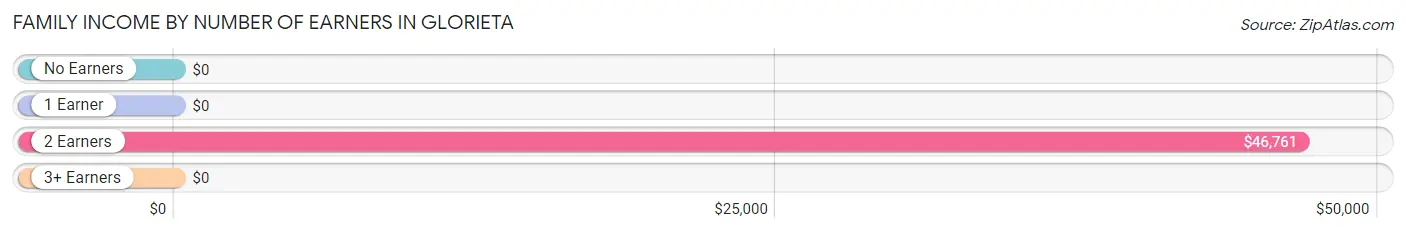
Family Income by Number of Earners in Glorieta
| Number of Earners | # Families | Median Income |
| No Earners | 40 (20.8%) | $0 |
| 1 Earner | 0 (0.0%) | $0 |
| 2 Earners | 152 (79.2%) | $46,761 |
| 3+ Earners | 0 (0.0%) | $0 |
| Total | 192 (100.0%) | $0 |
Household Income in Glorieta
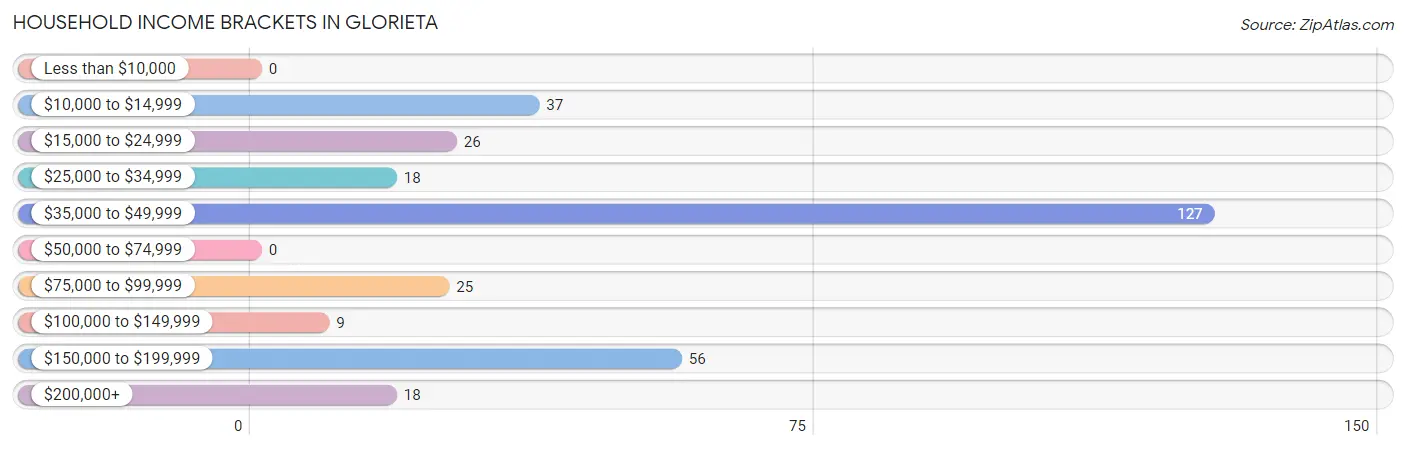
Household Income Brackets in Glorieta
With 127 households falling in the category, the $35,000 to $49,999 income range is the most frequent in Glorieta, accounting for 40.2% of all households.
| Income Bracket | # Households | % Households |
| Less than $10,000 | 0 | 0.0% |
| $10,000 to $14,999 | 37 | 11.7% |
| $15,000 to $24,999 | 26 | 8.2% |
| $25,000 to $34,999 | 18 | 5.7% |
| $35,000 to $49,999 | 127 | 40.2% |
| $50,000 to $74,999 | 0 | 0.0% |
| $75,000 to $99,999 | 25 | 7.9% |
| $100,000 to $149,999 | 9 | 2.8% |
| $150,000 to $199,999 | 56 | 17.7% |
| $200,000+ | 18 | 5.7% |
Household Income by Householder Age in Glorieta
The median household income in Glorieta is $46,394, with the highest median household income of $80,588 found in the 25 to 44 years age bracket for the primary householder. A total of 44 households (13.9%) fall into this category. Meanwhile, the 15 to 24 years age bracket for the primary householder has the lowest median household income of $0, with 88 households (27.9%) in this group.
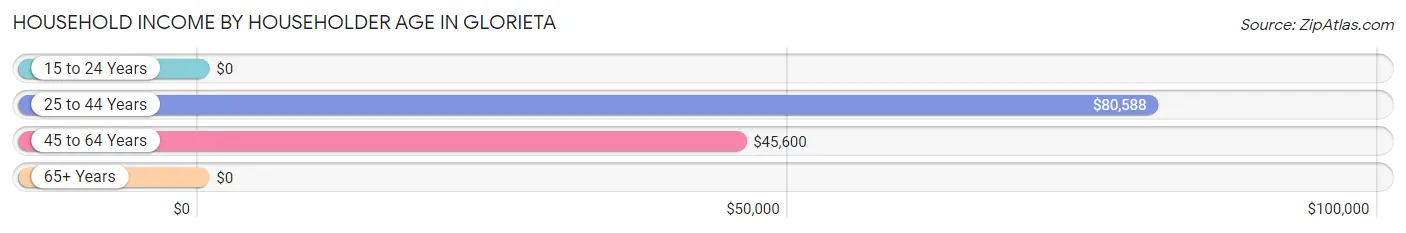
| Income Bracket | # Households | Median Income |
| 15 to 24 Years | 88 (27.9%) | $0 |
| 25 to 44 Years | 44 (13.9%) | $80,588 |
| 45 to 64 Years | 92 (29.1%) | $45,600 |
| 65+ Years | 92 (29.1%) | $0 |
| Total | 316 (100.0%) | $46,394 |
Poverty in Glorieta
Income Below Poverty by Sex and Age in Glorieta
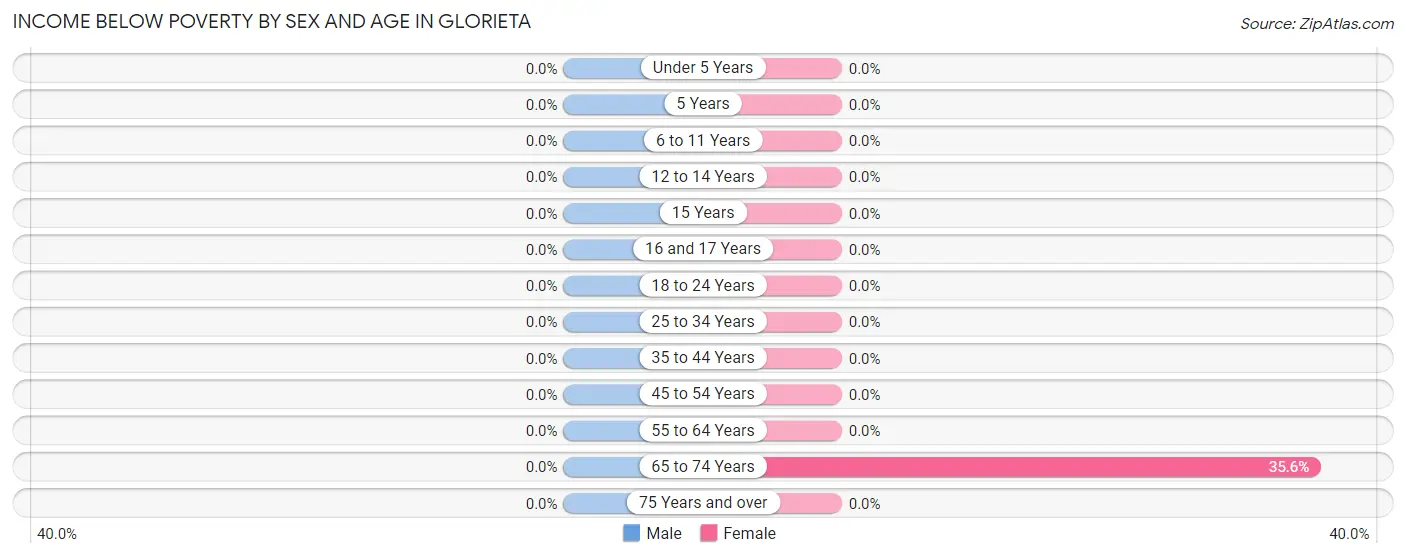
| Age Bracket | Male | Female |
| Under 5 Years | 0 (0.0%) | 0 (0.0%) |
| 5 Years | 0 (0.0%) | 0 (0.0%) |
| 6 to 11 Years | 0 (0.0%) | 0 (0.0%) |
| 12 to 14 Years | 0 (0.0%) | 0 (0.0%) |
| 15 Years | 0 (0.0%) | 0 (0.0%) |
| 16 and 17 Years | 0 (0.0%) | 0 (0.0%) |
| 18 to 24 Years | 0 (0.0%) | 0 (0.0%) |
| 25 to 34 Years | 0 (0.0%) | 0 (0.0%) |
| 35 to 44 Years | 0 (0.0%) | 0 (0.0%) |
| 45 to 54 Years | 0 (0.0%) | 0 (0.0%) |
| 55 to 64 Years | 0 (0.0%) | 0 (0.0%) |
| 65 to 74 Years | 0 (0.0%) | 37 (35.6%) |
| 75 Years and over | 0 (0.0%) | 0 (0.0%) |
| Total | 0 (0.0%) | 37 (13.1%) |
Income Above Poverty by Sex and Age in Glorieta
According to the poverty statistics in Glorieta, males aged 6 to 11 years and females aged 12 to 14 years are the age groups that are most secure financially, with 100.0% of males and 100.0% of females in these age groups living above the poverty line.
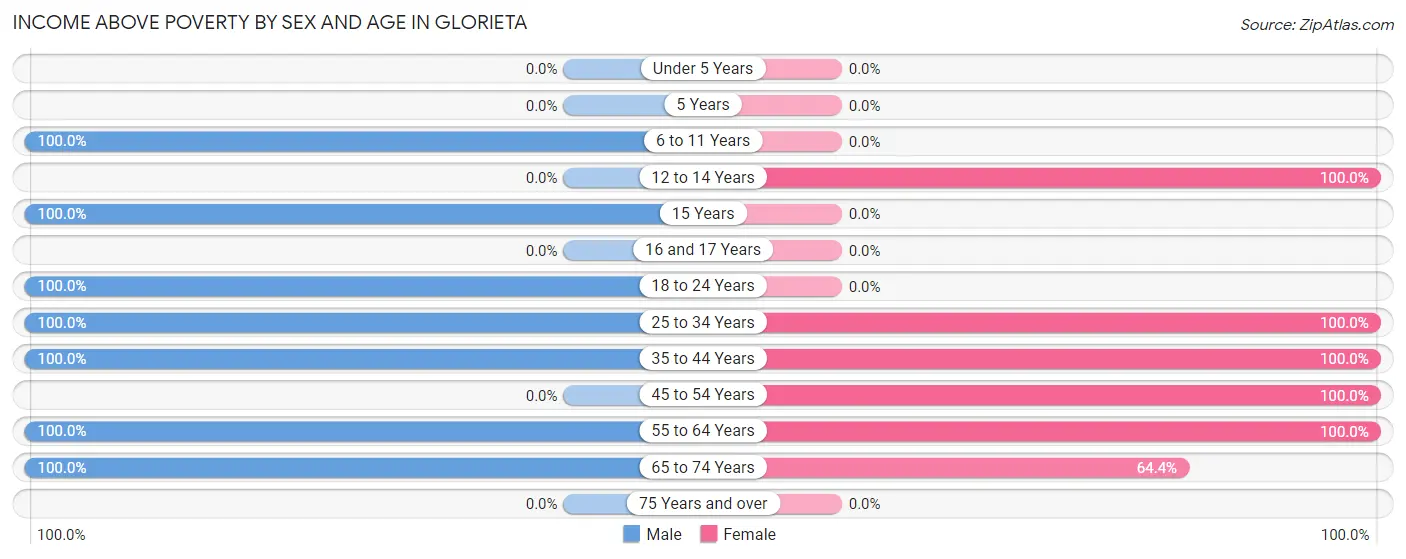
| Age Bracket | Male | Female |
| Under 5 Years | 0 (0.0%) | 0 (0.0%) |
| 5 Years | 0 (0.0%) | 0 (0.0%) |
| 6 to 11 Years | 14 (100.0%) | 0 (0.0%) |
| 12 to 14 Years | 0 (0.0%) | 15 (100.0%) |
| 15 Years | 5 (100.0%) | 0 (0.0%) |
| 16 and 17 Years | 0 (0.0%) | 0 (0.0%) |
| 18 to 24 Years | 101 (100.0%) | 0 (0.0%) |
| 25 to 34 Years | 18 (100.0%) | 79 (100.0%) |
| 35 to 44 Years | 26 (100.0%) | 19 (100.0%) |
| 45 to 54 Years | 0 (0.0%) | 7 (100.0%) |
| 55 to 64 Years | 55 (100.0%) | 59 (100.0%) |
| 65 to 74 Years | 47 (100.0%) | 67 (64.4%) |
| 75 Years and over | 0 (0.0%) | 0 (0.0%) |
| Total | 266 (100.0%) | 246 (86.9%) |
Income Below Poverty Among Married-Couple Families in Glorieta
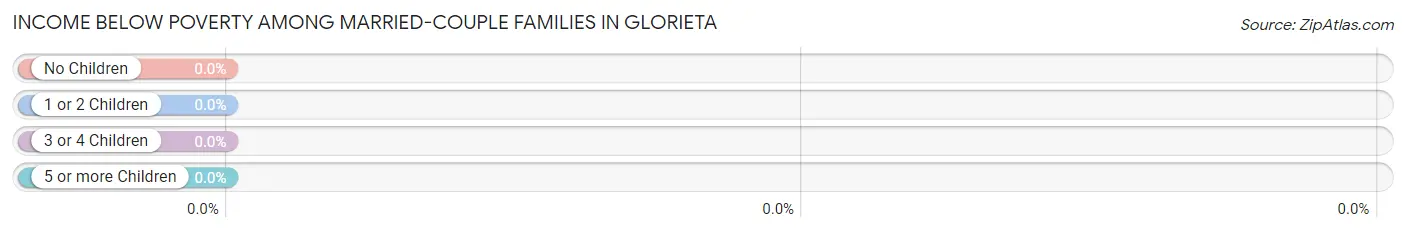
| Children | Above Poverty | Below Poverty |
| No Children | 161 (100.0%) | 0 (0.0%) |
| 1 or 2 Children | 17 (100.0%) | 0 (0.0%) |
| 3 or 4 Children | 0 (0.0%) | 0 (0.0%) |
| 5 or more Children | 0 (0.0%) | 0 (0.0%) |
| Total | 178 (100.0%) | 0 (0.0%) |
Income Below Poverty Among Single-Parent Households in Glorieta
| Children | Single Father | Single Mother |
| No Children | 0 (0.0%) | 0 (0.0%) |
| 1 or 2 Children | 0 (0.0%) | 0 (0.0%) |
| 3 or 4 Children | 0 (0.0%) | 0 (0.0%) |
| 5 or more Children | 0 (0.0%) | 0 (0.0%) |
| Total | 0 (0.0%) | 0 (0.0%) |
Income Below Poverty Among Married-Couple vs Single-Parent Households in Glorieta
| Children | Married-Couple Families | Single-Parent Households |
| No Children | 0 (0.0%) | 0 (0.0%) |
| 1 or 2 Children | 0 (0.0%) | 0 (0.0%) |
| 3 or 4 Children | 0 (0.0%) | 0 (0.0%) |
| 5 or more Children | 0 (0.0%) | 0 (0.0%) |
| Total | 0 (0.0%) | 0 (0.0%) |
Race in Glorieta
The most populous races in Glorieta are White / Caucasian (549 | 100.0%), and Hispanic or Latino (58 | 10.6%).
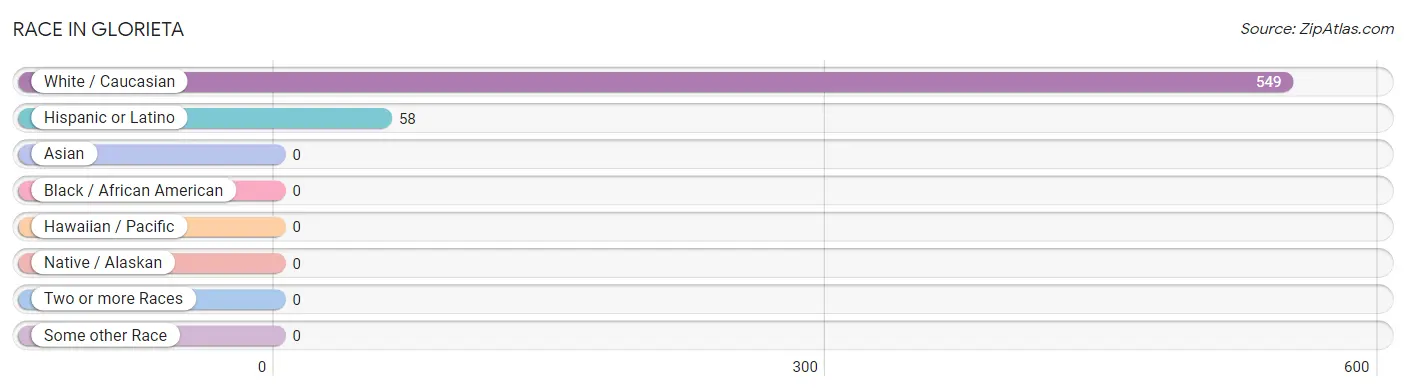
| Race | # Population | % Population |
| Asian | 0 | 0.0% |
| Black / African American | 0 | 0.0% |
| Hawaiian / Pacific | 0 | 0.0% |
| Hispanic or Latino | 58 | 10.6% |
| Native / Alaskan | 0 | 0.0% |
| White / Caucasian | 549 | 100.0% |
| Two or more Races | 0 | 0.0% |
| Some other Race | 0 | 0.0% |
| Total | 549 | 100.0% |
Ancestry in Glorieta
The most populous ancestries reported in Glorieta are European (157 | 28.6%), English (134 | 24.4%), German (114 | 20.8%), Norwegian (95 | 17.3%), and Welsh (52 | 9.5%), together accounting for 100.6% of all Glorieta residents.
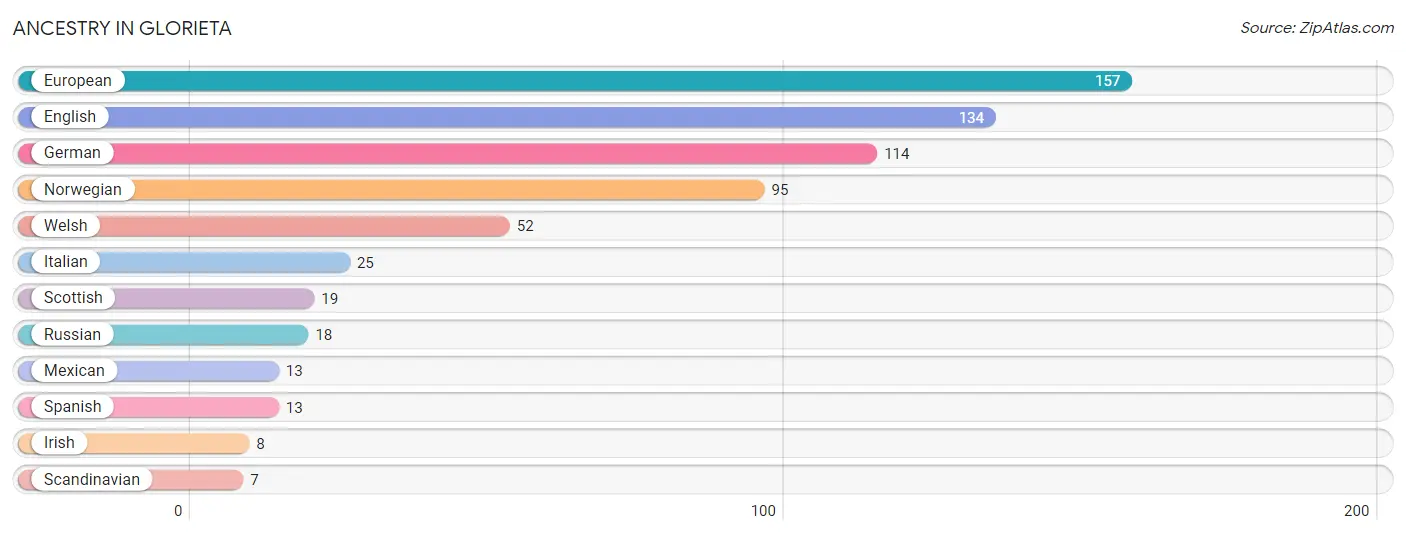
| Ancestry | # Population | % Population |
| English | 134 | 24.4% |
| European | 157 | 28.6% |
| German | 114 | 20.8% |
| Irish | 8 | 1.5% |
| Italian | 25 | 4.5% |
| Mexican | 13 | 2.4% |
| Norwegian | 95 | 17.3% |
| Russian | 18 | 3.3% |
| Scandinavian | 7 | 1.3% |
| Scottish | 19 | 3.5% |
| Spanish | 13 | 2.4% |
| Welsh | 52 | 9.5% | View All 12 Rows |
Immigrants in Glorieta
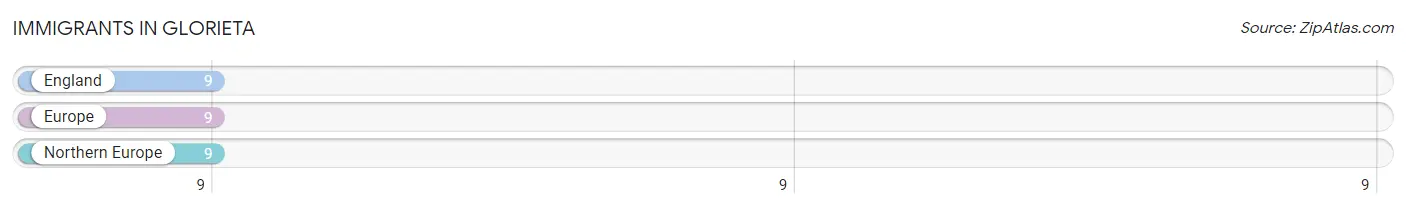
The most numerous immigrant groups reported in Glorieta came from England (9 | 1.6%), Europe (9 | 1.6%), and Northern Europe (9 | 1.6%), together accounting for 4.9% of all Glorieta residents.
| Immigration Origin | # Population | % Population |
| England | 9 | 1.6% |
| Europe | 9 | 1.6% |
| Northern Europe | 9 | 1.6% | View All 3 Rows |
Sex and Age in Glorieta
Sex and Age in Glorieta
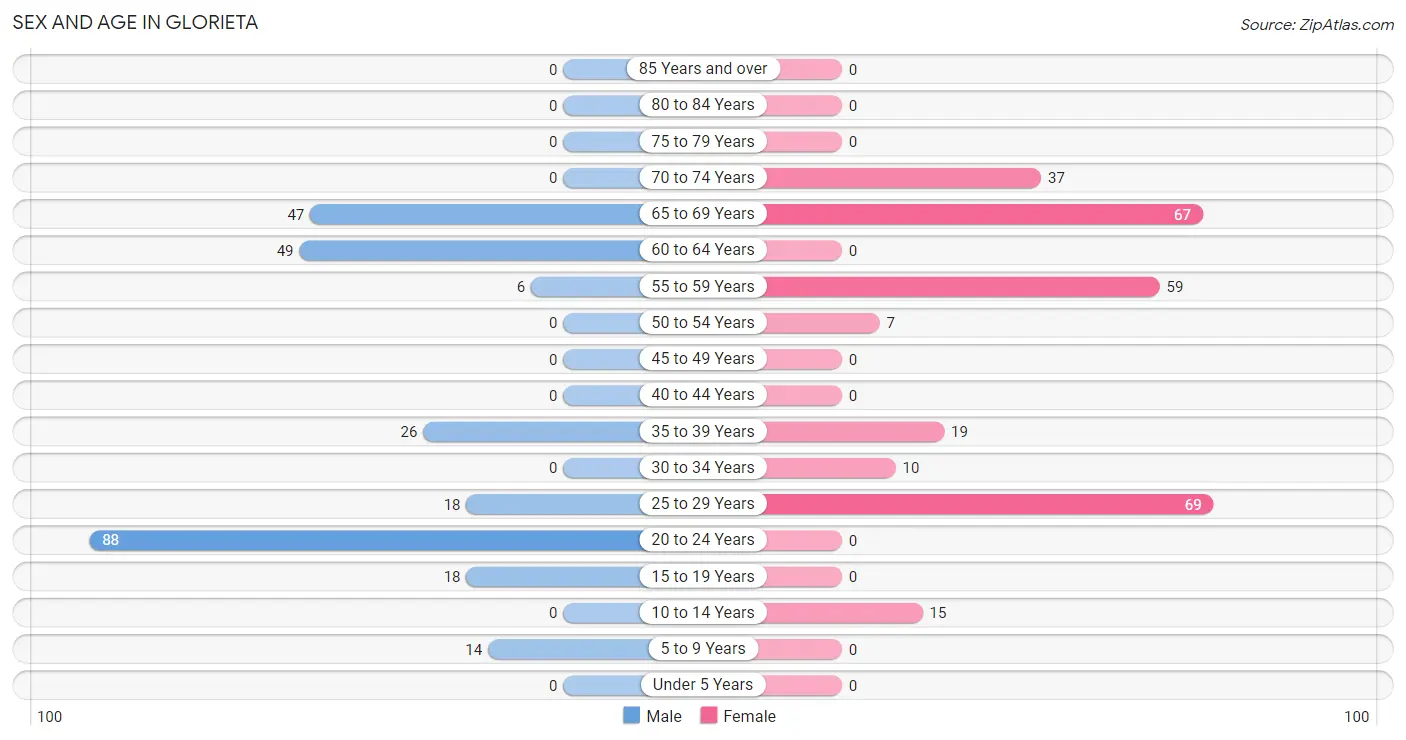
The most populous age groups in Glorieta are 20 to 24 Years (88 | 33.1%) for men and 25 to 29 Years (69 | 24.4%) for women.
| Age Bracket | Male | Female |
| Under 5 Years | 0 (0.0%) | 0 (0.0%) |
| 5 to 9 Years | 14 (5.3%) | 0 (0.0%) |
| 10 to 14 Years | 0 (0.0%) | 15 (5.3%) |
| 15 to 19 Years | 18 (6.8%) | 0 (0.0%) |
| 20 to 24 Years | 88 (33.1%) | 0 (0.0%) |
| 25 to 29 Years | 18 (6.8%) | 69 (24.4%) |
| 30 to 34 Years | 0 (0.0%) | 10 (3.5%) |
| 35 to 39 Years | 26 (9.8%) | 19 (6.7%) |
| 40 to 44 Years | 0 (0.0%) | 0 (0.0%) |
| 45 to 49 Years | 0 (0.0%) | 0 (0.0%) |
| 50 to 54 Years | 0 (0.0%) | 7 (2.5%) |
| 55 to 59 Years | 6 (2.3%) | 59 (20.8%) |
| 60 to 64 Years | 49 (18.4%) | 0 (0.0%) |
| 65 to 69 Years | 47 (17.7%) | 67 (23.7%) |
| 70 to 74 Years | 0 (0.0%) | 37 (13.1%) |
| 75 to 79 Years | 0 (0.0%) | 0 (0.0%) |
| 80 to 84 Years | 0 (0.0%) | 0 (0.0%) |
| 85 Years and over | 0 (0.0%) | 0 (0.0%) |
| Total | 266 (100.0%) | 283 (100.0%) |
Families and Households in Glorieta
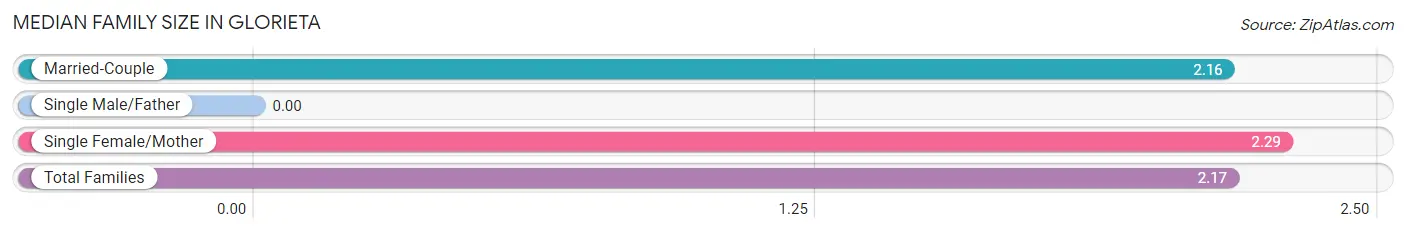
Median Family Size in Glorieta
| Family Type | # Families | Family Size |
| Married-Couple | 178 (92.7%) | 2.16 |
| Single Male/Father | 0 (0.0%) | - |
| Single Female/Mother | 14 (7.3%) | 2.29 |
| Total Families | 192 (100.0%) | 2.17 |
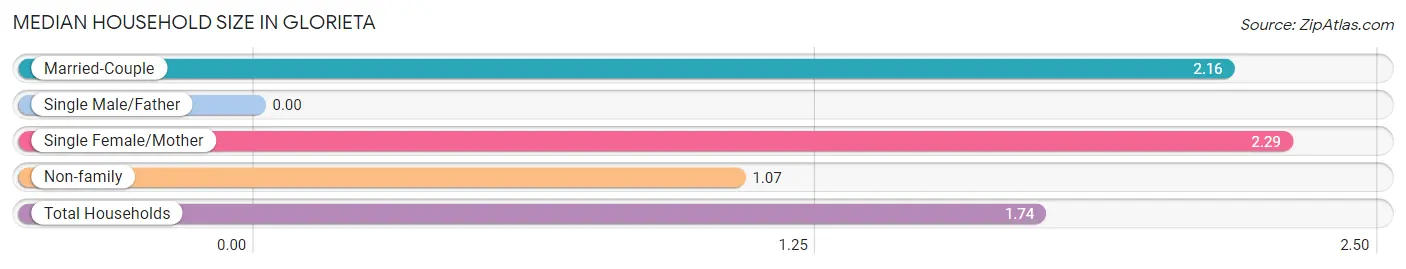
Median Household Size in Glorieta
| Household Type | # Households | Household Size |
| Married-Couple | 178 (56.3%) | 2.16 |
| Single Male/Father | 0 (0.0%) | - |
| Single Female/Mother | 14 (4.4%) | 2.29 |
| Non-family | 124 (39.2%) | 1.07 |
| Total Households | 316 (100.0%) | 1.74 |
Household Size by Marriage Status in Glorieta
Out of a total of 316 households in Glorieta, 192 (60.8%) are family households, while 124 (39.2%) are nonfamily households. The most numerous type of family households are 2-person households, comprising 161, and the most common type of nonfamily households are 1-person households, comprising 114.
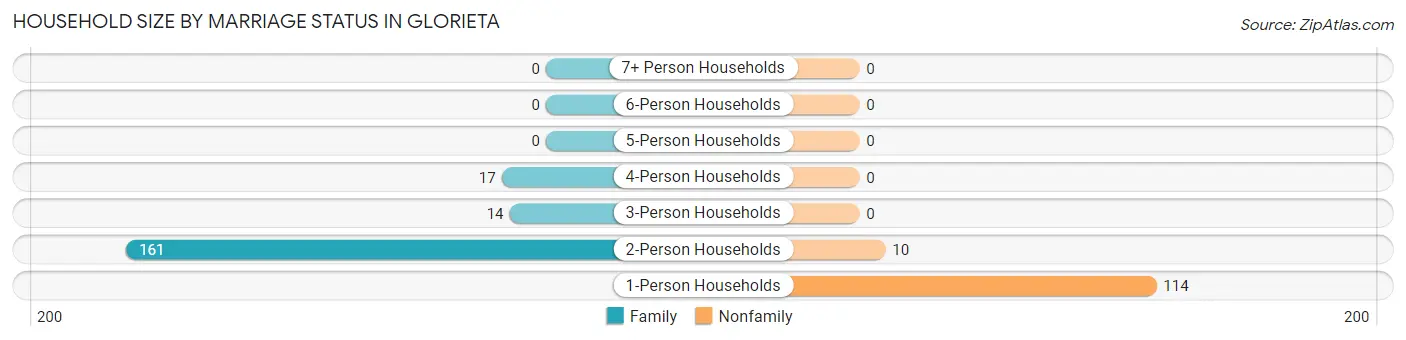
| Household Size | Family Households | Nonfamily Households |
| 1-Person Households | - | 114 (36.1%) |
| 2-Person Households | 161 (50.9%) | 10 (3.2%) |
| 3-Person Households | 14 (4.4%) | 0 (0.0%) |
| 4-Person Households | 17 (5.4%) | 0 (0.0%) |
| 5-Person Households | 0 (0.0%) | 0 (0.0%) |
| 6-Person Households | 0 (0.0%) | 0 (0.0%) |
| 7+ Person Households | 0 (0.0%) | 0 (0.0%) |
| Total | 192 (60.8%) | 124 (39.2%) |
Female Fertility in Glorieta
Fertility by Age in Glorieta
| Age Bracket | Women with Births | Births / 1,000 Women |
| 15 to 19 years | 0 (0.0%) | 0.0 |
| 20 to 34 years | 0 (0.0%) | 0.0 |
| 35 to 50 years | 0 (0.0%) | 0.0 |
| Total | 0 (0.0%) | 0.0 |
Fertility by Age by Marriage Status in Glorieta
| Age Bracket | Married | Unmarried |
| 15 to 19 years | 0 (0.0%) | 0 (0.0%) |
| 20 to 34 years | 0 (0.0%) | 0 (0.0%) |
| 35 to 50 years | 0 (0.0%) | 0 (0.0%) |
| Total | 0 (0.0%) | 0 (0.0%) |
Fertility by Education in Glorieta
| Educational Attainment | Women with Births | Births / 1,000 Women |
| Less than High School | 0 (0.0%) | 0.0 |
| High School Diploma | 0 (0.0%) | 0.0 |
| College or Associate's Degree | 0 (0.0%) | 0.0 |
| Bachelor's Degree | 0 (0.0%) | 0.0 |
| Graduate Degree | 0 (0.0%) | 0.0 |
| Total | 0 (0.0%) | 0.0 |
Fertility by Education by Marriage Status in Glorieta
| Educational Attainment | Married | Unmarried |
| Less than High School | 0 (0.0%) | 0 (0.0%) |
| High School Diploma | 0 (0.0%) | 0 (0.0%) |
| College or Associate's Degree | 0 (0.0%) | 0 (0.0%) |
| Bachelor's Degree | 0 (0.0%) | 0 (0.0%) |
| Graduate Degree | 0 (0.0%) | 0 (0.0%) |
| Total | 0 (0.0%) | 0 (0.0%) |
Employment Characteristics in Glorieta
Employment by Class of Employer in Glorieta
Among the 252 employed individuals in Glorieta, not-for-profit organizations (164 | 65.1%), self-employed (not incorporated) (32 | 12.7%), and local government employees (17 | 6.8%) make up the most common classes of employment.
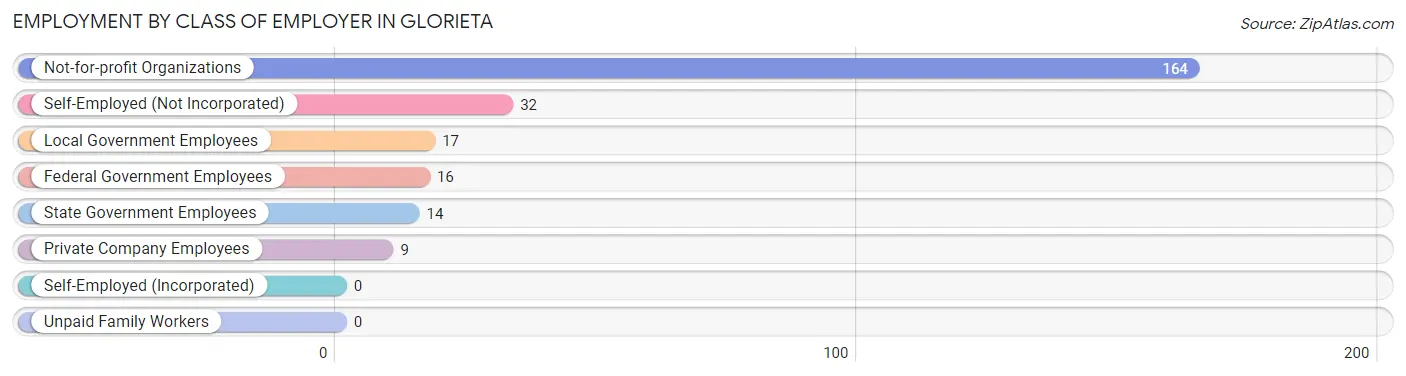
| Employer Class | # Employees | % Employees |
| Private Company Employees | 9 | 3.6% |
| Self-Employed (Incorporated) | 0 | 0.0% |
| Self-Employed (Not Incorporated) | 32 | 12.7% |
| Not-for-profit Organizations | 164 | 65.1% |
| Local Government Employees | 17 | 6.8% |
| State Government Employees | 14 | 5.6% |
| Federal Government Employees | 16 | 6.4% |
| Unpaid Family Workers | 0 | 0.0% |
| Total | 252 | 100.0% |
Employment Status by Age in Glorieta
According to the labor force statistics for Glorieta, out of the total population over 16 years of age (515), 75.0% or 386 individuals are in the labor force, with 34.7% or 134 of them unemployed. The age group with the highest labor force participation rate is 16 to 19 years, with 100.0% or 13 individuals in the labor force. Within the labor force, the 16 to 19 years age range has the highest percentage of unemployed individuals, with 100.0% or 13 of them being unemployed.
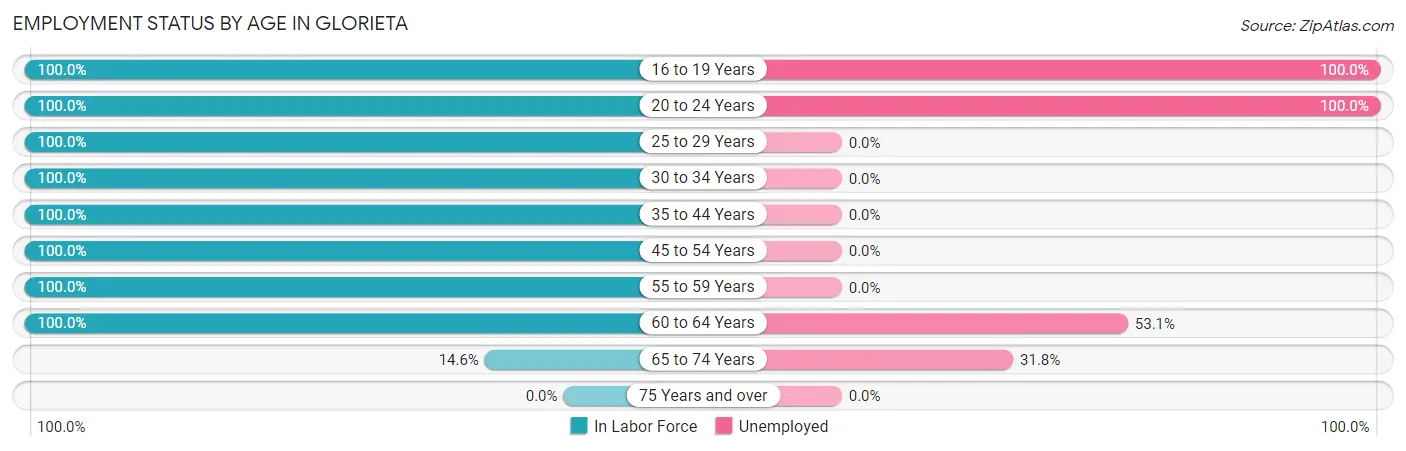
| Age Bracket | In Labor Force | Unemployed |
| 16 to 19 Years | 13 (100.0%) | 13 (100.0%) |
| 20 to 24 Years | 88 (100.0%) | 88 (100.0%) |
| 25 to 29 Years | 87 (100.0%) | 0 (0.0%) |
| 30 to 34 Years | 10 (100.0%) | 0 (0.0%) |
| 35 to 44 Years | 45 (100.0%) | 0 (0.0%) |
| 45 to 54 Years | 7 (100.0%) | 0 (0.0%) |
| 55 to 59 Years | 65 (100.0%) | 0 (0.0%) |
| 60 to 64 Years | 49 (100.0%) | 26 (53.1%) |
| 65 to 74 Years | 22 (14.6%) | 7 (31.8%) |
| 75 Years and over | 0 (0.0%) | 0 (0.0%) |
| Total | 386 (75.0%) | 134 (34.7%) |
Employment Status by Educational Attainment in Glorieta
According to labor force statistics for Glorieta, 100.0% of individuals (263) out of the total population between 25 and 64 years of age (263) are in the labor force, with 9.9% or 26 of them being unemployed. The group with the highest labor force participation rate are those with the educational attainment of high school diploma, with 100.0% or 23 individuals in the labor force. Within the labor force, individuals with bachelor's degree or higher education have the highest percentage of unemployment, with 13.2% or 26 of them being unemployed.
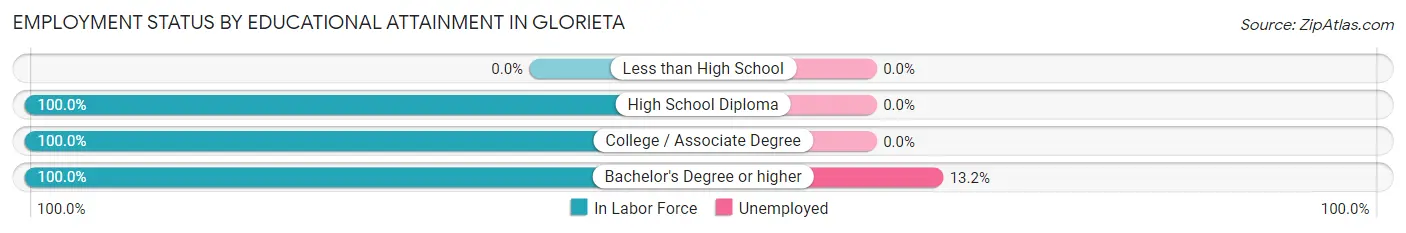
| Educational Attainment | In Labor Force | Unemployed |
| Less than High School | 0 (0.0%) | 0 (0.0%) |
| High School Diploma | 23 (100.0%) | 0 (0.0%) |
| College / Associate Degree | 43 (100.0%) | 0 (0.0%) |
| Bachelor's Degree or higher | 197 (100.0%) | 26 (13.2%) |
| Total | 263 (100.0%) | 26 (9.9%) |
Employment Occupations by Sex in Glorieta
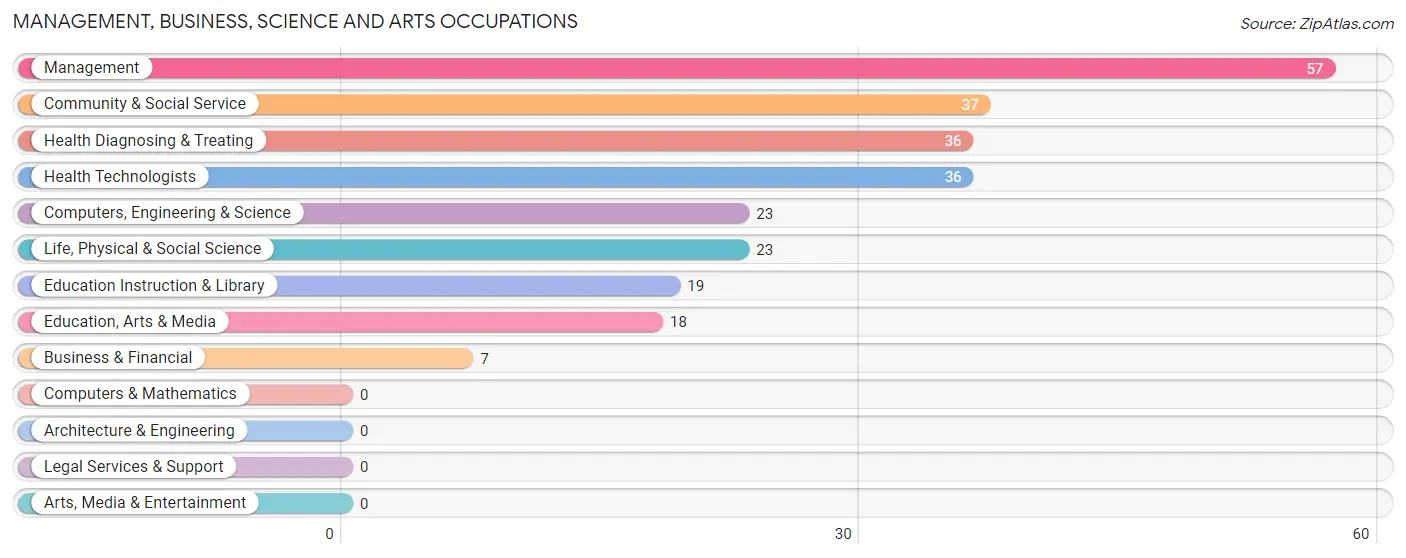
Management, Business, Science and Arts Occupations
The most common Management, Business, Science and Arts occupations in Glorieta are Management (57 | 22.6%), Community & Social Service (37 | 14.7%), Health Diagnosing & Treating (36 | 14.3%), Health Technologists (36 | 14.3%), and Computers, Engineering & Science (23 | 9.1%).
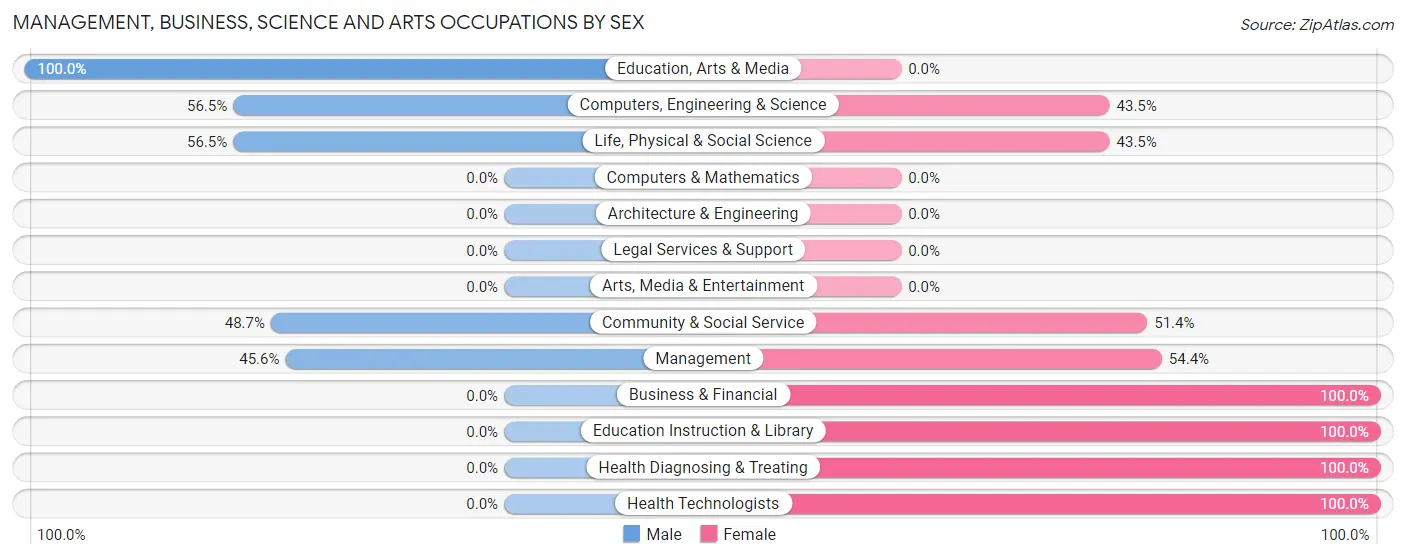
Management, Business, Science and Arts Occupations by Sex
Within the Management, Business, Science and Arts occupations in Glorieta, the most male-oriented occupations are Education, Arts & Media (100.0%), Computers, Engineering & Science (56.5%), and Life, Physical & Social Science (56.5%), while the most female-oriented occupations are Business & Financial (100.0%), Education Instruction & Library (100.0%), and Health Diagnosing & Treating (100.0%).
| Occupation | Male | Female |
| Management | 26 (45.6%) | 31 (54.4%) |
| Business & Financial | 0 (0.0%) | 7 (100.0%) |
| Computers, Engineering & Science | 13 (56.5%) | 10 (43.5%) |
| Computers & Mathematics | 0 (0.0%) | 0 (0.0%) |
| Architecture & Engineering | 0 (0.0%) | 0 (0.0%) |
| Life, Physical & Social Science | 13 (56.5%) | 10 (43.5%) |
| Community & Social Service | 18 (48.6%) | 19 (51.3%) |
| Education, Arts & Media | 18 (100.0%) | 0 (0.0%) |
| Legal Services & Support | 0 (0.0%) | 0 (0.0%) |
| Education Instruction & Library | 0 (0.0%) | 19 (100.0%) |
| Arts, Media & Entertainment | 0 (0.0%) | 0 (0.0%) |
| Health Diagnosing & Treating | 0 (0.0%) | 36 (100.0%) |
| Health Technologists | 0 (0.0%) | 36 (100.0%) |
| Total (Category) | 57 (35.6%) | 103 (64.4%) |
| Total (Overall) | 73 (29.0%) | 179 (71.0%) |
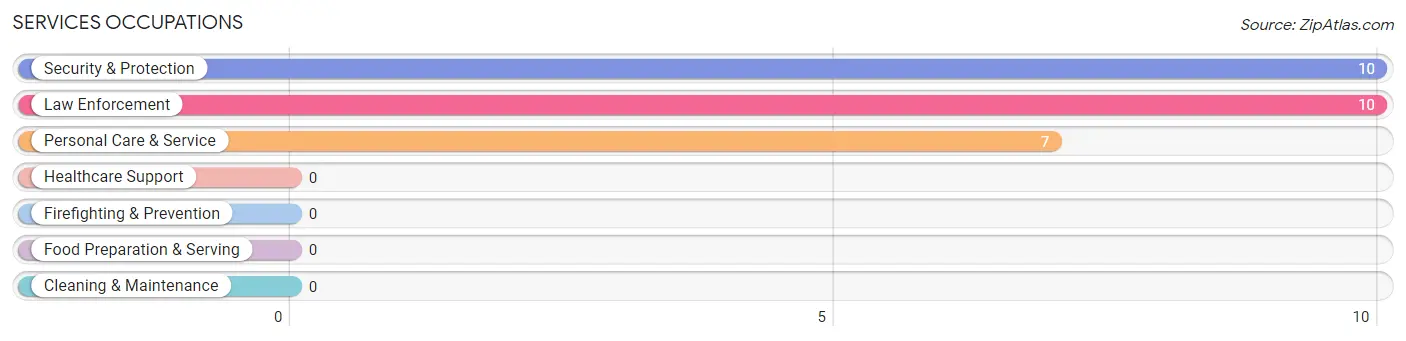
Services Occupations
The most common Services occupations in Glorieta are Security & Protection (10 | 4.0%), Law Enforcement (10 | 4.0%), and Personal Care & Service (7 | 2.8%).
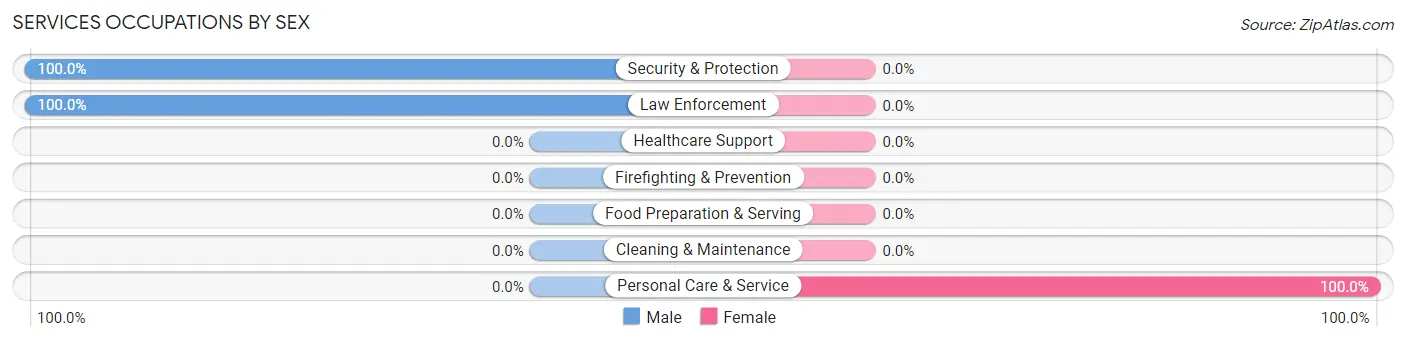
Services Occupations by Sex
| Occupation | Male | Female |
| Healthcare Support | 0 (0.0%) | 0 (0.0%) |
| Security & Protection | 10 (100.0%) | 0 (0.0%) |
| Firefighting & Prevention | 0 (0.0%) | 0 (0.0%) |
| Law Enforcement | 10 (100.0%) | 0 (0.0%) |
| Food Preparation & Serving | 0 (0.0%) | 0 (0.0%) |
| Cleaning & Maintenance | 0 (0.0%) | 0 (0.0%) |
| Personal Care & Service | 0 (0.0%) | 7 (100.0%) |
| Total (Category) | 10 (58.8%) | 7 (41.2%) |
| Total (Overall) | 73 (29.0%) | 179 (71.0%) |
Sales and Office Occupations
The most common Sales and Office occupations in Glorieta are Office & Administration (69 | 27.4%), and Sales & Related (6 | 2.4%).
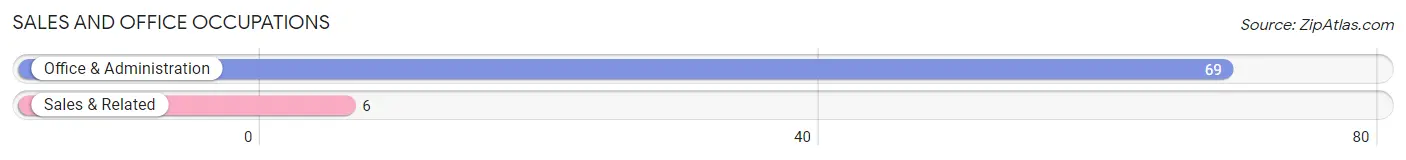
Sales and Office Occupations by Sex
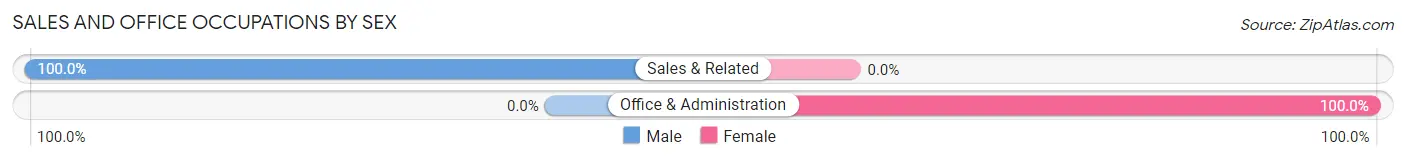
| Occupation | Male | Female |
| Sales & Related | 6 (100.0%) | 0 (0.0%) |
| Office & Administration | 0 (0.0%) | 69 (100.0%) |
| Total (Category) | 6 (8.0%) | 69 (92.0%) |
| Total (Overall) | 73 (29.0%) | 179 (71.0%) |
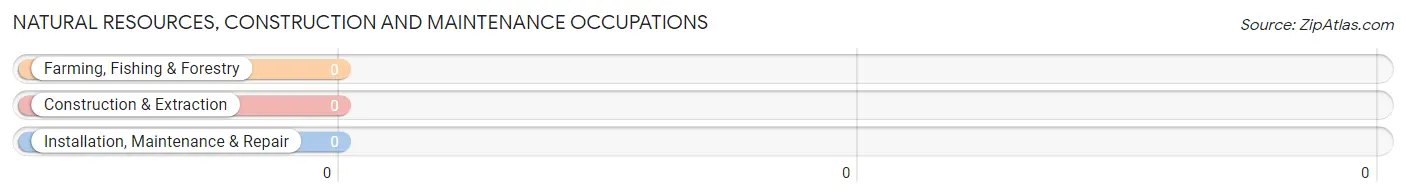
Natural Resources, Construction and Maintenance Occupations
Natural Resources, Construction and Maintenance Occupations by Sex
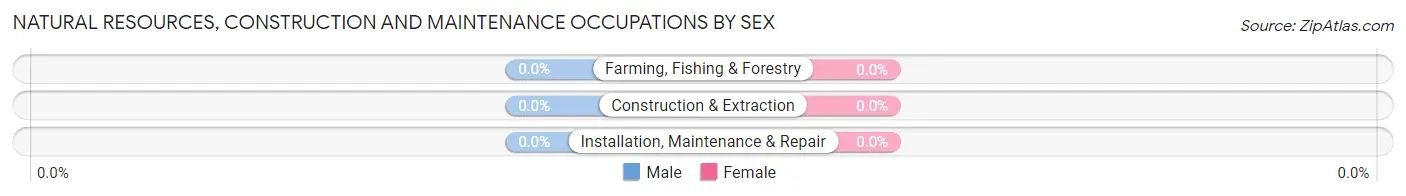
| Occupation | Male | Female |
| Farming, Fishing & Forestry | 0 (0.0%) | 0 (0.0%) |
| Construction & Extraction | 0 (0.0%) | 0 (0.0%) |
| Installation, Maintenance & Repair | 0 (0.0%) | 0 (0.0%) |
| Total (Category) | 0 (0.0%) | 0 (0.0%) |
| Total (Overall) | 73 (29.0%) | 179 (71.0%) |
Production, Transportation and Moving Occupations
Production, Transportation and Moving Occupations by Sex
| Occupation | Male | Female |
| Production | 0 (0.0%) | 0 (0.0%) |
| Transportation | 0 (0.0%) | 0 (0.0%) |
| Material Moving | 0 (0.0%) | 0 (0.0%) |
| Total (Category) | 0 (0.0%) | 0 (0.0%) |
| Total (Overall) | 73 (29.0%) | 179 (71.0%) |
Employment Industries by Sex in Glorieta
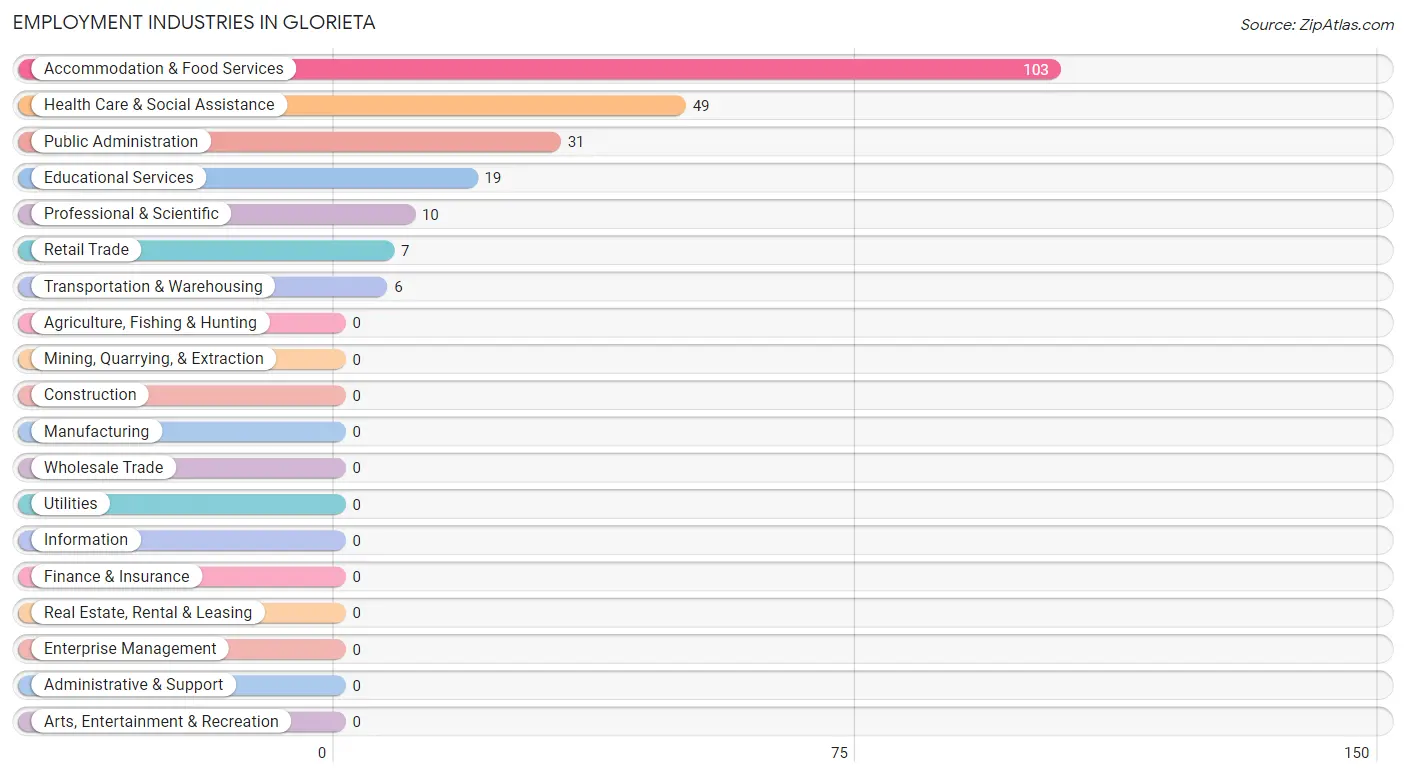
Employment Industries in Glorieta
The major employment industries in Glorieta include Accommodation & Food Services (103 | 40.9%), Health Care & Social Assistance (49 | 19.4%), Public Administration (31 | 12.3%), Educational Services (19 | 7.5%), and Professional & Scientific (10 | 4.0%).
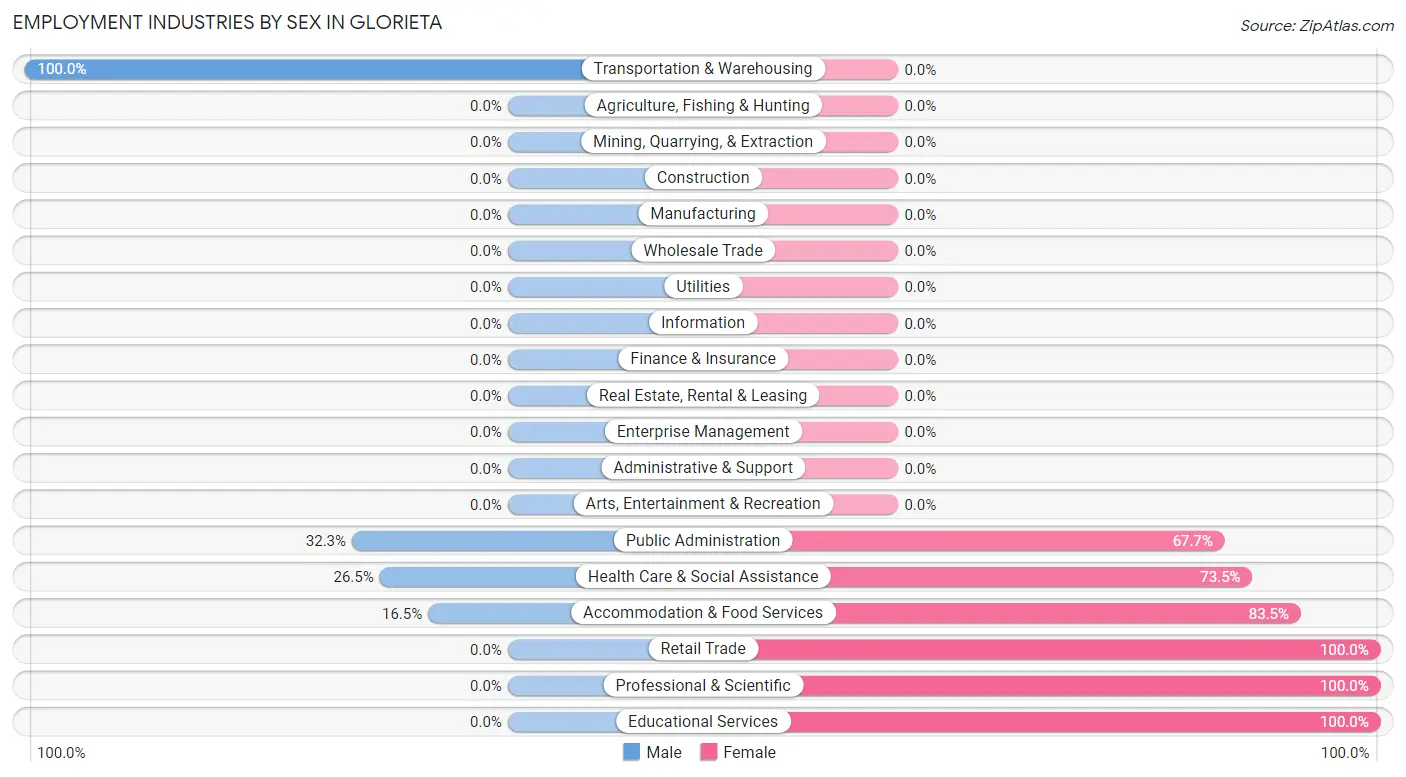
Employment Industries by Sex in Glorieta
The Glorieta industries that see more men than women are Transportation & Warehousing (100.0%), Public Administration (32.3%), and Health Care & Social Assistance (26.5%), whereas the industries that tend to have a higher number of women are Retail Trade (100.0%), Professional & Scientific (100.0%), and Educational Services (100.0%).
| Industry | Male | Female |
| Agriculture, Fishing & Hunting | 0 (0.0%) | 0 (0.0%) |
| Mining, Quarrying, & Extraction | 0 (0.0%) | 0 (0.0%) |
| Construction | 0 (0.0%) | 0 (0.0%) |
| Manufacturing | 0 (0.0%) | 0 (0.0%) |
| Wholesale Trade | 0 (0.0%) | 0 (0.0%) |
| Retail Trade | 0 (0.0%) | 7 (100.0%) |
| Transportation & Warehousing | 6 (100.0%) | 0 (0.0%) |
| Utilities | 0 (0.0%) | 0 (0.0%) |
| Information | 0 (0.0%) | 0 (0.0%) |
| Finance & Insurance | 0 (0.0%) | 0 (0.0%) |
| Real Estate, Rental & Leasing | 0 (0.0%) | 0 (0.0%) |
| Professional & Scientific | 0 (0.0%) | 10 (100.0%) |
| Enterprise Management | 0 (0.0%) | 0 (0.0%) |
| Administrative & Support | 0 (0.0%) | 0 (0.0%) |
| Educational Services | 0 (0.0%) | 19 (100.0%) |
| Health Care & Social Assistance | 13 (26.5%) | 36 (73.5%) |
| Arts, Entertainment & Recreation | 0 (0.0%) | 0 (0.0%) |
| Accommodation & Food Services | 17 (16.5%) | 86 (83.5%) |
| Public Administration | 10 (32.3%) | 21 (67.7%) |
| Total | 73 (29.0%) | 179 (71.0%) |
Education in Glorieta
School Enrollment in Glorieta
The most common levels of schooling among the 47 students in Glorieta are high school (18 | 38.3%), middle school (15 | 31.9%), and kindergarten (14 | 29.8%).
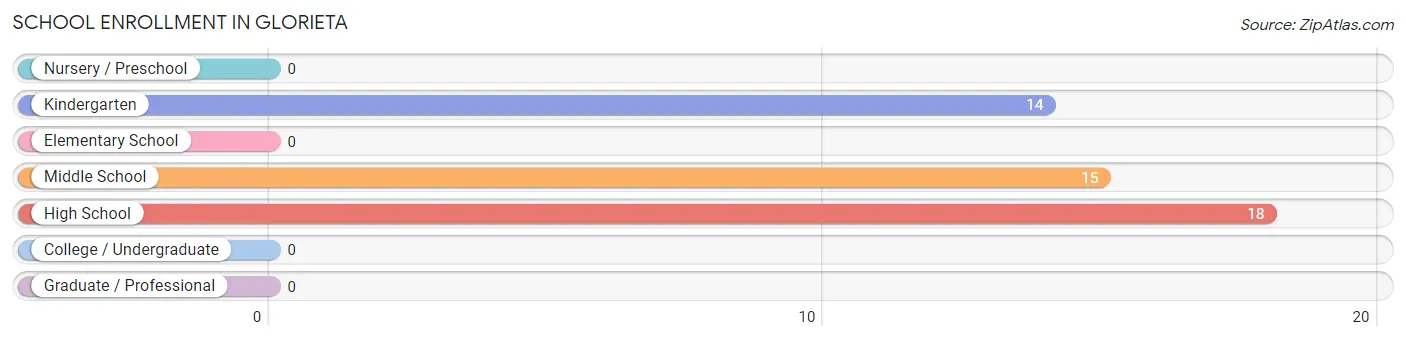
| School Level | # Students | % Students |
| Nursery / Preschool | 0 | 0.0% |
| Kindergarten | 14 | 29.8% |
| Elementary School | 0 | 0.0% |
| Middle School | 15 | 31.9% |
| High School | 18 | 38.3% |
| College / Undergraduate | 0 | 0.0% |
| Graduate / Professional | 0 | 0.0% |
| Total | 47 | 100.0% |
School Enrollment by Age by Funding Source in Glorieta
Out of a total of 47 students who are enrolled in schools in Glorieta, 15 (31.9%) attend a private institution, while the remaining 32 (68.1%) are enrolled in public schools. The age group of 10 to 14 year olds has the highest likelihood of being enrolled in private schools, with 15 (100.0% in the age bracket) enrolled. Conversely, the age group of 5 to 9 year old has the lowest likelihood of being enrolled in a private school, with 14 (100.0% in the age bracket) attending a public institution.
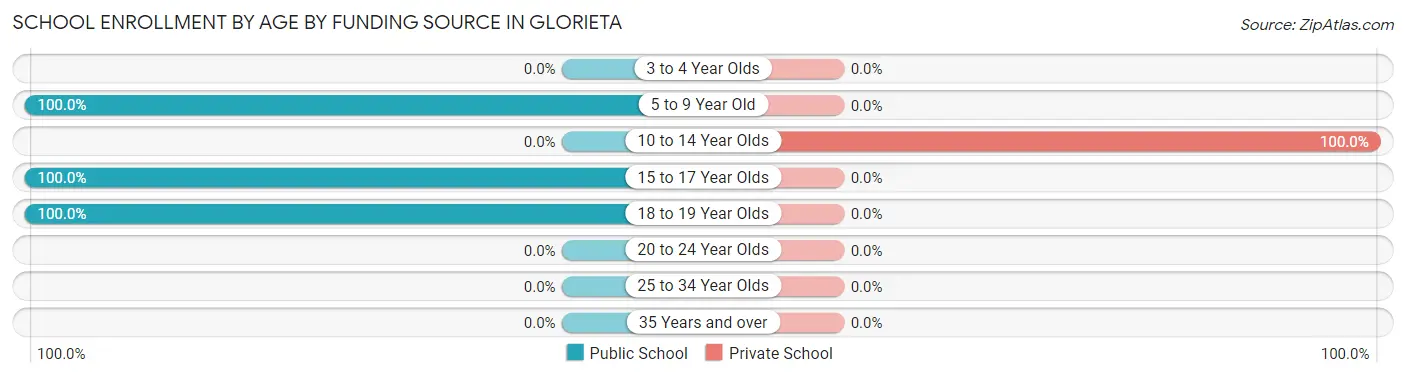
| Age Bracket | Public School | Private School |
| 3 to 4 Year Olds | 0 (0.0%) | 0 (0.0%) |
| 5 to 9 Year Old | 14 (100.0%) | 0 (0.0%) |
| 10 to 14 Year Olds | 0 (0.0%) | 15 (100.0%) |
| 15 to 17 Year Olds | 5 (100.0%) | 0 (0.0%) |
| 18 to 19 Year Olds | 13 (100.0%) | 0 (0.0%) |
| 20 to 24 Year Olds | 0 (0.0%) | 0 (0.0%) |
| 25 to 34 Year Olds | 0 (0.0%) | 0 (0.0%) |
| 35 Years and over | 0 (0.0%) | 0 (0.0%) |
| Total | 32 (68.1%) | 15 (31.9%) |
Educational Attainment by Field of Study in Glorieta
Multidisciplinary studies (69 | 22.3%), business (62 | 20.0%), communications (53 | 17.1%), liberal arts & history (26 | 8.4%), and psychology (25 | 8.1%) are the most common fields of study among 310 individuals in Glorieta who have obtained a bachelor's degree or higher.
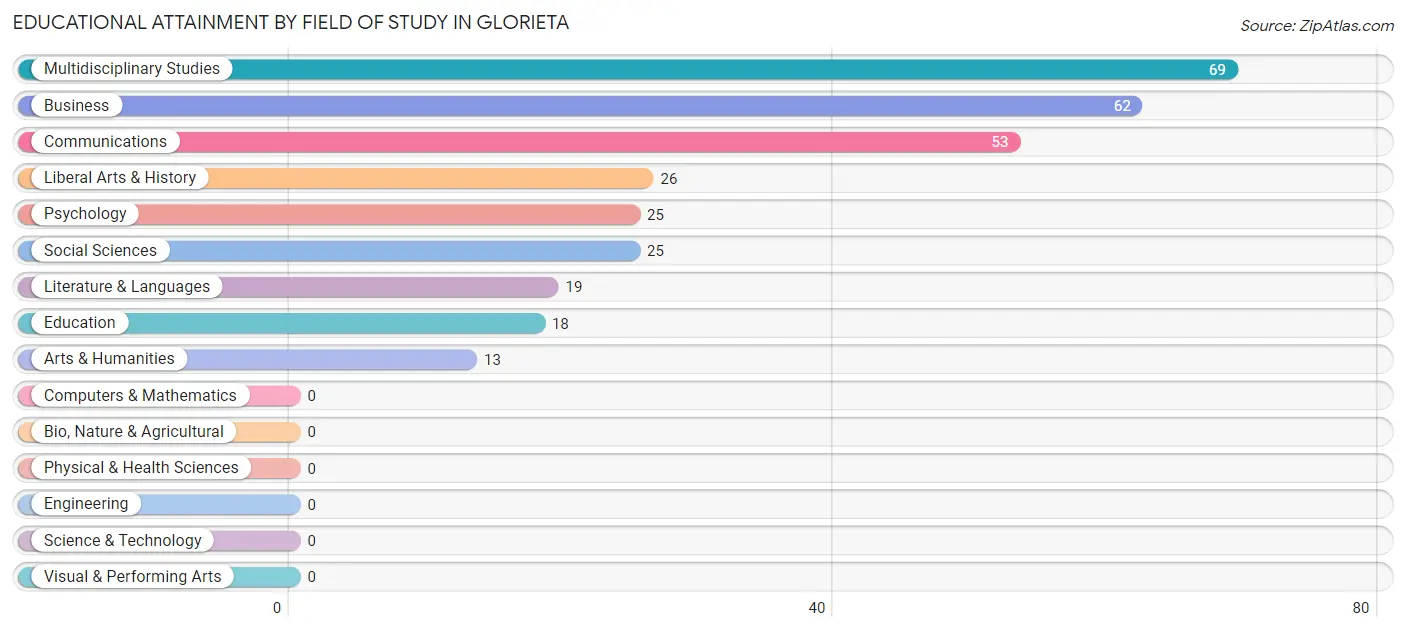
| Field of Study | # Graduates | % Graduates |
| Computers & Mathematics | 0 | 0.0% |
| Bio, Nature & Agricultural | 0 | 0.0% |
| Physical & Health Sciences | 0 | 0.0% |
| Psychology | 25 | 8.1% |
| Social Sciences | 25 | 8.1% |
| Engineering | 0 | 0.0% |
| Multidisciplinary Studies | 69 | 22.3% |
| Science & Technology | 0 | 0.0% |
| Business | 62 | 20.0% |
| Education | 18 | 5.8% |
| Literature & Languages | 19 | 6.1% |
| Liberal Arts & History | 26 | 8.4% |
| Visual & Performing Arts | 0 | 0.0% |
| Communications | 53 | 17.1% |
| Arts & Humanities | 13 | 4.2% |
| Total | 310 | 100.0% |
Transportation & Commute in Glorieta
Vehicle Availability by Sex in Glorieta
The most prevalent vehicle ownership categories in Glorieta are males with 2 vehicles (32, accounting for 43.8%) and females with 2 vehicles (113, making up 17.9%).
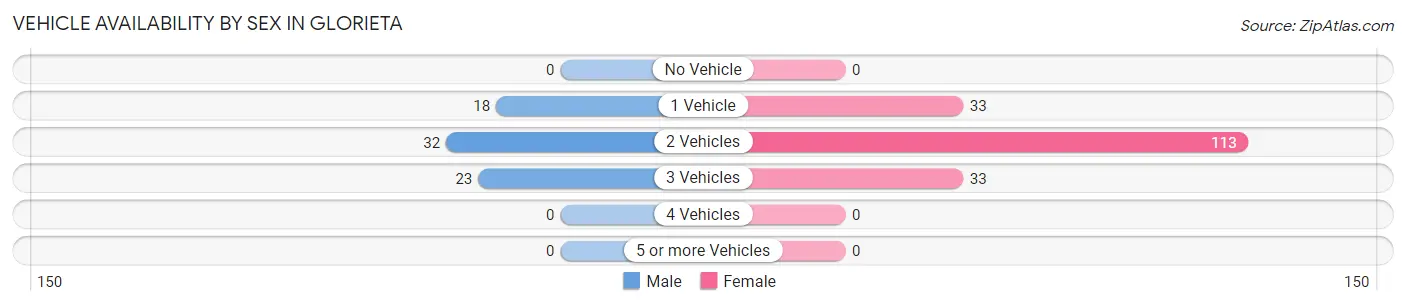
| Vehicles Available | Male | Female |
| No Vehicle | 0 (0.0%) | 0 (0.0%) |
| 1 Vehicle | 18 (24.7%) | 33 (18.4%) |
| 2 Vehicles | 32 (43.8%) | 113 (63.1%) |
| 3 Vehicles | 23 (31.5%) | 33 (18.4%) |
| 4 Vehicles | 0 (0.0%) | 0 (0.0%) |
| 5 or more Vehicles | 0 (0.0%) | 0 (0.0%) |
| Total | 73 (100.0%) | 179 (100.0%) |
Commute Time in Glorieta
The most frequently occuring commute durations in Glorieta are 5 to 9 minutes (84 commuters, 33.3%), 30 to 34 minutes (40 commuters, 15.9%), and 60 to 89 minutes (33 commuters, 13.1%).
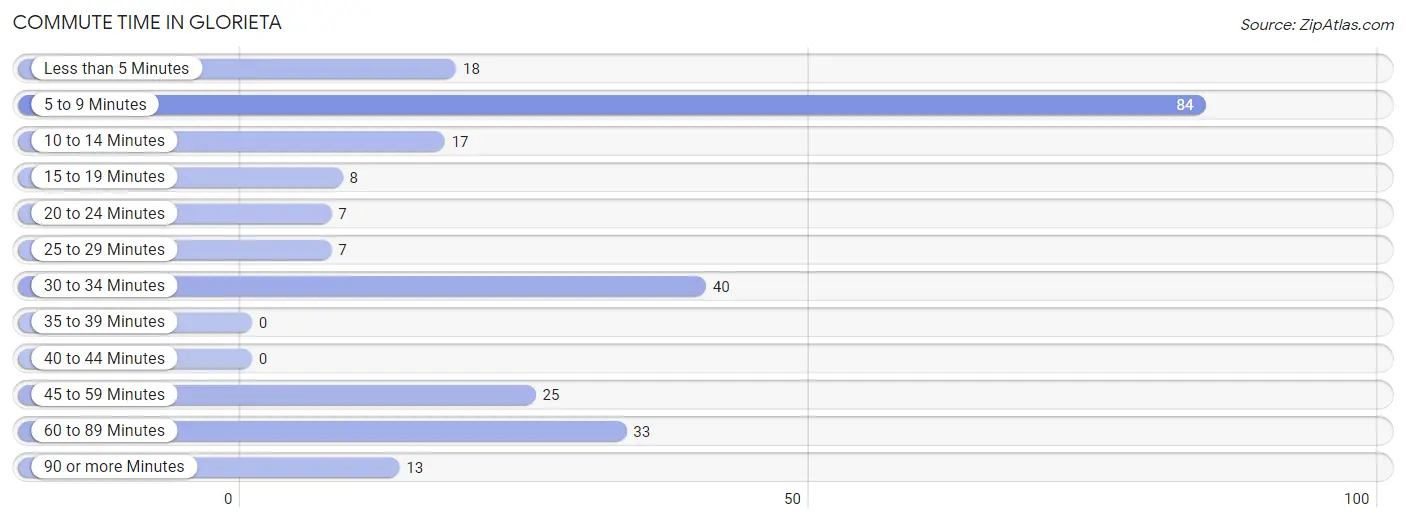
| Commute Time | # Commuters | % Commuters |
| Less than 5 Minutes | 18 | 7.1% |
| 5 to 9 Minutes | 84 | 33.3% |
| 10 to 14 Minutes | 17 | 6.8% |
| 15 to 19 Minutes | 8 | 3.2% |
| 20 to 24 Minutes | 7 | 2.8% |
| 25 to 29 Minutes | 7 | 2.8% |
| 30 to 34 Minutes | 40 | 15.9% |
| 35 to 39 Minutes | 0 | 0.0% |
| 40 to 44 Minutes | 0 | 0.0% |
| 45 to 59 Minutes | 25 | 9.9% |
| 60 to 89 Minutes | 33 | 13.1% |
| 90 or more Minutes | 13 | 5.2% |
Commute Time by Sex in Glorieta
The most common commute times in Glorieta are less than 5 minutes (18 commuters, 24.7%) for males and 5 to 9 minutes (69 commuters, 38.6%) for females.
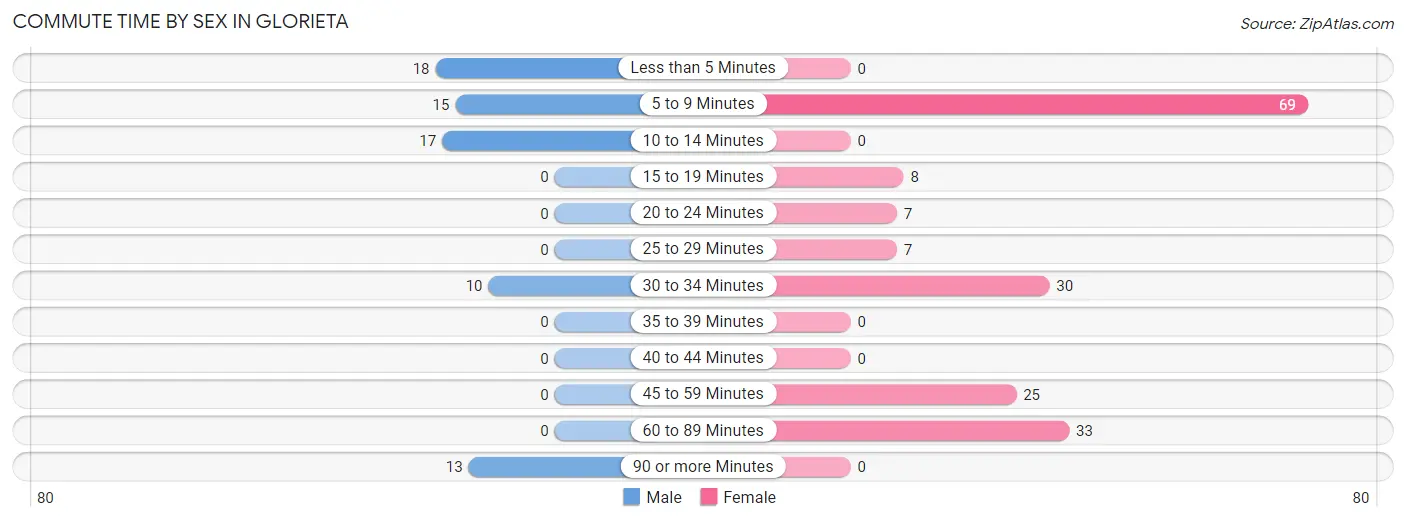
| Commute Time | Male | Female |
| Less than 5 Minutes | 18 (24.7%) | 0 (0.0%) |
| 5 to 9 Minutes | 15 (20.5%) | 69 (38.6%) |
| 10 to 14 Minutes | 17 (23.3%) | 0 (0.0%) |
| 15 to 19 Minutes | 0 (0.0%) | 8 (4.5%) |
| 20 to 24 Minutes | 0 (0.0%) | 7 (3.9%) |
| 25 to 29 Minutes | 0 (0.0%) | 7 (3.9%) |
| 30 to 34 Minutes | 10 (13.7%) | 30 (16.8%) |
| 35 to 39 Minutes | 0 (0.0%) | 0 (0.0%) |
| 40 to 44 Minutes | 0 (0.0%) | 0 (0.0%) |
| 45 to 59 Minutes | 0 (0.0%) | 25 (14.0%) |
| 60 to 89 Minutes | 0 (0.0%) | 33 (18.4%) |
| 90 or more Minutes | 13 (17.8%) | 0 (0.0%) |
Time of Departure to Work by Sex in Glorieta
The most frequent times of departure to work in Glorieta are 7:30 AM to 7:59 AM (44, 60.3%) for males and 8:00 AM to 8:29 AM (69, 38.6%) for females.
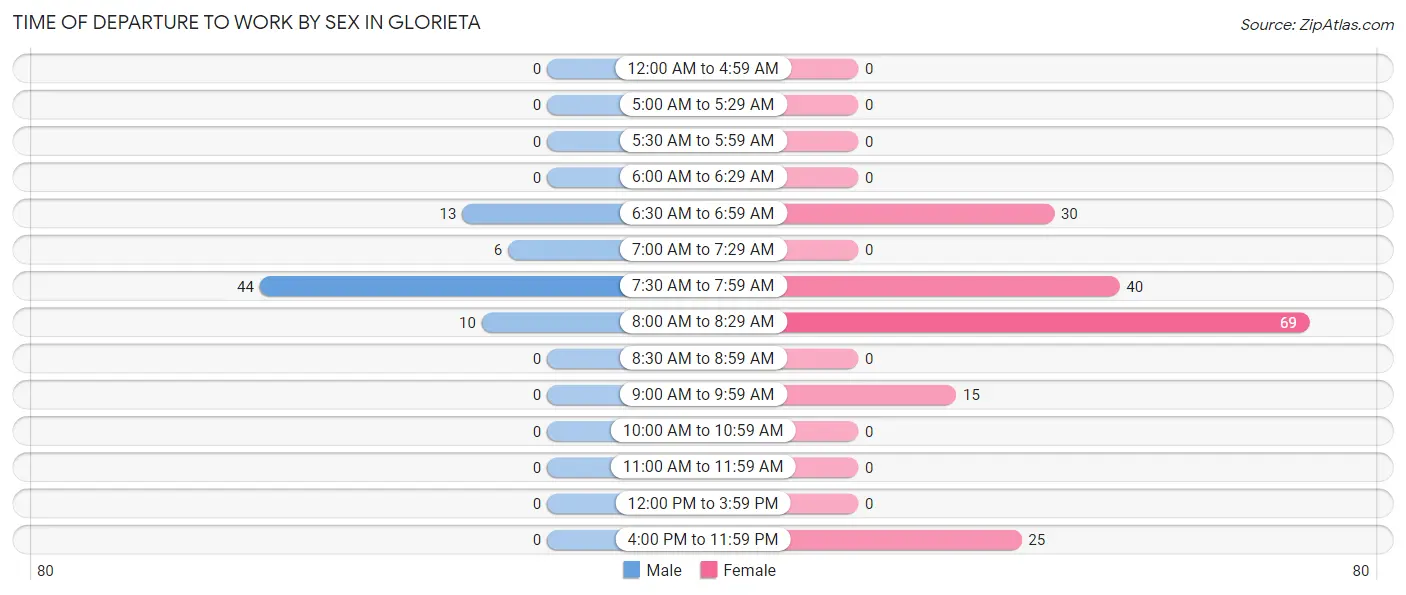
| Time of Departure | Male | Female |
| 12:00 AM to 4:59 AM | 0 (0.0%) | 0 (0.0%) |
| 5:00 AM to 5:29 AM | 0 (0.0%) | 0 (0.0%) |
| 5:30 AM to 5:59 AM | 0 (0.0%) | 0 (0.0%) |
| 6:00 AM to 6:29 AM | 0 (0.0%) | 0 (0.0%) |
| 6:30 AM to 6:59 AM | 13 (17.8%) | 30 (16.8%) |
| 7:00 AM to 7:29 AM | 6 (8.2%) | 0 (0.0%) |
| 7:30 AM to 7:59 AM | 44 (60.3%) | 40 (22.4%) |
| 8:00 AM to 8:29 AM | 10 (13.7%) | 69 (38.6%) |
| 8:30 AM to 8:59 AM | 0 (0.0%) | 0 (0.0%) |
| 9:00 AM to 9:59 AM | 0 (0.0%) | 15 (8.4%) |
| 10:00 AM to 10:59 AM | 0 (0.0%) | 0 (0.0%) |
| 11:00 AM to 11:59 AM | 0 (0.0%) | 0 (0.0%) |
| 12:00 PM to 3:59 PM | 0 (0.0%) | 0 (0.0%) |
| 4:00 PM to 11:59 PM | 0 (0.0%) | 25 (14.0%) |
| Total | 73 (100.0%) | 179 (100.0%) |
Housing Occupancy in Glorieta
Occupancy by Ownership in Glorieta
Of the total 316 dwellings in Glorieta, owner-occupied units account for 162 (51.3%), while renter-occupied units make up 154 (48.7%).
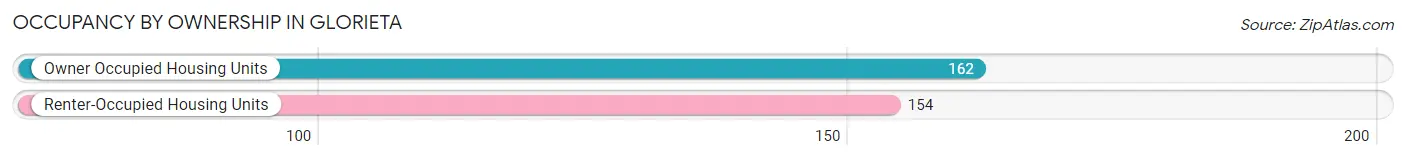
| Occupancy | # Housing Units | % Housing Units |
| Owner Occupied Housing Units | 162 | 51.3% |
| Renter-Occupied Housing Units | 154 | 48.7% |
| Total Occupied Housing Units | 316 | 100.0% |
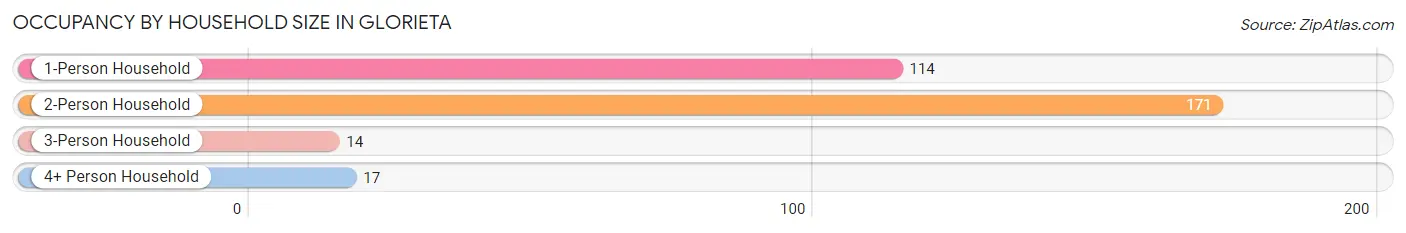
Occupancy by Household Size in Glorieta
| Household Size | # Housing Units | % Housing Units |
| 1-Person Household | 114 | 36.1% |
| 2-Person Household | 171 | 54.1% |
| 3-Person Household | 14 | 4.4% |
| 4+ Person Household | 17 | 5.4% |
| Total Housing Units | 316 | 100.0% |
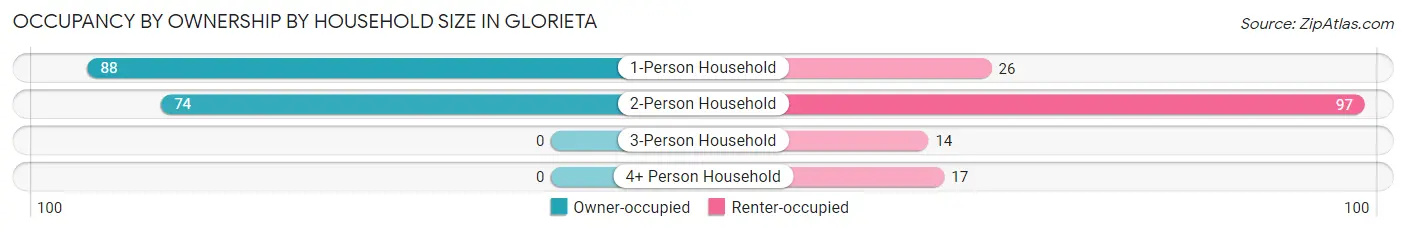
Occupancy by Ownership by Household Size in Glorieta
| Household Size | Owner-occupied | Renter-occupied |
| 1-Person Household | 88 (77.2%) | 26 (22.8%) |
| 2-Person Household | 74 (43.3%) | 97 (56.7%) |
| 3-Person Household | 0 (0.0%) | 14 (100.0%) |
| 4+ Person Household | 0 (0.0%) | 17 (100.0%) |
| Total Housing Units | 162 (51.3%) | 154 (48.7%) |
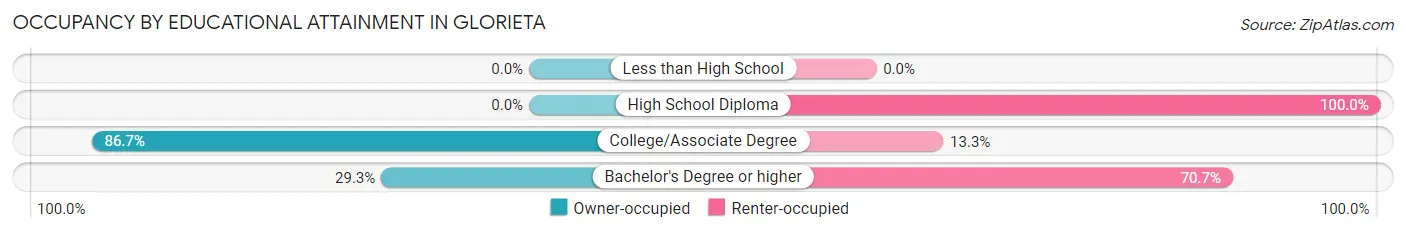
Occupancy by Educational Attainment in Glorieta
| Household Size | Owner-occupied | Renter-occupied |
| Less than High School | 0 (0.0%) | 0 (0.0%) |
| High School Diploma | 0 (0.0%) | 14 (100.0%) |
| College/Associate Degree | 111 (86.7%) | 17 (13.3%) |
| Bachelor's Degree or higher | 51 (29.3%) | 123 (70.7%) |
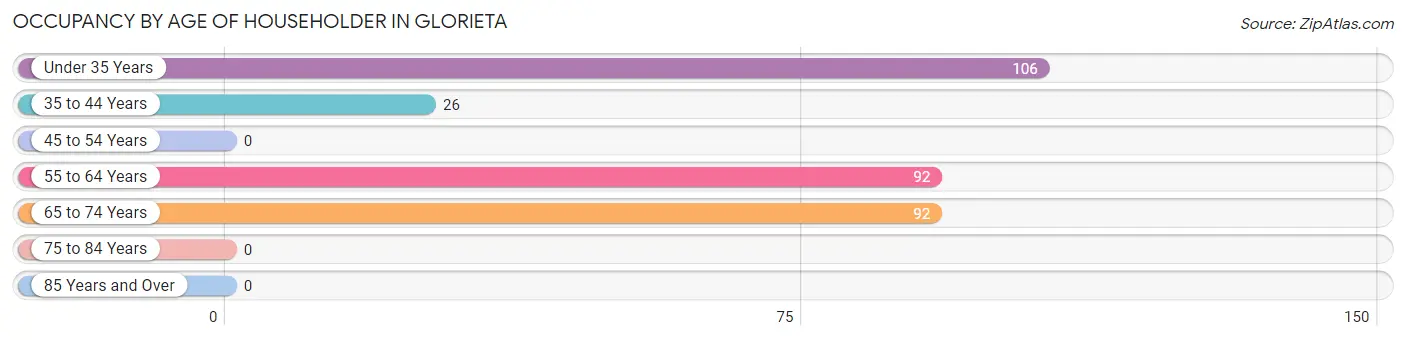
Occupancy by Age of Householder in Glorieta
| Age Bracket | # Households | % Households |
| Under 35 Years | 106 | 33.5% |
| 35 to 44 Years | 26 | 8.2% |
| 45 to 54 Years | 0 | 0.0% |
| 55 to 64 Years | 92 | 29.1% |
| 65 to 74 Years | 92 | 29.1% |
| 75 to 84 Years | 0 | 0.0% |
| 85 Years and Over | 0 | 0.0% |
| Total | 316 | 100.0% |
Housing Finances in Glorieta
Median Income by Occupancy in Glorieta
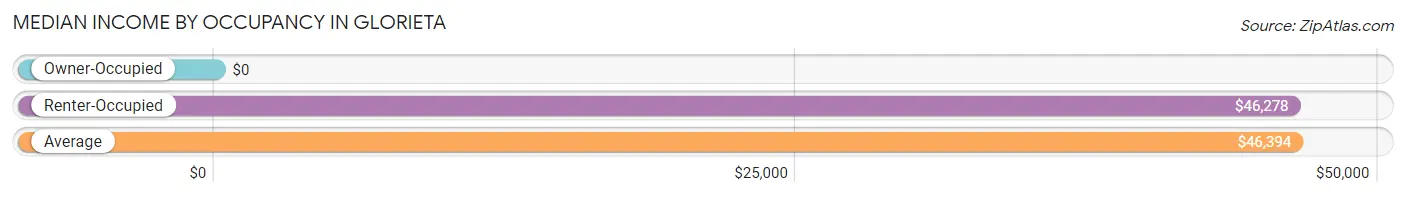
| Occupancy Type | # Households | Median Income |
| Owner-Occupied | 162 (51.3%) | $0 |
| Renter-Occupied | 154 (48.7%) | $46,278 |
| Average | 316 (100.0%) | $46,394 |
Occupancy by Householder Income Bracket in Glorieta
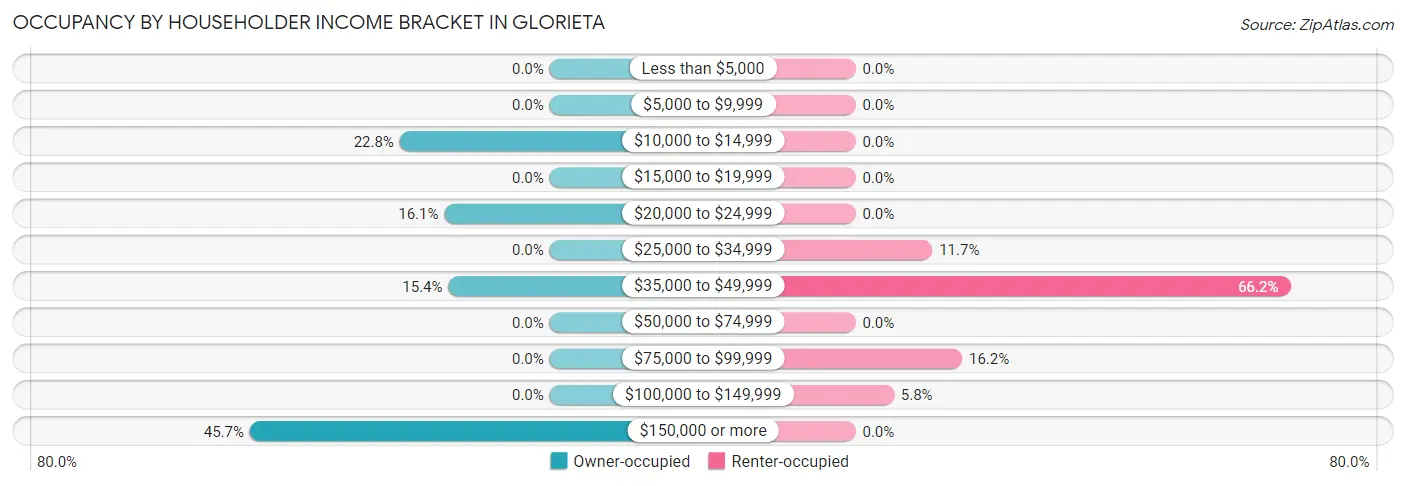
| Income Bracket | Owner-occupied | Renter-occupied |
| Less than $5,000 | 0 (0.0%) | 0 (0.0%) |
| $5,000 to $9,999 | 0 (0.0%) | 0 (0.0%) |
| $10,000 to $14,999 | 37 (22.8%) | 0 (0.0%) |
| $15,000 to $19,999 | 0 (0.0%) | 0 (0.0%) |
| $20,000 to $24,999 | 26 (16.1%) | 0 (0.0%) |
| $25,000 to $34,999 | 0 (0.0%) | 18 (11.7%) |
| $35,000 to $49,999 | 25 (15.4%) | 102 (66.2%) |
| $50,000 to $74,999 | 0 (0.0%) | 0 (0.0%) |
| $75,000 to $99,999 | 0 (0.0%) | 25 (16.2%) |
| $100,000 to $149,999 | 0 (0.0%) | 9 (5.8%) |
| $150,000 or more | 74 (45.7%) | 0 (0.0%) |
| Total | 162 (100.0%) | 154 (100.0%) |
Monthly Housing Cost Tiers in Glorieta
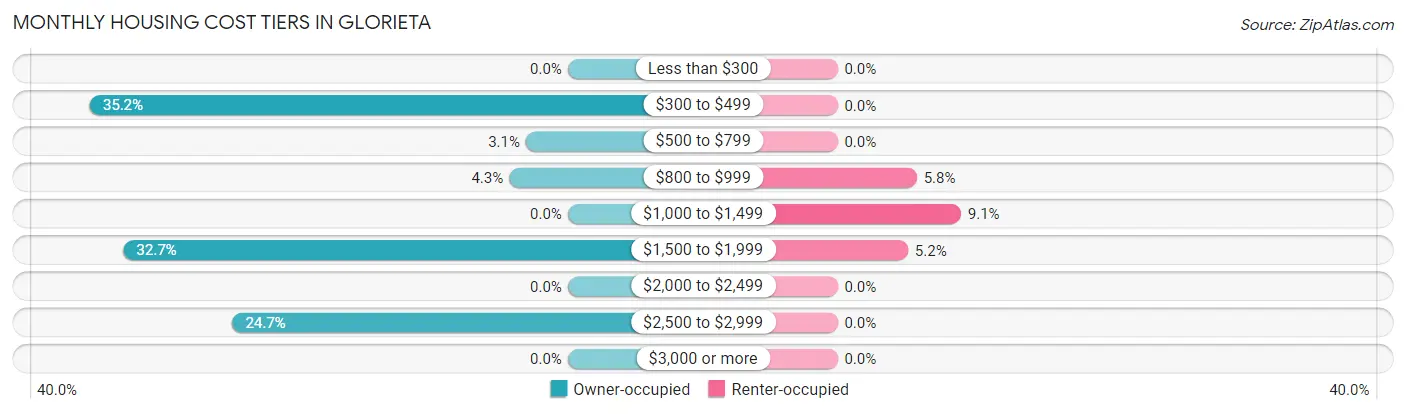
| Monthly Cost | Owner-occupied | Renter-occupied |
| Less than $300 | 0 (0.0%) | 0 (0.0%) |
| $300 to $499 | 57 (35.2%) | 0 (0.0%) |
| $500 to $799 | 5 (3.1%) | 0 (0.0%) |
| $800 to $999 | 7 (4.3%) | 9 (5.8%) |
| $1,000 to $1,499 | 0 (0.0%) | 14 (9.1%) |
| $1,500 to $1,999 | 53 (32.7%) | 8 (5.2%) |
| $2,000 to $2,499 | 0 (0.0%) | 0 (0.0%) |
| $2,500 to $2,999 | 40 (24.7%) | 0 (0.0%) |
| $3,000 or more | 0 (0.0%) | 0 (0.0%) |
| Total | 162 (100.0%) | 154 (100.0%) |
Physical Housing Characteristics in Glorieta
Housing Structures in Glorieta
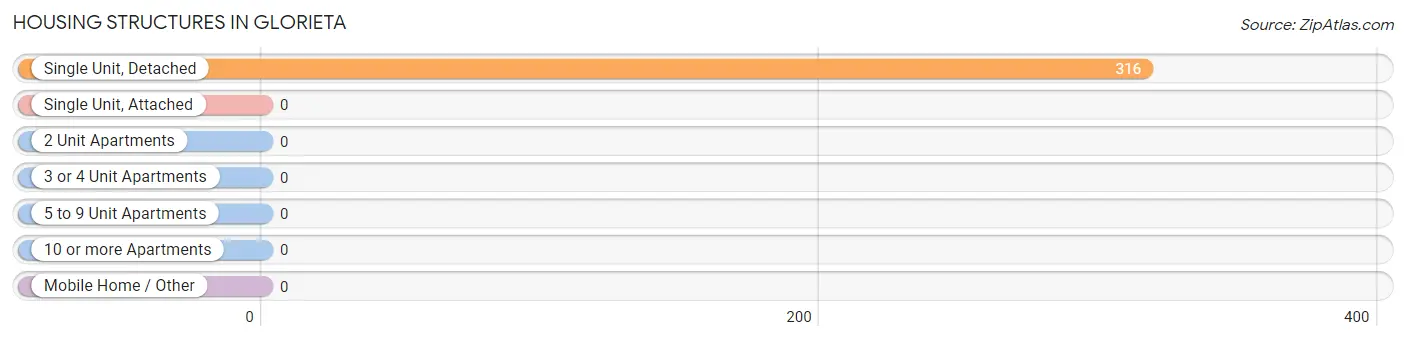
| Structure Type | # Housing Units | % Housing Units |
| Single Unit, Detached | 316 | 100.0% |
| Single Unit, Attached | 0 | 0.0% |
| 2 Unit Apartments | 0 | 0.0% |
| 3 or 4 Unit Apartments | 0 | 0.0% |
| 5 to 9 Unit Apartments | 0 | 0.0% |
| 10 or more Apartments | 0 | 0.0% |
| Mobile Home / Other | 0 | 0.0% |
| Total | 316 | 100.0% |
Housing Structures by Occupancy in Glorieta
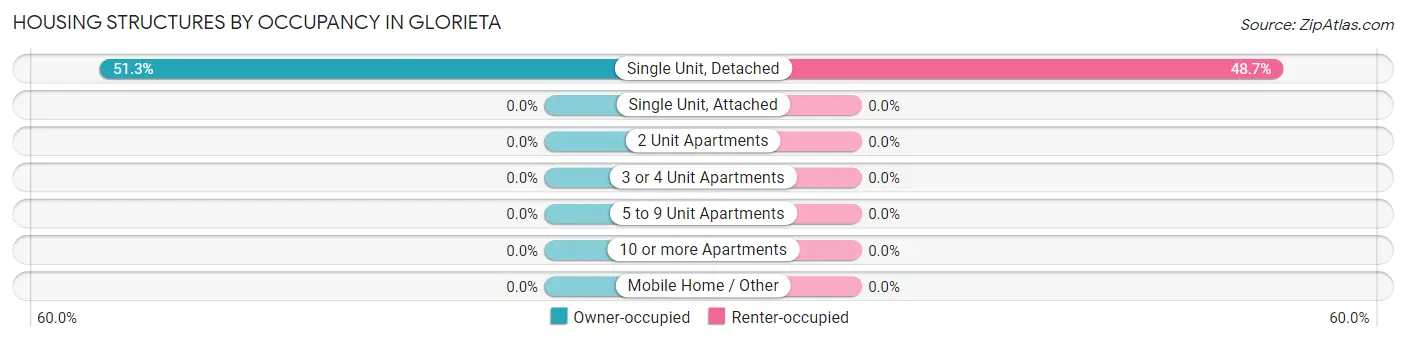
| Structure Type | Owner-occupied | Renter-occupied |
| Single Unit, Detached | 162 (51.3%) | 154 (48.7%) |
| Single Unit, Attached | 0 (0.0%) | 0 (0.0%) |
| 2 Unit Apartments | 0 (0.0%) | 0 (0.0%) |
| 3 or 4 Unit Apartments | 0 (0.0%) | 0 (0.0%) |
| 5 to 9 Unit Apartments | 0 (0.0%) | 0 (0.0%) |
| 10 or more Apartments | 0 (0.0%) | 0 (0.0%) |
| Mobile Home / Other | 0 (0.0%) | 0 (0.0%) |
| Total | 162 (51.3%) | 154 (48.7%) |
Housing Structures by Number of Rooms in Glorieta
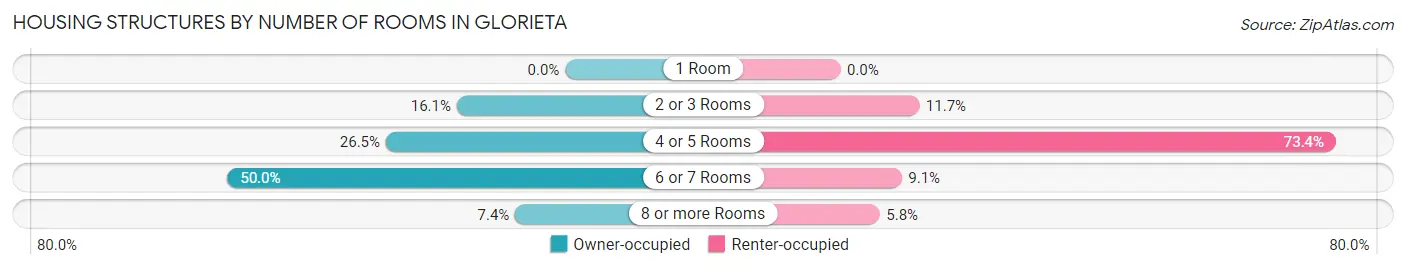
| Number of Rooms | Owner-occupied | Renter-occupied |
| 1 Room | 0 (0.0%) | 0 (0.0%) |
| 2 or 3 Rooms | 26 (16.1%) | 18 (11.7%) |
| 4 or 5 Rooms | 43 (26.5%) | 113 (73.4%) |
| 6 or 7 Rooms | 81 (50.0%) | 14 (9.1%) |
| 8 or more Rooms | 12 (7.4%) | 9 (5.8%) |
| Total | 162 (100.0%) | 154 (100.0%) |
Housing Structure by Heating Type in Glorieta
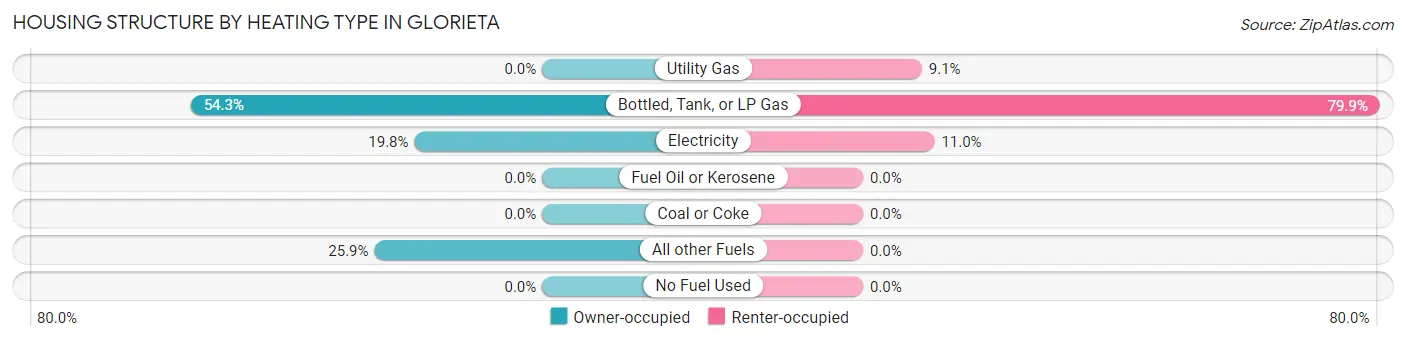
| Heating Type | Owner-occupied | Renter-occupied |
| Utility Gas | 0 (0.0%) | 14 (9.1%) |
| Bottled, Tank, or LP Gas | 88 (54.3%) | 123 (79.9%) |
| Electricity | 32 (19.8%) | 17 (11.0%) |
| Fuel Oil or Kerosene | 0 (0.0%) | 0 (0.0%) |
| Coal or Coke | 0 (0.0%) | 0 (0.0%) |
| All other Fuels | 42 (25.9%) | 0 (0.0%) |
| No Fuel Used | 0 (0.0%) | 0 (0.0%) |
| Total | 162 (100.0%) | 154 (100.0%) |
Household Vehicle Usage in Glorieta
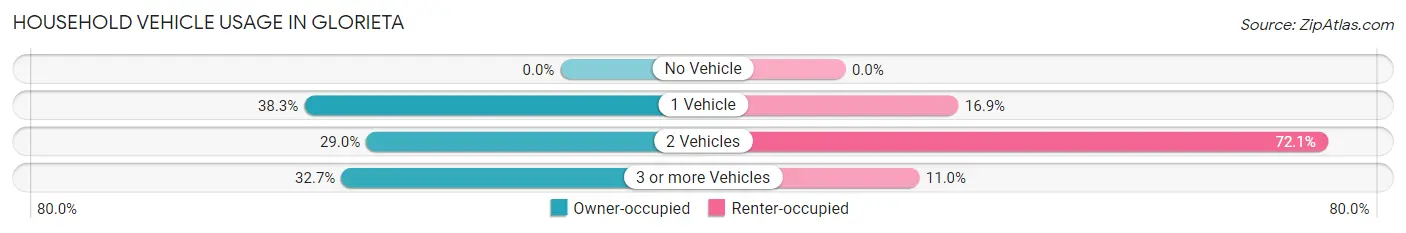
| Vehicles per Household | Owner-occupied | Renter-occupied |
| No Vehicle | 0 (0.0%) | 0 (0.0%) |
| 1 Vehicle | 62 (38.3%) | 26 (16.9%) |
| 2 Vehicles | 47 (29.0%) | 111 (72.1%) |
| 3 or more Vehicles | 53 (32.7%) | 17 (11.0%) |
| Total | 162 (100.0%) | 154 (100.0%) |
Real Estate & Mortgages in Glorieta
Real Estate and Mortgage Overview in Glorieta
| Characteristic | Without Mortgage | With Mortgage |
| Housing Units | 69 | 93 |
| Median Property Value | - | - |
| Median Household Income | - | - |
| Monthly Housing Costs | $410 | $0 |
| Real Estate Taxes | $1,604 | $0 |
Property Value by Mortgage Status in Glorieta
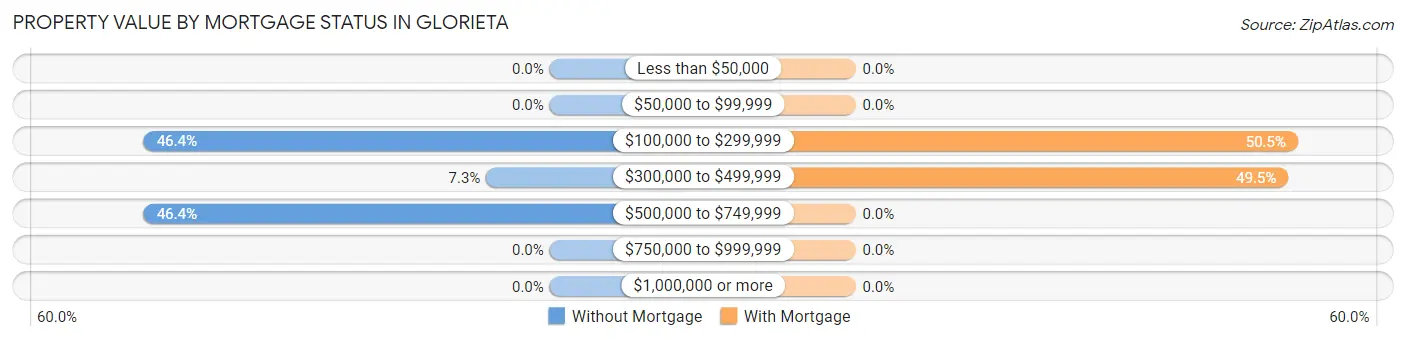
| Property Value | Without Mortgage | With Mortgage |
| Less than $50,000 | 0 (0.0%) | 0 (0.0%) |
| $50,000 to $99,999 | 0 (0.0%) | 0 (0.0%) |
| $100,000 to $299,999 | 32 (46.4%) | 47 (50.5%) |
| $300,000 to $499,999 | 5 (7.2%) | 46 (49.5%) |
| $500,000 to $749,999 | 32 (46.4%) | 0 (0.0%) |
| $750,000 to $999,999 | 0 (0.0%) | 0 (0.0%) |
| $1,000,000 or more | 0 (0.0%) | 0 (0.0%) |
| Total | 69 (100.0%) | 93 (100.0%) |
Household Income by Mortgage Status in Glorieta
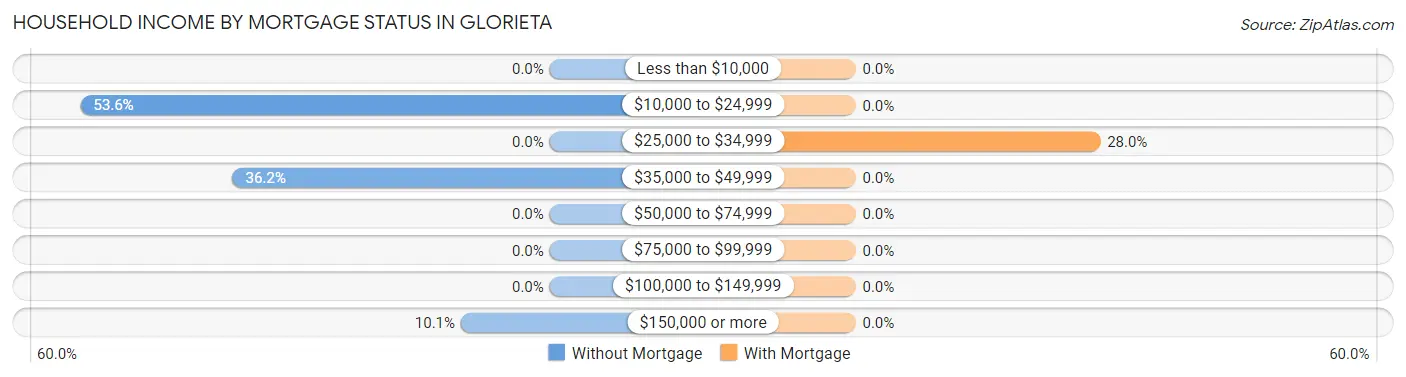
| Household Income | Without Mortgage | With Mortgage |
| Less than $10,000 | 0 (0.0%) | 0 (0.0%) |
| $10,000 to $24,999 | 37 (53.6%) | 0 (0.0%) |
| $25,000 to $34,999 | 0 (0.0%) | 26 (28.0%) |
| $35,000 to $49,999 | 25 (36.2%) | 0 (0.0%) |
| $50,000 to $74,999 | 0 (0.0%) | 0 (0.0%) |
| $75,000 to $99,999 | 0 (0.0%) | 0 (0.0%) |
| $100,000 to $149,999 | 0 (0.0%) | 0 (0.0%) |
| $150,000 or more | 7 (10.1%) | 0 (0.0%) |
| Total | 69 (100.0%) | 93 (100.0%) |
Property Value to Household Income Ratio in Glorieta
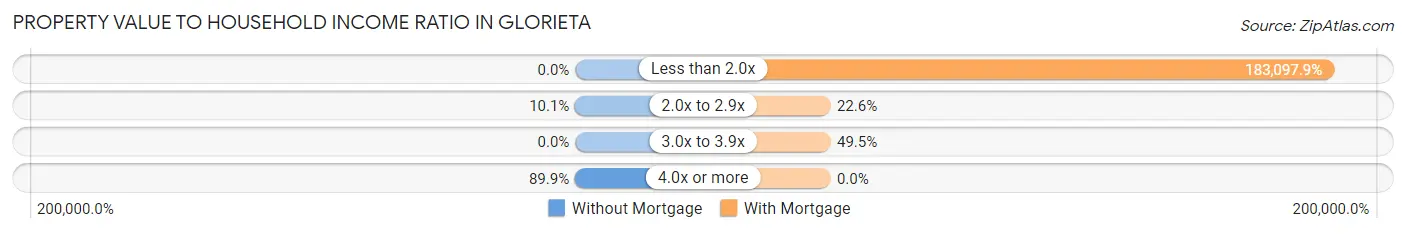
| Value-to-Income Ratio | Without Mortgage | With Mortgage |
| Less than 2.0x | 0 (0.0%) | 170,281 (183,097.8%) |
| 2.0x to 2.9x | 7 (10.1%) | 21 (22.6%) |
| 3.0x to 3.9x | 0 (0.0%) | 46 (49.5%) |
| 4.0x or more | 62 (89.9%) | 0 (0.0%) |
| Total | 69 (100.0%) | 93 (100.0%) |
Real Estate Taxes by Mortgage Status in Glorieta
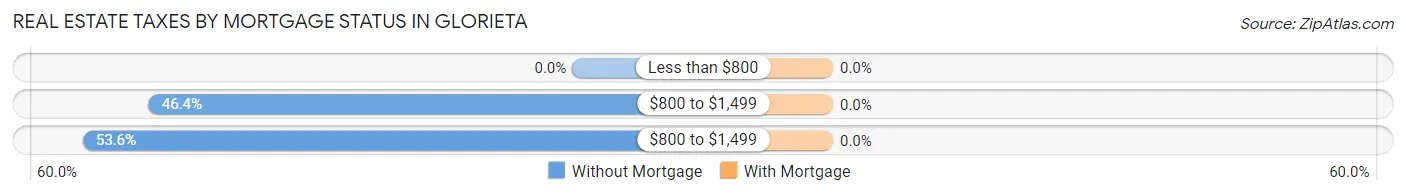
| Property Taxes | Without Mortgage | With Mortgage |
| Less than $800 | 0 (0.0%) | 0 (0.0%) |
| $800 to $1,499 | 32 (46.4%) | 0 (0.0%) |
| $800 to $1,499 | 37 (53.6%) | 0 (0.0%) |
| Total | 69 (100.0%) | 93 (100.0%) |
Health & Disability in Glorieta
Health Insurance Coverage by Age in Glorieta
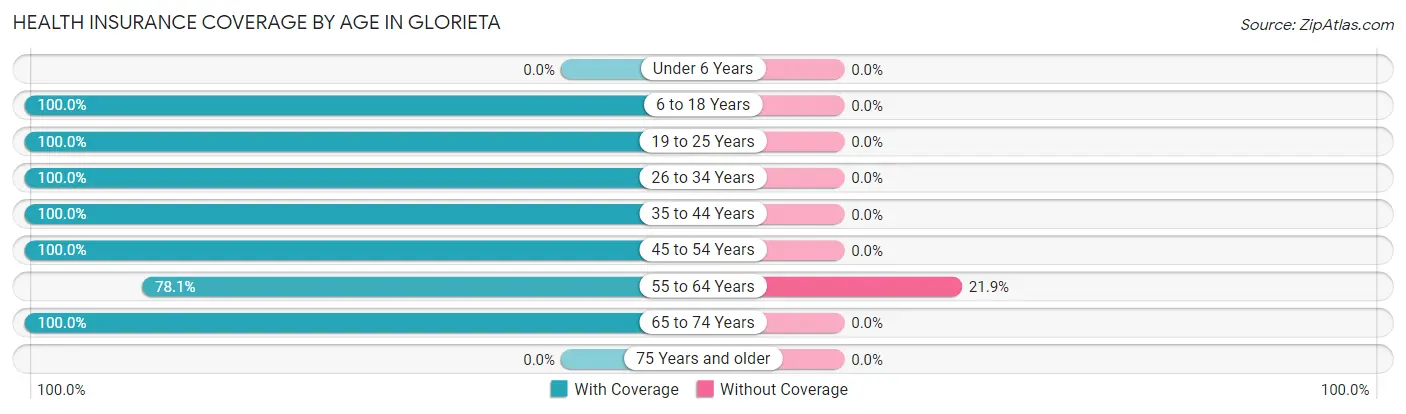
| Age Bracket | With Coverage | Without Coverage |
| Under 6 Years | 0 (0.0%) | 0 (0.0%) |
| 6 to 18 Years | 34 (100.0%) | 0 (0.0%) |
| 19 to 25 Years | 101 (100.0%) | 0 (0.0%) |
| 26 to 34 Years | 97 (100.0%) | 0 (0.0%) |
| 35 to 44 Years | 45 (100.0%) | 0 (0.0%) |
| 45 to 54 Years | 7 (100.0%) | 0 (0.0%) |
| 55 to 64 Years | 89 (78.1%) | 25 (21.9%) |
| 65 to 74 Years | 151 (100.0%) | 0 (0.0%) |
| 75 Years and older | 0 (0.0%) | 0 (0.0%) |
| Total | 524 (95.5%) | 25 (4.5%) |
Health Insurance Coverage by Citizenship Status in Glorieta
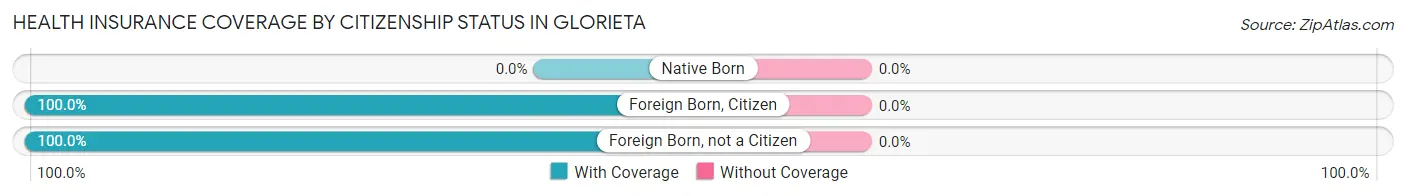
| Citizenship Status | With Coverage | Without Coverage |
| Native Born | 0 (0.0%) | 0 (0.0%) |
| Foreign Born, Citizen | 34 (100.0%) | 0 (0.0%) |
| Foreign Born, not a Citizen | 101 (100.0%) | 0 (0.0%) |
Health Insurance Coverage by Household Income in Glorieta
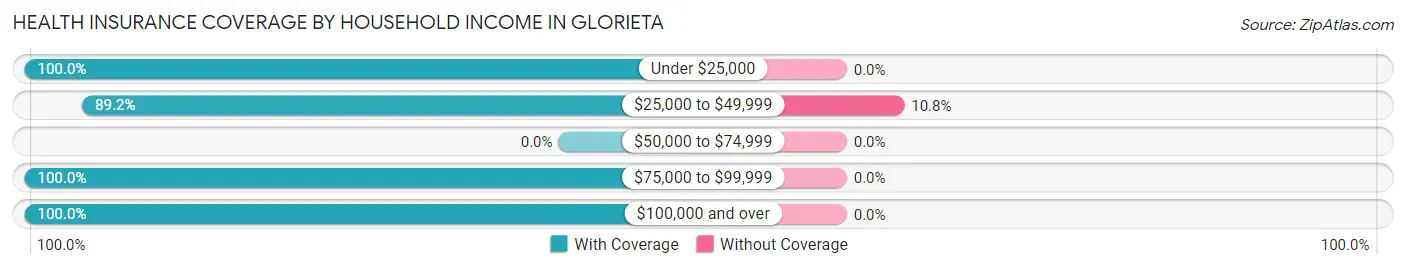
| Household Income | With Coverage | Without Coverage |
| Under $25,000 | 63 (100.0%) | 0 (0.0%) |
| $25,000 to $49,999 | 207 (89.2%) | 25 (10.8%) |
| $50,000 to $74,999 | 0 (0.0%) | 0 (0.0%) |
| $75,000 to $99,999 | 73 (100.0%) | 0 (0.0%) |
| $100,000 and over | 181 (100.0%) | 0 (0.0%) |
Public vs Private Health Insurance Coverage by Age in Glorieta
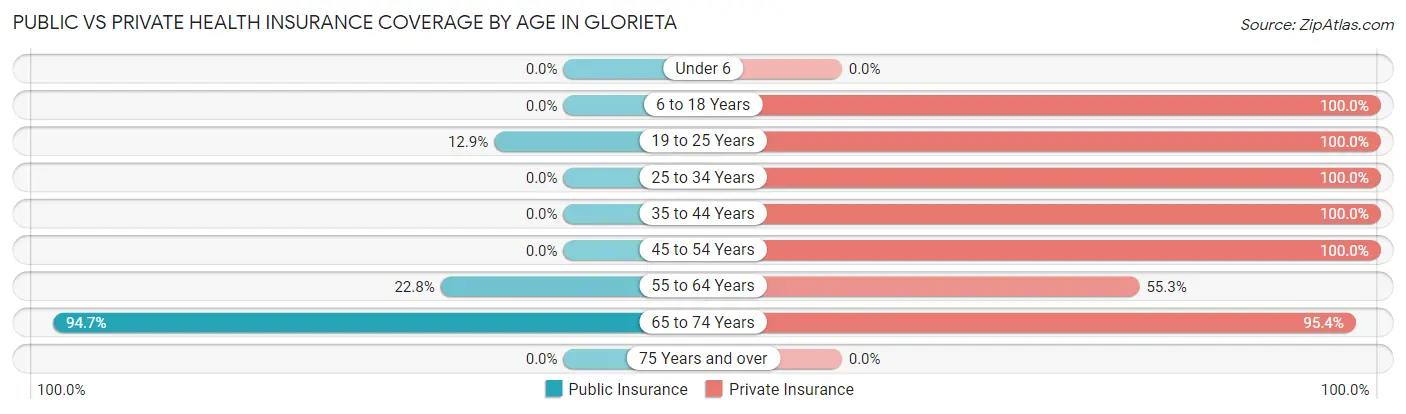
| Age Bracket | Public Insurance | Private Insurance |
| Under 6 | 0 (0.0%) | 0 (0.0%) |
| 6 to 18 Years | 0 (0.0%) | 34 (100.0%) |
| 19 to 25 Years | 13 (12.9%) | 101 (100.0%) |
| 25 to 34 Years | 0 (0.0%) | 97 (100.0%) |
| 35 to 44 Years | 0 (0.0%) | 45 (100.0%) |
| 45 to 54 Years | 0 (0.0%) | 7 (100.0%) |
| 55 to 64 Years | 26 (22.8%) | 63 (55.3%) |
| 65 to 74 Years | 143 (94.7%) | 144 (95.4%) |
| 75 Years and over | 0 (0.0%) | 0 (0.0%) |
| Total | 182 (33.2%) | 491 (89.4%) |
Disability Status by Sex by Age in Glorieta

| Age Bracket | Male | Female |
| Under 5 Years | 0 (0.0%) | 0 (0.0%) |
| 5 to 17 Years | 0 (0.0%) | 0 (0.0%) |
| 18 to 34 Years | 0 (0.0%) | 0 (0.0%) |
| 35 to 64 Years | 0 (0.0%) | 0 (0.0%) |
| 65 to 74 Years | 40 (85.1%) | 52 (50.0%) |
| 75 Years and over | 0 (0.0%) | 0 (0.0%) |
Disability Class by Sex by Age in Glorieta
Disability Class: Hearing Difficulty
| Age Bracket | Male | Female |
| Under 5 Years | 0 (0.0%) | 0 (0.0%) |
| 5 to 17 Years | 0 (0.0%) | 0 (0.0%) |
| 18 to 34 Years | 0 (0.0%) | 0 (0.0%) |
| 35 to 64 Years | 0 (0.0%) | 0 (0.0%) |
| 65 to 74 Years | 0 (0.0%) | 0 (0.0%) |
| 75 Years and over | 0 (0.0%) | 0 (0.0%) |
Disability Class: Vision Difficulty
| Age Bracket | Male | Female |
| Under 5 Years | 0 (0.0%) | 0 (0.0%) |
| 5 to 17 Years | 0 (0.0%) | 0 (0.0%) |
| 18 to 34 Years | 0 (0.0%) | 0 (0.0%) |
| 35 to 64 Years | 0 (0.0%) | 0 (0.0%) |
| 65 to 74 Years | 0 (0.0%) | 0 (0.0%) |
| 75 Years and over | 0 (0.0%) | 0 (0.0%) |
Disability Class: Cognitive Difficulty
| Age Bracket | Male | Female |
| 5 to 17 Years | 0 (0.0%) | 0 (0.0%) |
| 18 to 34 Years | 0 (0.0%) | 0 (0.0%) |
| 35 to 64 Years | 0 (0.0%) | 0 (0.0%) |
| 65 to 74 Years | 0 (0.0%) | 52 (50.0%) |
| 75 Years and over | 0 (0.0%) | 0 (0.0%) |
Disability Class: Ambulatory Difficulty
| Age Bracket | Male | Female |
| 5 to 17 Years | 0 (0.0%) | 0 (0.0%) |
| 18 to 34 Years | 0 (0.0%) | 0 (0.0%) |
| 35 to 64 Years | 0 (0.0%) | 0 (0.0%) |
| 65 to 74 Years | 40 (85.1%) | 0 (0.0%) |
| 75 Years and over | 0 (0.0%) | 0 (0.0%) |
Disability Class: Self-Care Difficulty
| Age Bracket | Male | Female |
| 5 to 17 Years | 0 (0.0%) | 0 (0.0%) |
| 18 to 34 Years | 0 (0.0%) | 0 (0.0%) |
| 35 to 64 Years | 0 (0.0%) | 0 (0.0%) |
| 65 to 74 Years | 0 (0.0%) | 0 (0.0%) |
| 75 Years and over | 0 (0.0%) | 0 (0.0%) |
Technology Access in Glorieta
Computing Device Access in Glorieta
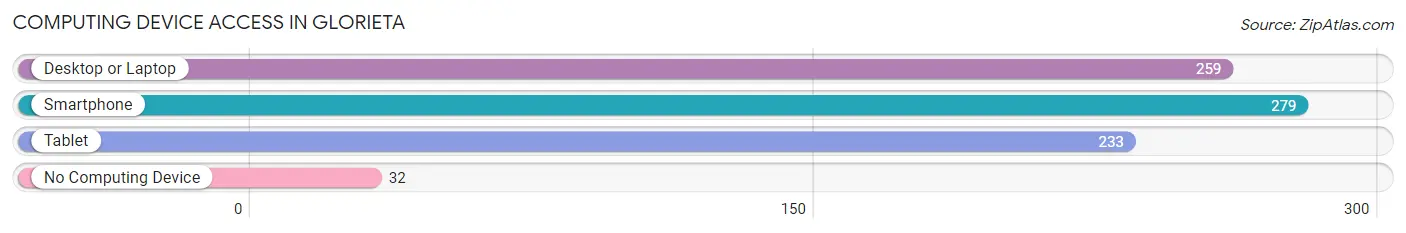
| Device Type | # Households | % Households |
| Desktop or Laptop | 259 | 82.0% |
| Smartphone | 279 | 88.3% |
| Tablet | 233 | 73.7% |
| No Computing Device | 32 | 10.1% |
| Total | 316 | 100.0% |
Internet Access in Glorieta
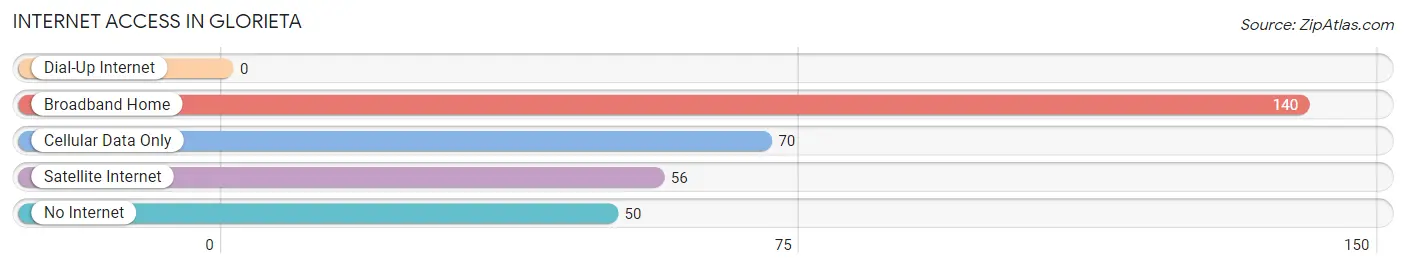
| Internet Type | # Households | % Households |
| Dial-Up Internet | 0 | 0.0% |
| Broadband Home | 140 | 44.3% |
| Cellular Data Only | 70 | 22.2% |
| Satellite Internet | 56 | 17.7% |
| No Internet | 50 | 15.8% |
| Total | 316 | 100.0% |
Glorieta Summary
Glorieta, New Mexico is a small unincorporated community located in Santa Fe County, New Mexico. It is situated in the foothills of the Sangre de Cristo Mountains, approximately 25 miles south of Santa Fe. The area is known for its rich history, diverse geography, and vibrant economy.
History
Glorieta has a long and storied history. The area was first inhabited by the Pueblo Indians, who lived in the area for centuries before the arrival of the Spanish in the 16th century. The Spanish established a mission in the area in 1610, and the area was later used as a stopover point for travelers on the Santa Fe Trail. During the Civil War, the Battle of Glorieta Pass was fought in the area, and the Union forces were victorious.
In the late 19th century, the area was settled by ranchers and farmers, and the town of Glorieta was established in 1881. The town was named after the nearby Glorieta Pass, which was named after a nearby mountain peak. The town grew steadily throughout the 20th century, and today it is home to a population of approximately 500 people.
Geography
Glorieta is located in the foothills of the Sangre de Cristo Mountains, approximately 25 miles south of Santa Fe. The area is characterized by rolling hills, lush vegetation, and stunning views of the surrounding mountains. The area is also home to a variety of wildlife, including deer, elk, and mountain lions.
The climate in Glorieta is semi-arid, with hot summers and mild winters. The average annual temperature is approximately 60 degrees Fahrenheit, and the average annual precipitation is approximately 12 inches.
Economy
Glorieta’s economy is largely based on tourism and agriculture. The area is home to several popular tourist attractions, including the Glorieta Pass National Historic Site, the Glorieta Battlefield, and the Glorieta Ski Resort. The area is also home to several wineries, and the nearby Santa Fe National Forest provides opportunities for camping, hiking, and other outdoor activities.
Agriculture is also an important part of the local economy. The area is home to several farms, which produce a variety of crops, including apples, peaches, and hay.
Demographics
As of the 2010 census, the population of Glorieta was 498. The racial makeup of the town was 94.2% White, 0.2% African American, 0.4% Native American, 0.2% Asian, 0.2% Pacific Islander, and 4.0% from other races. The median household income was $45,000, and the median age was 44.
Glorieta is a small, rural community with a rich history, diverse geography, and vibrant economy. The area is home to a variety of attractions, and the local economy is largely based on tourism and agriculture. The population is diverse, and the median household income is relatively high. Glorieta is a great place to live, work, and play.
Common Questions
What is Per Capita Income in Glorieta?
Per Capita income in Glorieta is $46,878.
What is the Median Household income in Glorieta?
Median Household Income in Glorieta is $46,394.
What is Income or Wage Gap in Glorieta?
Income or Wage Gap in Glorieta is 35.2%.
Women in Glorieta earn 64.8 cents for every dollar earned by a man.
What is Inequality or Gini Index in Glorieta?
Inequality or Gini Index in Glorieta is 0.44.
What is the Total Population of Glorieta?
Total Population of Glorieta is 549.
What is the Total Male Population of Glorieta?
Total Male Population of Glorieta is 266.
What is the Total Female Population of Glorieta?
Total Female Population of Glorieta is 283.
What is the Ratio of Males per 100 Females in Glorieta?
There are 93.99 Males per 100 Females in Glorieta.
What is the Ratio of Females per 100 Males in Glorieta?
There are 106.39 Females per 100 Males in Glorieta.
What is the Median Population Age in Glorieta?
Median Population Age in Glorieta is 39.7 Years.
What is the Average Family Size in Glorieta
Average Family Size in Glorieta is 2.2 People.
What is the Average Household Size in Glorieta
Average Household Size in Glorieta is 1.7 People.
How Large is the Labor Force in Glorieta?
There are 386 People in the Labor Forcein in Glorieta.
What is the Percentage of People in the Labor Force in Glorieta?
75.0% of People are in the Labor Force in Glorieta.
What is the Unemployment Rate in Glorieta?
Unemployment Rate in Glorieta is 34.7%.