Flora Vista, NM Map & Demographics
Flora Vista Map
Flora Vista Overview
$26,227
PER CAPITA INCOME
$42,030
AVG FAMILY INCOME
$41,525
AVG HOUSEHOLD INCOME
60.9%
WAGE / INCOME GAP [ % ]
39.1¢/ $1
WAGE / INCOME GAP [ $ ]
0.45
INEQUALITY / GINI INDEX
2,346
TOTAL POPULATION
1,212
MALE POPULATION
1,134
FEMALE POPULATION
106.88
MALES / 100 FEMALES
93.56
FEMALES / 100 MALES
53.1
MEDIAN AGE
2.7
AVG FAMILY SIZE
2.5
AVG HOUSEHOLD SIZE
935
LABOR FORCE [ PEOPLE ]
46.6%
PERCENT IN LABOR FORCE
Flora Vista Zip Codes
Flora Vista Area Codes
Income in Flora Vista
Income Overview in Flora Vista
Per Capita Income in Flora Vista is $26,227, while median incomes of families and households are $42,030 and $41,525 respectively.
| Characteristic | Number | Measure |
| Per Capita Income | 2,346 | $26,227 |
| Median Family Income | 662 | $42,030 |
| Mean Family Income | 662 | $65,995 |
| Median Household Income | 958 | $41,525 |
| Mean Household Income | 958 | $63,044 |
| Income Deficit | 662 | $0 |
| Wage / Income Gap (%) | 2,346 | 60.86% |
| Wage / Income Gap ($) | 2,346 | 39.14¢ per $1 |
| Gini / Inequality Index | 2,346 | 0.45 |
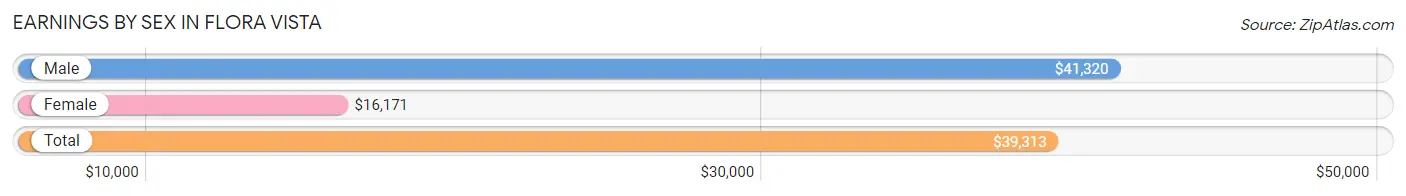
Earnings by Sex in Flora Vista
Average Earnings in Flora Vista are $39,313, $41,320 for men and $16,171 for women, a difference of 60.9%.
| Sex | Number | Average Earnings |
| Male | 568 (57.6%) | $41,320 |
| Female | 419 (42.4%) | $16,171 |
| Total | 987 (100.0%) | $39,313 |
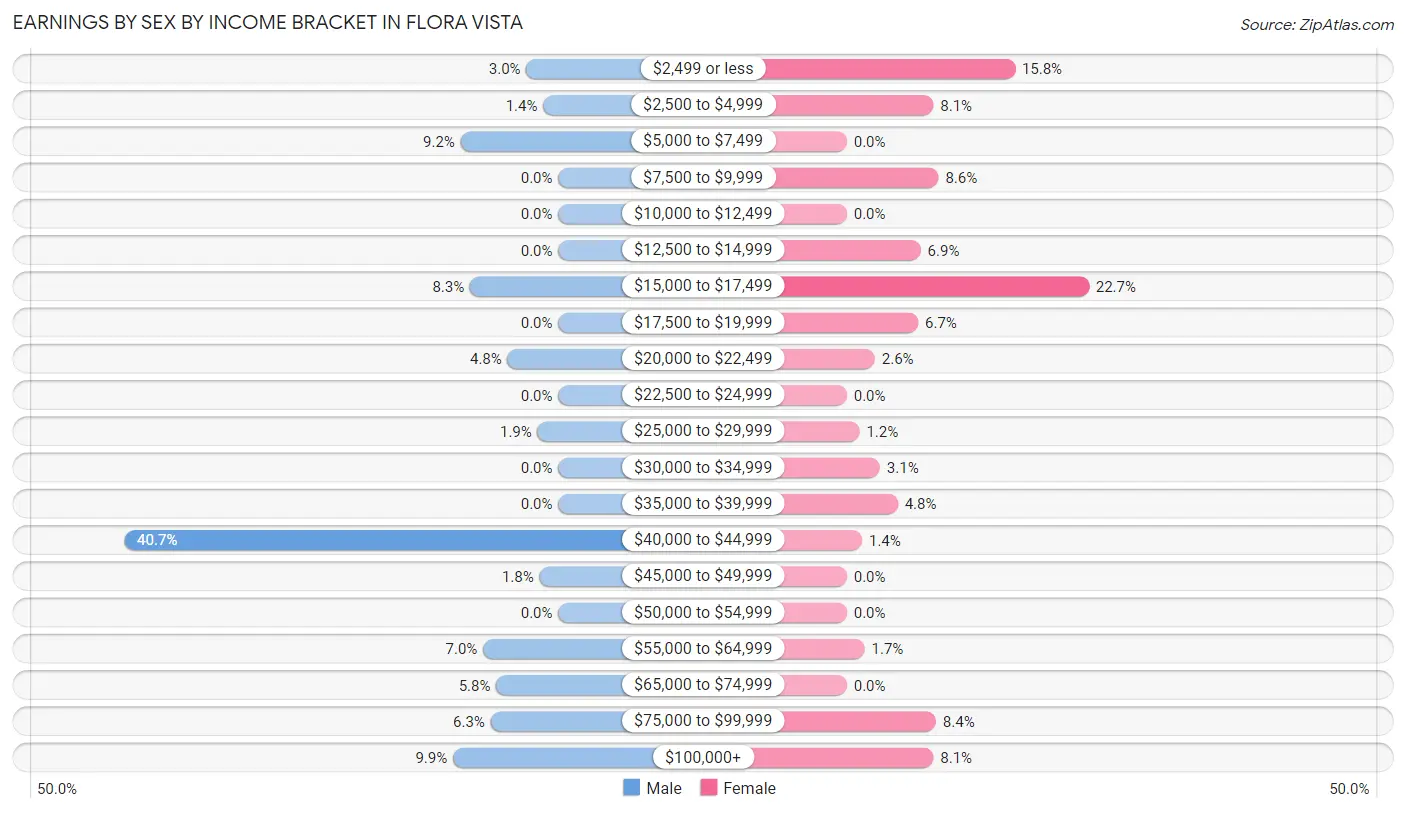
Earnings by Sex by Income Bracket in Flora Vista
The most common earnings brackets in Flora Vista are $40,000 to $44,999 for men (231 | 40.7%) and $15,000 to $17,499 for women (95 | 22.7%).
| Income | Male | Female |
| $2,499 or less | 17 (3.0%) | 66 (15.8%) |
| $2,500 to $4,999 | 8 (1.4%) | 34 (8.1%) |
| $5,000 to $7,499 | 52 (9.1%) | 0 (0.0%) |
| $7,500 to $9,999 | 0 (0.0%) | 36 (8.6%) |
| $10,000 to $12,499 | 0 (0.0%) | 0 (0.0%) |
| $12,500 to $14,999 | 0 (0.0%) | 29 (6.9%) |
| $15,000 to $17,499 | 47 (8.3%) | 95 (22.7%) |
| $17,500 to $19,999 | 0 (0.0%) | 28 (6.7%) |
| $20,000 to $22,499 | 27 (4.8%) | 11 (2.6%) |
| $22,500 to $24,999 | 0 (0.0%) | 0 (0.0%) |
| $25,000 to $29,999 | 11 (1.9%) | 5 (1.2%) |
| $30,000 to $34,999 | 0 (0.0%) | 13 (3.1%) |
| $35,000 to $39,999 | 0 (0.0%) | 20 (4.8%) |
| $40,000 to $44,999 | 231 (40.7%) | 6 (1.4%) |
| $45,000 to $49,999 | 10 (1.8%) | 0 (0.0%) |
| $50,000 to $54,999 | 0 (0.0%) | 0 (0.0%) |
| $55,000 to $64,999 | 40 (7.0%) | 7 (1.7%) |
| $65,000 to $74,999 | 33 (5.8%) | 0 (0.0%) |
| $75,000 to $99,999 | 36 (6.3%) | 35 (8.4%) |
| $100,000+ | 56 (9.9%) | 34 (8.1%) |
| Total | 568 (100.0%) | 419 (100.0%) |
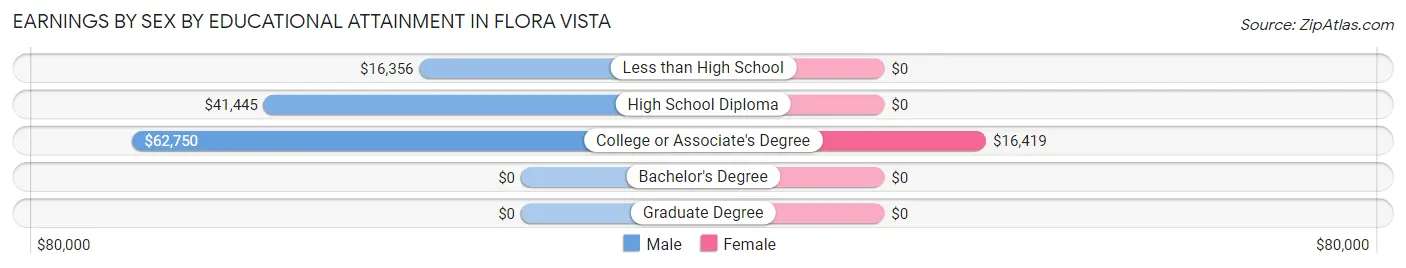
Earnings by Sex by Educational Attainment in Flora Vista
Average earnings in Flora Vista are $41,504 for men and $16,303 for women, a difference of 60.7%. Men with an educational attainment of college or associate's degree enjoy the highest average annual earnings of $62,750, while those with less than high school education earn the least with $16,356. Women with an educational attainment of college or associate's degree earn the most with the average annual earnings of $16,419, while those with college or associate's degree education have the smallest earnings of $16,419.
| Educational Attainment | Male Income | Female Income |
| Less than High School | $16,356 | $0 |
| High School Diploma | $41,445 | $0 |
| College or Associate's Degree | $62,750 | $16,419 |
| Bachelor's Degree | - | - |
| Graduate Degree | - | - |
| Total | $41,504 | $16,303 |
Family Income in Flora Vista
Family Income Brackets in Flora Vista
According to the Flora Vista family income data, there are 316 families falling into the $35,000 to $49,999 income range, which is the most common income bracket and makes up 47.7% of all families. Conversely, the $15,000 to $24,999 income bracket is the least frequent group with only 8 families (1.2%) belonging to this category.
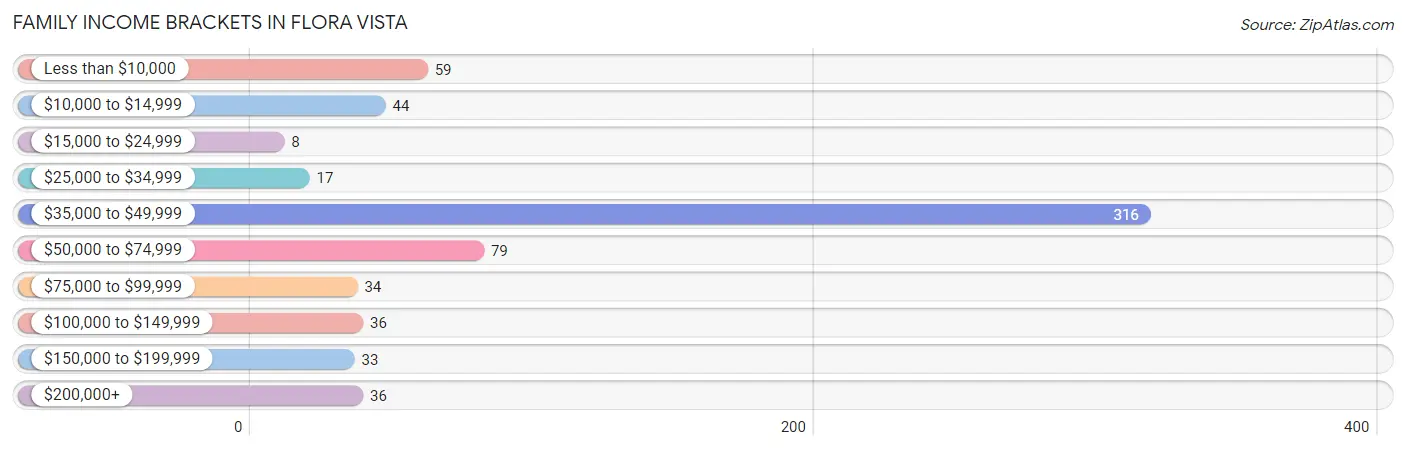
| Income Bracket | # Families | % Families |
| Less than $10,000 | 59 | 8.9% |
| $10,000 to $14,999 | 44 | 6.6% |
| $15,000 to $24,999 | 8 | 1.2% |
| $25,000 to $34,999 | 17 | 2.6% |
| $35,000 to $49,999 | 316 | 47.7% |
| $50,000 to $74,999 | 79 | 11.9% |
| $75,000 to $99,999 | 34 | 5.1% |
| $100,000 to $149,999 | 36 | 5.4% |
| $150,000 to $199,999 | 33 | 5.0% |
| $200,000+ | 36 | 5.4% |
Family Income by Famaliy Size in Flora Vista
2-person families (433 | 65.4%) account for the highest median family income in Flora Vista with $41,393 per family, while 2-person families (433 | 65.4%) have the highest median income of $20,696 per family member.
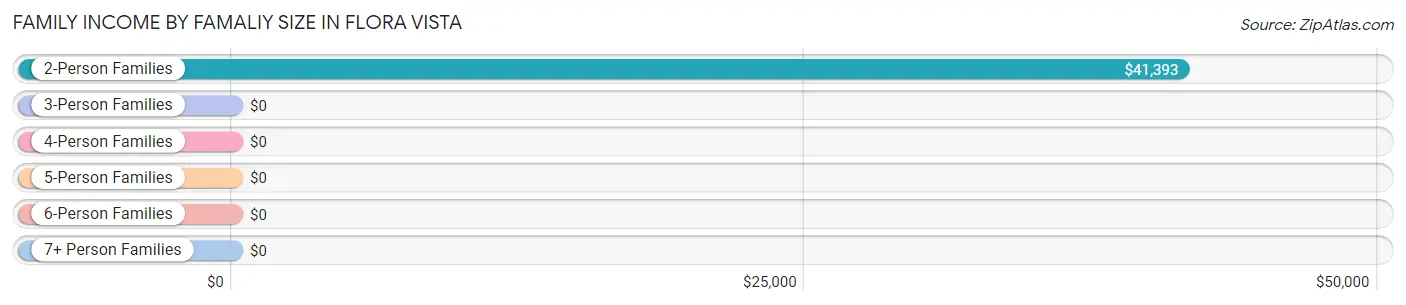
| Income Bracket | # Families | Median Income |
| 2-Person Families | 433 (65.4%) | $41,393 |
| 3-Person Families | 122 (18.4%) | $0 |
| 4-Person Families | 46 (7.0%) | $0 |
| 5-Person Families | 0 (0.0%) | $0 |
| 6-Person Families | 61 (9.2%) | $0 |
| 7+ Person Families | 0 (0.0%) | $0 |
| Total | 662 (100.0%) | $42,030 |
Family Income by Number of Earners in Flora Vista
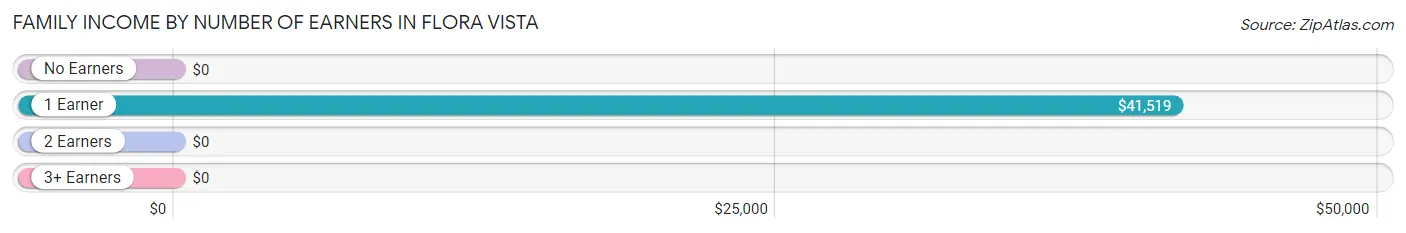
| Number of Earners | # Families | Median Income |
| No Earners | 170 (25.7%) | $0 |
| 1 Earner | 303 (45.8%) | $41,519 |
| 2 Earners | 169 (25.5%) | $0 |
| 3+ Earners | 20 (3.0%) | $0 |
| Total | 662 (100.0%) | $42,030 |
Household Income in Flora Vista
Household Income Brackets in Flora Vista
With 332 households falling in the category, the $35,000 to $49,999 income range is the most frequent in Flora Vista, accounting for 34.7% of all households. In contrast, only 35 households (3.6%) fall into the $10,000 to $14,999 income bracket, making it the least populous group.
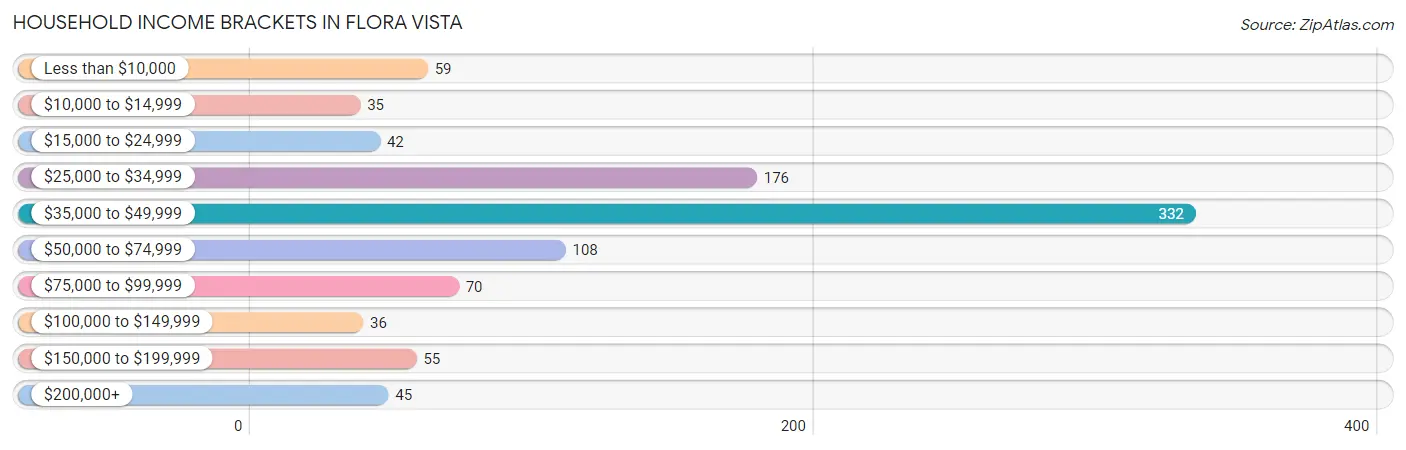
| Income Bracket | # Households | % Households |
| Less than $10,000 | 59 | 6.2% |
| $10,000 to $14,999 | 35 | 3.7% |
| $15,000 to $24,999 | 42 | 4.4% |
| $25,000 to $34,999 | 176 | 18.4% |
| $35,000 to $49,999 | 332 | 34.7% |
| $50,000 to $74,999 | 108 | 11.3% |
| $75,000 to $99,999 | 70 | 7.3% |
| $100,000 to $149,999 | 36 | 3.8% |
| $150,000 to $199,999 | 55 | 5.7% |
| $200,000+ | 45 | 4.7% |
Household Income by Householder Age in Flora Vista
The median household income in Flora Vista is $41,525, with the highest median household income of $67,117 found in the 25 to 44 years age bracket for the primary householder. A total of 201 households (21.0%) fall into this category.
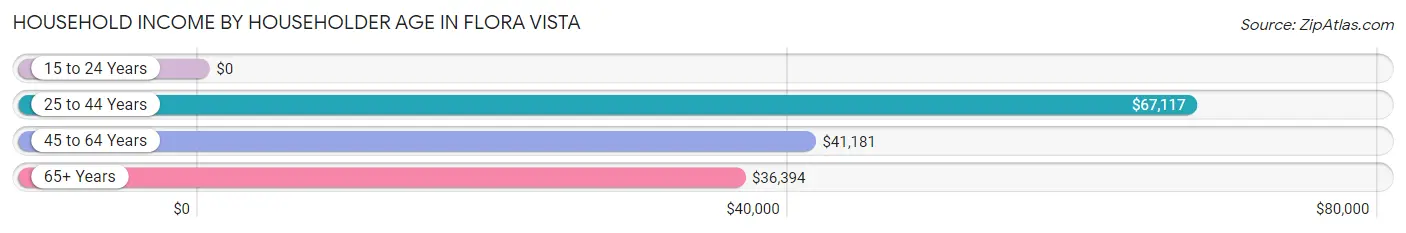
| Income Bracket | # Households | Median Income |
| 15 to 24 Years | 0 (0.0%) | $0 |
| 25 to 44 Years | 201 (21.0%) | $67,117 |
| 45 to 64 Years | 562 (58.7%) | $41,181 |
| 65+ Years | 195 (20.3%) | $36,394 |
| Total | 958 (100.0%) | $41,525 |
Poverty in Flora Vista
Income Below Poverty by Sex and Age in Flora Vista
With 30.1% poverty level for males and 17.9% for females among the residents of Flora Vista, under 5 year old males and 16 and 17 year old females are the most vulnerable to poverty, with 29 males (100.0%) and 22 females (100.0%) in their respective age groups living below the poverty level.
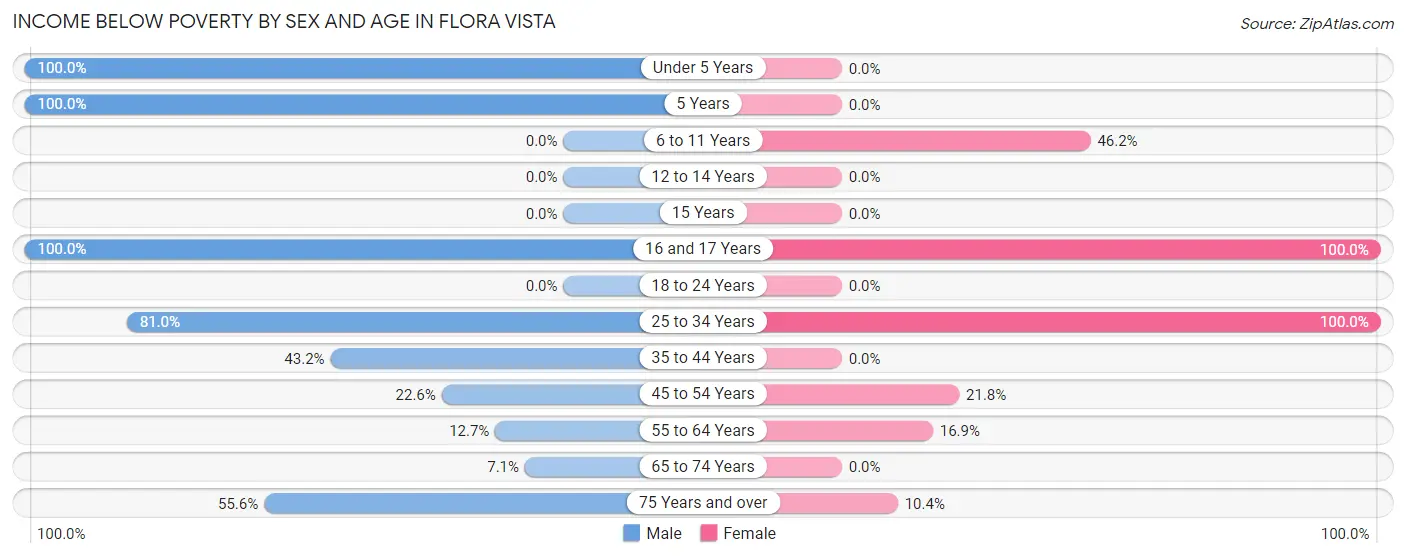
| Age Bracket | Male | Female |
| Under 5 Years | 29 (100.0%) | 0 (0.0%) |
| 5 Years | 41 (100.0%) | 0 (0.0%) |
| 6 to 11 Years | 0 (0.0%) | 42 (46.2%) |
| 12 to 14 Years | 0 (0.0%) | 0 (0.0%) |
| 15 Years | 0 (0.0%) | 0 (0.0%) |
| 16 and 17 Years | 8 (100.0%) | 22 (100.0%) |
| 18 to 24 Years | 0 (0.0%) | 0 (0.0%) |
| 25 to 34 Years | 47 (81.0%) | 12 (100.0%) |
| 35 to 44 Years | 112 (43.2%) | 0 (0.0%) |
| 45 to 54 Years | 33 (22.6%) | 54 (21.8%) |
| 55 to 64 Years | 42 (12.7%) | 62 (16.9%) |
| 65 to 74 Years | 8 (7.1%) | 0 (0.0%) |
| 75 Years and over | 45 (55.6%) | 11 (10.4%) |
| Total | 365 (30.1%) | 203 (17.9%) |
Income Above Poverty by Sex and Age in Flora Vista
According to the poverty statistics in Flora Vista, males aged 6 to 11 years and females aged under 5 years are the age groups that are most secure financially, with 100.0% of males and 100.0% of females in these age groups living above the poverty line.
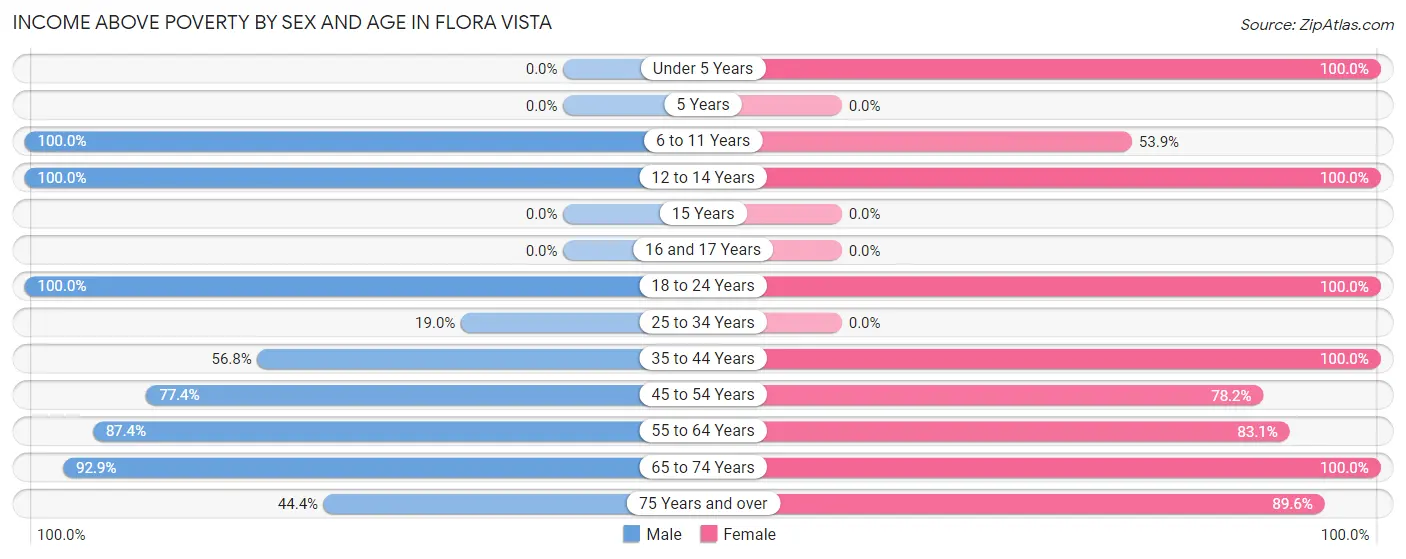
| Age Bracket | Male | Female |
| Under 5 Years | 0 (0.0%) | 39 (100.0%) |
| 5 Years | 0 (0.0%) | 0 (0.0%) |
| 6 to 11 Years | 39 (100.0%) | 49 (53.8%) |
| 12 to 14 Years | 73 (100.0%) | 28 (100.0%) |
| 15 Years | 0 (0.0%) | 0 (0.0%) |
| 16 and 17 Years | 0 (0.0%) | 0 (0.0%) |
| 18 to 24 Years | 34 (100.0%) | 35 (100.0%) |
| 25 to 34 Years | 11 (19.0%) | 0 (0.0%) |
| 35 to 44 Years | 147 (56.8%) | 107 (100.0%) |
| 45 to 54 Years | 113 (77.4%) | 194 (78.2%) |
| 55 to 64 Years | 290 (87.4%) | 305 (83.1%) |
| 65 to 74 Years | 104 (92.9%) | 79 (100.0%) |
| 75 Years and over | 36 (44.4%) | 95 (89.6%) |
| Total | 847 (69.9%) | 931 (82.1%) |
Income Below Poverty Among Married-Couple Families in Flora Vista
The poverty statistics for married-couple families in Flora Vista show that 4.3% or 23 of the total 537 families live below the poverty line. Families with 3 or 4 children have the highest poverty rate of 19.7%, comprising of 12 families. On the other hand, families with 1 or 2 children have the lowest poverty rate of 0.0%, which includes 0 families.
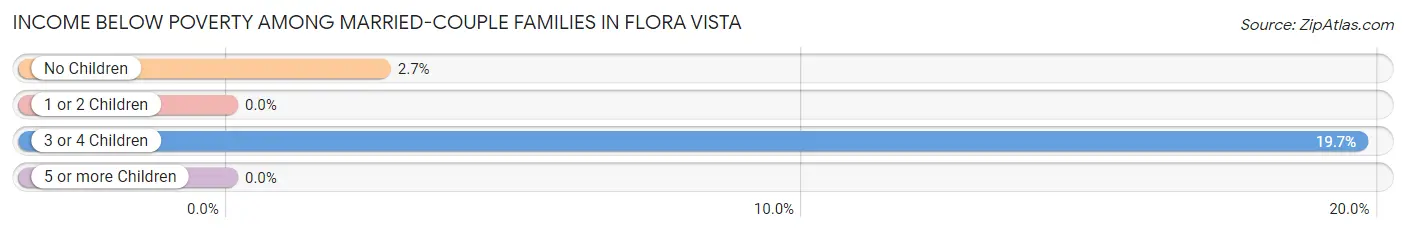
| Children | Above Poverty | Below Poverty |
| No Children | 402 (97.3%) | 11 (2.7%) |
| 1 or 2 Children | 63 (100.0%) | 0 (0.0%) |
| 3 or 4 Children | 49 (80.3%) | 12 (19.7%) |
| 5 or more Children | 0 (0.0%) | 0 (0.0%) |
| Total | 514 (95.7%) | 23 (4.3%) |
Income Below Poverty Among Single-Parent Households in Flora Vista
According to the poverty data in Flora Vista, 87.9% or 80 single-father households and 23.5% or 8 single-mother households are living below the poverty line. Among single-father households, those with 1 or 2 children have the highest poverty rate, with 47 households (100.0%) experiencing poverty. Likewise, among single-mother households, those with 1 or 2 children have the highest poverty rate, with 8 households (100.0%) falling below the poverty line.
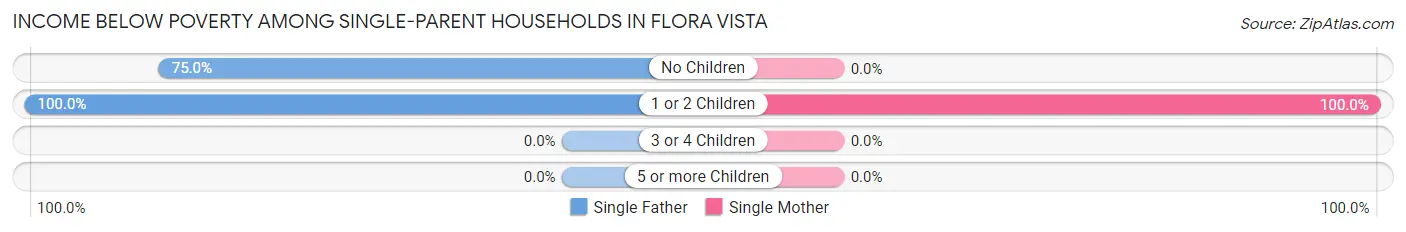
| Children | Single Father | Single Mother |
| No Children | 33 (75.0%) | 0 (0.0%) |
| 1 or 2 Children | 47 (100.0%) | 8 (100.0%) |
| 3 or 4 Children | 0 (0.0%) | 0 (0.0%) |
| 5 or more Children | 0 (0.0%) | 0 (0.0%) |
| Total | 80 (87.9%) | 8 (23.5%) |
Income Below Poverty Among Married-Couple vs Single-Parent Households in Flora Vista
The poverty data for Flora Vista shows that 23 of the married-couple family households (4.3%) and 88 of the single-parent households (70.4%) are living below the poverty level. Within the married-couple family households, those with 3 or 4 children have the highest poverty rate, with 12 households (19.7%) falling below the poverty line. Among the single-parent households, those with 1 or 2 children have the highest poverty rate, with 55 household (100.0%) living below poverty.
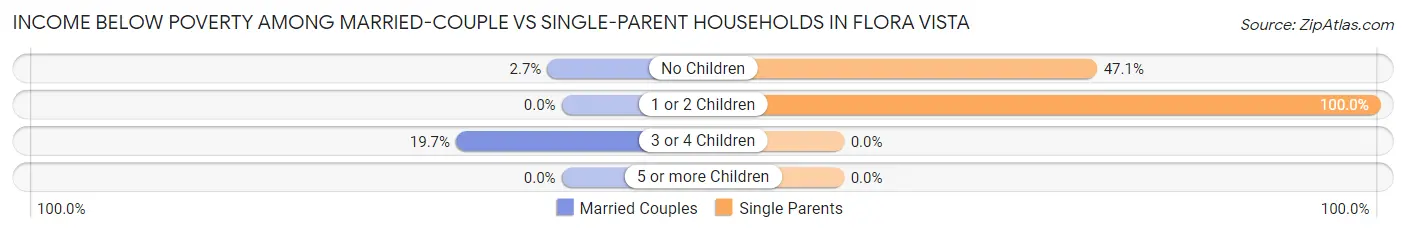
| Children | Married-Couple Families | Single-Parent Households |
| No Children | 11 (2.7%) | 33 (47.1%) |
| 1 or 2 Children | 0 (0.0%) | 55 (100.0%) |
| 3 or 4 Children | 12 (19.7%) | 0 (0.0%) |
| 5 or more Children | 0 (0.0%) | 0 (0.0%) |
| Total | 23 (4.3%) | 88 (70.4%) |
Race in Flora Vista
The most populous races in Flora Vista are White / Caucasian (2,016 | 85.9%), Hispanic or Latino (375 | 16.0%), and Native / Alaskan (187 | 8.0%).
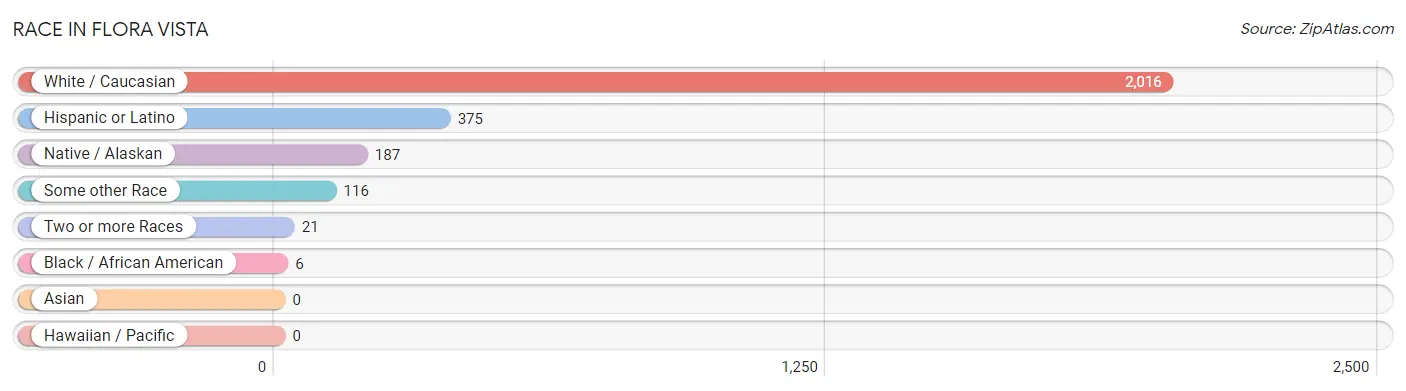
| Race | # Population | % Population |
| Asian | 0 | 0.0% |
| Black / African American | 6 | 0.3% |
| Hawaiian / Pacific | 0 | 0.0% |
| Hispanic or Latino | 375 | 16.0% |
| Native / Alaskan | 187 | 8.0% |
| White / Caucasian | 2,016 | 85.9% |
| Two or more Races | 21 | 0.9% |
| Some other Race | 116 | 4.9% |
| Total | 2,346 | 100.0% |
Ancestry in Flora Vista
The most populous ancestries reported in Flora Vista are Irish (213 | 9.1%), German (211 | 9.0%), Mexican (203 | 8.6%), Navajo (157 | 6.7%), and English (118 | 5.0%), together accounting for 38.4% of all Flora Vista residents.
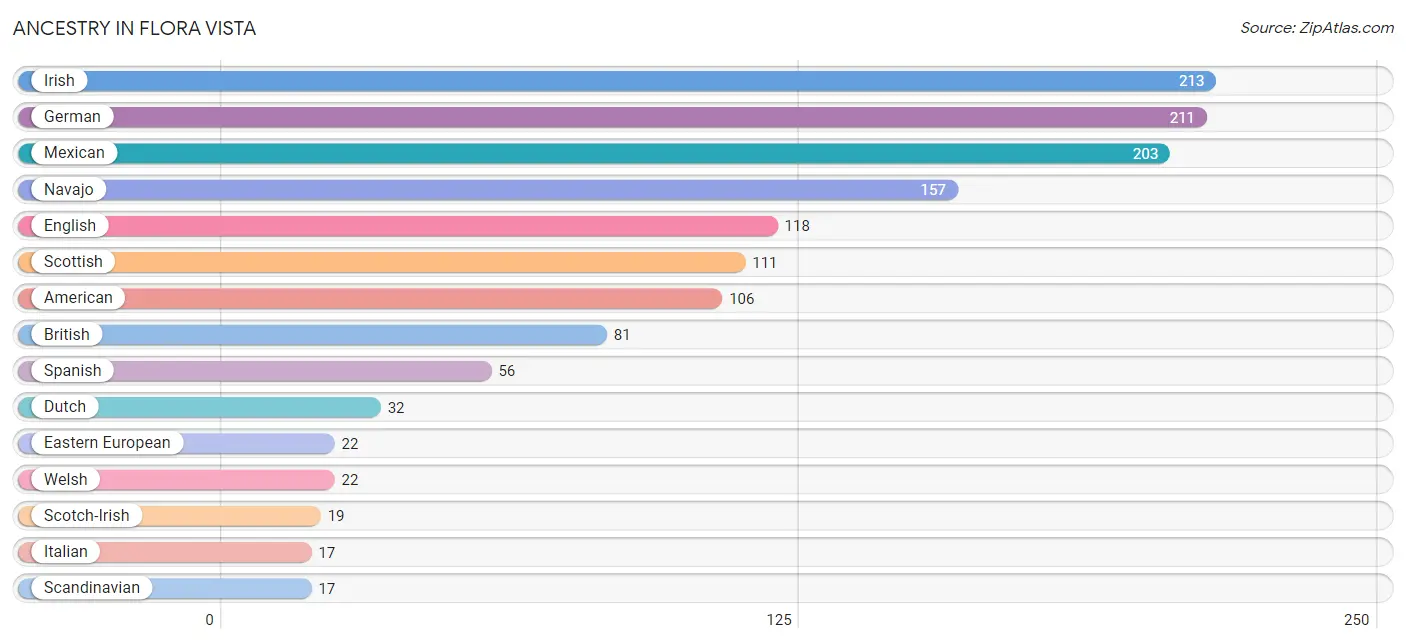
| Ancestry | # Population | % Population |
| American | 106 | 4.5% |
| Apache | 7 | 0.3% |
| British | 81 | 3.5% |
| Chippewa | 8 | 0.3% |
| Choctaw | 7 | 0.3% |
| Creek | 7 | 0.3% |
| Cuban | 11 | 0.5% |
| Danish | 7 | 0.3% |
| Dutch | 32 | 1.4% |
| Eastern European | 22 | 0.9% |
| English | 118 | 5.0% |
| European | 15 | 0.6% |
| Finnish | 16 | 0.7% |
| French | 4 | 0.2% |
| French Canadian | 1 | 0.0% |
| German | 211 | 9.0% |
| Irish | 213 | 9.1% |
| Italian | 17 | 0.7% |
| Mexican | 203 | 8.6% |
| Navajo | 157 | 6.7% |
| Norwegian | 12 | 0.5% |
| Russian | 3 | 0.1% |
| Scandinavian | 17 | 0.7% |
| Scotch-Irish | 19 | 0.8% |
| Scottish | 111 | 4.7% |
| Spaniard | 8 | 0.3% |
| Spanish | 56 | 2.4% |
| Swedish | 11 | 0.5% |
| Welsh | 22 | 0.9% | View All 29 Rows |
Immigrants in Flora Vista
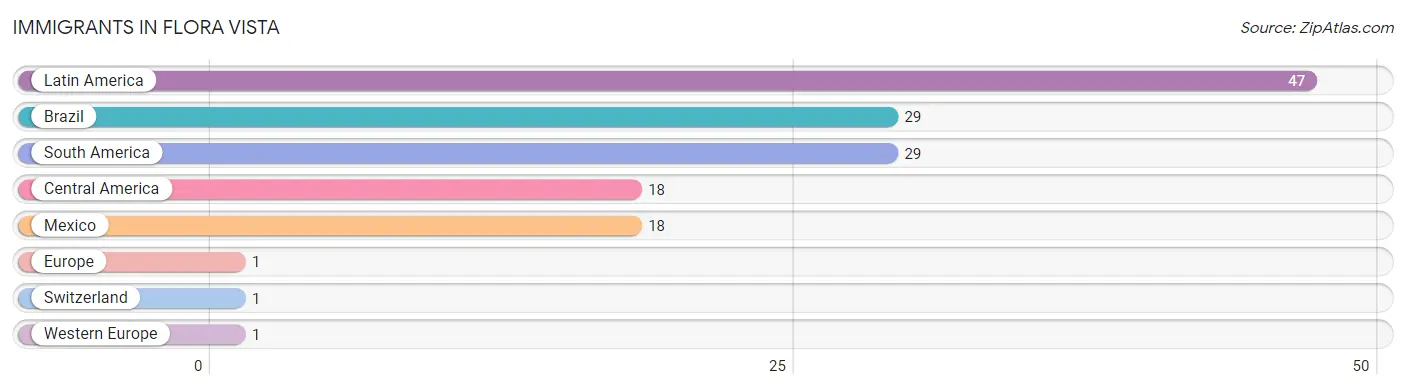
The most numerous immigrant groups reported in Flora Vista came from Latin America (47 | 2.0%), Brazil (29 | 1.2%), South America (29 | 1.2%), Central America (18 | 0.8%), and Mexico (18 | 0.8%), together accounting for 6.0% of all Flora Vista residents.
| Immigration Origin | # Population | % Population |
| Brazil | 29 | 1.2% |
| Central America | 18 | 0.8% |
| Europe | 1 | 0.0% |
| Latin America | 47 | 2.0% |
| Mexico | 18 | 0.8% |
| South America | 29 | 1.2% |
| Switzerland | 1 | 0.0% |
| Western Europe | 1 | 0.0% | View All 8 Rows |
Sex and Age in Flora Vista
Sex and Age in Flora Vista
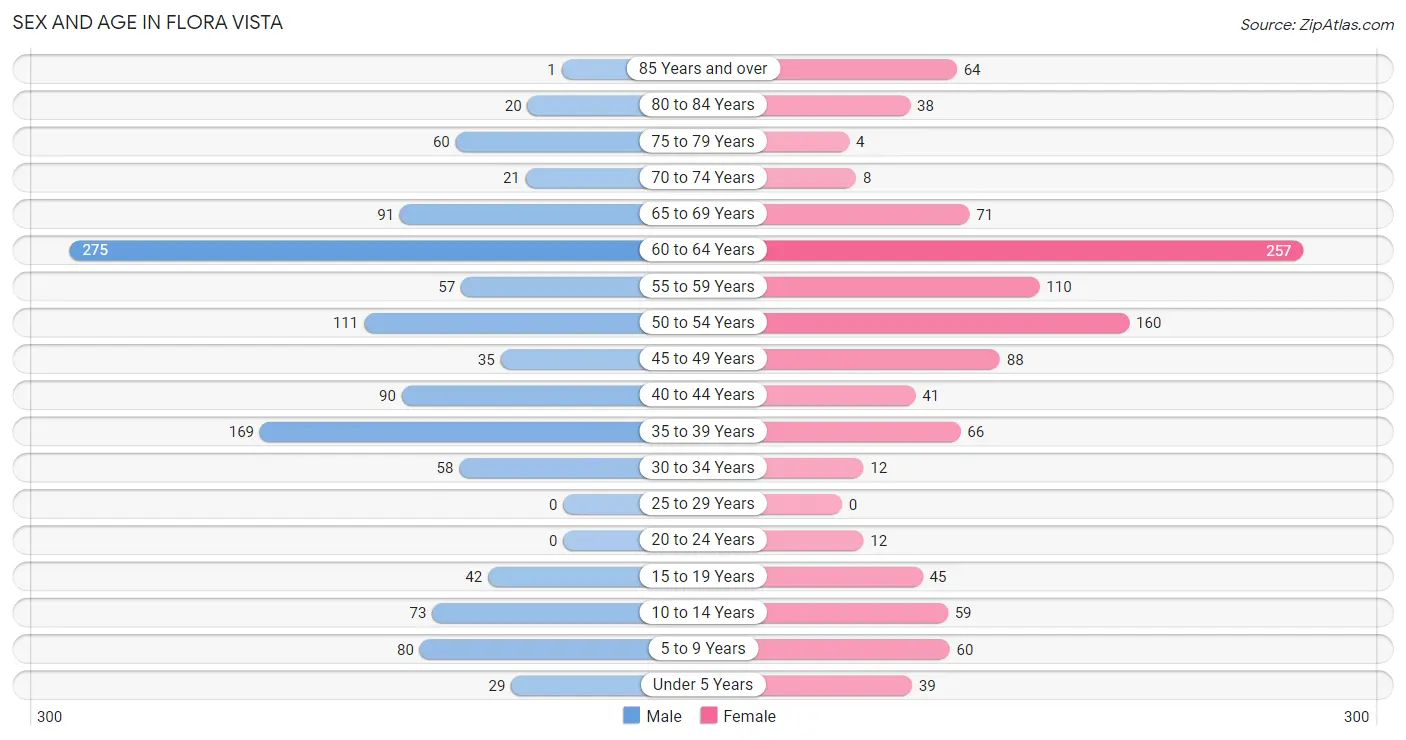
The most populous age groups in Flora Vista are 60 to 64 Years (275 | 22.7%) for men and 60 to 64 Years (257 | 22.7%) for women.
| Age Bracket | Male | Female |
| Under 5 Years | 29 (2.4%) | 39 (3.4%) |
| 5 to 9 Years | 80 (6.6%) | 60 (5.3%) |
| 10 to 14 Years | 73 (6.0%) | 59 (5.2%) |
| 15 to 19 Years | 42 (3.5%) | 45 (4.0%) |
| 20 to 24 Years | 0 (0.0%) | 12 (1.1%) |
| 25 to 29 Years | 0 (0.0%) | 0 (0.0%) |
| 30 to 34 Years | 58 (4.8%) | 12 (1.1%) |
| 35 to 39 Years | 169 (13.9%) | 66 (5.8%) |
| 40 to 44 Years | 90 (7.4%) | 41 (3.6%) |
| 45 to 49 Years | 35 (2.9%) | 88 (7.8%) |
| 50 to 54 Years | 111 (9.2%) | 160 (14.1%) |
| 55 to 59 Years | 57 (4.7%) | 110 (9.7%) |
| 60 to 64 Years | 275 (22.7%) | 257 (22.7%) |
| 65 to 69 Years | 91 (7.5%) | 71 (6.3%) |
| 70 to 74 Years | 21 (1.7%) | 8 (0.7%) |
| 75 to 79 Years | 60 (5.0%) | 4 (0.4%) |
| 80 to 84 Years | 20 (1.7%) | 38 (3.4%) |
| 85 Years and over | 1 (0.1%) | 64 (5.6%) |
| Total | 1,212 (100.0%) | 1,134 (100.0%) |
Families and Households in Flora Vista
Median Family Size in Flora Vista
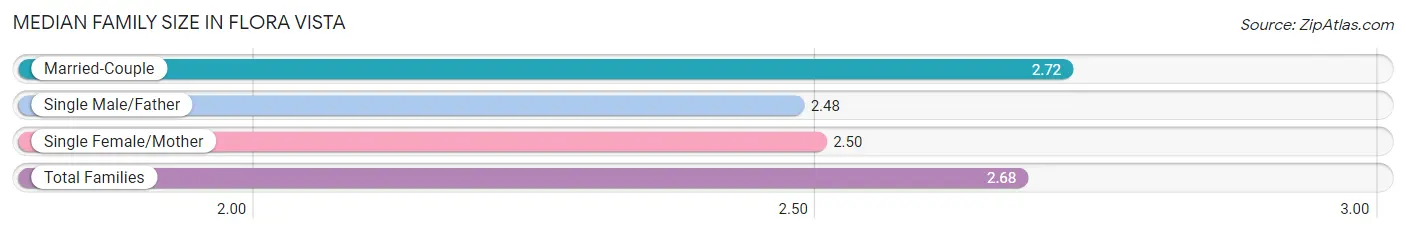
The median family size in Flora Vista is 2.68 persons per family, with married-couple families (537 | 81.1%) accounting for the largest median family size of 2.72 persons per family. On the other hand, single male/father families (91 | 13.8%) represent the smallest median family size with 2.48 persons per family.
| Family Type | # Families | Family Size |
| Married-Couple | 537 (81.1%) | 2.72 |
| Single Male/Father | 91 (13.8%) | 2.48 |
| Single Female/Mother | 34 (5.1%) | 2.50 |
| Total Families | 662 (100.0%) | 2.68 |
Median Household Size in Flora Vista
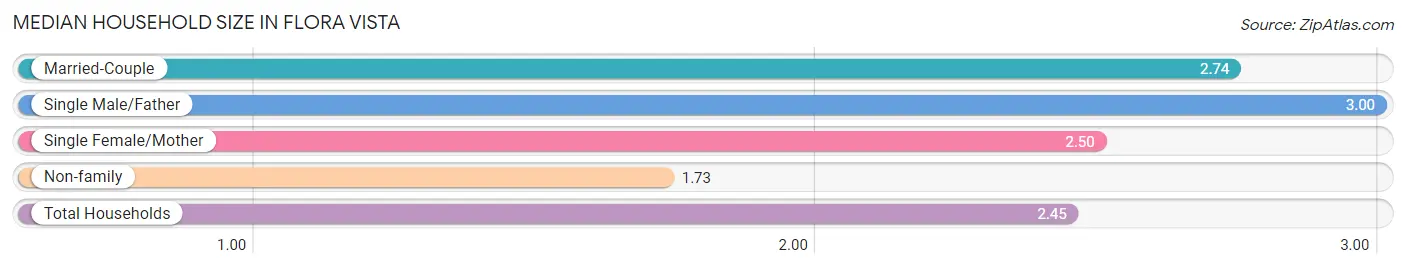
The median household size in Flora Vista is 2.45 persons per household, with single male/father households (91 | 9.5%) accounting for the largest median household size of 3 persons per household. non-family households (296 | 30.9%) represent the smallest median household size with 1.73 persons per household.
| Household Type | # Households | Household Size |
| Married-Couple | 537 (56.0%) | 2.74 |
| Single Male/Father | 91 (9.5%) | 3.00 |
| Single Female/Mother | 34 (3.5%) | 2.50 |
| Non-family | 296 (30.9%) | 1.73 |
| Total Households | 958 (100.0%) | 2.45 |
Household Size by Marriage Status in Flora Vista
Out of a total of 958 households in Flora Vista, 662 (69.1%) are family households, while 296 (30.9%) are nonfamily households. The most numerous type of family households are 2-person households, comprising 394, and the most common type of nonfamily households are 2-person households, comprising 163.
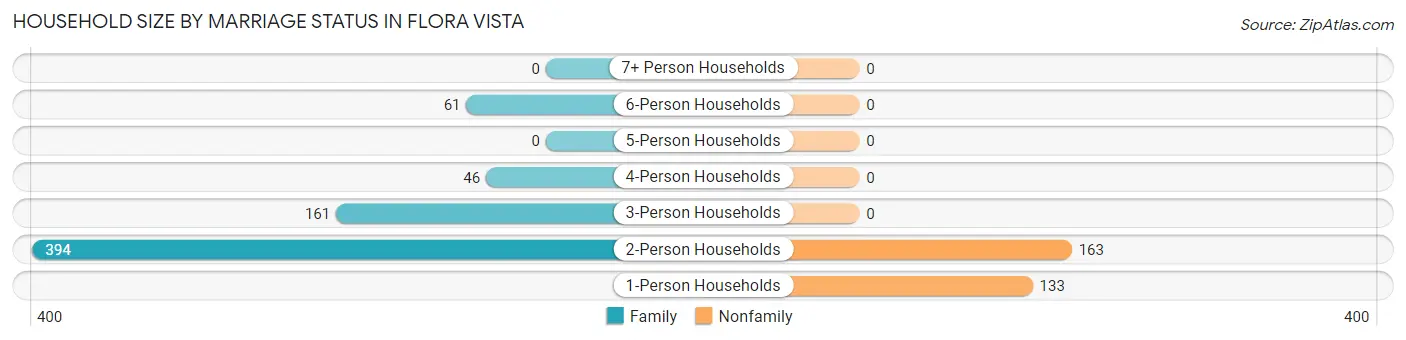
| Household Size | Family Households | Nonfamily Households |
| 1-Person Households | - | 133 (13.9%) |
| 2-Person Households | 394 (41.1%) | 163 (17.0%) |
| 3-Person Households | 161 (16.8%) | 0 (0.0%) |
| 4-Person Households | 46 (4.8%) | 0 (0.0%) |
| 5-Person Households | 0 (0.0%) | 0 (0.0%) |
| 6-Person Households | 61 (6.4%) | 0 (0.0%) |
| 7+ Person Households | 0 (0.0%) | 0 (0.0%) |
| Total | 662 (69.1%) | 296 (30.9%) |
Female Fertility in Flora Vista
Fertility by Age in Flora Vista
| Age Bracket | Women with Births | Births / 1,000 Women |
| 15 to 19 years | 0 (0.0%) | 0.0 |
| 20 to 34 years | 0 (0.0%) | 0.0 |
| 35 to 50 years | 0 (0.0%) | 0.0 |
| Total | 0 (0.0%) | 0.0 |
Fertility by Age by Marriage Status in Flora Vista
| Age Bracket | Married | Unmarried |
| 15 to 19 years | 0 (0.0%) | 0 (0.0%) |
| 20 to 34 years | 0 (0.0%) | 0 (0.0%) |
| 35 to 50 years | 0 (0.0%) | 0 (0.0%) |
| Total | 0 (0.0%) | 0 (0.0%) |
Fertility by Education in Flora Vista
| Educational Attainment | Women with Births | Births / 1,000 Women |
| Less than High School | 0 (0.0%) | 0.0 |
| High School Diploma | 0 (0.0%) | 0.0 |
| College or Associate's Degree | 0 (0.0%) | 0.0 |
| Bachelor's Degree | 0 (0.0%) | 0.0 |
| Graduate Degree | 0 (0.0%) | 0.0 |
| Total | 0 (0.0%) | 0.0 |
Fertility by Education by Marriage Status in Flora Vista
| Educational Attainment | Married | Unmarried |
| Less than High School | 0 (0.0%) | 0 (0.0%) |
| High School Diploma | 0 (0.0%) | 0 (0.0%) |
| College or Associate's Degree | 0 (0.0%) | 0 (0.0%) |
| Bachelor's Degree | 0 (0.0%) | 0 (0.0%) |
| Graduate Degree | 0 (0.0%) | 0 (0.0%) |
| Total | 0 (0.0%) | 0 (0.0%) |
Employment Characteristics in Flora Vista
Employment by Class of Employer in Flora Vista
Among the 934 employed individuals in Flora Vista, private company employees (602 | 64.4%), not-for-profit organizations (93 | 10.0%), and local government employees (66 | 7.1%) make up the most common classes of employment.
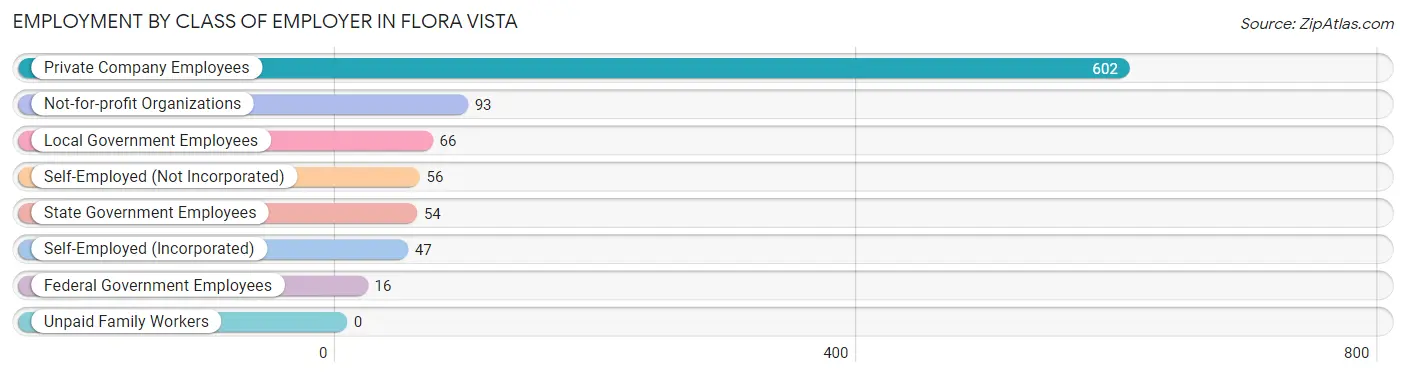
| Employer Class | # Employees | % Employees |
| Private Company Employees | 602 | 64.4% |
| Self-Employed (Incorporated) | 47 | 5.0% |
| Self-Employed (Not Incorporated) | 56 | 6.0% |
| Not-for-profit Organizations | 93 | 10.0% |
| Local Government Employees | 66 | 7.1% |
| State Government Employees | 54 | 5.8% |
| Federal Government Employees | 16 | 1.7% |
| Unpaid Family Workers | 0 | 0.0% |
| Total | 934 | 100.0% |
Employment Status by Age in Flora Vista
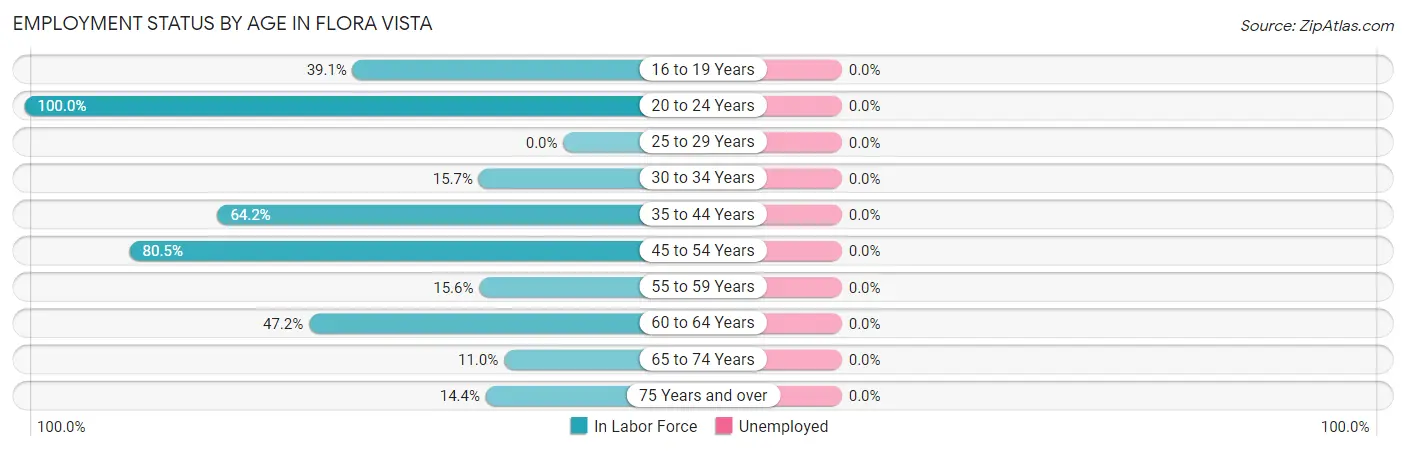
| Age Bracket | In Labor Force | Unemployed |
| 16 to 19 Years | 34 (39.1%) | 0 (0.0%) |
| 20 to 24 Years | 12 (100.0%) | 0 (0.0%) |
| 25 to 29 Years | 0 (0.0%) | 0 (0.0%) |
| 30 to 34 Years | 11 (15.7%) | 0 (0.0%) |
| 35 to 44 Years | 235 (64.2%) | 0 (0.0%) |
| 45 to 54 Years | 317 (80.5%) | 0 (0.0%) |
| 55 to 59 Years | 26 (15.6%) | 0 (0.0%) |
| 60 to 64 Years | 251 (47.2%) | 0 (0.0%) |
| 65 to 74 Years | 21 (11.0%) | 0 (0.0%) |
| 75 Years and over | 27 (14.4%) | 0 (0.0%) |
| Total | 935 (46.6%) | 0 (0.0%) |
Employment Status by Educational Attainment in Flora Vista

| Educational Attainment | In Labor Force | Unemployed |
| Less than High School | 105 (29.8%) | 0 (0.0%) |
| High School Diploma | 275 (83.1%) | 0 (0.0%) |
| College / Associate Degree | 272 (41.9%) | 0 (0.0%) |
| Bachelor's Degree or higher | 188 (95.4%) | 0 (0.0%) |
| Total | 839 (54.9%) | 0 (0.0%) |
Employment Occupations by Sex in Flora Vista
Management, Business, Science and Arts Occupations
The most common Management, Business, Science and Arts occupations in Flora Vista are Community & Social Service (145 | 15.5%), Education Instruction & Library (118 | 12.6%), Management (102 | 10.9%), Health Diagnosing & Treating (39 | 4.2%), and Health Technologists (28 | 3.0%).
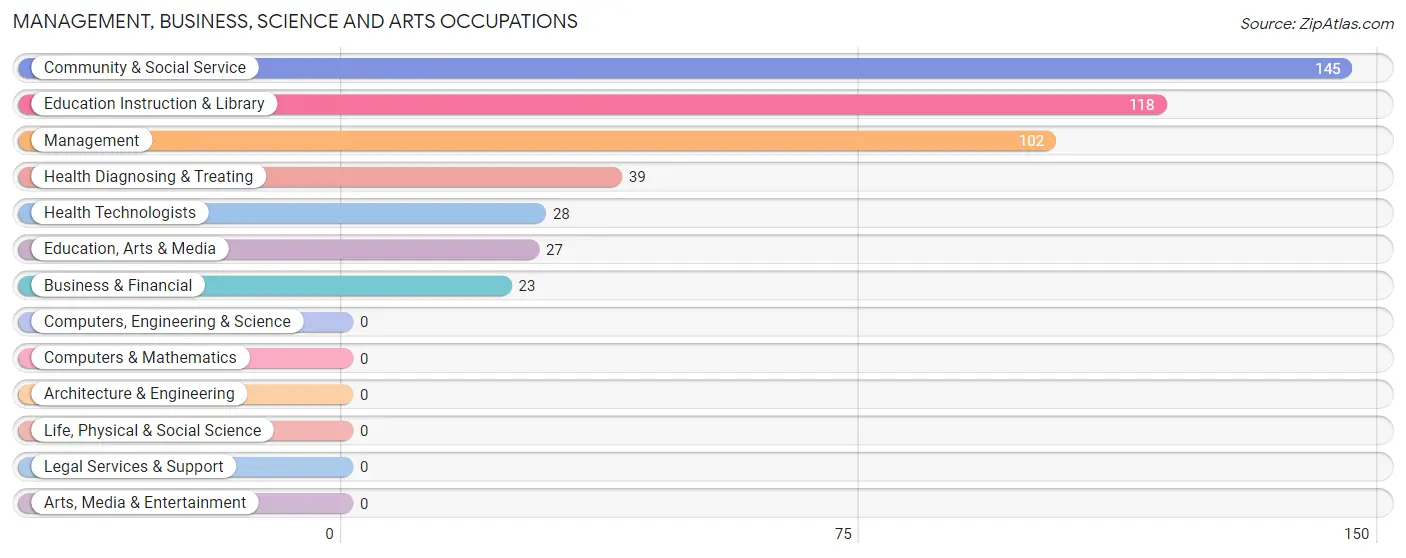
Management, Business, Science and Arts Occupations by Sex
Within the Management, Business, Science and Arts occupations in Flora Vista, the most male-oriented occupations are Education, Arts & Media (100.0%), Health Technologists (78.6%), and Community & Social Service (74.5%), while the most female-oriented occupations are Business & Financial (69.6%), Management (62.7%), and Health Diagnosing & Treating (43.6%).
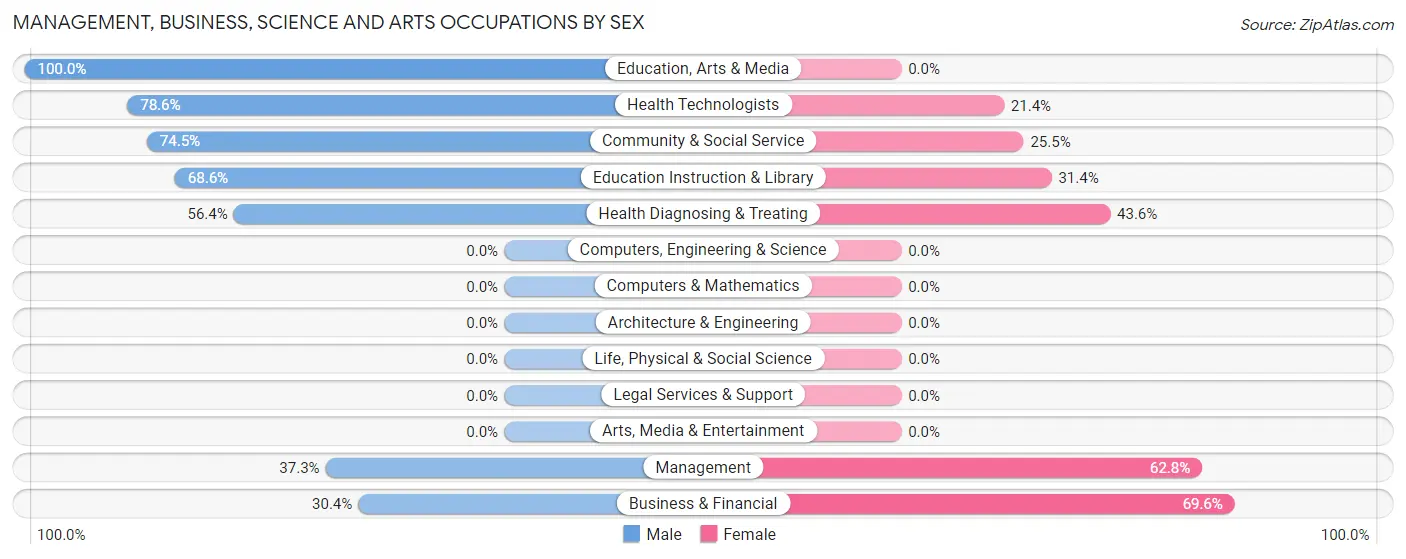
| Occupation | Male | Female |
| Management | 38 (37.2%) | 64 (62.7%) |
| Business & Financial | 7 (30.4%) | 16 (69.6%) |
| Computers, Engineering & Science | 0 (0.0%) | 0 (0.0%) |
| Computers & Mathematics | 0 (0.0%) | 0 (0.0%) |
| Architecture & Engineering | 0 (0.0%) | 0 (0.0%) |
| Life, Physical & Social Science | 0 (0.0%) | 0 (0.0%) |
| Community & Social Service | 108 (74.5%) | 37 (25.5%) |
| Education, Arts & Media | 27 (100.0%) | 0 (0.0%) |
| Legal Services & Support | 0 (0.0%) | 0 (0.0%) |
| Education Instruction & Library | 81 (68.6%) | 37 (31.4%) |
| Arts, Media & Entertainment | 0 (0.0%) | 0 (0.0%) |
| Health Diagnosing & Treating | 22 (56.4%) | 17 (43.6%) |
| Health Technologists | 22 (78.6%) | 6 (21.4%) |
| Total (Category) | 175 (56.6%) | 134 (43.4%) |
| Total (Overall) | 560 (60.0%) | 374 (40.0%) |
Services Occupations
The most common Services occupations in Flora Vista are Healthcare Support (109 | 11.7%), Cleaning & Maintenance (49 | 5.2%), and Personal Care & Service (26 | 2.8%).
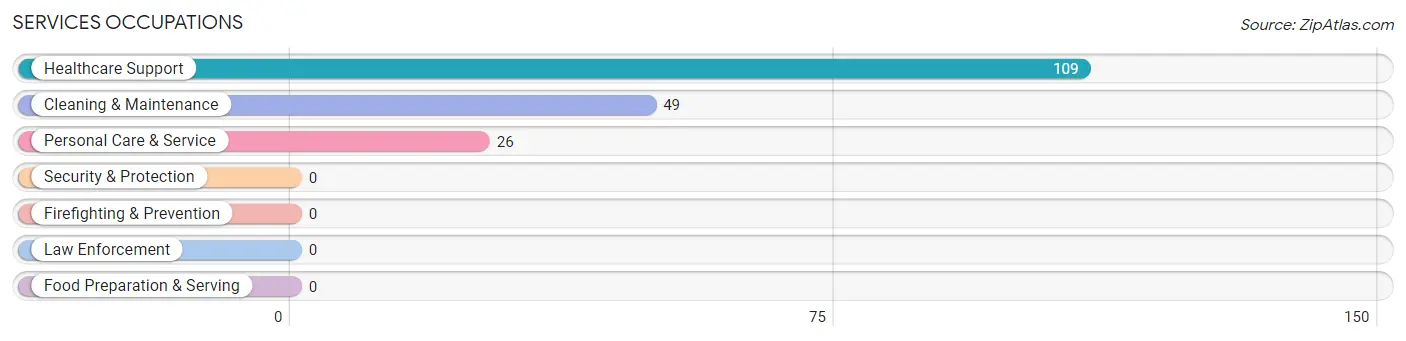
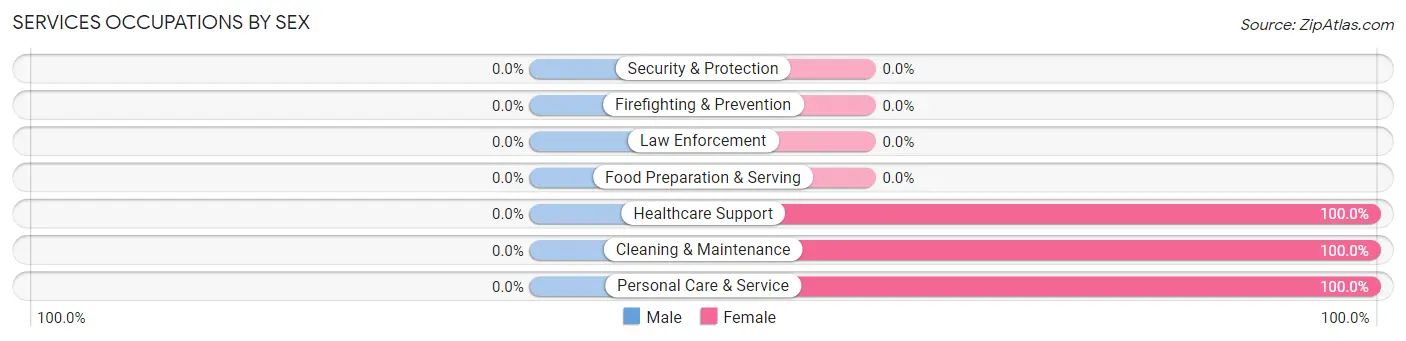
Services Occupations by Sex
| Occupation | Male | Female |
| Healthcare Support | 0 (0.0%) | 109 (100.0%) |
| Security & Protection | 0 (0.0%) | 0 (0.0%) |
| Firefighting & Prevention | 0 (0.0%) | 0 (0.0%) |
| Law Enforcement | 0 (0.0%) | 0 (0.0%) |
| Food Preparation & Serving | 0 (0.0%) | 0 (0.0%) |
| Cleaning & Maintenance | 0 (0.0%) | 49 (100.0%) |
| Personal Care & Service | 0 (0.0%) | 26 (100.0%) |
| Total (Category) | 0 (0.0%) | 184 (100.0%) |
| Total (Overall) | 560 (60.0%) | 374 (40.0%) |
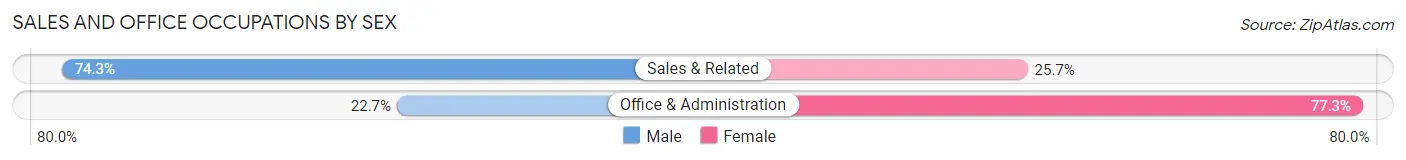
Sales and Office Occupations
The most common Sales and Office occupations in Flora Vista are Sales & Related (70 | 7.5%), and Office & Administration (44 | 4.7%).

Sales and Office Occupations by Sex
| Occupation | Male | Female |
| Sales & Related | 52 (74.3%) | 18 (25.7%) |
| Office & Administration | 10 (22.7%) | 34 (77.3%) |
| Total (Category) | 62 (54.4%) | 52 (45.6%) |
| Total (Overall) | 560 (60.0%) | 374 (40.0%) |
Natural Resources, Construction and Maintenance Occupations
The most common Natural Resources, Construction and Maintenance occupations in Flora Vista are Construction & Extraction (230 | 24.6%), and Installation, Maintenance & Repair (23 | 2.5%).
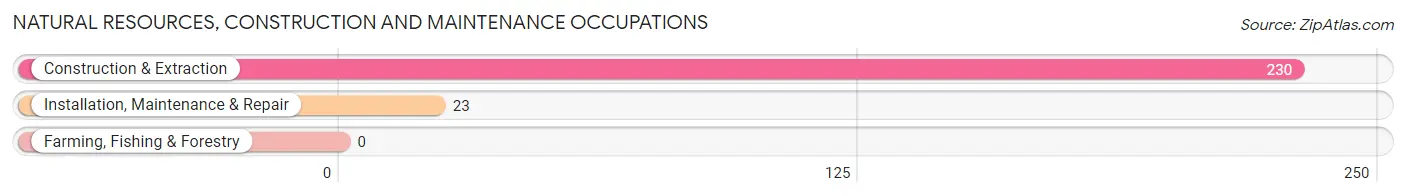
Natural Resources, Construction and Maintenance Occupations by Sex

| Occupation | Male | Female |
| Farming, Fishing & Forestry | 0 (0.0%) | 0 (0.0%) |
| Construction & Extraction | 230 (100.0%) | 0 (0.0%) |
| Installation, Maintenance & Repair | 23 (100.0%) | 0 (0.0%) |
| Total (Category) | 253 (100.0%) | 0 (0.0%) |
| Total (Overall) | 560 (60.0%) | 374 (40.0%) |
Production, Transportation and Moving Occupations
The most common Production, Transportation and Moving occupations in Flora Vista are Production (59 | 6.3%), and Material Moving (15 | 1.6%).
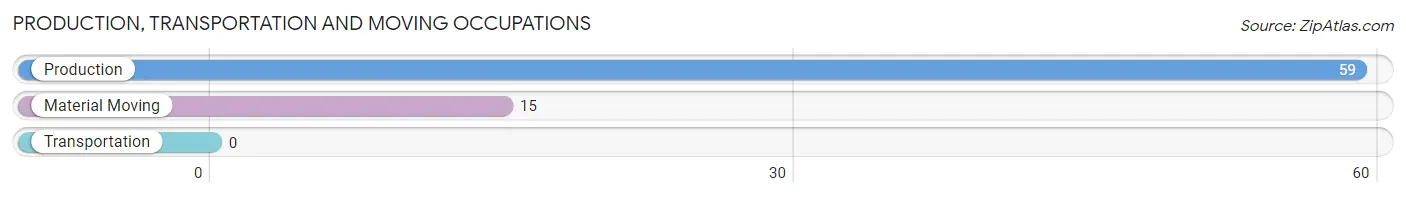
Production, Transportation and Moving Occupations by Sex
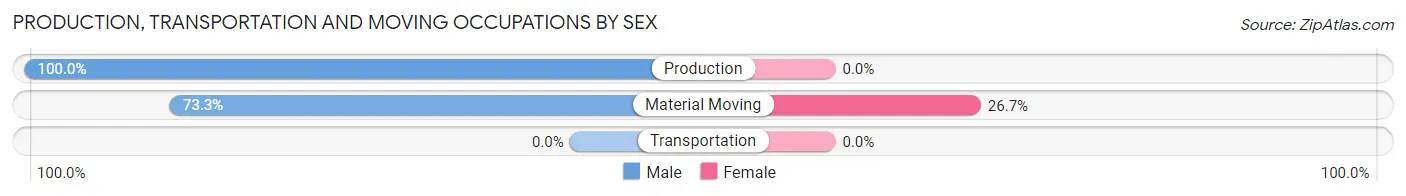
| Occupation | Male | Female |
| Production | 59 (100.0%) | 0 (0.0%) |
| Transportation | 0 (0.0%) | 0 (0.0%) |
| Material Moving | 11 (73.3%) | 4 (26.7%) |
| Total (Category) | 70 (94.6%) | 4 (5.4%) |
| Total (Overall) | 560 (60.0%) | 374 (40.0%) |
Employment Industries by Sex in Flora Vista
Employment Industries in Flora Vista
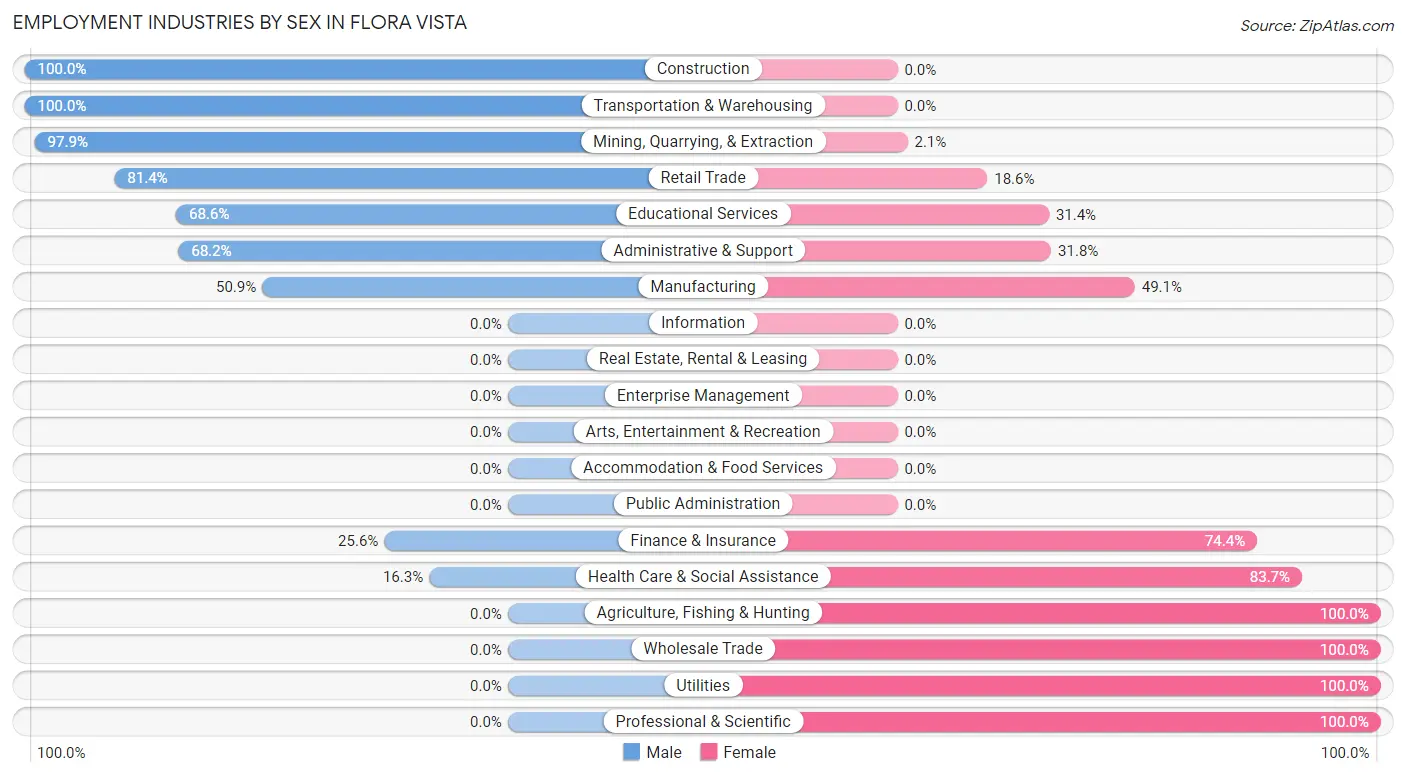
The major employment industries in Flora Vista include Mining, Quarrying, & Extraction (287 | 30.7%), Health Care & Social Assistance (135 | 14.4%), Educational Services (118 | 12.6%), Manufacturing (116 | 12.4%), and Retail Trade (43 | 4.6%).
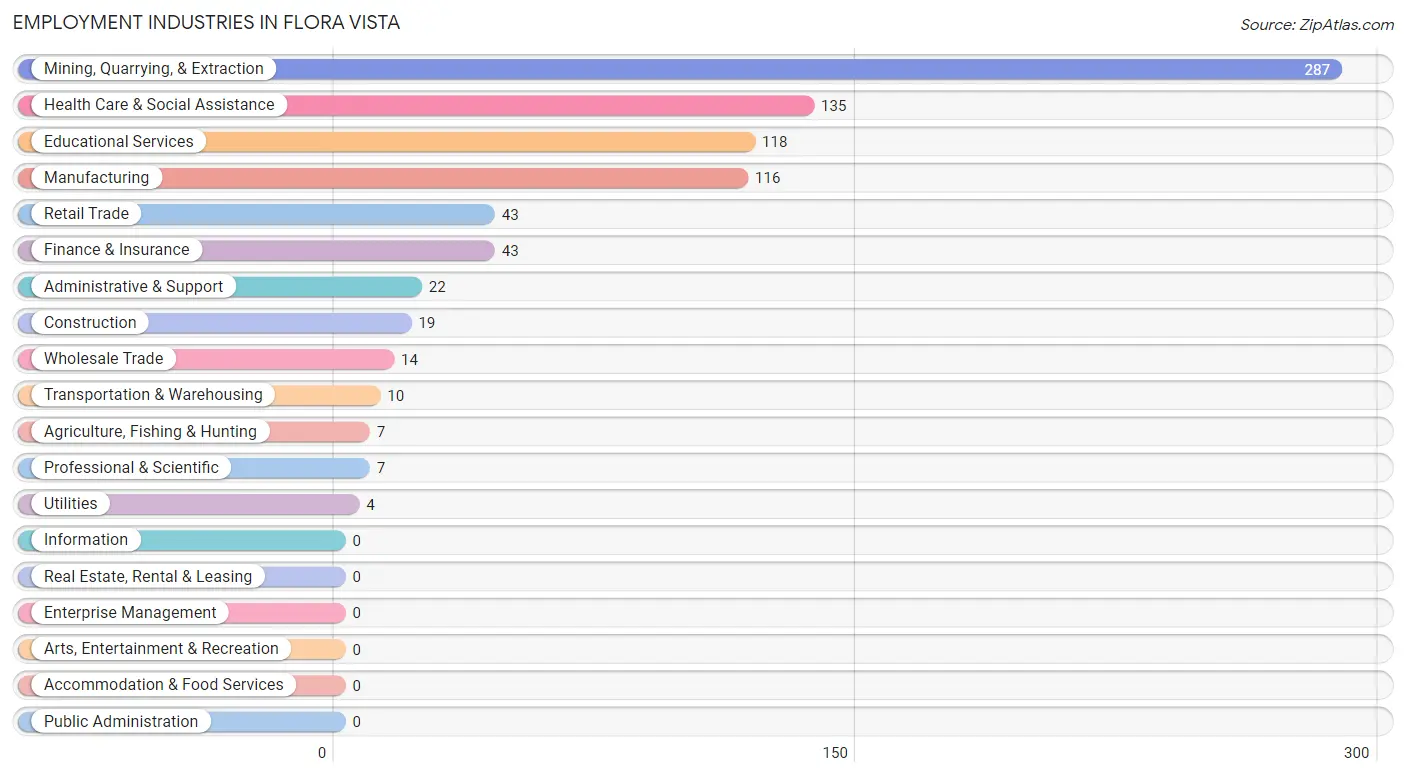
Employment Industries by Sex in Flora Vista
The Flora Vista industries that see more men than women are Construction (100.0%), Transportation & Warehousing (100.0%), and Mining, Quarrying, & Extraction (97.9%), whereas the industries that tend to have a higher number of women are Agriculture, Fishing & Hunting (100.0%), Wholesale Trade (100.0%), and Utilities (100.0%).
| Industry | Male | Female |
| Agriculture, Fishing & Hunting | 0 (0.0%) | 7 (100.0%) |
| Mining, Quarrying, & Extraction | 281 (97.9%) | 6 (2.1%) |
| Construction | 19 (100.0%) | 0 (0.0%) |
| Manufacturing | 59 (50.9%) | 57 (49.1%) |
| Wholesale Trade | 0 (0.0%) | 14 (100.0%) |
| Retail Trade | 35 (81.4%) | 8 (18.6%) |
| Transportation & Warehousing | 10 (100.0%) | 0 (0.0%) |
| Utilities | 0 (0.0%) | 4 (100.0%) |
| Information | 0 (0.0%) | 0 (0.0%) |
| Finance & Insurance | 11 (25.6%) | 32 (74.4%) |
| Real Estate, Rental & Leasing | 0 (0.0%) | 0 (0.0%) |
| Professional & Scientific | 0 (0.0%) | 7 (100.0%) |
| Enterprise Management | 0 (0.0%) | 0 (0.0%) |
| Administrative & Support | 15 (68.2%) | 7 (31.8%) |
| Educational Services | 81 (68.6%) | 37 (31.4%) |
| Health Care & Social Assistance | 22 (16.3%) | 113 (83.7%) |
| Arts, Entertainment & Recreation | 0 (0.0%) | 0 (0.0%) |
| Accommodation & Food Services | 0 (0.0%) | 0 (0.0%) |
| Public Administration | 0 (0.0%) | 0 (0.0%) |
| Total | 560 (60.0%) | 374 (40.0%) |
Education in Flora Vista
School Enrollment in Flora Vista
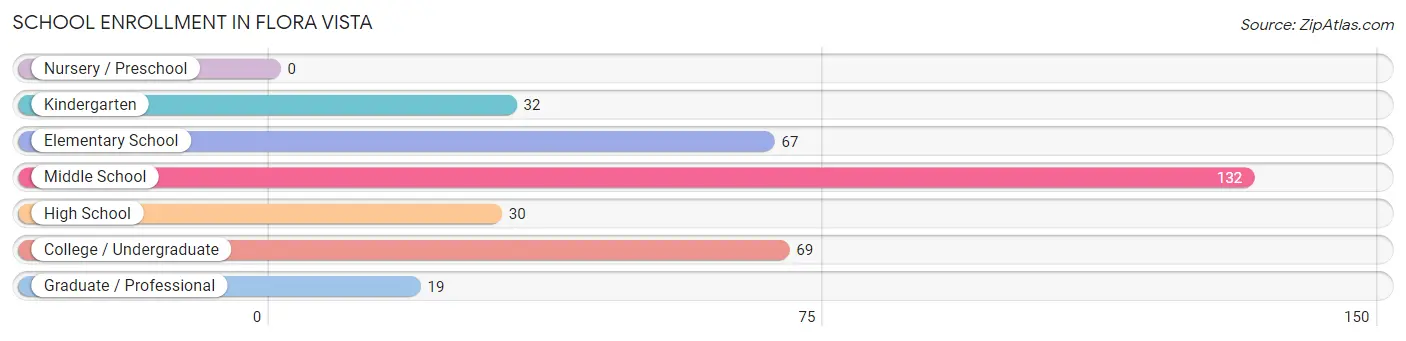
The most common levels of schooling among the 349 students in Flora Vista are middle school (132 | 37.8%), college / undergraduate (69 | 19.8%), and elementary school (67 | 19.2%).
| School Level | # Students | % Students |
| Nursery / Preschool | 0 | 0.0% |
| Kindergarten | 32 | 9.2% |
| Elementary School | 67 | 19.2% |
| Middle School | 132 | 37.8% |
| High School | 30 | 8.6% |
| College / Undergraduate | 69 | 19.8% |
| Graduate / Professional | 19 | 5.4% |
| Total | 349 | 100.0% |
School Enrollment by Age by Funding Source in Flora Vista
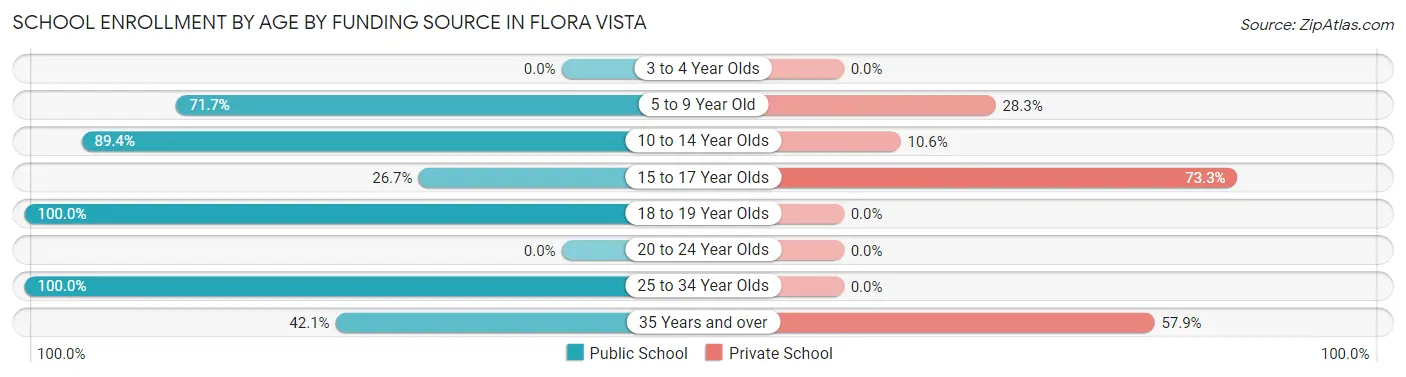
Out of a total of 349 students who are enrolled in schools in Flora Vista, 75 (21.5%) attend a private institution, while the remaining 274 (78.5%) are enrolled in public schools. The age group of 15 to 17 year olds has the highest likelihood of being enrolled in private schools, with 22 (73.3% in the age bracket) enrolled. Conversely, the age group of 18 to 19 year olds has the lowest likelihood of being enrolled in a private school, with 57 (100.0% in the age bracket) attending a public institution.
| Age Bracket | Public School | Private School |
| 3 to 4 Year Olds | 0 (0.0%) | 0 (0.0%) |
| 5 to 9 Year Old | 71 (71.7%) | 28 (28.3%) |
| 10 to 14 Year Olds | 118 (89.4%) | 14 (10.6%) |
| 15 to 17 Year Olds | 8 (26.7%) | 22 (73.3%) |
| 18 to 19 Year Olds | 57 (100.0%) | 0 (0.0%) |
| 20 to 24 Year Olds | 0 (0.0%) | 0 (0.0%) |
| 25 to 34 Year Olds | 12 (100.0%) | 0 (0.0%) |
| 35 Years and over | 8 (42.1%) | 11 (57.9%) |
| Total | 274 (78.5%) | 75 (21.5%) |
Educational Attainment by Field of Study in Flora Vista
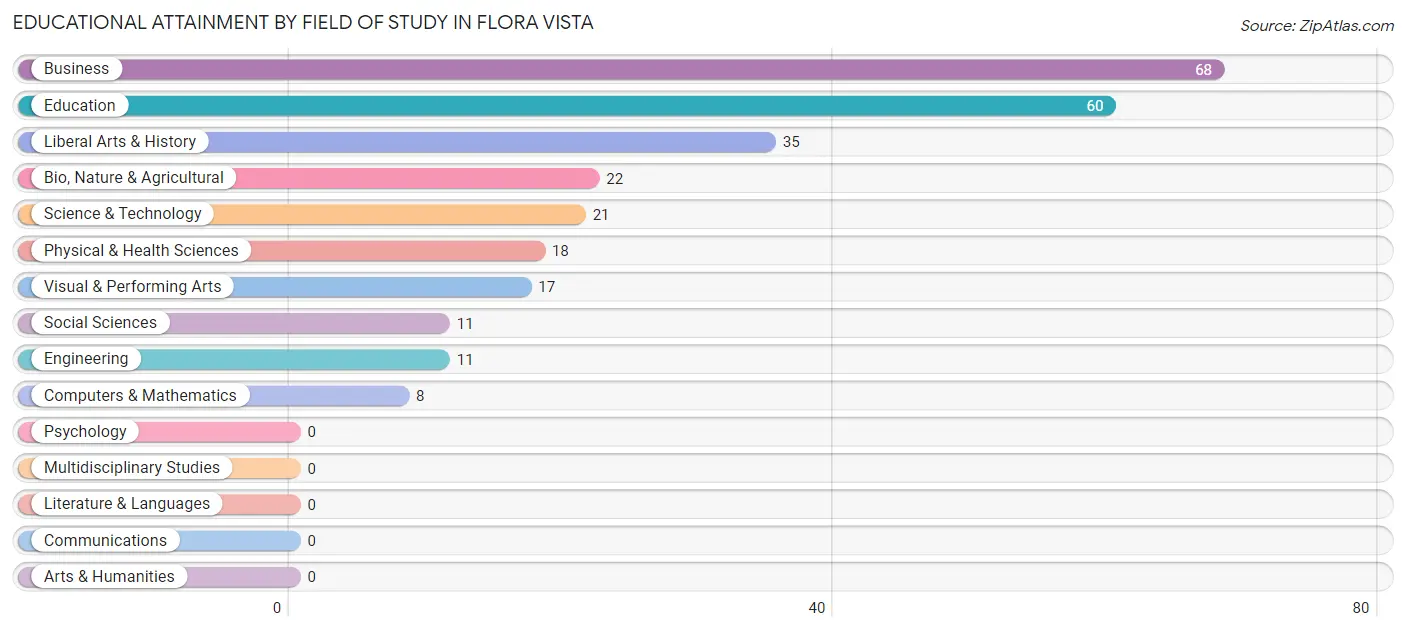
Business (68 | 25.1%), education (60 | 22.1%), liberal arts & history (35 | 12.9%), bio, nature & agricultural (22 | 8.1%), and science & technology (21 | 7.7%) are the most common fields of study among 271 individuals in Flora Vista who have obtained a bachelor's degree or higher.
| Field of Study | # Graduates | % Graduates |
| Computers & Mathematics | 8 | 2.9% |
| Bio, Nature & Agricultural | 22 | 8.1% |
| Physical & Health Sciences | 18 | 6.6% |
| Psychology | 0 | 0.0% |
| Social Sciences | 11 | 4.1% |
| Engineering | 11 | 4.1% |
| Multidisciplinary Studies | 0 | 0.0% |
| Science & Technology | 21 | 7.7% |
| Business | 68 | 25.1% |
| Education | 60 | 22.1% |
| Literature & Languages | 0 | 0.0% |
| Liberal Arts & History | 35 | 12.9% |
| Visual & Performing Arts | 17 | 6.3% |
| Communications | 0 | 0.0% |
| Arts & Humanities | 0 | 0.0% |
| Total | 271 | 100.0% |
Transportation & Commute in Flora Vista
Vehicle Availability by Sex in Flora Vista
The most prevalent vehicle ownership categories in Flora Vista are males with 3 vehicles (275, accounting for 49.1%) and females with 3 vehicles (78, making up 73.7%).
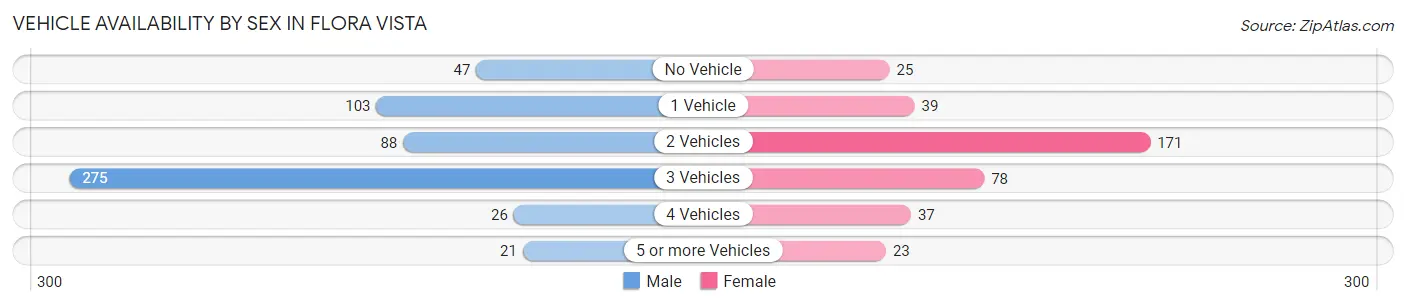
| Vehicles Available | Male | Female |
| No Vehicle | 47 (8.4%) | 25 (6.7%) |
| 1 Vehicle | 103 (18.4%) | 39 (10.5%) |
| 2 Vehicles | 88 (15.7%) | 171 (45.8%) |
| 3 Vehicles | 275 (49.1%) | 78 (20.9%) |
| 4 Vehicles | 26 (4.6%) | 37 (9.9%) |
| 5 or more Vehicles | 21 (3.7%) | 23 (6.2%) |
| Total | 560 (100.0%) | 373 (100.0%) |
Commute Time in Flora Vista
The most frequently occuring commute durations in Flora Vista are 10 to 14 minutes (240 commuters, 26.6%), 30 to 34 minutes (212 commuters, 23.5%), and 15 to 19 minutes (167 commuters, 18.5%).
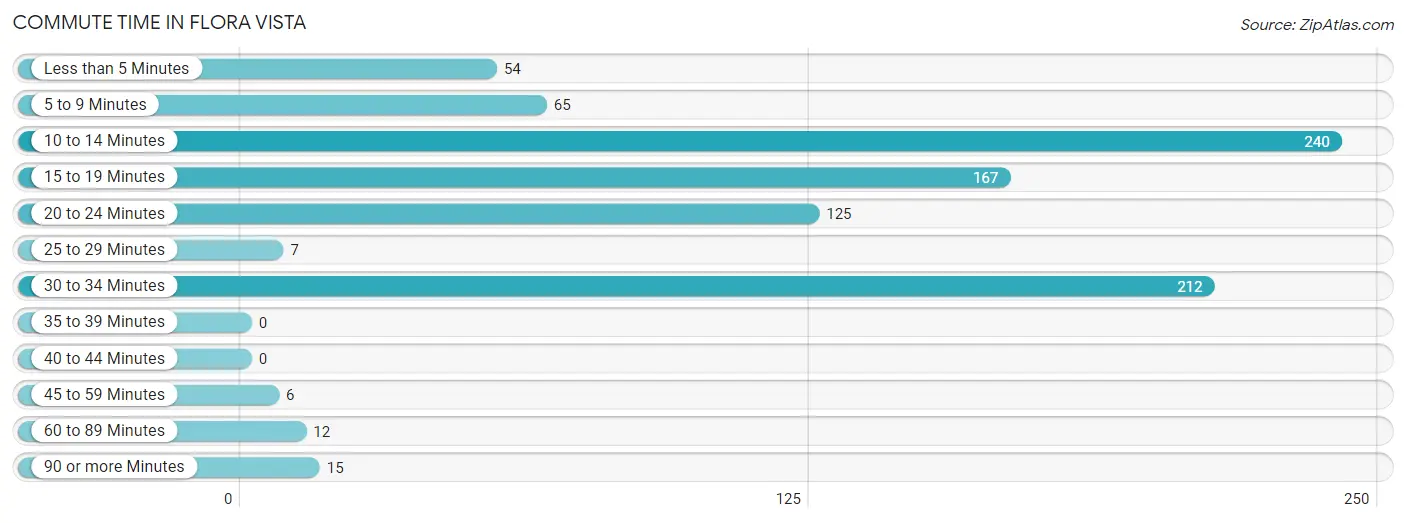
| Commute Time | # Commuters | % Commuters |
| Less than 5 Minutes | 54 | 6.0% |
| 5 to 9 Minutes | 65 | 7.2% |
| 10 to 14 Minutes | 240 | 26.6% |
| 15 to 19 Minutes | 167 | 18.5% |
| 20 to 24 Minutes | 125 | 13.8% |
| 25 to 29 Minutes | 7 | 0.8% |
| 30 to 34 Minutes | 212 | 23.5% |
| 35 to 39 Minutes | 0 | 0.0% |
| 40 to 44 Minutes | 0 | 0.0% |
| 45 to 59 Minutes | 6 | 0.7% |
| 60 to 89 Minutes | 12 | 1.3% |
| 90 or more Minutes | 15 | 1.7% |
Commute Time by Sex in Flora Vista
The most common commute times in Flora Vista are 30 to 34 minutes (212 commuters, 39.3%) for males and 15 to 19 minutes (106 commuters, 29.2%) for females.
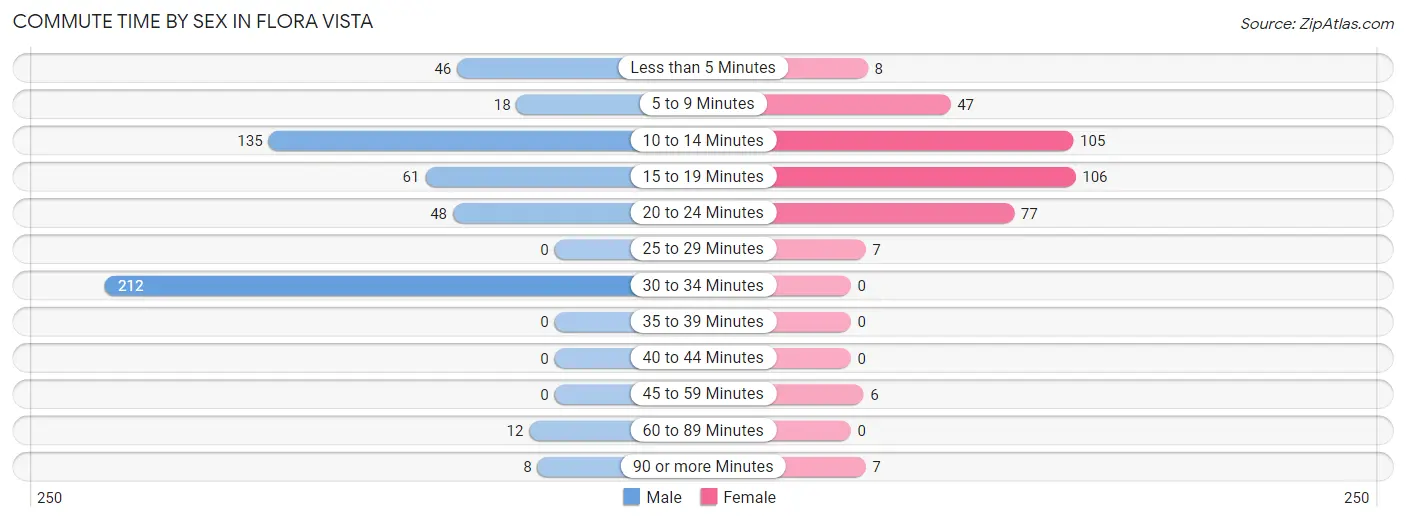
| Commute Time | Male | Female |
| Less than 5 Minutes | 46 (8.5%) | 8 (2.2%) |
| 5 to 9 Minutes | 18 (3.3%) | 47 (13.0%) |
| 10 to 14 Minutes | 135 (25.0%) | 105 (28.9%) |
| 15 to 19 Minutes | 61 (11.3%) | 106 (29.2%) |
| 20 to 24 Minutes | 48 (8.9%) | 77 (21.2%) |
| 25 to 29 Minutes | 0 (0.0%) | 7 (1.9%) |
| 30 to 34 Minutes | 212 (39.3%) | 0 (0.0%) |
| 35 to 39 Minutes | 0 (0.0%) | 0 (0.0%) |
| 40 to 44 Minutes | 0 (0.0%) | 0 (0.0%) |
| 45 to 59 Minutes | 0 (0.0%) | 6 (1.7%) |
| 60 to 89 Minutes | 12 (2.2%) | 0 (0.0%) |
| 90 or more Minutes | 8 (1.5%) | 7 (1.9%) |
Time of Departure to Work by Sex in Flora Vista
The most frequent times of departure to work in Flora Vista are 4:00 PM to 11:59 PM (241, 44.6%) for males and 7:00 AM to 7:29 AM (115, 31.7%) for females.
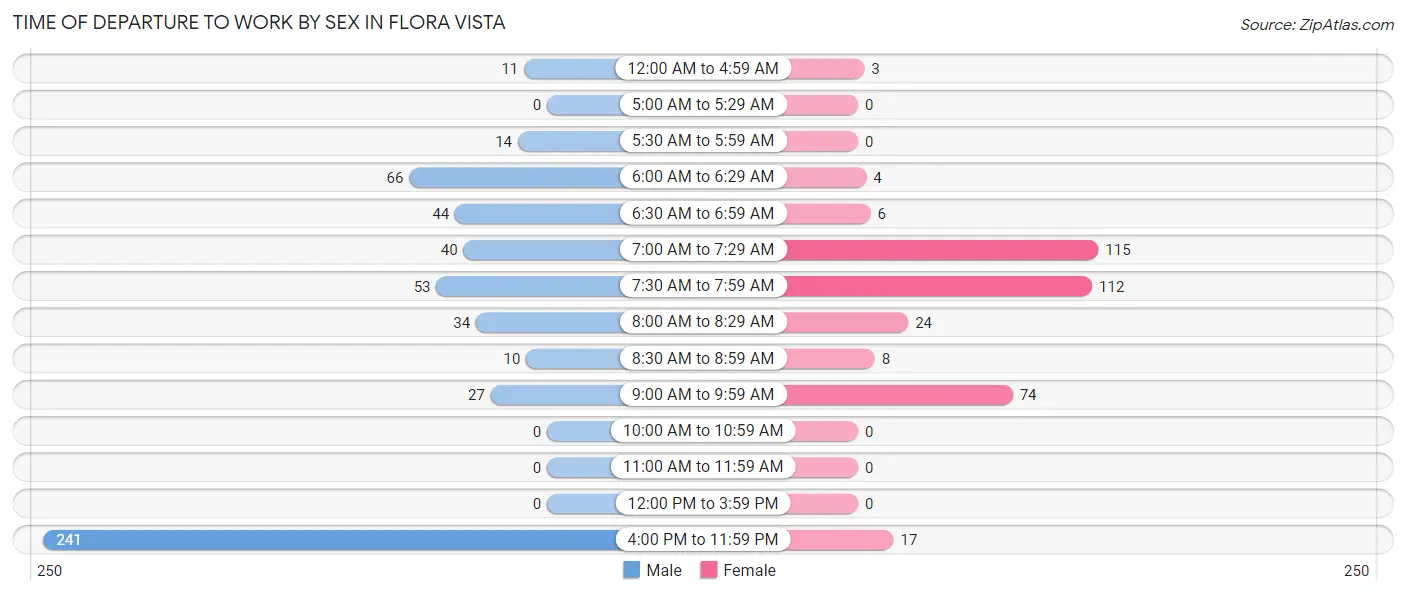
| Time of Departure | Male | Female |
| 12:00 AM to 4:59 AM | 11 (2.0%) | 3 (0.8%) |
| 5:00 AM to 5:29 AM | 0 (0.0%) | 0 (0.0%) |
| 5:30 AM to 5:59 AM | 14 (2.6%) | 0 (0.0%) |
| 6:00 AM to 6:29 AM | 66 (12.2%) | 4 (1.1%) |
| 6:30 AM to 6:59 AM | 44 (8.2%) | 6 (1.7%) |
| 7:00 AM to 7:29 AM | 40 (7.4%) | 115 (31.7%) |
| 7:30 AM to 7:59 AM | 53 (9.8%) | 112 (30.8%) |
| 8:00 AM to 8:29 AM | 34 (6.3%) | 24 (6.6%) |
| 8:30 AM to 8:59 AM | 10 (1.8%) | 8 (2.2%) |
| 9:00 AM to 9:59 AM | 27 (5.0%) | 74 (20.4%) |
| 10:00 AM to 10:59 AM | 0 (0.0%) | 0 (0.0%) |
| 11:00 AM to 11:59 AM | 0 (0.0%) | 0 (0.0%) |
| 12:00 PM to 3:59 PM | 0 (0.0%) | 0 (0.0%) |
| 4:00 PM to 11:59 PM | 241 (44.6%) | 17 (4.7%) |
| Total | 540 (100.0%) | 363 (100.0%) |
Housing Occupancy in Flora Vista
Occupancy by Ownership in Flora Vista
Of the total 958 dwellings in Flora Vista, owner-occupied units account for 717 (74.8%), while renter-occupied units make up 241 (25.2%).
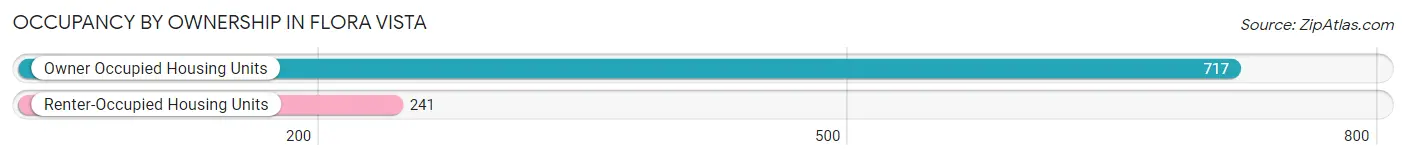
| Occupancy | # Housing Units | % Housing Units |
| Owner Occupied Housing Units | 717 | 74.8% |
| Renter-Occupied Housing Units | 241 | 25.2% |
| Total Occupied Housing Units | 958 | 100.0% |
Occupancy by Household Size in Flora Vista
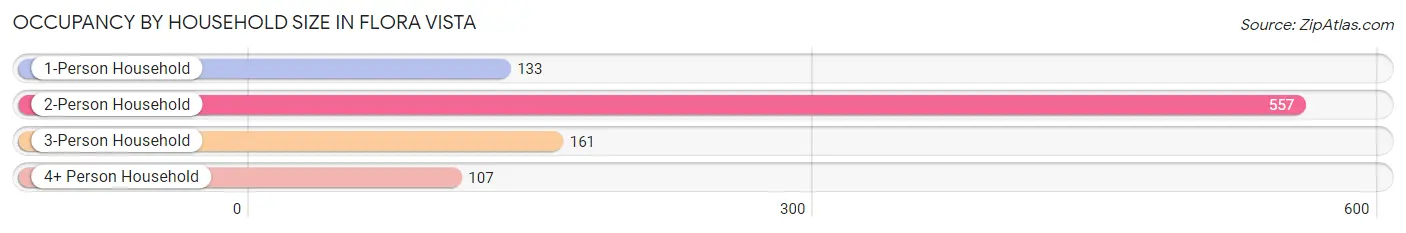
| Household Size | # Housing Units | % Housing Units |
| 1-Person Household | 133 | 13.9% |
| 2-Person Household | 557 | 58.1% |
| 3-Person Household | 161 | 16.8% |
| 4+ Person Household | 107 | 11.2% |
| Total Housing Units | 958 | 100.0% |
Occupancy by Ownership by Household Size in Flora Vista
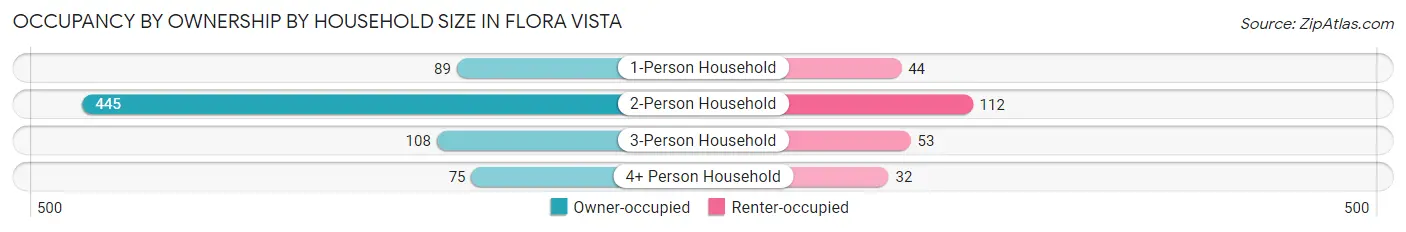
| Household Size | Owner-occupied | Renter-occupied |
| 1-Person Household | 89 (66.9%) | 44 (33.1%) |
| 2-Person Household | 445 (79.9%) | 112 (20.1%) |
| 3-Person Household | 108 (67.1%) | 53 (32.9%) |
| 4+ Person Household | 75 (70.1%) | 32 (29.9%) |
| Total Housing Units | 717 (74.8%) | 241 (25.2%) |
Occupancy by Educational Attainment in Flora Vista
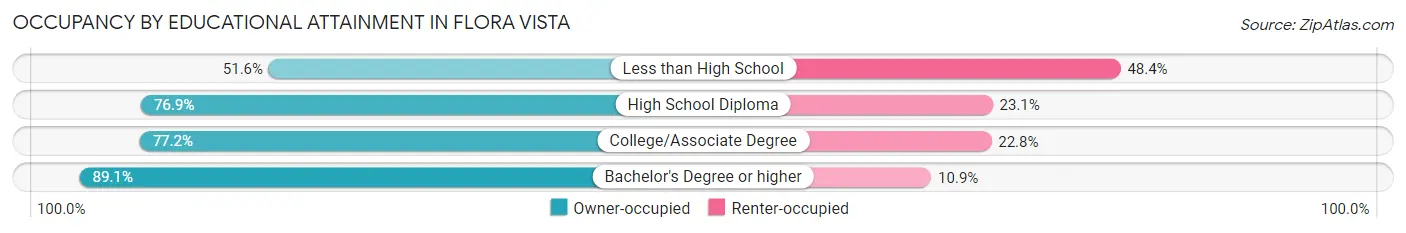
| Household Size | Owner-occupied | Renter-occupied |
| Less than High School | 82 (51.6%) | 77 (48.4%) |
| High School Diploma | 70 (76.9%) | 21 (23.1%) |
| College/Associate Degree | 426 (77.2%) | 126 (22.8%) |
| Bachelor's Degree or higher | 139 (89.1%) | 17 (10.9%) |
Occupancy by Age of Householder in Flora Vista
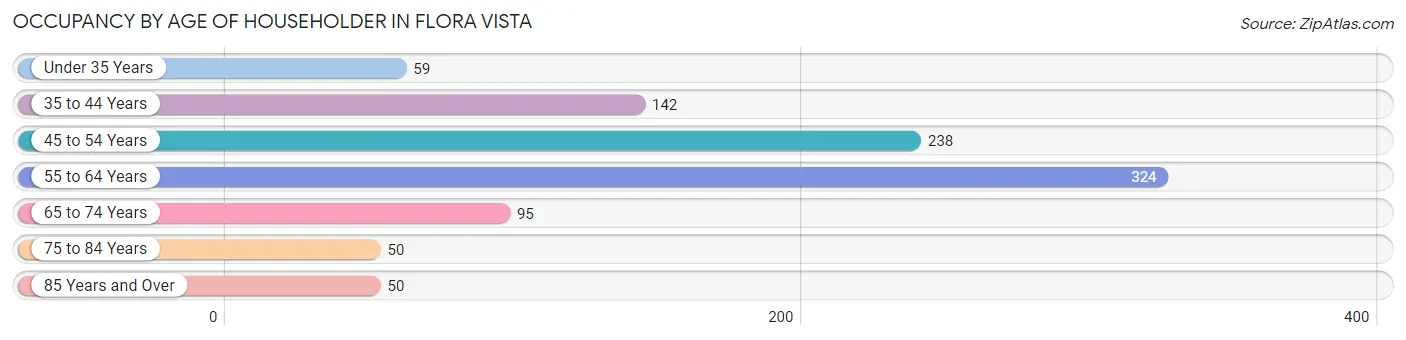
| Age Bracket | # Households | % Households |
| Under 35 Years | 59 | 6.2% |
| 35 to 44 Years | 142 | 14.8% |
| 45 to 54 Years | 238 | 24.8% |
| 55 to 64 Years | 324 | 33.8% |
| 65 to 74 Years | 95 | 9.9% |
| 75 to 84 Years | 50 | 5.2% |
| 85 Years and Over | 50 | 5.2% |
| Total | 958 | 100.0% |
Housing Finances in Flora Vista
Median Income by Occupancy in Flora Vista
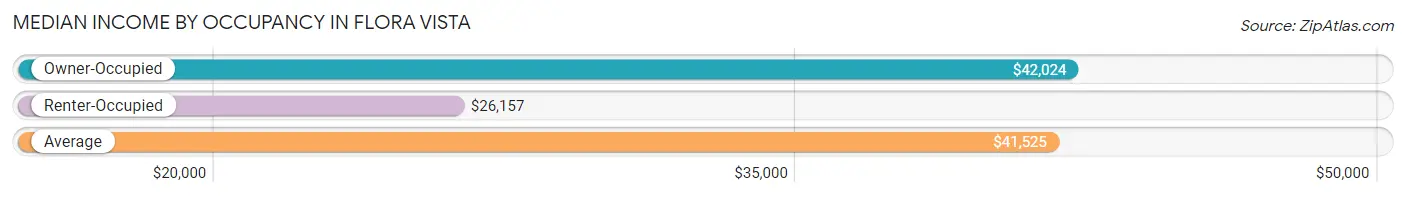
| Occupancy Type | # Households | Median Income |
| Owner-Occupied | 717 (74.8%) | $42,024 |
| Renter-Occupied | 241 (25.2%) | $26,157 |
| Average | 958 (100.0%) | $41,525 |
Occupancy by Householder Income Bracket in Flora Vista
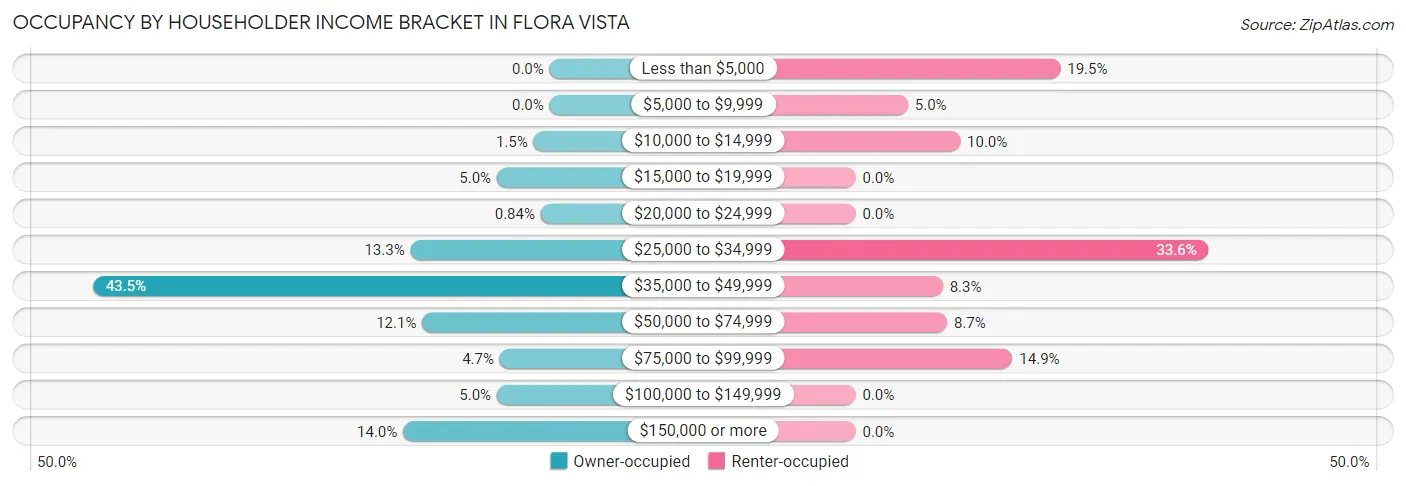
| Income Bracket | Owner-occupied | Renter-occupied |
| Less than $5,000 | 0 (0.0%) | 47 (19.5%) |
| $5,000 to $9,999 | 0 (0.0%) | 12 (5.0%) |
| $10,000 to $14,999 | 11 (1.5%) | 24 (10.0%) |
| $15,000 to $19,999 | 36 (5.0%) | 0 (0.0%) |
| $20,000 to $24,999 | 6 (0.8%) | 0 (0.0%) |
| $25,000 to $34,999 | 95 (13.3%) | 81 (33.6%) |
| $35,000 to $49,999 | 312 (43.5%) | 20 (8.3%) |
| $50,000 to $74,999 | 87 (12.1%) | 21 (8.7%) |
| $75,000 to $99,999 | 34 (4.7%) | 36 (14.9%) |
| $100,000 to $149,999 | 36 (5.0%) | 0 (0.0%) |
| $150,000 or more | 100 (14.0%) | 0 (0.0%) |
| Total | 717 (100.0%) | 241 (100.0%) |
Monthly Housing Cost Tiers in Flora Vista
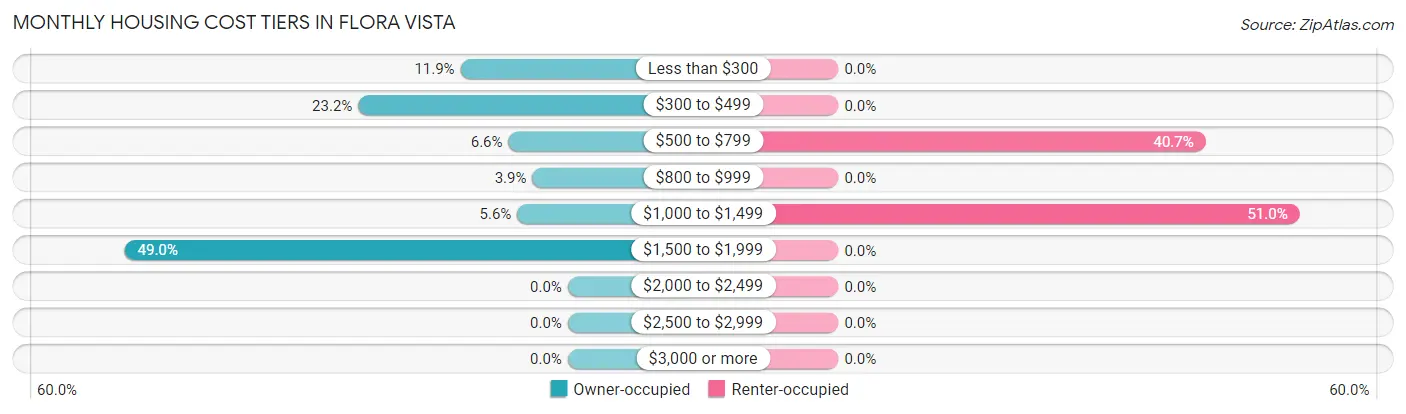
| Monthly Cost | Owner-occupied | Renter-occupied |
| Less than $300 | 85 (11.8%) | 0 (0.0%) |
| $300 to $499 | 166 (23.2%) | 0 (0.0%) |
| $500 to $799 | 47 (6.6%) | 98 (40.7%) |
| $800 to $999 | 28 (3.9%) | 0 (0.0%) |
| $1,000 to $1,499 | 40 (5.6%) | 123 (51.0%) |
| $1,500 to $1,999 | 351 (48.9%) | 0 (0.0%) |
| $2,000 to $2,499 | 0 (0.0%) | 0 (0.0%) |
| $2,500 to $2,999 | 0 (0.0%) | 0 (0.0%) |
| $3,000 or more | 0 (0.0%) | 0 (0.0%) |
| Total | 717 (100.0%) | 241 (100.0%) |
Physical Housing Characteristics in Flora Vista
Housing Structures in Flora Vista
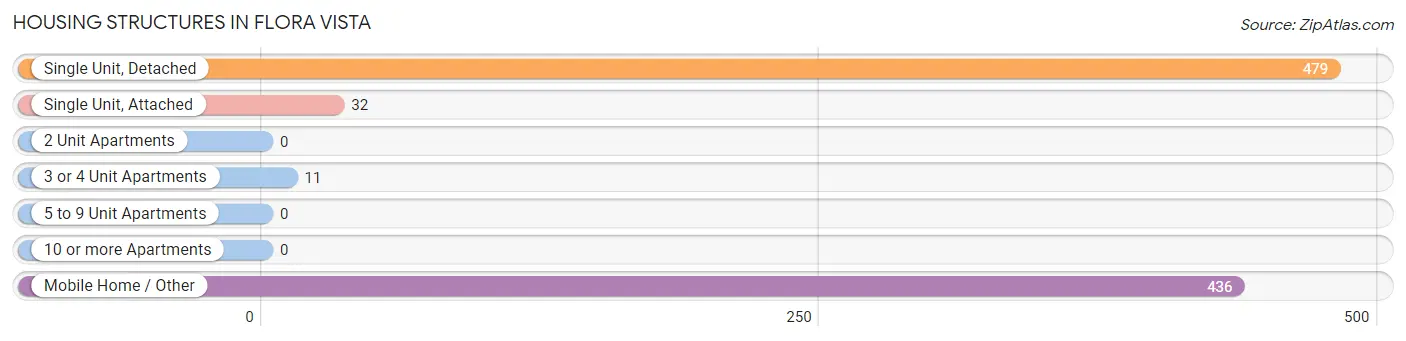
| Structure Type | # Housing Units | % Housing Units |
| Single Unit, Detached | 479 | 50.0% |
| Single Unit, Attached | 32 | 3.3% |
| 2 Unit Apartments | 0 | 0.0% |
| 3 or 4 Unit Apartments | 11 | 1.1% |
| 5 to 9 Unit Apartments | 0 | 0.0% |
| 10 or more Apartments | 0 | 0.0% |
| Mobile Home / Other | 436 | 45.5% |
| Total | 958 | 100.0% |
Housing Structures by Occupancy in Flora Vista
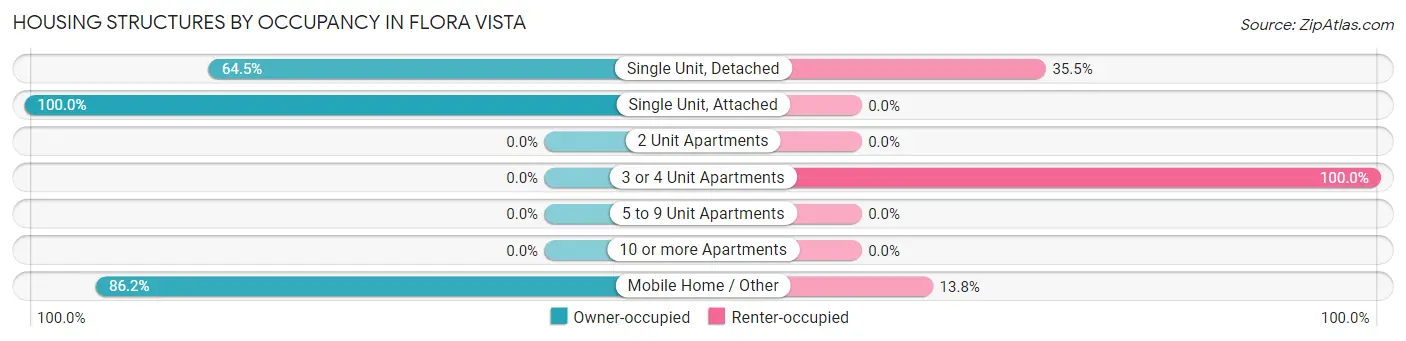
| Structure Type | Owner-occupied | Renter-occupied |
| Single Unit, Detached | 309 (64.5%) | 170 (35.5%) |
| Single Unit, Attached | 32 (100.0%) | 0 (0.0%) |
| 2 Unit Apartments | 0 (0.0%) | 0 (0.0%) |
| 3 or 4 Unit Apartments | 0 (0.0%) | 11 (100.0%) |
| 5 to 9 Unit Apartments | 0 (0.0%) | 0 (0.0%) |
| 10 or more Apartments | 0 (0.0%) | 0 (0.0%) |
| Mobile Home / Other | 376 (86.2%) | 60 (13.8%) |
| Total | 717 (74.8%) | 241 (25.2%) |
Housing Structures by Number of Rooms in Flora Vista
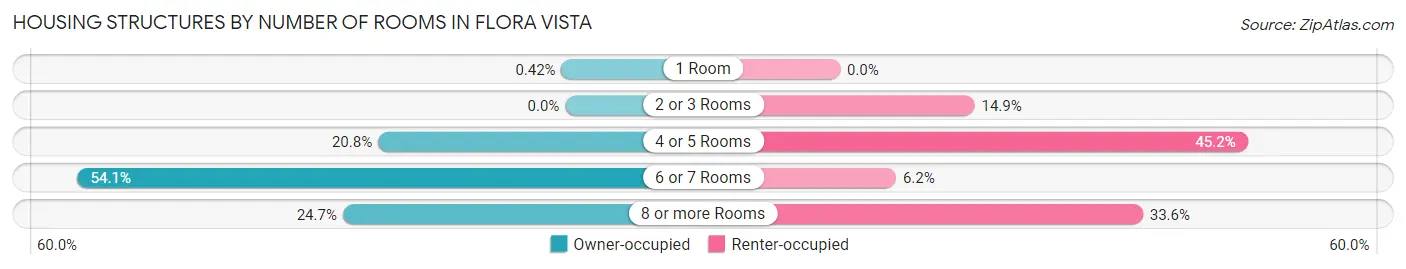
| Number of Rooms | Owner-occupied | Renter-occupied |
| 1 Room | 3 (0.4%) | 0 (0.0%) |
| 2 or 3 Rooms | 0 (0.0%) | 36 (14.9%) |
| 4 or 5 Rooms | 149 (20.8%) | 109 (45.2%) |
| 6 or 7 Rooms | 388 (54.1%) | 15 (6.2%) |
| 8 or more Rooms | 177 (24.7%) | 81 (33.6%) |
| Total | 717 (100.0%) | 241 (100.0%) |
Housing Structure by Heating Type in Flora Vista
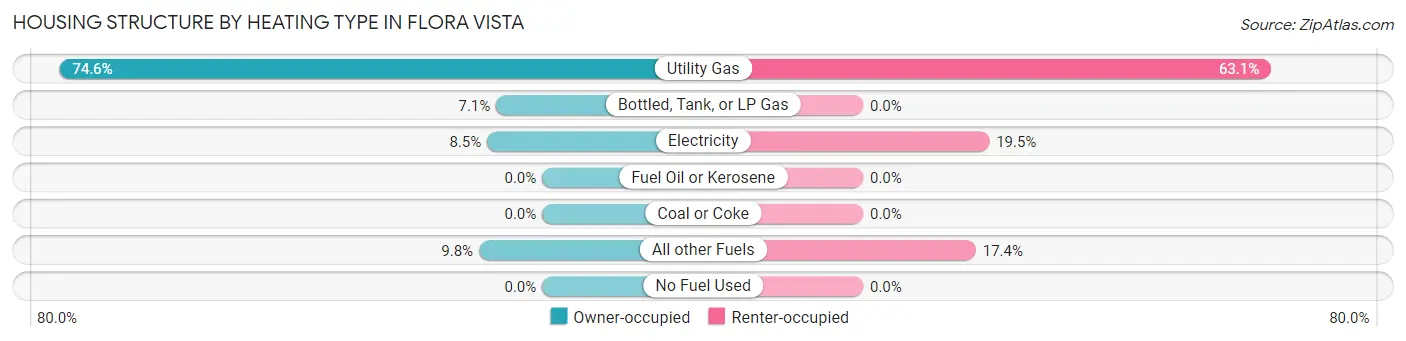
| Heating Type | Owner-occupied | Renter-occupied |
| Utility Gas | 535 (74.6%) | 152 (63.1%) |
| Bottled, Tank, or LP Gas | 51 (7.1%) | 0 (0.0%) |
| Electricity | 61 (8.5%) | 47 (19.5%) |
| Fuel Oil or Kerosene | 0 (0.0%) | 0 (0.0%) |
| Coal or Coke | 0 (0.0%) | 0 (0.0%) |
| All other Fuels | 70 (9.8%) | 42 (17.4%) |
| No Fuel Used | 0 (0.0%) | 0 (0.0%) |
| Total | 717 (100.0%) | 241 (100.0%) |
Household Vehicle Usage in Flora Vista
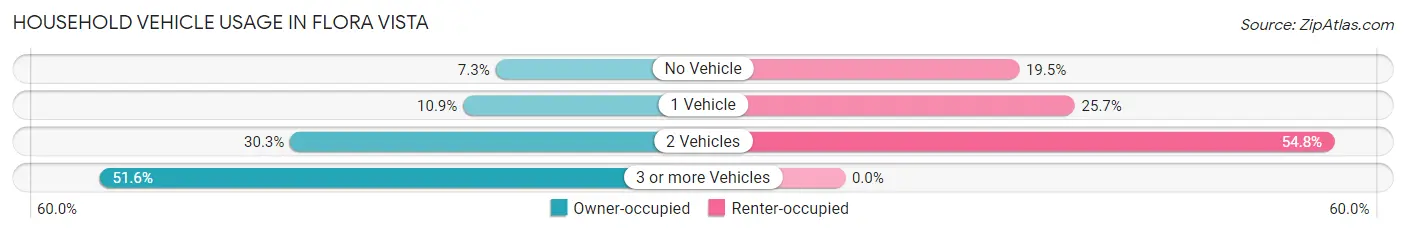
| Vehicles per Household | Owner-occupied | Renter-occupied |
| No Vehicle | 52 (7.2%) | 47 (19.5%) |
| 1 Vehicle | 78 (10.9%) | 62 (25.7%) |
| 2 Vehicles | 217 (30.3%) | 132 (54.8%) |
| 3 or more Vehicles | 370 (51.6%) | 0 (0.0%) |
| Total | 717 (100.0%) | 241 (100.0%) |
Real Estate & Mortgages in Flora Vista
Real Estate and Mortgage Overview in Flora Vista
| Characteristic | Without Mortgage | With Mortgage |
| Housing Units | 274 | 443 |
| Median Property Value | $225,900 | $194,000 |
| Median Household Income | $43,585 | $87 |
| Monthly Housing Costs | $334 | $0 |
| Real Estate Taxes | $867 | $13 |
Property Value by Mortgage Status in Flora Vista
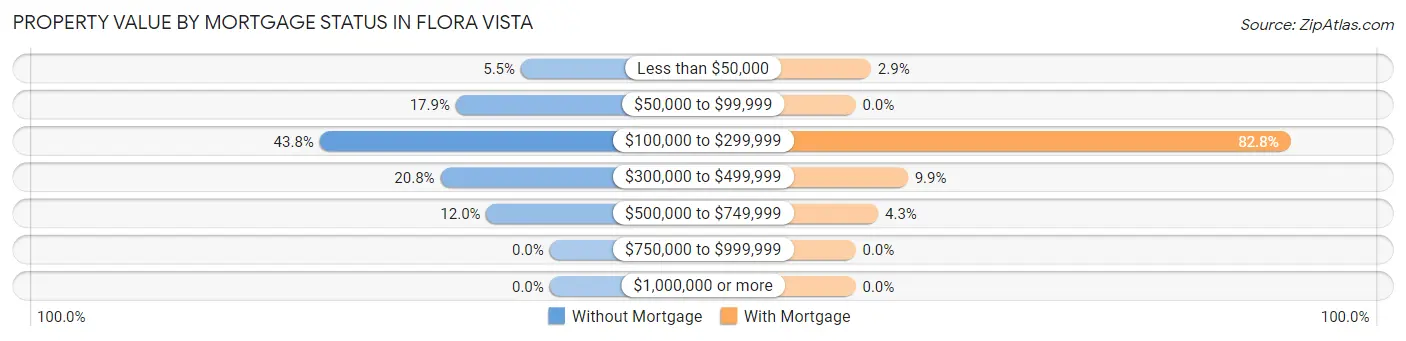
| Property Value | Without Mortgage | With Mortgage |
| Less than $50,000 | 15 (5.5%) | 13 (2.9%) |
| $50,000 to $99,999 | 49 (17.9%) | 0 (0.0%) |
| $100,000 to $299,999 | 120 (43.8%) | 367 (82.8%) |
| $300,000 to $499,999 | 57 (20.8%) | 44 (9.9%) |
| $500,000 to $749,999 | 33 (12.0%) | 19 (4.3%) |
| $750,000 to $999,999 | 0 (0.0%) | 0 (0.0%) |
| $1,000,000 or more | 0 (0.0%) | 0 (0.0%) |
| Total | 274 (100.0%) | 443 (100.0%) |
Household Income by Mortgage Status in Flora Vista
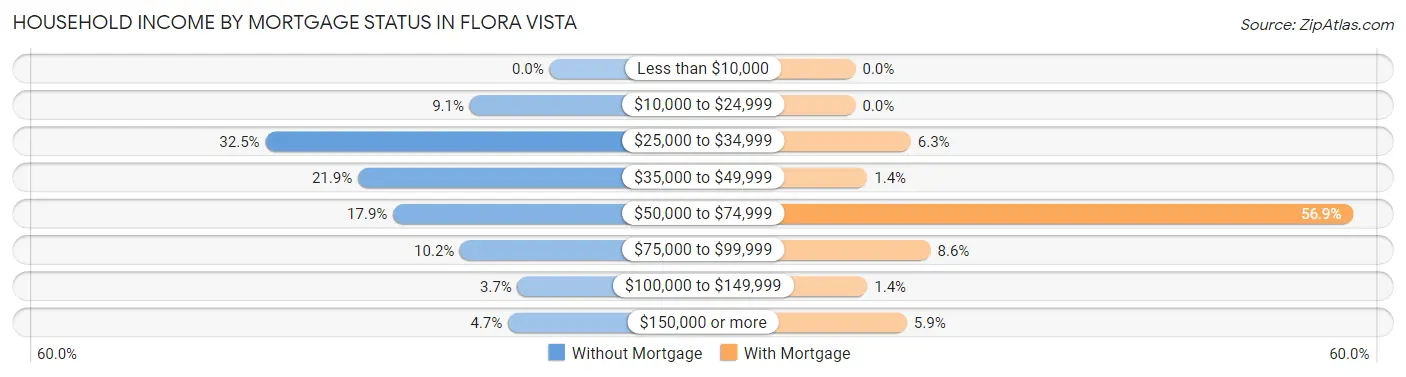
| Household Income | Without Mortgage | With Mortgage |
| Less than $10,000 | 0 (0.0%) | 0 (0.0%) |
| $10,000 to $24,999 | 25 (9.1%) | 0 (0.0%) |
| $25,000 to $34,999 | 89 (32.5%) | 28 (6.3%) |
| $35,000 to $49,999 | 60 (21.9%) | 6 (1.3%) |
| $50,000 to $74,999 | 49 (17.9%) | 252 (56.9%) |
| $75,000 to $99,999 | 28 (10.2%) | 38 (8.6%) |
| $100,000 to $149,999 | 10 (3.6%) | 6 (1.3%) |
| $150,000 or more | 13 (4.7%) | 26 (5.9%) |
| Total | 274 (100.0%) | 443 (100.0%) |
Property Value to Household Income Ratio in Flora Vista
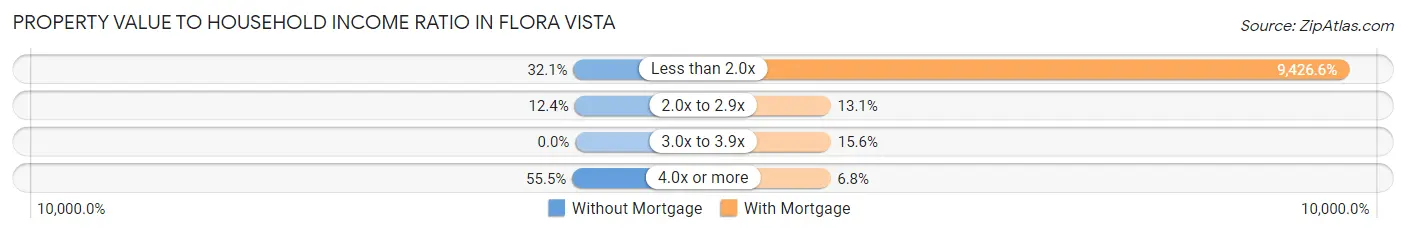
| Value-to-Income Ratio | Without Mortgage | With Mortgage |
| Less than 2.0x | 88 (32.1%) | 41,760 (9,426.6%) |
| 2.0x to 2.9x | 34 (12.4%) | 58 (13.1%) |
| 3.0x to 3.9x | 0 (0.0%) | 69 (15.6%) |
| 4.0x or more | 152 (55.5%) | 30 (6.8%) |
| Total | 274 (100.0%) | 443 (100.0%) |
Real Estate Taxes by Mortgage Status in Flora Vista
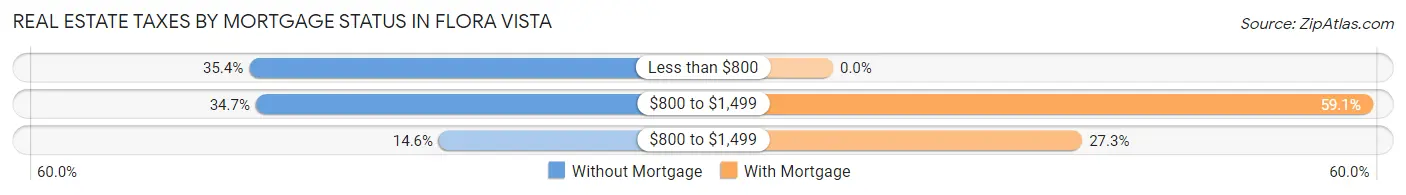
| Property Taxes | Without Mortgage | With Mortgage |
| Less than $800 | 97 (35.4%) | 0 (0.0%) |
| $800 to $1,499 | 95 (34.7%) | 262 (59.1%) |
| $800 to $1,499 | 40 (14.6%) | 121 (27.3%) |
| Total | 274 (100.0%) | 443 (100.0%) |
Health & Disability in Flora Vista
Health Insurance Coverage by Age in Flora Vista
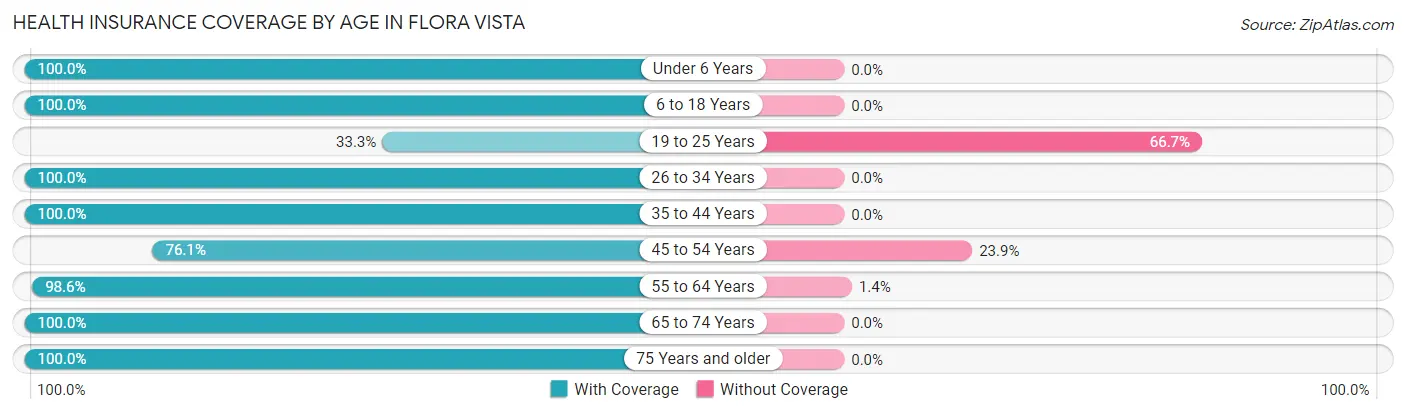
| Age Bracket | With Coverage | Without Coverage |
| Under 6 Years | 109 (100.0%) | 0 (0.0%) |
| 6 to 18 Years | 261 (100.0%) | 0 (0.0%) |
| 19 to 25 Years | 23 (33.3%) | 46 (66.7%) |
| 26 to 34 Years | 70 (100.0%) | 0 (0.0%) |
| 35 to 44 Years | 366 (100.0%) | 0 (0.0%) |
| 45 to 54 Years | 300 (76.1%) | 94 (23.9%) |
| 55 to 64 Years | 689 (98.6%) | 10 (1.4%) |
| 65 to 74 Years | 191 (100.0%) | 0 (0.0%) |
| 75 Years and older | 187 (100.0%) | 0 (0.0%) |
| Total | 2,196 (93.6%) | 150 (6.4%) |
Health Insurance Coverage by Citizenship Status in Flora Vista

| Citizenship Status | With Coverage | Without Coverage |
| Native Born | 109 (100.0%) | 0 (0.0%) |
| Foreign Born, Citizen | 261 (100.0%) | 0 (0.0%) |
| Foreign Born, not a Citizen | 23 (33.3%) | 46 (66.7%) |
Health Insurance Coverage by Household Income in Flora Vista
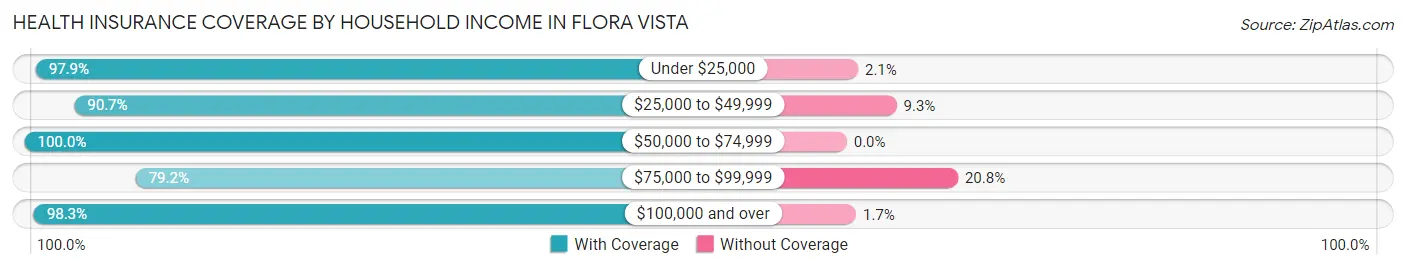
| Household Income | With Coverage | Without Coverage |
| Under $25,000 | 372 (97.9%) | 8 (2.1%) |
| $25,000 to $49,999 | 1,030 (90.7%) | 106 (9.3%) |
| $50,000 to $74,999 | 338 (100.0%) | 0 (0.0%) |
| $75,000 to $99,999 | 114 (79.2%) | 30 (20.8%) |
| $100,000 and over | 339 (98.3%) | 6 (1.7%) |
Public vs Private Health Insurance Coverage by Age in Flora Vista
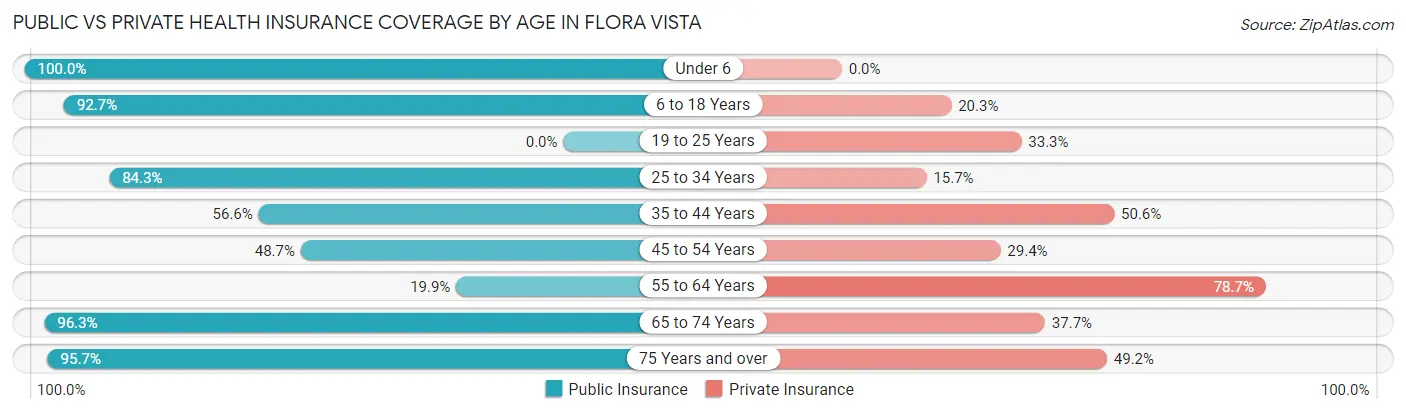
| Age Bracket | Public Insurance | Private Insurance |
| Under 6 | 109 (100.0%) | 0 (0.0%) |
| 6 to 18 Years | 242 (92.7%) | 53 (20.3%) |
| 19 to 25 Years | 0 (0.0%) | 23 (33.3%) |
| 25 to 34 Years | 59 (84.3%) | 11 (15.7%) |
| 35 to 44 Years | 207 (56.6%) | 185 (50.5%) |
| 45 to 54 Years | 192 (48.7%) | 116 (29.4%) |
| 55 to 64 Years | 139 (19.9%) | 550 (78.7%) |
| 65 to 74 Years | 184 (96.3%) | 72 (37.7%) |
| 75 Years and over | 179 (95.7%) | 92 (49.2%) |
| Total | 1,311 (55.9%) | 1,102 (47.0%) |
Disability Status by Sex by Age in Flora Vista
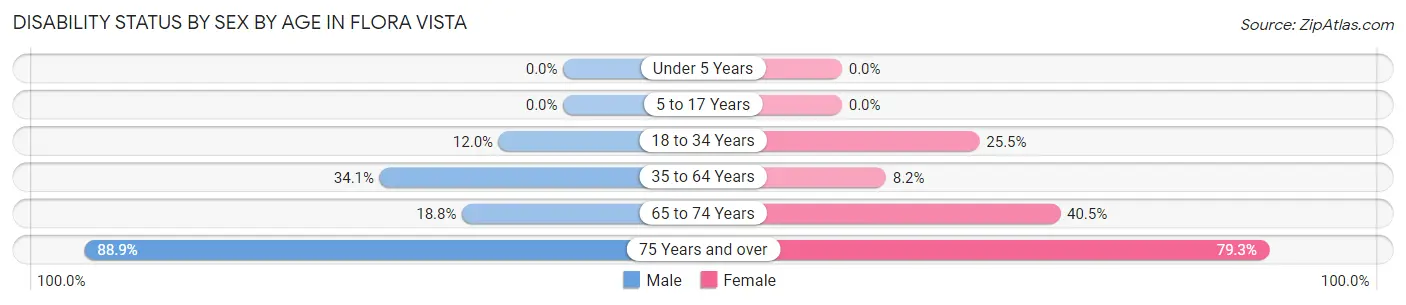
| Age Bracket | Male | Female |
| Under 5 Years | 0 (0.0%) | 0 (0.0%) |
| 5 to 17 Years | 0 (0.0%) | 0 (0.0%) |
| 18 to 34 Years | 11 (12.0%) | 12 (25.5%) |
| 35 to 64 Years | 251 (34.1%) | 59 (8.2%) |
| 65 to 74 Years | 21 (18.8%) | 32 (40.5%) |
| 75 Years and over | 72 (88.9%) | 84 (79.2%) |
Disability Class by Sex by Age in Flora Vista
Disability Class: Hearing Difficulty
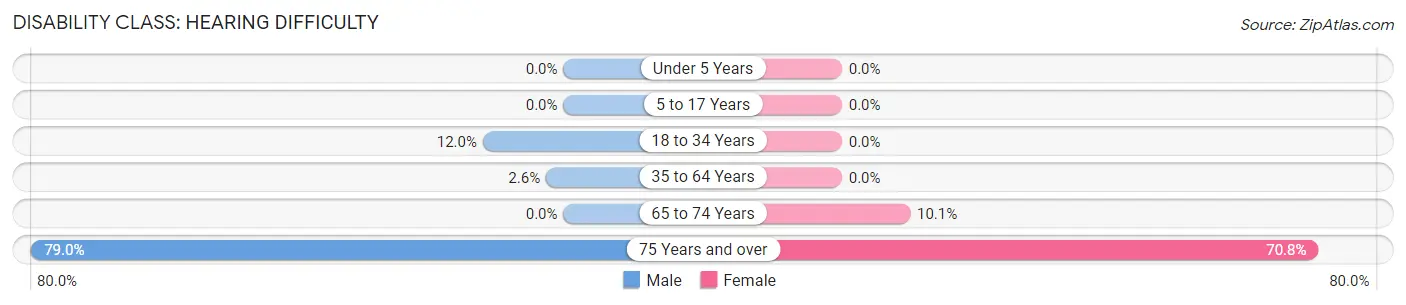
| Age Bracket | Male | Female |
| Under 5 Years | 0 (0.0%) | 0 (0.0%) |
| 5 to 17 Years | 0 (0.0%) | 0 (0.0%) |
| 18 to 34 Years | 11 (12.0%) | 0 (0.0%) |
| 35 to 64 Years | 19 (2.6%) | 0 (0.0%) |
| 65 to 74 Years | 0 (0.0%) | 8 (10.1%) |
| 75 Years and over | 64 (79.0%) | 75 (70.8%) |
Disability Class: Vision Difficulty
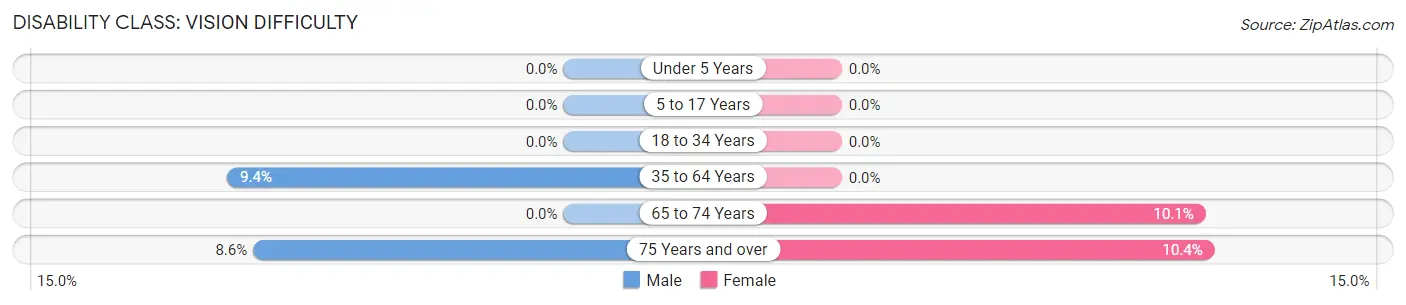
| Age Bracket | Male | Female |
| Under 5 Years | 0 (0.0%) | 0 (0.0%) |
| 5 to 17 Years | 0 (0.0%) | 0 (0.0%) |
| 18 to 34 Years | 0 (0.0%) | 0 (0.0%) |
| 35 to 64 Years | 69 (9.4%) | 0 (0.0%) |
| 65 to 74 Years | 0 (0.0%) | 8 (10.1%) |
| 75 Years and over | 7 (8.6%) | 11 (10.4%) |
Disability Class: Cognitive Difficulty

| Age Bracket | Male | Female |
| 5 to 17 Years | 0 (0.0%) | 0 (0.0%) |
| 18 to 34 Years | 0 (0.0%) | 0 (0.0%) |
| 35 to 64 Years | 72 (9.8%) | 0 (0.0%) |
| 65 to 74 Years | 0 (0.0%) | 0 (0.0%) |
| 75 Years and over | 8 (9.9%) | 50 (47.2%) |
Disability Class: Ambulatory Difficulty
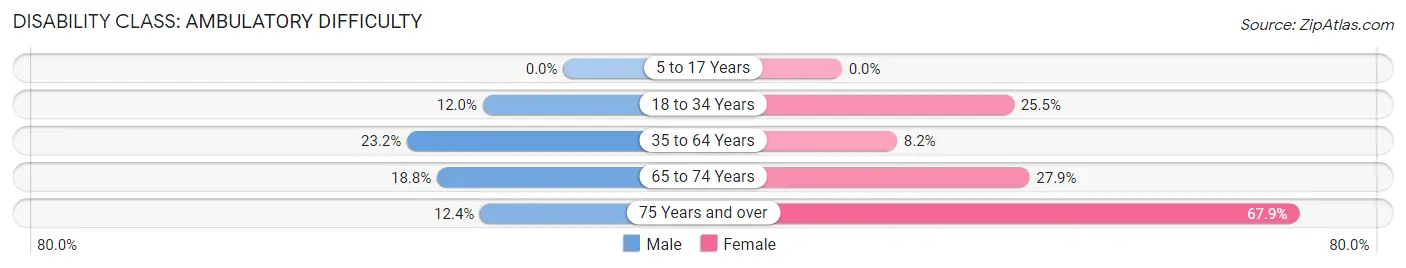
| Age Bracket | Male | Female |
| 5 to 17 Years | 0 (0.0%) | 0 (0.0%) |
| 18 to 34 Years | 11 (12.0%) | 12 (25.5%) |
| 35 to 64 Years | 171 (23.2%) | 59 (8.2%) |
| 65 to 74 Years | 21 (18.8%) | 22 (27.9%) |
| 75 Years and over | 10 (12.3%) | 72 (67.9%) |
Disability Class: Self-Care Difficulty
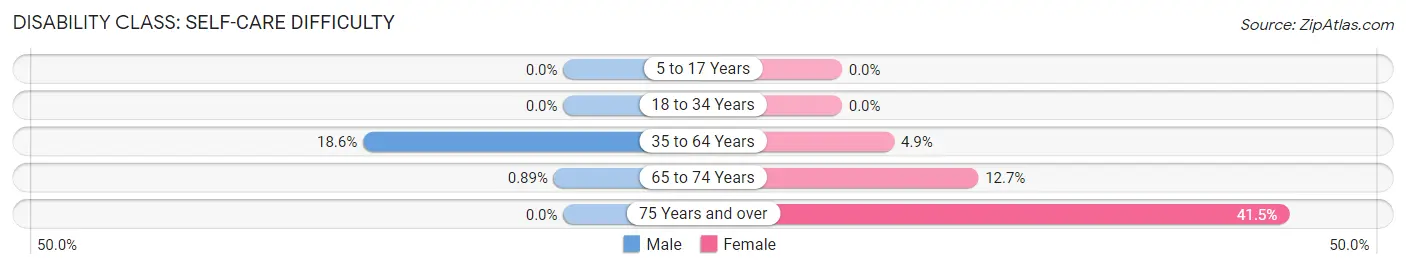
| Age Bracket | Male | Female |
| 5 to 17 Years | 0 (0.0%) | 0 (0.0%) |
| 18 to 34 Years | 0 (0.0%) | 0 (0.0%) |
| 35 to 64 Years | 137 (18.6%) | 35 (4.9%) |
| 65 to 74 Years | 1 (0.9%) | 10 (12.7%) |
| 75 Years and over | 0 (0.0%) | 44 (41.5%) |
Technology Access in Flora Vista
Computing Device Access in Flora Vista
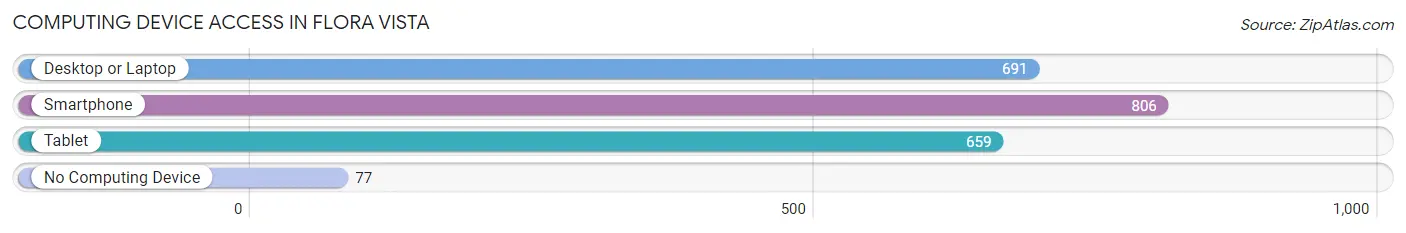
| Device Type | # Households | % Households |
| Desktop or Laptop | 691 | 72.1% |
| Smartphone | 806 | 84.1% |
| Tablet | 659 | 68.8% |
| No Computing Device | 77 | 8.0% |
| Total | 958 | 100.0% |
Internet Access in Flora Vista
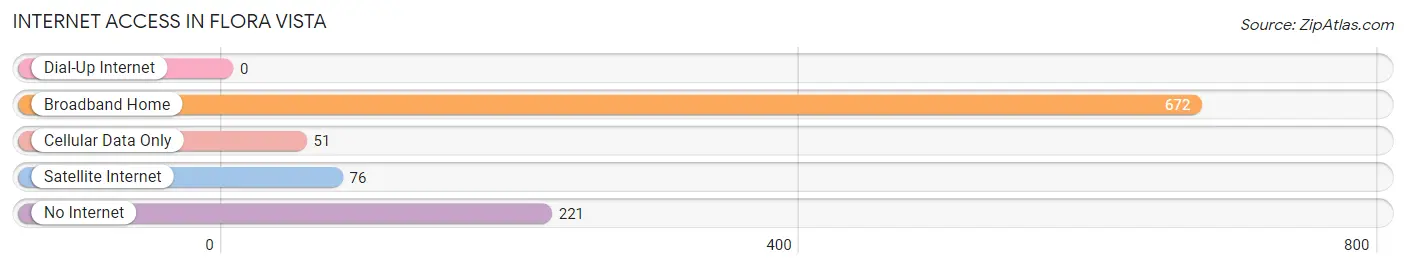
| Internet Type | # Households | % Households |
| Dial-Up Internet | 0 | 0.0% |
| Broadband Home | 672 | 70.2% |
| Cellular Data Only | 51 | 5.3% |
| Satellite Internet | 76 | 7.9% |
| No Internet | 221 | 23.1% |
| Total | 958 | 100.0% |
Flora Vista Summary
Flora Vista is a small unincorporated community located in San Juan County, New Mexico. It is situated in the Four Corners region of the United States, near the Arizona border. The community is located approximately 20 miles south of Farmington, the county seat. The population of Flora Vista was estimated to be 1,845 in 2019.
History
The area that is now Flora Vista was originally inhabited by the Navajo people. The first non-Native American settlers arrived in the area in the late 19th century. The community was originally known as "Four Corners" and was established in the early 1900s. The name was changed to Flora Vista in the 1920s.
The community was originally a farming and ranching community, but in the 1950s, the area began to experience an influx of new residents. This was due to the discovery of oil and gas in the area. The oil and gas industry has been a major contributor to the local economy ever since.
Geography
Flora Vista is located in the Four Corners region of the United States. It is situated in the northwest corner of New Mexico, near the Arizona border. The community is located approximately 20 miles south of Farmington, the county seat.
The area is characterized by a semi-arid climate, with hot summers and mild winters. The average annual temperature is approximately 60°F. The average annual precipitation is approximately 8 inches.
Economy
The economy of Flora Vista is largely based on the oil and gas industry. The area is home to several oil and gas companies, including Chevron, ConocoPhillips, and BP. The oil and gas industry is the primary source of employment in the area.
In addition to the oil and gas industry, Flora Vista is also home to several small businesses. These include restaurants, retail stores, and other services. The community is also home to a number of agricultural operations, including cattle ranches and farms.
Demographics
As of 2019, the population of Flora Vista was estimated to be 1,845. The racial makeup of the community is predominantly white (83.3%), followed by Hispanic or Latino (14.2%), Native American (1.2%), and African American (0.7%).
The median household income in Flora Vista is $45,938, which is slightly lower than the national median of $50,221. The median home value in the community is $127,400, which is slightly higher than the national median of $118,600.
Conclusion
Flora Vista is a small unincorporated community located in San Juan County, New Mexico. It is situated in the Four Corners region of the United States, near the Arizona border. The community is largely supported by the oil and gas industry, as well as small businesses and agricultural operations. The population of Flora Vista was estimated to be 1,845 in 2019, and the median household income is slightly lower than the national median.
Common Questions
What is Per Capita Income in Flora Vista?
Per Capita income in Flora Vista is $26,227.
What is the Median Family Income in Flora Vista?
Median Family Income in Flora Vista is $42,030.
What is the Median Household income in Flora Vista?
Median Household Income in Flora Vista is $41,525.
What is Income or Wage Gap in Flora Vista?
Income or Wage Gap in Flora Vista is 60.9%.
Women in Flora Vista earn 39.1 cents for every dollar earned by a man.
What is Inequality or Gini Index in Flora Vista?
Inequality or Gini Index in Flora Vista is 0.45.
What is the Total Population of Flora Vista?
Total Population of Flora Vista is 2,346.
What is the Total Male Population of Flora Vista?
Total Male Population of Flora Vista is 1,212.
What is the Total Female Population of Flora Vista?
Total Female Population of Flora Vista is 1,134.
What is the Ratio of Males per 100 Females in Flora Vista?
There are 106.88 Males per 100 Females in Flora Vista.
What is the Ratio of Females per 100 Males in Flora Vista?
There are 93.56 Females per 100 Males in Flora Vista.
What is the Median Population Age in Flora Vista?
Median Population Age in Flora Vista is 53.1 Years.
What is the Average Family Size in Flora Vista
Average Family Size in Flora Vista is 2.7 People.
What is the Average Household Size in Flora Vista
Average Household Size in Flora Vista is 2.5 People.
How Large is the Labor Force in Flora Vista?
There are 935 People in the Labor Forcein in Flora Vista.
What is the Percentage of People in the Labor Force in Flora Vista?
46.6% of People are in the Labor Force in Flora Vista.