Espanola, NM Map & Demographics
Espanola Overview
$25,322
PER CAPITA INCOME
$59,242
AVG FAMILY INCOME
$44,427
AVG HOUSEHOLD INCOME
31.4%
WAGE / INCOME GAP [ % ]
68.6¢/ $1
WAGE / INCOME GAP [ $ ]
$9,372
FAMILY INCOME DEFICIT
0.47
INEQUALITY / GINI INDEX
10,473
TOTAL POPULATION
5,128
MALE POPULATION
5,345
FEMALE POPULATION
95.94
MALES / 100 FEMALES
104.23
FEMALES / 100 MALES
35.6
MEDIAN AGE
3.7
AVG FAMILY SIZE
2.7
AVG HOUSEHOLD SIZE
4,455
LABOR FORCE [ PEOPLE ]
55.3%
PERCENT IN LABOR FORCE
5.3%
UNEMPLOYMENT RATE
Espanola Zip Codes
Espanola Area Codes
Income in Espanola
Income Overview in Espanola
Per Capita Income in Espanola is $25,322, while median incomes of families and households are $59,242 and $44,427 respectively.
| Characteristic | Number | Measure |
| Per Capita Income | 10,473 | $25,322 |
| Median Family Income | 2,204 | $59,242 |
| Mean Family Income | 2,204 | $74,042 |
| Median Household Income | 3,899 | $44,427 |
| Mean Household Income | 3,899 | $61,943 |
| Income Deficit | 2,204 | $9,372 |
| Wage / Income Gap (%) | 10,473 | 31.38% |
| Wage / Income Gap ($) | 10,473 | 68.62¢ per $1 |
| Gini / Inequality Index | 10,473 | 0.47 |
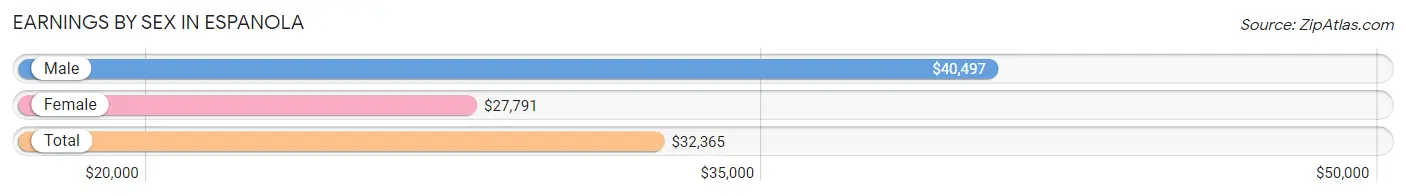
Earnings by Sex in Espanola
Average Earnings in Espanola are $32,365, $40,497 for men and $27,791 for women, a difference of 31.4%.
| Sex | Number | Average Earnings |
| Male | 2,370 (53.3%) | $40,497 |
| Female | 2,080 (46.7%) | $27,791 |
| Total | 4,450 (100.0%) | $32,365 |
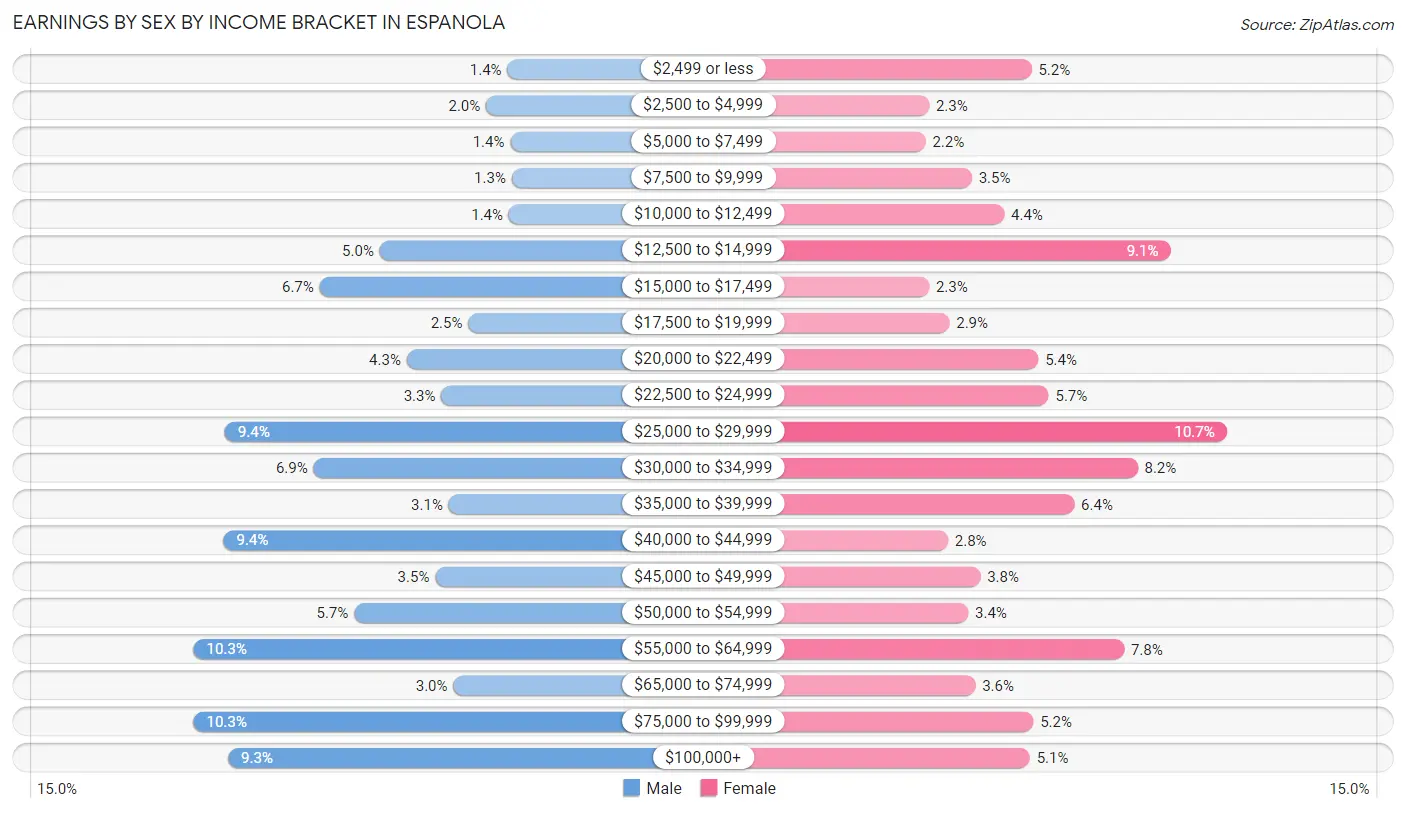
Earnings by Sex by Income Bracket in Espanola
The most common earnings brackets in Espanola are $55,000 to $64,999 for men (243 | 10.2%) and $25,000 to $29,999 for women (222 | 10.7%).
| Income | Male | Female |
| $2,499 or less | 34 (1.4%) | 108 (5.2%) |
| $2,500 to $4,999 | 48 (2.0%) | 48 (2.3%) |
| $5,000 to $7,499 | 32 (1.3%) | 46 (2.2%) |
| $7,500 to $9,999 | 31 (1.3%) | 73 (3.5%) |
| $10,000 to $12,499 | 33 (1.4%) | 92 (4.4%) |
| $12,500 to $14,999 | 119 (5.0%) | 189 (9.1%) |
| $15,000 to $17,499 | 159 (6.7%) | 48 (2.3%) |
| $17,500 to $19,999 | 60 (2.5%) | 60 (2.9%) |
| $20,000 to $22,499 | 101 (4.3%) | 112 (5.4%) |
| $22,500 to $24,999 | 78 (3.3%) | 118 (5.7%) |
| $25,000 to $29,999 | 222 (9.4%) | 222 (10.7%) |
| $30,000 to $34,999 | 163 (6.9%) | 170 (8.2%) |
| $35,000 to $39,999 | 73 (3.1%) | 133 (6.4%) |
| $40,000 to $44,999 | 223 (9.4%) | 59 (2.8%) |
| $45,000 to $49,999 | 82 (3.5%) | 78 (3.7%) |
| $50,000 to $54,999 | 136 (5.7%) | 71 (3.4%) |
| $55,000 to $64,999 | 243 (10.2%) | 162 (7.8%) |
| $65,000 to $74,999 | 70 (2.9%) | 75 (3.6%) |
| $75,000 to $99,999 | 243 (10.2%) | 109 (5.2%) |
| $100,000+ | 220 (9.3%) | 107 (5.1%) |
| Total | 2,370 (100.0%) | 2,080 (100.0%) |
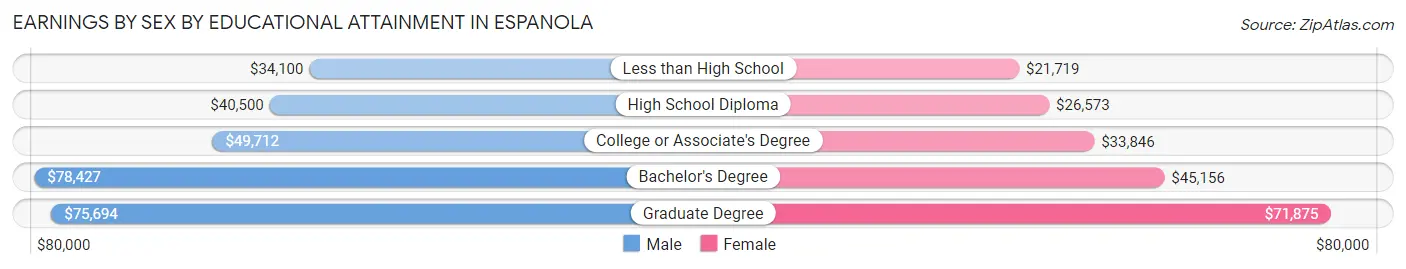
Earnings by Sex by Educational Attainment in Espanola
Average earnings in Espanola are $44,118 for men and $30,406 for women, a difference of 31.1%. Men with an educational attainment of bachelor's degree enjoy the highest average annual earnings of $78,427, while those with less than high school education earn the least with $34,100. Women with an educational attainment of graduate degree earn the most with the average annual earnings of $71,875, while those with less than high school education have the smallest earnings of $21,719.
| Educational Attainment | Male Income | Female Income |
| Less than High School | $34,100 | $21,719 |
| High School Diploma | $40,500 | $26,573 |
| College or Associate's Degree | $49,712 | $33,846 |
| Bachelor's Degree | $78,427 | $45,156 |
| Graduate Degree | $75,694 | $71,875 |
| Total | $44,118 | $30,406 |
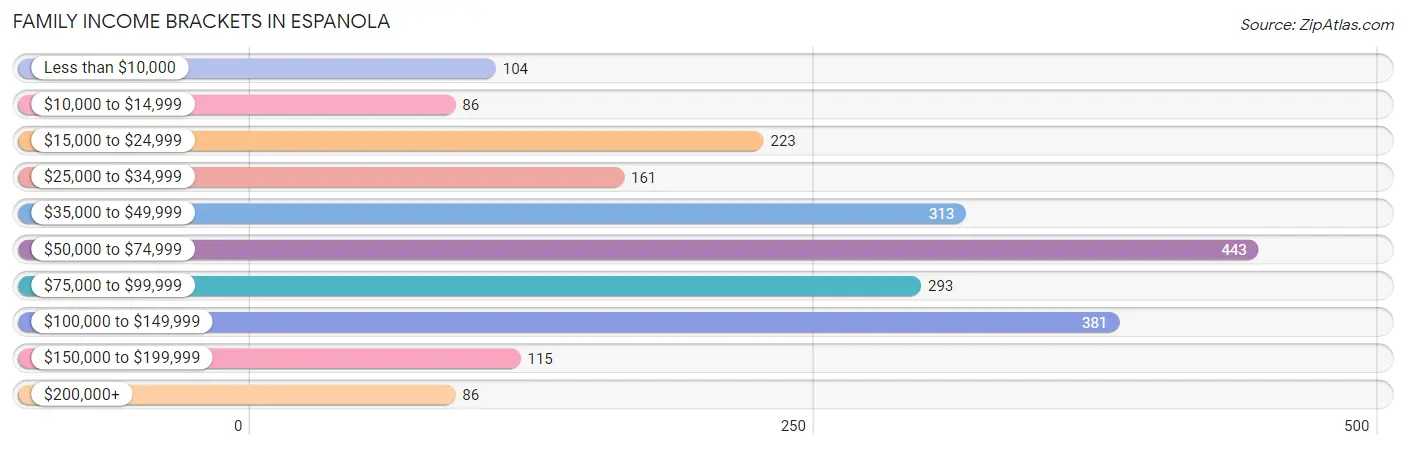
Family Income in Espanola
Family Income Brackets in Espanola
According to the Espanola family income data, there are 443 families falling into the $50,000 to $74,999 income range, which is the most common income bracket and makes up 20.1% of all families. Conversely, the $10,000 to $14,999 income bracket is the least frequent group with only 86 families (3.9%) belonging to this category.
| Income Bracket | # Families | % Families |
| Less than $10,000 | 104 | 4.7% |
| $10,000 to $14,999 | 86 | 3.9% |
| $15,000 to $24,999 | 223 | 10.1% |
| $25,000 to $34,999 | 161 | 7.3% |
| $35,000 to $49,999 | 313 | 14.2% |
| $50,000 to $74,999 | 443 | 20.1% |
| $75,000 to $99,999 | 293 | 13.3% |
| $100,000 to $149,999 | 381 | 17.3% |
| $150,000 to $199,999 | 115 | 5.2% |
| $200,000+ | 86 | 3.9% |
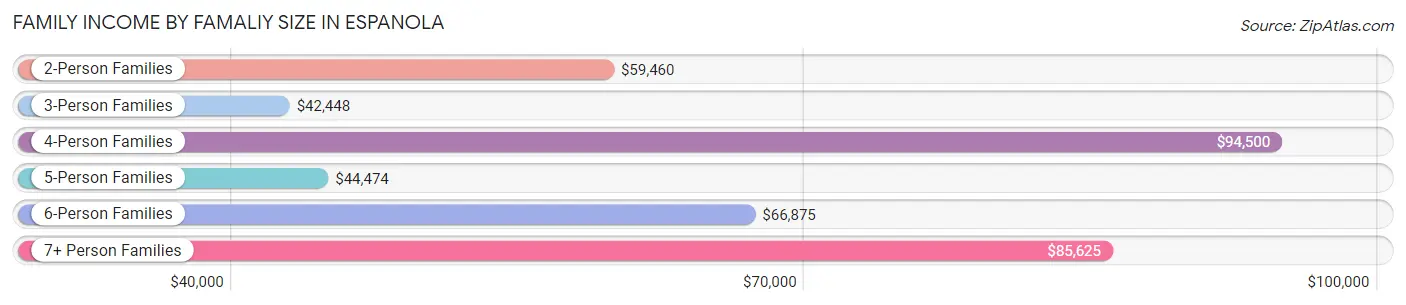
Family Income by Famaliy Size in Espanola
4-person families (390 | 17.7%) account for the highest median family income in Espanola with $94,500 per family, while 2-person families (1,013 | 46.0%) have the highest median income of $29,730 per family member.
| Income Bracket | # Families | Median Income |
| 2-Person Families | 1,013 (46.0%) | $59,460 |
| 3-Person Families | 556 (25.2%) | $42,448 |
| 4-Person Families | 390 (17.7%) | $94,500 |
| 5-Person Families | 172 (7.8%) | $44,474 |
| 6-Person Families | 58 (2.6%) | $66,875 |
| 7+ Person Families | 15 (0.7%) | $85,625 |
| Total | 2,204 (100.0%) | $59,242 |
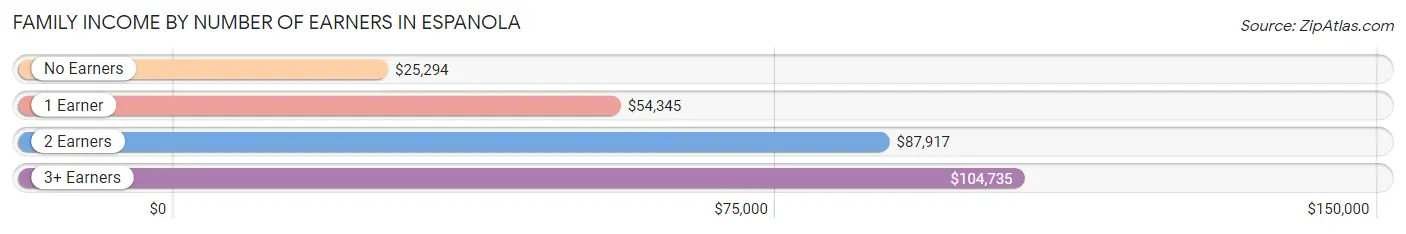
Family Income by Number of Earners in Espanola
The median family income in Espanola is $59,242, with families comprising 3+ earners (169) having the highest median family income of $104,735, while families with no earners (552) have the lowest median family income of $25,294, accounting for 7.7% and 25.1% of families, respectively.
| Number of Earners | # Families | Median Income |
| No Earners | 552 (25.1%) | $25,294 |
| 1 Earner | 771 (35.0%) | $54,345 |
| 2 Earners | 712 (32.3%) | $87,917 |
| 3+ Earners | 169 (7.7%) | $104,735 |
| Total | 2,204 (100.0%) | $59,242 |
Household Income in Espanola
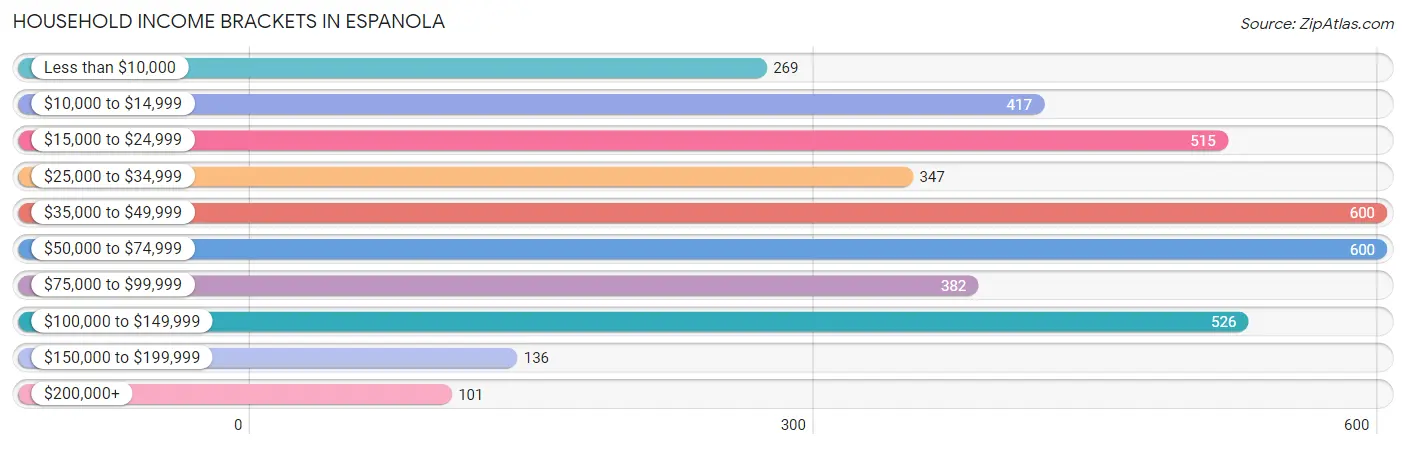
Household Income Brackets in Espanola
With 600 households falling in the category, the $35,000 to $49,999 income range is the most frequent in Espanola, accounting for 15.4% of all households. In contrast, only 101 households (2.6%) fall into the $200,000+ income bracket, making it the least populous group.
| Income Bracket | # Households | % Households |
| Less than $10,000 | 269 | 6.9% |
| $10,000 to $14,999 | 417 | 10.7% |
| $15,000 to $24,999 | 515 | 13.2% |
| $25,000 to $34,999 | 347 | 8.9% |
| $35,000 to $49,999 | 600 | 15.4% |
| $50,000 to $74,999 | 600 | 15.4% |
| $75,000 to $99,999 | 382 | 9.8% |
| $100,000 to $149,999 | 526 | 13.5% |
| $150,000 to $199,999 | 136 | 3.5% |
| $200,000+ | 101 | 2.6% |
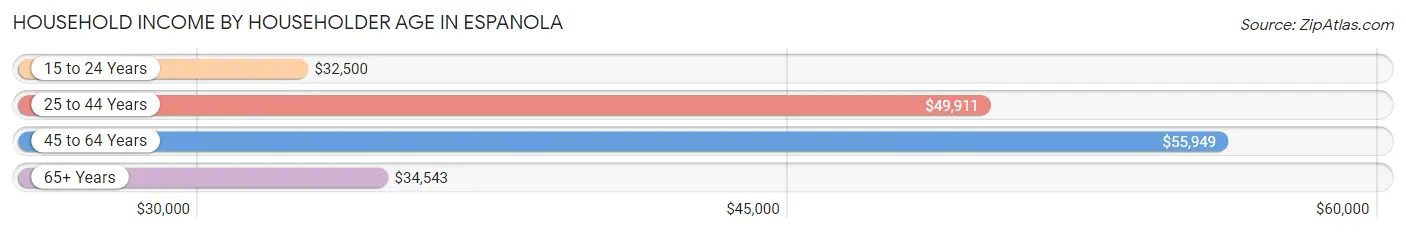
Household Income by Householder Age in Espanola
The median household income in Espanola is $44,427, with the highest median household income of $55,949 found in the 45 to 64 years age bracket for the primary householder. A total of 1,427 households (36.6%) fall into this category. Meanwhile, the 15 to 24 years age bracket for the primary householder has the lowest median household income of $32,500, with 88 households (2.3%) in this group.
| Income Bracket | # Households | Median Income |
| 15 to 24 Years | 88 (2.3%) | $32,500 |
| 25 to 44 Years | 1,093 (28.0%) | $49,911 |
| 45 to 64 Years | 1,427 (36.6%) | $55,949 |
| 65+ Years | 1,291 (33.1%) | $34,543 |
| Total | 3,899 (100.0%) | $44,427 |
Poverty in Espanola
Income Below Poverty by Sex and Age in Espanola
With 16.7% poverty level for males and 21.0% for females among the residents of Espanola, 16 and 17 year old males and 6 to 11 year old females are the most vulnerable to poverty, with 43 males (41.3%) and 153 females (32.7%) in their respective age groups living below the poverty level.
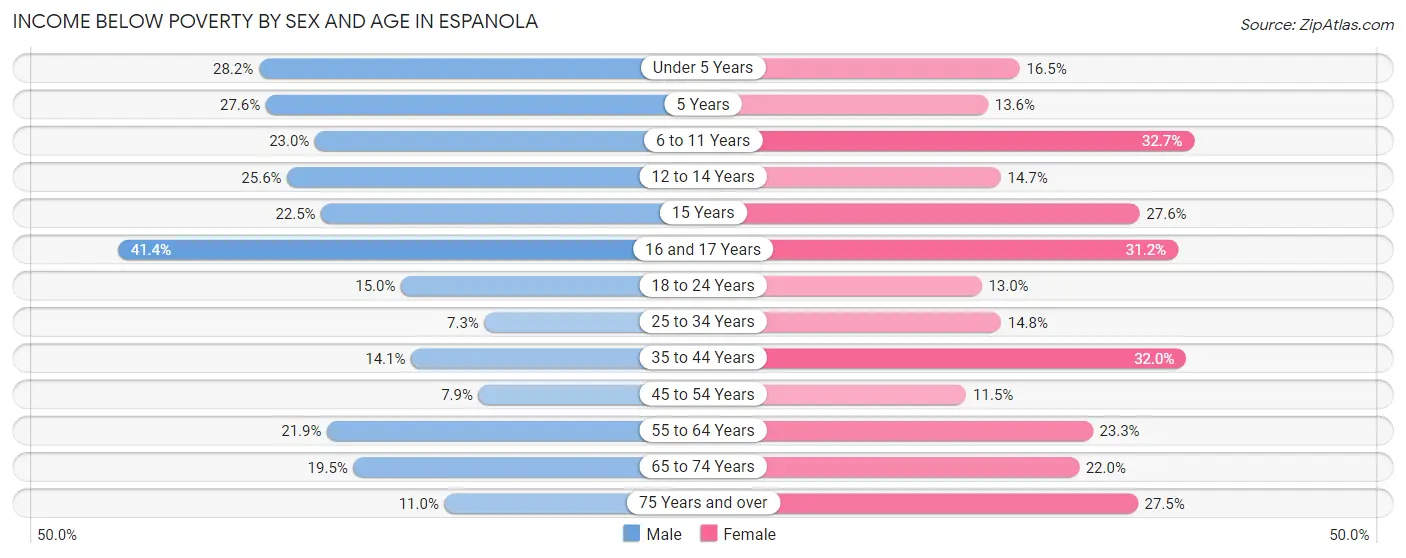
| Age Bracket | Male | Female |
| Under 5 Years | 72 (28.2%) | 48 (16.5%) |
| 5 Years | 8 (27.6%) | 21 (13.6%) |
| 6 to 11 Years | 126 (23.0%) | 153 (32.7%) |
| 12 to 14 Years | 42 (25.6%) | 42 (14.7%) |
| 15 Years | 22 (22.5%) | 29 (27.6%) |
| 16 and 17 Years | 43 (41.3%) | 34 (31.2%) |
| 18 to 24 Years | 102 (15.0%) | 77 (13.0%) |
| 25 to 34 Years | 50 (7.3%) | 84 (14.8%) |
| 35 to 44 Years | 70 (14.1%) | 179 (32.0%) |
| 45 to 54 Years | 46 (7.9%) | 68 (11.5%) |
| 55 to 64 Years | 133 (21.9%) | 137 (23.3%) |
| 65 to 74 Years | 101 (19.5%) | 117 (22.0%) |
| 75 Years and over | 37 (11.0%) | 129 (27.5%) |
| Total | 852 (16.7%) | 1,118 (21.0%) |
Income Above Poverty by Sex and Age in Espanola
According to the poverty statistics in Espanola, males aged 25 to 34 years and females aged 45 to 54 years are the age groups that are most secure financially, with 92.7% of males and 88.5% of females in these age groups living above the poverty line.
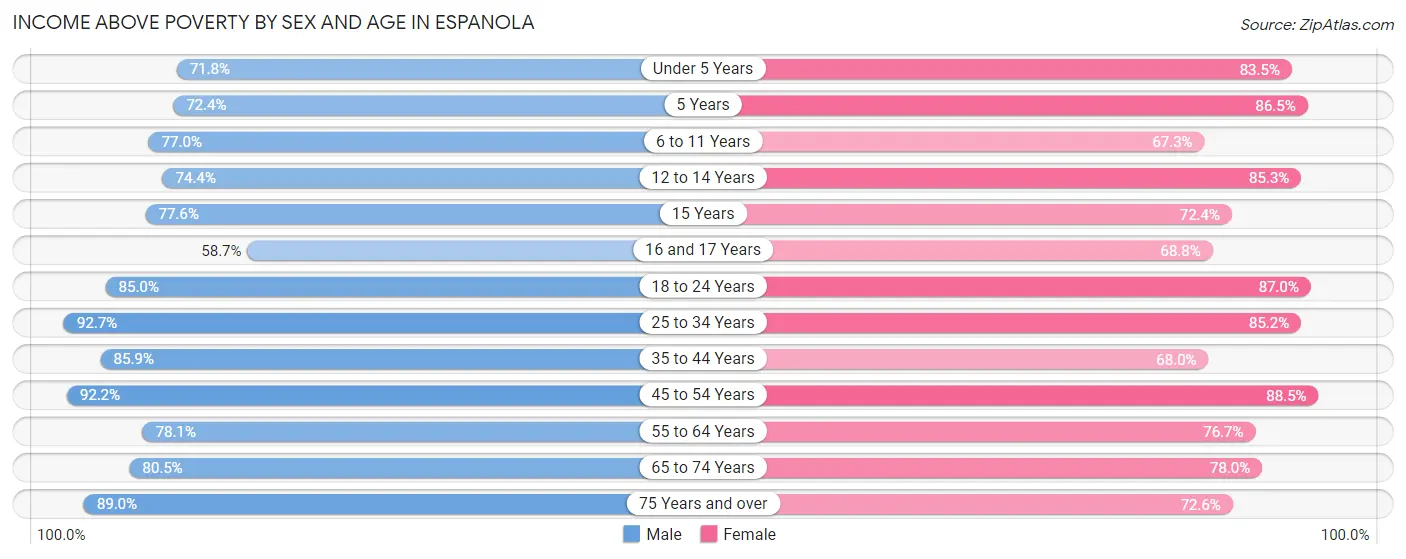
| Age Bracket | Male | Female |
| Under 5 Years | 183 (71.8%) | 243 (83.5%) |
| 5 Years | 21 (72.4%) | 134 (86.5%) |
| 6 to 11 Years | 421 (77.0%) | 315 (67.3%) |
| 12 to 14 Years | 122 (74.4%) | 243 (85.3%) |
| 15 Years | 76 (77.5%) | 76 (72.4%) |
| 16 and 17 Years | 61 (58.7%) | 75 (68.8%) |
| 18 to 24 Years | 576 (85.0%) | 517 (87.0%) |
| 25 to 34 Years | 635 (92.7%) | 485 (85.2%) |
| 35 to 44 Years | 426 (85.9%) | 381 (68.0%) |
| 45 to 54 Years | 540 (92.1%) | 521 (88.5%) |
| 55 to 64 Years | 474 (78.1%) | 452 (76.7%) |
| 65 to 74 Years | 418 (80.5%) | 415 (78.0%) |
| 75 Years and over | 299 (89.0%) | 341 (72.6%) |
| Total | 4,252 (83.3%) | 4,198 (79.0%) |
Income Below Poverty Among Married-Couple Families in Espanola
The poverty statistics for married-couple families in Espanola show that 8.0% or 92 of the total 1,153 families live below the poverty line. Families with 3 or 4 children have the highest poverty rate of 26.4%, comprising of 19 families. On the other hand, families with 5 or more children have the lowest poverty rate of 0.0%, which includes 0 families.
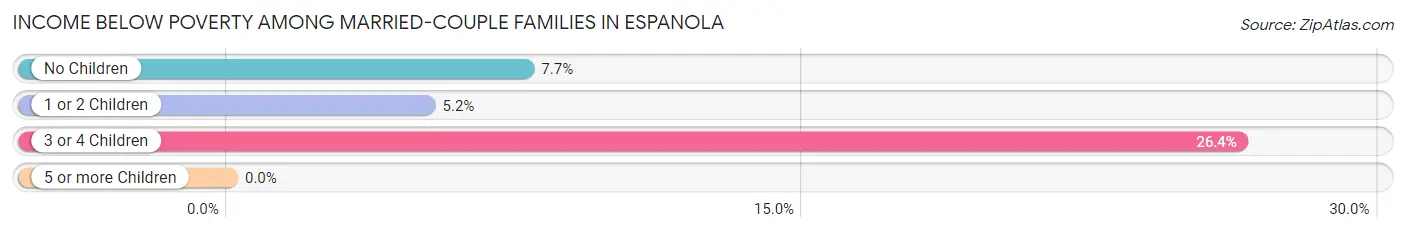
| Children | Above Poverty | Below Poverty |
| No Children | 620 (92.3%) | 52 (7.7%) |
| 1 or 2 Children | 386 (94.8%) | 21 (5.2%) |
| 3 or 4 Children | 53 (73.6%) | 19 (26.4%) |
| 5 or more Children | 2 (100.0%) | 0 (0.0%) |
| Total | 1,061 (92.0%) | 92 (8.0%) |
Income Below Poverty Among Single-Parent Households in Espanola
According to the poverty data in Espanola, 32.5% or 100 single-father households and 26.0% or 193 single-mother households are living below the poverty line. Among single-father households, those with 1 or 2 children have the highest poverty rate, with 88 households (40.4%) experiencing poverty. Likewise, among single-mother households, those with 5 or more children have the highest poverty rate, with 9 households (100.0%) falling below the poverty line.
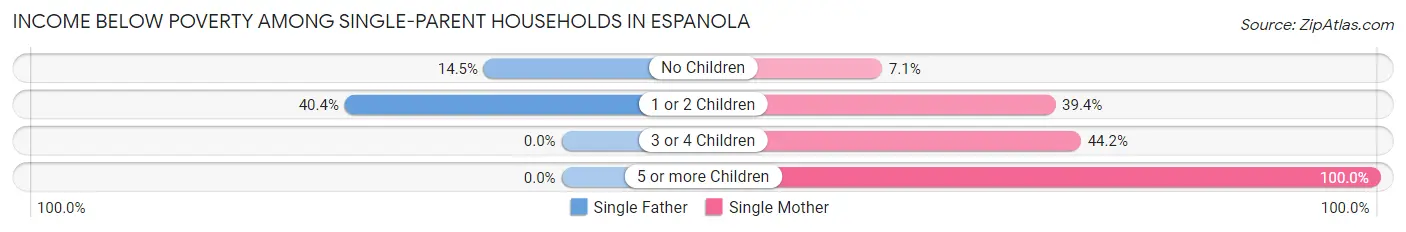
| Children | Single Father | Single Mother |
| No Children | 12 (14.5%) | 24 (7.1%) |
| 1 or 2 Children | 88 (40.4%) | 126 (39.4%) |
| 3 or 4 Children | 0 (0.0%) | 34 (44.2%) |
| 5 or more Children | 0 (0.0%) | 9 (100.0%) |
| Total | 100 (32.5%) | 193 (26.0%) |
Income Below Poverty Among Married-Couple vs Single-Parent Households in Espanola
The poverty data for Espanola shows that 92 of the married-couple family households (8.0%) and 293 of the single-parent households (27.9%) are living below the poverty level. Within the married-couple family households, those with 3 or 4 children have the highest poverty rate, with 19 households (26.4%) falling below the poverty line. Among the single-parent households, those with 5 or more children have the highest poverty rate, with 9 household (100.0%) living below poverty.
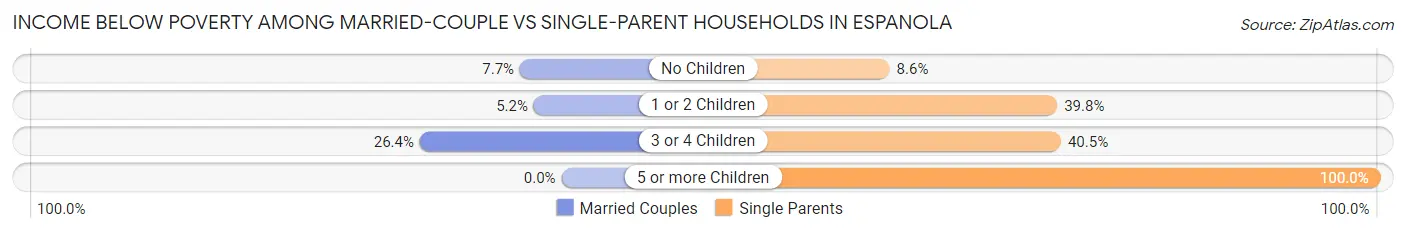
| Children | Married-Couple Families | Single-Parent Households |
| No Children | 52 (7.7%) | 36 (8.6%) |
| 1 or 2 Children | 21 (5.2%) | 214 (39.8%) |
| 3 or 4 Children | 19 (26.4%) | 34 (40.5%) |
| 5 or more Children | 0 (0.0%) | 9 (100.0%) |
| Total | 92 (8.0%) | 293 (27.9%) |
Race in Espanola
The most populous races in Espanola are Hispanic or Latino (8,882 | 84.8%), Some other Race (4,695 | 44.8%), and White / Caucasian (4,133 | 39.5%).
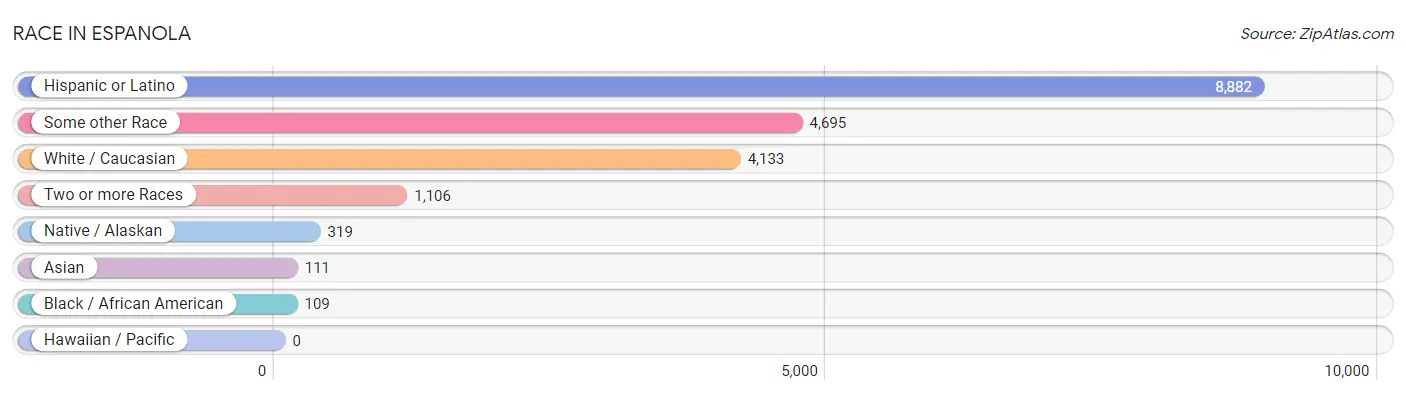
| Race | # Population | % Population |
| Asian | 111 | 1.1% |
| Black / African American | 109 | 1.0% |
| Hawaiian / Pacific | 0 | 0.0% |
| Hispanic or Latino | 8,882 | 84.8% |
| Native / Alaskan | 319 | 3.0% |
| White / Caucasian | 4,133 | 39.5% |
| Two or more Races | 1,106 | 10.6% |
| Some other Race | 4,695 | 44.8% |
| Total | 10,473 | 100.0% |
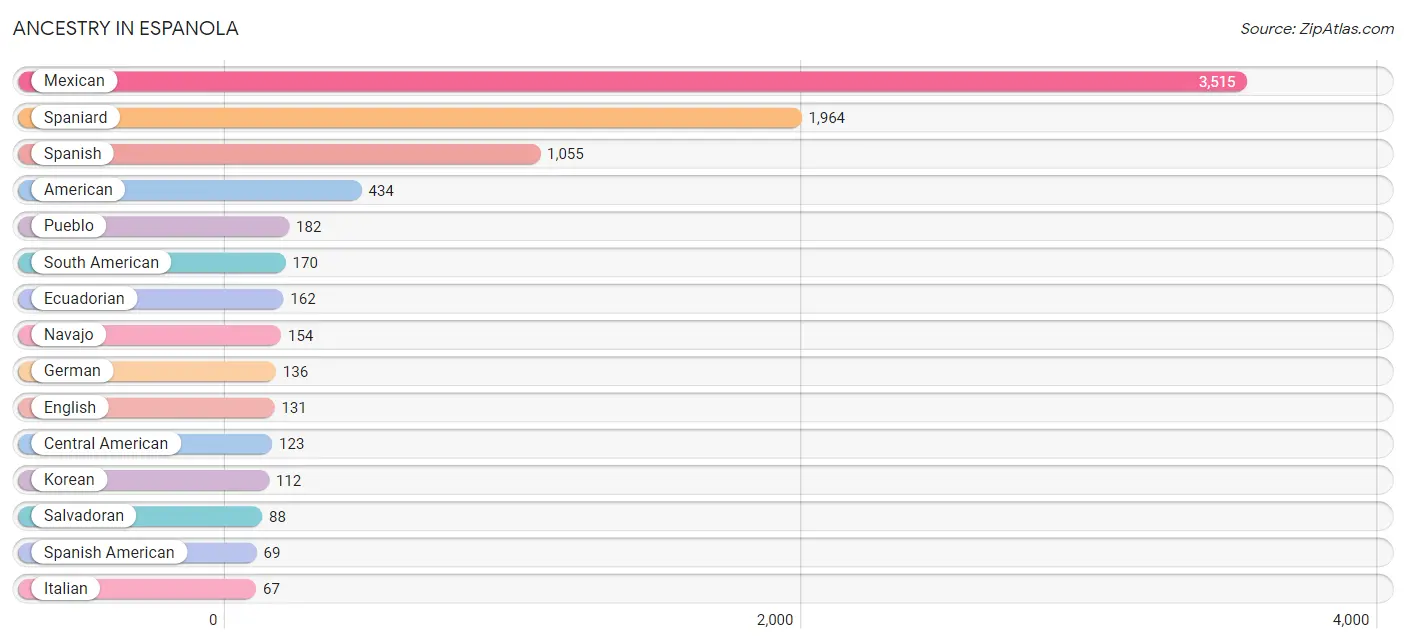
Ancestry in Espanola
The most populous ancestries reported in Espanola are Mexican (3,515 | 33.6%), Spaniard (1,964 | 18.8%), Spanish (1,055 | 10.1%), American (434 | 4.1%), and Pueblo (182 | 1.7%), together accounting for 68.3% of all Espanola residents.
| Ancestry | # Population | % Population |
| African | 16 | 0.2% |
| American | 434 | 4.1% |
| Apache | 10 | 0.1% |
| Australian | 3 | 0.0% |
| Barbadian | 9 | 0.1% |
| British | 37 | 0.4% |
| Central American | 123 | 1.2% |
| Cherokee | 10 | 0.1% |
| Colombian | 4 | 0.0% |
| Comanche | 3 | 0.0% |
| Costa Rican | 2 | 0.0% |
| Cuban | 4 | 0.0% |
| Danish | 6 | 0.1% |
| Dutch | 25 | 0.2% |
| Eastern European | 3 | 0.0% |
| Ecuadorian | 162 | 1.5% |
| English | 131 | 1.3% |
| European | 9 | 0.1% |
| Finnish | 4 | 0.0% |
| French | 29 | 0.3% |
| French Canadian | 4 | 0.0% |
| German | 136 | 1.3% |
| Greek | 8 | 0.1% |
| Guatemalan | 33 | 0.3% |
| Hopi | 3 | 0.0% |
| Indian (Asian) | 16 | 0.2% |
| Irish | 57 | 0.5% |
| Italian | 67 | 0.6% |
| Korean | 112 | 1.1% |
| Mexican | 3,515 | 33.6% |
| Mexican American Indian | 2 | 0.0% |
| Navajo | 154 | 1.5% |
| Norwegian | 3 | 0.0% |
| Polish | 3 | 0.0% |
| Pueblo | 182 | 1.7% |
| Puerto Rican | 15 | 0.1% |
| Russian | 7 | 0.1% |
| Salvadoran | 88 | 0.8% |
| Scotch-Irish | 28 | 0.3% |
| Scottish | 29 | 0.3% |
| South American | 170 | 1.6% |
| Spaniard | 1,964 | 18.8% |
| Spanish | 1,055 | 10.1% |
| Spanish American | 69 | 0.7% |
| Subsaharan African | 16 | 0.2% |
| Swedish | 6 | 0.1% |
| Swiss | 25 | 0.2% |
| Thai | 4 | 0.0% |
| Welsh | 7 | 0.1% | View All 49 Rows |
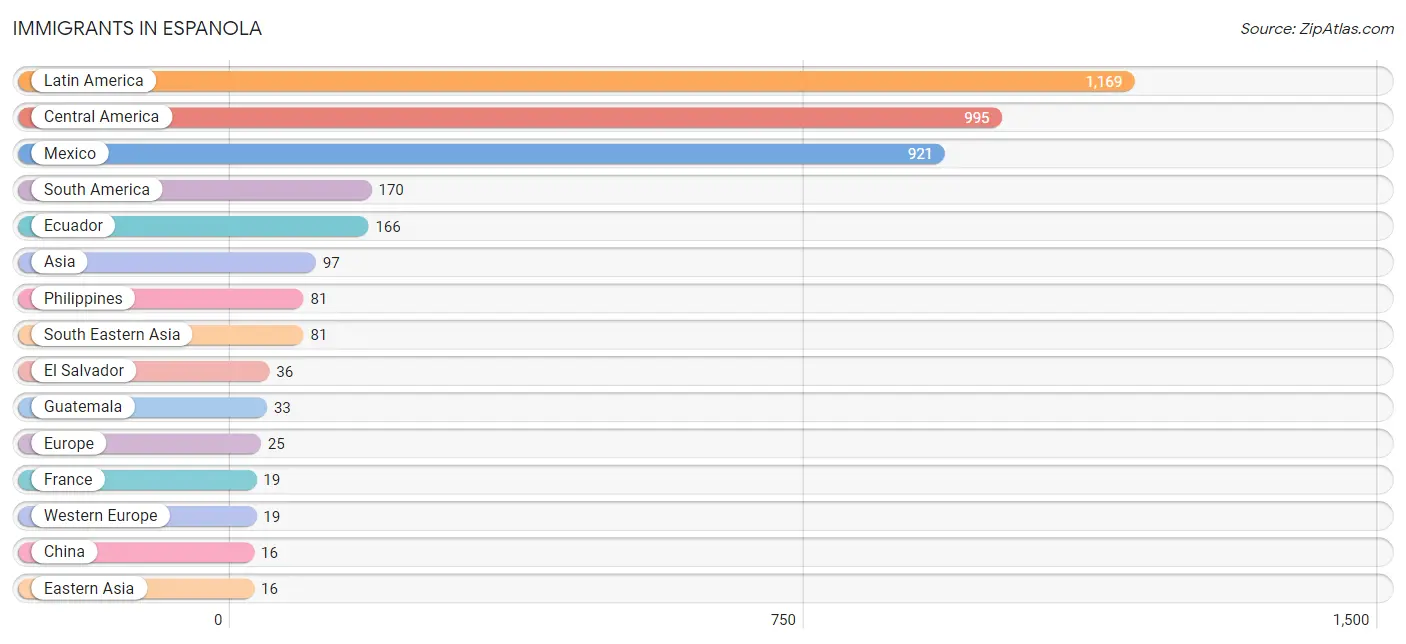
Immigrants in Espanola
The most numerous immigrant groups reported in Espanola came from Latin America (1,169 | 11.2%), Central America (995 | 9.5%), Mexico (921 | 8.8%), South America (170 | 1.6%), and Ecuador (166 | 1.6%), together accounting for 32.7% of all Espanola residents.
| Immigration Origin | # Population | % Population |
| Asia | 97 | 0.9% |
| Australia | 3 | 0.0% |
| Caribbean | 4 | 0.0% |
| Central America | 995 | 9.5% |
| China | 16 | 0.2% |
| Colombia | 4 | 0.0% |
| Costa Rica | 2 | 0.0% |
| Cuba | 4 | 0.0% |
| Eastern Asia | 16 | 0.2% |
| Ecuador | 166 | 1.6% |
| El Salvador | 36 | 0.3% |
| Europe | 25 | 0.2% |
| France | 19 | 0.2% |
| Guatemala | 33 | 0.3% |
| Latin America | 1,169 | 11.2% |
| Mexico | 921 | 8.8% |
| Nicaragua | 3 | 0.0% |
| Northern Europe | 6 | 0.1% |
| Oceania | 3 | 0.0% |
| Philippines | 81 | 0.8% |
| South America | 170 | 1.6% |
| South Eastern Asia | 81 | 0.8% |
| Western Europe | 19 | 0.2% | View All 23 Rows |
Sex and Age in Espanola
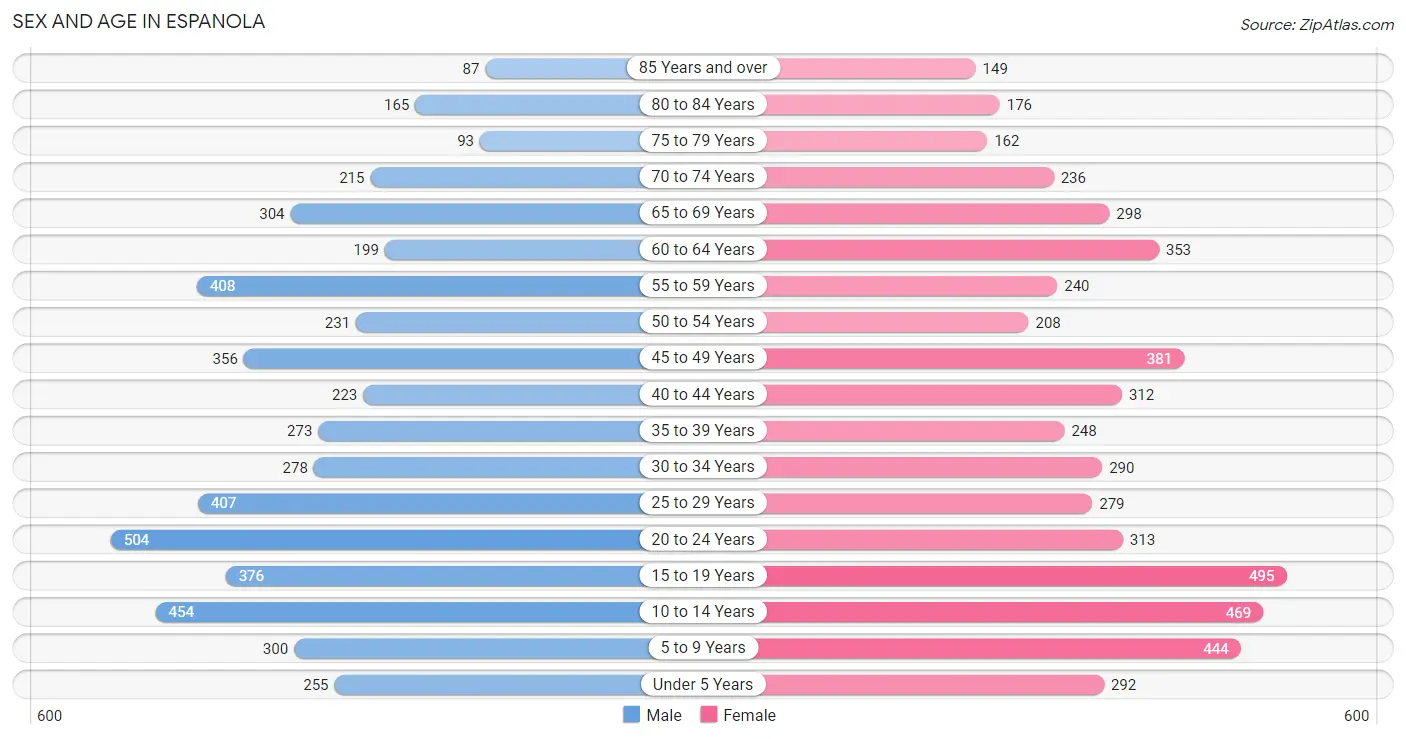
Sex and Age in Espanola
The most populous age groups in Espanola are 20 to 24 Years (504 | 9.8%) for men and 15 to 19 Years (495 | 9.3%) for women.
| Age Bracket | Male | Female |
| Under 5 Years | 255 (5.0%) | 292 (5.5%) |
| 5 to 9 Years | 300 (5.9%) | 444 (8.3%) |
| 10 to 14 Years | 454 (8.8%) | 469 (8.8%) |
| 15 to 19 Years | 376 (7.3%) | 495 (9.3%) |
| 20 to 24 Years | 504 (9.8%) | 313 (5.9%) |
| 25 to 29 Years | 407 (7.9%) | 279 (5.2%) |
| 30 to 34 Years | 278 (5.4%) | 290 (5.4%) |
| 35 to 39 Years | 273 (5.3%) | 248 (4.6%) |
| 40 to 44 Years | 223 (4.3%) | 312 (5.8%) |
| 45 to 49 Years | 356 (6.9%) | 381 (7.1%) |
| 50 to 54 Years | 231 (4.5%) | 208 (3.9%) |
| 55 to 59 Years | 408 (8.0%) | 240 (4.5%) |
| 60 to 64 Years | 199 (3.9%) | 353 (6.6%) |
| 65 to 69 Years | 304 (5.9%) | 298 (5.6%) |
| 70 to 74 Years | 215 (4.2%) | 236 (4.4%) |
| 75 to 79 Years | 93 (1.8%) | 162 (3.0%) |
| 80 to 84 Years | 165 (3.2%) | 176 (3.3%) |
| 85 Years and over | 87 (1.7%) | 149 (2.8%) |
| Total | 5,128 (100.0%) | 5,345 (100.0%) |
Families and Households in Espanola
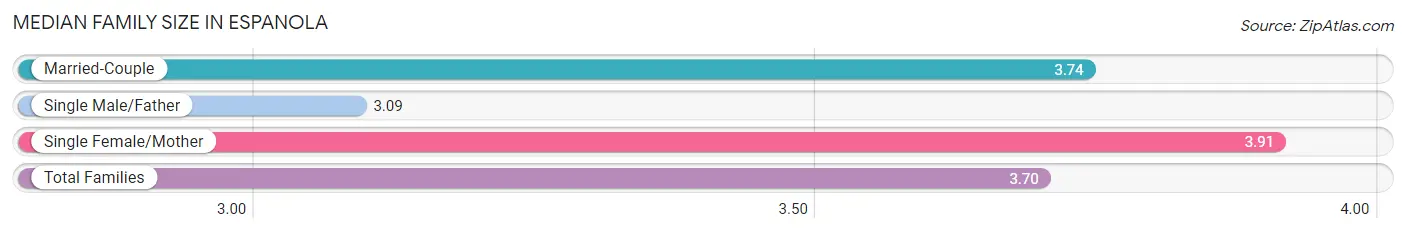
Median Family Size in Espanola
The median family size in Espanola is 3.70 persons per family, with single female/mother families (743 | 33.7%) accounting for the largest median family size of 3.91 persons per family. On the other hand, single male/father families (308 | 14.0%) represent the smallest median family size with 3.09 persons per family.
| Family Type | # Families | Family Size |
| Married-Couple | 1,153 (52.3%) | 3.74 |
| Single Male/Father | 308 (14.0%) | 3.09 |
| Single Female/Mother | 743 (33.7%) | 3.91 |
| Total Families | 2,204 (100.0%) | 3.70 |
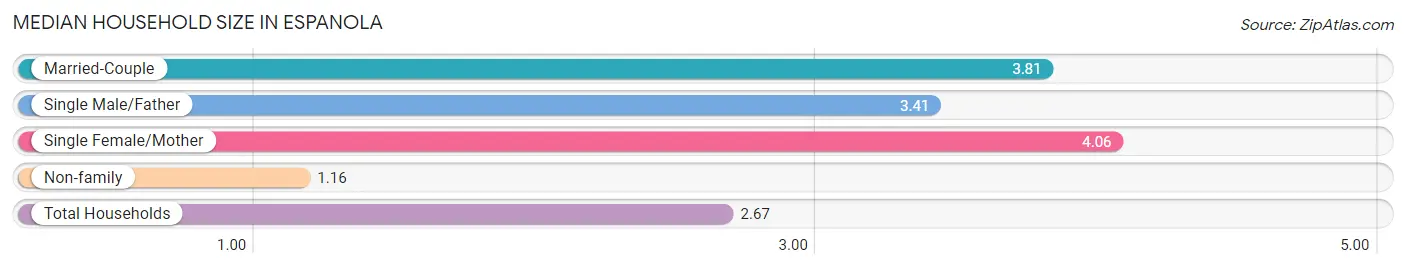
Median Household Size in Espanola
The median household size in Espanola is 2.67 persons per household, with single female/mother households (743 | 19.1%) accounting for the largest median household size of 4.06 persons per household. non-family households (1,695 | 43.5%) represent the smallest median household size with 1.16 persons per household.
| Household Type | # Households | Household Size |
| Married-Couple | 1,153 (29.6%) | 3.81 |
| Single Male/Father | 308 (7.9%) | 3.41 |
| Single Female/Mother | 743 (19.1%) | 4.06 |
| Non-family | 1,695 (43.5%) | 1.16 |
| Total Households | 3,899 (100.0%) | 2.67 |
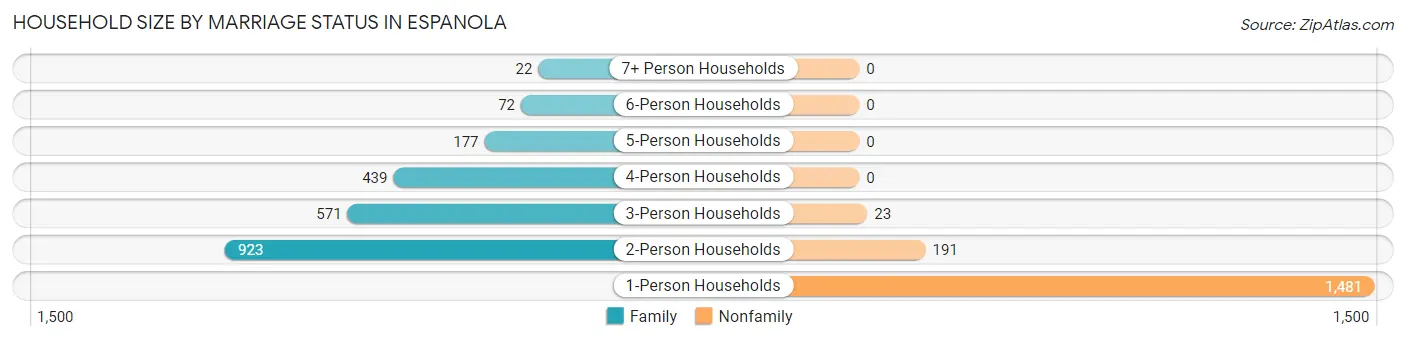
Household Size by Marriage Status in Espanola
Out of a total of 3,899 households in Espanola, 2,204 (56.5%) are family households, while 1,695 (43.5%) are nonfamily households. The most numerous type of family households are 2-person households, comprising 923, and the most common type of nonfamily households are 1-person households, comprising 1,481.
| Household Size | Family Households | Nonfamily Households |
| 1-Person Households | - | 1,481 (38.0%) |
| 2-Person Households | 923 (23.7%) | 191 (4.9%) |
| 3-Person Households | 571 (14.6%) | 23 (0.6%) |
| 4-Person Households | 439 (11.3%) | 0 (0.0%) |
| 5-Person Households | 177 (4.5%) | 0 (0.0%) |
| 6-Person Households | 72 (1.8%) | 0 (0.0%) |
| 7+ Person Households | 22 (0.6%) | 0 (0.0%) |
| Total | 2,204 (56.5%) | 1,695 (43.5%) |
Female Fertility in Espanola
Fertility by Age in Espanola
Average fertility rate in Espanola is 34.0 births per 1,000 women. Women in the age bracket of 20 to 34 years have the highest fertility rate with 56.0 births per 1,000 women. Women in the age bracket of 20 to 34 years acount for 60.5% of all women with births.
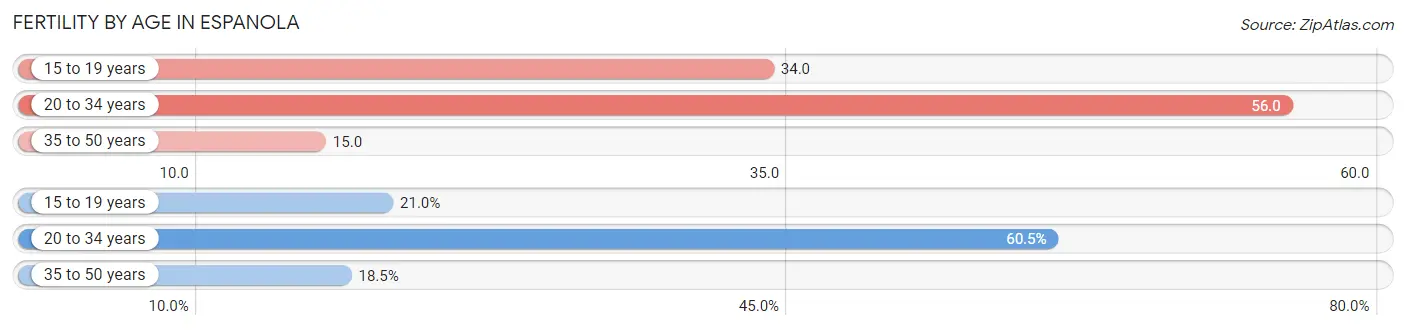
| Age Bracket | Women with Births | Births / 1,000 Women |
| 15 to 19 years | 17 (21.0%) | 34.0 |
| 20 to 34 years | 49 (60.5%) | 56.0 |
| 35 to 50 years | 15 (18.5%) | 15.0 |
| Total | 81 (100.0%) | 34.0 |
Fertility by Age by Marriage Status in Espanola
33.3% of women with births (81) in Espanola are married. The highest percentage of unmarried women with births falls into 15 to 19 years age bracket with 100.0% of them unmarried at the time of birth, while the lowest percentage of unmarried women with births belong to 20 to 34 years age bracket with 57.1% of them unmarried.
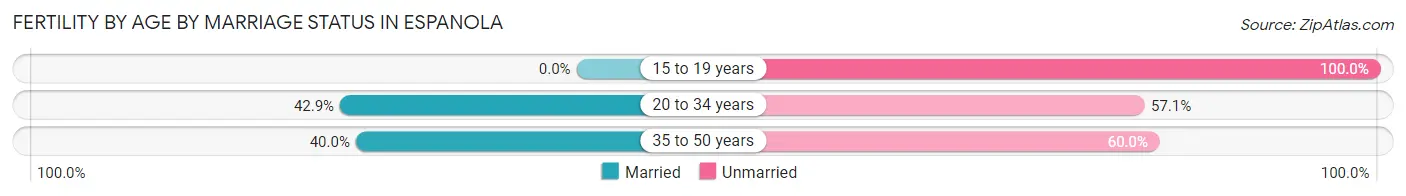
| Age Bracket | Married | Unmarried |
| 15 to 19 years | 0 (0.0%) | 17 (100.0%) |
| 20 to 34 years | 21 (42.9%) | 28 (57.1%) |
| 35 to 50 years | 6 (40.0%) | 9 (60.0%) |
| Total | 27 (33.3%) | 54 (66.7%) |
Fertility by Education in Espanola
Average fertility rate in Espanola is 34.0 births per 1,000 women. Women with the education attainment of bachelor's degree have the highest fertility rate of 133.0 births per 1,000 women, while women with the education attainment of less than high school have the lowest fertility at 7.0 births per 1,000 women. Women with the education attainment of high school diploma represent 39.5% of all women with births.
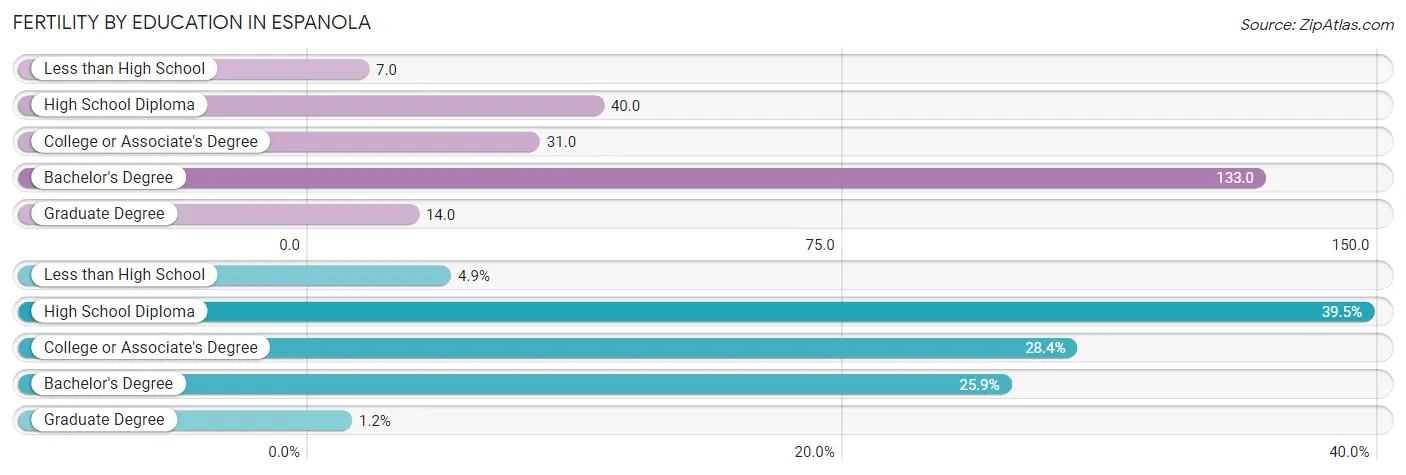
| Educational Attainment | Women with Births | Births / 1,000 Women |
| Less than High School | 4 (4.9%) | 7.0 |
| High School Diploma | 32 (39.5%) | 40.0 |
| College or Associate's Degree | 23 (28.4%) | 31.0 |
| Bachelor's Degree | 21 (25.9%) | 133.0 |
| Graduate Degree | 1 (1.2%) | 14.0 |
| Total | 81 (100.0%) | 34.0 |
Fertility by Education by Marriage Status in Espanola
66.7% of women with births in Espanola are unmarried. Women with the educational attainment of graduate degree are most likely to be married with 100.0% of them married at childbirth, while women with the educational attainment of less than high school are least likely to be married with 100.0% of them unmarried at childbirth.
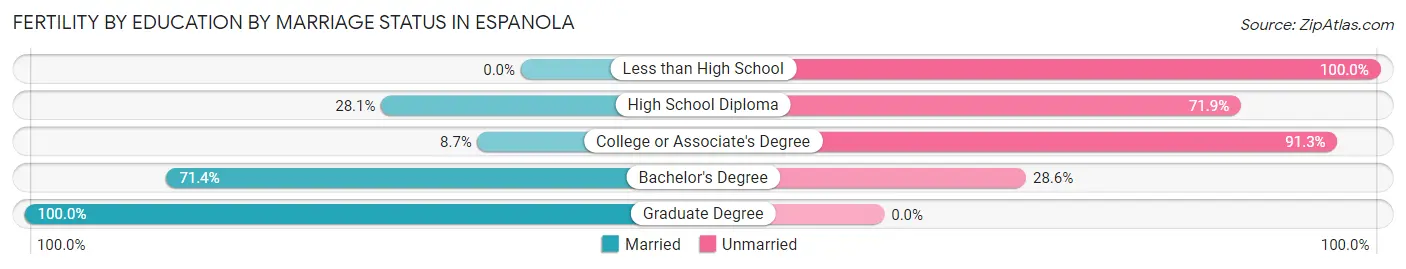
| Educational Attainment | Married | Unmarried |
| Less than High School | 0 (0.0%) | 4 (100.0%) |
| High School Diploma | 9 (28.1%) | 23 (71.9%) |
| College or Associate's Degree | 2 (8.7%) | 21 (91.3%) |
| Bachelor's Degree | 15 (71.4%) | 6 (28.6%) |
| Graduate Degree | 1 (100.0%) | 0 (0.0%) |
| Total | 27 (33.3%) | 54 (66.7%) |
Employment Characteristics in Espanola
Employment by Class of Employer in Espanola
Among the 4,176 employed individuals in Espanola, private company employees (2,539 | 60.8%), federal government employees (434 | 10.4%), and local government employees (404 | 9.7%) make up the most common classes of employment.
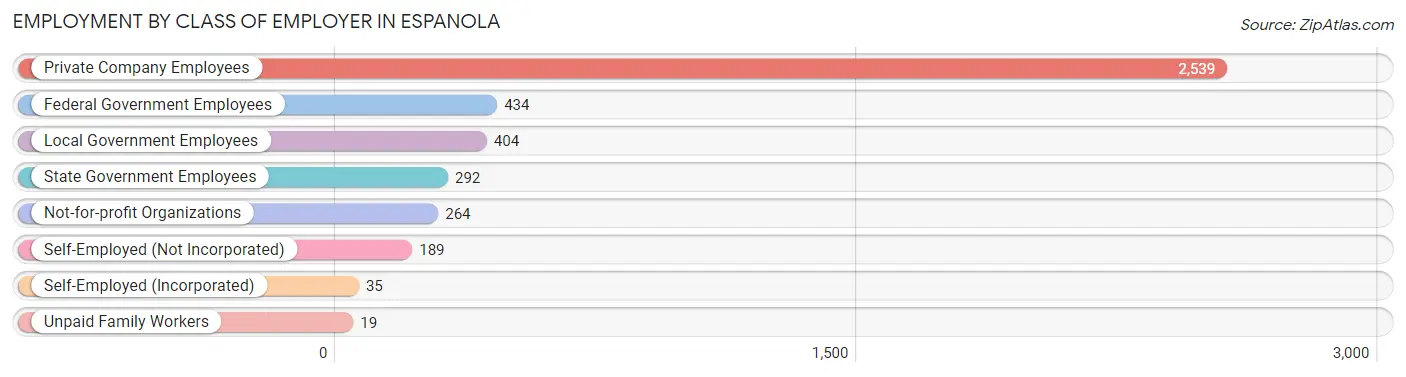
| Employer Class | # Employees | % Employees |
| Private Company Employees | 2,539 | 60.8% |
| Self-Employed (Incorporated) | 35 | 0.8% |
| Self-Employed (Not Incorporated) | 189 | 4.5% |
| Not-for-profit Organizations | 264 | 6.3% |
| Local Government Employees | 404 | 9.7% |
| State Government Employees | 292 | 7.0% |
| Federal Government Employees | 434 | 10.4% |
| Unpaid Family Workers | 19 | 0.4% |
| Total | 4,176 | 100.0% |
Employment Status by Age in Espanola
According to the labor force statistics for Espanola, out of the total population over 16 years of age (8,056), 55.3% or 4,455 individuals are in the labor force, with 5.3% or 236 of them unemployed. The age group with the highest labor force participation rate is 30 to 34 years, with 89.8% or 510 individuals in the labor force. Within the labor force, the 16 to 19 years age range has the highest percentage of unemployed individuals, with 21.7% or 59 of them being unemployed.
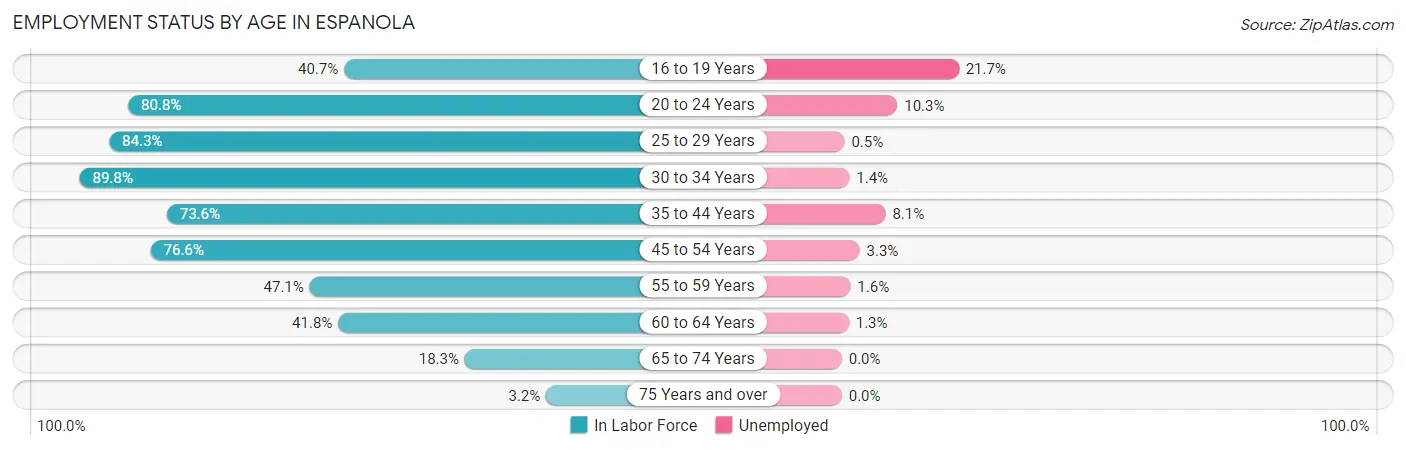
| Age Bracket | In Labor Force | Unemployed |
| 16 to 19 Years | 272 (40.7%) | 59 (21.7%) |
| 20 to 24 Years | 660 (80.8%) | 68 (10.3%) |
| 25 to 29 Years | 578 (84.3%) | 3 (0.5%) |
| 30 to 34 Years | 510 (89.8%) | 7 (1.4%) |
| 35 to 44 Years | 777 (73.6%) | 63 (8.1%) |
| 45 to 54 Years | 901 (76.6%) | 30 (3.3%) |
| 55 to 59 Years | 305 (47.1%) | 5 (1.6%) |
| 60 to 64 Years | 231 (41.8%) | 3 (1.3%) |
| 65 to 74 Years | 193 (18.3%) | 0 (0.0%) |
| 75 Years and over | 27 (3.2%) | 0 (0.0%) |
| Total | 4,455 (55.3%) | 236 (5.3%) |
Employment Status by Educational Attainment in Espanola
According to labor force statistics for Espanola, 70.5% of individuals (3,304) out of the total population between 25 and 64 years of age (4,686) are in the labor force, with 3.4% or 112 of them being unemployed. The group with the highest labor force participation rate are those with the educational attainment of college / associate degree, with 76.1% or 1,181 individuals in the labor force. Within the labor force, individuals with less than high school education have the highest percentage of unemployment, with 7.9% or 41 of them being unemployed.
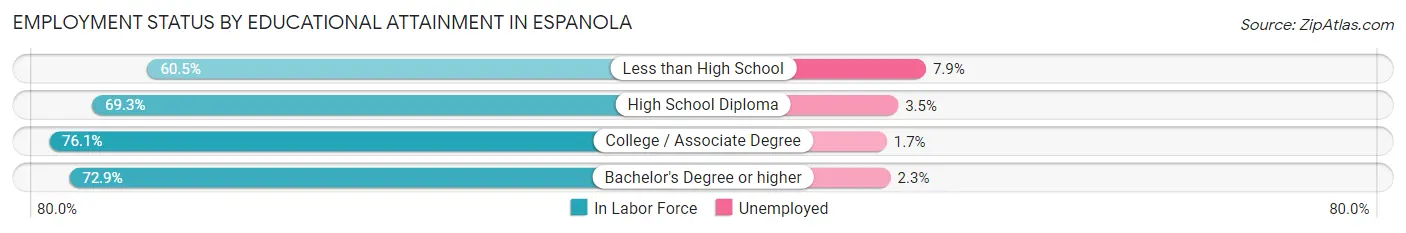
| Educational Attainment | In Labor Force | Unemployed |
| Less than High School | 517 (60.5%) | 68 (7.9%) |
| High School Diploma | 1,094 (69.3%) | 55 (3.5%) |
| College / Associate Degree | 1,181 (76.1%) | 26 (1.7%) |
| Bachelor's Degree or higher | 511 (72.9%) | 16 (2.3%) |
| Total | 3,304 (70.5%) | 159 (3.4%) |
Employment Occupations by Sex in Espanola
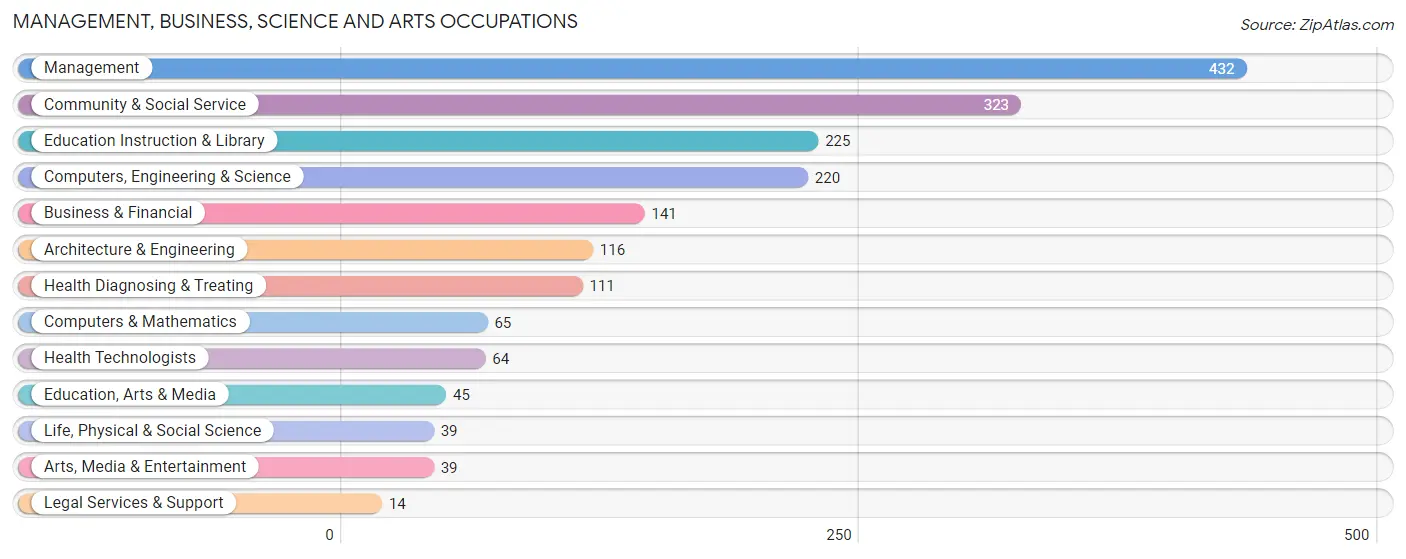
Management, Business, Science and Arts Occupations
The most common Management, Business, Science and Arts occupations in Espanola are Management (432 | 10.3%), Community & Social Service (323 | 7.7%), Education Instruction & Library (225 | 5.3%), Computers, Engineering & Science (220 | 5.2%), and Business & Financial (141 | 3.4%).
Management, Business, Science and Arts Occupations by Sex
Within the Management, Business, Science and Arts occupations in Espanola, the most male-oriented occupations are Life, Physical & Social Science (94.9%), Legal Services & Support (78.6%), and Architecture & Engineering (78.4%), while the most female-oriented occupations are Health Technologists (82.8%), Education, Arts & Media (80.0%), and Arts, Media & Entertainment (79.5%).
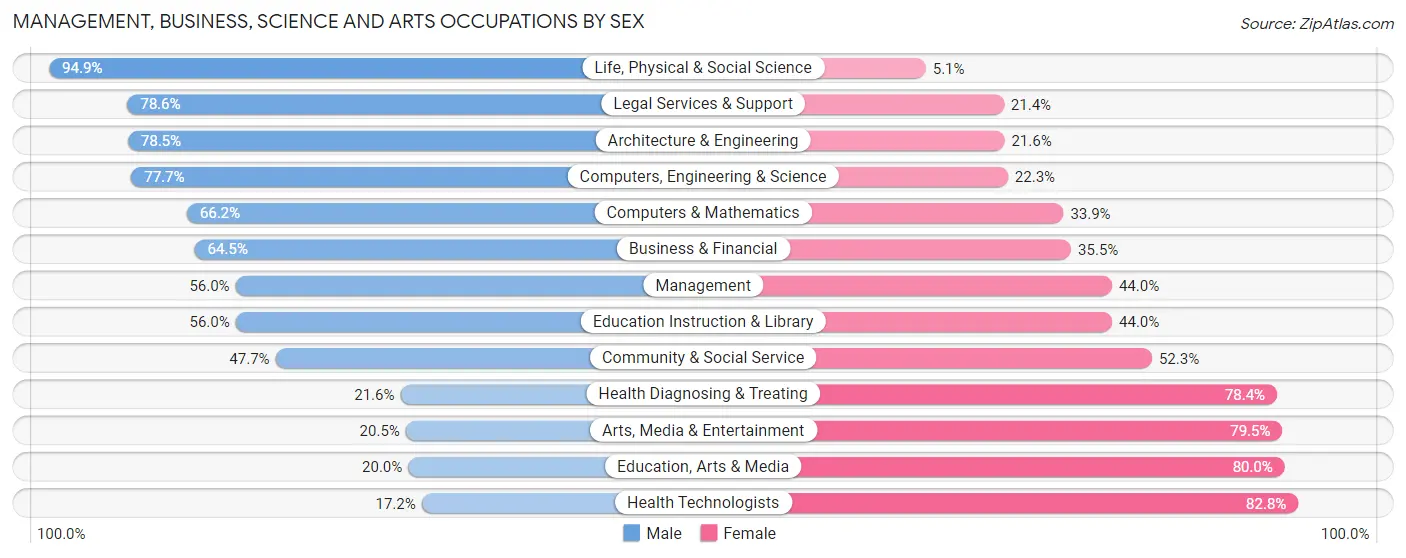
| Occupation | Male | Female |
| Management | 242 (56.0%) | 190 (44.0%) |
| Business & Financial | 91 (64.5%) | 50 (35.5%) |
| Computers, Engineering & Science | 171 (77.7%) | 49 (22.3%) |
| Computers & Mathematics | 43 (66.1%) | 22 (33.9%) |
| Architecture & Engineering | 91 (78.4%) | 25 (21.5%) |
| Life, Physical & Social Science | 37 (94.9%) | 2 (5.1%) |
| Community & Social Service | 154 (47.7%) | 169 (52.3%) |
| Education, Arts & Media | 9 (20.0%) | 36 (80.0%) |
| Legal Services & Support | 11 (78.6%) | 3 (21.4%) |
| Education Instruction & Library | 126 (56.0%) | 99 (44.0%) |
| Arts, Media & Entertainment | 8 (20.5%) | 31 (79.5%) |
| Health Diagnosing & Treating | 24 (21.6%) | 87 (78.4%) |
| Health Technologists | 11 (17.2%) | 53 (82.8%) |
| Total (Category) | 682 (55.6%) | 545 (44.4%) |
| Total (Overall) | 2,298 (54.6%) | 1,911 (45.4%) |
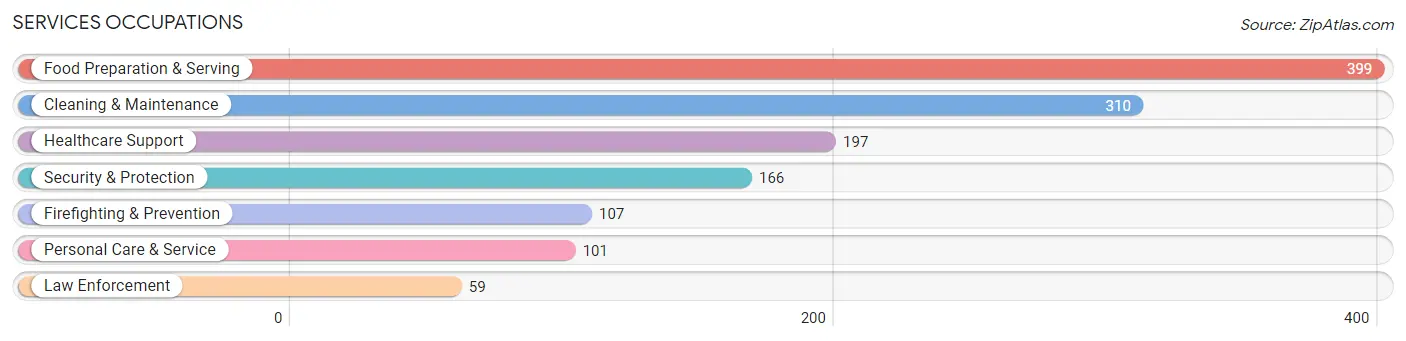
Services Occupations
The most common Services occupations in Espanola are Food Preparation & Serving (399 | 9.5%), Cleaning & Maintenance (310 | 7.4%), Healthcare Support (197 | 4.7%), Security & Protection (166 | 3.9%), and Firefighting & Prevention (107 | 2.5%).
Services Occupations by Sex
Within the Services occupations in Espanola, the most male-oriented occupations are Law Enforcement (98.3%), Security & Protection (81.3%), and Firefighting & Prevention (72.0%), while the most female-oriented occupations are Healthcare Support (93.9%), Personal Care & Service (82.2%), and Food Preparation & Serving (47.6%).
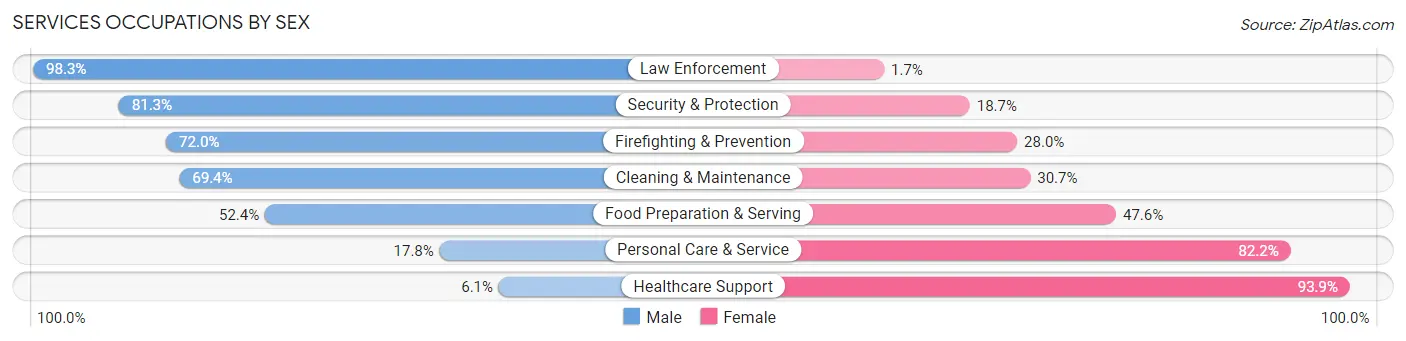
| Occupation | Male | Female |
| Healthcare Support | 12 (6.1%) | 185 (93.9%) |
| Security & Protection | 135 (81.3%) | 31 (18.7%) |
| Firefighting & Prevention | 77 (72.0%) | 30 (28.0%) |
| Law Enforcement | 58 (98.3%) | 1 (1.7%) |
| Food Preparation & Serving | 209 (52.4%) | 190 (47.6%) |
| Cleaning & Maintenance | 215 (69.4%) | 95 (30.6%) |
| Personal Care & Service | 18 (17.8%) | 83 (82.2%) |
| Total (Category) | 589 (50.2%) | 584 (49.8%) |
| Total (Overall) | 2,298 (54.6%) | 1,911 (45.4%) |
Sales and Office Occupations
The most common Sales and Office occupations in Espanola are Office & Administration (478 | 11.4%), and Sales & Related (457 | 10.9%).

Sales and Office Occupations by Sex

| Occupation | Male | Female |
| Sales & Related | 206 (45.1%) | 251 (54.9%) |
| Office & Administration | 73 (15.3%) | 405 (84.7%) |
| Total (Category) | 279 (29.8%) | 656 (70.2%) |
| Total (Overall) | 2,298 (54.6%) | 1,911 (45.4%) |
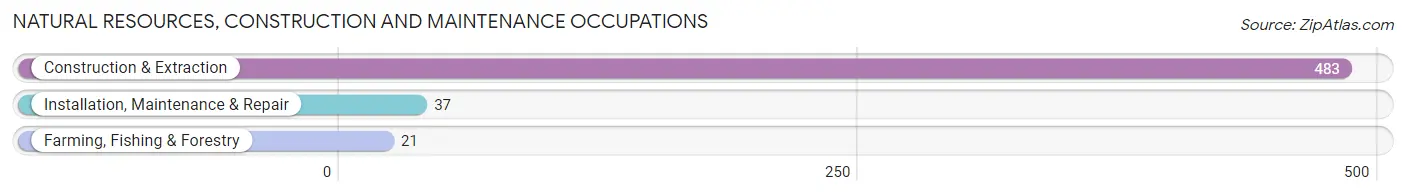
Natural Resources, Construction and Maintenance Occupations
The most common Natural Resources, Construction and Maintenance occupations in Espanola are Construction & Extraction (483 | 11.5%), Installation, Maintenance & Repair (37 | 0.9%), and Farming, Fishing & Forestry (21 | 0.5%).
Natural Resources, Construction and Maintenance Occupations by Sex
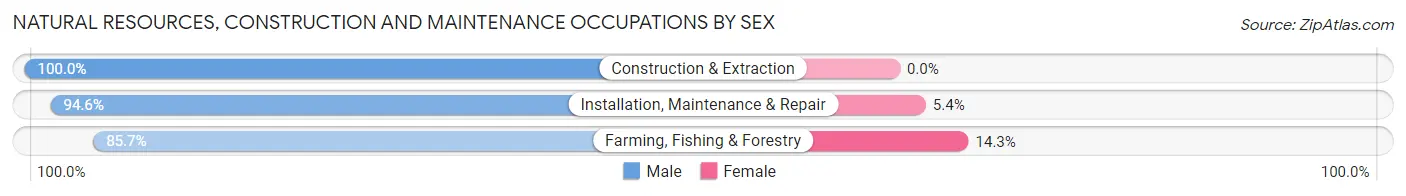
| Occupation | Male | Female |
| Farming, Fishing & Forestry | 18 (85.7%) | 3 (14.3%) |
| Construction & Extraction | 483 (100.0%) | 0 (0.0%) |
| Installation, Maintenance & Repair | 35 (94.6%) | 2 (5.4%) |
| Total (Category) | 536 (99.1%) | 5 (0.9%) |
| Total (Overall) | 2,298 (54.6%) | 1,911 (45.4%) |
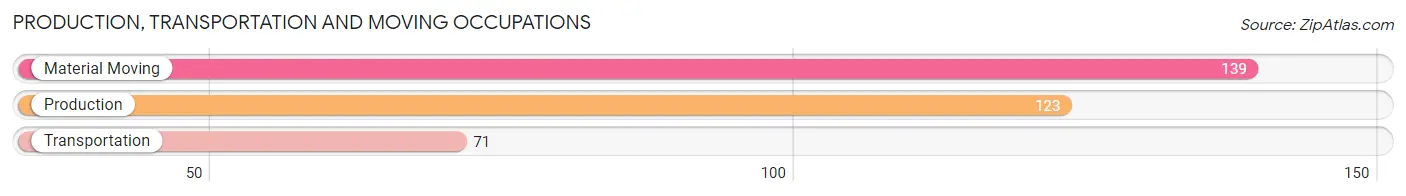
Production, Transportation and Moving Occupations
The most common Production, Transportation and Moving occupations in Espanola are Material Moving (139 | 3.3%), Production (123 | 2.9%), and Transportation (71 | 1.7%).
Production, Transportation and Moving Occupations by Sex
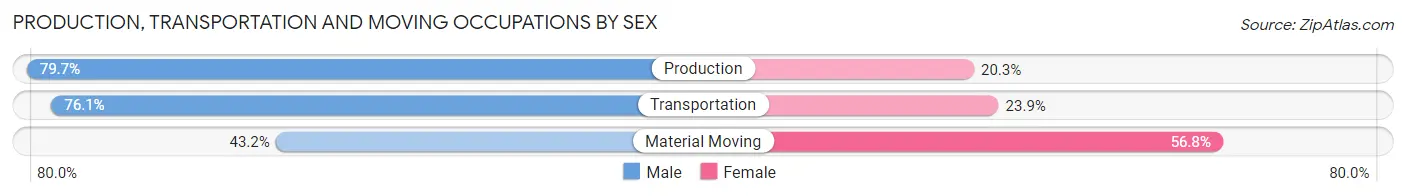
| Occupation | Male | Female |
| Production | 98 (79.7%) | 25 (20.3%) |
| Transportation | 54 (76.1%) | 17 (23.9%) |
| Material Moving | 60 (43.2%) | 79 (56.8%) |
| Total (Category) | 212 (63.7%) | 121 (36.3%) |
| Total (Overall) | 2,298 (54.6%) | 1,911 (45.4%) |
Employment Industries by Sex in Espanola
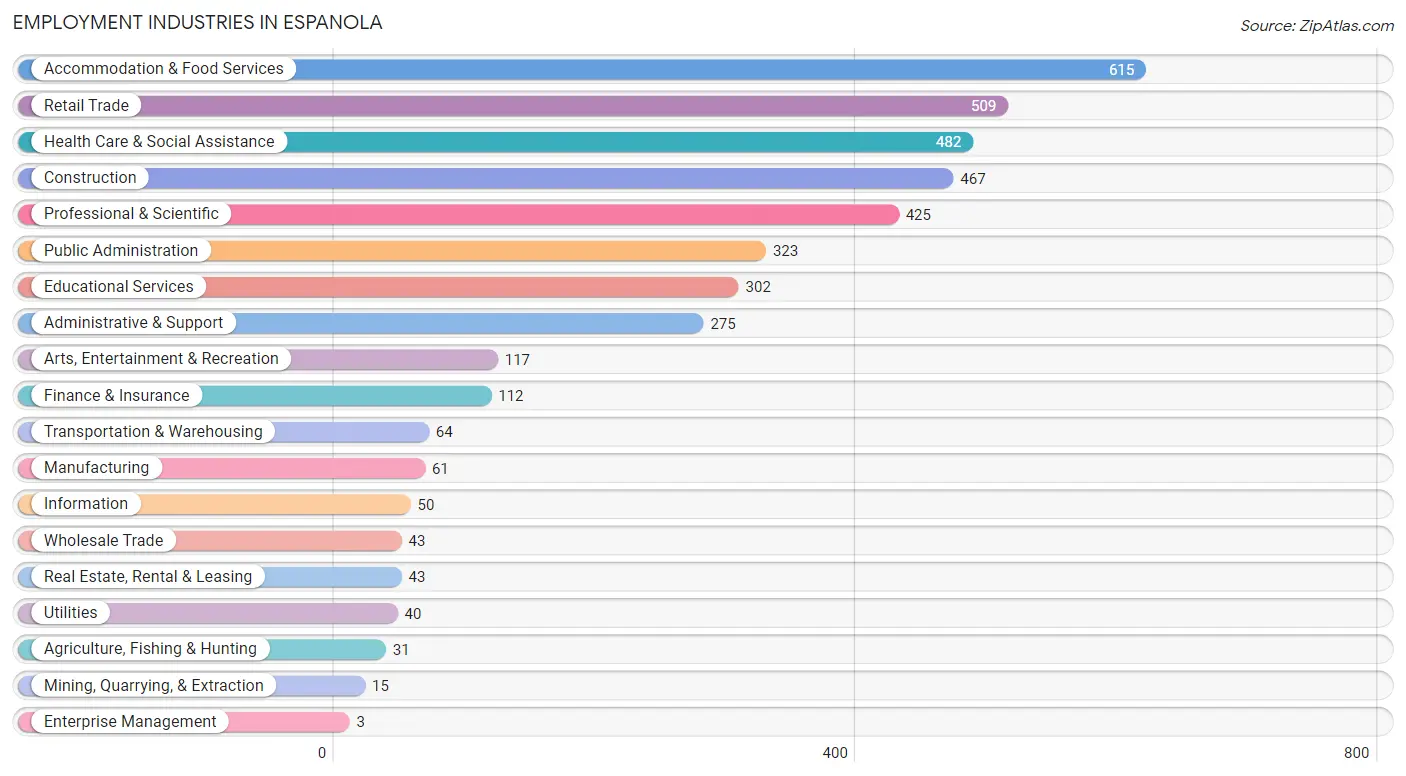
Employment Industries in Espanola
The major employment industries in Espanola include Accommodation & Food Services (615 | 14.6%), Retail Trade (509 | 12.1%), Health Care & Social Assistance (482 | 11.5%), Construction (467 | 11.1%), and Professional & Scientific (425 | 10.1%).
Employment Industries by Sex in Espanola
The Espanola industries that see more men than women are Wholesale Trade (100.0%), Construction (95.7%), and Real Estate, Rental & Leasing (90.7%), whereas the industries that tend to have a higher number of women are Enterprise Management (100.0%), Information (88.0%), and Health Care & Social Assistance (79.9%).
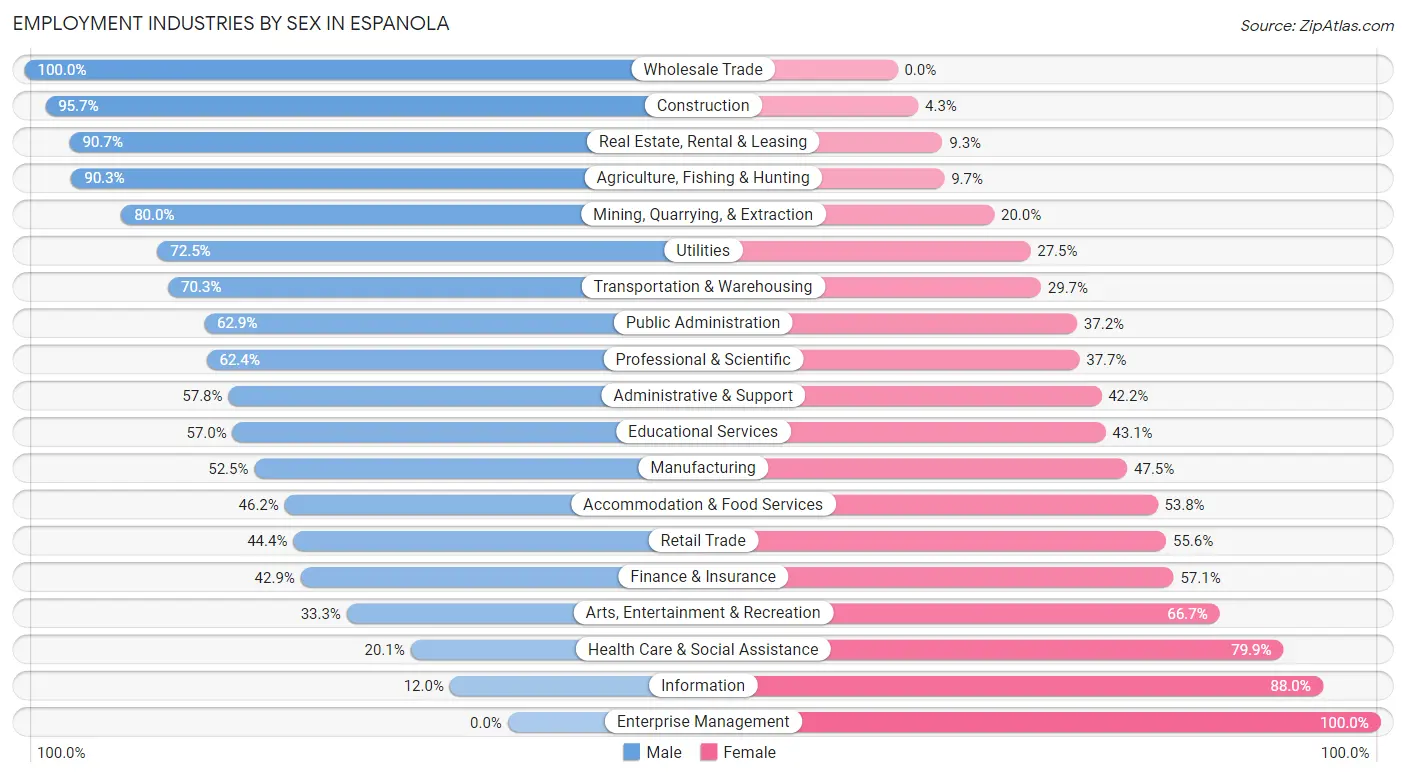
| Industry | Male | Female |
| Agriculture, Fishing & Hunting | 28 (90.3%) | 3 (9.7%) |
| Mining, Quarrying, & Extraction | 12 (80.0%) | 3 (20.0%) |
| Construction | 447 (95.7%) | 20 (4.3%) |
| Manufacturing | 32 (52.5%) | 29 (47.5%) |
| Wholesale Trade | 43 (100.0%) | 0 (0.0%) |
| Retail Trade | 226 (44.4%) | 283 (55.6%) |
| Transportation & Warehousing | 45 (70.3%) | 19 (29.7%) |
| Utilities | 29 (72.5%) | 11 (27.5%) |
| Information | 6 (12.0%) | 44 (88.0%) |
| Finance & Insurance | 48 (42.9%) | 64 (57.1%) |
| Real Estate, Rental & Leasing | 39 (90.7%) | 4 (9.3%) |
| Professional & Scientific | 265 (62.4%) | 160 (37.7%) |
| Enterprise Management | 0 (0.0%) | 3 (100.0%) |
| Administrative & Support | 159 (57.8%) | 116 (42.2%) |
| Educational Services | 172 (57.0%) | 130 (43.0%) |
| Health Care & Social Assistance | 97 (20.1%) | 385 (79.9%) |
| Arts, Entertainment & Recreation | 39 (33.3%) | 78 (66.7%) |
| Accommodation & Food Services | 284 (46.2%) | 331 (53.8%) |
| Public Administration | 203 (62.8%) | 120 (37.1%) |
| Total | 2,298 (54.6%) | 1,911 (45.4%) |
Education in Espanola
School Enrollment in Espanola
The most common levels of schooling among the 2,878 students in Espanola are middle school (762 | 26.5%), elementary school (613 | 21.3%), and high school (569 | 19.8%).
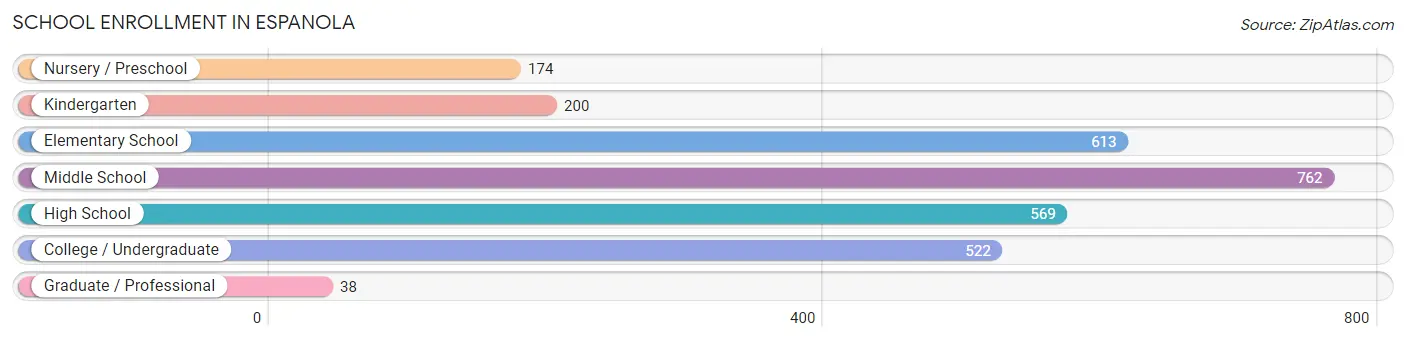
| School Level | # Students | % Students |
| Nursery / Preschool | 174 | 6.0% |
| Kindergarten | 200 | 7.0% |
| Elementary School | 613 | 21.3% |
| Middle School | 762 | 26.5% |
| High School | 569 | 19.8% |
| College / Undergraduate | 522 | 18.1% |
| Graduate / Professional | 38 | 1.3% |
| Total | 2,878 | 100.0% |
School Enrollment by Age by Funding Source in Espanola
Out of a total of 2,878 students who are enrolled in schools in Espanola, 213 (7.4%) attend a private institution, while the remaining 2,665 (92.6%) are enrolled in public schools. The age group of 35 years and over has the highest likelihood of being enrolled in private schools, with 43 (37.4% in the age bracket) enrolled. Conversely, the age group of 3 to 4 year olds has the lowest likelihood of being enrolled in a private school, with 143 (100.0% in the age bracket) attending a public institution.
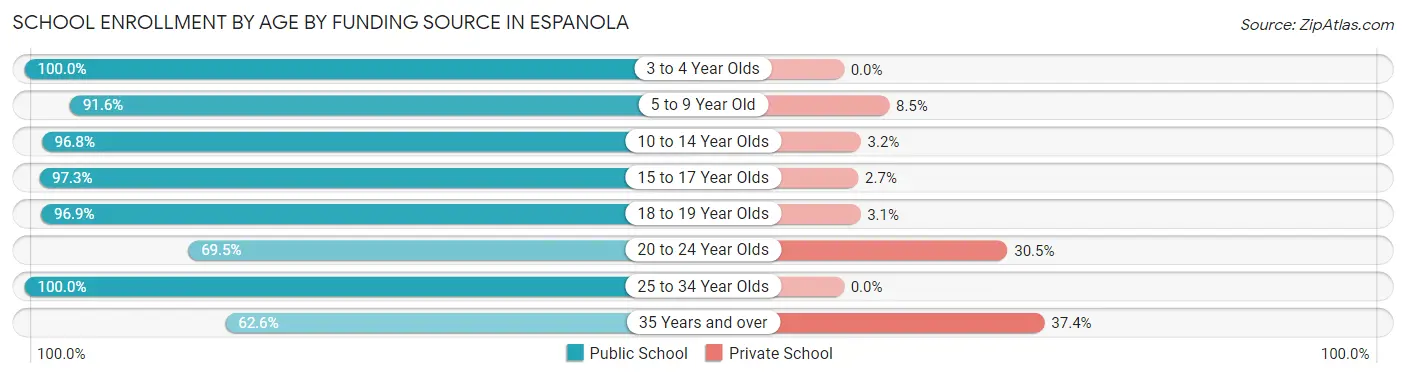
| Age Bracket | Public School | Private School |
| 3 to 4 Year Olds | 143 (100.0%) | 0 (0.0%) |
| 5 to 9 Year Old | 650 (91.5%) | 60 (8.5%) |
| 10 to 14 Year Olds | 890 (96.8%) | 29 (3.2%) |
| 15 to 17 Year Olds | 396 (97.3%) | 11 (2.7%) |
| 18 to 19 Year Olds | 220 (96.9%) | 7 (3.1%) |
| 20 to 24 Year Olds | 146 (69.5%) | 64 (30.5%) |
| 25 to 34 Year Olds | 147 (100.0%) | 0 (0.0%) |
| 35 Years and over | 72 (62.6%) | 43 (37.4%) |
| Total | 2,665 (92.6%) | 213 (7.4%) |
Educational Attainment by Field of Study in Espanola
Business (265 | 22.3%), education (213 | 18.0%), science & technology (132 | 11.1%), engineering (121 | 10.2%), and arts & humanities (106 | 8.9%) are the most common fields of study among 1,186 individuals in Espanola who have obtained a bachelor's degree or higher.
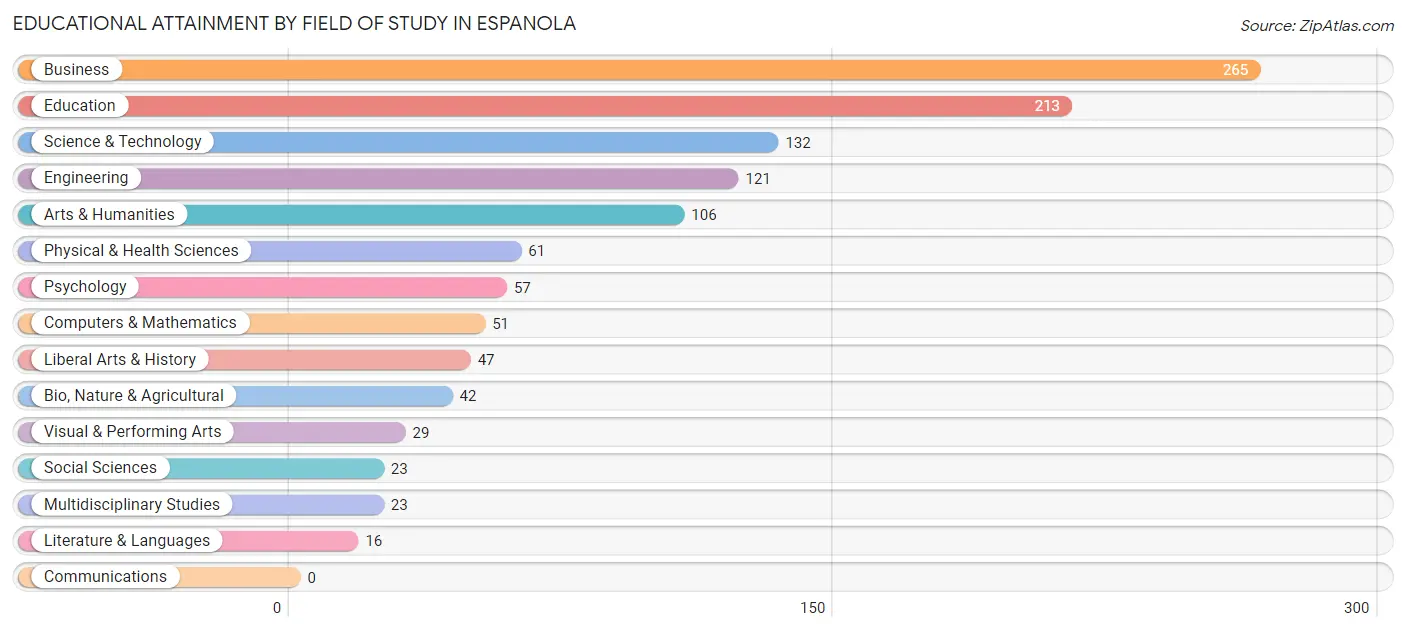
| Field of Study | # Graduates | % Graduates |
| Computers & Mathematics | 51 | 4.3% |
| Bio, Nature & Agricultural | 42 | 3.5% |
| Physical & Health Sciences | 61 | 5.1% |
| Psychology | 57 | 4.8% |
| Social Sciences | 23 | 1.9% |
| Engineering | 121 | 10.2% |
| Multidisciplinary Studies | 23 | 1.9% |
| Science & Technology | 132 | 11.1% |
| Business | 265 | 22.3% |
| Education | 213 | 18.0% |
| Literature & Languages | 16 | 1.3% |
| Liberal Arts & History | 47 | 4.0% |
| Visual & Performing Arts | 29 | 2.5% |
| Communications | 0 | 0.0% |
| Arts & Humanities | 106 | 8.9% |
| Total | 1,186 | 100.0% |
Transportation & Commute in Espanola
Vehicle Availability by Sex in Espanola
The most prevalent vehicle ownership categories in Espanola are males with 3 vehicles (673, accounting for 29.7%) and females with 3 vehicles (544, making up 35.3%).
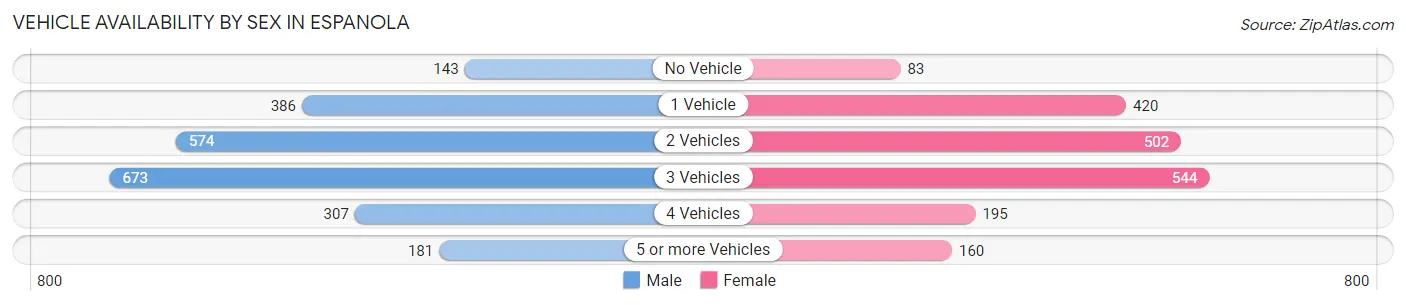
| Vehicles Available | Male | Female |
| No Vehicle | 143 (6.3%) | 83 (4.4%) |
| 1 Vehicle | 386 (17.1%) | 420 (22.1%) |
| 2 Vehicles | 574 (25.4%) | 502 (26.4%) |
| 3 Vehicles | 673 (29.7%) | 544 (28.6%) |
| 4 Vehicles | 307 (13.6%) | 195 (10.2%) |
| 5 or more Vehicles | 181 (8.0%) | 160 (8.4%) |
| Total | 2,264 (100.0%) | 1,904 (100.0%) |
Commute Time in Espanola
The most frequently occuring commute durations in Espanola are 10 to 14 minutes (545 commuters, 13.6%), 45 to 59 minutes (535 commuters, 13.3%), and 5 to 9 minutes (502 commuters, 12.5%).
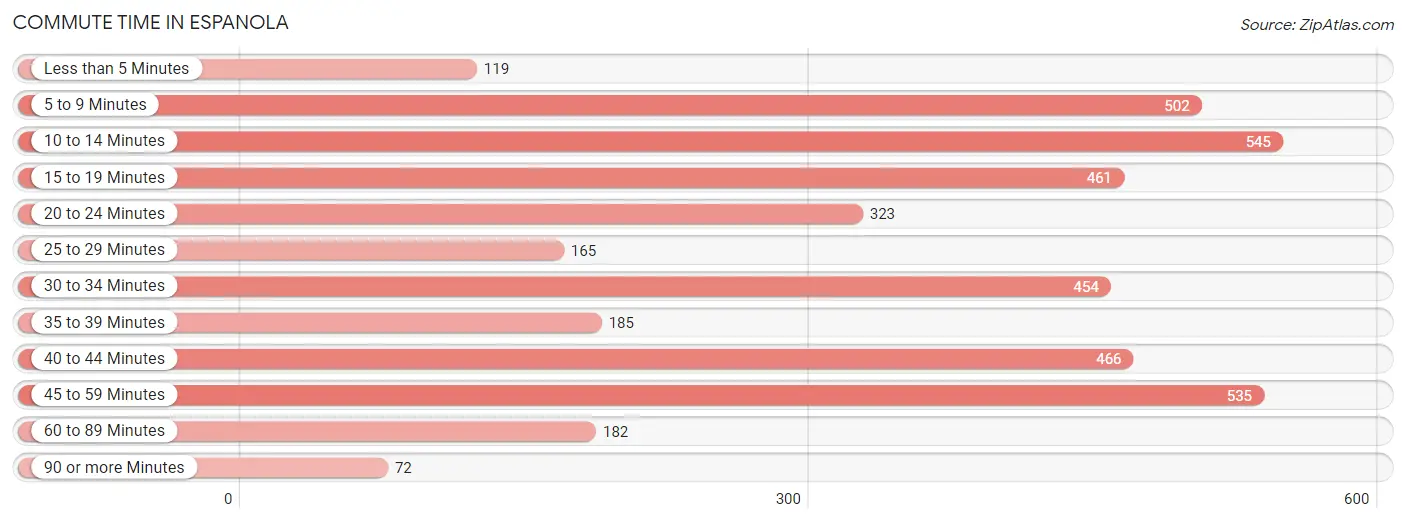
| Commute Time | # Commuters | % Commuters |
| Less than 5 Minutes | 119 | 3.0% |
| 5 to 9 Minutes | 502 | 12.5% |
| 10 to 14 Minutes | 545 | 13.6% |
| 15 to 19 Minutes | 461 | 11.5% |
| 20 to 24 Minutes | 323 | 8.1% |
| 25 to 29 Minutes | 165 | 4.1% |
| 30 to 34 Minutes | 454 | 11.3% |
| 35 to 39 Minutes | 185 | 4.6% |
| 40 to 44 Minutes | 466 | 11.6% |
| 45 to 59 Minutes | 535 | 13.3% |
| 60 to 89 Minutes | 182 | 4.5% |
| 90 or more Minutes | 72 | 1.8% |
Commute Time by Sex in Espanola
The most common commute times in Espanola are 10 to 14 minutes (312 commuters, 14.2%) for males and 45 to 59 minutes (304 commuters, 16.7%) for females.
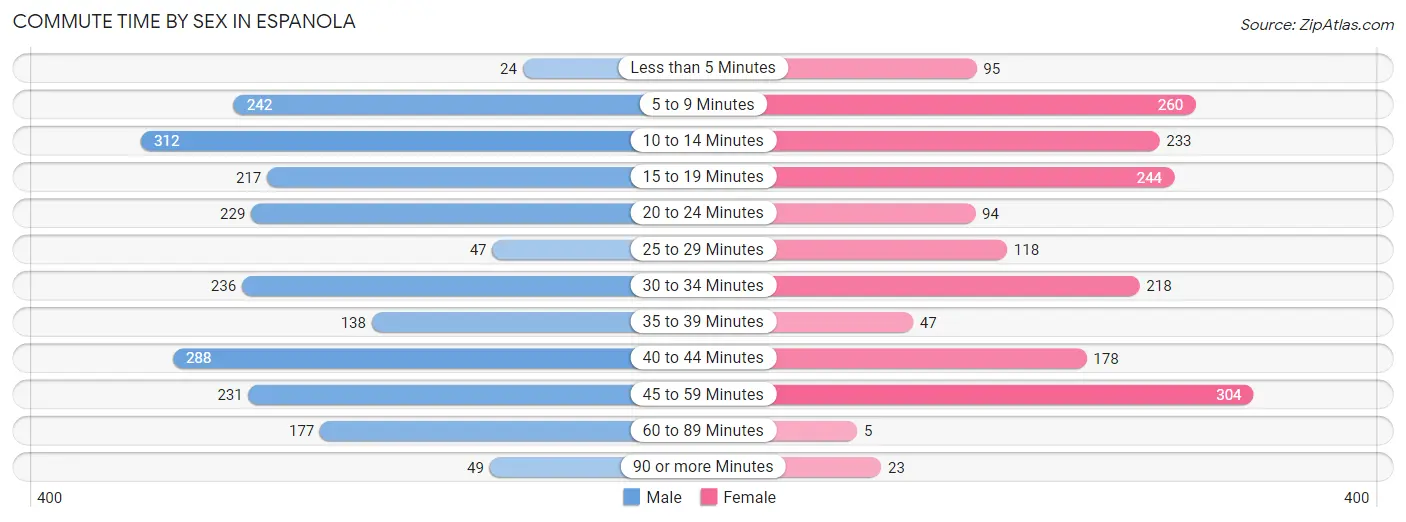
| Commute Time | Male | Female |
| Less than 5 Minutes | 24 (1.1%) | 95 (5.2%) |
| 5 to 9 Minutes | 242 (11.1%) | 260 (14.3%) |
| 10 to 14 Minutes | 312 (14.2%) | 233 (12.8%) |
| 15 to 19 Minutes | 217 (9.9%) | 244 (13.4%) |
| 20 to 24 Minutes | 229 (10.5%) | 94 (5.2%) |
| 25 to 29 Minutes | 47 (2.1%) | 118 (6.5%) |
| 30 to 34 Minutes | 236 (10.8%) | 218 (12.0%) |
| 35 to 39 Minutes | 138 (6.3%) | 47 (2.6%) |
| 40 to 44 Minutes | 288 (13.2%) | 178 (9.8%) |
| 45 to 59 Minutes | 231 (10.5%) | 304 (16.7%) |
| 60 to 89 Minutes | 177 (8.1%) | 5 (0.3%) |
| 90 or more Minutes | 49 (2.2%) | 23 (1.3%) |
Time of Departure to Work by Sex in Espanola
The most frequent times of departure to work in Espanola are 7:30 AM to 7:59 AM (390, 17.8%) for males and 7:00 AM to 7:29 AM (425, 23.4%) for females.
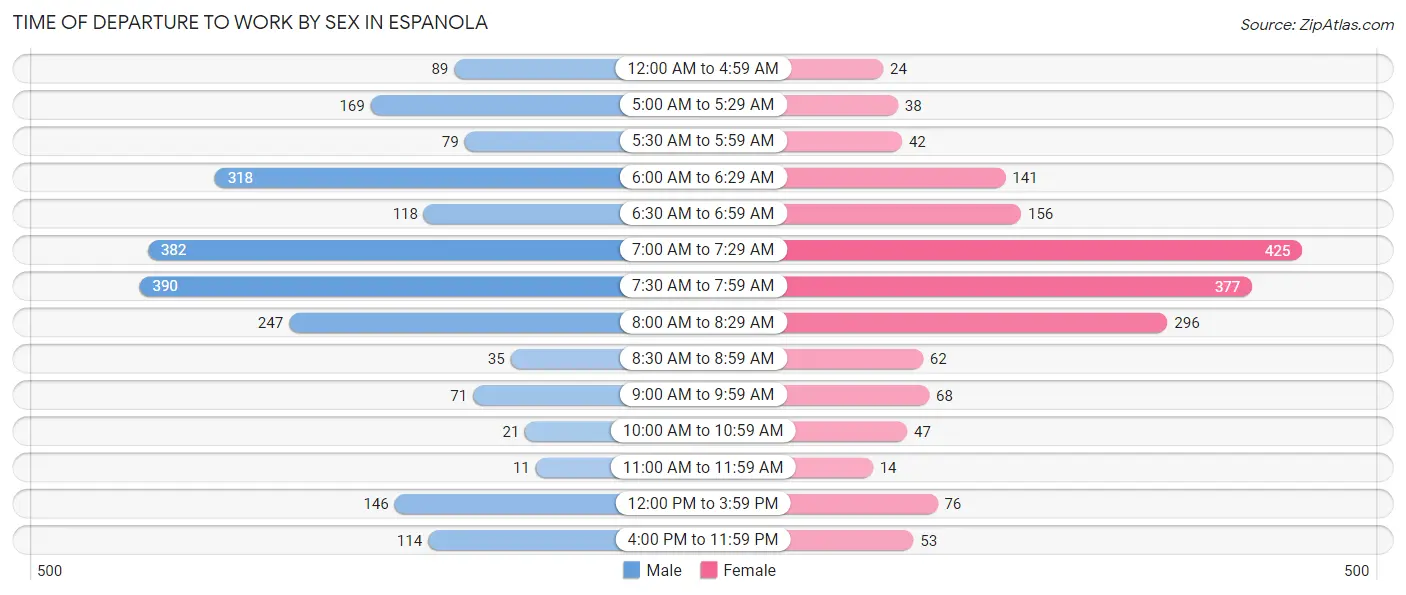
| Time of Departure | Male | Female |
| 12:00 AM to 4:59 AM | 89 (4.1%) | 24 (1.3%) |
| 5:00 AM to 5:29 AM | 169 (7.7%) | 38 (2.1%) |
| 5:30 AM to 5:59 AM | 79 (3.6%) | 42 (2.3%) |
| 6:00 AM to 6:29 AM | 318 (14.5%) | 141 (7.7%) |
| 6:30 AM to 6:59 AM | 118 (5.4%) | 156 (8.6%) |
| 7:00 AM to 7:29 AM | 382 (17.4%) | 425 (23.4%) |
| 7:30 AM to 7:59 AM | 390 (17.8%) | 377 (20.7%) |
| 8:00 AM to 8:29 AM | 247 (11.3%) | 296 (16.3%) |
| 8:30 AM to 8:59 AM | 35 (1.6%) | 62 (3.4%) |
| 9:00 AM to 9:59 AM | 71 (3.2%) | 68 (3.7%) |
| 10:00 AM to 10:59 AM | 21 (1.0%) | 47 (2.6%) |
| 11:00 AM to 11:59 AM | 11 (0.5%) | 14 (0.8%) |
| 12:00 PM to 3:59 PM | 146 (6.7%) | 76 (4.2%) |
| 4:00 PM to 11:59 PM | 114 (5.2%) | 53 (2.9%) |
| Total | 2,190 (100.0%) | 1,819 (100.0%) |
Housing Occupancy in Espanola
Occupancy by Ownership in Espanola
Of the total 3,899 dwellings in Espanola, owner-occupied units account for 2,519 (64.6%), while renter-occupied units make up 1,380 (35.4%).
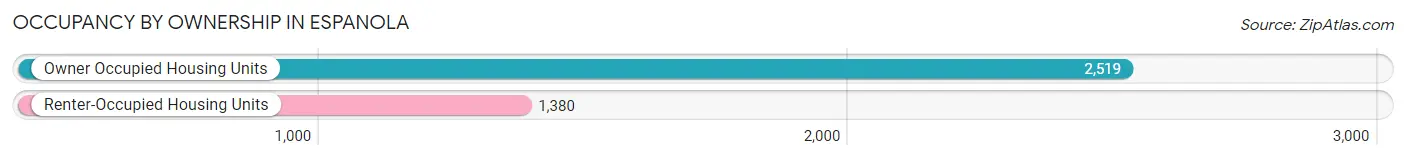
| Occupancy | # Housing Units | % Housing Units |
| Owner Occupied Housing Units | 2,519 | 64.6% |
| Renter-Occupied Housing Units | 1,380 | 35.4% |
| Total Occupied Housing Units | 3,899 | 100.0% |
Occupancy by Household Size in Espanola
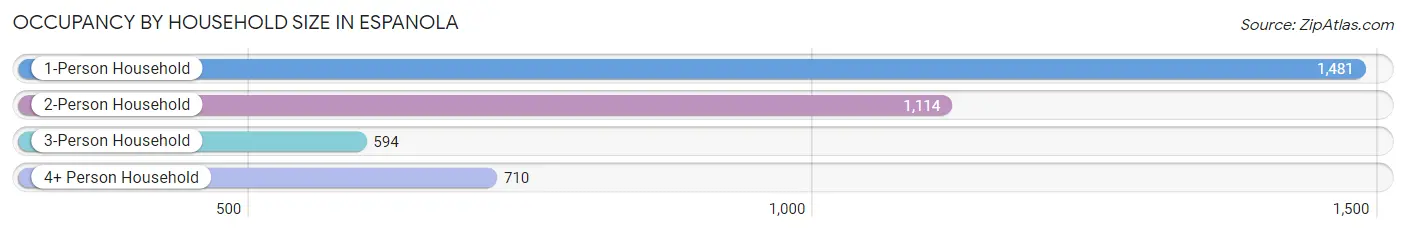
| Household Size | # Housing Units | % Housing Units |
| 1-Person Household | 1,481 | 38.0% |
| 2-Person Household | 1,114 | 28.6% |
| 3-Person Household | 594 | 15.2% |
| 4+ Person Household | 710 | 18.2% |
| Total Housing Units | 3,899 | 100.0% |
Occupancy by Ownership by Household Size in Espanola
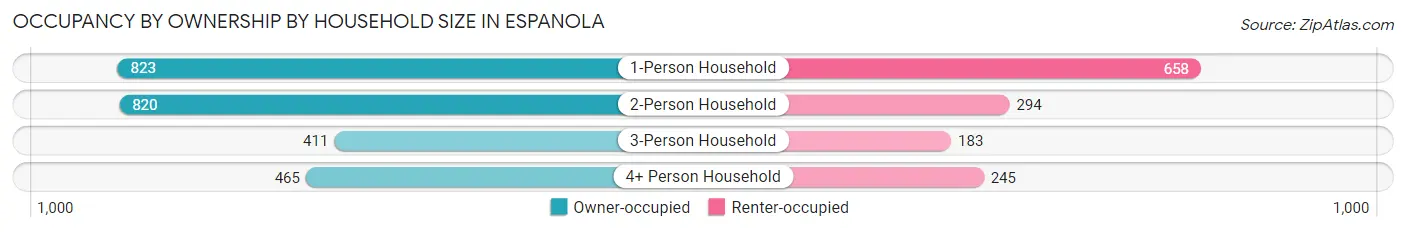
| Household Size | Owner-occupied | Renter-occupied |
| 1-Person Household | 823 (55.6%) | 658 (44.4%) |
| 2-Person Household | 820 (73.6%) | 294 (26.4%) |
| 3-Person Household | 411 (69.2%) | 183 (30.8%) |
| 4+ Person Household | 465 (65.5%) | 245 (34.5%) |
| Total Housing Units | 2,519 (64.6%) | 1,380 (35.4%) |
Occupancy by Educational Attainment in Espanola
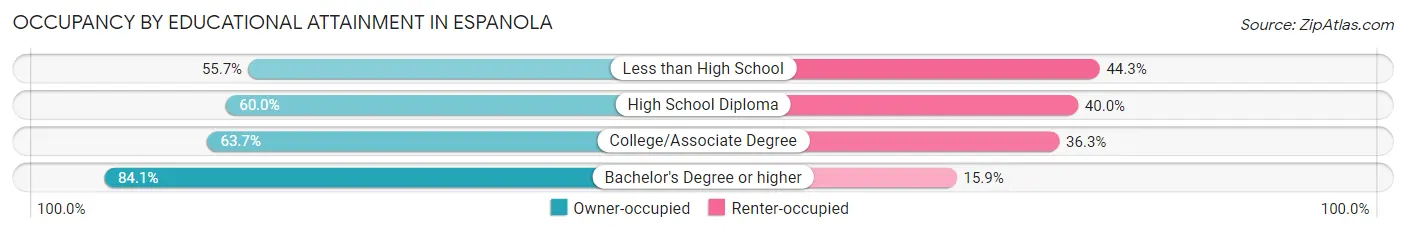
| Household Size | Owner-occupied | Renter-occupied |
| Less than High School | 443 (55.7%) | 352 (44.3%) |
| High School Diploma | 681 (60.0%) | 454 (40.0%) |
| College/Associate Degree | 815 (63.7%) | 464 (36.3%) |
| Bachelor's Degree or higher | 580 (84.1%) | 110 (15.9%) |
Occupancy by Age of Householder in Espanola
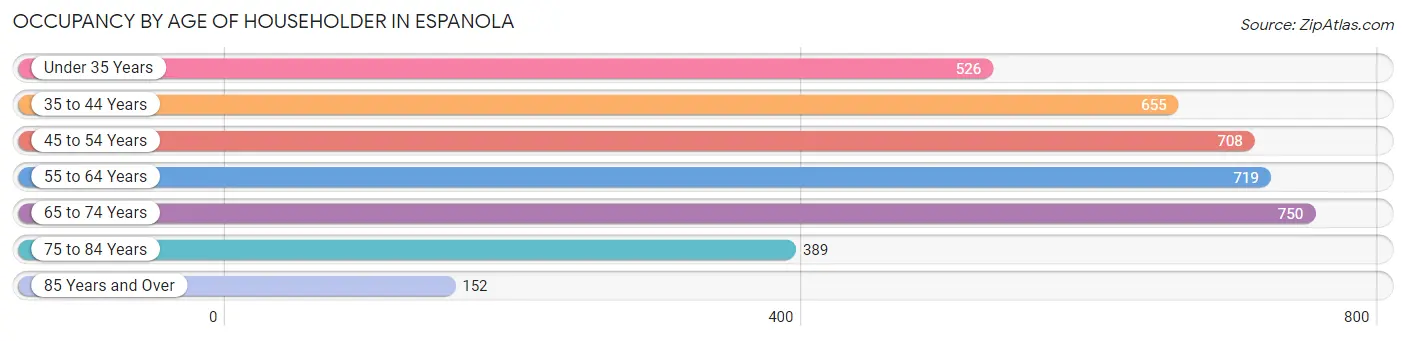
| Age Bracket | # Households | % Households |
| Under 35 Years | 526 | 13.5% |
| 35 to 44 Years | 655 | 16.8% |
| 45 to 54 Years | 708 | 18.2% |
| 55 to 64 Years | 719 | 18.4% |
| 65 to 74 Years | 750 | 19.2% |
| 75 to 84 Years | 389 | 10.0% |
| 85 Years and Over | 152 | 3.9% |
| Total | 3,899 | 100.0% |
Housing Finances in Espanola
Median Income by Occupancy in Espanola
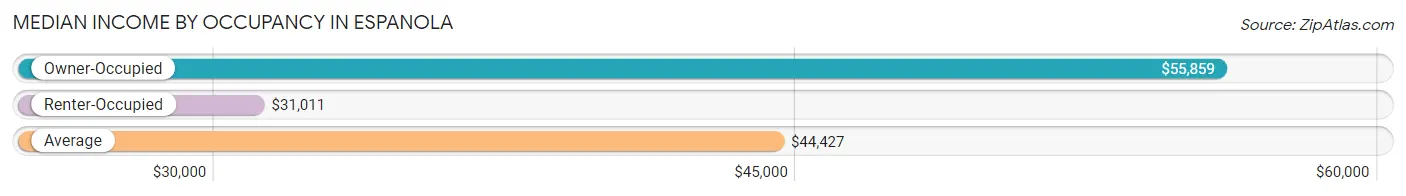
| Occupancy Type | # Households | Median Income |
| Owner-Occupied | 2,519 (64.6%) | $55,859 |
| Renter-Occupied | 1,380 (35.4%) | $31,011 |
| Average | 3,899 (100.0%) | $44,427 |
Occupancy by Householder Income Bracket in Espanola
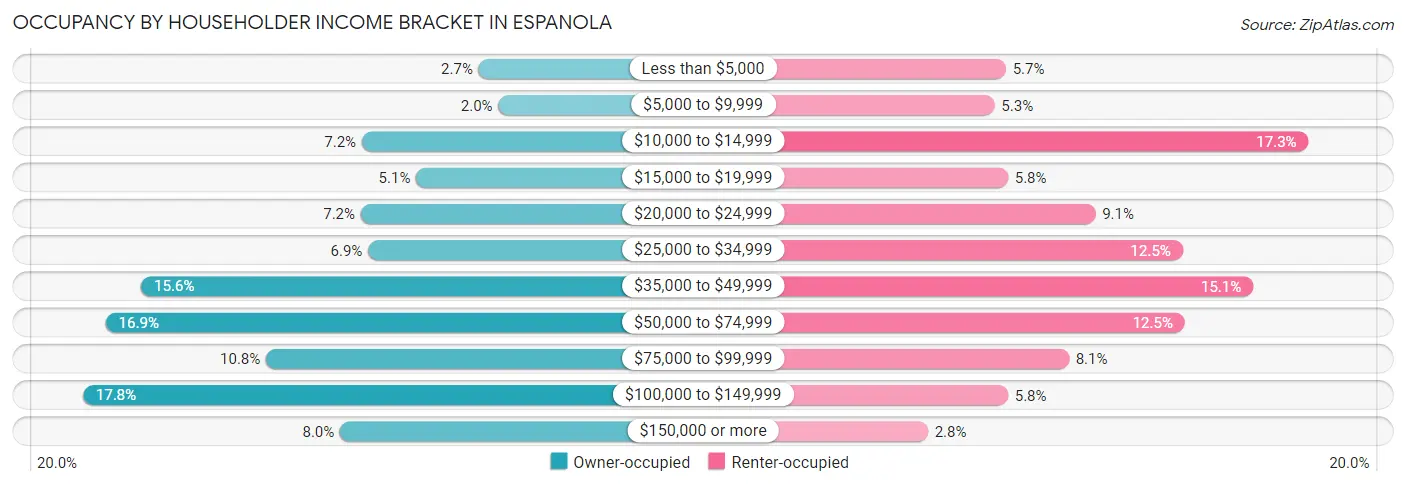
| Income Bracket | Owner-occupied | Renter-occupied |
| Less than $5,000 | 68 (2.7%) | 79 (5.7%) |
| $5,000 to $9,999 | 49 (1.9%) | 73 (5.3%) |
| $10,000 to $14,999 | 180 (7.1%) | 238 (17.2%) |
| $15,000 to $19,999 | 128 (5.1%) | 80 (5.8%) |
| $20,000 to $24,999 | 181 (7.2%) | 126 (9.1%) |
| $25,000 to $34,999 | 174 (6.9%) | 172 (12.5%) |
| $35,000 to $49,999 | 392 (15.6%) | 209 (15.1%) |
| $50,000 to $74,999 | 426 (16.9%) | 173 (12.5%) |
| $75,000 to $99,999 | 272 (10.8%) | 112 (8.1%) |
| $100,000 to $149,999 | 448 (17.8%) | 80 (5.8%) |
| $150,000 or more | 201 (8.0%) | 38 (2.8%) |
| Total | 2,519 (100.0%) | 1,380 (100.0%) |
Monthly Housing Cost Tiers in Espanola
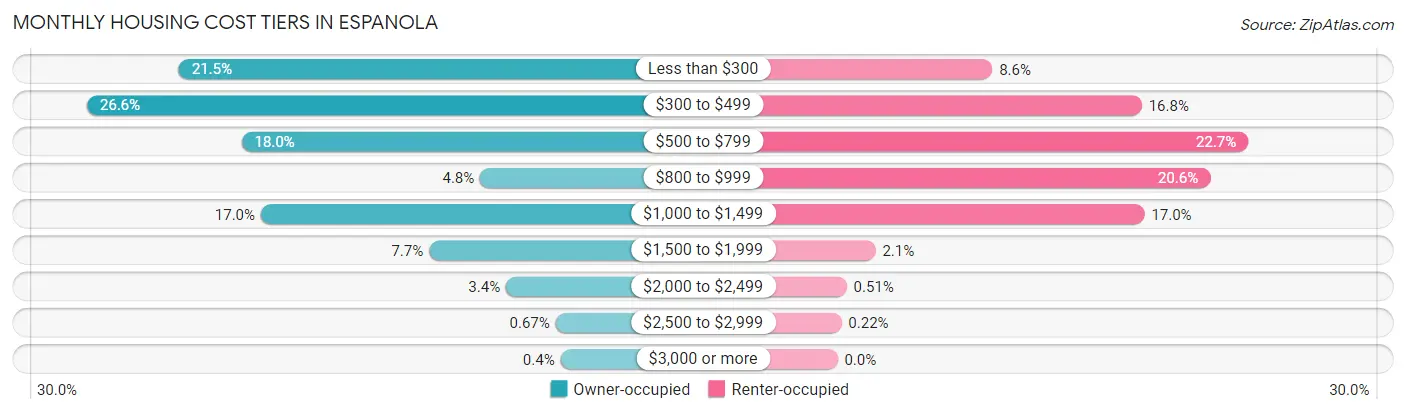
| Monthly Cost | Owner-occupied | Renter-occupied |
| Less than $300 | 541 (21.5%) | 118 (8.6%) |
| $300 to $499 | 669 (26.6%) | 232 (16.8%) |
| $500 to $799 | 454 (18.0%) | 313 (22.7%) |
| $800 to $999 | 122 (4.8%) | 284 (20.6%) |
| $1,000 to $1,499 | 427 (17.0%) | 234 (17.0%) |
| $1,500 to $1,999 | 193 (7.7%) | 29 (2.1%) |
| $2,000 to $2,499 | 86 (3.4%) | 7 (0.5%) |
| $2,500 to $2,999 | 17 (0.7%) | 3 (0.2%) |
| $3,000 or more | 10 (0.4%) | 0 (0.0%) |
| Total | 2,519 (100.0%) | 1,380 (100.0%) |
Physical Housing Characteristics in Espanola
Housing Structures in Espanola
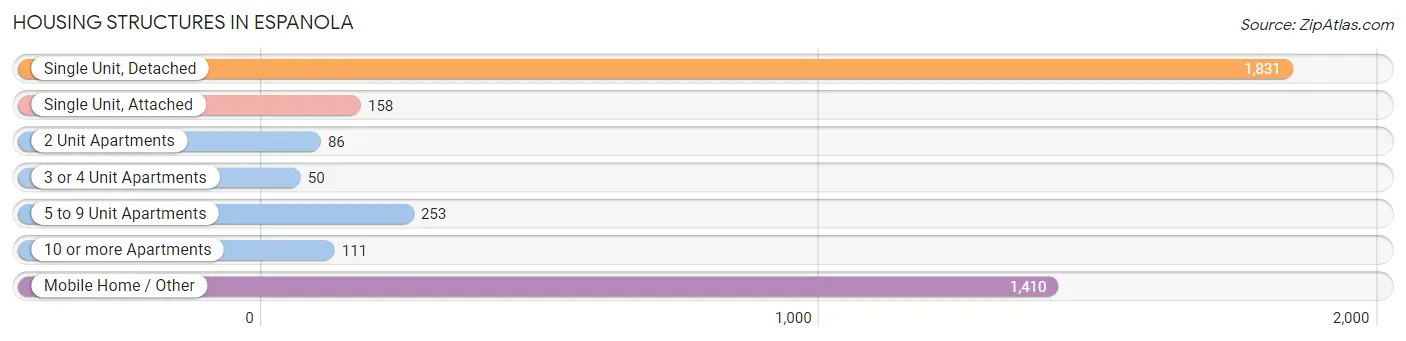
| Structure Type | # Housing Units | % Housing Units |
| Single Unit, Detached | 1,831 | 47.0% |
| Single Unit, Attached | 158 | 4.1% |
| 2 Unit Apartments | 86 | 2.2% |
| 3 or 4 Unit Apartments | 50 | 1.3% |
| 5 to 9 Unit Apartments | 253 | 6.5% |
| 10 or more Apartments | 111 | 2.9% |
| Mobile Home / Other | 1,410 | 36.2% |
| Total | 3,899 | 100.0% |
Housing Structures by Occupancy in Espanola
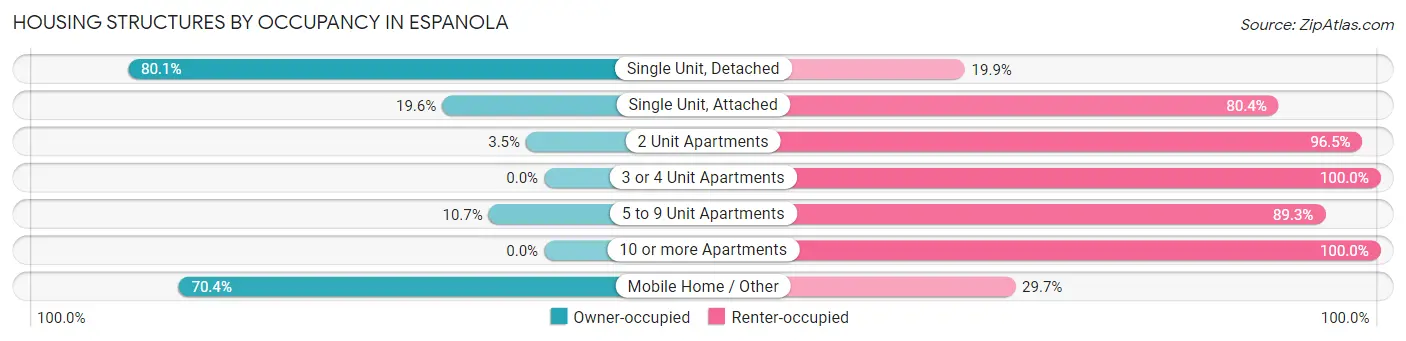
| Structure Type | Owner-occupied | Renter-occupied |
| Single Unit, Detached | 1,466 (80.1%) | 365 (19.9%) |
| Single Unit, Attached | 31 (19.6%) | 127 (80.4%) |
| 2 Unit Apartments | 3 (3.5%) | 83 (96.5%) |
| 3 or 4 Unit Apartments | 0 (0.0%) | 50 (100.0%) |
| 5 to 9 Unit Apartments | 27 (10.7%) | 226 (89.3%) |
| 10 or more Apartments | 0 (0.0%) | 111 (100.0%) |
| Mobile Home / Other | 992 (70.4%) | 418 (29.6%) |
| Total | 2,519 (64.6%) | 1,380 (35.4%) |
Housing Structures by Number of Rooms in Espanola
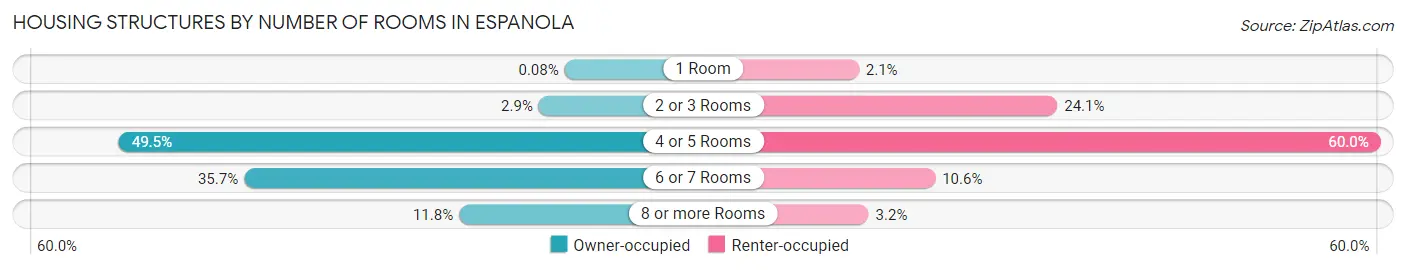
| Number of Rooms | Owner-occupied | Renter-occupied |
| 1 Room | 2 (0.1%) | 29 (2.1%) |
| 2 or 3 Rooms | 74 (2.9%) | 333 (24.1%) |
| 4 or 5 Rooms | 1,248 (49.5%) | 828 (60.0%) |
| 6 or 7 Rooms | 898 (35.6%) | 146 (10.6%) |
| 8 or more Rooms | 297 (11.8%) | 44 (3.2%) |
| Total | 2,519 (100.0%) | 1,380 (100.0%) |
Housing Structure by Heating Type in Espanola
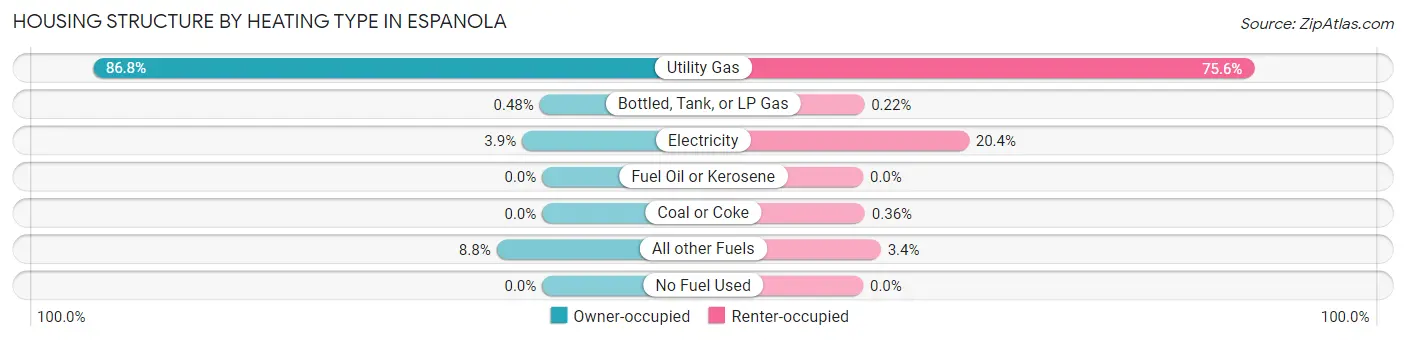
| Heating Type | Owner-occupied | Renter-occupied |
| Utility Gas | 2,187 (86.8%) | 1,043 (75.6%) |
| Bottled, Tank, or LP Gas | 12 (0.5%) | 3 (0.2%) |
| Electricity | 98 (3.9%) | 282 (20.4%) |
| Fuel Oil or Kerosene | 0 (0.0%) | 0 (0.0%) |
| Coal or Coke | 0 (0.0%) | 5 (0.4%) |
| All other Fuels | 222 (8.8%) | 47 (3.4%) |
| No Fuel Used | 0 (0.0%) | 0 (0.0%) |
| Total | 2,519 (100.0%) | 1,380 (100.0%) |
Household Vehicle Usage in Espanola
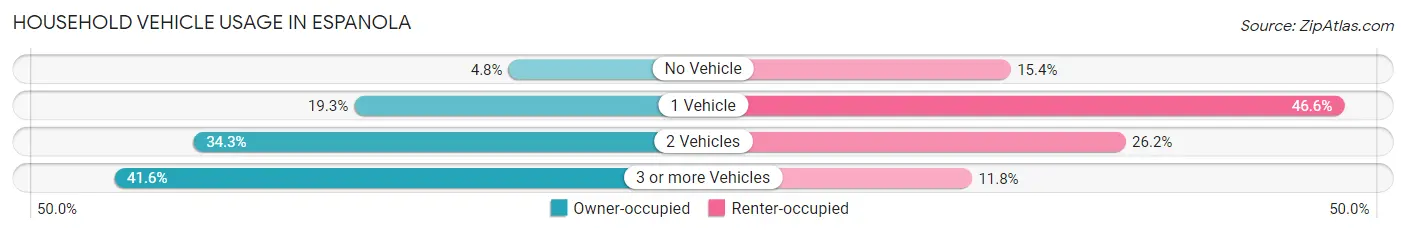
| Vehicles per Household | Owner-occupied | Renter-occupied |
| No Vehicle | 122 (4.8%) | 213 (15.4%) |
| 1 Vehicle | 485 (19.3%) | 643 (46.6%) |
| 2 Vehicles | 863 (34.3%) | 361 (26.2%) |
| 3 or more Vehicles | 1,049 (41.6%) | 163 (11.8%) |
| Total | 2,519 (100.0%) | 1,380 (100.0%) |
Real Estate & Mortgages in Espanola
Real Estate and Mortgage Overview in Espanola
| Characteristic | Without Mortgage | With Mortgage |
| Housing Units | 1,625 | 894 |
| Median Property Value | $150,400 | $225,900 |
| Median Household Income | $49,241 | $130 |
| Monthly Housing Costs | $355 | $10 |
| Real Estate Taxes | $830 | $103 |
Property Value by Mortgage Status in Espanola
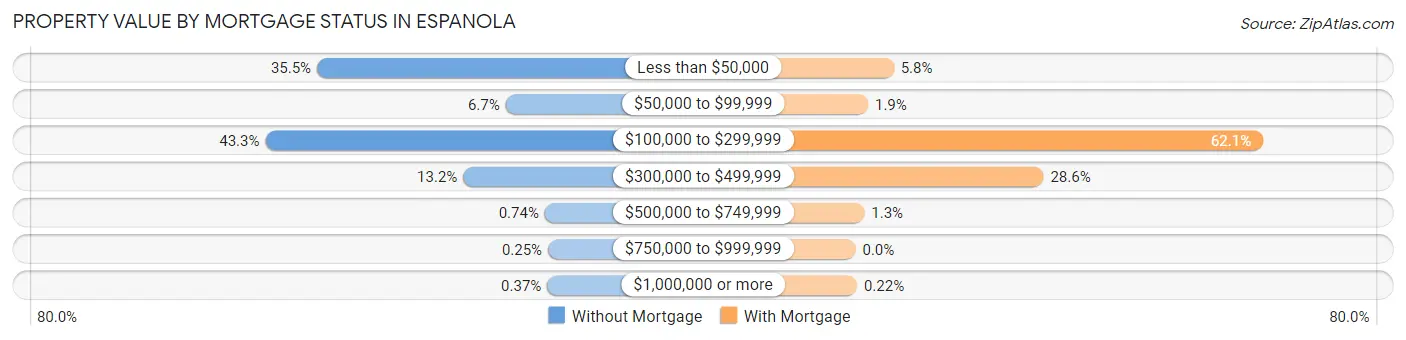
| Property Value | Without Mortgage | With Mortgage |
| Less than $50,000 | 576 (35.4%) | 52 (5.8%) |
| $50,000 to $99,999 | 109 (6.7%) | 17 (1.9%) |
| $100,000 to $299,999 | 704 (43.3%) | 555 (62.1%) |
| $300,000 to $499,999 | 214 (13.2%) | 256 (28.6%) |
| $500,000 to $749,999 | 12 (0.7%) | 12 (1.3%) |
| $750,000 to $999,999 | 4 (0.3%) | 0 (0.0%) |
| $1,000,000 or more | 6 (0.4%) | 2 (0.2%) |
| Total | 1,625 (100.0%) | 894 (100.0%) |
Household Income by Mortgage Status in Espanola
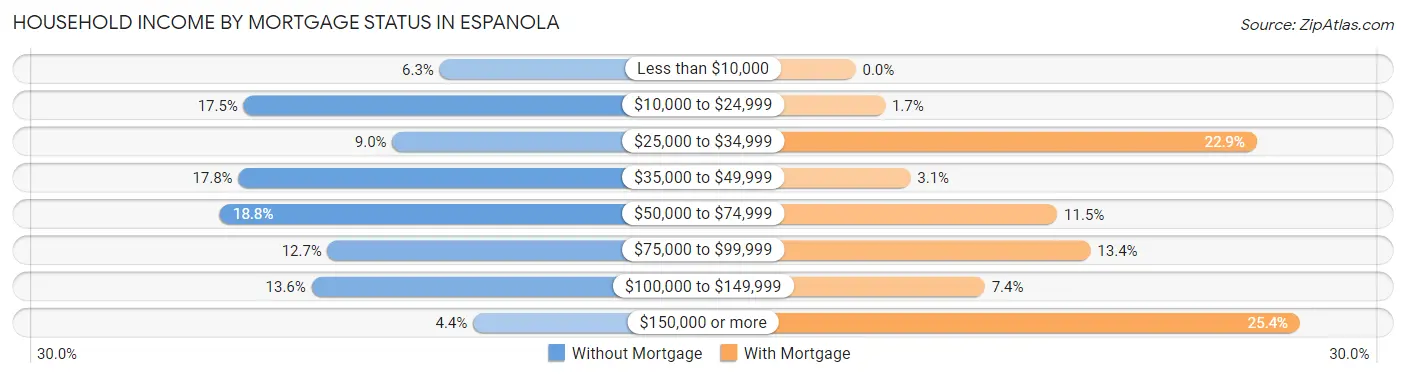
| Household Income | Without Mortgage | With Mortgage |
| Less than $10,000 | 102 (6.3%) | 0 (0.0%) |
| $10,000 to $24,999 | 284 (17.5%) | 15 (1.7%) |
| $25,000 to $34,999 | 146 (9.0%) | 205 (22.9%) |
| $35,000 to $49,999 | 289 (17.8%) | 28 (3.1%) |
| $50,000 to $74,999 | 306 (18.8%) | 103 (11.5%) |
| $75,000 to $99,999 | 206 (12.7%) | 120 (13.4%) |
| $100,000 to $149,999 | 221 (13.6%) | 66 (7.4%) |
| $150,000 or more | 71 (4.4%) | 227 (25.4%) |
| Total | 1,625 (100.0%) | 894 (100.0%) |
Property Value to Household Income Ratio in Espanola
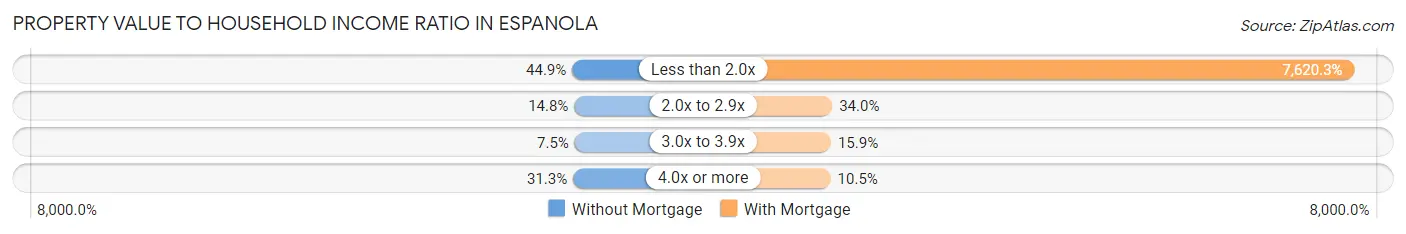
| Value-to-Income Ratio | Without Mortgage | With Mortgage |
| Less than 2.0x | 729 (44.9%) | 68,125 (7,620.3%) |
| 2.0x to 2.9x | 240 (14.8%) | 304 (34.0%) |
| 3.0x to 3.9x | 122 (7.5%) | 142 (15.9%) |
| 4.0x or more | 508 (31.3%) | 94 (10.5%) |
| Total | 1,625 (100.0%) | 894 (100.0%) |
Real Estate Taxes by Mortgage Status in Espanola
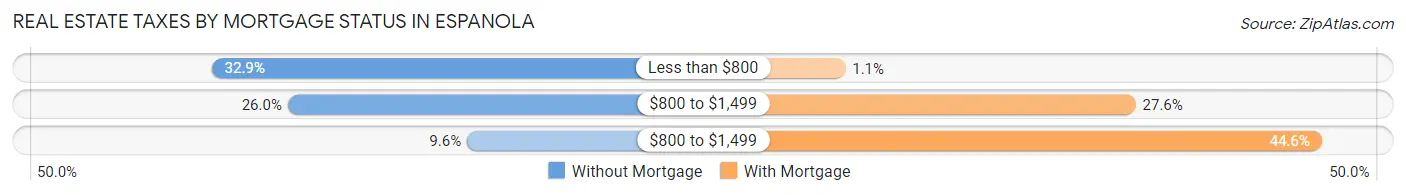
| Property Taxes | Without Mortgage | With Mortgage |
| Less than $800 | 535 (32.9%) | 10 (1.1%) |
| $800 to $1,499 | 422 (26.0%) | 247 (27.6%) |
| $800 to $1,499 | 156 (9.6%) | 399 (44.6%) |
| Total | 1,625 (100.0%) | 894 (100.0%) |
Health & Disability in Espanola
Health Insurance Coverage by Age in Espanola
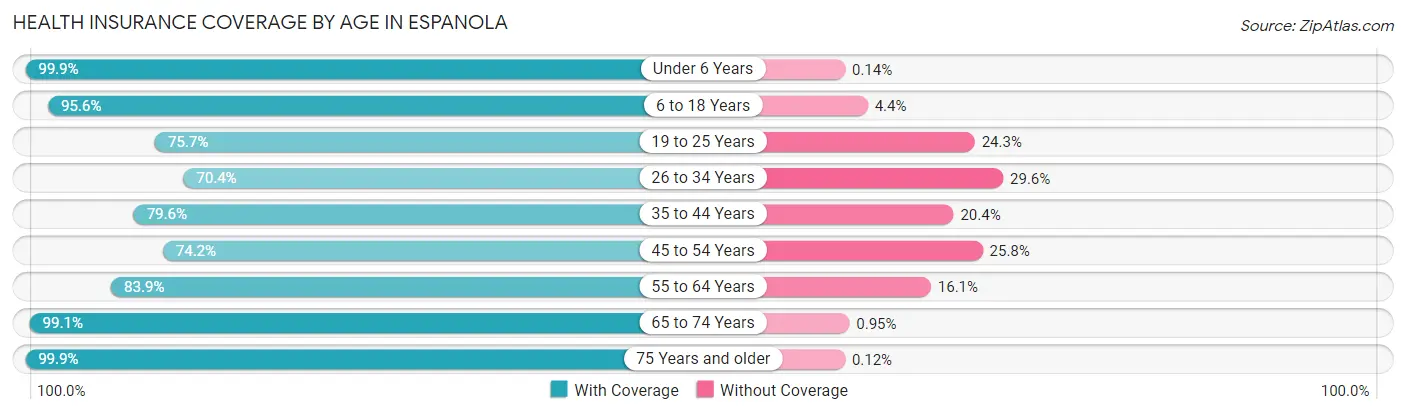
| Age Bracket | With Coverage | Without Coverage |
| Under 6 Years | 730 (99.9%) | 1 (0.1%) |
| 6 to 18 Years | 2,056 (95.6%) | 94 (4.4%) |
| 19 to 25 Years | 893 (75.7%) | 287 (24.3%) |
| 26 to 34 Years | 765 (70.4%) | 322 (29.6%) |
| 35 to 44 Years | 841 (79.6%) | 215 (20.4%) |
| 45 to 54 Years | 872 (74.2%) | 303 (25.8%) |
| 55 to 64 Years | 1,003 (83.9%) | 193 (16.1%) |
| 65 to 74 Years | 1,041 (99.1%) | 10 (0.9%) |
| 75 Years and older | 805 (99.9%) | 1 (0.1%) |
| Total | 9,006 (86.3%) | 1,426 (13.7%) |
Health Insurance Coverage by Citizenship Status in Espanola
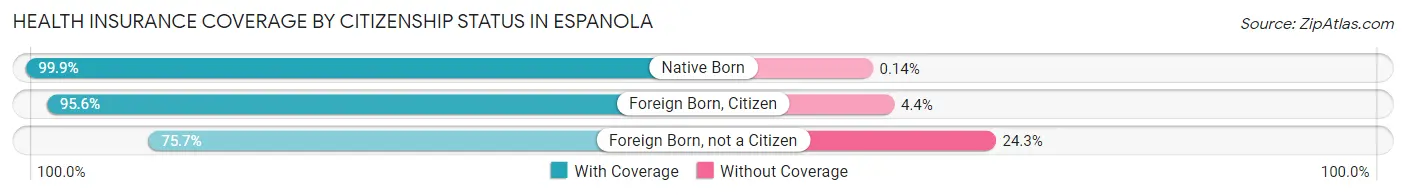
| Citizenship Status | With Coverage | Without Coverage |
| Native Born | 730 (99.9%) | 1 (0.1%) |
| Foreign Born, Citizen | 2,056 (95.6%) | 94 (4.4%) |
| Foreign Born, not a Citizen | 893 (75.7%) | 287 (24.3%) |
Health Insurance Coverage by Household Income in Espanola
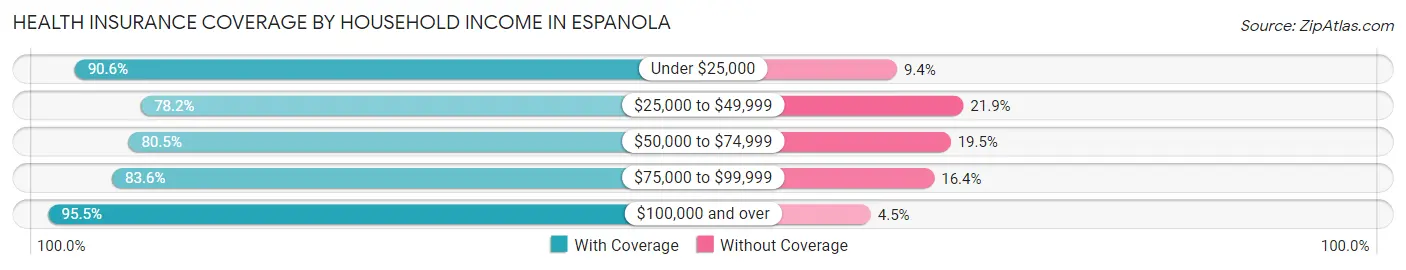
| Household Income | With Coverage | Without Coverage |
| Under $25,000 | 1,803 (90.6%) | 187 (9.4%) |
| $25,000 to $49,999 | 1,788 (78.1%) | 500 (21.8%) |
| $50,000 to $74,999 | 1,530 (80.5%) | 370 (19.5%) |
| $75,000 to $99,999 | 1,254 (83.6%) | 246 (16.4%) |
| $100,000 and over | 2,604 (95.5%) | 123 (4.5%) |
Public vs Private Health Insurance Coverage by Age in Espanola
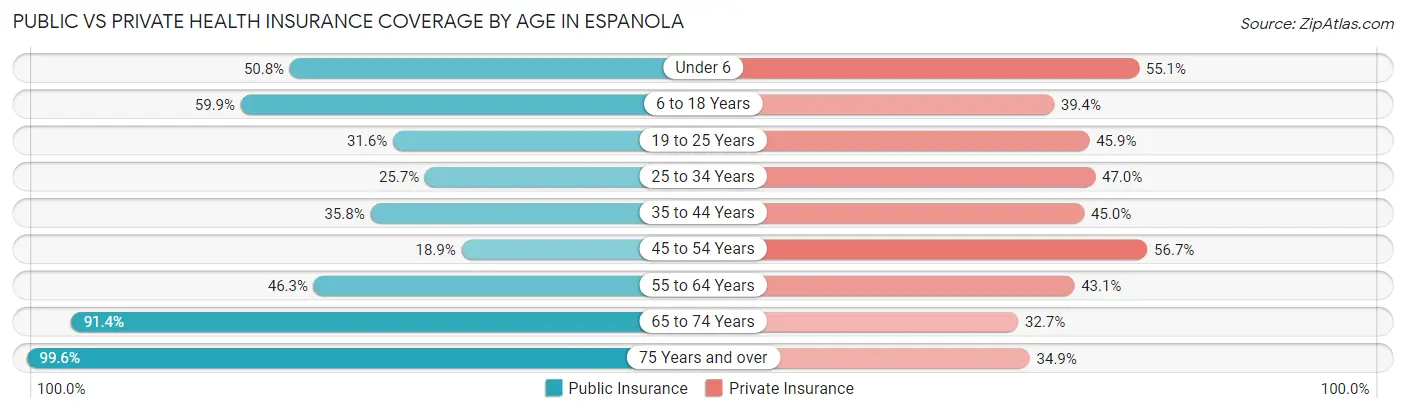
| Age Bracket | Public Insurance | Private Insurance |
| Under 6 | 371 (50.7%) | 403 (55.1%) |
| 6 to 18 Years | 1,287 (59.9%) | 846 (39.4%) |
| 19 to 25 Years | 373 (31.6%) | 542 (45.9%) |
| 25 to 34 Years | 279 (25.7%) | 511 (47.0%) |
| 35 to 44 Years | 378 (35.8%) | 475 (45.0%) |
| 45 to 54 Years | 222 (18.9%) | 666 (56.7%) |
| 55 to 64 Years | 554 (46.3%) | 516 (43.1%) |
| 65 to 74 Years | 961 (91.4%) | 344 (32.7%) |
| 75 Years and over | 803 (99.6%) | 281 (34.9%) |
| Total | 5,228 (50.1%) | 4,584 (43.9%) |
Disability Status by Sex by Age in Espanola
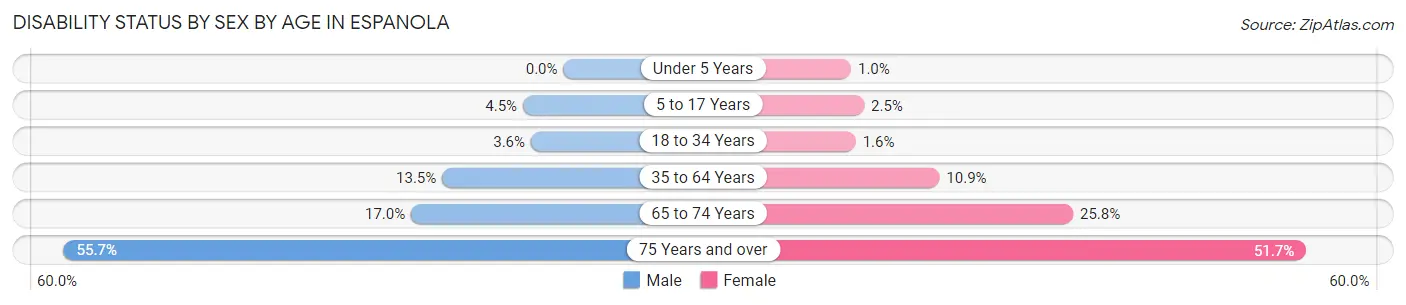
| Age Bracket | Male | Female |
| Under 5 Years | 0 (0.0%) | 3 (1.0%) |
| 5 to 17 Years | 43 (4.5%) | 28 (2.5%) |
| 18 to 34 Years | 49 (3.6%) | 18 (1.5%) |
| 35 to 64 Years | 228 (13.5%) | 189 (10.9%) |
| 65 to 74 Years | 88 (17.0%) | 137 (25.8%) |
| 75 Years and over | 187 (55.6%) | 243 (51.7%) |
Disability Class by Sex by Age in Espanola
Disability Class: Hearing Difficulty
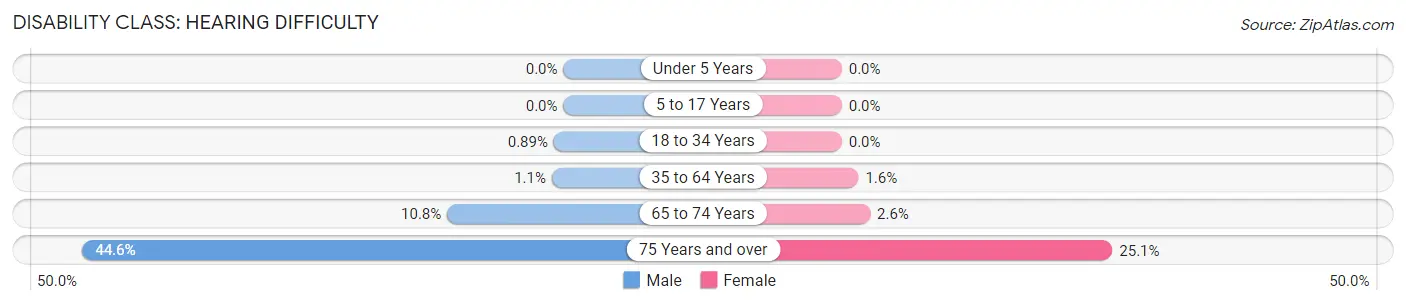
| Age Bracket | Male | Female |
| Under 5 Years | 0 (0.0%) | 0 (0.0%) |
| 5 to 17 Years | 0 (0.0%) | 0 (0.0%) |
| 18 to 34 Years | 12 (0.9%) | 0 (0.0%) |
| 35 to 64 Years | 18 (1.1%) | 27 (1.5%) |
| 65 to 74 Years | 56 (10.8%) | 14 (2.6%) |
| 75 Years and over | 150 (44.6%) | 118 (25.1%) |
Disability Class: Vision Difficulty
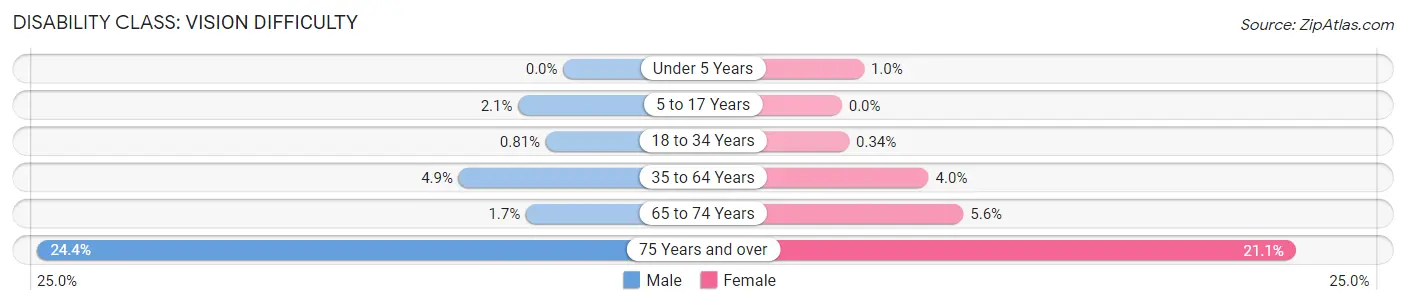
| Age Bracket | Male | Female |
| Under 5 Years | 0 (0.0%) | 3 (1.0%) |
| 5 to 17 Years | 20 (2.1%) | 0 (0.0%) |
| 18 to 34 Years | 11 (0.8%) | 4 (0.3%) |
| 35 to 64 Years | 82 (4.9%) | 70 (4.0%) |
| 65 to 74 Years | 9 (1.7%) | 30 (5.6%) |
| 75 Years and over | 82 (24.4%) | 99 (21.1%) |
Disability Class: Cognitive Difficulty
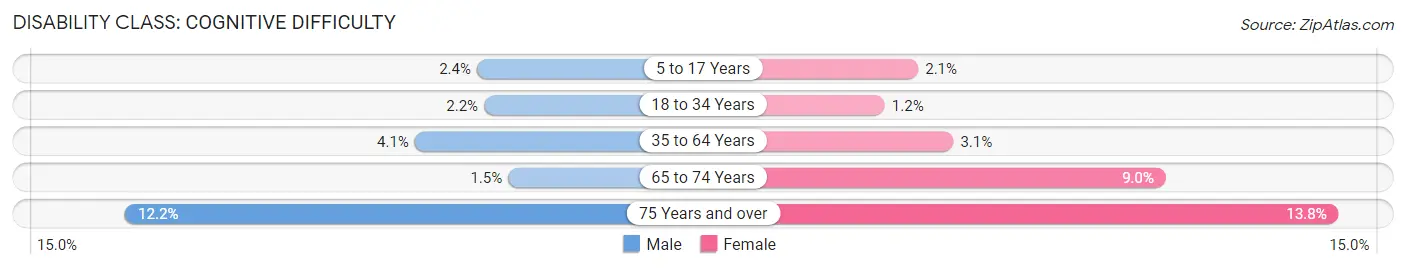
| Age Bracket | Male | Female |
| 5 to 17 Years | 23 (2.4%) | 24 (2.1%) |
| 18 to 34 Years | 30 (2.2%) | 14 (1.2%) |
| 35 to 64 Years | 70 (4.1%) | 54 (3.1%) |
| 65 to 74 Years | 8 (1.5%) | 48 (9.0%) |
| 75 Years and over | 41 (12.2%) | 65 (13.8%) |
Disability Class: Ambulatory Difficulty
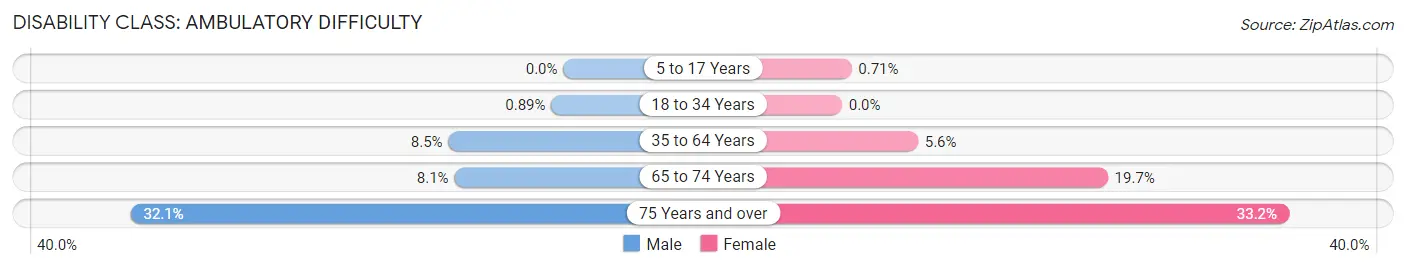
| Age Bracket | Male | Female |
| 5 to 17 Years | 0 (0.0%) | 8 (0.7%) |
| 18 to 34 Years | 12 (0.9%) | 0 (0.0%) |
| 35 to 64 Years | 144 (8.5%) | 98 (5.6%) |
| 65 to 74 Years | 42 (8.1%) | 105 (19.7%) |
| 75 Years and over | 108 (32.1%) | 156 (33.2%) |
Disability Class: Self-Care Difficulty
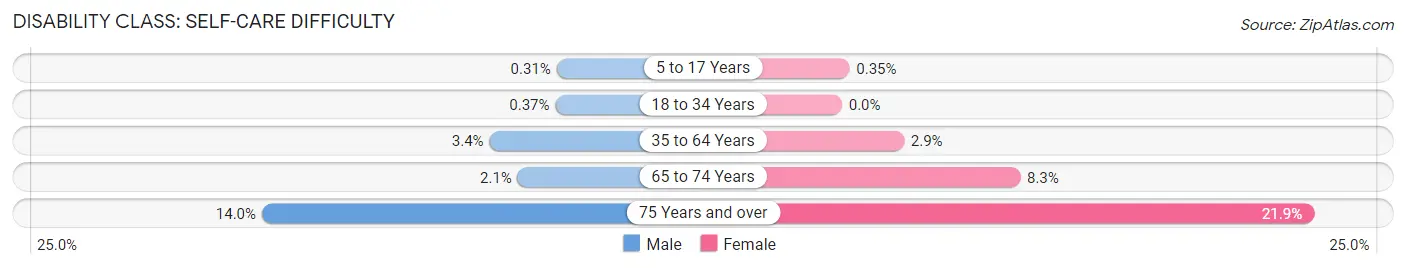
| Age Bracket | Male | Female |
| 5 to 17 Years | 3 (0.3%) | 4 (0.4%) |
| 18 to 34 Years | 5 (0.4%) | 0 (0.0%) |
| 35 to 64 Years | 58 (3.4%) | 50 (2.9%) |
| 65 to 74 Years | 11 (2.1%) | 44 (8.3%) |
| 75 Years and over | 47 (14.0%) | 103 (21.9%) |
Technology Access in Espanola
Computing Device Access in Espanola
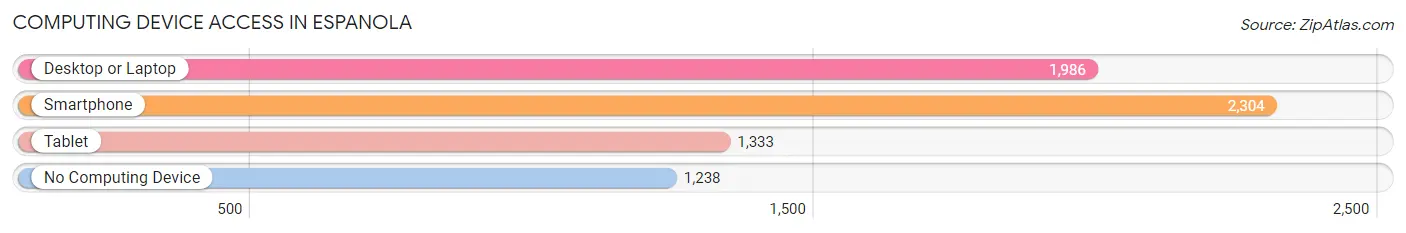
| Device Type | # Households | % Households |
| Desktop or Laptop | 1,986 | 50.9% |
| Smartphone | 2,304 | 59.1% |
| Tablet | 1,333 | 34.2% |
| No Computing Device | 1,238 | 31.8% |
| Total | 3,899 | 100.0% |
Internet Access in Espanola
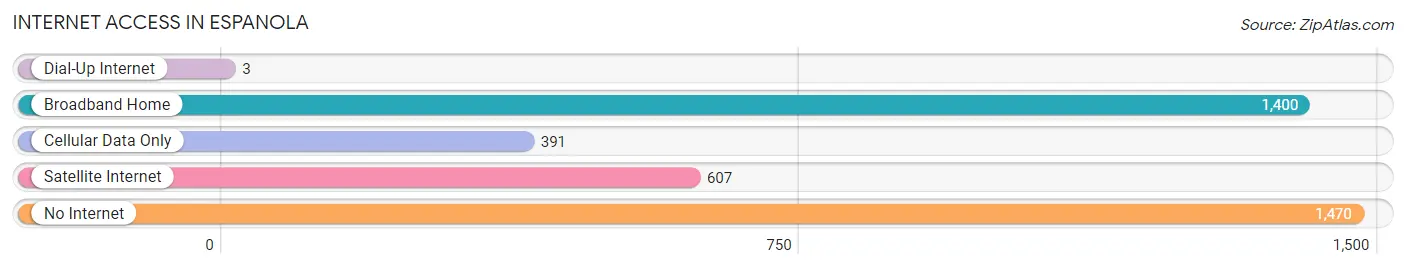
| Internet Type | # Households | % Households |
| Dial-Up Internet | 3 | 0.1% |
| Broadband Home | 1,400 | 35.9% |
| Cellular Data Only | 391 | 10.0% |
| Satellite Internet | 607 | 15.6% |
| No Internet | 1,470 | 37.7% |
| Total | 3,899 | 100.0% |
Espanola Summary
Espanola, New Mexico is a small city located in the northern part of the state, in Rio Arriba County. It is situated on the banks of the Rio Grande, and is the county seat of Rio Arriba County. The city is located about 30 miles north of Santa Fe, and is part of the Santa Fe Metropolitan Statistical Area. The city has a population of approximately 10,000 people, and is the largest city in the county.
History
Espanola was founded in 1706 by Spanish settlers, and was originally known as San Juan de los Caballeros. The city was named after the Spanish word for “Spanish”, and was the first permanent settlement in the area. The city was an important trading post for the Spanish, and was the site of several battles during the Mexican-American War.
In the late 19th century, the city began to grow and develop, and by the early 20th century, it had become an important agricultural center. The city was also home to several large industries, including a woolen mill, a flour mill, and a brick factory.
Geography
Espanola is located in the northern part of New Mexico, in Rio Arriba County. The city is situated on the banks of the Rio Grande, and is surrounded by the Sangre de Cristo Mountains to the east and the Jemez Mountains to the west. The city has a total area of 4.3 square miles, and has an elevation of 5,890 feet.
Economy
Espanola’s economy is largely based on agriculture and tourism. The city is home to several large farms, and is a major producer of chile peppers, onions, and other vegetables. The city is also home to several tourist attractions, including the Espanola Valley Museum, the Espanola Valley Historical Society, and the Espanola Valley Arts Council.
Demographics
As of the 2010 census, Espanola had a population of 10,209 people. The racial makeup of the city was 63.3% Hispanic or Latino, 28.2% White, 0.7% African American, 0.3% Native American, 0.2% Asian, and 6.5% from other races. The median household income was $25,945, and the median family income was $31,945. The per capita income was $14,945.
Espanola is a small city with a rich history and culture. The city is home to a diverse population, and is an important agricultural center. The city is also home to several tourist attractions, and is a great place to visit and explore.
Common Questions
What is Per Capita Income in Espanola?
Per Capita income in Espanola is $25,322.
What is the Median Family Income in Espanola?
Median Family Income in Espanola is $59,242.
What is the Median Household income in Espanola?
Median Household Income in Espanola is $44,427.
What is Income or Wage Gap in Espanola?
Income or Wage Gap in Espanola is 31.4%.
Women in Espanola earn 68.6 cents for every dollar earned by a man.
What is Family Income Deficit in Espanola?
Family Income Deficit in Espanola is $9,372.
Families that are below poverty line in Espanola earn $9,372 less on average than the poverty threshold level.
What is Inequality or Gini Index in Espanola?
Inequality or Gini Index in Espanola is 0.47.
What is the Total Population of Espanola?
Total Population of Espanola is 10,473.
What is the Total Male Population of Espanola?
Total Male Population of Espanola is 5,128.
What is the Total Female Population of Espanola?
Total Female Population of Espanola is 5,345.
What is the Ratio of Males per 100 Females in Espanola?
There are 95.94 Males per 100 Females in Espanola.
What is the Ratio of Females per 100 Males in Espanola?
There are 104.23 Females per 100 Males in Espanola.
What is the Median Population Age in Espanola?
Median Population Age in Espanola is 35.6 Years.
What is the Average Family Size in Espanola
Average Family Size in Espanola is 3.7 People.
What is the Average Household Size in Espanola
Average Household Size in Espanola is 2.7 People.
How Large is the Labor Force in Espanola?
There are 4,455 People in the Labor Forcein in Espanola.
What is the Percentage of People in the Labor Force in Espanola?
55.3% of People are in the Labor Force in Espanola.
What is the Unemployment Rate in Espanola?
Unemployment Rate in Espanola is 5.3%.