Edgewood, NM Map & Demographics
Edgewood Map
Edgewood Overview
$34,164
PER CAPITA INCOME
$76,295
AVG FAMILY INCOME
$70,568
AVG HOUSEHOLD INCOME
38.2%
WAGE / INCOME GAP [ % ]
61.8¢/ $1
WAGE / INCOME GAP [ $ ]
$8,483
FAMILY INCOME DEFICIT
0.42
INEQUALITY / GINI INDEX
6,113
TOTAL POPULATION
3,213
MALE POPULATION
2,900
FEMALE POPULATION
110.79
MALES / 100 FEMALES
90.26
FEMALES / 100 MALES
41.2
MEDIAN AGE
3.2
AVG FAMILY SIZE
2.8
AVG HOUSEHOLD SIZE
2,888
LABOR FORCE [ PEOPLE ]
59.1%
PERCENT IN LABOR FORCE
6.6%
UNEMPLOYMENT RATE
Edgewood Zip Codes
Edgewood Area Codes
Income in Edgewood
Income Overview in Edgewood
Per Capita Income in Edgewood is $34,164, while median incomes of families and households are $76,295 and $70,568 respectively.
| Characteristic | Number | Measure |
| Per Capita Income | 6,113 | $34,164 |
| Median Family Income | 1,642 | $76,295 |
| Mean Family Income | 1,642 | $90,903 |
| Median Household Income | 2,220 | $70,568 |
| Mean Household Income | 2,220 | $89,070 |
| Income Deficit | 1,642 | $8,483 |
| Wage / Income Gap (%) | 6,113 | 38.17% |
| Wage / Income Gap ($) | 6,113 | 61.83¢ per $1 |
| Gini / Inequality Index | 6,113 | 0.42 |
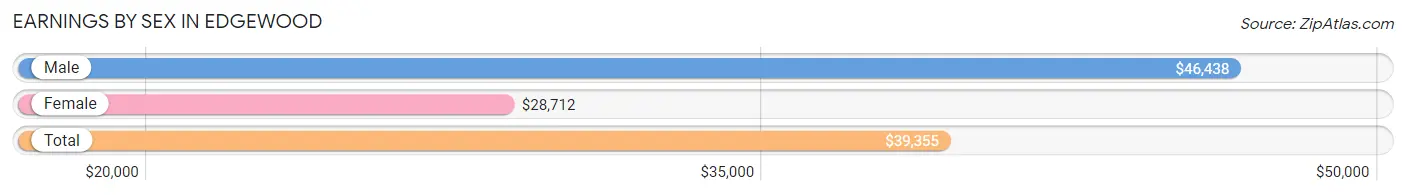
Earnings by Sex in Edgewood
Average Earnings in Edgewood are $39,355, $46,438 for men and $28,712 for women, a difference of 38.2%.
| Sex | Number | Average Earnings |
| Male | 1,653 (56.0%) | $46,438 |
| Female | 1,301 (44.0%) | $28,712 |
| Total | 2,954 (100.0%) | $39,355 |
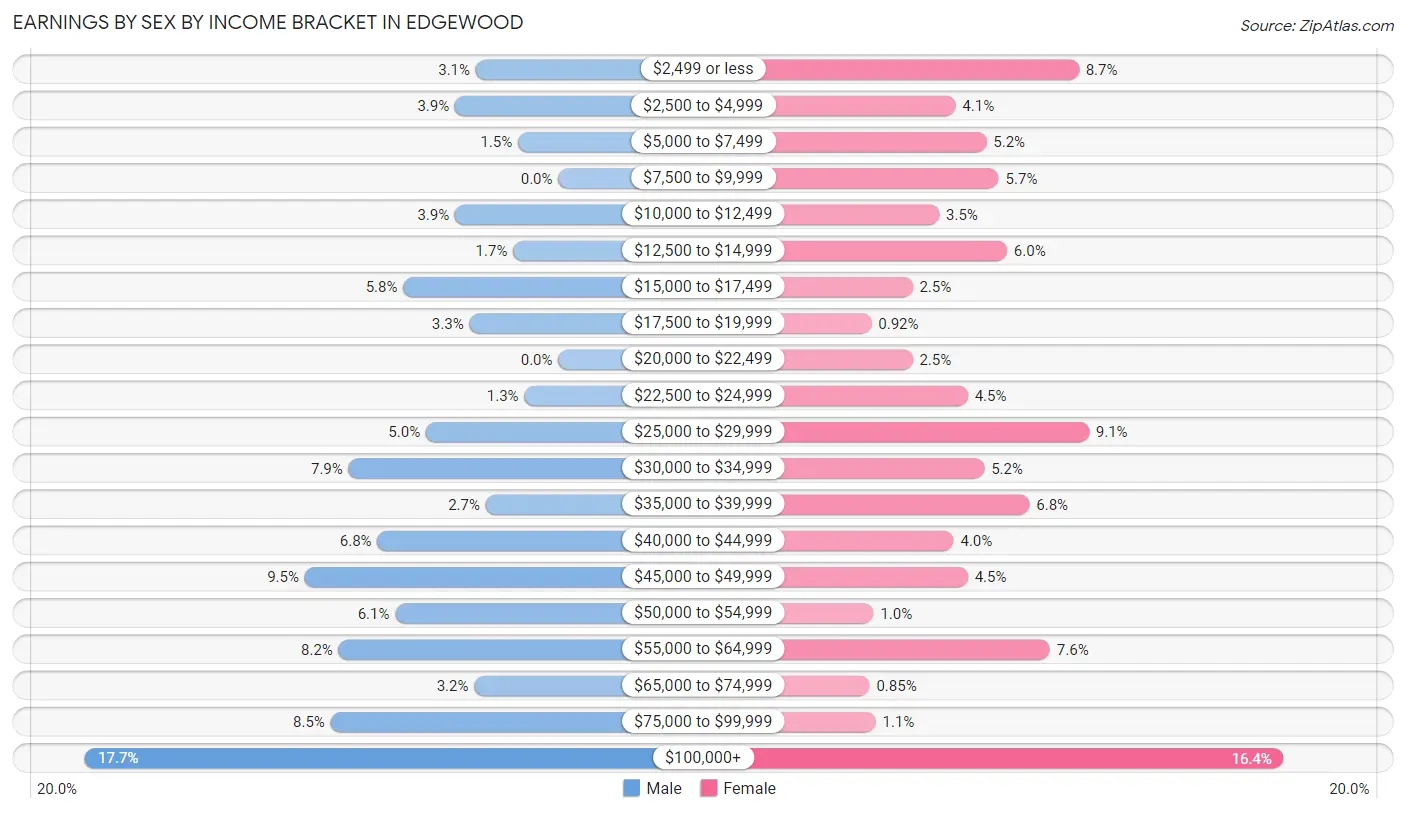
Earnings by Sex by Income Bracket in Edgewood
The most common earnings brackets in Edgewood are $100,000+ for men (293 | 17.7%) and $100,000+ for women (213 | 16.4%).
| Income | Male | Female |
| $2,499 or less | 51 (3.1%) | 113 (8.7%) |
| $2,500 to $4,999 | 64 (3.9%) | 53 (4.1%) |
| $5,000 to $7,499 | 25 (1.5%) | 68 (5.2%) |
| $7,500 to $9,999 | 0 (0.0%) | 74 (5.7%) |
| $10,000 to $12,499 | 64 (3.9%) | 45 (3.5%) |
| $12,500 to $14,999 | 28 (1.7%) | 78 (6.0%) |
| $15,000 to $17,499 | 96 (5.8%) | 32 (2.5%) |
| $17,500 to $19,999 | 55 (3.3%) | 12 (0.9%) |
| $20,000 to $22,499 | 0 (0.0%) | 32 (2.5%) |
| $22,500 to $24,999 | 21 (1.3%) | 59 (4.5%) |
| $25,000 to $29,999 | 82 (5.0%) | 118 (9.1%) |
| $30,000 to $34,999 | 130 (7.9%) | 67 (5.1%) |
| $35,000 to $39,999 | 45 (2.7%) | 89 (6.8%) |
| $40,000 to $44,999 | 112 (6.8%) | 52 (4.0%) |
| $45,000 to $49,999 | 157 (9.5%) | 59 (4.5%) |
| $50,000 to $54,999 | 101 (6.1%) | 13 (1.0%) |
| $55,000 to $64,999 | 136 (8.2%) | 99 (7.6%) |
| $65,000 to $74,999 | 52 (3.2%) | 11 (0.9%) |
| $75,000 to $99,999 | 141 (8.5%) | 14 (1.1%) |
| $100,000+ | 293 (17.7%) | 213 (16.4%) |
| Total | 1,653 (100.0%) | 1,301 (100.0%) |
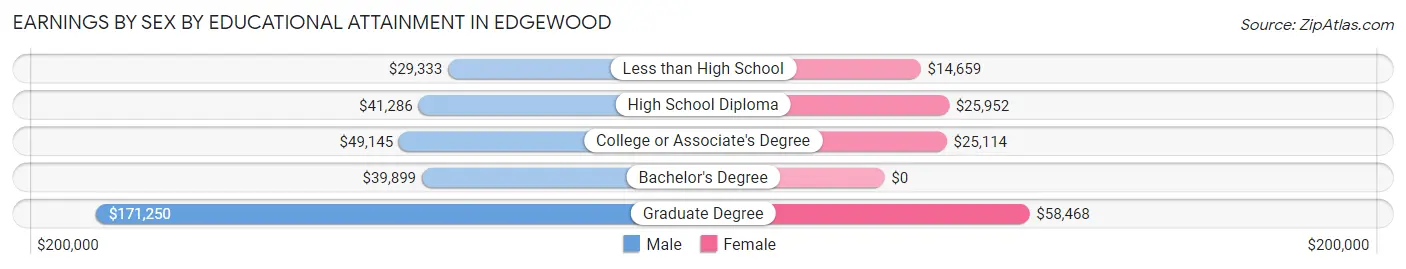
Earnings by Sex by Educational Attainment in Edgewood
Average earnings in Edgewood are $47,520 for men and $33,229 for women, a difference of 30.1%. Men with an educational attainment of graduate degree enjoy the highest average annual earnings of $171,250, while those with less than high school education earn the least with $29,333. Women with an educational attainment of graduate degree earn the most with the average annual earnings of $58,468, while those with less than high school education have the smallest earnings of $14,659.
| Educational Attainment | Male Income | Female Income |
| Less than High School | $29,333 | $14,659 |
| High School Diploma | $41,286 | $25,952 |
| College or Associate's Degree | $49,145 | $25,114 |
| Bachelor's Degree | $39,899 | $0 |
| Graduate Degree | $171,250 | $58,468 |
| Total | $47,520 | $33,229 |
Family Income in Edgewood
Family Income Brackets in Edgewood
According to the Edgewood family income data, there are 315 families falling into the $50,000 to $74,999 income range, which is the most common income bracket and makes up 19.2% of all families. Conversely, the less than $10,000 income bracket is the least frequent group with only 30 families (1.8%) belonging to this category.
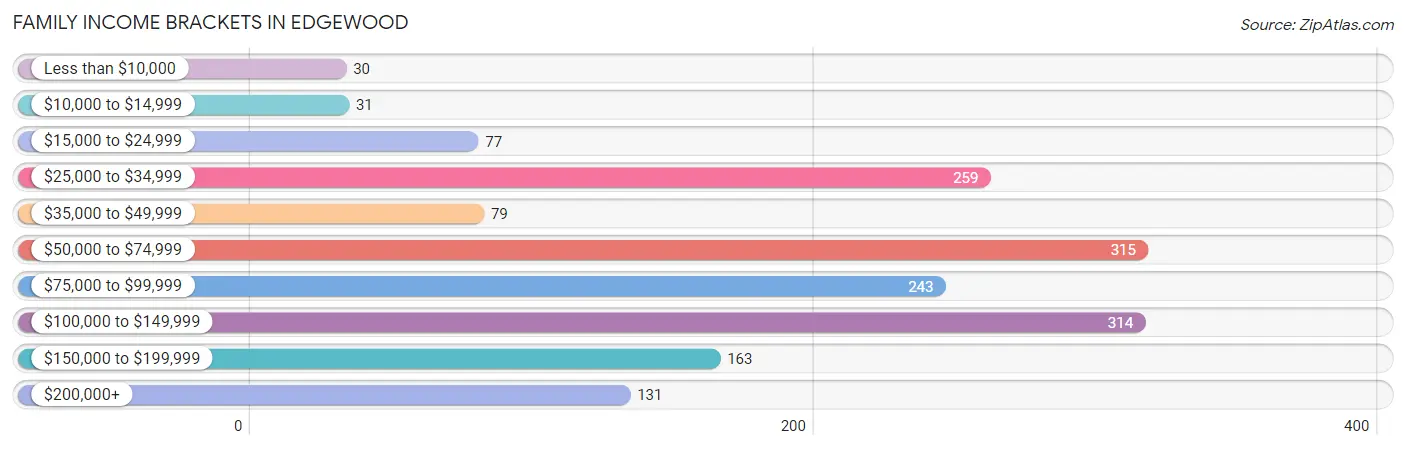
| Income Bracket | # Families | % Families |
| Less than $10,000 | 30 | 1.8% |
| $10,000 to $14,999 | 31 | 1.9% |
| $15,000 to $24,999 | 77 | 4.7% |
| $25,000 to $34,999 | 259 | 15.8% |
| $35,000 to $49,999 | 79 | 4.8% |
| $50,000 to $74,999 | 315 | 19.2% |
| $75,000 to $99,999 | 243 | 14.8% |
| $100,000 to $149,999 | 314 | 19.1% |
| $150,000 to $199,999 | 163 | 9.9% |
| $200,000+ | 131 | 8.0% |
Family Income by Famaliy Size in Edgewood
4-person families (296 | 18.0%) account for the highest median family income in Edgewood with $90,833 per family, while 2-person families (865 | 52.7%) have the highest median income of $35,938 per family member.
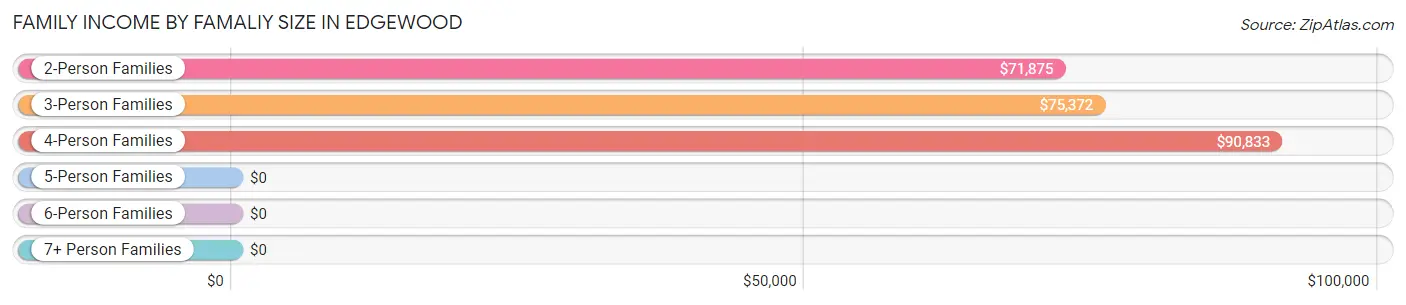
| Income Bracket | # Families | Median Income |
| 2-Person Families | 865 (52.7%) | $71,875 |
| 3-Person Families | 231 (14.1%) | $75,372 |
| 4-Person Families | 296 (18.0%) | $90,833 |
| 5-Person Families | 136 (8.3%) | $0 |
| 6-Person Families | 107 (6.5%) | $0 |
| 7+ Person Families | 7 (0.4%) | $0 |
| Total | 1,642 (100.0%) | $76,295 |
Family Income by Number of Earners in Edgewood
The median family income in Edgewood is $76,295, with families comprising 3+ earners (113) having the highest median family income of $183,393, while families with 1 earner (709) have the lowest median family income of $53,767, accounting for 6.9% and 43.2% of families, respectively.
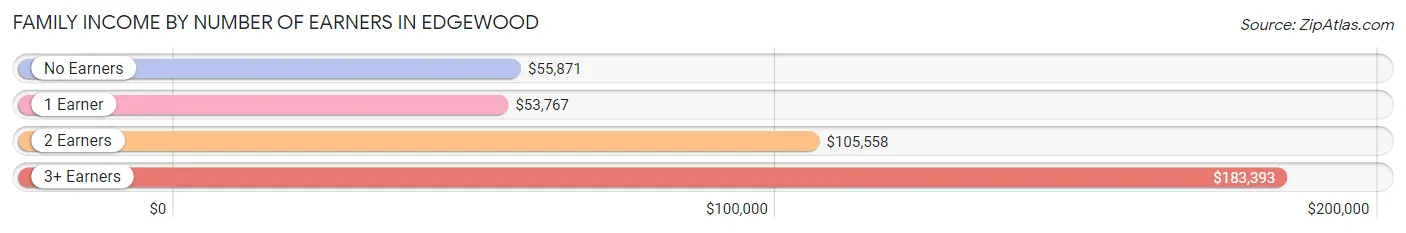
| Number of Earners | # Families | Median Income |
| No Earners | 251 (15.3%) | $55,871 |
| 1 Earner | 709 (43.2%) | $53,767 |
| 2 Earners | 569 (34.6%) | $105,558 |
| 3+ Earners | 113 (6.9%) | $183,393 |
| Total | 1,642 (100.0%) | $76,295 |
Household Income in Edgewood
Household Income Brackets in Edgewood
With 442 households falling in the category, the $50,000 to $74,999 income range is the most frequent in Edgewood, accounting for 19.9% of all households. In contrast, only 51 households (2.3%) fall into the $10,000 to $14,999 income bracket, making it the least populous group.
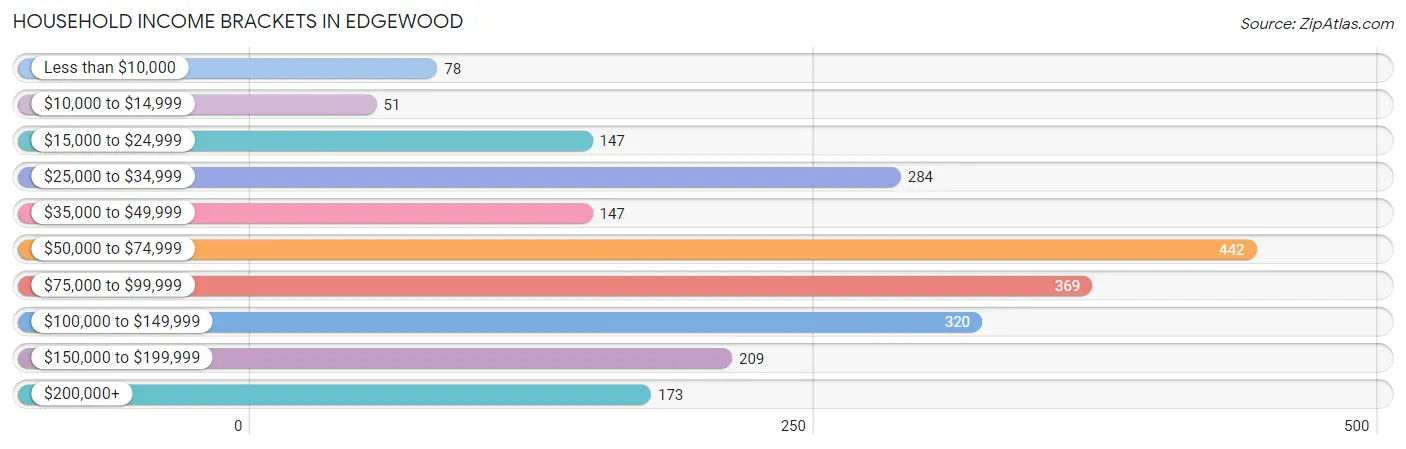
| Income Bracket | # Households | % Households |
| Less than $10,000 | 78 | 3.5% |
| $10,000 to $14,999 | 51 | 2.3% |
| $15,000 to $24,999 | 147 | 6.6% |
| $25,000 to $34,999 | 284 | 12.8% |
| $35,000 to $49,999 | 147 | 6.6% |
| $50,000 to $74,999 | 442 | 19.9% |
| $75,000 to $99,999 | 369 | 16.6% |
| $100,000 to $149,999 | 320 | 14.4% |
| $150,000 to $199,999 | 209 | 9.4% |
| $200,000+ | 173 | 7.8% |
Household Income by Householder Age in Edgewood
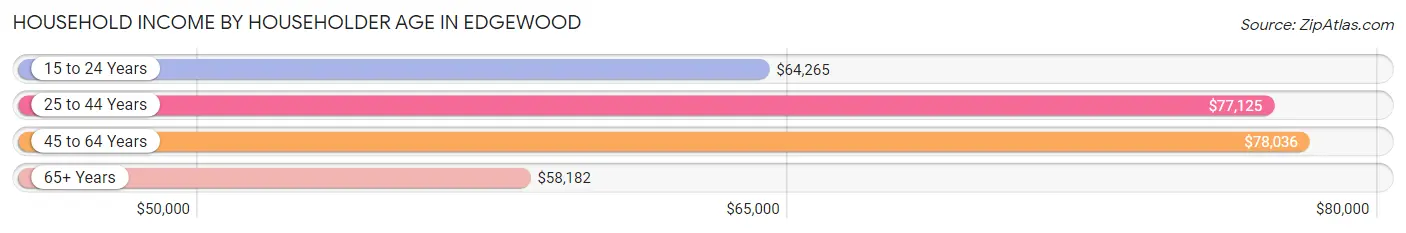
The median household income in Edgewood is $70,568, with the highest median household income of $78,036 found in the 45 to 64 years age bracket for the primary householder. A total of 982 households (44.2%) fall into this category. Meanwhile, the 65+ years age bracket for the primary householder has the lowest median household income of $58,182, with 524 households (23.6%) in this group.
| Income Bracket | # Households | Median Income |
| 15 to 24 Years | 54 (2.4%) | $64,265 |
| 25 to 44 Years | 660 (29.7%) | $77,125 |
| 45 to 64 Years | 982 (44.2%) | $78,036 |
| 65+ Years | 524 (23.6%) | $58,182 |
| Total | 2,220 (100.0%) | $70,568 |
Poverty in Edgewood
Income Below Poverty by Sex and Age in Edgewood
With 7.9% poverty level for males and 10.3% for females among the residents of Edgewood, 5 year old males and 5 year old females are the most vulnerable to poverty, with 25 males (40.3%) and 16 females (100.0%) in their respective age groups living below the poverty level.
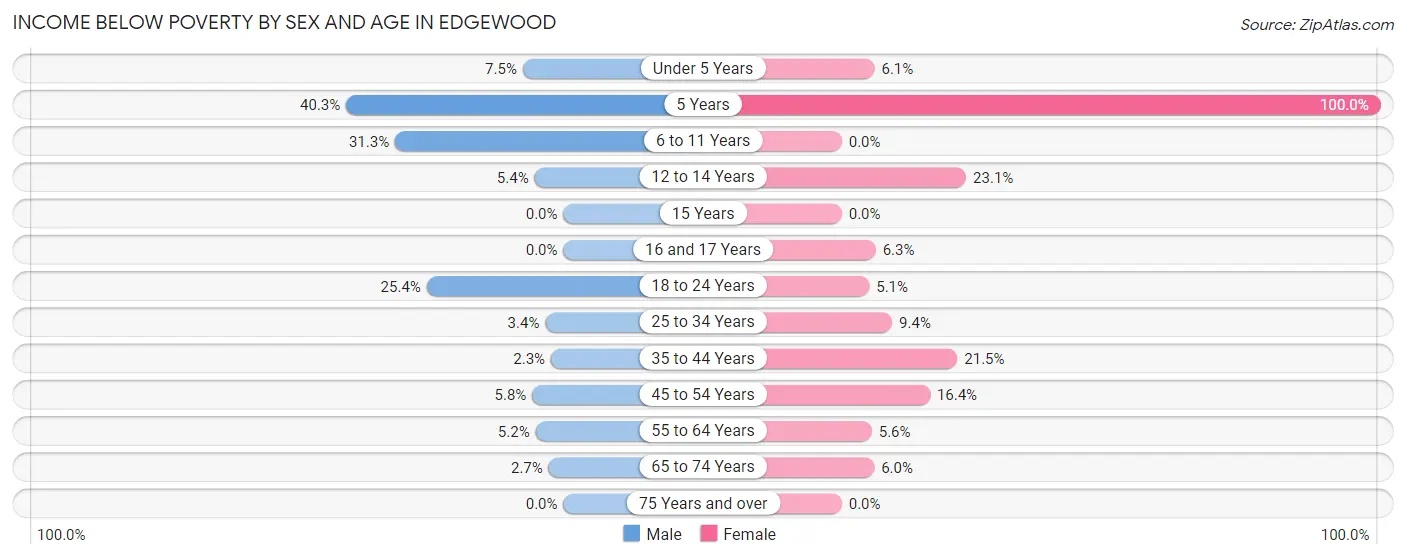
| Age Bracket | Male | Female |
| Under 5 Years | 19 (7.5%) | 11 (6.1%) |
| 5 Years | 25 (40.3%) | 16 (100.0%) |
| 6 to 11 Years | 70 (31.2%) | 0 (0.0%) |
| 12 to 14 Years | 9 (5.4%) | 21 (23.1%) |
| 15 Years | 0 (0.0%) | 0 (0.0%) |
| 16 and 17 Years | 0 (0.0%) | 10 (6.3%) |
| 18 to 24 Years | 51 (25.4%) | 5 (5.1%) |
| 25 to 34 Years | 12 (3.4%) | 39 (9.3%) |
| 35 to 44 Years | 11 (2.3%) | 80 (21.4%) |
| 45 to 54 Years | 20 (5.8%) | 63 (16.4%) |
| 55 to 64 Years | 28 (5.2%) | 33 (5.6%) |
| 65 to 74 Years | 8 (2.7%) | 18 (6.0%) |
| 75 Years and over | 0 (0.0%) | 0 (0.0%) |
| Total | 253 (7.9%) | 296 (10.3%) |
Income Above Poverty by Sex and Age in Edgewood
According to the poverty statistics in Edgewood, males aged 15 years and females aged 6 to 11 years are the age groups that are most secure financially, with 100.0% of males and 100.0% of females in these age groups living above the poverty line.
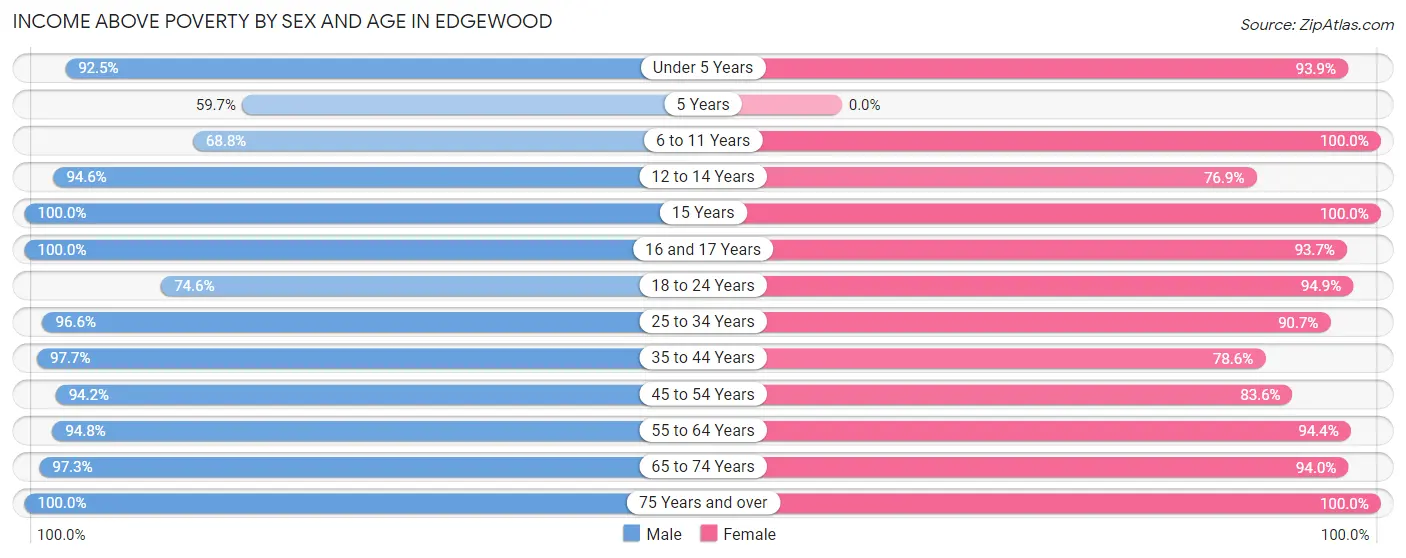
| Age Bracket | Male | Female |
| Under 5 Years | 233 (92.5%) | 170 (93.9%) |
| 5 Years | 37 (59.7%) | 0 (0.0%) |
| 6 to 11 Years | 154 (68.8%) | 119 (100.0%) |
| 12 to 14 Years | 159 (94.6%) | 70 (76.9%) |
| 15 Years | 79 (100.0%) | 6 (100.0%) |
| 16 and 17 Years | 11 (100.0%) | 149 (93.7%) |
| 18 to 24 Years | 150 (74.6%) | 93 (94.9%) |
| 25 to 34 Years | 345 (96.6%) | 378 (90.6%) |
| 35 to 44 Years | 466 (97.7%) | 293 (78.5%) |
| 45 to 54 Years | 326 (94.2%) | 322 (83.6%) |
| 55 to 64 Years | 514 (94.8%) | 559 (94.4%) |
| 65 to 74 Years | 285 (97.3%) | 281 (94.0%) |
| 75 Years and over | 195 (100.0%) | 136 (100.0%) |
| Total | 2,954 (92.1%) | 2,576 (89.7%) |
Income Below Poverty Among Married-Couple Families in Edgewood
The poverty statistics for married-couple families in Edgewood show that 3.5% or 50 of the total 1,415 families live below the poverty line. Families with 3 or 4 children have the highest poverty rate of 8.8%, comprising of 15 families. On the other hand, families with 5 or more children have the lowest poverty rate of 0.0%, which includes 0 families.
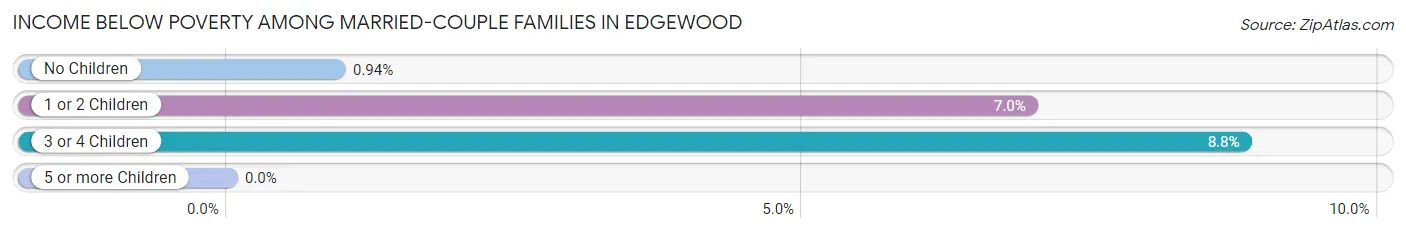
| Children | Above Poverty | Below Poverty |
| No Children | 842 (99.1%) | 8 (0.9%) |
| 1 or 2 Children | 361 (93.0%) | 27 (7.0%) |
| 3 or 4 Children | 155 (91.2%) | 15 (8.8%) |
| 5 or more Children | 7 (100.0%) | 0 (0.0%) |
| Total | 1,365 (96.5%) | 50 (3.5%) |
Income Below Poverty Among Single-Parent Households in Edgewood
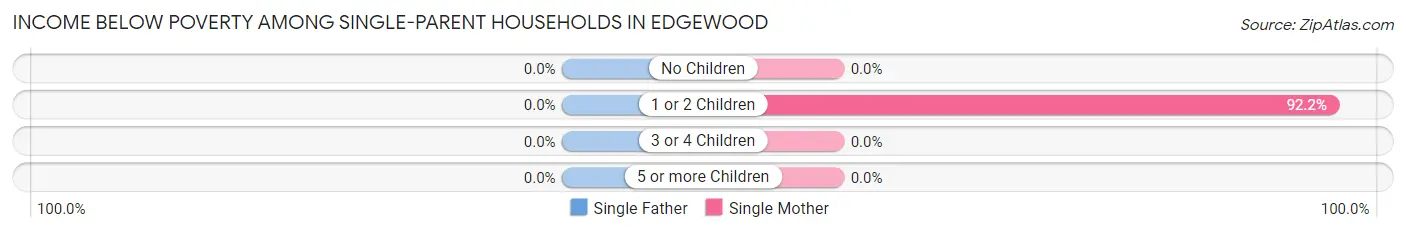
| Children | Single Father | Single Mother |
| No Children | 0 (0.0%) | 0 (0.0%) |
| 1 or 2 Children | 0 (0.0%) | 71 (92.2%) |
| 3 or 4 Children | 0 (0.0%) | 0 (0.0%) |
| 5 or more Children | 0 (0.0%) | 0 (0.0%) |
| Total | 0 (0.0%) | 71 (43.8%) |
Income Below Poverty Among Married-Couple vs Single-Parent Households in Edgewood
The poverty data for Edgewood shows that 50 of the married-couple family households (3.5%) and 71 of the single-parent households (31.3%) are living below the poverty level. Within the married-couple family households, those with 3 or 4 children have the highest poverty rate, with 15 households (8.8%) falling below the poverty line. Among the single-parent households, those with 1 or 2 children have the highest poverty rate, with 71 household (74.7%) living below poverty.
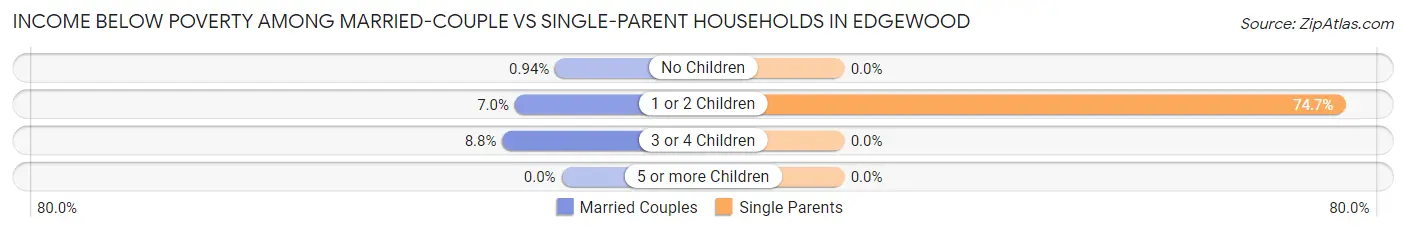
| Children | Married-Couple Families | Single-Parent Households |
| No Children | 8 (0.9%) | 0 (0.0%) |
| 1 or 2 Children | 27 (7.0%) | 71 (74.7%) |
| 3 or 4 Children | 15 (8.8%) | 0 (0.0%) |
| 5 or more Children | 0 (0.0%) | 0 (0.0%) |
| Total | 50 (3.5%) | 71 (31.3%) |
Race in Edgewood
The most populous races in Edgewood are White / Caucasian (4,806 | 78.6%), Hispanic or Latino (2,225 | 36.4%), and Two or more Races (732 | 12.0%).
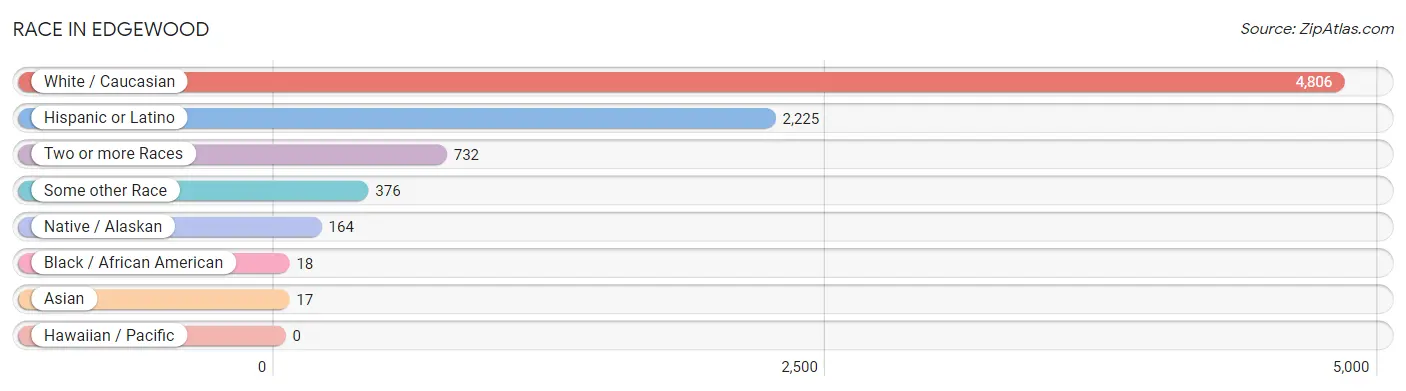
| Race | # Population | % Population |
| Asian | 17 | 0.3% |
| Black / African American | 18 | 0.3% |
| Hawaiian / Pacific | 0 | 0.0% |
| Hispanic or Latino | 2,225 | 36.4% |
| Native / Alaskan | 164 | 2.7% |
| White / Caucasian | 4,806 | 78.6% |
| Two or more Races | 732 | 12.0% |
| Some other Race | 376 | 6.1% |
| Total | 6,113 | 100.0% |
Ancestry in Edgewood
The most populous ancestries reported in Edgewood are Mexican (1,398 | 22.9%), German (689 | 11.3%), Irish (641 | 10.5%), English (432 | 7.1%), and American (406 | 6.6%), together accounting for 58.3% of all Edgewood residents.
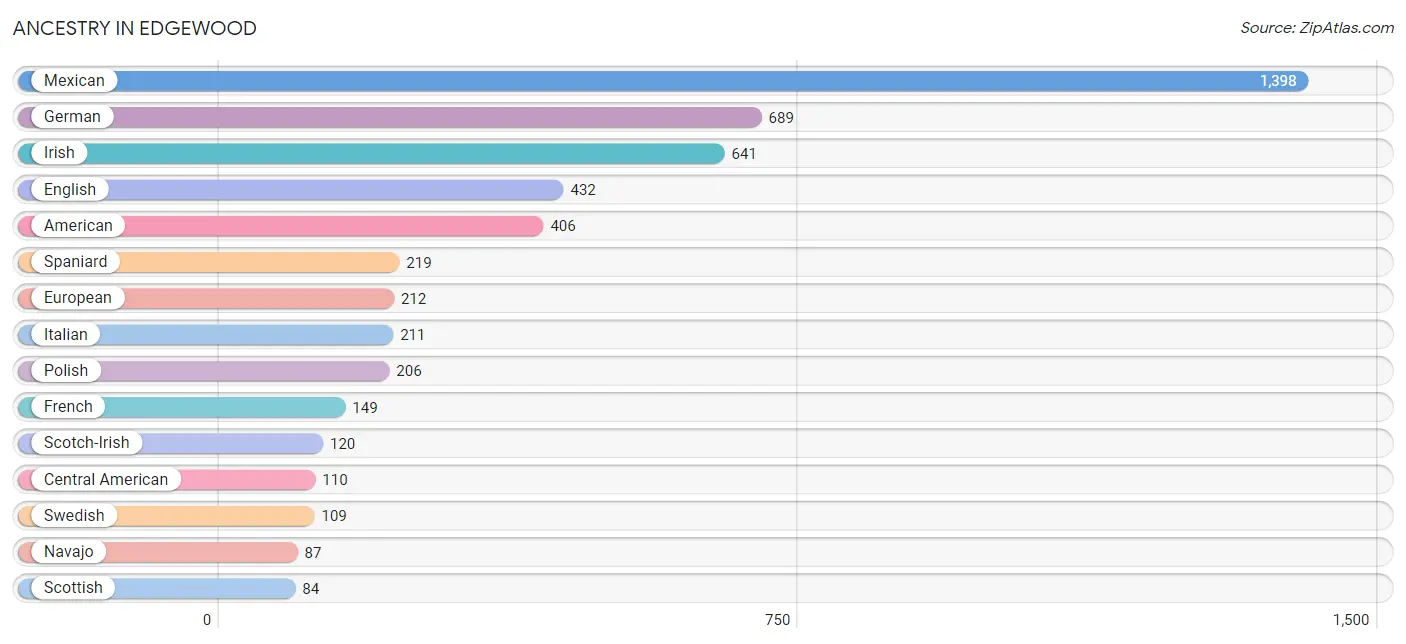
| Ancestry | # Population | % Population |
| American | 406 | 6.6% |
| Apache | 15 | 0.3% |
| Arab | 27 | 0.4% |
| Austrian | 11 | 0.2% |
| British | 63 | 1.0% |
| Cajun | 69 | 1.1% |
| Celtic | 23 | 0.4% |
| Central American | 110 | 1.8% |
| Cherokee | 23 | 0.4% |
| Croatian | 13 | 0.2% |
| Czech | 28 | 0.5% |
| Danish | 12 | 0.2% |
| Dominican | 37 | 0.6% |
| Dutch | 20 | 0.3% |
| Dutch West Indian | 17 | 0.3% |
| Eastern European | 8 | 0.1% |
| English | 432 | 7.1% |
| European | 212 | 3.5% |
| French | 149 | 2.4% |
| French Canadian | 83 | 1.4% |
| German | 689 | 11.3% |
| Honduran | 57 | 0.9% |
| Inupiat | 14 | 0.2% |
| Irish | 641 | 10.5% |
| Italian | 211 | 3.5% |
| Jamaican | 10 | 0.2% |
| Mexican | 1,398 | 22.9% |
| Mexican American Indian | 14 | 0.2% |
| Navajo | 87 | 1.4% |
| Nicaraguan | 12 | 0.2% |
| Northern European | 13 | 0.2% |
| Norwegian | 53 | 0.9% |
| Pennsylvania German | 16 | 0.3% |
| Polish | 206 | 3.4% |
| Puerto Rican | 55 | 0.9% |
| Salvadoran | 41 | 0.7% |
| Scotch-Irish | 120 | 2.0% |
| Scottish | 84 | 1.4% |
| Spaniard | 219 | 3.6% |
| Spanish | 82 | 1.3% |
| Spanish American | 23 | 0.4% |
| Swedish | 109 | 1.8% |
| Thai | 17 | 0.3% |
| Welsh | 17 | 0.3% | View All 44 Rows |
Immigrants in Edgewood
The most numerous immigrant groups reported in Edgewood came from Central America (311 | 5.1%), Latin America (311 | 5.1%), Mexico (241 | 3.9%), Honduras (58 | 0.9%), and Asia (17 | 0.3%), together accounting for 15.3% of all Edgewood residents.
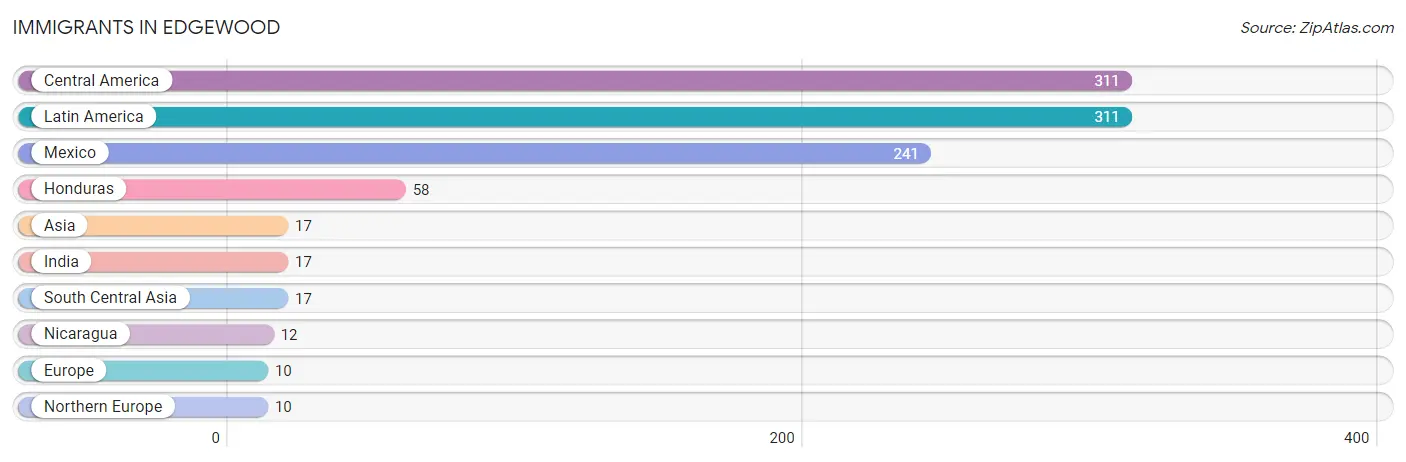
| Immigration Origin | # Population | % Population |
| Asia | 17 | 0.3% |
| Central America | 311 | 5.1% |
| Europe | 10 | 0.2% |
| Honduras | 58 | 0.9% |
| India | 17 | 0.3% |
| Latin America | 311 | 5.1% |
| Mexico | 241 | 3.9% |
| Nicaragua | 12 | 0.2% |
| Northern Europe | 10 | 0.2% |
| South Central Asia | 17 | 0.3% | View All 10 Rows |
Sex and Age in Edgewood
Sex and Age in Edgewood
The most populous age groups in Edgewood are 55 to 59 Years (274 | 8.5%) for men and 60 to 64 Years (348 | 12.0%) for women.
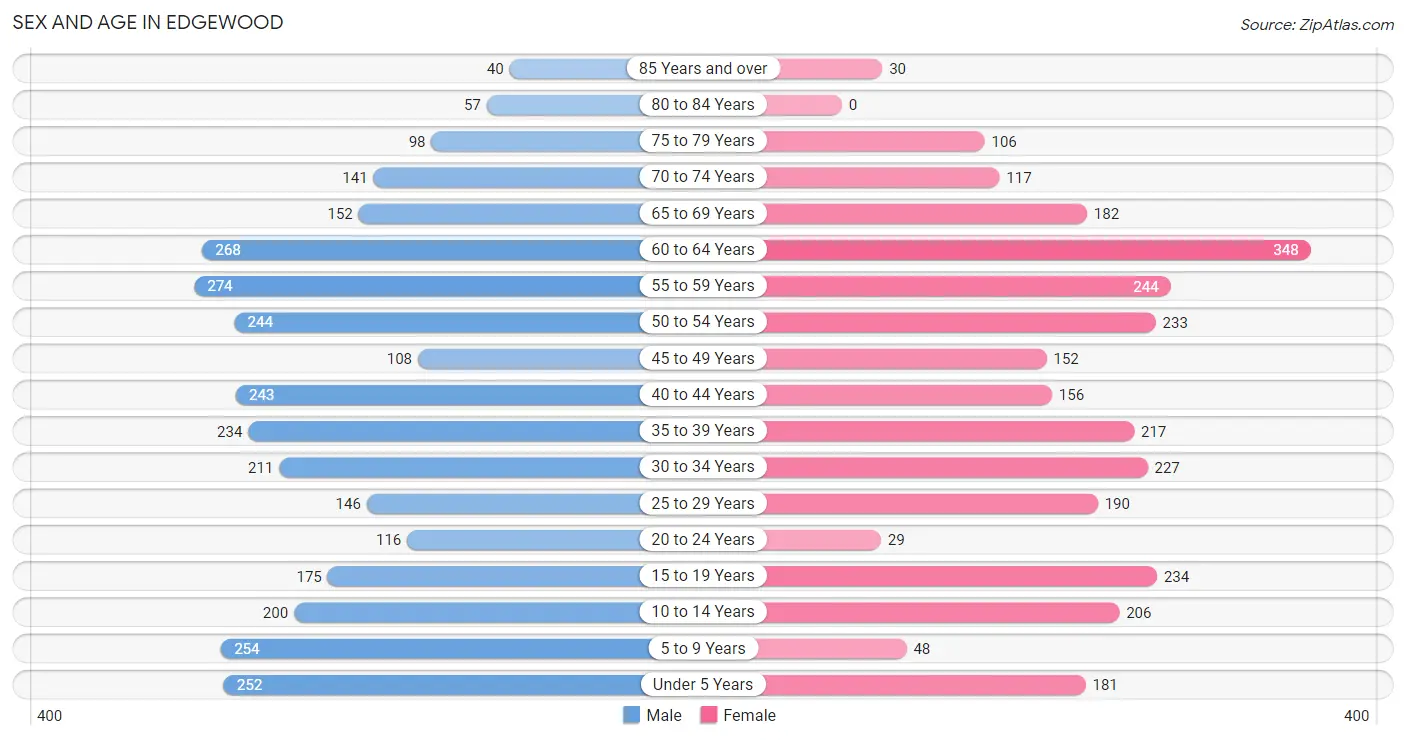
| Age Bracket | Male | Female |
| Under 5 Years | 252 (7.8%) | 181 (6.2%) |
| 5 to 9 Years | 254 (7.9%) | 48 (1.7%) |
| 10 to 14 Years | 200 (6.2%) | 206 (7.1%) |
| 15 to 19 Years | 175 (5.4%) | 234 (8.1%) |
| 20 to 24 Years | 116 (3.6%) | 29 (1.0%) |
| 25 to 29 Years | 146 (4.5%) | 190 (6.6%) |
| 30 to 34 Years | 211 (6.6%) | 227 (7.8%) |
| 35 to 39 Years | 234 (7.3%) | 217 (7.5%) |
| 40 to 44 Years | 243 (7.6%) | 156 (5.4%) |
| 45 to 49 Years | 108 (3.4%) | 152 (5.2%) |
| 50 to 54 Years | 244 (7.6%) | 233 (8.0%) |
| 55 to 59 Years | 274 (8.5%) | 244 (8.4%) |
| 60 to 64 Years | 268 (8.3%) | 348 (12.0%) |
| 65 to 69 Years | 152 (4.7%) | 182 (6.3%) |
| 70 to 74 Years | 141 (4.4%) | 117 (4.0%) |
| 75 to 79 Years | 98 (3.0%) | 106 (3.7%) |
| 80 to 84 Years | 57 (1.8%) | 0 (0.0%) |
| 85 Years and over | 40 (1.2%) | 30 (1.0%) |
| Total | 3,213 (100.0%) | 2,900 (100.0%) |
Families and Households in Edgewood
Median Family Size in Edgewood
The median family size in Edgewood is 3.21 persons per family, with married-couple families (1,415 | 86.2%) accounting for the largest median family size of 3.31 persons per family. On the other hand, single male/father families (65 | 4.0%) represent the smallest median family size with 2.14 persons per family.
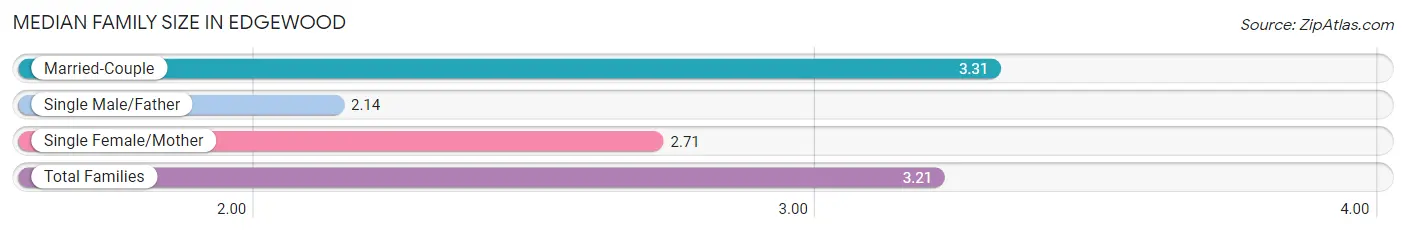
| Family Type | # Families | Family Size |
| Married-Couple | 1,415 (86.2%) | 3.31 |
| Single Male/Father | 65 (4.0%) | 2.14 |
| Single Female/Mother | 162 (9.9%) | 2.71 |
| Total Families | 1,642 (100.0%) | 3.21 |
Median Household Size in Edgewood
The median household size in Edgewood is 2.75 persons per household, with married-couple households (1,415 | 63.7%) accounting for the largest median household size of 3.31 persons per household. non-family households (578 | 26.0%) represent the smallest median household size with 1.36 persons per household.
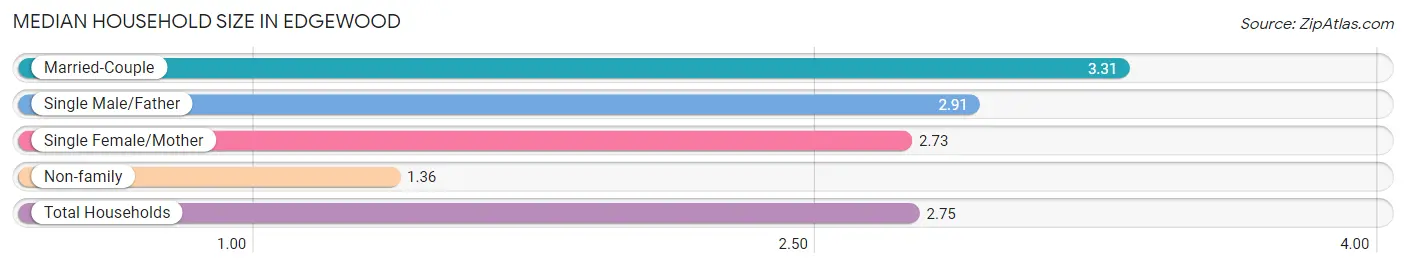
| Household Type | # Households | Household Size |
| Married-Couple | 1,415 (63.7%) | 3.31 |
| Single Male/Father | 65 (2.9%) | 2.91 |
| Single Female/Mother | 162 (7.3%) | 2.73 |
| Non-family | 578 (26.0%) | 1.36 |
| Total Households | 2,220 (100.0%) | 2.75 |
Household Size by Marriage Status in Edgewood
Out of a total of 2,220 households in Edgewood, 1,642 (74.0%) are family households, while 578 (26.0%) are nonfamily households. The most numerous type of family households are 2-person households, comprising 814, and the most common type of nonfamily households are 1-person households, comprising 418.
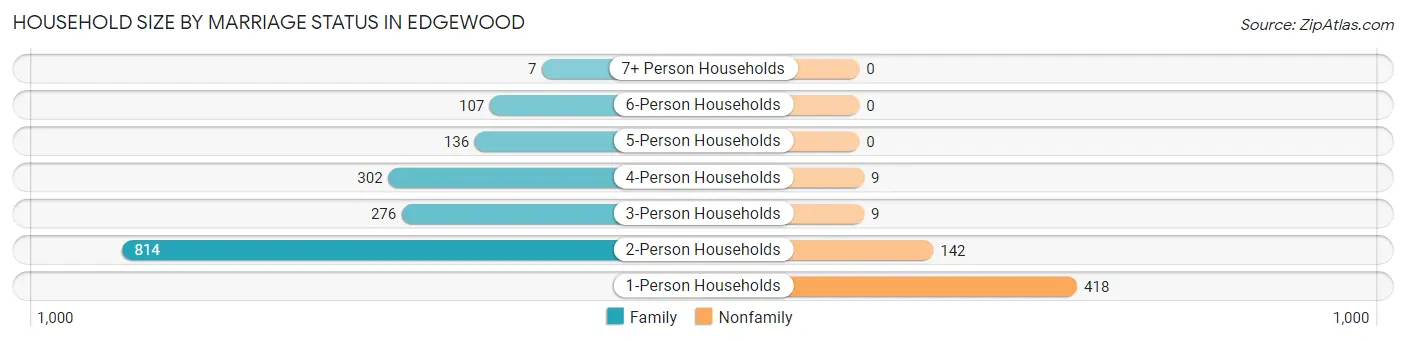
| Household Size | Family Households | Nonfamily Households |
| 1-Person Households | - | 418 (18.8%) |
| 2-Person Households | 814 (36.7%) | 142 (6.4%) |
| 3-Person Households | 276 (12.4%) | 9 (0.4%) |
| 4-Person Households | 302 (13.6%) | 9 (0.4%) |
| 5-Person Households | 136 (6.1%) | 0 (0.0%) |
| 6-Person Households | 107 (4.8%) | 0 (0.0%) |
| 7+ Person Households | 7 (0.3%) | 0 (0.0%) |
| Total | 1,642 (74.0%) | 578 (26.0%) |
Female Fertility in Edgewood
Fertility by Age in Edgewood
Average fertility rate in Edgewood is 35.0 births per 1,000 women. Women in the age bracket of 20 to 34 years have the highest fertility rate with 99.0 births per 1,000 women. Women in the age bracket of 20 to 34 years acount for 100.0% of all women with births.
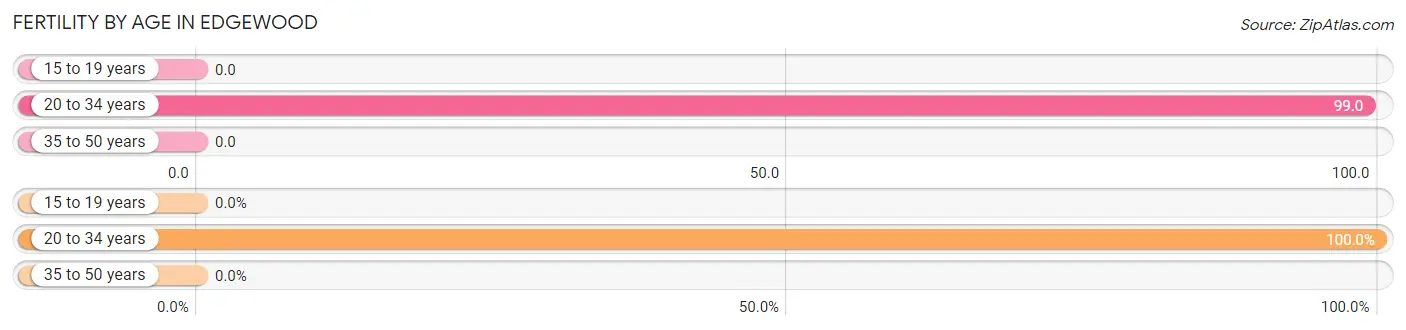
| Age Bracket | Women with Births | Births / 1,000 Women |
| 15 to 19 years | 0 (0.0%) | 0.0 |
| 20 to 34 years | 44 (100.0%) | 99.0 |
| 35 to 50 years | 0 (0.0%) | 0.0 |
| Total | 44 (100.0%) | 35.0 |
Fertility by Age by Marriage Status in Edgewood
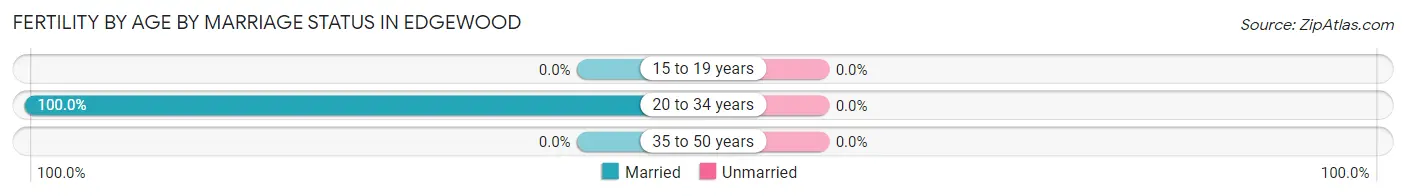
| Age Bracket | Married | Unmarried |
| 15 to 19 years | 0 (0.0%) | 0 (0.0%) |
| 20 to 34 years | 44 (100.0%) | 0 (0.0%) |
| 35 to 50 years | 0 (0.0%) | 0 (0.0%) |
| Total | 44 (100.0%) | 0 (0.0%) |
Fertility by Education in Edgewood
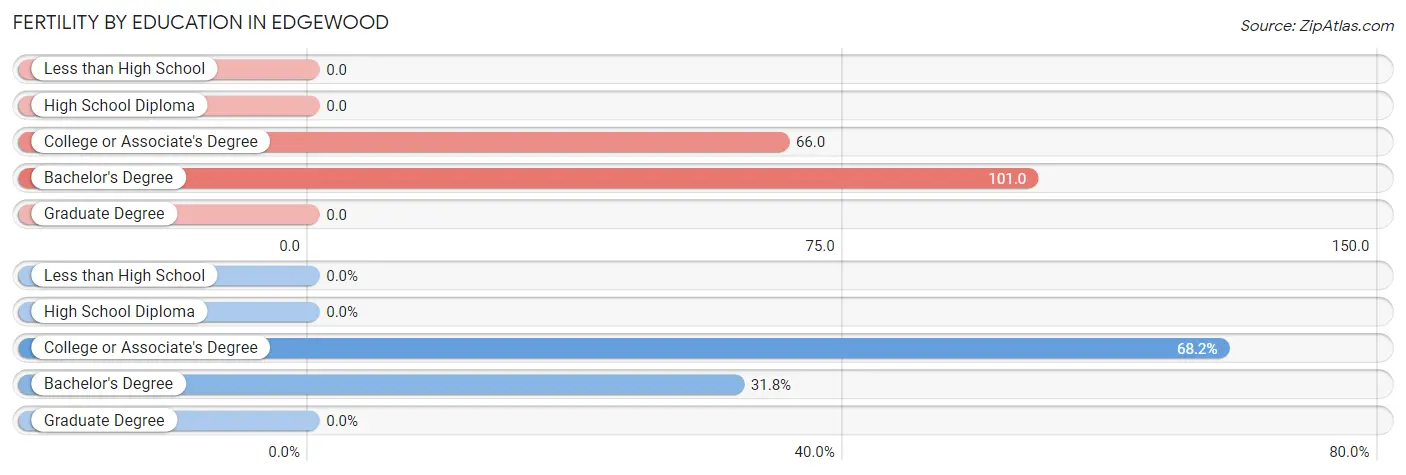
| Educational Attainment | Women with Births | Births / 1,000 Women |
| Less than High School | 0 (0.0%) | 0.0 |
| High School Diploma | 0 (0.0%) | 0.0 |
| College or Associate's Degree | 30 (68.2%) | 66.0 |
| Bachelor's Degree | 14 (31.8%) | 101.0 |
| Graduate Degree | 0 (0.0%) | 0.0 |
| Total | 44 (100.0%) | 35.0 |
Fertility by Education by Marriage Status in Edgewood
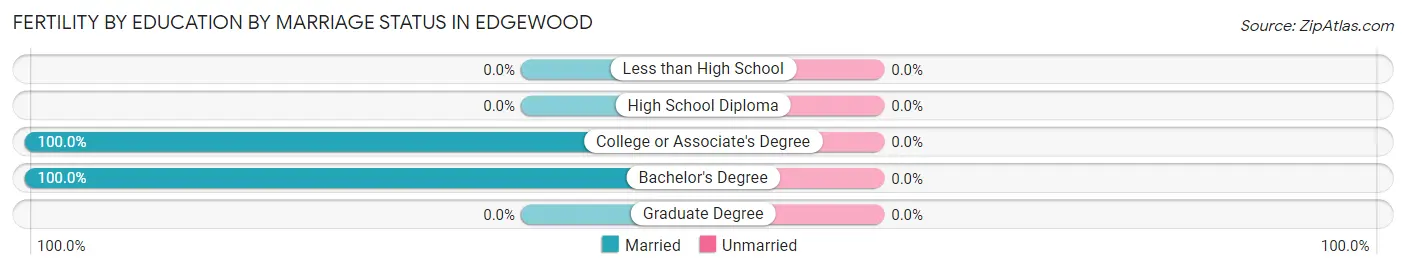
| Educational Attainment | Married | Unmarried |
| Less than High School | 0 (0.0%) | 0 (0.0%) |
| High School Diploma | 0 (0.0%) | 0 (0.0%) |
| College or Associate's Degree | 30 (100.0%) | 0 (0.0%) |
| Bachelor's Degree | 14 (100.0%) | 0 (0.0%) |
| Graduate Degree | 0 (0.0%) | 0 (0.0%) |
| Total | 44 (100.0%) | 0 (0.0%) |
Employment Characteristics in Edgewood
Employment by Class of Employer in Edgewood
Among the 2,675 employed individuals in Edgewood, private company employees (1,479 | 55.3%), state government employees (473 | 17.7%), and federal government employees (214 | 8.0%) make up the most common classes of employment.
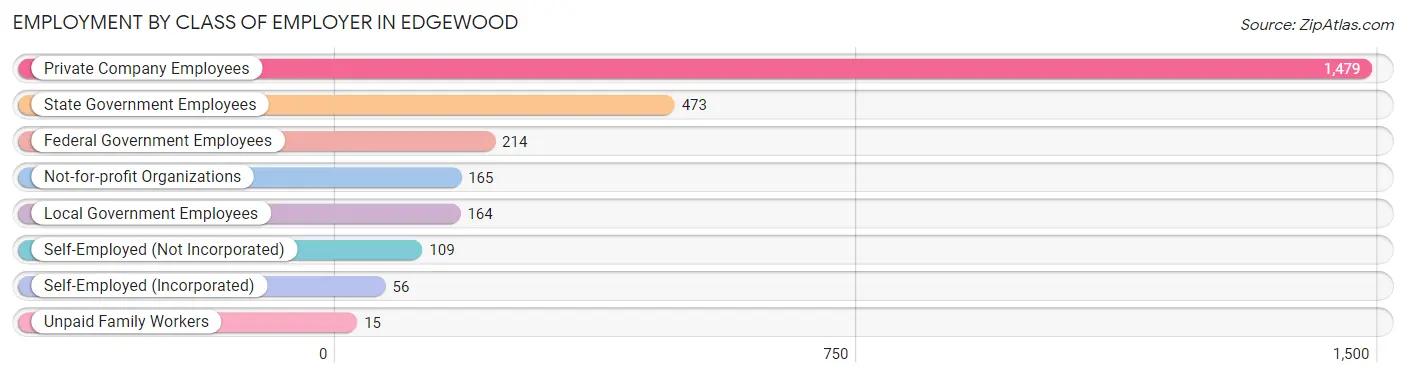
| Employer Class | # Employees | % Employees |
| Private Company Employees | 1,479 | 55.3% |
| Self-Employed (Incorporated) | 56 | 2.1% |
| Self-Employed (Not Incorporated) | 109 | 4.1% |
| Not-for-profit Organizations | 165 | 6.2% |
| Local Government Employees | 164 | 6.1% |
| State Government Employees | 473 | 17.7% |
| Federal Government Employees | 214 | 8.0% |
| Unpaid Family Workers | 15 | 0.6% |
| Total | 2,675 | 100.0% |
Employment Status by Age in Edgewood
According to the labor force statistics for Edgewood, out of the total population over 16 years of age (4,887), 59.1% or 2,888 individuals are in the labor force, with 6.6% or 191 of them unemployed. The age group with the highest labor force participation rate is 20 to 24 years, with 100.0% or 145 individuals in the labor force. Within the labor force, the 16 to 19 years age range has the highest percentage of unemployed individuals, with 43.4% or 86 of them being unemployed.
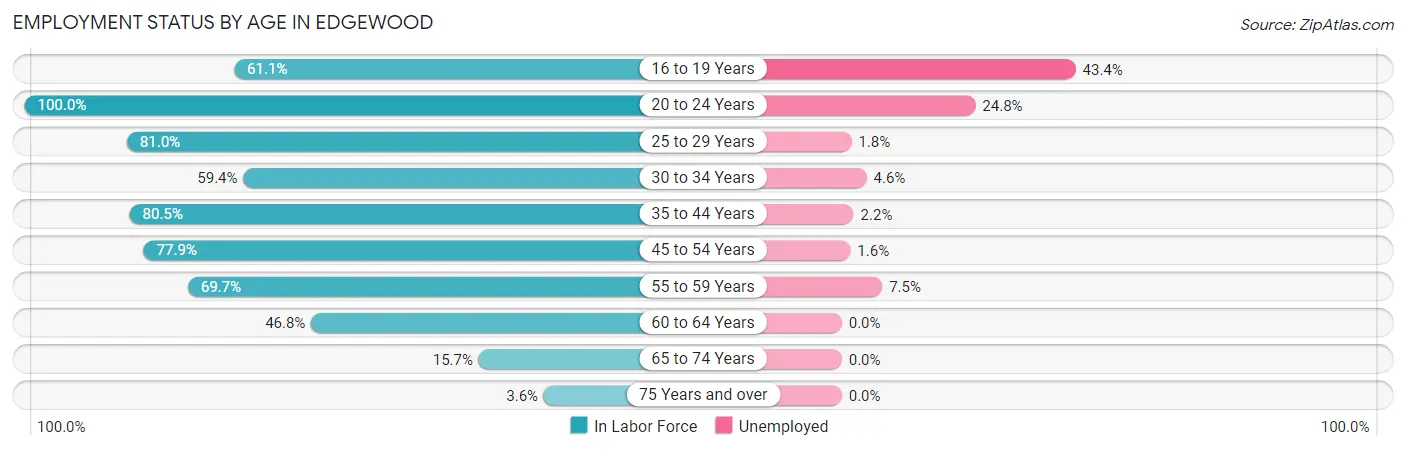
| Age Bracket | In Labor Force | Unemployed |
| 16 to 19 Years | 198 (61.1%) | 86 (43.4%) |
| 20 to 24 Years | 145 (100.0%) | 36 (24.8%) |
| 25 to 29 Years | 272 (81.0%) | 5 (1.8%) |
| 30 to 34 Years | 260 (59.4%) | 12 (4.6%) |
| 35 to 44 Years | 684 (80.5%) | 15 (2.2%) |
| 45 to 54 Years | 574 (77.9%) | 9 (1.6%) |
| 55 to 59 Years | 361 (69.7%) | 27 (7.5%) |
| 60 to 64 Years | 288 (46.8%) | 0 (0.0%) |
| 65 to 74 Years | 93 (15.7%) | 0 (0.0%) |
| 75 Years and over | 12 (3.6%) | 0 (0.0%) |
| Total | 2,888 (59.1%) | 191 (6.6%) |
Employment Status by Educational Attainment in Edgewood
According to labor force statistics for Edgewood, 69.8% of individuals (2,440) out of the total population between 25 and 64 years of age (3,495) are in the labor force, with 2.8% or 68 of them being unemployed. The group with the highest labor force participation rate are those with the educational attainment of bachelor's degree or higher, with 79.6% or 929 individuals in the labor force. Within the labor force, individuals with less than high school education have the highest percentage of unemployment, with 13.0% or 15 of them being unemployed.
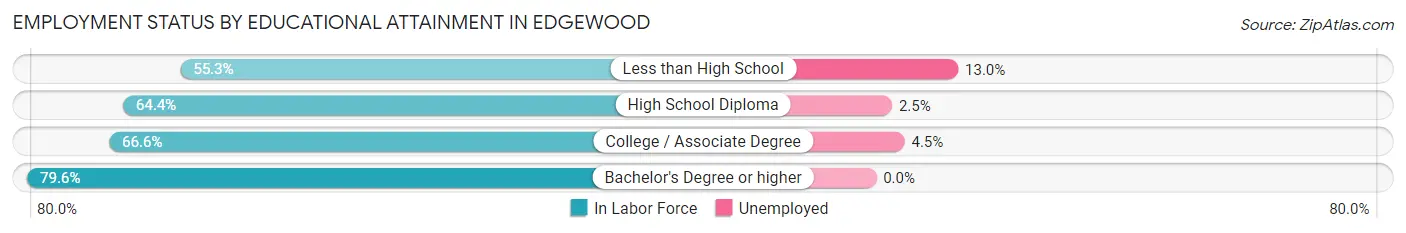
| Educational Attainment | In Labor Force | Unemployed |
| Less than High School | 115 (55.3%) | 27 (13.0%) |
| High School Diploma | 479 (64.4%) | 19 (2.5%) |
| College / Associate Degree | 916 (66.6%) | 62 (4.5%) |
| Bachelor's Degree or higher | 929 (79.6%) | 0 (0.0%) |
| Total | 2,440 (69.8%) | 98 (2.8%) |
Employment Occupations by Sex in Edgewood
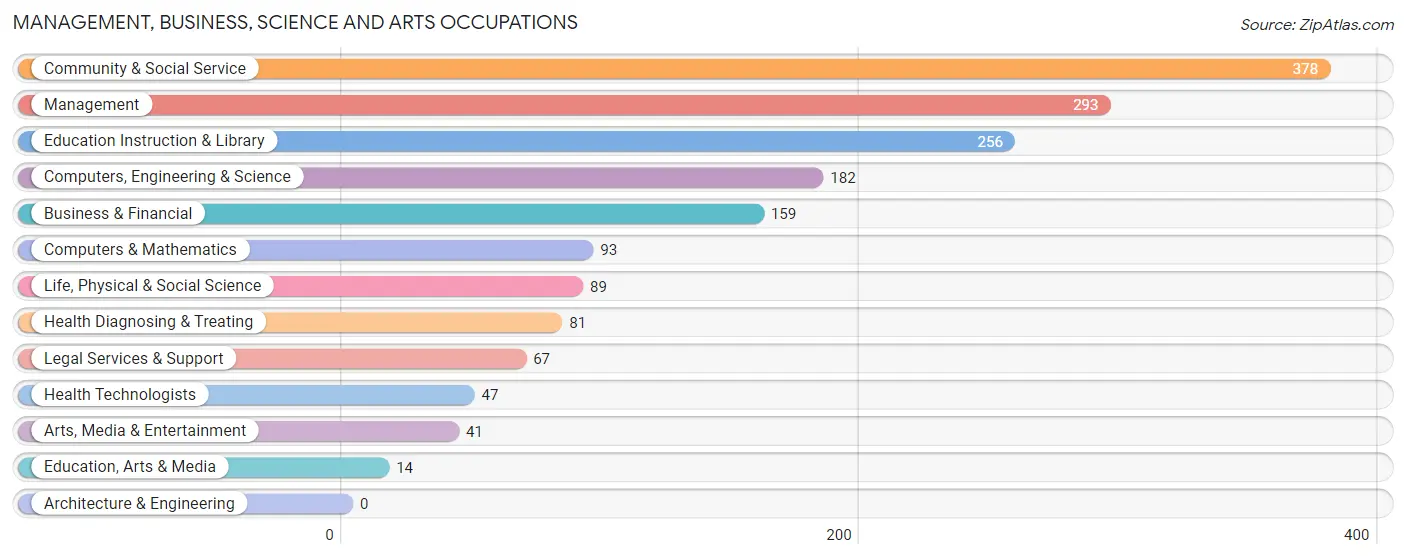
Management, Business, Science and Arts Occupations
The most common Management, Business, Science and Arts occupations in Edgewood are Community & Social Service (378 | 14.1%), Management (293 | 10.9%), Education Instruction & Library (256 | 9.5%), Computers, Engineering & Science (182 | 6.8%), and Business & Financial (159 | 5.9%).
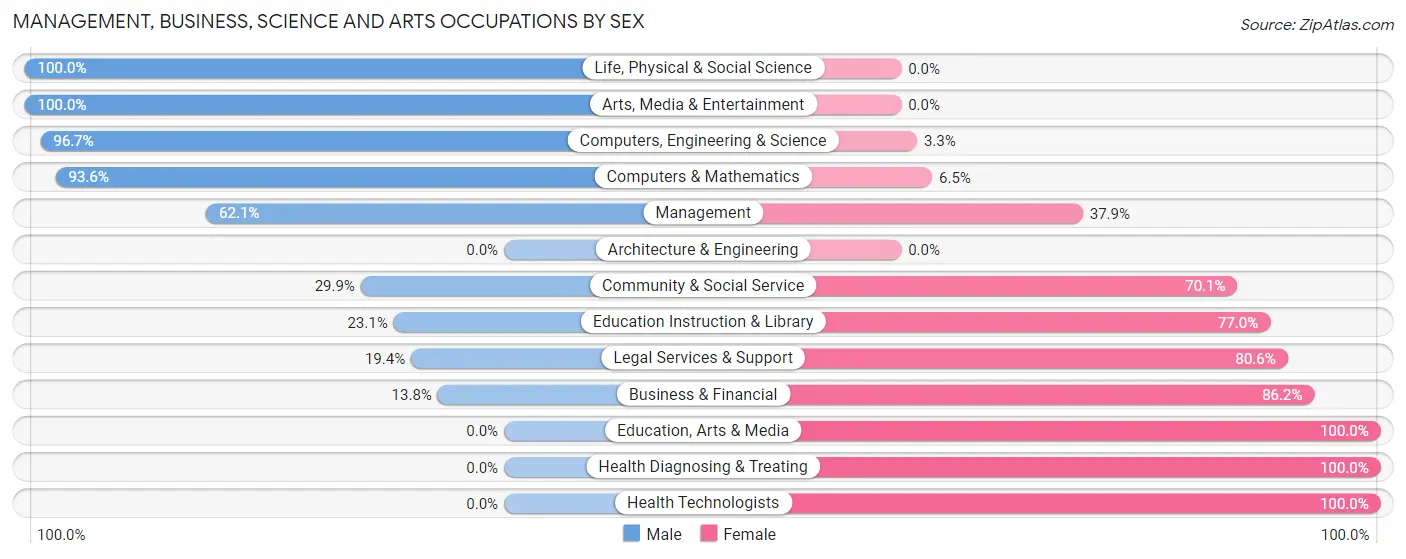
Management, Business, Science and Arts Occupations by Sex
Within the Management, Business, Science and Arts occupations in Edgewood, the most male-oriented occupations are Life, Physical & Social Science (100.0%), Arts, Media & Entertainment (100.0%), and Computers, Engineering & Science (96.7%), while the most female-oriented occupations are Education, Arts & Media (100.0%), Health Diagnosing & Treating (100.0%), and Health Technologists (100.0%).
| Occupation | Male | Female |
| Management | 182 (62.1%) | 111 (37.9%) |
| Business & Financial | 22 (13.8%) | 137 (86.2%) |
| Computers, Engineering & Science | 176 (96.7%) | 6 (3.3%) |
| Computers & Mathematics | 87 (93.5%) | 6 (6.5%) |
| Architecture & Engineering | 0 (0.0%) | 0 (0.0%) |
| Life, Physical & Social Science | 89 (100.0%) | 0 (0.0%) |
| Community & Social Service | 113 (29.9%) | 265 (70.1%) |
| Education, Arts & Media | 0 (0.0%) | 14 (100.0%) |
| Legal Services & Support | 13 (19.4%) | 54 (80.6%) |
| Education Instruction & Library | 59 (23.1%) | 197 (76.9%) |
| Arts, Media & Entertainment | 41 (100.0%) | 0 (0.0%) |
| Health Diagnosing & Treating | 0 (0.0%) | 81 (100.0%) |
| Health Technologists | 0 (0.0%) | 47 (100.0%) |
| Total (Category) | 493 (45.1%) | 600 (54.9%) |
| Total (Overall) | 1,546 (57.6%) | 1,137 (42.4%) |
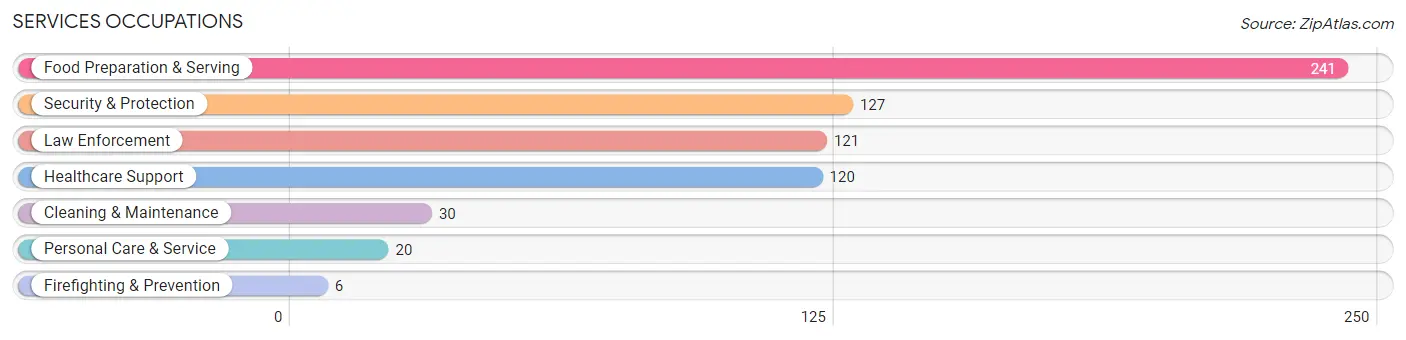
Services Occupations
The most common Services occupations in Edgewood are Food Preparation & Serving (241 | 9.0%), Security & Protection (127 | 4.7%), Law Enforcement (121 | 4.5%), Healthcare Support (120 | 4.5%), and Cleaning & Maintenance (30 | 1.1%).
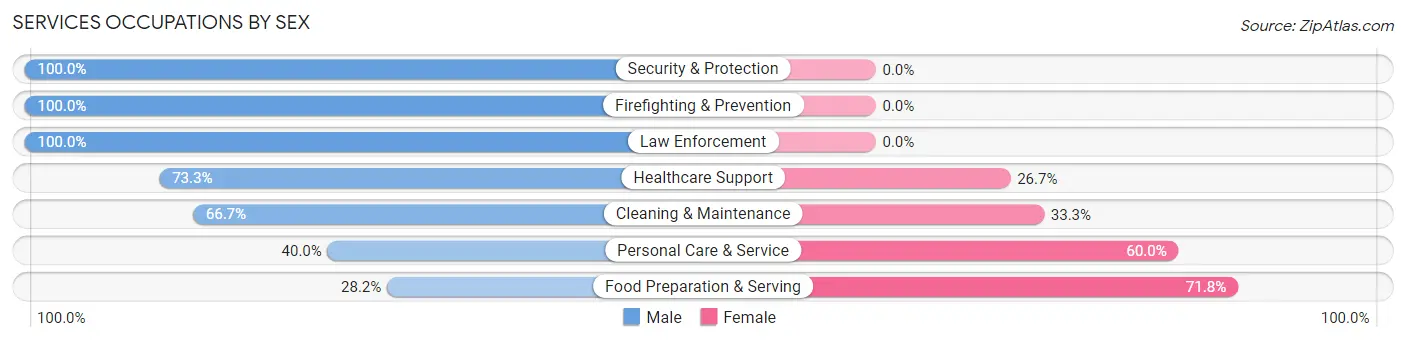
Services Occupations by Sex
Within the Services occupations in Edgewood, the most male-oriented occupations are Security & Protection (100.0%), Firefighting & Prevention (100.0%), and Law Enforcement (100.0%), while the most female-oriented occupations are Food Preparation & Serving (71.8%), Personal Care & Service (60.0%), and Cleaning & Maintenance (33.3%).
| Occupation | Male | Female |
| Healthcare Support | 88 (73.3%) | 32 (26.7%) |
| Security & Protection | 127 (100.0%) | 0 (0.0%) |
| Firefighting & Prevention | 6 (100.0%) | 0 (0.0%) |
| Law Enforcement | 121 (100.0%) | 0 (0.0%) |
| Food Preparation & Serving | 68 (28.2%) | 173 (71.8%) |
| Cleaning & Maintenance | 20 (66.7%) | 10 (33.3%) |
| Personal Care & Service | 8 (40.0%) | 12 (60.0%) |
| Total (Category) | 311 (57.8%) | 227 (42.2%) |
| Total (Overall) | 1,546 (57.6%) | 1,137 (42.4%) |
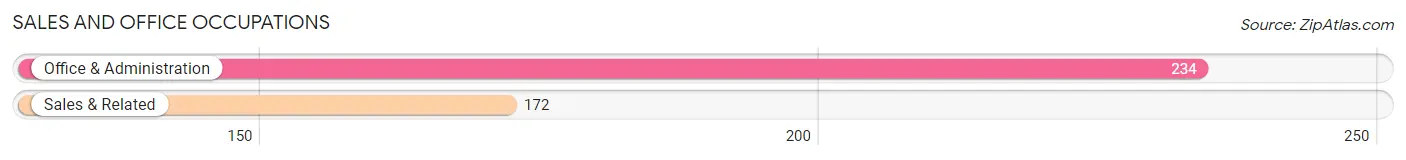
Sales and Office Occupations
The most common Sales and Office occupations in Edgewood are Office & Administration (234 | 8.7%), and Sales & Related (172 | 6.4%).
Sales and Office Occupations by Sex
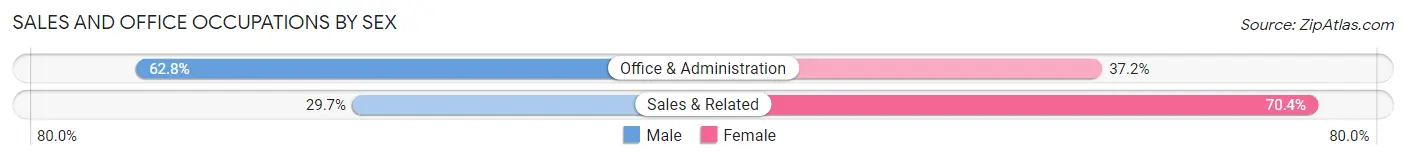
| Occupation | Male | Female |
| Sales & Related | 51 (29.6%) | 121 (70.4%) |
| Office & Administration | 147 (62.8%) | 87 (37.2%) |
| Total (Category) | 198 (48.8%) | 208 (51.2%) |
| Total (Overall) | 1,546 (57.6%) | 1,137 (42.4%) |
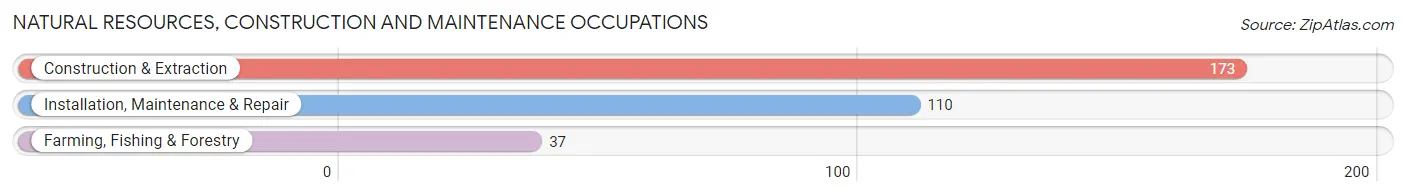
Natural Resources, Construction and Maintenance Occupations
The most common Natural Resources, Construction and Maintenance occupations in Edgewood are Construction & Extraction (173 | 6.5%), Installation, Maintenance & Repair (110 | 4.1%), and Farming, Fishing & Forestry (37 | 1.4%).
Natural Resources, Construction and Maintenance Occupations by Sex
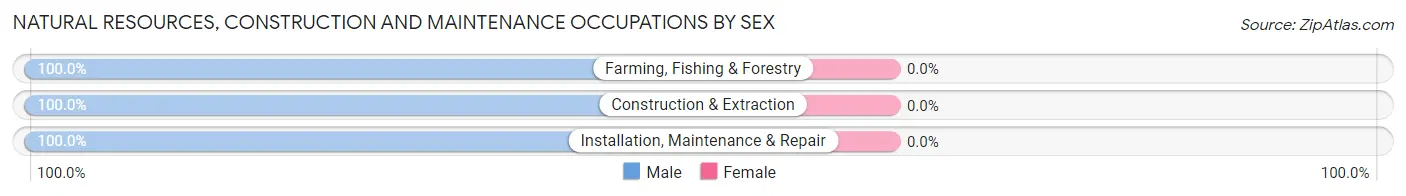
| Occupation | Male | Female |
| Farming, Fishing & Forestry | 37 (100.0%) | 0 (0.0%) |
| Construction & Extraction | 173 (100.0%) | 0 (0.0%) |
| Installation, Maintenance & Repair | 110 (100.0%) | 0 (0.0%) |
| Total (Category) | 320 (100.0%) | 0 (0.0%) |
| Total (Overall) | 1,546 (57.6%) | 1,137 (42.4%) |
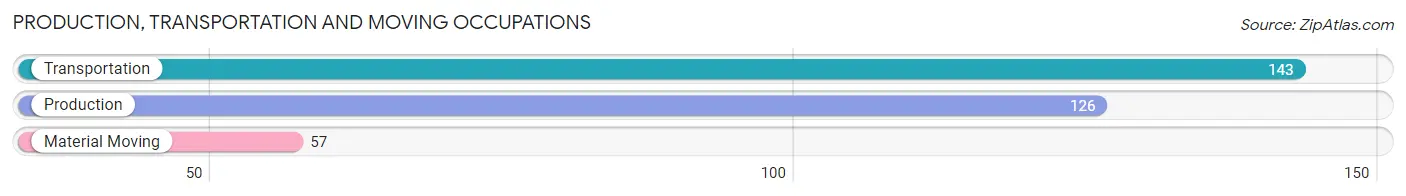
Production, Transportation and Moving Occupations
The most common Production, Transportation and Moving occupations in Edgewood are Transportation (143 | 5.3%), Production (126 | 4.7%), and Material Moving (57 | 2.1%).
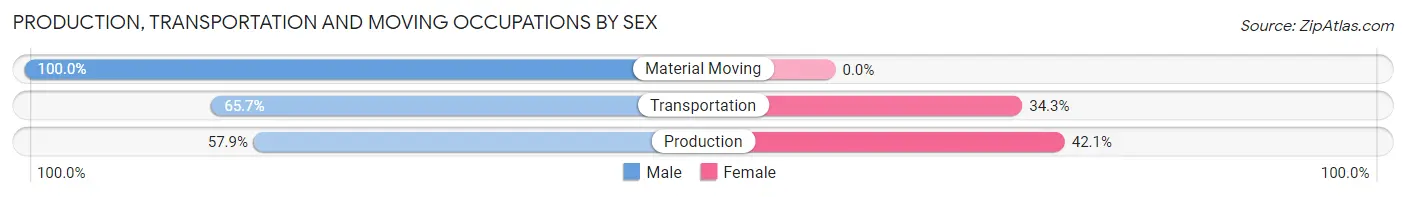
Production, Transportation and Moving Occupations by Sex
| Occupation | Male | Female |
| Production | 73 (57.9%) | 53 (42.1%) |
| Transportation | 94 (65.7%) | 49 (34.3%) |
| Material Moving | 57 (100.0%) | 0 (0.0%) |
| Total (Category) | 224 (68.7%) | 102 (31.3%) |
| Total (Overall) | 1,546 (57.6%) | 1,137 (42.4%) |
Employment Industries by Sex in Edgewood
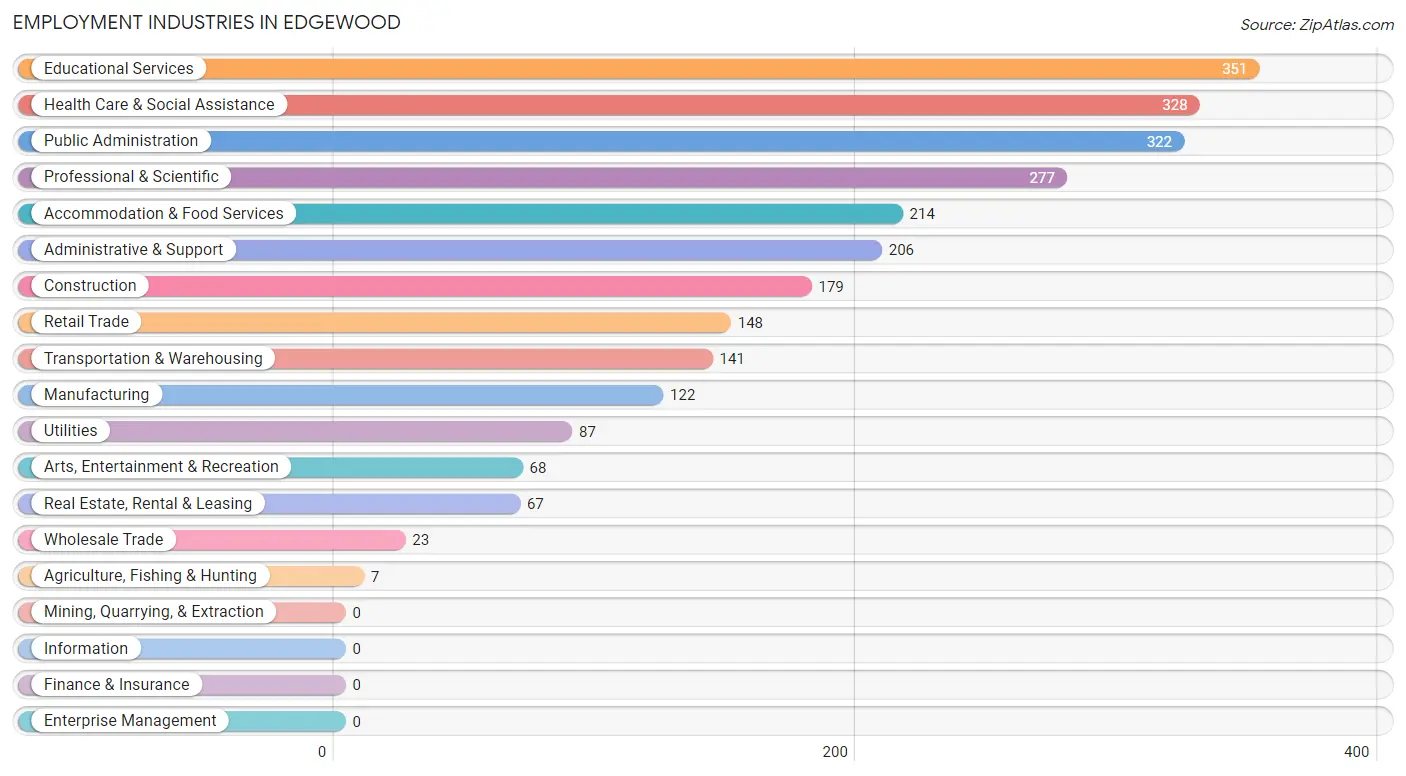
Employment Industries in Edgewood
The major employment industries in Edgewood include Educational Services (351 | 13.1%), Health Care & Social Assistance (328 | 12.2%), Public Administration (322 | 12.0%), Professional & Scientific (277 | 10.3%), and Accommodation & Food Services (214 | 8.0%).
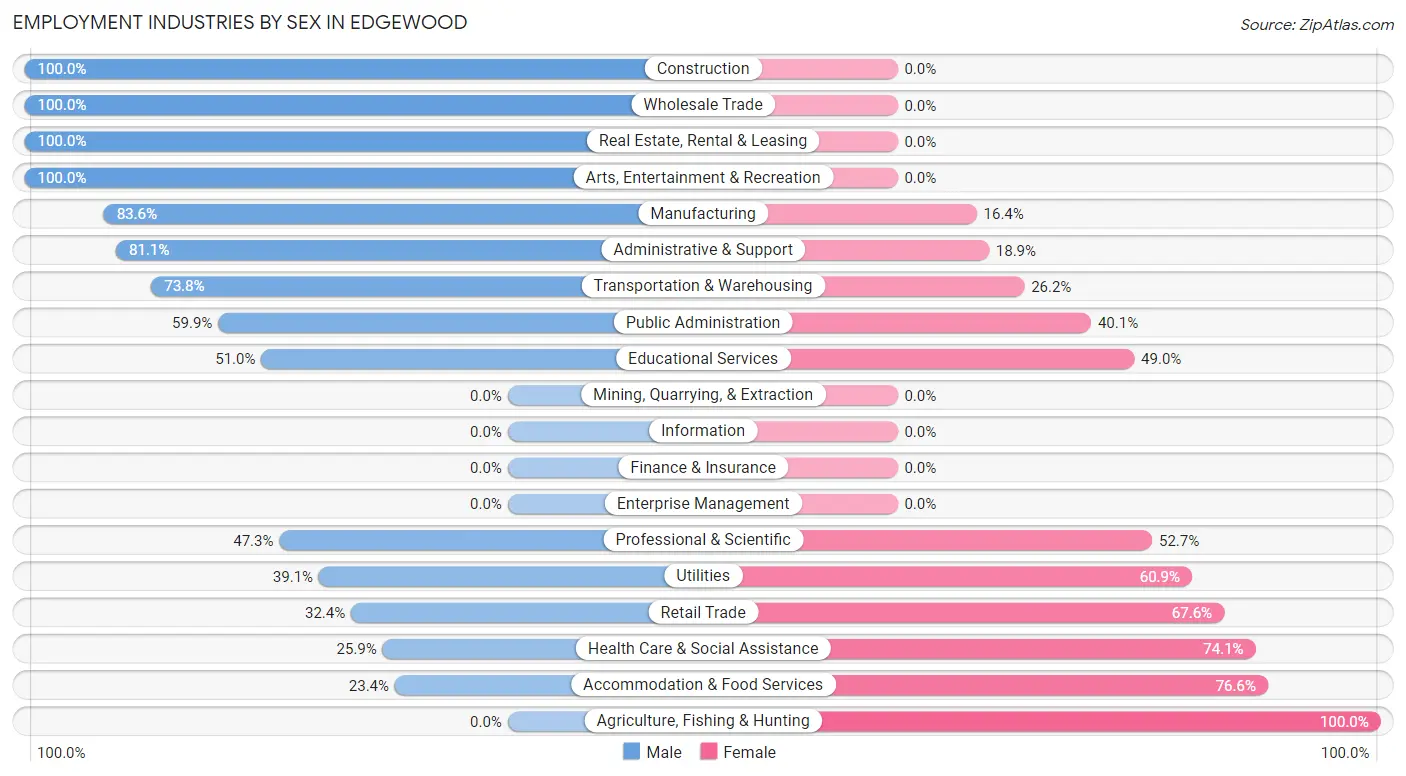
Employment Industries by Sex in Edgewood
The Edgewood industries that see more men than women are Construction (100.0%), Wholesale Trade (100.0%), and Real Estate, Rental & Leasing (100.0%), whereas the industries that tend to have a higher number of women are Agriculture, Fishing & Hunting (100.0%), Accommodation & Food Services (76.6%), and Health Care & Social Assistance (74.1%).
| Industry | Male | Female |
| Agriculture, Fishing & Hunting | 0 (0.0%) | 7 (100.0%) |
| Mining, Quarrying, & Extraction | 0 (0.0%) | 0 (0.0%) |
| Construction | 179 (100.0%) | 0 (0.0%) |
| Manufacturing | 102 (83.6%) | 20 (16.4%) |
| Wholesale Trade | 23 (100.0%) | 0 (0.0%) |
| Retail Trade | 48 (32.4%) | 100 (67.6%) |
| Transportation & Warehousing | 104 (73.8%) | 37 (26.2%) |
| Utilities | 34 (39.1%) | 53 (60.9%) |
| Information | 0 (0.0%) | 0 (0.0%) |
| Finance & Insurance | 0 (0.0%) | 0 (0.0%) |
| Real Estate, Rental & Leasing | 67 (100.0%) | 0 (0.0%) |
| Professional & Scientific | 131 (47.3%) | 146 (52.7%) |
| Enterprise Management | 0 (0.0%) | 0 (0.0%) |
| Administrative & Support | 167 (81.1%) | 39 (18.9%) |
| Educational Services | 179 (51.0%) | 172 (49.0%) |
| Health Care & Social Assistance | 85 (25.9%) | 243 (74.1%) |
| Arts, Entertainment & Recreation | 68 (100.0%) | 0 (0.0%) |
| Accommodation & Food Services | 50 (23.4%) | 164 (76.6%) |
| Public Administration | 193 (59.9%) | 129 (40.1%) |
| Total | 1,546 (57.6%) | 1,137 (42.4%) |
Education in Edgewood
School Enrollment in Edgewood
The most common levels of schooling among the 1,287 students in Edgewood are high school (355 | 27.6%), middle school (315 | 24.5%), and college / undergraduate (276 | 21.4%).
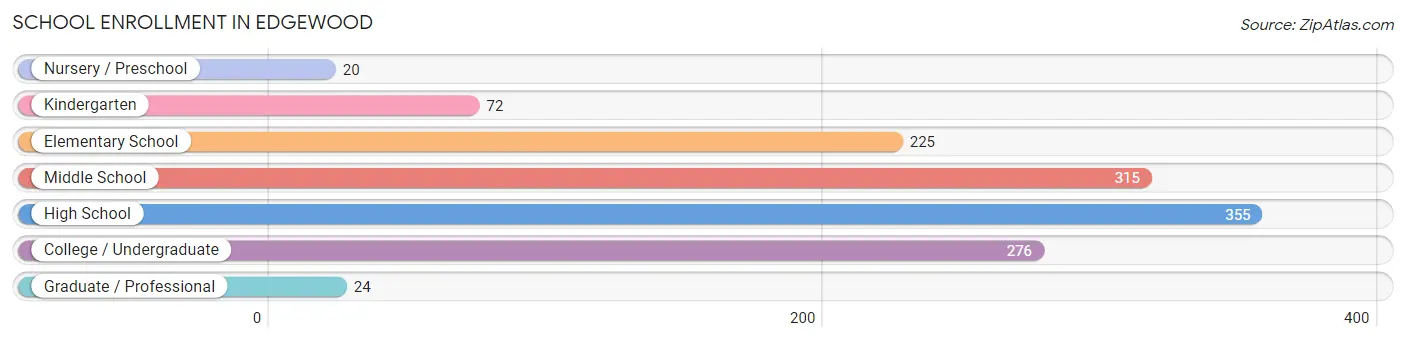
| School Level | # Students | % Students |
| Nursery / Preschool | 20 | 1.5% |
| Kindergarten | 72 | 5.6% |
| Elementary School | 225 | 17.5% |
| Middle School | 315 | 24.5% |
| High School | 355 | 27.6% |
| College / Undergraduate | 276 | 21.4% |
| Graduate / Professional | 24 | 1.9% |
| Total | 1,287 | 100.0% |
School Enrollment by Age by Funding Source in Edgewood
Out of a total of 1,287 students who are enrolled in schools in Edgewood, 423 (32.9%) attend a private institution, while the remaining 864 (67.1%) are enrolled in public schools. The age group of 35 years and over has the highest likelihood of being enrolled in private schools, with 50 (48.1% in the age bracket) enrolled. Conversely, the age group of 20 to 24 year olds has the lowest likelihood of being enrolled in a private school, with 5 (100.0% in the age bracket) attending a public institution.
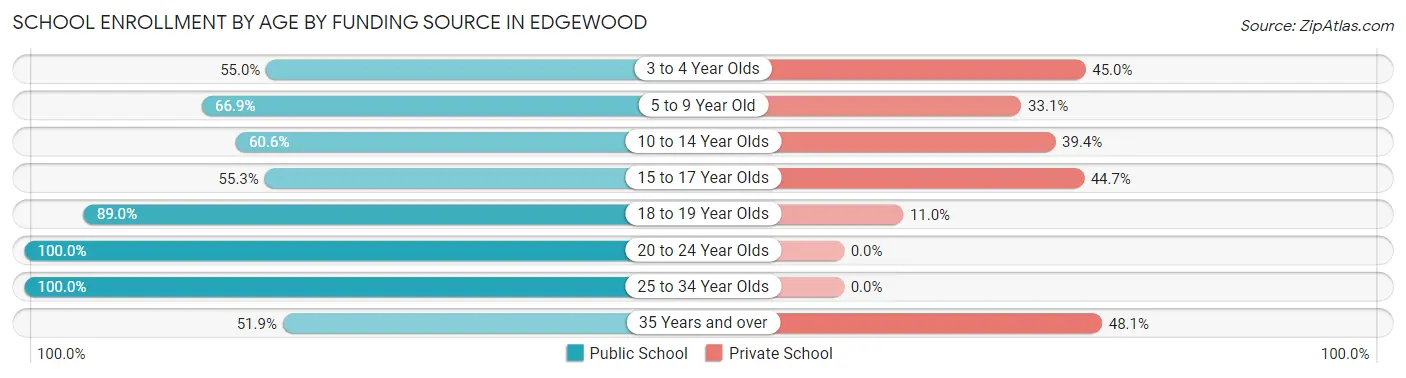
| Age Bracket | Public School | Private School |
| 3 to 4 Year Olds | 11 (55.0%) | 9 (45.0%) |
| 5 to 9 Year Old | 166 (66.9%) | 82 (33.1%) |
| 10 to 14 Year Olds | 234 (60.6%) | 152 (39.4%) |
| 15 to 17 Year Olds | 141 (55.3%) | 114 (44.7%) |
| 18 to 19 Year Olds | 137 (89.0%) | 17 (11.0%) |
| 20 to 24 Year Olds | 5 (100.0%) | 0 (0.0%) |
| 25 to 34 Year Olds | 115 (100.0%) | 0 (0.0%) |
| 35 Years and over | 54 (51.9%) | 50 (48.1%) |
| Total | 864 (67.1%) | 423 (32.9%) |
Educational Attainment by Field of Study in Edgewood
Business (244 | 15.5%), liberal arts & history (176 | 11.2%), science & technology (147 | 9.3%), education (146 | 9.2%), and engineering (137 | 8.7%) are the most common fields of study among 1,578 individuals in Edgewood who have obtained a bachelor's degree or higher.
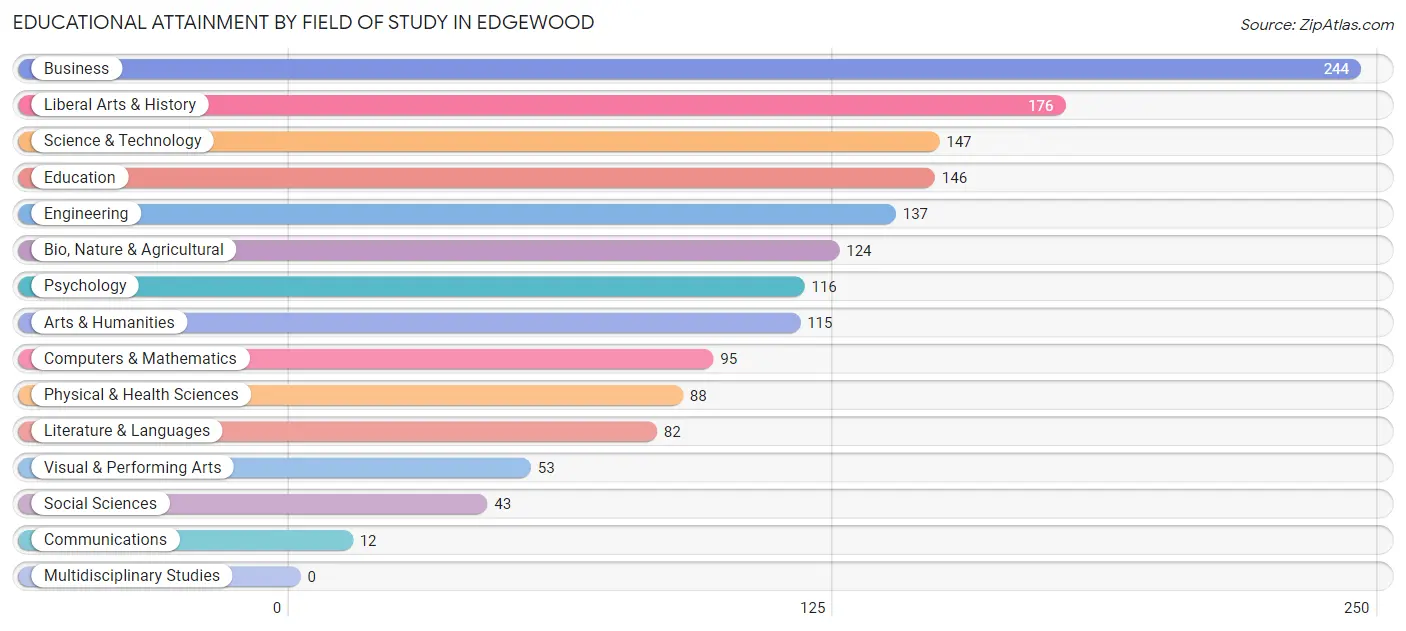
| Field of Study | # Graduates | % Graduates |
| Computers & Mathematics | 95 | 6.0% |
| Bio, Nature & Agricultural | 124 | 7.9% |
| Physical & Health Sciences | 88 | 5.6% |
| Psychology | 116 | 7.3% |
| Social Sciences | 43 | 2.7% |
| Engineering | 137 | 8.7% |
| Multidisciplinary Studies | 0 | 0.0% |
| Science & Technology | 147 | 9.3% |
| Business | 244 | 15.5% |
| Education | 146 | 9.2% |
| Literature & Languages | 82 | 5.2% |
| Liberal Arts & History | 176 | 11.2% |
| Visual & Performing Arts | 53 | 3.4% |
| Communications | 12 | 0.8% |
| Arts & Humanities | 115 | 7.3% |
| Total | 1,578 | 100.0% |
Transportation & Commute in Edgewood
Vehicle Availability by Sex in Edgewood
The most prevalent vehicle ownership categories in Edgewood are males with 2 vehicles (504, accounting for 32.3%) and females with 2 vehicles (276, making up 45.2%).
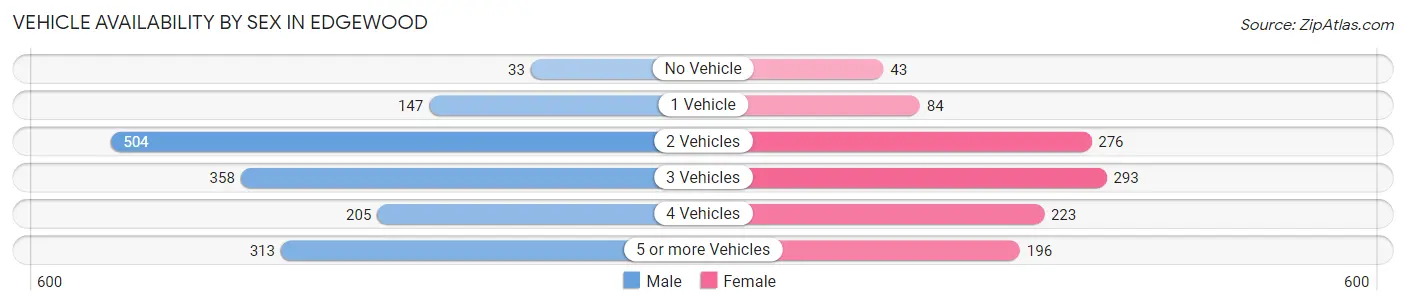
| Vehicles Available | Male | Female |
| No Vehicle | 33 (2.1%) | 43 (3.9%) |
| 1 Vehicle | 147 (9.4%) | 84 (7.5%) |
| 2 Vehicles | 504 (32.3%) | 276 (24.7%) |
| 3 Vehicles | 358 (23.0%) | 293 (26.3%) |
| 4 Vehicles | 205 (13.1%) | 223 (20.0%) |
| 5 or more Vehicles | 313 (20.1%) | 196 (17.6%) |
| Total | 1,560 (100.0%) | 1,115 (100.0%) |
Commute Time in Edgewood
The most frequently occuring commute durations in Edgewood are 45 to 59 minutes (374 commuters, 16.3%), 40 to 44 minutes (335 commuters, 14.6%), and 30 to 34 minutes (286 commuters, 12.5%).
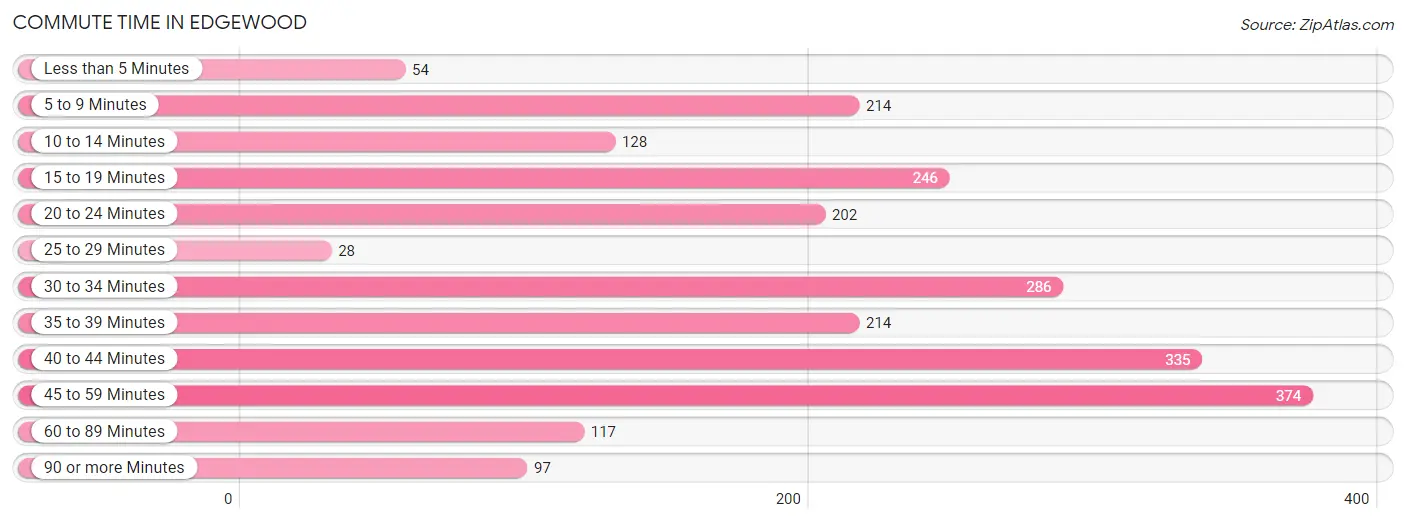
| Commute Time | # Commuters | % Commuters |
| Less than 5 Minutes | 54 | 2.4% |
| 5 to 9 Minutes | 214 | 9.3% |
| 10 to 14 Minutes | 128 | 5.6% |
| 15 to 19 Minutes | 246 | 10.7% |
| 20 to 24 Minutes | 202 | 8.8% |
| 25 to 29 Minutes | 28 | 1.2% |
| 30 to 34 Minutes | 286 | 12.5% |
| 35 to 39 Minutes | 214 | 9.3% |
| 40 to 44 Minutes | 335 | 14.6% |
| 45 to 59 Minutes | 374 | 16.3% |
| 60 to 89 Minutes | 117 | 5.1% |
| 90 or more Minutes | 97 | 4.2% |
Commute Time by Sex in Edgewood
The most common commute times in Edgewood are 40 to 44 minutes (280 commuters, 19.3%) for males and 15 to 19 minutes (193 commuters, 22.9%) for females.
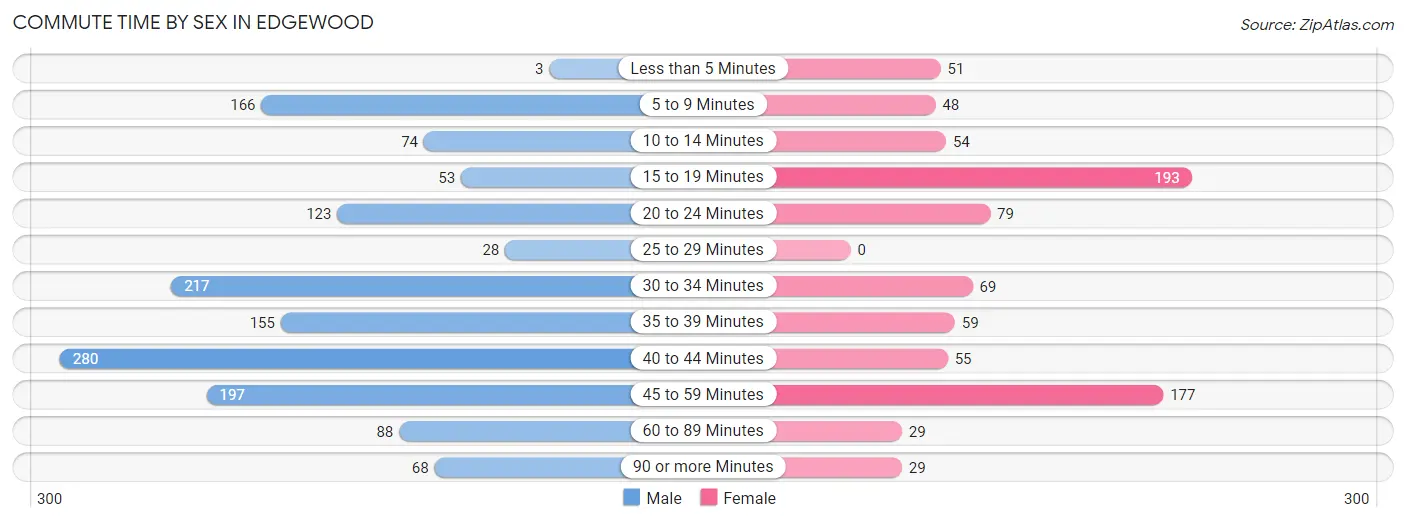
| Commute Time | Male | Female |
| Less than 5 Minutes | 3 (0.2%) | 51 (6.0%) |
| 5 to 9 Minutes | 166 (11.4%) | 48 (5.7%) |
| 10 to 14 Minutes | 74 (5.1%) | 54 (6.4%) |
| 15 to 19 Minutes | 53 (3.6%) | 193 (22.9%) |
| 20 to 24 Minutes | 123 (8.5%) | 79 (9.4%) |
| 25 to 29 Minutes | 28 (1.9%) | 0 (0.0%) |
| 30 to 34 Minutes | 217 (14.9%) | 69 (8.2%) |
| 35 to 39 Minutes | 155 (10.7%) | 59 (7.0%) |
| 40 to 44 Minutes | 280 (19.3%) | 55 (6.5%) |
| 45 to 59 Minutes | 197 (13.6%) | 177 (21.0%) |
| 60 to 89 Minutes | 88 (6.1%) | 29 (3.4%) |
| 90 or more Minutes | 68 (4.7%) | 29 (3.4%) |
Time of Departure to Work by Sex in Edgewood
The most frequent times of departure to work in Edgewood are 7:00 AM to 7:29 AM (219, 15.1%) for males and 7:30 AM to 7:59 AM (162, 19.2%) for females.
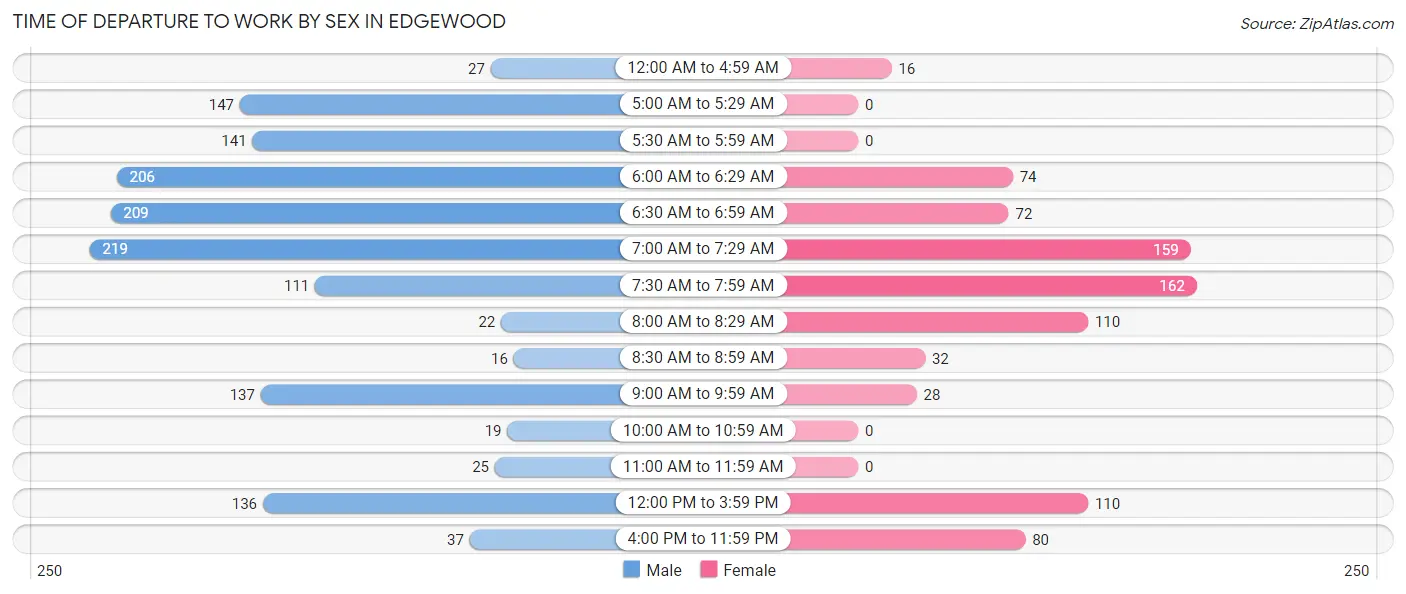
| Time of Departure | Male | Female |
| 12:00 AM to 4:59 AM | 27 (1.9%) | 16 (1.9%) |
| 5:00 AM to 5:29 AM | 147 (10.1%) | 0 (0.0%) |
| 5:30 AM to 5:59 AM | 141 (9.7%) | 0 (0.0%) |
| 6:00 AM to 6:29 AM | 206 (14.2%) | 74 (8.8%) |
| 6:30 AM to 6:59 AM | 209 (14.4%) | 72 (8.5%) |
| 7:00 AM to 7:29 AM | 219 (15.1%) | 159 (18.9%) |
| 7:30 AM to 7:59 AM | 111 (7.6%) | 162 (19.2%) |
| 8:00 AM to 8:29 AM | 22 (1.5%) | 110 (13.1%) |
| 8:30 AM to 8:59 AM | 16 (1.1%) | 32 (3.8%) |
| 9:00 AM to 9:59 AM | 137 (9.4%) | 28 (3.3%) |
| 10:00 AM to 10:59 AM | 19 (1.3%) | 0 (0.0%) |
| 11:00 AM to 11:59 AM | 25 (1.7%) | 0 (0.0%) |
| 12:00 PM to 3:59 PM | 136 (9.4%) | 110 (13.1%) |
| 4:00 PM to 11:59 PM | 37 (2.5%) | 80 (9.5%) |
| Total | 1,452 (100.0%) | 843 (100.0%) |
Housing Occupancy in Edgewood
Occupancy by Ownership in Edgewood
Of the total 2,220 dwellings in Edgewood, owner-occupied units account for 1,987 (89.5%), while renter-occupied units make up 233 (10.5%).
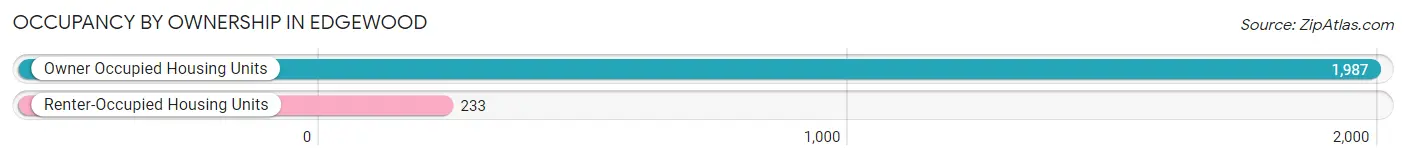
| Occupancy | # Housing Units | % Housing Units |
| Owner Occupied Housing Units | 1,987 | 89.5% |
| Renter-Occupied Housing Units | 233 | 10.5% |
| Total Occupied Housing Units | 2,220 | 100.0% |
Occupancy by Household Size in Edgewood
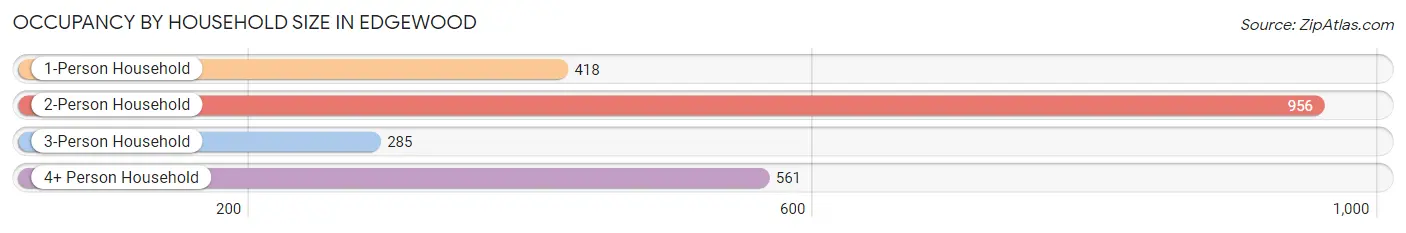
| Household Size | # Housing Units | % Housing Units |
| 1-Person Household | 418 | 18.8% |
| 2-Person Household | 956 | 43.1% |
| 3-Person Household | 285 | 12.8% |
| 4+ Person Household | 561 | 25.3% |
| Total Housing Units | 2,220 | 100.0% |
Occupancy by Ownership by Household Size in Edgewood
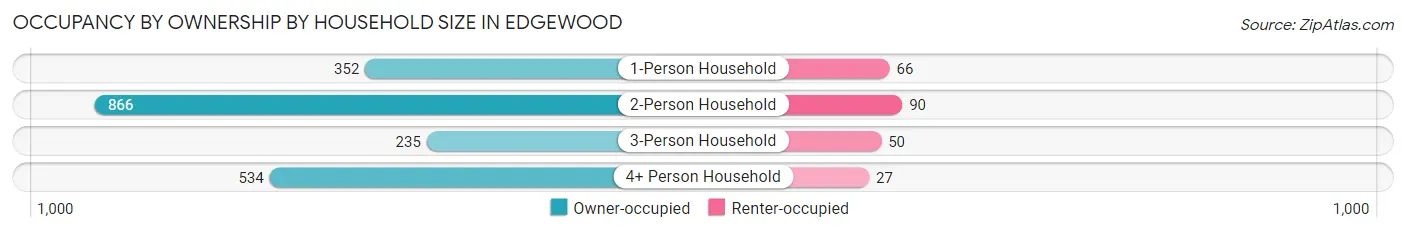
| Household Size | Owner-occupied | Renter-occupied |
| 1-Person Household | 352 (84.2%) | 66 (15.8%) |
| 2-Person Household | 866 (90.6%) | 90 (9.4%) |
| 3-Person Household | 235 (82.5%) | 50 (17.5%) |
| 4+ Person Household | 534 (95.2%) | 27 (4.8%) |
| Total Housing Units | 1,987 (89.5%) | 233 (10.5%) |
Occupancy by Educational Attainment in Edgewood
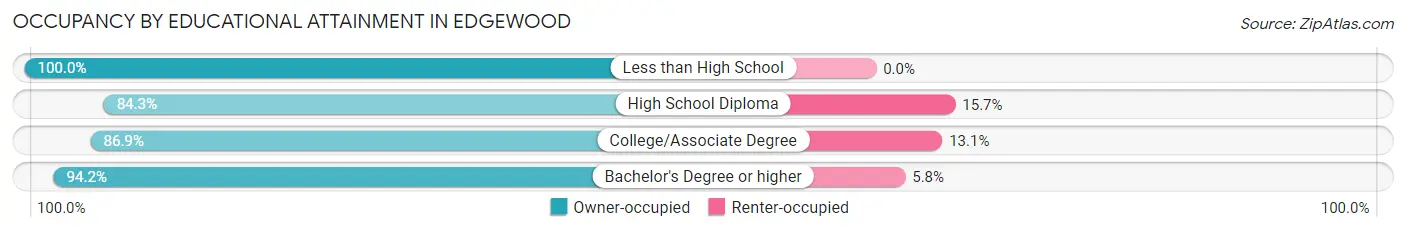
| Household Size | Owner-occupied | Renter-occupied |
| Less than High School | 171 (100.0%) | 0 (0.0%) |
| High School Diploma | 376 (84.3%) | 70 (15.7%) |
| College/Associate Degree | 836 (86.9%) | 126 (13.1%) |
| Bachelor's Degree or higher | 604 (94.2%) | 37 (5.8%) |
Occupancy by Age of Householder in Edgewood
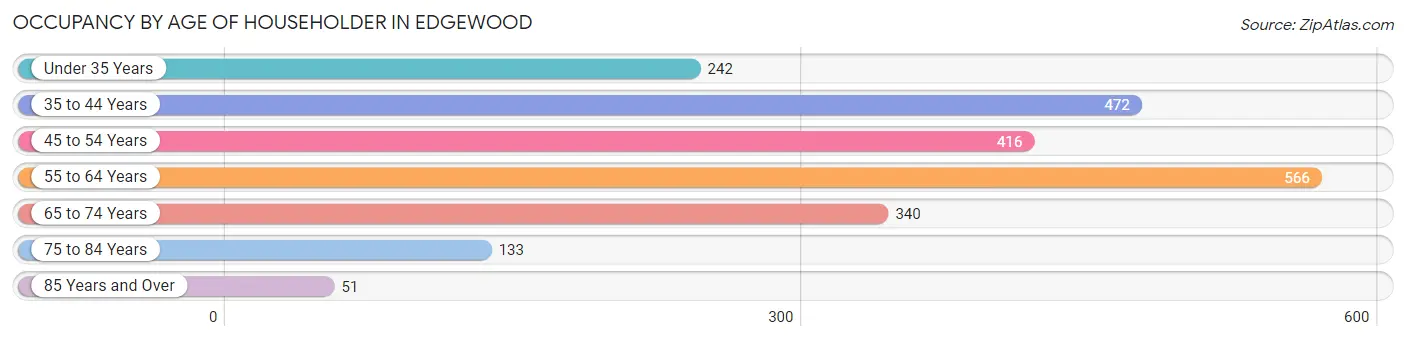
| Age Bracket | # Households | % Households |
| Under 35 Years | 242 | 10.9% |
| 35 to 44 Years | 472 | 21.3% |
| 45 to 54 Years | 416 | 18.7% |
| 55 to 64 Years | 566 | 25.5% |
| 65 to 74 Years | 340 | 15.3% |
| 75 to 84 Years | 133 | 6.0% |
| 85 Years and Over | 51 | 2.3% |
| Total | 2,220 | 100.0% |
Housing Finances in Edgewood
Median Income by Occupancy in Edgewood
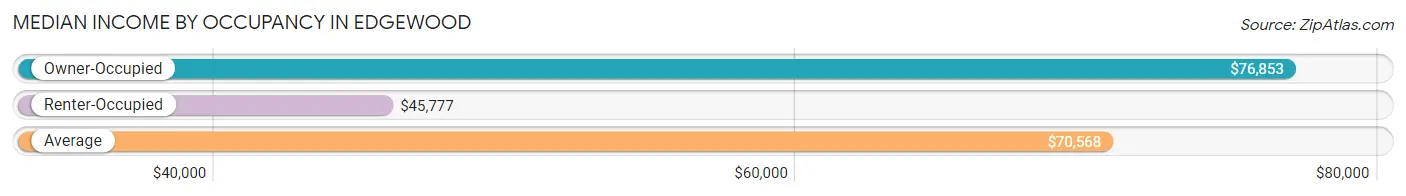
| Occupancy Type | # Households | Median Income |
| Owner-Occupied | 1,987 (89.5%) | $76,853 |
| Renter-Occupied | 233 (10.5%) | $45,777 |
| Average | 2,220 (100.0%) | $70,568 |
Occupancy by Householder Income Bracket in Edgewood
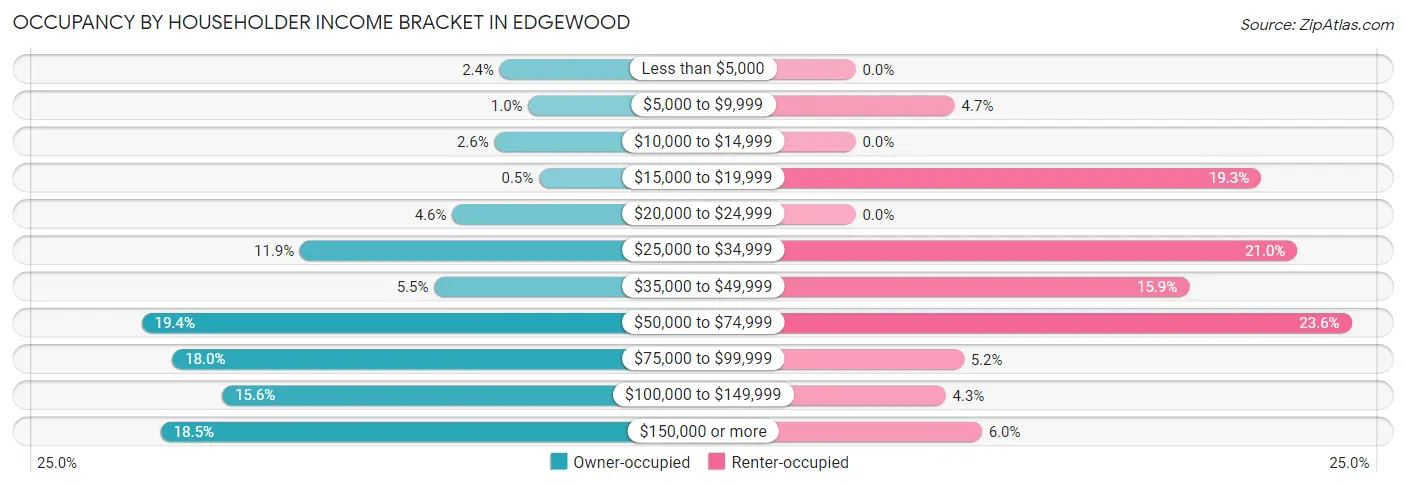
| Income Bracket | Owner-occupied | Renter-occupied |
| Less than $5,000 | 47 (2.4%) | 0 (0.0%) |
| $5,000 to $9,999 | 20 (1.0%) | 11 (4.7%) |
| $10,000 to $14,999 | 52 (2.6%) | 0 (0.0%) |
| $15,000 to $19,999 | 10 (0.5%) | 45 (19.3%) |
| $20,000 to $24,999 | 92 (4.6%) | 0 (0.0%) |
| $25,000 to $34,999 | 236 (11.9%) | 49 (21.0%) |
| $35,000 to $49,999 | 109 (5.5%) | 37 (15.9%) |
| $50,000 to $74,999 | 386 (19.4%) | 55 (23.6%) |
| $75,000 to $99,999 | 357 (18.0%) | 12 (5.1%) |
| $100,000 to $149,999 | 310 (15.6%) | 10 (4.3%) |
| $150,000 or more | 368 (18.5%) | 14 (6.0%) |
| Total | 1,987 (100.0%) | 233 (100.0%) |
Monthly Housing Cost Tiers in Edgewood
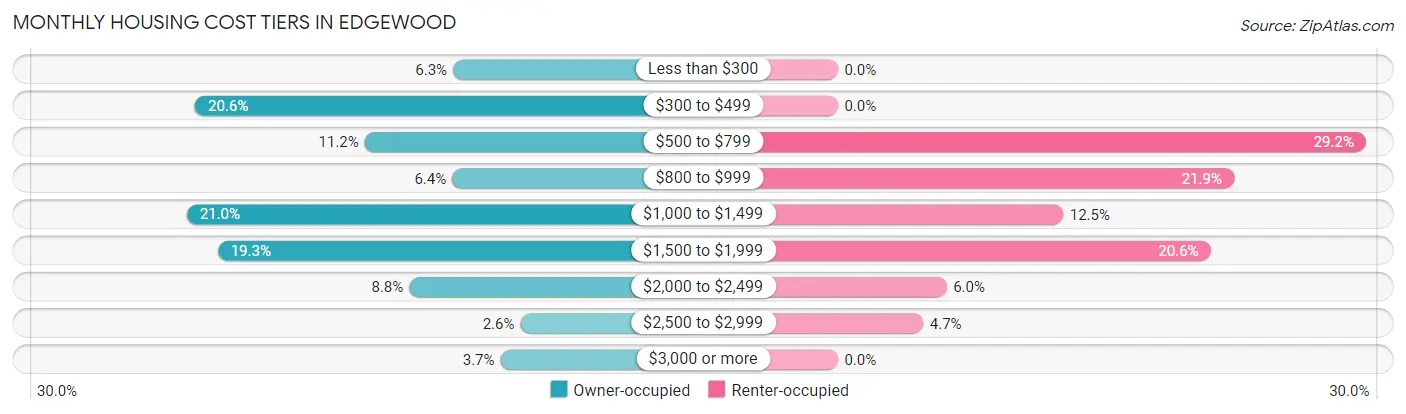
| Monthly Cost | Owner-occupied | Renter-occupied |
| Less than $300 | 126 (6.3%) | 0 (0.0%) |
| $300 to $499 | 409 (20.6%) | 0 (0.0%) |
| $500 to $799 | 223 (11.2%) | 68 (29.2%) |
| $800 to $999 | 127 (6.4%) | 51 (21.9%) |
| $1,000 to $1,499 | 418 (21.0%) | 29 (12.4%) |
| $1,500 to $1,999 | 384 (19.3%) | 48 (20.6%) |
| $2,000 to $2,499 | 174 (8.8%) | 14 (6.0%) |
| $2,500 to $2,999 | 52 (2.6%) | 11 (4.7%) |
| $3,000 or more | 74 (3.7%) | 0 (0.0%) |
| Total | 1,987 (100.0%) | 233 (100.0%) |
Physical Housing Characteristics in Edgewood
Housing Structures in Edgewood
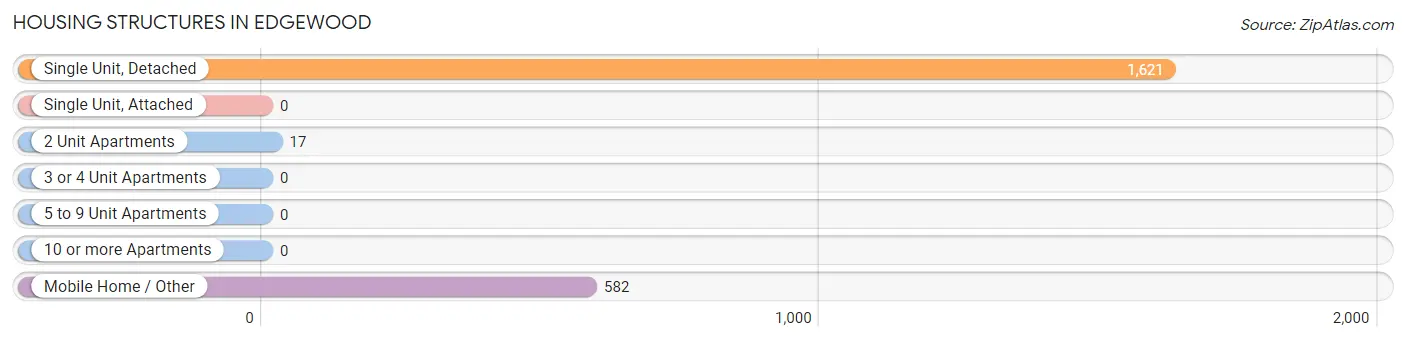
| Structure Type | # Housing Units | % Housing Units |
| Single Unit, Detached | 1,621 | 73.0% |
| Single Unit, Attached | 0 | 0.0% |
| 2 Unit Apartments | 17 | 0.8% |
| 3 or 4 Unit Apartments | 0 | 0.0% |
| 5 to 9 Unit Apartments | 0 | 0.0% |
| 10 or more Apartments | 0 | 0.0% |
| Mobile Home / Other | 582 | 26.2% |
| Total | 2,220 | 100.0% |
Housing Structures by Occupancy in Edgewood
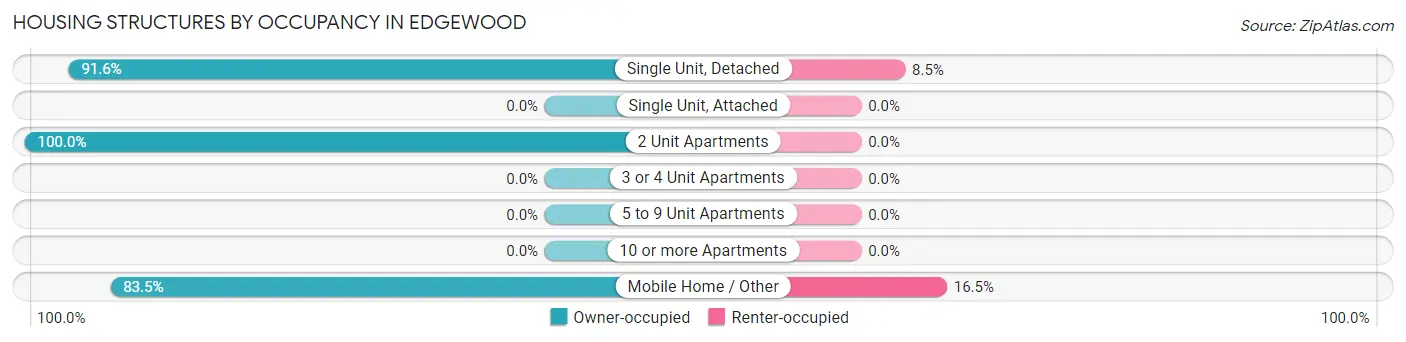
| Structure Type | Owner-occupied | Renter-occupied |
| Single Unit, Detached | 1,484 (91.5%) | 137 (8.5%) |
| Single Unit, Attached | 0 (0.0%) | 0 (0.0%) |
| 2 Unit Apartments | 17 (100.0%) | 0 (0.0%) |
| 3 or 4 Unit Apartments | 0 (0.0%) | 0 (0.0%) |
| 5 to 9 Unit Apartments | 0 (0.0%) | 0 (0.0%) |
| 10 or more Apartments | 0 (0.0%) | 0 (0.0%) |
| Mobile Home / Other | 486 (83.5%) | 96 (16.5%) |
| Total | 1,987 (89.5%) | 233 (10.5%) |
Housing Structures by Number of Rooms in Edgewood
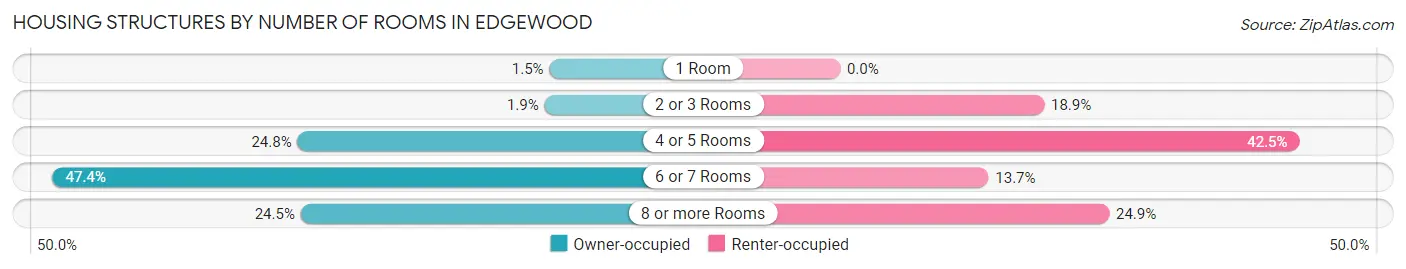
| Number of Rooms | Owner-occupied | Renter-occupied |
| 1 Room | 29 (1.5%) | 0 (0.0%) |
| 2 or 3 Rooms | 38 (1.9%) | 44 (18.9%) |
| 4 or 5 Rooms | 492 (24.8%) | 99 (42.5%) |
| 6 or 7 Rooms | 942 (47.4%) | 32 (13.7%) |
| 8 or more Rooms | 486 (24.5%) | 58 (24.9%) |
| Total | 1,987 (100.0%) | 233 (100.0%) |
Housing Structure by Heating Type in Edgewood
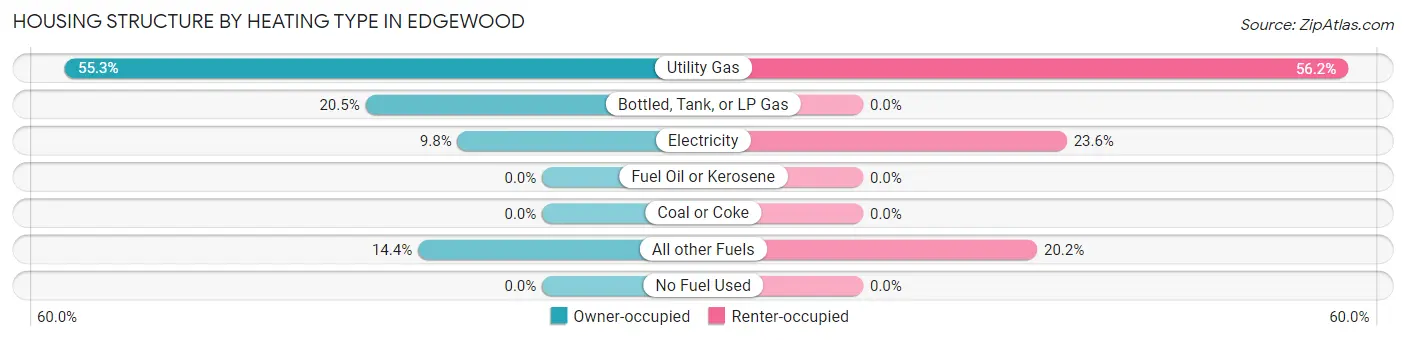
| Heating Type | Owner-occupied | Renter-occupied |
| Utility Gas | 1,099 (55.3%) | 131 (56.2%) |
| Bottled, Tank, or LP Gas | 407 (20.5%) | 0 (0.0%) |
| Electricity | 195 (9.8%) | 55 (23.6%) |
| Fuel Oil or Kerosene | 0 (0.0%) | 0 (0.0%) |
| Coal or Coke | 0 (0.0%) | 0 (0.0%) |
| All other Fuels | 286 (14.4%) | 47 (20.2%) |
| No Fuel Used | 0 (0.0%) | 0 (0.0%) |
| Total | 1,987 (100.0%) | 233 (100.0%) |
Household Vehicle Usage in Edgewood
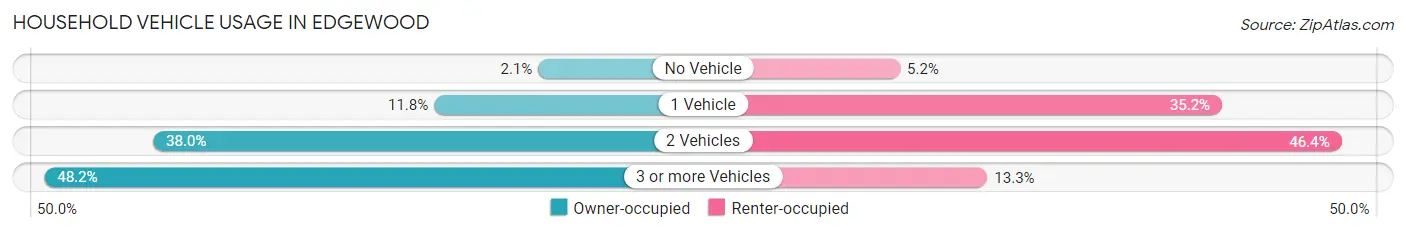
| Vehicles per Household | Owner-occupied | Renter-occupied |
| No Vehicle | 41 (2.1%) | 12 (5.1%) |
| 1 Vehicle | 234 (11.8%) | 82 (35.2%) |
| 2 Vehicles | 755 (38.0%) | 108 (46.4%) |
| 3 or more Vehicles | 957 (48.2%) | 31 (13.3%) |
| Total | 1,987 (100.0%) | 233 (100.0%) |
Real Estate & Mortgages in Edgewood
Real Estate and Mortgage Overview in Edgewood
| Characteristic | Without Mortgage | With Mortgage |
| Housing Units | 750 | 1,237 |
| Median Property Value | $225,500 | $249,800 |
| Median Household Income | $53,580 | $319 |
| Monthly Housing Costs | $456 | $74 |
| Real Estate Taxes | $1,398 | $182 |
Property Value by Mortgage Status in Edgewood
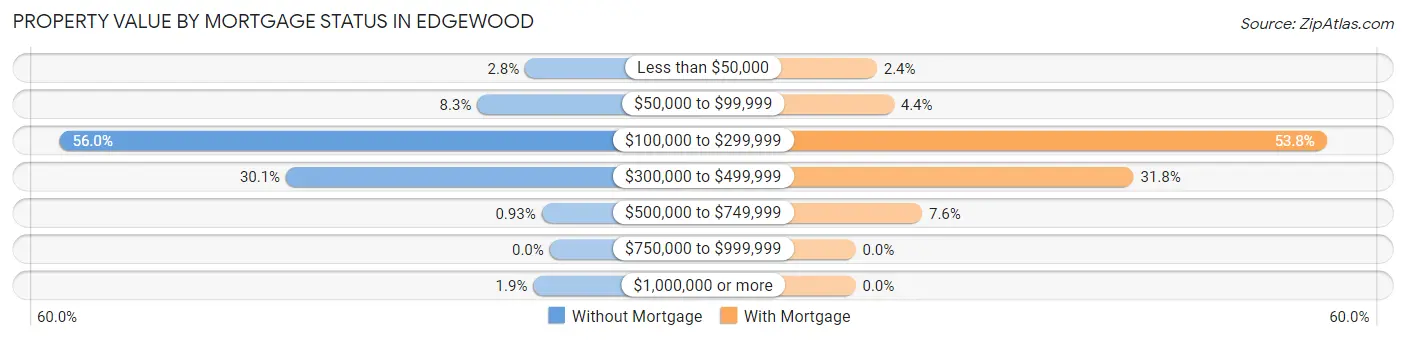
| Property Value | Without Mortgage | With Mortgage |
| Less than $50,000 | 21 (2.8%) | 30 (2.4%) |
| $50,000 to $99,999 | 62 (8.3%) | 54 (4.4%) |
| $100,000 to $299,999 | 420 (56.0%) | 666 (53.8%) |
| $300,000 to $499,999 | 226 (30.1%) | 393 (31.8%) |
| $500,000 to $749,999 | 7 (0.9%) | 94 (7.6%) |
| $750,000 to $999,999 | 0 (0.0%) | 0 (0.0%) |
| $1,000,000 or more | 14 (1.9%) | 0 (0.0%) |
| Total | 750 (100.0%) | 1,237 (100.0%) |
Household Income by Mortgage Status in Edgewood
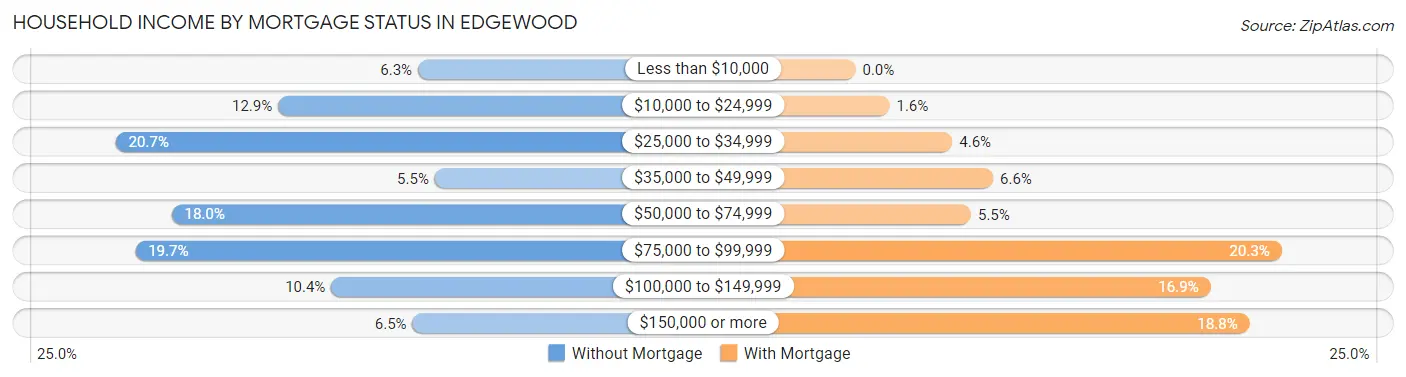
| Household Income | Without Mortgage | With Mortgage |
| Less than $10,000 | 47 (6.3%) | 0 (0.0%) |
| $10,000 to $24,999 | 97 (12.9%) | 20 (1.6%) |
| $25,000 to $34,999 | 155 (20.7%) | 57 (4.6%) |
| $35,000 to $49,999 | 41 (5.5%) | 81 (6.6%) |
| $50,000 to $74,999 | 135 (18.0%) | 68 (5.5%) |
| $75,000 to $99,999 | 148 (19.7%) | 251 (20.3%) |
| $100,000 to $149,999 | 78 (10.4%) | 209 (16.9%) |
| $150,000 or more | 49 (6.5%) | 232 (18.8%) |
| Total | 750 (100.0%) | 1,237 (100.0%) |
Property Value to Household Income Ratio in Edgewood
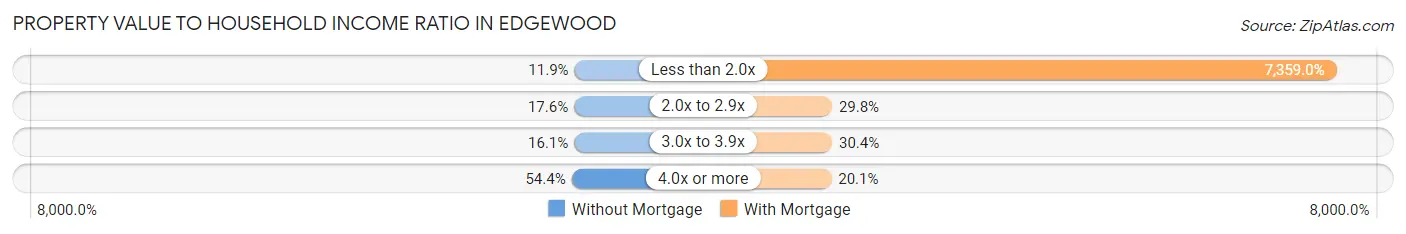
| Value-to-Income Ratio | Without Mortgage | With Mortgage |
| Less than 2.0x | 89 (11.9%) | 91,031 (7,359.0%) |
| 2.0x to 2.9x | 132 (17.6%) | 368 (29.7%) |
| 3.0x to 3.9x | 121 (16.1%) | 376 (30.4%) |
| 4.0x or more | 408 (54.4%) | 248 (20.1%) |
| Total | 750 (100.0%) | 1,237 (100.0%) |
Real Estate Taxes by Mortgage Status in Edgewood
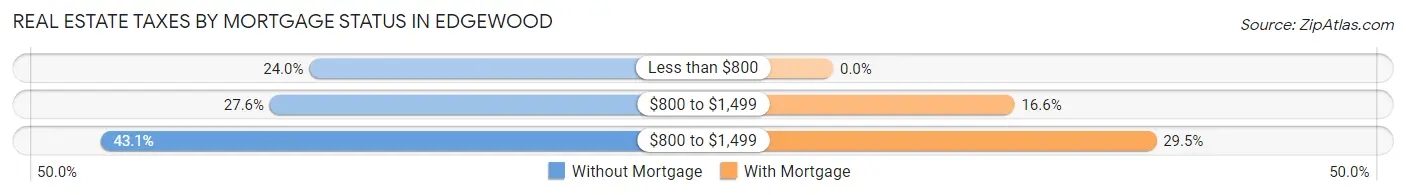
| Property Taxes | Without Mortgage | With Mortgage |
| Less than $800 | 180 (24.0%) | 0 (0.0%) |
| $800 to $1,499 | 207 (27.6%) | 205 (16.6%) |
| $800 to $1,499 | 323 (43.1%) | 365 (29.5%) |
| Total | 750 (100.0%) | 1,237 (100.0%) |
Health & Disability in Edgewood
Health Insurance Coverage by Age in Edgewood
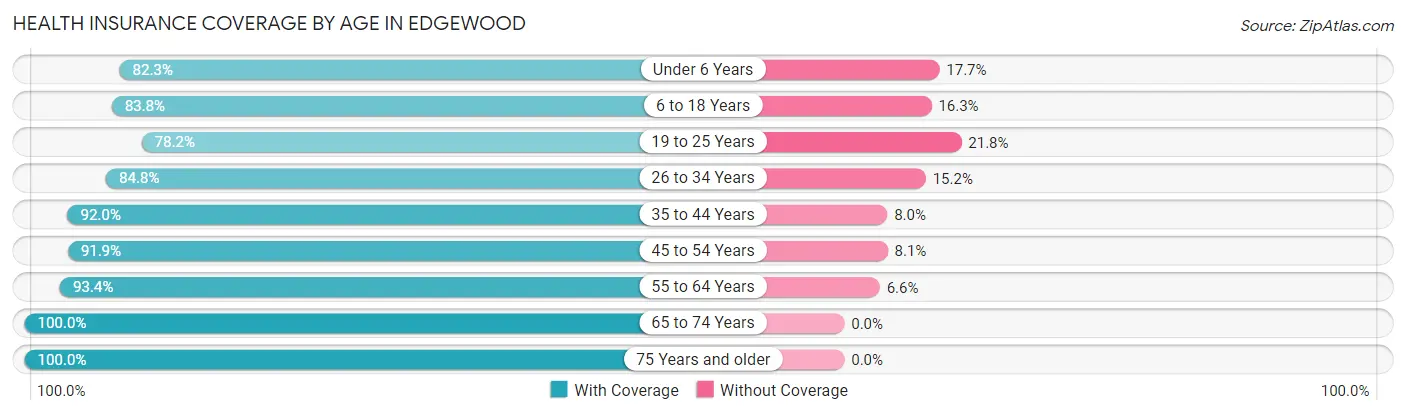
| Age Bracket | With Coverage | Without Coverage |
| Under 6 Years | 427 (82.3%) | 92 (17.7%) |
| 6 to 18 Years | 835 (83.8%) | 162 (16.3%) |
| 19 to 25 Years | 179 (78.2%) | 50 (21.8%) |
| 26 to 34 Years | 614 (84.8%) | 110 (15.2%) |
| 35 to 44 Years | 769 (92.0%) | 67 (8.0%) |
| 45 to 54 Years | 672 (91.9%) | 59 (8.1%) |
| 55 to 64 Years | 1,059 (93.4%) | 75 (6.6%) |
| 65 to 74 Years | 592 (100.0%) | 0 (0.0%) |
| 75 Years and older | 331 (100.0%) | 0 (0.0%) |
| Total | 5,478 (89.9%) | 615 (10.1%) |
Health Insurance Coverage by Citizenship Status in Edgewood
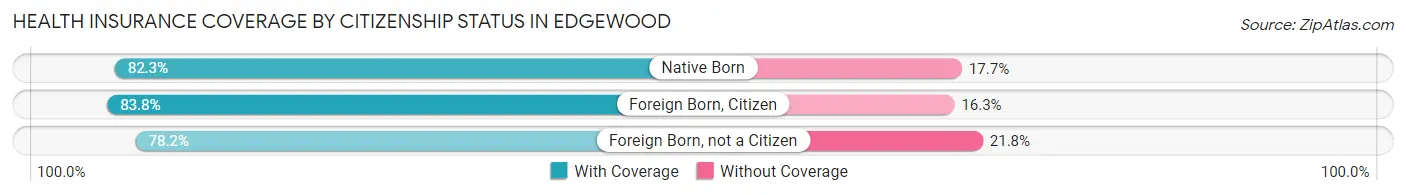
| Citizenship Status | With Coverage | Without Coverage |
| Native Born | 427 (82.3%) | 92 (17.7%) |
| Foreign Born, Citizen | 835 (83.8%) | 162 (16.3%) |
| Foreign Born, not a Citizen | 179 (78.2%) | 50 (21.8%) |
Health Insurance Coverage by Household Income in Edgewood
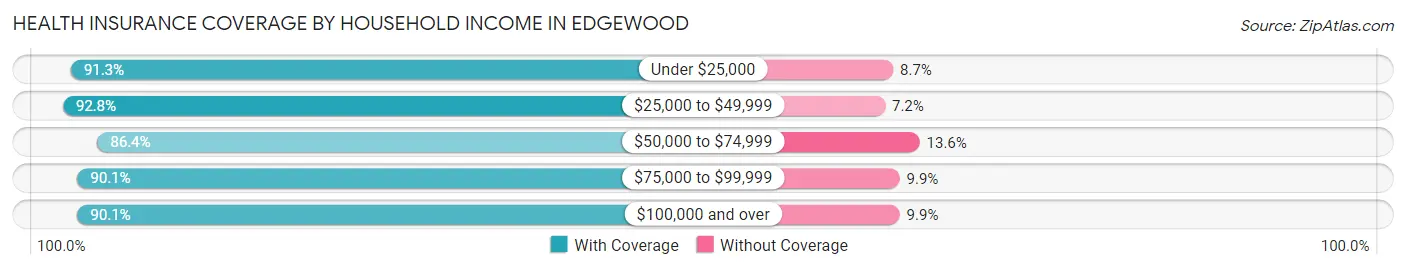
| Household Income | With Coverage | Without Coverage |
| Under $25,000 | 453 (91.3%) | 43 (8.7%) |
| $25,000 to $49,999 | 1,012 (92.8%) | 78 (7.2%) |
| $50,000 to $74,999 | 1,108 (86.4%) | 175 (13.6%) |
| $75,000 to $99,999 | 820 (90.1%) | 90 (9.9%) |
| $100,000 and over | 2,085 (90.1%) | 229 (9.9%) |
Public vs Private Health Insurance Coverage by Age in Edgewood
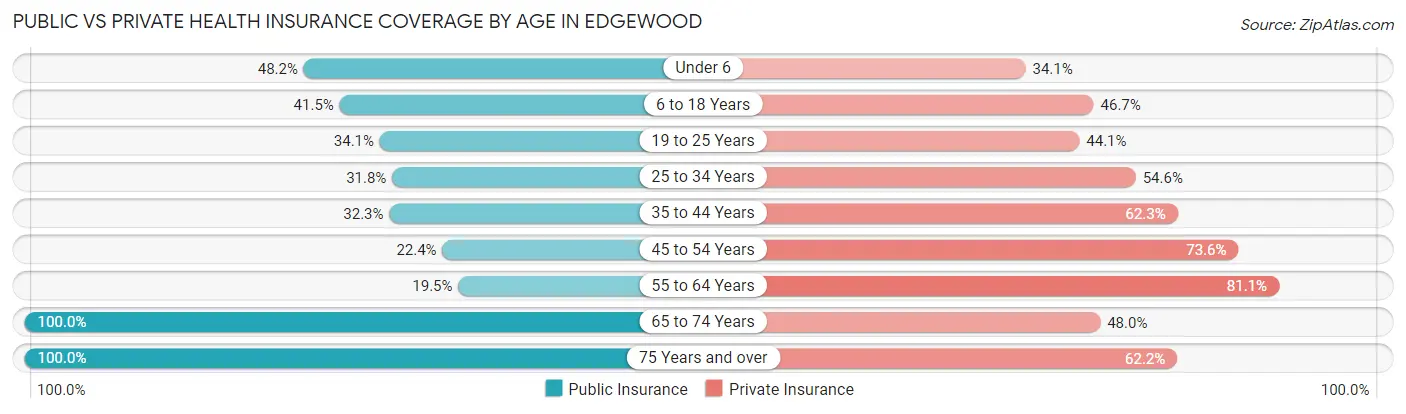
| Age Bracket | Public Insurance | Private Insurance |
| Under 6 | 250 (48.2%) | 177 (34.1%) |
| 6 to 18 Years | 414 (41.5%) | 466 (46.7%) |
| 19 to 25 Years | 78 (34.1%) | 101 (44.1%) |
| 25 to 34 Years | 230 (31.8%) | 395 (54.6%) |
| 35 to 44 Years | 270 (32.3%) | 521 (62.3%) |
| 45 to 54 Years | 164 (22.4%) | 538 (73.6%) |
| 55 to 64 Years | 221 (19.5%) | 920 (81.1%) |
| 65 to 74 Years | 592 (100.0%) | 284 (48.0%) |
| 75 Years and over | 331 (100.0%) | 206 (62.2%) |
| Total | 2,550 (41.8%) | 3,608 (59.2%) |
Disability Status by Sex by Age in Edgewood
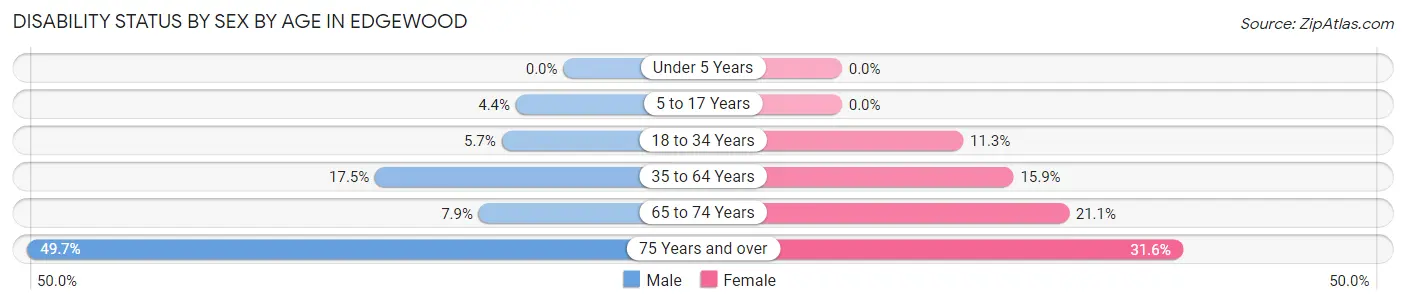
| Age Bracket | Male | Female |
| Under 5 Years | 0 (0.0%) | 0 (0.0%) |
| 5 to 17 Years | 24 (4.4%) | 0 (0.0%) |
| 18 to 34 Years | 32 (5.7%) | 58 (11.3%) |
| 35 to 64 Years | 236 (17.5%) | 215 (15.9%) |
| 65 to 74 Years | 23 (7.9%) | 63 (21.1%) |
| 75 Years and over | 97 (49.7%) | 43 (31.6%) |
Disability Class by Sex by Age in Edgewood
Disability Class: Hearing Difficulty
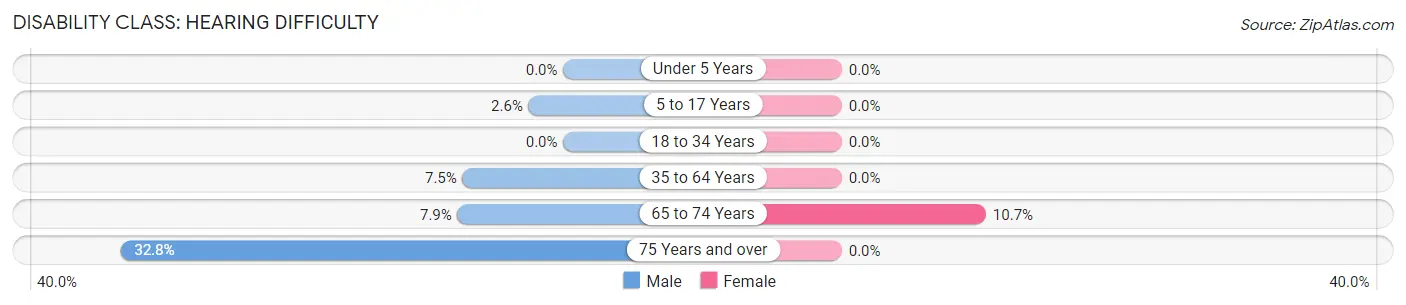
| Age Bracket | Male | Female |
| Under 5 Years | 0 (0.0%) | 0 (0.0%) |
| 5 to 17 Years | 14 (2.6%) | 0 (0.0%) |
| 18 to 34 Years | 0 (0.0%) | 0 (0.0%) |
| 35 to 64 Years | 101 (7.5%) | 0 (0.0%) |
| 65 to 74 Years | 23 (7.9%) | 32 (10.7%) |
| 75 Years and over | 64 (32.8%) | 0 (0.0%) |
Disability Class: Vision Difficulty
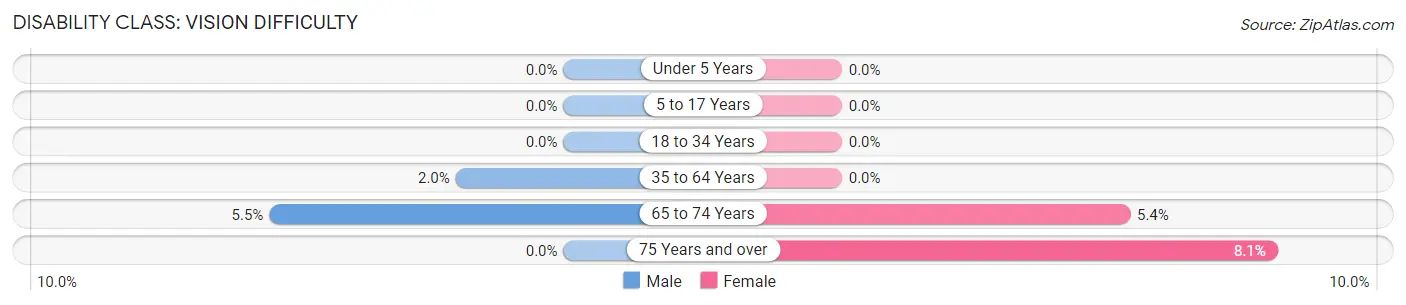
| Age Bracket | Male | Female |
| Under 5 Years | 0 (0.0%) | 0 (0.0%) |
| 5 to 17 Years | 0 (0.0%) | 0 (0.0%) |
| 18 to 34 Years | 0 (0.0%) | 0 (0.0%) |
| 35 to 64 Years | 27 (2.0%) | 0 (0.0%) |
| 65 to 74 Years | 16 (5.5%) | 16 (5.3%) |
| 75 Years and over | 0 (0.0%) | 11 (8.1%) |
Disability Class: Cognitive Difficulty
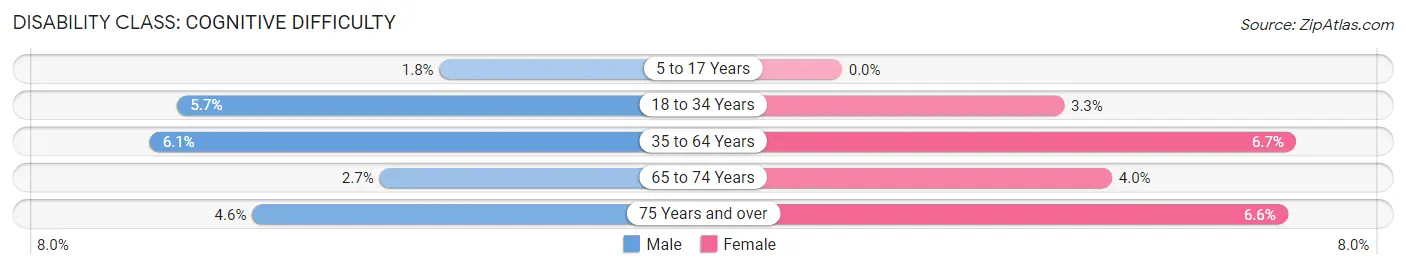
| Age Bracket | Male | Female |
| 5 to 17 Years | 10 (1.8%) | 0 (0.0%) |
| 18 to 34 Years | 32 (5.7%) | 17 (3.3%) |
| 35 to 64 Years | 83 (6.1%) | 91 (6.7%) |
| 65 to 74 Years | 8 (2.7%) | 12 (4.0%) |
| 75 Years and over | 9 (4.6%) | 9 (6.6%) |
Disability Class: Ambulatory Difficulty
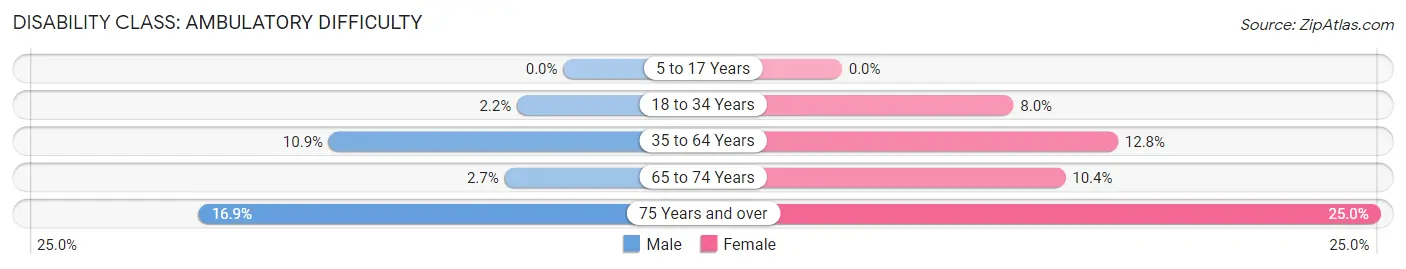
| Age Bracket | Male | Female |
| 5 to 17 Years | 0 (0.0%) | 0 (0.0%) |
| 18 to 34 Years | 12 (2.1%) | 41 (8.0%) |
| 35 to 64 Years | 147 (10.9%) | 173 (12.8%) |
| 65 to 74 Years | 8 (2.7%) | 31 (10.4%) |
| 75 Years and over | 33 (16.9%) | 34 (25.0%) |
Disability Class: Self-Care Difficulty
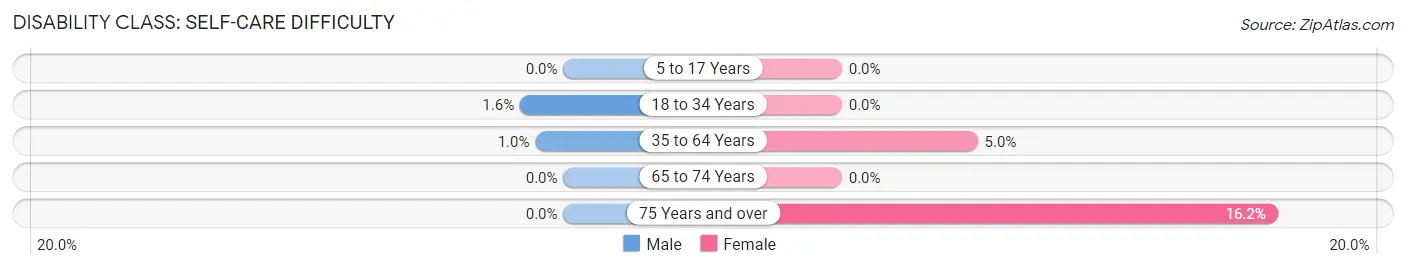
| Age Bracket | Male | Female |
| 5 to 17 Years | 0 (0.0%) | 0 (0.0%) |
| 18 to 34 Years | 9 (1.6%) | 0 (0.0%) |
| 35 to 64 Years | 14 (1.0%) | 68 (5.0%) |
| 65 to 74 Years | 0 (0.0%) | 0 (0.0%) |
| 75 Years and over | 0 (0.0%) | 22 (16.2%) |
Technology Access in Edgewood
Computing Device Access in Edgewood
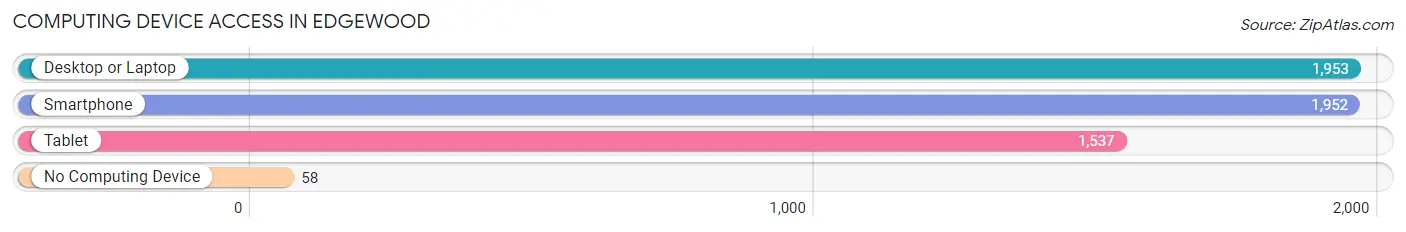
| Device Type | # Households | % Households |
| Desktop or Laptop | 1,953 | 88.0% |
| Smartphone | 1,952 | 87.9% |
| Tablet | 1,537 | 69.2% |
| No Computing Device | 58 | 2.6% |
| Total | 2,220 | 100.0% |
Internet Access in Edgewood
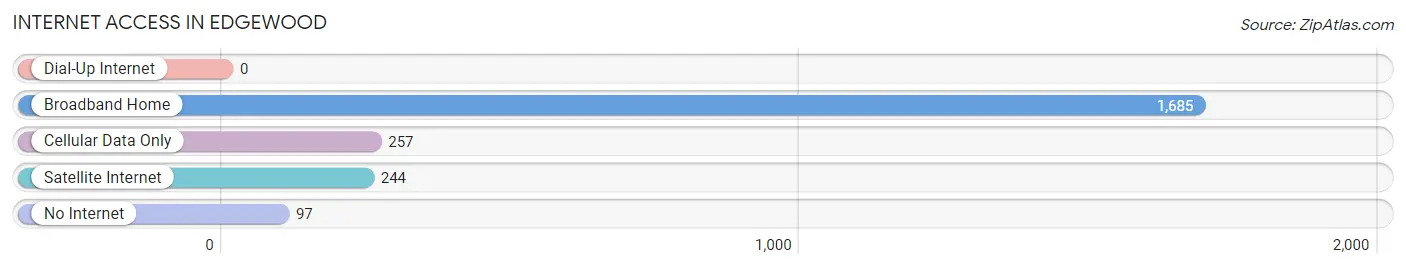
| Internet Type | # Households | % Households |
| Dial-Up Internet | 0 | 0.0% |
| Broadband Home | 1,685 | 75.9% |
| Cellular Data Only | 257 | 11.6% |
| Satellite Internet | 244 | 11.0% |
| No Internet | 97 | 4.4% |
| Total | 2,220 | 100.0% |
Edgewood Summary
Edgewood is a small town located in the state of New Mexico, United States. It is situated in the foothills of the Manzano Mountains, about 25 miles east of Albuquerque. The town has a population of approximately 8,000 people and is part of the Albuquerque metropolitan area.
History
The area that is now Edgewood was originally inhabited by the Pueblo Indians. The first European settlers arrived in the area in the late 1800s. The town was founded in 1891 and was originally known as “Edgewood Station”. The name was changed to Edgewood in 1895.
The town was originally a farming community, but in the early 1900s, the railroad came to the area and the town began to grow. The railroad brought new businesses and industries to the area, and the population began to increase.
In the 1950s, the town began to experience a population boom as people moved to the area from other parts of the country. This growth continued into the 1960s and 1970s, and the town began to develop into a bedroom community for Albuquerque.
Geography
Edgewood is located in the foothills of the Manzano Mountains, about 25 miles east of Albuquerque. The town is situated at an elevation of 6,000 feet above sea level. The town is surrounded by the Cibola National Forest, which provides a beautiful backdrop for the town.
The climate in Edgewood is semi-arid, with hot summers and cold winters. The average annual temperature is around 60 degrees Fahrenheit. The town receives an average of 12 inches of precipitation per year.
Economy
The economy of Edgewood is largely based on tourism and agriculture. The town is home to several tourist attractions, including the Manzano Mountains State Park and the Edgewood Historic District. The town is also home to several wineries and vineyards, which attract visitors from all over the state.
Agriculture is also an important part of the local economy. The town is home to several farms, which produce a variety of crops, including alfalfa, hay, and corn.
Demographics
As of the 2010 census, the population of Edgewood was 8,000. The town is predominantly white, with a small Hispanic population. The median household income is $50,000, and the median home value is $150,000.
The town is served by the Edgewood Independent School District, which consists of four elementary schools, one middle school, and one high school. The town is also home to several private schools, including the Edgewood Academy and the Edgewood Christian Academy.
Edgewood is a small town with a rich history and a vibrant economy. The town is home to a diverse population and offers a variety of attractions and activities for visitors and residents alike. The town is a great place to live, work, and play.
Common Questions
What is Per Capita Income in Edgewood?
Per Capita income in Edgewood is $34,164.
What is the Median Family Income in Edgewood?
Median Family Income in Edgewood is $76,295.
What is the Median Household income in Edgewood?
Median Household Income in Edgewood is $70,568.
What is Income or Wage Gap in Edgewood?
Income or Wage Gap in Edgewood is 38.2%.
Women in Edgewood earn 61.8 cents for every dollar earned by a man.
What is Family Income Deficit in Edgewood?
Family Income Deficit in Edgewood is $8,483.
Families that are below poverty line in Edgewood earn $8,483 less on average than the poverty threshold level.
What is Inequality or Gini Index in Edgewood?
Inequality or Gini Index in Edgewood is 0.42.
What is the Total Population of Edgewood?
Total Population of Edgewood is 6,113.
What is the Total Male Population of Edgewood?
Total Male Population of Edgewood is 3,213.
What is the Total Female Population of Edgewood?
Total Female Population of Edgewood is 2,900.
What is the Ratio of Males per 100 Females in Edgewood?
There are 110.79 Males per 100 Females in Edgewood.
What is the Ratio of Females per 100 Males in Edgewood?
There are 90.26 Females per 100 Males in Edgewood.
What is the Median Population Age in Edgewood?
Median Population Age in Edgewood is 41.2 Years.
What is the Average Family Size in Edgewood
Average Family Size in Edgewood is 3.2 People.
What is the Average Household Size in Edgewood
Average Household Size in Edgewood is 2.8 People.
How Large is the Labor Force in Edgewood?
There are 2,888 People in the Labor Forcein in Edgewood.
What is the Percentage of People in the Labor Force in Edgewood?
59.1% of People are in the Labor Force in Edgewood.
What is the Unemployment Rate in Edgewood?
Unemployment Rate in Edgewood is 6.6%.