Eagle Nest, NM Map & Demographics
Eagle Nest Map
Eagle Nest Overview
$24,686
PER CAPITA INCOME
$58,036
AVG FAMILY INCOME
$43,750
AVG HOUSEHOLD INCOME
8.5%
WAGE / INCOME GAP [ % ]
91.5¢/ $1
WAGE / INCOME GAP [ $ ]
0.33
INEQUALITY / GINI INDEX
249
TOTAL POPULATION
111
MALE POPULATION
138
FEMALE POPULATION
80.43
MALES / 100 FEMALES
124.32
FEMALES / 100 MALES
55.3
MEDIAN AGE
3.3
AVG FAMILY SIZE
2.0
AVG HOUSEHOLD SIZE
93
LABOR FORCE [ PEOPLE ]
47.4%
PERCENT IN LABOR FORCE
23.7%
UNEMPLOYMENT RATE
Eagle Nest Zip Codes
Income in Eagle Nest
Income Overview in Eagle Nest
Per Capita Income in Eagle Nest is $24,686, while median incomes of families and households are $58,036 and $43,750 respectively.
| Characteristic | Number | Measure |
| Per Capita Income | 249 | $24,686 |
| Median Family Income | 47 | $58,036 |
| Mean Family Income | 47 | $55,847 |
| Median Household Income | 122 | $43,750 |
| Mean Household Income | 122 | $51,558 |
| Income Deficit | 47 | $0 |
| Wage / Income Gap (%) | 249 | 8.49% |
| Wage / Income Gap ($) | 249 | 91.51¢ per $1 |
| Gini / Inequality Index | 249 | 0.33 |
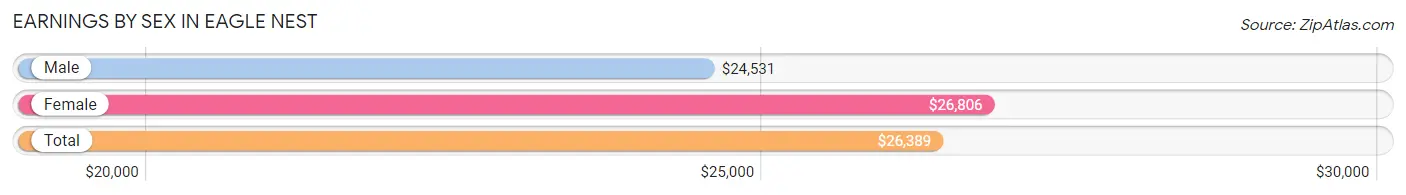
Earnings by Sex in Eagle Nest
Average Earnings in Eagle Nest are $26,389, $24,531 for men and $26,806 for women, a difference of 8.5%.
| Sex | Number | Average Earnings |
| Male | 53 (55.2%) | $24,531 |
| Female | 43 (44.8%) | $26,806 |
| Total | 96 (100.0%) | $26,389 |
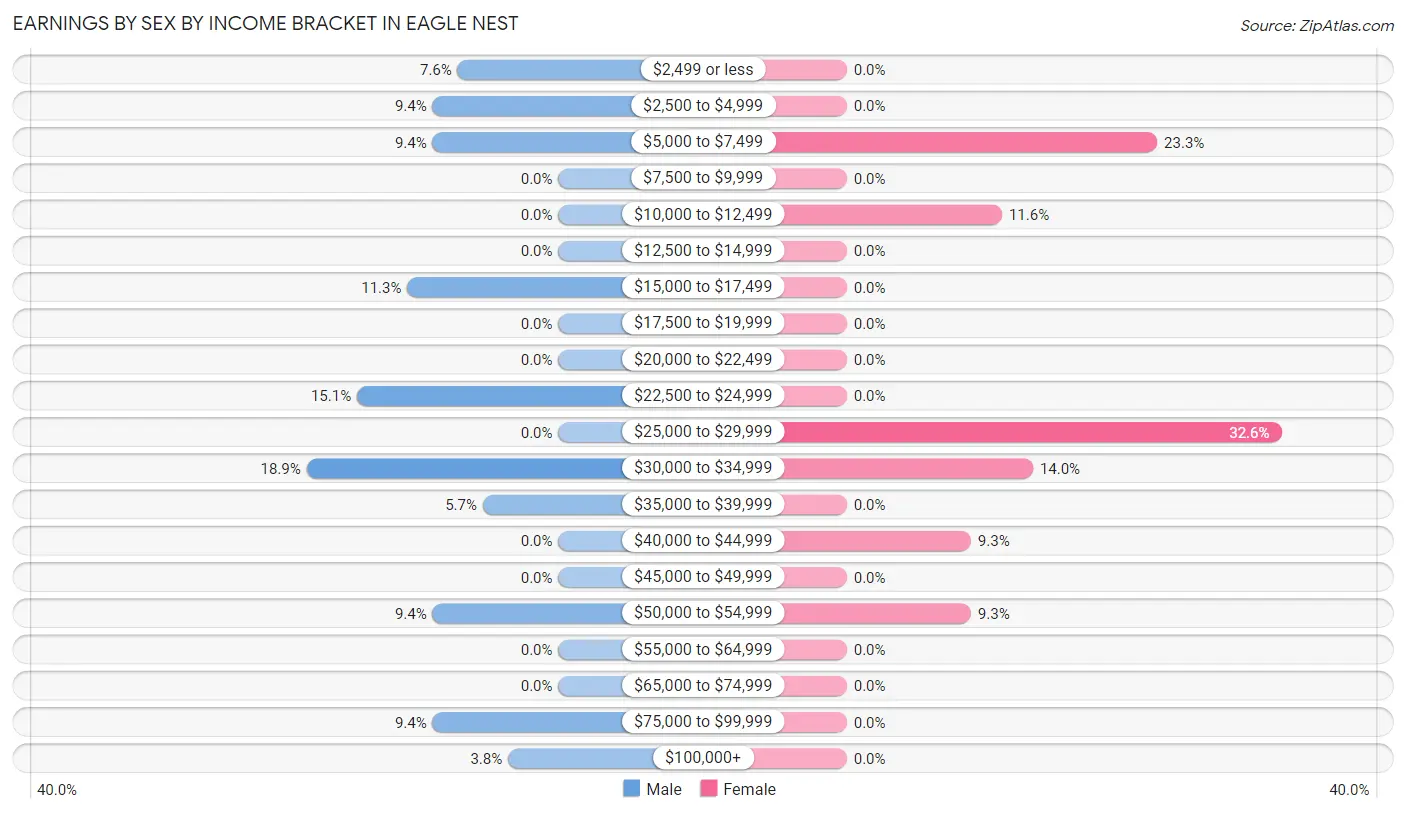
Earnings by Sex by Income Bracket in Eagle Nest
The most common earnings brackets in Eagle Nest are $30,000 to $34,999 for men (10 | 18.9%) and $25,000 to $29,999 for women (14 | 32.6%).
| Income | Male | Female |
| $2,499 or less | 4 (7.5%) | 0 (0.0%) |
| $2,500 to $4,999 | 5 (9.4%) | 0 (0.0%) |
| $5,000 to $7,499 | 5 (9.4%) | 10 (23.3%) |
| $7,500 to $9,999 | 0 (0.0%) | 0 (0.0%) |
| $10,000 to $12,499 | 0 (0.0%) | 5 (11.6%) |
| $12,500 to $14,999 | 0 (0.0%) | 0 (0.0%) |
| $15,000 to $17,499 | 6 (11.3%) | 0 (0.0%) |
| $17,500 to $19,999 | 0 (0.0%) | 0 (0.0%) |
| $20,000 to $22,499 | 0 (0.0%) | 0 (0.0%) |
| $22,500 to $24,999 | 8 (15.1%) | 0 (0.0%) |
| $25,000 to $29,999 | 0 (0.0%) | 14 (32.6%) |
| $30,000 to $34,999 | 10 (18.9%) | 6 (14.0%) |
| $35,000 to $39,999 | 3 (5.7%) | 0 (0.0%) |
| $40,000 to $44,999 | 0 (0.0%) | 4 (9.3%) |
| $45,000 to $49,999 | 0 (0.0%) | 0 (0.0%) |
| $50,000 to $54,999 | 5 (9.4%) | 4 (9.3%) |
| $55,000 to $64,999 | 0 (0.0%) | 0 (0.0%) |
| $65,000 to $74,999 | 0 (0.0%) | 0 (0.0%) |
| $75,000 to $99,999 | 5 (9.4%) | 0 (0.0%) |
| $100,000+ | 2 (3.8%) | 0 (0.0%) |
| Total | 53 (100.0%) | 43 (100.0%) |
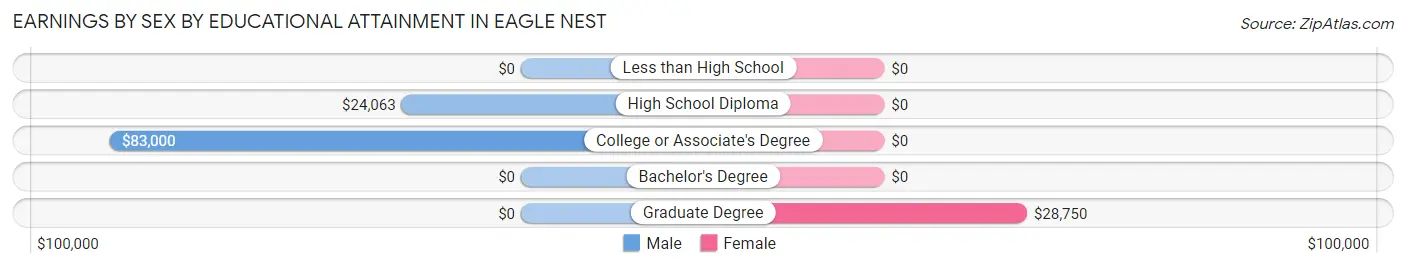
Earnings by Sex by Educational Attainment in Eagle Nest
Average earnings in Eagle Nest are $24,531 for men and $26,806 for women, a difference of 8.5%. Men with an educational attainment of college or associate's degree enjoy the highest average annual earnings of $83,000, while those with high school diploma education earn the least with $24,063. Women with an educational attainment of graduate degree earn the most with the average annual earnings of $28,750, while those with graduate degree education have the smallest earnings of $28,750.
| Educational Attainment | Male Income | Female Income |
| Less than High School | - | - |
| High School Diploma | $24,063 | $0 |
| College or Associate's Degree | $83,000 | $0 |
| Bachelor's Degree | - | - |
| Graduate Degree | - | - |
| Total | $24,531 | $26,806 |
Family Income in Eagle Nest
Family Income Brackets in Eagle Nest
According to the Eagle Nest family income data, there are 17 families falling into the $25,000 to $34,999 income range, which is the most common income bracket and makes up 36.2% of all families.
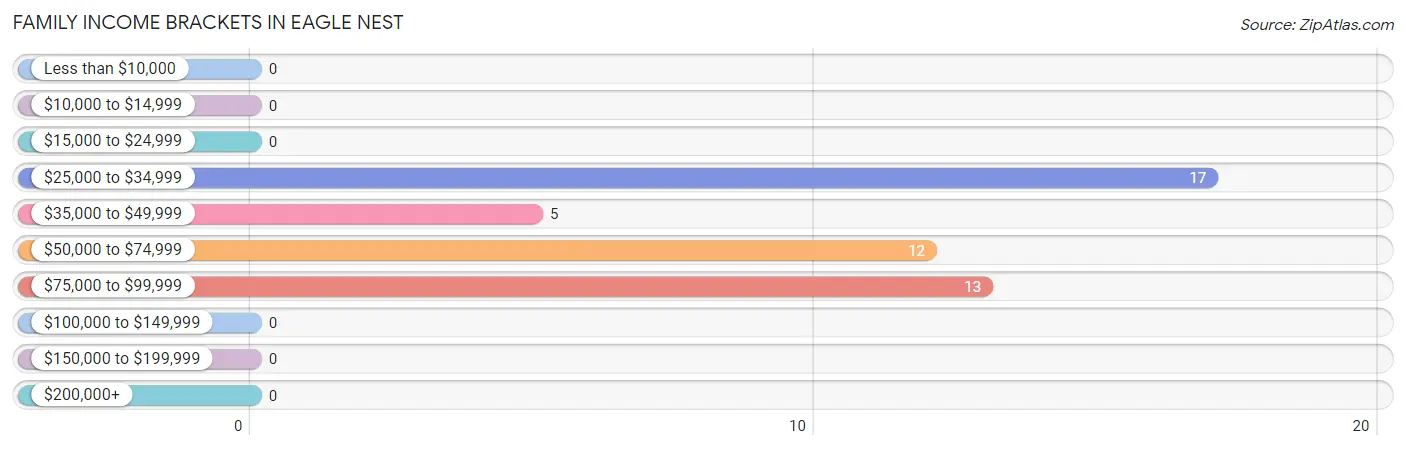
| Income Bracket | # Families | % Families |
| Less than $10,000 | 0 | 0.0% |
| $10,000 to $14,999 | 0 | 0.0% |
| $15,000 to $24,999 | 0 | 0.0% |
| $25,000 to $34,999 | 17 | 36.2% |
| $35,000 to $49,999 | 5 | 10.6% |
| $50,000 to $74,999 | 12 | 25.5% |
| $75,000 to $99,999 | 13 | 27.7% |
| $100,000 to $149,999 | 0 | 0.0% |
| $150,000 to $199,999 | 0 | 0.0% |
| $200,000+ | 0 | 0.0% |
Family Income by Famaliy Size in Eagle Nest
2-person families (29 | 61.7%) account for the highest median family income in Eagle Nest with $62,750 per family, while 2-person families (29 | 61.7%) have the highest median income of $31,375 per family member.
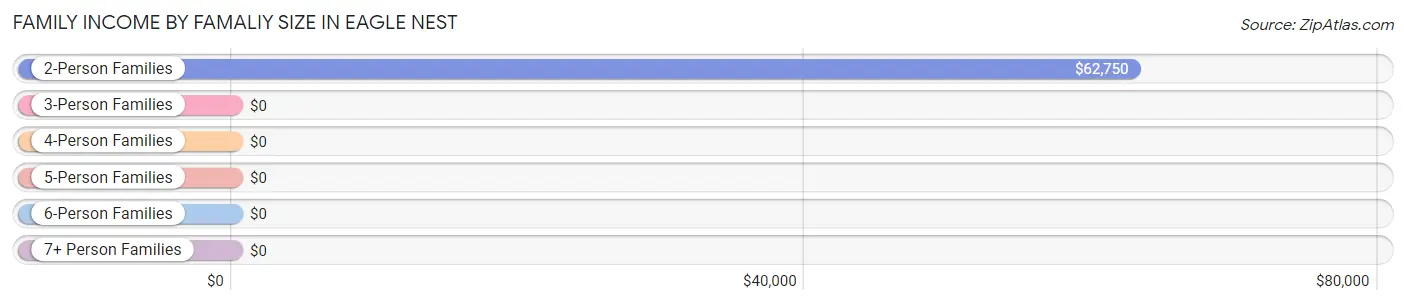
| Income Bracket | # Families | Median Income |
| 2-Person Families | 29 (61.7%) | $62,750 |
| 3-Person Families | 3 (6.4%) | $0 |
| 4-Person Families | 0 (0.0%) | $0 |
| 5-Person Families | 7 (14.9%) | $0 |
| 6-Person Families | 8 (17.0%) | $0 |
| 7+ Person Families | 0 (0.0%) | $0 |
| Total | 47 (100.0%) | $58,036 |
Family Income by Number of Earners in Eagle Nest
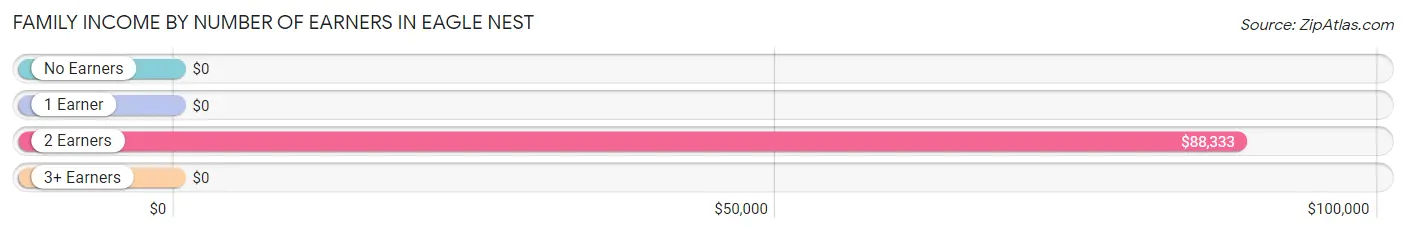
| Number of Earners | # Families | Median Income |
| No Earners | 6 (12.8%) | $0 |
| 1 Earner | 29 (61.7%) | $0 |
| 2 Earners | 12 (25.5%) | $88,333 |
| 3+ Earners | 0 (0.0%) | $0 |
| Total | 47 (100.0%) | $58,036 |
Household Income in Eagle Nest
Household Income Brackets in Eagle Nest
With 29 households falling in the category, the $35,000 to $49,999 income range is the most frequent in Eagle Nest, accounting for 23.8% of all households.
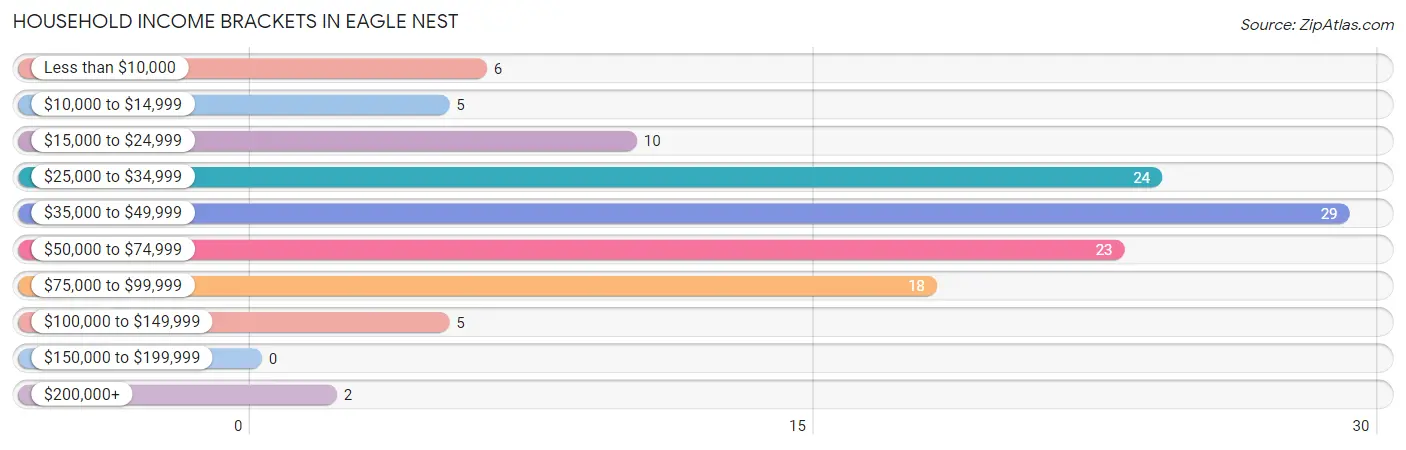
| Income Bracket | # Households | % Households |
| Less than $10,000 | 6 | 4.9% |
| $10,000 to $14,999 | 5 | 4.1% |
| $15,000 to $24,999 | 10 | 8.2% |
| $25,000 to $34,999 | 24 | 19.7% |
| $35,000 to $49,999 | 29 | 23.8% |
| $50,000 to $74,999 | 23 | 18.9% |
| $75,000 to $99,999 | 18 | 14.8% |
| $100,000 to $149,999 | 5 | 4.1% |
| $150,000 to $199,999 | 0 | 0.0% |
| $200,000+ | 2 | 1.6% |
Household Income by Householder Age in Eagle Nest
The median household income in Eagle Nest is $43,750, with the highest median household income of $65,833 found in the 45 to 64 years age bracket for the primary householder. A total of 44 households (36.1%) fall into this category. Meanwhile, the 15 to 24 years age bracket for the primary householder has the lowest median household income of $0, with 8 households (6.6%) in this group.
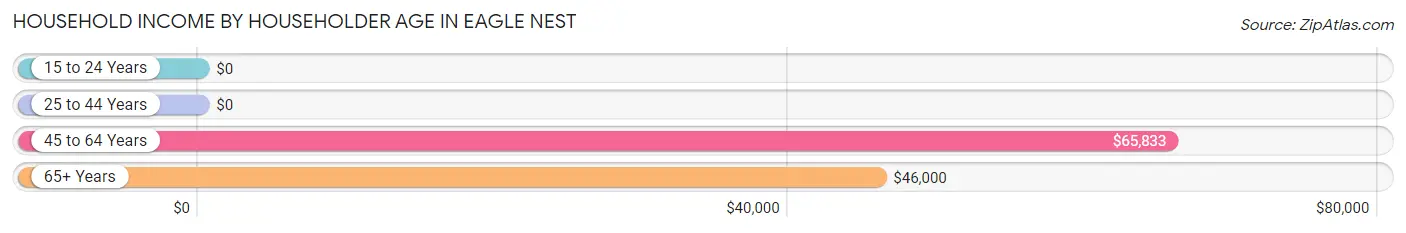
| Income Bracket | # Households | Median Income |
| 15 to 24 Years | 8 (6.6%) | $0 |
| 25 to 44 Years | 12 (9.8%) | $0 |
| 45 to 64 Years | 44 (36.1%) | $65,833 |
| 65+ Years | 58 (47.5%) | $46,000 |
| Total | 122 (100.0%) | $43,750 |
Poverty in Eagle Nest
Income Below Poverty by Sex and Age in Eagle Nest
With 22.5% poverty level for males and 27.5% for females among the residents of Eagle Nest, 25 to 34 year old males and under 5 year old females are the most vulnerable to poverty, with 10 males (62.5%) and 5 females (100.0%) in their respective age groups living below the poverty level.
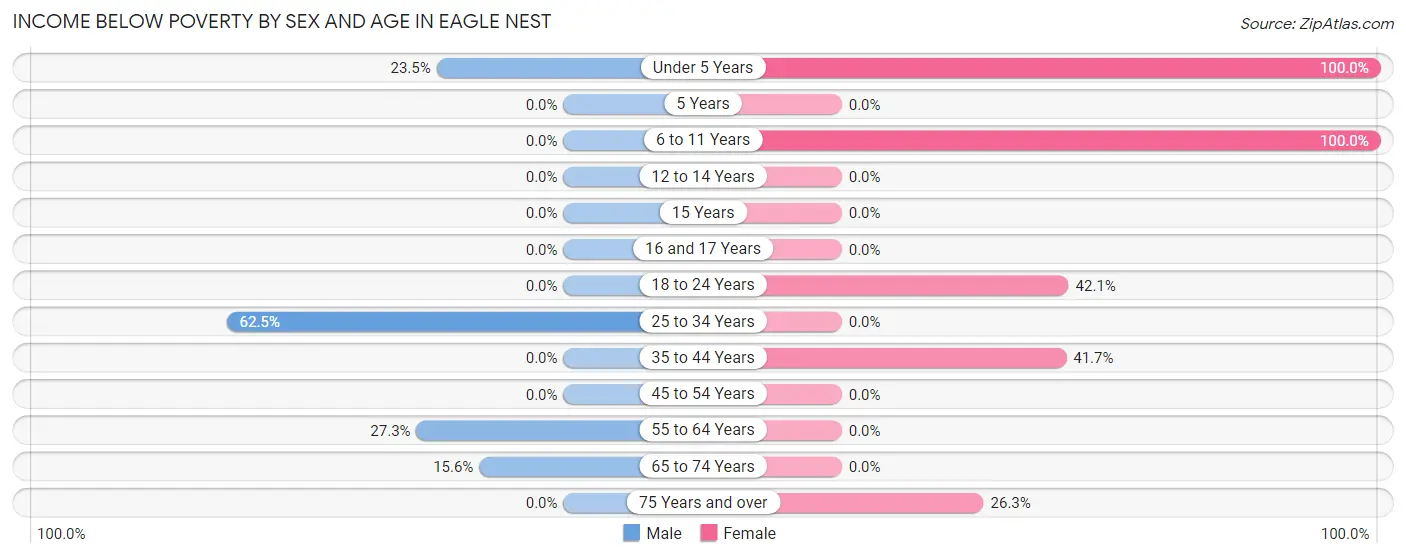
| Age Bracket | Male | Female |
| Under 5 Years | 4 (23.5%) | 5 (100.0%) |
| 5 Years | 0 (0.0%) | 0 (0.0%) |
| 6 to 11 Years | 0 (0.0%) | 15 (100.0%) |
| 12 to 14 Years | 0 (0.0%) | 0 (0.0%) |
| 15 Years | 0 (0.0%) | 0 (0.0%) |
| 16 and 17 Years | 0 (0.0%) | 0 (0.0%) |
| 18 to 24 Years | 0 (0.0%) | 8 (42.1%) |
| 25 to 34 Years | 10 (62.5%) | 0 (0.0%) |
| 35 to 44 Years | 0 (0.0%) | 5 (41.7%) |
| 45 to 54 Years | 0 (0.0%) | 0 (0.0%) |
| 55 to 64 Years | 6 (27.3%) | 0 (0.0%) |
| 65 to 74 Years | 5 (15.6%) | 0 (0.0%) |
| 75 Years and over | 0 (0.0%) | 5 (26.3%) |
| Total | 25 (22.5%) | 38 (27.5%) |
Income Above Poverty by Sex and Age in Eagle Nest
According to the poverty statistics in Eagle Nest, males aged 6 to 11 years and females aged 12 to 14 years are the age groups that are most secure financially, with 100.0% of males and 100.0% of females in these age groups living above the poverty line.
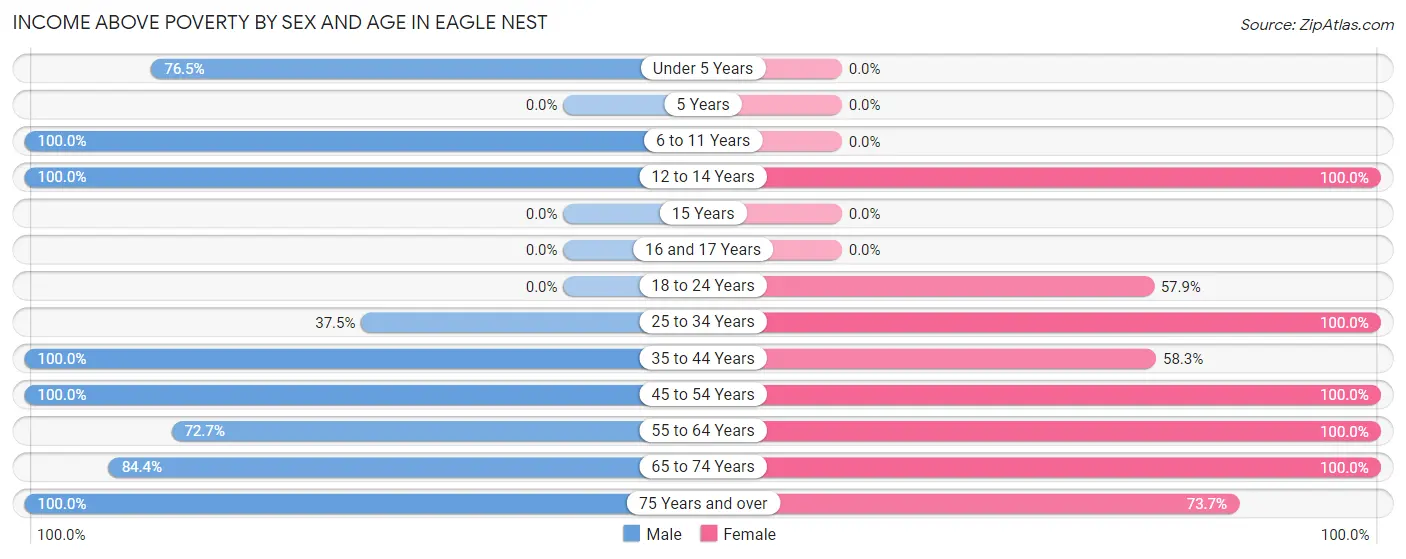
| Age Bracket | Male | Female |
| Under 5 Years | 13 (76.5%) | 0 (0.0%) |
| 5 Years | 0 (0.0%) | 0 (0.0%) |
| 6 to 11 Years | 4 (100.0%) | 0 (0.0%) |
| 12 to 14 Years | 2 (100.0%) | 10 (100.0%) |
| 15 Years | 0 (0.0%) | 0 (0.0%) |
| 16 and 17 Years | 0 (0.0%) | 0 (0.0%) |
| 18 to 24 Years | 0 (0.0%) | 11 (57.9%) |
| 25 to 34 Years | 6 (37.5%) | 4 (100.0%) |
| 35 to 44 Years | 3 (100.0%) | 7 (58.3%) |
| 45 to 54 Years | 5 (100.0%) | 8 (100.0%) |
| 55 to 64 Years | 16 (72.7%) | 24 (100.0%) |
| 65 to 74 Years | 27 (84.4%) | 22 (100.0%) |
| 75 Years and over | 10 (100.0%) | 14 (73.7%) |
| Total | 86 (77.5%) | 100 (72.5%) |
Income Below Poverty Among Married-Couple Families in Eagle Nest
The poverty statistics for married-couple families in Eagle Nest show that 22.2% or 8 of the total 36 families live below the poverty line. Families with 3 or 4 children have the highest poverty rate of 100.0%, comprising of 8 families. On the other hand, families with no children have the lowest poverty rate of 0.0%, which includes 0 families.
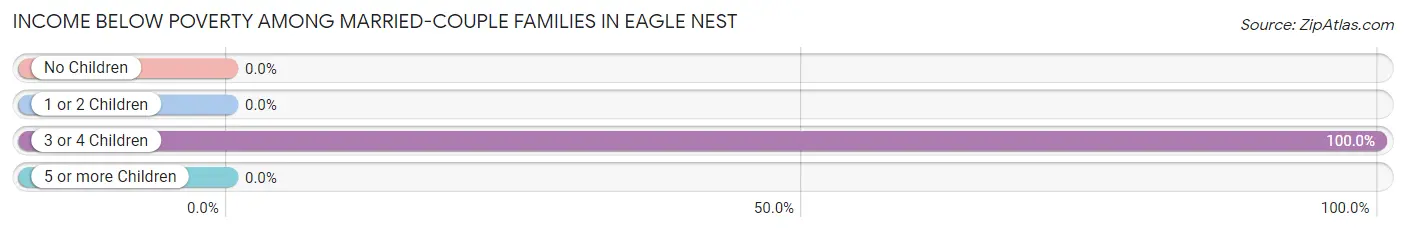
| Children | Above Poverty | Below Poverty |
| No Children | 25 (100.0%) | 0 (0.0%) |
| 1 or 2 Children | 3 (100.0%) | 0 (0.0%) |
| 3 or 4 Children | 0 (0.0%) | 8 (100.0%) |
| 5 or more Children | 0 (0.0%) | 0 (0.0%) |
| Total | 28 (77.8%) | 8 (22.2%) |
Income Below Poverty Among Single-Parent Households in Eagle Nest
| Children | Single Father | Single Mother |
| No Children | 0 (0.0%) | 0 (0.0%) |
| 1 or 2 Children | 0 (0.0%) | 0 (0.0%) |
| 3 or 4 Children | 0 (0.0%) | 0 (0.0%) |
| 5 or more Children | 0 (0.0%) | 0 (0.0%) |
| Total | 0 (0.0%) | 0 (0.0%) |
Income Below Poverty Among Married-Couple vs Single-Parent Households in Eagle Nest
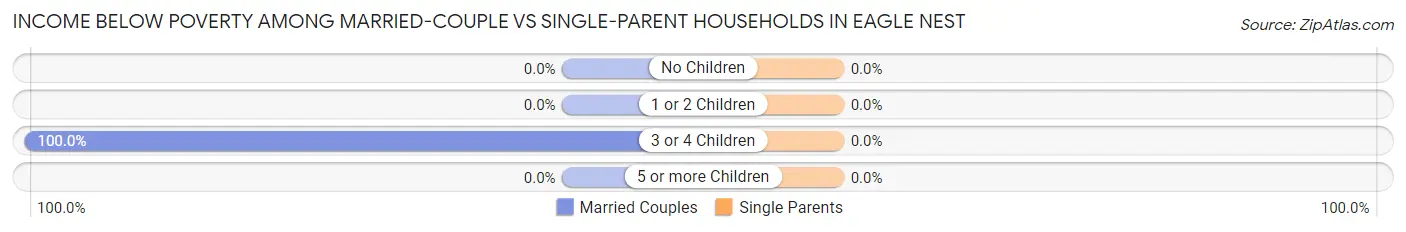
| Children | Married-Couple Families | Single-Parent Households |
| No Children | 0 (0.0%) | 0 (0.0%) |
| 1 or 2 Children | 0 (0.0%) | 0 (0.0%) |
| 3 or 4 Children | 8 (100.0%) | 0 (0.0%) |
| 5 or more Children | 0 (0.0%) | 0 (0.0%) |
| Total | 8 (22.2%) | 0 (0.0%) |
Race in Eagle Nest
The most populous races in Eagle Nest are White / Caucasian (170 | 68.3%), Hispanic or Latino (93 | 37.3%), and Some other Race (51 | 20.5%).
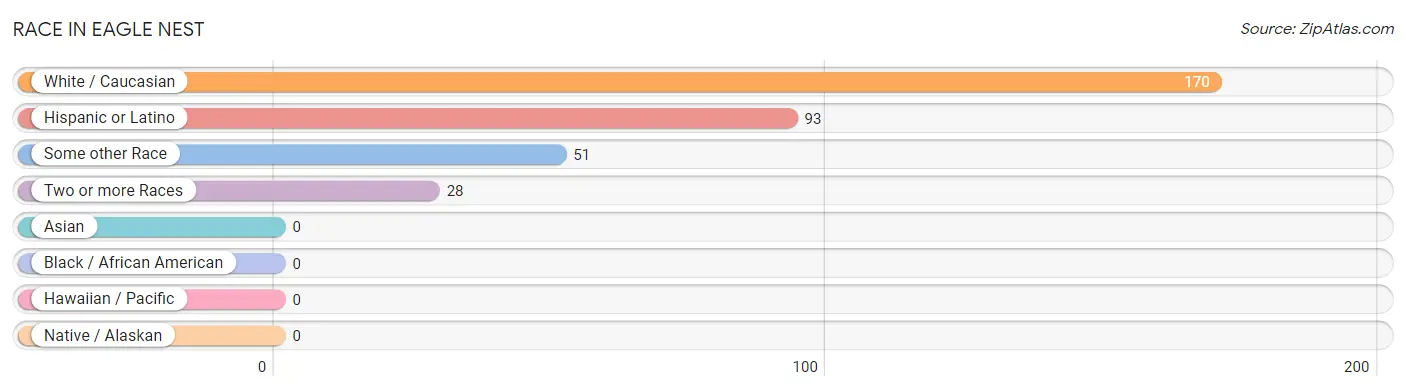
| Race | # Population | % Population |
| Asian | 0 | 0.0% |
| Black / African American | 0 | 0.0% |
| Hawaiian / Pacific | 0 | 0.0% |
| Hispanic or Latino | 93 | 37.3% |
| Native / Alaskan | 0 | 0.0% |
| White / Caucasian | 170 | 68.3% |
| Two or more Races | 28 | 11.2% |
| Some other Race | 51 | 20.5% |
| Total | 249 | 100.0% |
Ancestry in Eagle Nest
The most populous ancestries reported in Eagle Nest are Irish (68 | 27.3%), English (50 | 20.1%), Spaniard (47 | 18.9%), German (37 | 14.9%), and Mexican (27 | 10.8%), together accounting for 92.0% of all Eagle Nest residents.
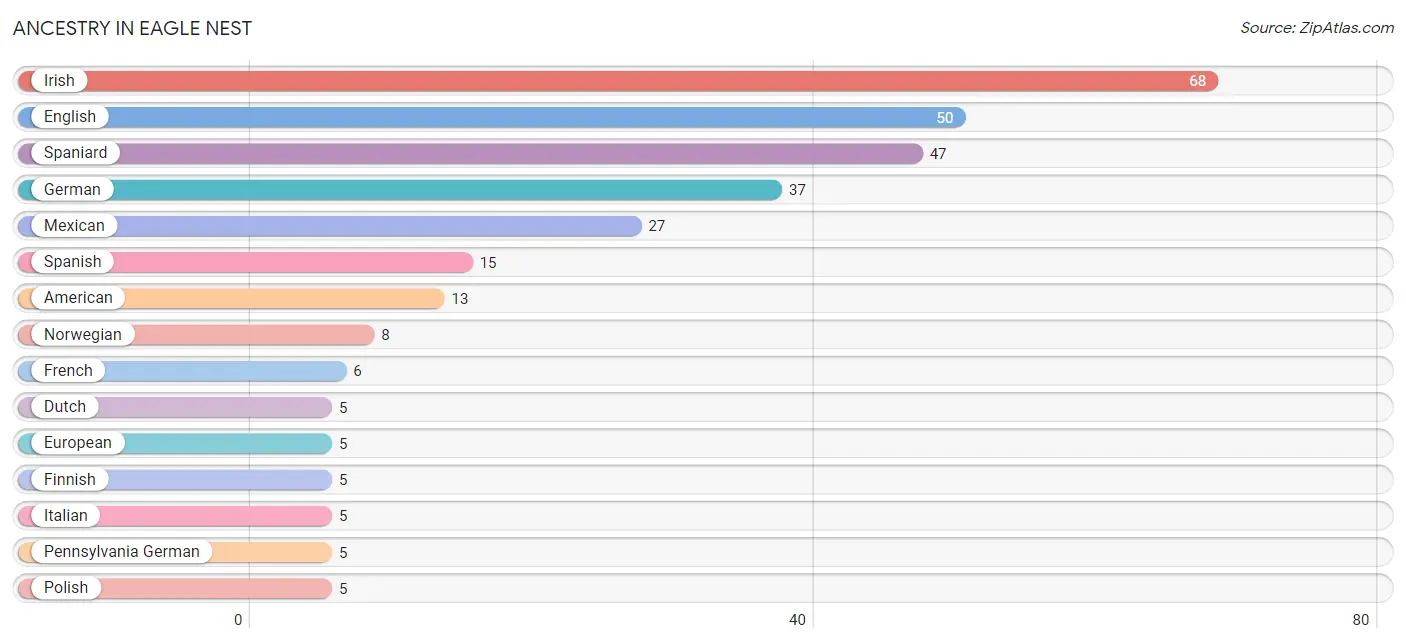
| Ancestry | # Population | % Population |
| American | 13 | 5.2% |
| Chilean | 4 | 1.6% |
| Dutch | 5 | 2.0% |
| Dutch West Indian | 1 | 0.4% |
| English | 50 | 20.1% |
| European | 5 | 2.0% |
| Finnish | 5 | 2.0% |
| French | 6 | 2.4% |
| German | 37 | 14.9% |
| Irish | 68 | 27.3% |
| Italian | 5 | 2.0% |
| Mexican | 27 | 10.8% |
| Northern European | 4 | 1.6% |
| Norwegian | 8 | 3.2% |
| Pennsylvania German | 5 | 2.0% |
| Polish | 5 | 2.0% |
| Scottish | 5 | 2.0% |
| South American | 4 | 1.6% |
| Spaniard | 47 | 18.9% |
| Spanish | 15 | 6.0% |
| Swedish | 5 | 2.0% |
| Welsh | 5 | 2.0% |
| Yugoslavian | 5 | 2.0% | View All 23 Rows |
Immigrants in Eagle Nest
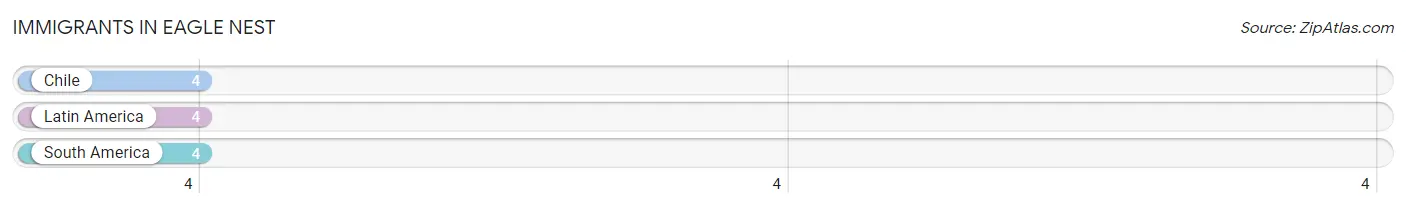
The most numerous immigrant groups reported in Eagle Nest came from Chile (4 | 1.6%), Latin America (4 | 1.6%), and South America (4 | 1.6%), together accounting for 4.8% of all Eagle Nest residents.
| Immigration Origin | # Population | % Population |
| Chile | 4 | 1.6% |
| Latin America | 4 | 1.6% |
| South America | 4 | 1.6% | View All 3 Rows |
Sex and Age in Eagle Nest
Sex and Age in Eagle Nest
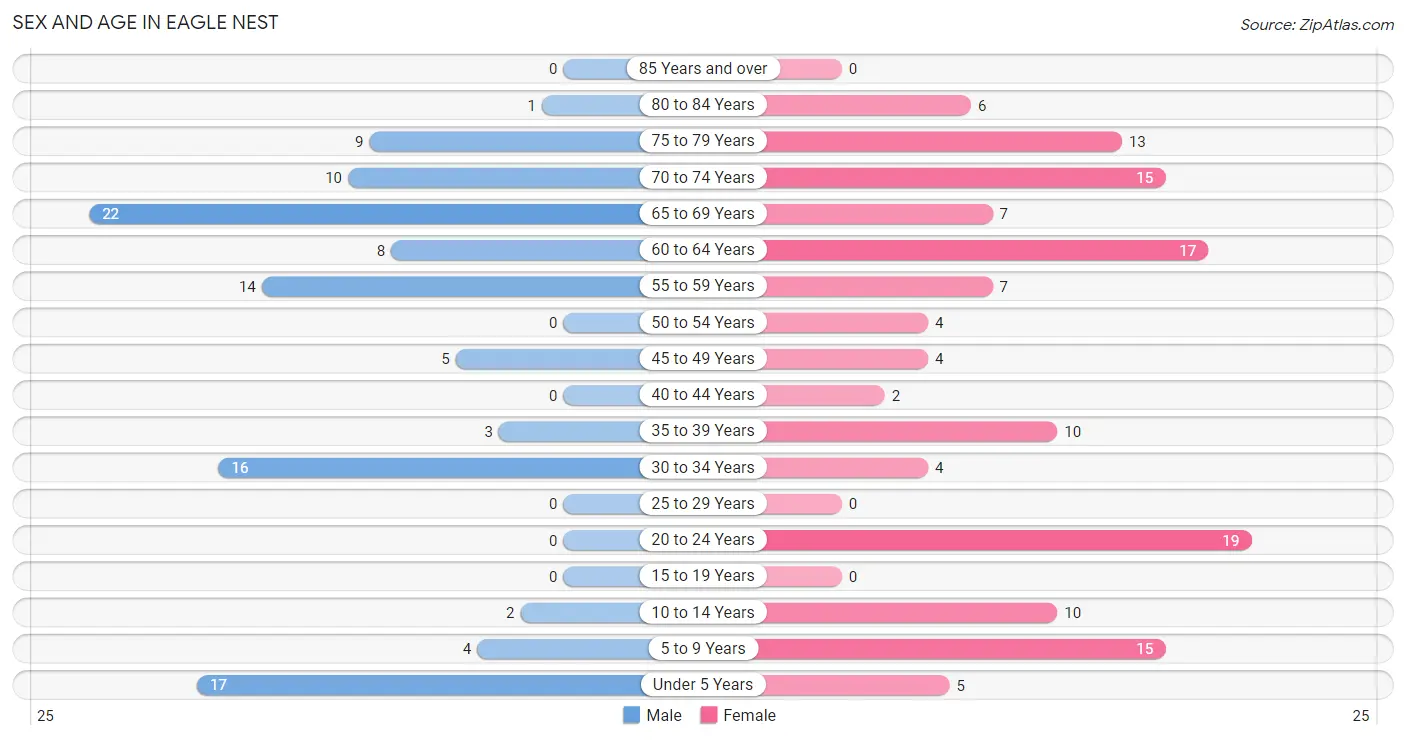
The most populous age groups in Eagle Nest are 65 to 69 Years (22 | 19.8%) for men and 20 to 24 Years (19 | 13.8%) for women.
| Age Bracket | Male | Female |
| Under 5 Years | 17 (15.3%) | 5 (3.6%) |
| 5 to 9 Years | 4 (3.6%) | 15 (10.9%) |
| 10 to 14 Years | 2 (1.8%) | 10 (7.2%) |
| 15 to 19 Years | 0 (0.0%) | 0 (0.0%) |
| 20 to 24 Years | 0 (0.0%) | 19 (13.8%) |
| 25 to 29 Years | 0 (0.0%) | 0 (0.0%) |
| 30 to 34 Years | 16 (14.4%) | 4 (2.9%) |
| 35 to 39 Years | 3 (2.7%) | 10 (7.2%) |
| 40 to 44 Years | 0 (0.0%) | 2 (1.5%) |
| 45 to 49 Years | 5 (4.5%) | 4 (2.9%) |
| 50 to 54 Years | 0 (0.0%) | 4 (2.9%) |
| 55 to 59 Years | 14 (12.6%) | 7 (5.1%) |
| 60 to 64 Years | 8 (7.2%) | 17 (12.3%) |
| 65 to 69 Years | 22 (19.8%) | 7 (5.1%) |
| 70 to 74 Years | 10 (9.0%) | 15 (10.9%) |
| 75 to 79 Years | 9 (8.1%) | 13 (9.4%) |
| 80 to 84 Years | 1 (0.9%) | 6 (4.3%) |
| 85 Years and over | 0 (0.0%) | 0 (0.0%) |
| Total | 111 (100.0%) | 138 (100.0%) |
Families and Households in Eagle Nest
Median Family Size in Eagle Nest
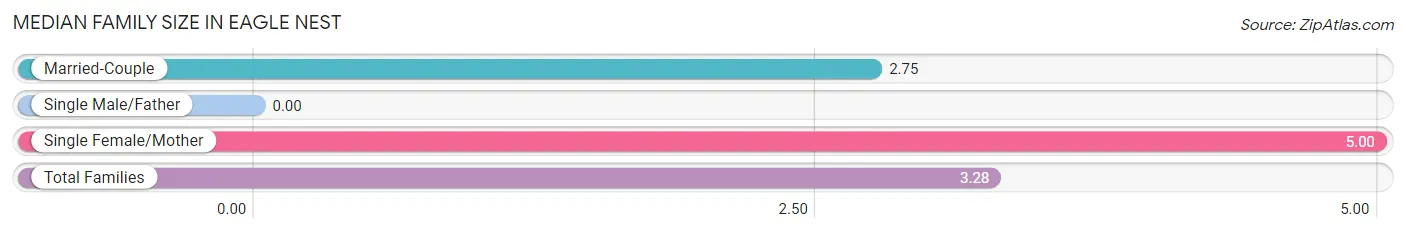
| Family Type | # Families | Family Size |
| Married-Couple | 36 (76.6%) | 2.75 |
| Single Male/Father | 0 (0.0%) | - |
| Single Female/Mother | 11 (23.4%) | 5.00 |
| Total Families | 47 (100.0%) | 3.28 |
Median Household Size in Eagle Nest
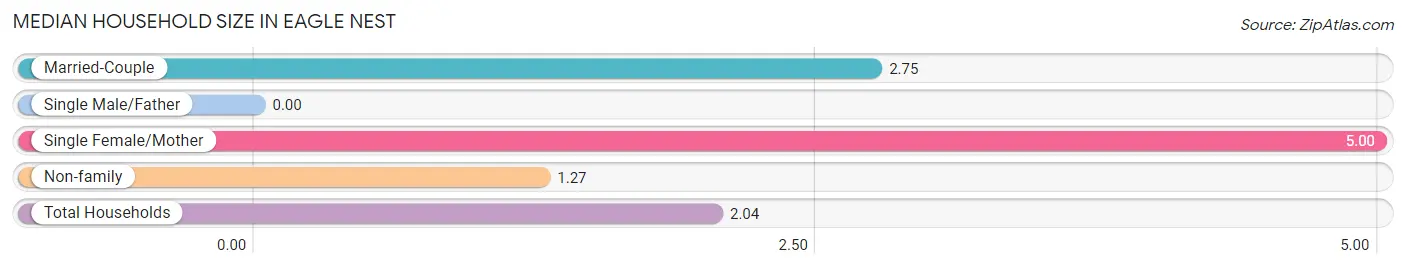
| Household Type | # Households | Household Size |
| Married-Couple | 36 (29.5%) | 2.75 |
| Single Male/Father | 0 (0.0%) | - |
| Single Female/Mother | 11 (9.0%) | 5.00 |
| Non-family | 75 (61.5%) | 1.27 |
| Total Households | 122 (100.0%) | 2.04 |
Household Size by Marriage Status in Eagle Nest
Out of a total of 122 households in Eagle Nest, 47 (38.5%) are family households, while 75 (61.5%) are nonfamily households. The most numerous type of family households are 2-person households, comprising 29, and the most common type of nonfamily households are 1-person households, comprising 50.
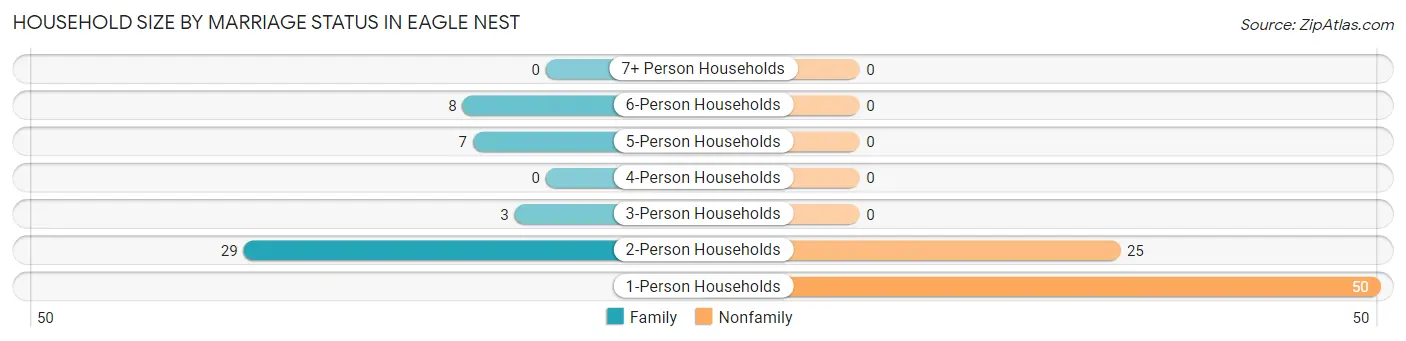
| Household Size | Family Households | Nonfamily Households |
| 1-Person Households | - | 50 (41.0%) |
| 2-Person Households | 29 (23.8%) | 25 (20.5%) |
| 3-Person Households | 3 (2.5%) | 0 (0.0%) |
| 4-Person Households | 0 (0.0%) | 0 (0.0%) |
| 5-Person Households | 7 (5.7%) | 0 (0.0%) |
| 6-Person Households | 8 (6.6%) | 0 (0.0%) |
| 7+ Person Households | 0 (0.0%) | 0 (0.0%) |
| Total | 47 (38.5%) | 75 (61.5%) |
Female Fertility in Eagle Nest
Fertility by Age in Eagle Nest
Average fertility rate in Eagle Nest is 205.0 births per 1,000 women. Women in the age bracket of 20 to 34 years have the highest fertility rate with 348.0 births per 1,000 women. Women in the age bracket of 20 to 34 years acount for 100.0% of all women with births.
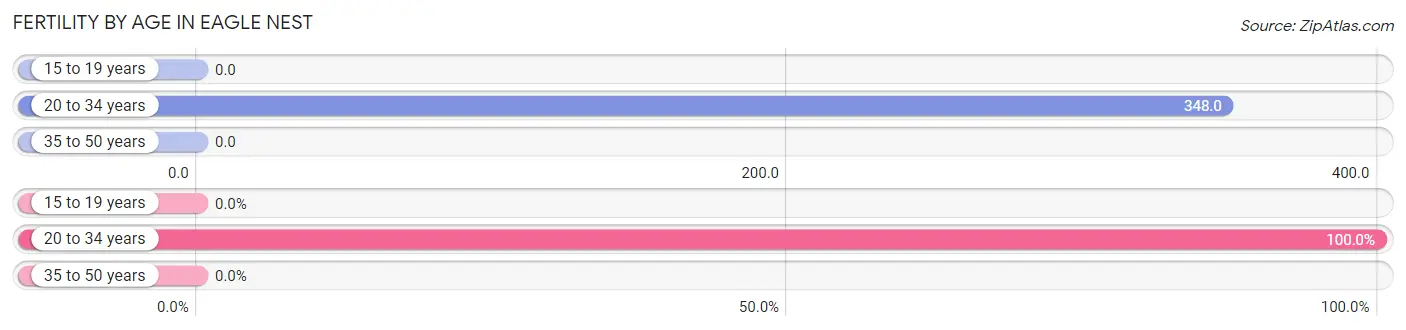
| Age Bracket | Women with Births | Births / 1,000 Women |
| 15 to 19 years | 0 (0.0%) | 0.0 |
| 20 to 34 years | 8 (100.0%) | 348.0 |
| 35 to 50 years | 0 (0.0%) | 0.0 |
| Total | 8 (100.0%) | 205.0 |
Fertility by Age by Marriage Status in Eagle Nest
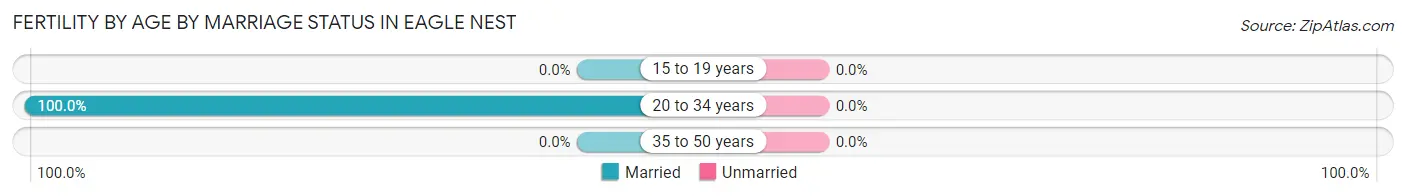
| Age Bracket | Married | Unmarried |
| 15 to 19 years | 0 (0.0%) | 0 (0.0%) |
| 20 to 34 years | 8 (100.0%) | 0 (0.0%) |
| 35 to 50 years | 0 (0.0%) | 0 (0.0%) |
| Total | 8 (100.0%) | 0 (0.0%) |
Fertility by Education in Eagle Nest
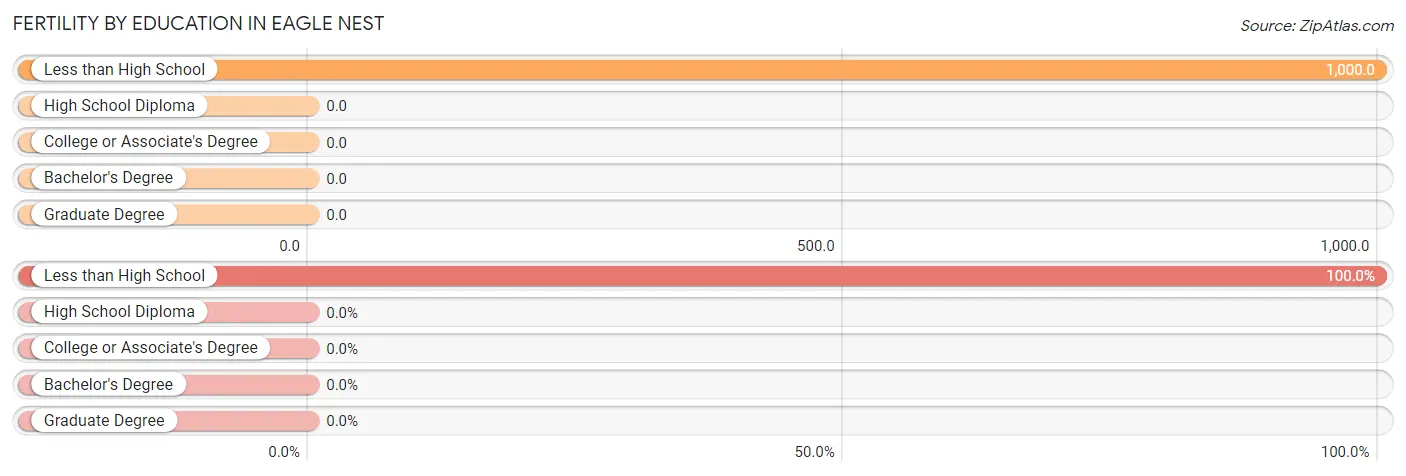
| Educational Attainment | Women with Births | Births / 1,000 Women |
| Less than High School | 8 (100.0%) | 1,000.0 |
| High School Diploma | 0 (0.0%) | 0.0 |
| College or Associate's Degree | 0 (0.0%) | 0.0 |
| Bachelor's Degree | 0 (0.0%) | 0.0 |
| Graduate Degree | 0 (0.0%) | 0.0 |
| Total | 8 (100.0%) | 205.0 |
Fertility by Education by Marriage Status in Eagle Nest
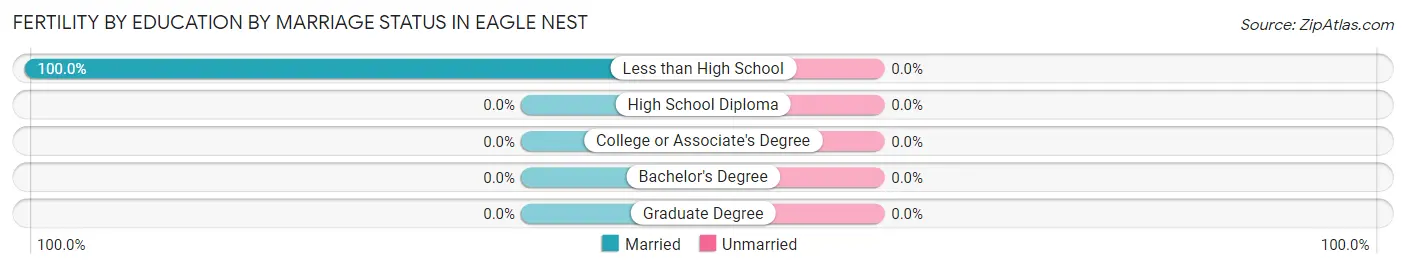
| Educational Attainment | Married | Unmarried |
| Less than High School | 8 (100.0%) | 0 (0.0%) |
| High School Diploma | 0 (0.0%) | 0 (0.0%) |
| College or Associate's Degree | 0 (0.0%) | 0 (0.0%) |
| Bachelor's Degree | 0 (0.0%) | 0 (0.0%) |
| Graduate Degree | 0 (0.0%) | 0 (0.0%) |
| Total | 8 (100.0%) | 0 (0.0%) |
Employment Characteristics in Eagle Nest
Employment by Class of Employer in Eagle Nest
Among the 69 employed individuals in Eagle Nest, private company employees (52 | 75.4%), self-employed (not incorporated) (5 | 7.2%), and not-for-profit organizations (4 | 5.8%) make up the most common classes of employment.
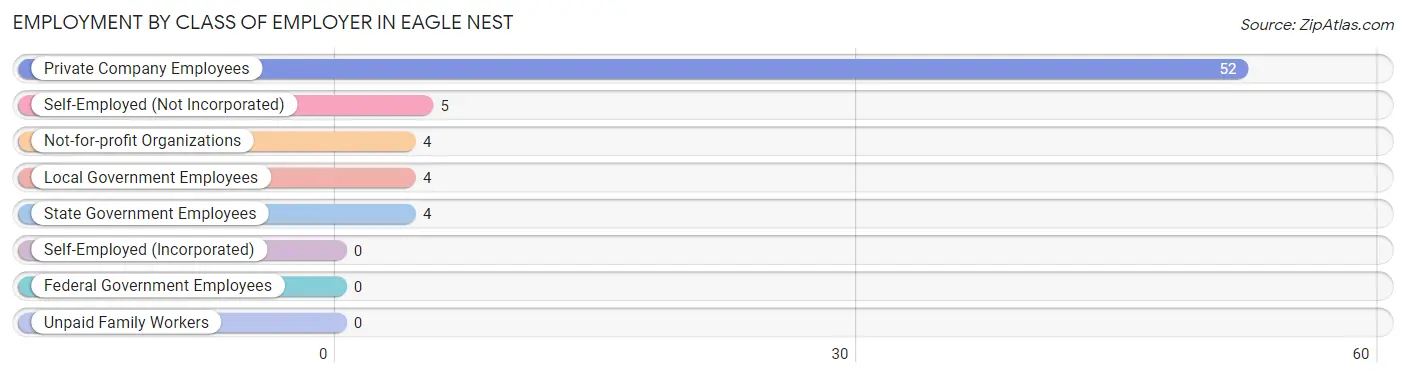
| Employer Class | # Employees | % Employees |
| Private Company Employees | 52 | 75.4% |
| Self-Employed (Incorporated) | 0 | 0.0% |
| Self-Employed (Not Incorporated) | 5 | 7.2% |
| Not-for-profit Organizations | 4 | 5.8% |
| Local Government Employees | 4 | 5.8% |
| State Government Employees | 4 | 5.8% |
| Federal Government Employees | 0 | 0.0% |
| Unpaid Family Workers | 0 | 0.0% |
| Total | 69 | 100.0% |
Employment Status by Age in Eagle Nest
According to the labor force statistics for Eagle Nest, out of the total population over 16 years of age (196), 47.4% or 93 individuals are in the labor force, with 23.7% or 22 of them unemployed. The age group with the highest labor force participation rate is 30 to 34 years, with 100.0% or 20 individuals in the labor force. Within the labor force, the 20 to 24 years age range has the highest percentage of unemployed individuals, with 100.0% or 11 of them being unemployed.
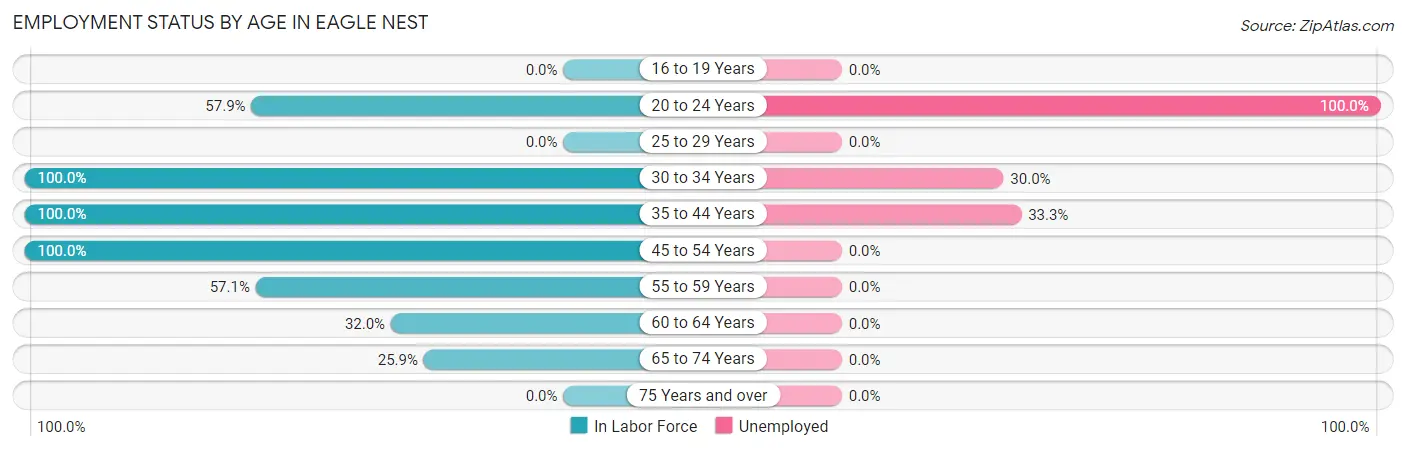
| Age Bracket | In Labor Force | Unemployed |
| 16 to 19 Years | 0 (0.0%) | 0 (0.0%) |
| 20 to 24 Years | 11 (57.9%) | 11 (100.0%) |
| 25 to 29 Years | 0 (0.0%) | 0 (0.0%) |
| 30 to 34 Years | 20 (100.0%) | 6 (30.0%) |
| 35 to 44 Years | 15 (100.0%) | 5 (33.3%) |
| 45 to 54 Years | 13 (100.0%) | 0 (0.0%) |
| 55 to 59 Years | 12 (57.1%) | 0 (0.0%) |
| 60 to 64 Years | 8 (32.0%) | 0 (0.0%) |
| 65 to 74 Years | 14 (25.9%) | 0 (0.0%) |
| 75 Years and over | 0 (0.0%) | 0 (0.0%) |
| Total | 93 (47.4%) | 22 (23.7%) |
Employment Status by Educational Attainment in Eagle Nest
According to labor force statistics for Eagle Nest, 72.3% of individuals (68) out of the total population between 25 and 64 years of age (94) are in the labor force, with 16.2% or 11 of them being unemployed. The group with the highest labor force participation rate are those with the educational attainment of bachelor's degree or higher, with 100.0% or 17 individuals in the labor force. Within the labor force, individuals with bachelor's degree or higher education have the highest percentage of unemployment, with 29.4% or 5 of them being unemployed.
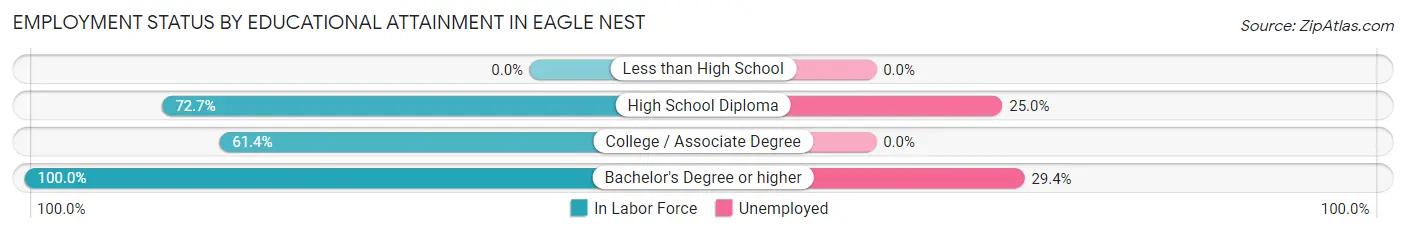
| Educational Attainment | In Labor Force | Unemployed |
| Less than High School | 0 (0.0%) | 0 (0.0%) |
| High School Diploma | 24 (72.7%) | 8 (25.0%) |
| College / Associate Degree | 27 (61.4%) | 0 (0.0%) |
| Bachelor's Degree or higher | 17 (100.0%) | 5 (29.4%) |
| Total | 68 (72.3%) | 15 (16.2%) |
Employment Occupations by Sex in Eagle Nest
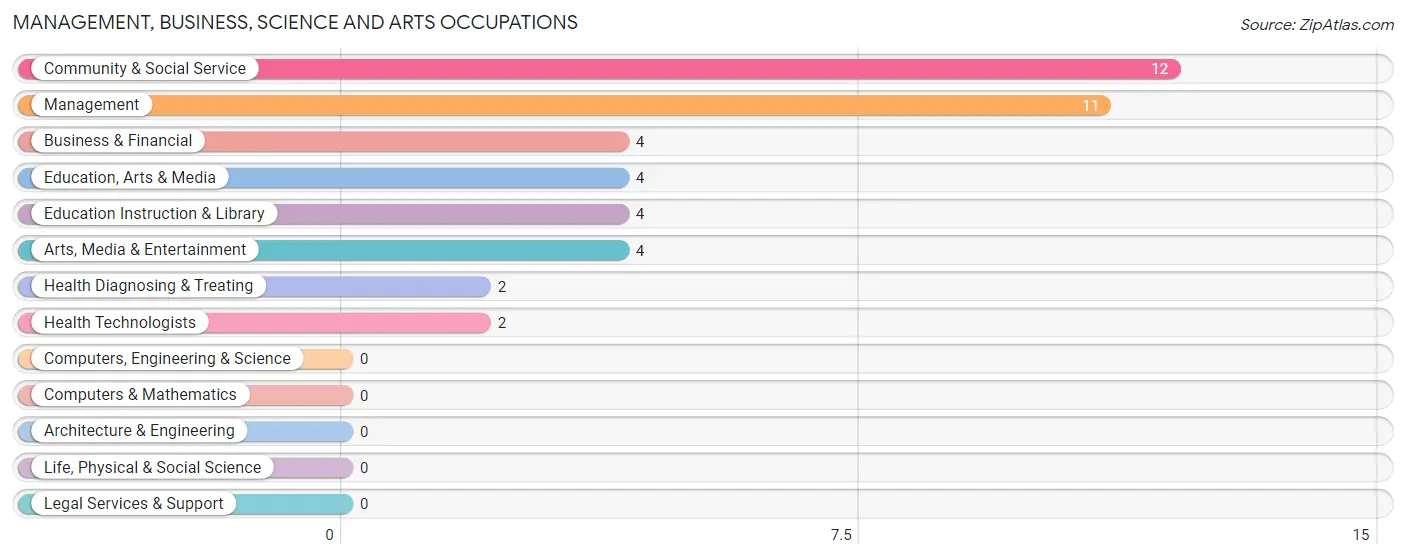
Management, Business, Science and Arts Occupations
The most common Management, Business, Science and Arts occupations in Eagle Nest are Community & Social Service (12 | 16.9%), Management (11 | 15.5%), Business & Financial (4 | 5.6%), Education, Arts & Media (4 | 5.6%), and Education Instruction & Library (4 | 5.6%).
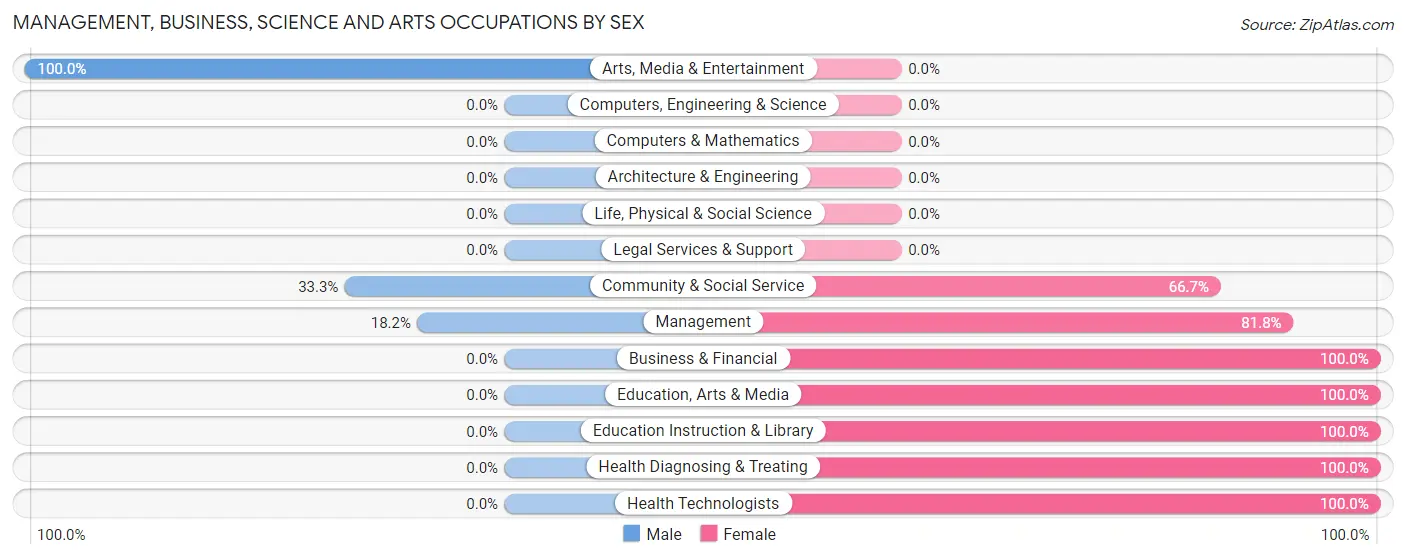
Management, Business, Science and Arts Occupations by Sex
Within the Management, Business, Science and Arts occupations in Eagle Nest, the most male-oriented occupations are Arts, Media & Entertainment (100.0%), Community & Social Service (33.3%), and Management (18.2%), while the most female-oriented occupations are Business & Financial (100.0%), Education, Arts & Media (100.0%), and Education Instruction & Library (100.0%).
| Occupation | Male | Female |
| Management | 2 (18.2%) | 9 (81.8%) |
| Business & Financial | 0 (0.0%) | 4 (100.0%) |
| Computers, Engineering & Science | 0 (0.0%) | 0 (0.0%) |
| Computers & Mathematics | 0 (0.0%) | 0 (0.0%) |
| Architecture & Engineering | 0 (0.0%) | 0 (0.0%) |
| Life, Physical & Social Science | 0 (0.0%) | 0 (0.0%) |
| Community & Social Service | 4 (33.3%) | 8 (66.7%) |
| Education, Arts & Media | 0 (0.0%) | 4 (100.0%) |
| Legal Services & Support | 0 (0.0%) | 0 (0.0%) |
| Education Instruction & Library | 0 (0.0%) | 4 (100.0%) |
| Arts, Media & Entertainment | 4 (100.0%) | 0 (0.0%) |
| Health Diagnosing & Treating | 0 (0.0%) | 2 (100.0%) |
| Health Technologists | 0 (0.0%) | 2 (100.0%) |
| Total (Category) | 6 (20.7%) | 23 (79.3%) |
| Total (Overall) | 34 (47.9%) | 37 (52.1%) |
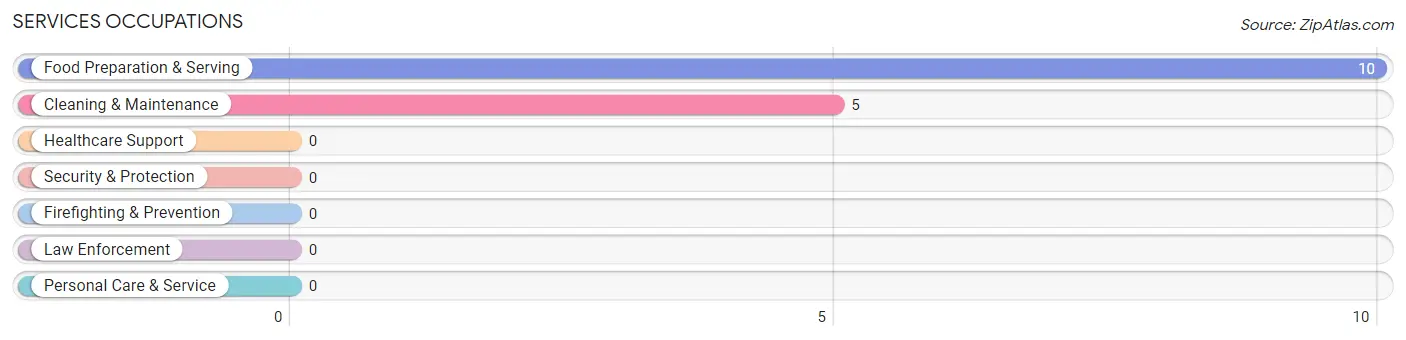
Services Occupations
The most common Services occupations in Eagle Nest are Food Preparation & Serving (10 | 14.1%), and Cleaning & Maintenance (5 | 7.0%).
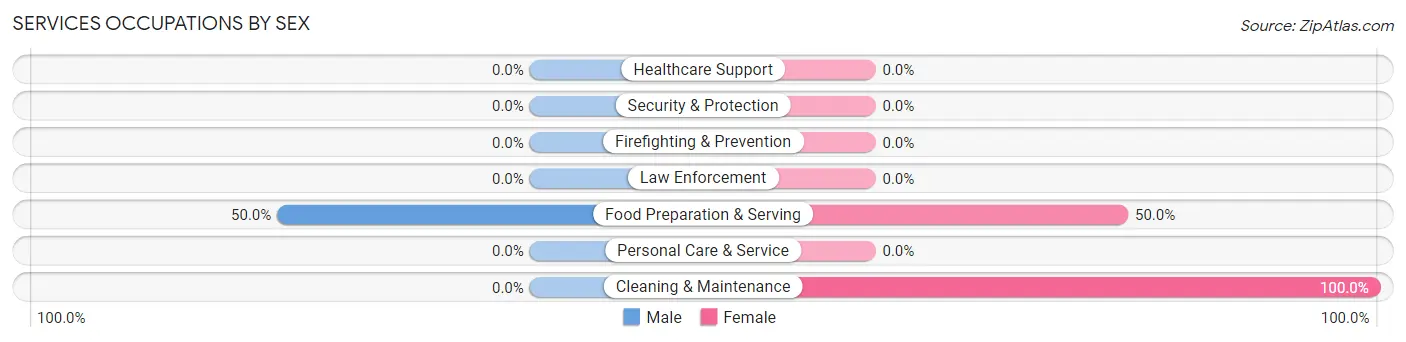
Services Occupations by Sex
| Occupation | Male | Female |
| Healthcare Support | 0 (0.0%) | 0 (0.0%) |
| Security & Protection | 0 (0.0%) | 0 (0.0%) |
| Firefighting & Prevention | 0 (0.0%) | 0 (0.0%) |
| Law Enforcement | 0 (0.0%) | 0 (0.0%) |
| Food Preparation & Serving | 5 (50.0%) | 5 (50.0%) |
| Cleaning & Maintenance | 0 (0.0%) | 5 (100.0%) |
| Personal Care & Service | 0 (0.0%) | 0 (0.0%) |
| Total (Category) | 5 (33.3%) | 10 (66.7%) |
| Total (Overall) | 34 (47.9%) | 37 (52.1%) |
Sales and Office Occupations
The most common Sales and Office occupations in Eagle Nest are Sales & Related (10 | 14.1%), and Office & Administration (7 | 9.9%).

Sales and Office Occupations by Sex

| Occupation | Male | Female |
| Sales & Related | 10 (100.0%) | 0 (0.0%) |
| Office & Administration | 5 (71.4%) | 2 (28.6%) |
| Total (Category) | 15 (88.2%) | 2 (11.8%) |
| Total (Overall) | 34 (47.9%) | 37 (52.1%) |
Natural Resources, Construction and Maintenance Occupations
The most common Natural Resources, Construction and Maintenance occupations in Eagle Nest are Construction & Extraction (5 | 7.0%), and Installation, Maintenance & Repair (3 | 4.2%).
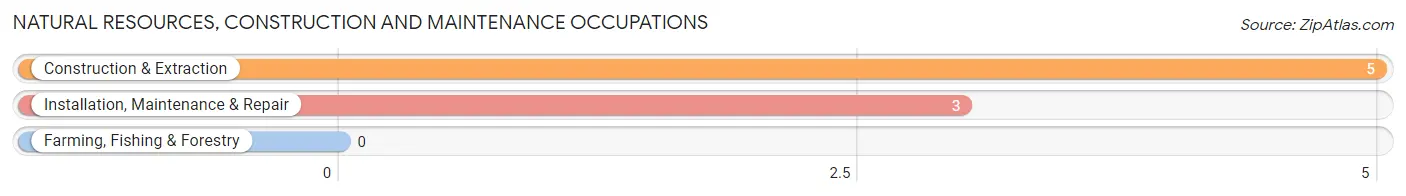
Natural Resources, Construction and Maintenance Occupations by Sex

| Occupation | Male | Female |
| Farming, Fishing & Forestry | 0 (0.0%) | 0 (0.0%) |
| Construction & Extraction | 5 (100.0%) | 0 (0.0%) |
| Installation, Maintenance & Repair | 3 (100.0%) | 0 (0.0%) |
| Total (Category) | 8 (100.0%) | 0 (0.0%) |
| Total (Overall) | 34 (47.9%) | 37 (52.1%) |
Production, Transportation and Moving Occupations
The most common Production, Transportation and Moving occupations in Eagle Nest are , and Transportation (2 | 2.8%).
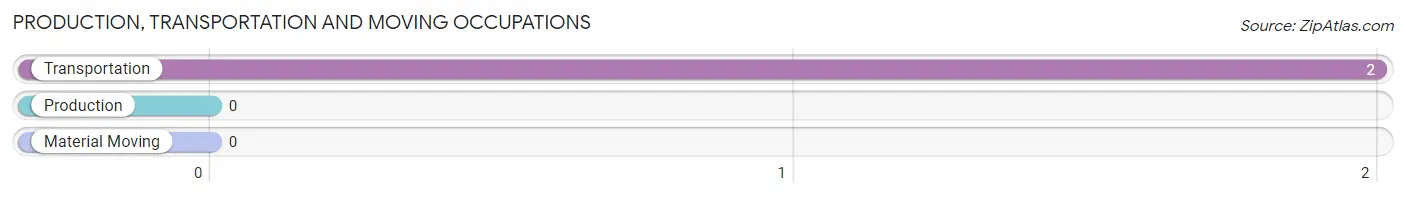
Production, Transportation and Moving Occupations by Sex
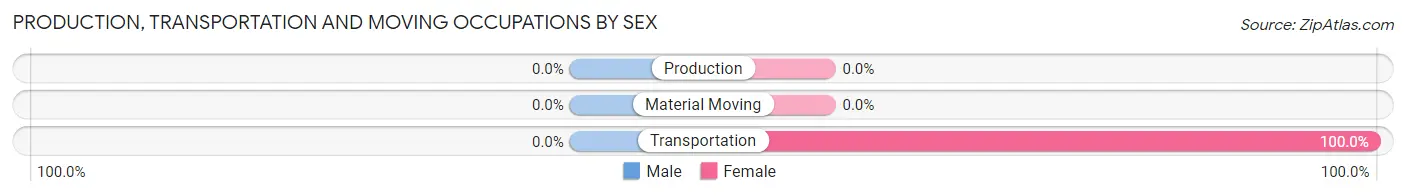
| Occupation | Male | Female |
| Production | 0 (0.0%) | 0 (0.0%) |
| Transportation | 0 (0.0%) | 2 (100.0%) |
| Material Moving | 0 (0.0%) | 0 (0.0%) |
| Total (Category) | 0 (0.0%) | 2 (100.0%) |
| Total (Overall) | 34 (47.9%) | 37 (52.1%) |
Employment Industries by Sex in Eagle Nest
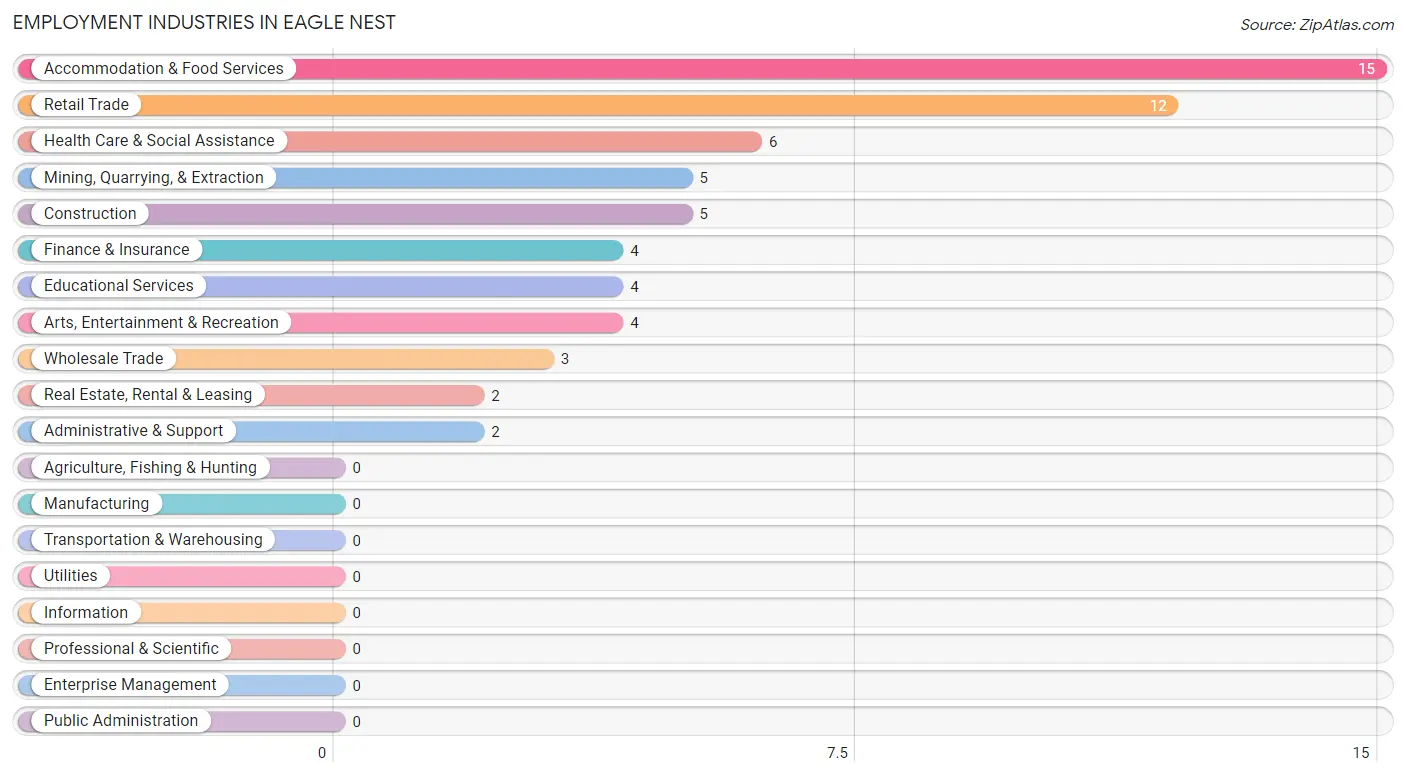
Employment Industries in Eagle Nest
The major employment industries in Eagle Nest include Accommodation & Food Services (15 | 21.1%), Retail Trade (12 | 16.9%), Health Care & Social Assistance (6 | 8.5%), Mining, Quarrying, & Extraction (5 | 7.0%), and Construction (5 | 7.0%).
Employment Industries by Sex in Eagle Nest
The Eagle Nest industries that see more men than women are Mining, Quarrying, & Extraction (100.0%), Construction (100.0%), and Wholesale Trade (100.0%), whereas the industries that tend to have a higher number of women are Finance & Insurance (100.0%), Administrative & Support (100.0%), and Educational Services (100.0%).
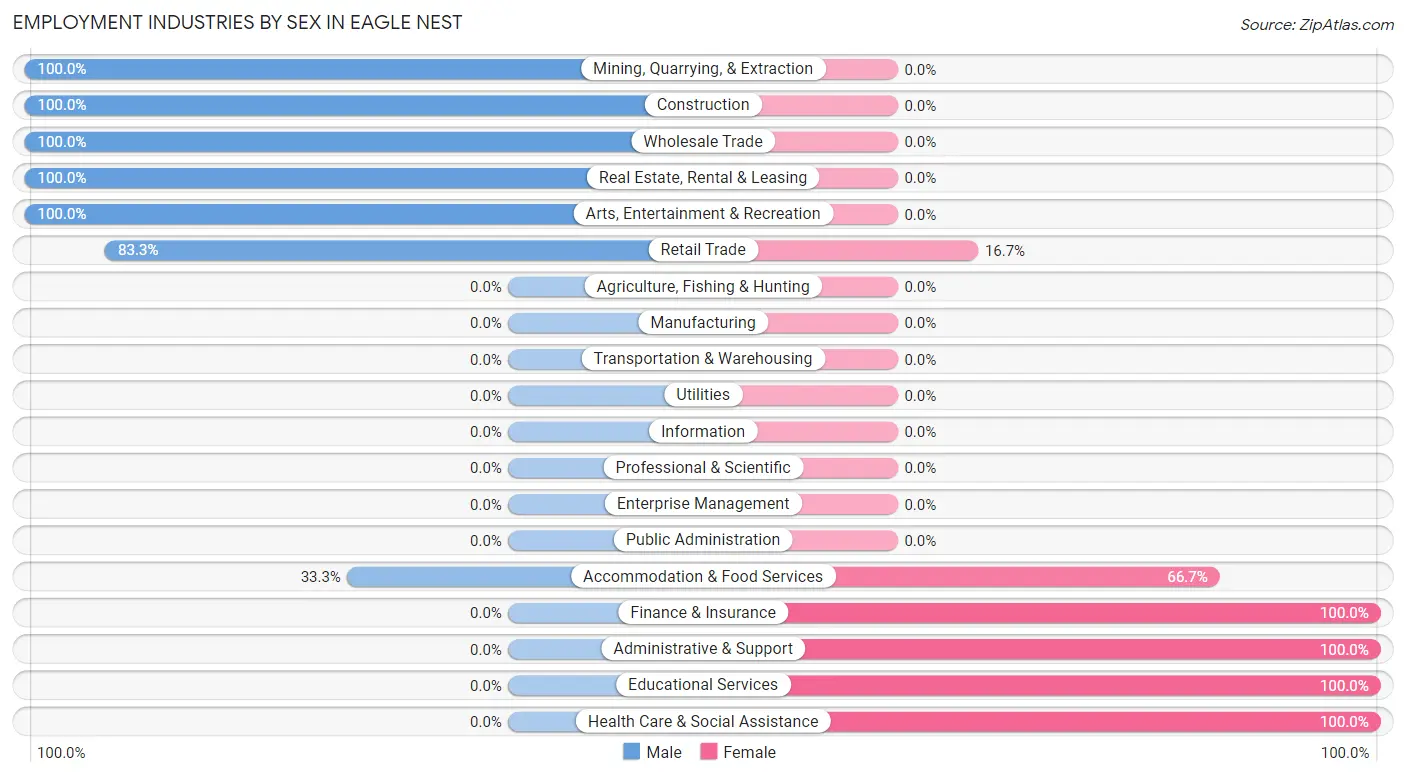
| Industry | Male | Female |
| Agriculture, Fishing & Hunting | 0 (0.0%) | 0 (0.0%) |
| Mining, Quarrying, & Extraction | 5 (100.0%) | 0 (0.0%) |
| Construction | 5 (100.0%) | 0 (0.0%) |
| Manufacturing | 0 (0.0%) | 0 (0.0%) |
| Wholesale Trade | 3 (100.0%) | 0 (0.0%) |
| Retail Trade | 10 (83.3%) | 2 (16.7%) |
| Transportation & Warehousing | 0 (0.0%) | 0 (0.0%) |
| Utilities | 0 (0.0%) | 0 (0.0%) |
| Information | 0 (0.0%) | 0 (0.0%) |
| Finance & Insurance | 0 (0.0%) | 4 (100.0%) |
| Real Estate, Rental & Leasing | 2 (100.0%) | 0 (0.0%) |
| Professional & Scientific | 0 (0.0%) | 0 (0.0%) |
| Enterprise Management | 0 (0.0%) | 0 (0.0%) |
| Administrative & Support | 0 (0.0%) | 2 (100.0%) |
| Educational Services | 0 (0.0%) | 4 (100.0%) |
| Health Care & Social Assistance | 0 (0.0%) | 6 (100.0%) |
| Arts, Entertainment & Recreation | 4 (100.0%) | 0 (0.0%) |
| Accommodation & Food Services | 5 (33.3%) | 10 (66.7%) |
| Public Administration | 0 (0.0%) | 0 (0.0%) |
| Total | 34 (47.9%) | 37 (52.1%) |
Education in Eagle Nest
School Enrollment in Eagle Nest
The most common levels of schooling among the 49 students in Eagle Nest are elementary school (19 | 38.8%), nursery / preschool (18 | 36.7%), and high school (10 | 20.4%).
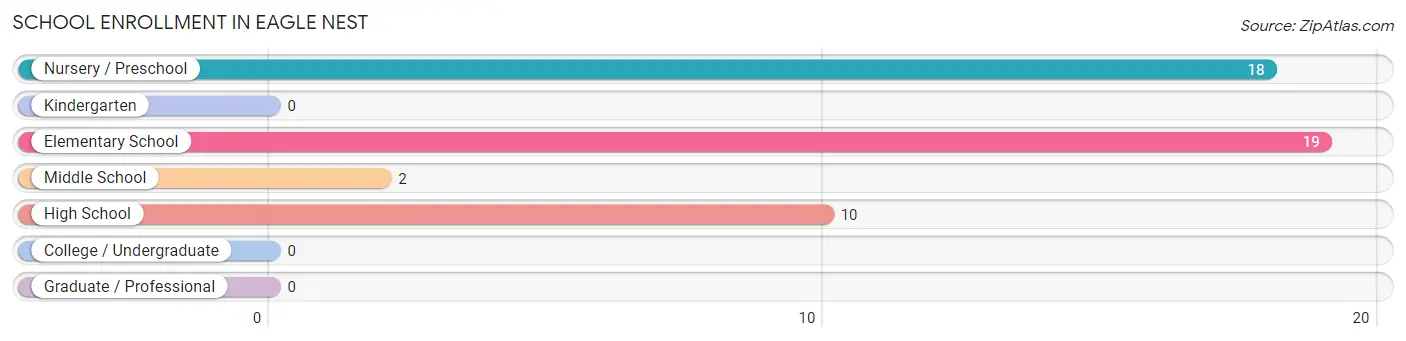
| School Level | # Students | % Students |
| Nursery / Preschool | 18 | 36.7% |
| Kindergarten | 0 | 0.0% |
| Elementary School | 19 | 38.8% |
| Middle School | 2 | 4.1% |
| High School | 10 | 20.4% |
| College / Undergraduate | 0 | 0.0% |
| Graduate / Professional | 0 | 0.0% |
| Total | 49 | 100.0% |
School Enrollment by Age by Funding Source in Eagle Nest
Out of a total of 49 students who are enrolled in schools in Eagle Nest, 20 (40.8%) attend a private institution, while the remaining 29 (59.2%) are enrolled in public schools. The age group of 5 to 9 year old has the highest likelihood of being enrolled in private schools, with 15 (78.9% in the age bracket) enrolled. Conversely, the age group of 10 to 14 year olds has the lowest likelihood of being enrolled in a private school, with 12 (100.0% in the age bracket) attending a public institution.
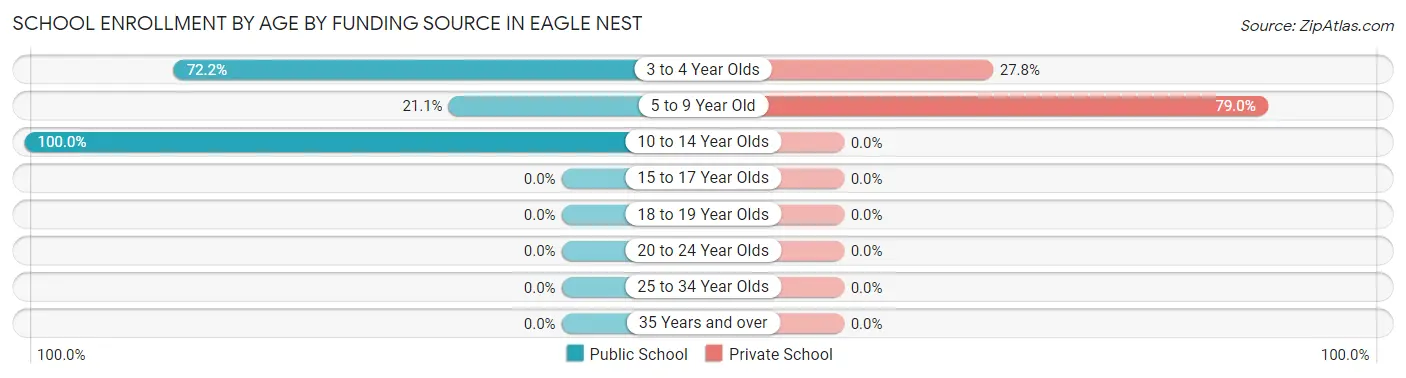
| Age Bracket | Public School | Private School |
| 3 to 4 Year Olds | 13 (72.2%) | 5 (27.8%) |
| 5 to 9 Year Old | 4 (21.0%) | 15 (78.9%) |
| 10 to 14 Year Olds | 12 (100.0%) | 0 (0.0%) |
| 15 to 17 Year Olds | 0 (0.0%) | 0 (0.0%) |
| 18 to 19 Year Olds | 0 (0.0%) | 0 (0.0%) |
| 20 to 24 Year Olds | 0 (0.0%) | 0 (0.0%) |
| 25 to 34 Year Olds | 0 (0.0%) | 0 (0.0%) |
| 35 Years and over | 0 (0.0%) | 0 (0.0%) |
| Total | 29 (59.2%) | 20 (40.8%) |
Educational Attainment by Field of Study in Eagle Nest
Education (16 | 33.3%), psychology (9 | 18.8%), business (8 | 16.7%), arts & humanities (5 | 10.4%), and multidisciplinary studies (4 | 8.3%) are the most common fields of study among 48 individuals in Eagle Nest who have obtained a bachelor's degree or higher.
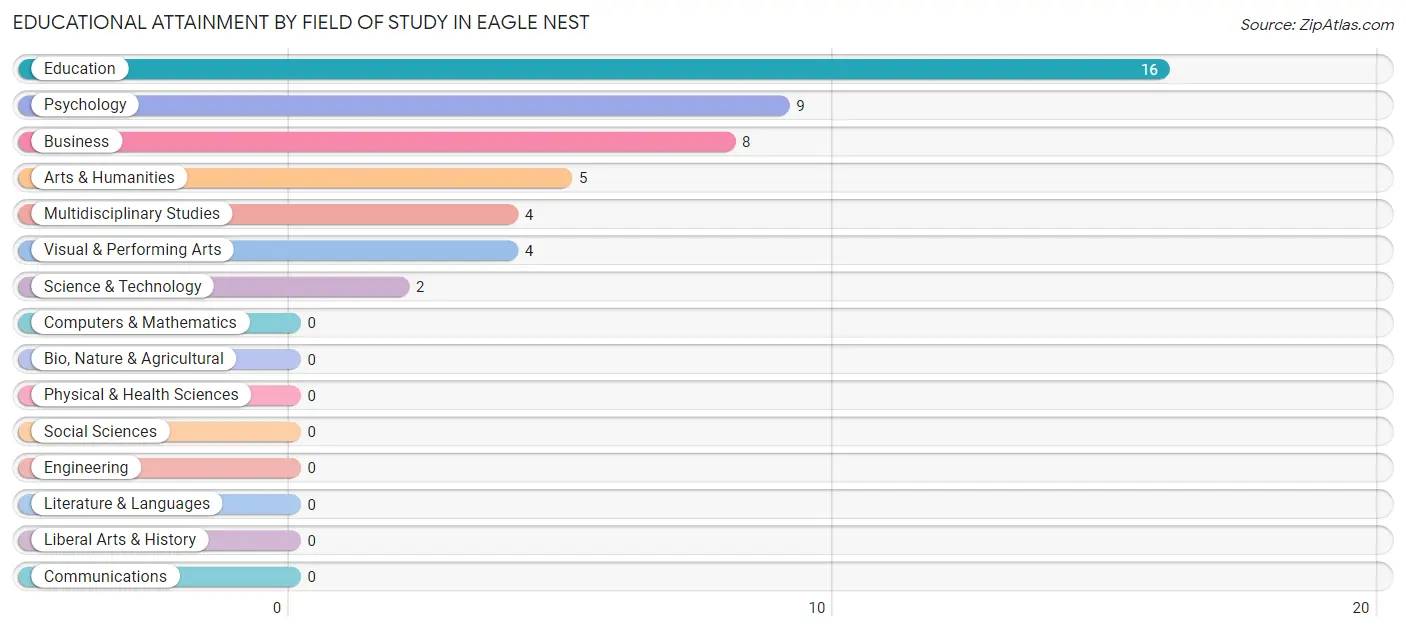
| Field of Study | # Graduates | % Graduates |
| Computers & Mathematics | 0 | 0.0% |
| Bio, Nature & Agricultural | 0 | 0.0% |
| Physical & Health Sciences | 0 | 0.0% |
| Psychology | 9 | 18.8% |
| Social Sciences | 0 | 0.0% |
| Engineering | 0 | 0.0% |
| Multidisciplinary Studies | 4 | 8.3% |
| Science & Technology | 2 | 4.2% |
| Business | 8 | 16.7% |
| Education | 16 | 33.3% |
| Literature & Languages | 0 | 0.0% |
| Liberal Arts & History | 0 | 0.0% |
| Visual & Performing Arts | 4 | 8.3% |
| Communications | 0 | 0.0% |
| Arts & Humanities | 5 | 10.4% |
| Total | 48 | 100.0% |
Transportation & Commute in Eagle Nest
Vehicle Availability by Sex in Eagle Nest
The most prevalent vehicle ownership categories in Eagle Nest are males with 2 vehicles (13, accounting for 40.6%) and females with 2 vehicles (14, making up 35.1%).
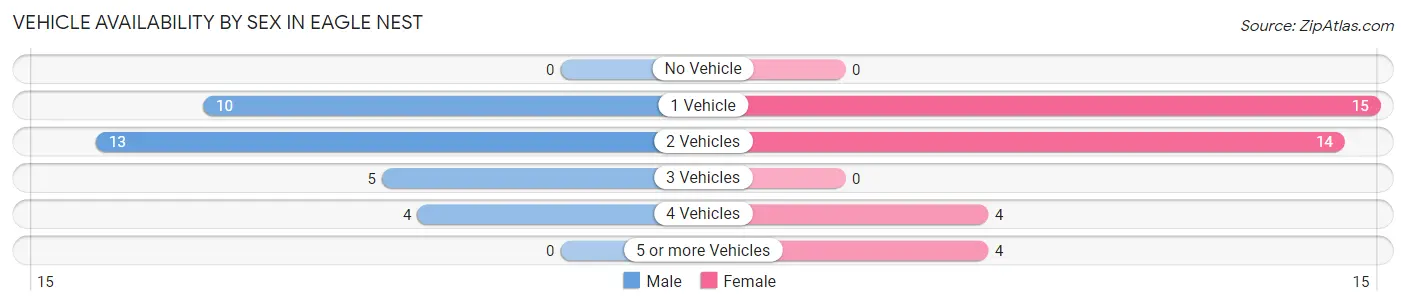
| Vehicles Available | Male | Female |
| No Vehicle | 0 (0.0%) | 0 (0.0%) |
| 1 Vehicle | 10 (31.2%) | 15 (40.5%) |
| 2 Vehicles | 13 (40.6%) | 14 (37.8%) |
| 3 Vehicles | 5 (15.6%) | 0 (0.0%) |
| 4 Vehicles | 4 (12.5%) | 4 (10.8%) |
| 5 or more Vehicles | 0 (0.0%) | 4 (10.8%) |
| Total | 32 (100.0%) | 37 (100.0%) |
Commute Time in Eagle Nest
The most frequently occuring commute durations in Eagle Nest are less than 5 minutes (14 commuters, 21.9%), 30 to 34 minutes (14 commuters, 21.9%), and 15 to 19 minutes (10 commuters, 15.6%).
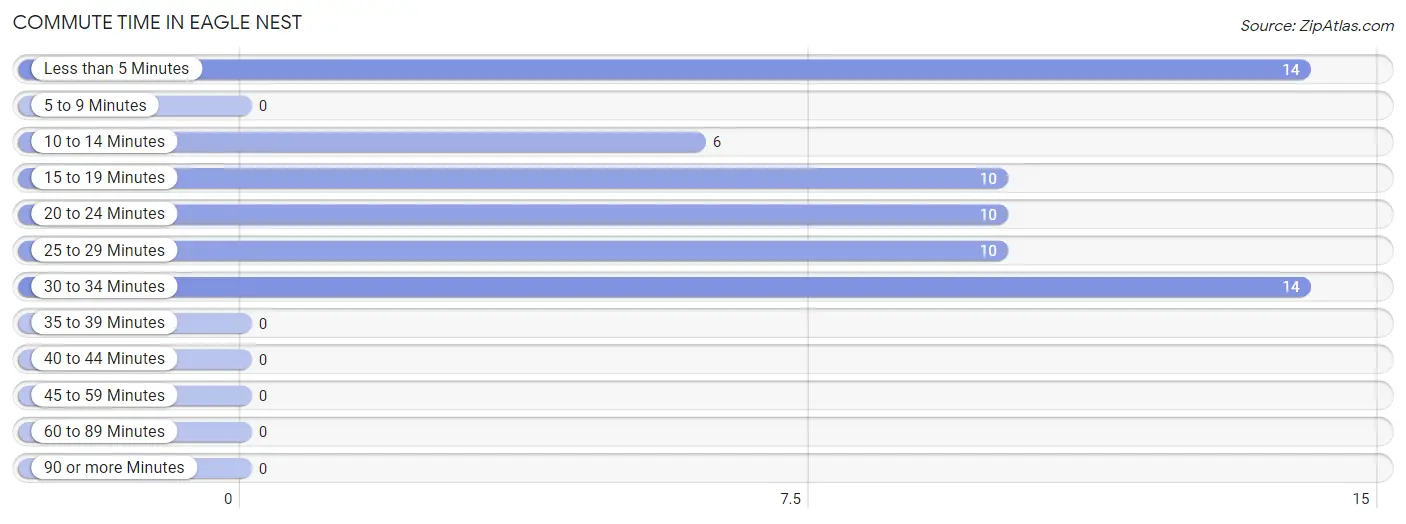
| Commute Time | # Commuters | % Commuters |
| Less than 5 Minutes | 14 | 21.9% |
| 5 to 9 Minutes | 0 | 0.0% |
| 10 to 14 Minutes | 6 | 9.4% |
| 15 to 19 Minutes | 10 | 15.6% |
| 20 to 24 Minutes | 10 | 15.6% |
| 25 to 29 Minutes | 10 | 15.6% |
| 30 to 34 Minutes | 14 | 21.9% |
| 35 to 39 Minutes | 0 | 0.0% |
| 40 to 44 Minutes | 0 | 0.0% |
| 45 to 59 Minutes | 0 | 0.0% |
| 60 to 89 Minutes | 0 | 0.0% |
| 90 or more Minutes | 0 | 0.0% |
Commute Time by Sex in Eagle Nest
The most common commute times in Eagle Nest are 30 to 34 minutes (10 commuters, 31.2%) for males and less than 5 minutes (6 commuters, 18.8%) for females.
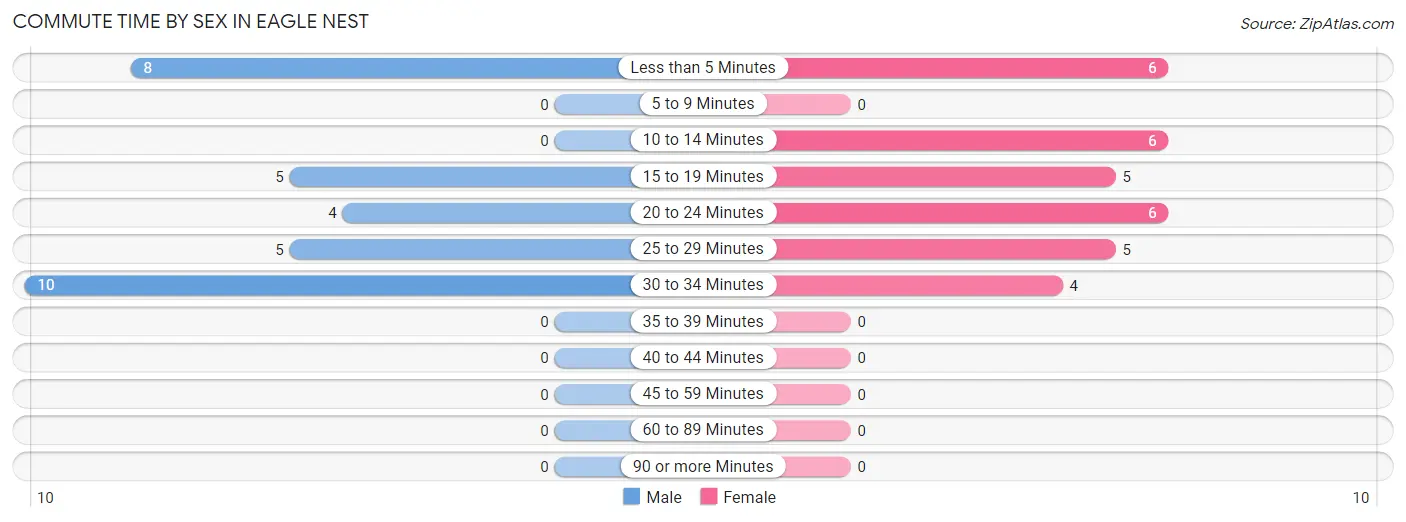
| Commute Time | Male | Female |
| Less than 5 Minutes | 8 (25.0%) | 6 (18.8%) |
| 5 to 9 Minutes | 0 (0.0%) | 0 (0.0%) |
| 10 to 14 Minutes | 0 (0.0%) | 6 (18.8%) |
| 15 to 19 Minutes | 5 (15.6%) | 5 (15.6%) |
| 20 to 24 Minutes | 4 (12.5%) | 6 (18.8%) |
| 25 to 29 Minutes | 5 (15.6%) | 5 (15.6%) |
| 30 to 34 Minutes | 10 (31.2%) | 4 (12.5%) |
| 35 to 39 Minutes | 0 (0.0%) | 0 (0.0%) |
| 40 to 44 Minutes | 0 (0.0%) | 0 (0.0%) |
| 45 to 59 Minutes | 0 (0.0%) | 0 (0.0%) |
| 60 to 89 Minutes | 0 (0.0%) | 0 (0.0%) |
| 90 or more Minutes | 0 (0.0%) | 0 (0.0%) |
Time of Departure to Work by Sex in Eagle Nest
The most frequent times of departure to work in Eagle Nest are 7:30 AM to 7:59 AM (15, 46.9%) for males and 8:00 AM to 8:29 AM (11, 34.4%) for females.
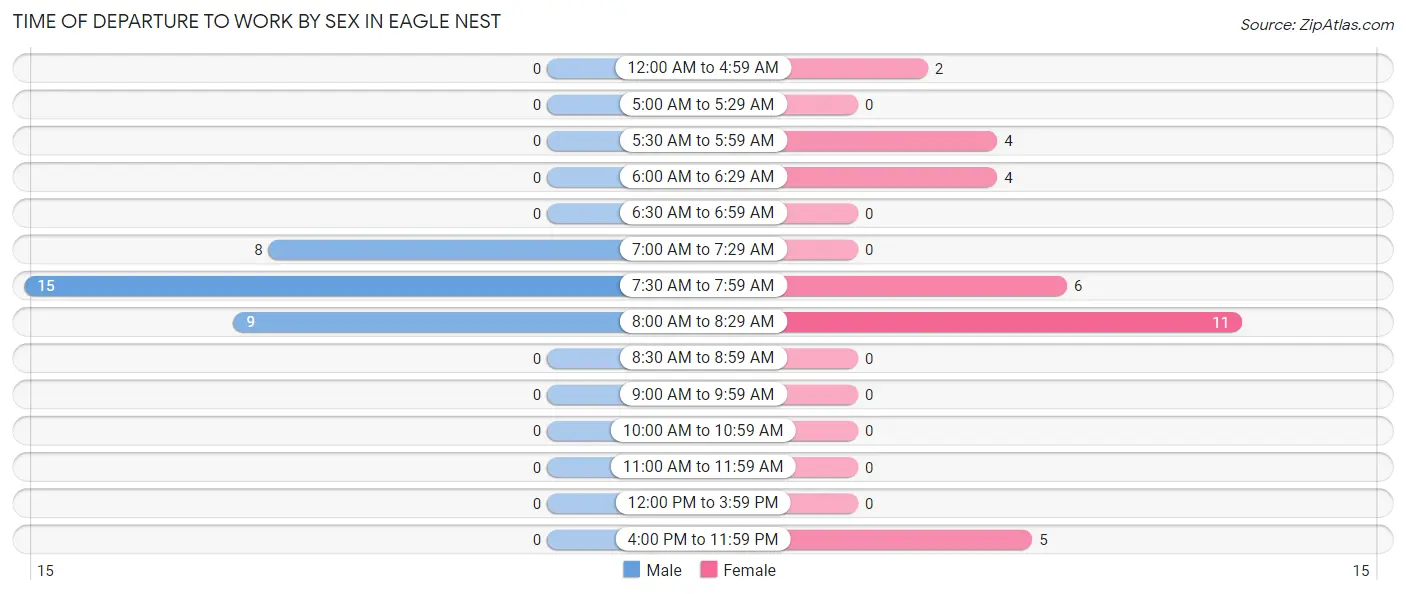
| Time of Departure | Male | Female |
| 12:00 AM to 4:59 AM | 0 (0.0%) | 2 (6.2%) |
| 5:00 AM to 5:29 AM | 0 (0.0%) | 0 (0.0%) |
| 5:30 AM to 5:59 AM | 0 (0.0%) | 4 (12.5%) |
| 6:00 AM to 6:29 AM | 0 (0.0%) | 4 (12.5%) |
| 6:30 AM to 6:59 AM | 0 (0.0%) | 0 (0.0%) |
| 7:00 AM to 7:29 AM | 8 (25.0%) | 0 (0.0%) |
| 7:30 AM to 7:59 AM | 15 (46.9%) | 6 (18.8%) |
| 8:00 AM to 8:29 AM | 9 (28.1%) | 11 (34.4%) |
| 8:30 AM to 8:59 AM | 0 (0.0%) | 0 (0.0%) |
| 9:00 AM to 9:59 AM | 0 (0.0%) | 0 (0.0%) |
| 10:00 AM to 10:59 AM | 0 (0.0%) | 0 (0.0%) |
| 11:00 AM to 11:59 AM | 0 (0.0%) | 0 (0.0%) |
| 12:00 PM to 3:59 PM | 0 (0.0%) | 0 (0.0%) |
| 4:00 PM to 11:59 PM | 0 (0.0%) | 5 (15.6%) |
| Total | 32 (100.0%) | 32 (100.0%) |
Housing Occupancy in Eagle Nest
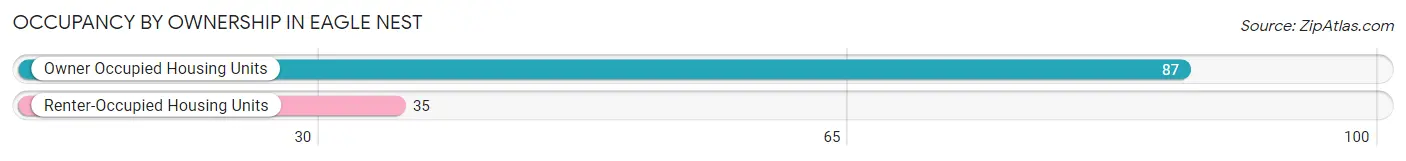
Occupancy by Ownership in Eagle Nest
Of the total 122 dwellings in Eagle Nest, owner-occupied units account for 87 (71.3%), while renter-occupied units make up 35 (28.7%).
| Occupancy | # Housing Units | % Housing Units |
| Owner Occupied Housing Units | 87 | 71.3% |
| Renter-Occupied Housing Units | 35 | 28.7% |
| Total Occupied Housing Units | 122 | 100.0% |
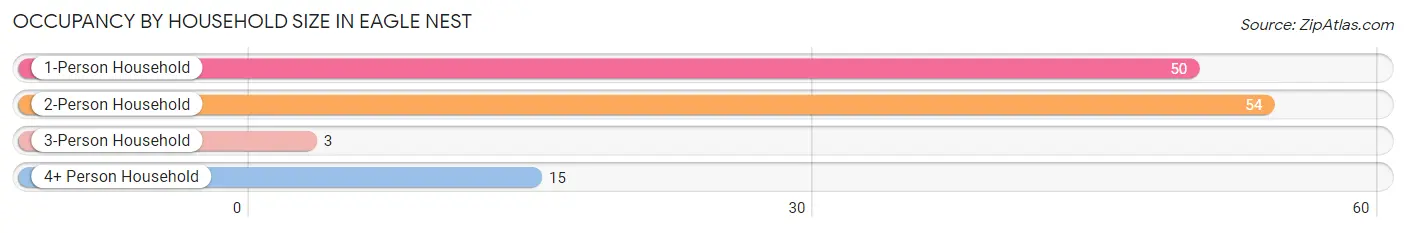
Occupancy by Household Size in Eagle Nest
| Household Size | # Housing Units | % Housing Units |
| 1-Person Household | 50 | 41.0% |
| 2-Person Household | 54 | 44.3% |
| 3-Person Household | 3 | 2.5% |
| 4+ Person Household | 15 | 12.3% |
| Total Housing Units | 122 | 100.0% |
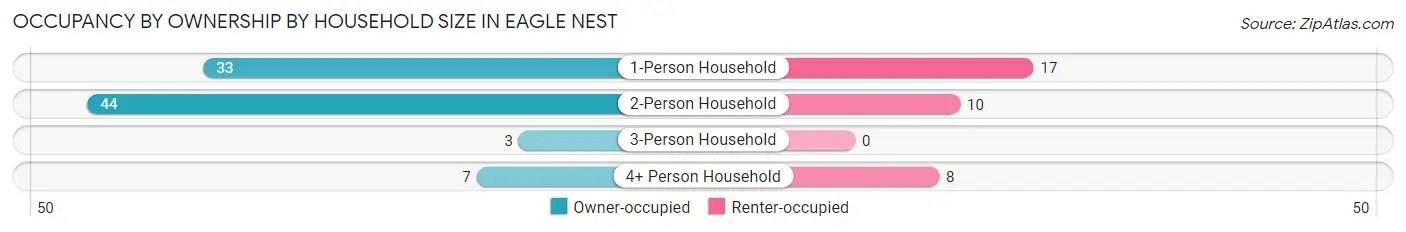
Occupancy by Ownership by Household Size in Eagle Nest
| Household Size | Owner-occupied | Renter-occupied |
| 1-Person Household | 33 (66.0%) | 17 (34.0%) |
| 2-Person Household | 44 (81.5%) | 10 (18.5%) |
| 3-Person Household | 3 (100.0%) | 0 (0.0%) |
| 4+ Person Household | 7 (46.7%) | 8 (53.3%) |
| Total Housing Units | 87 (71.3%) | 35 (28.7%) |
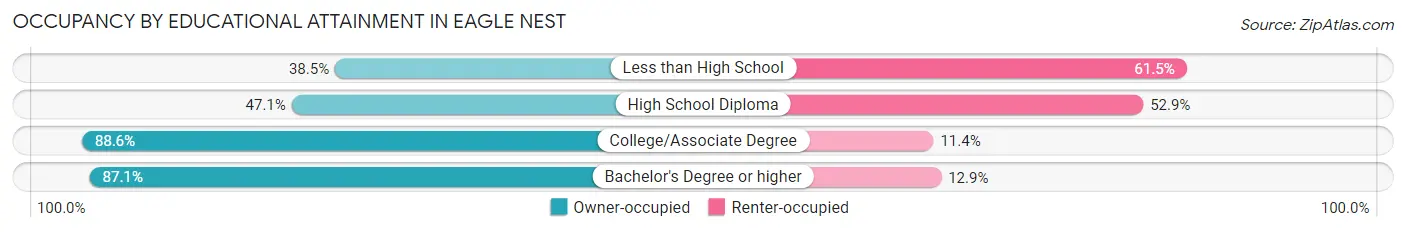
Occupancy by Educational Attainment in Eagle Nest
| Household Size | Owner-occupied | Renter-occupied |
| Less than High School | 5 (38.5%) | 8 (61.5%) |
| High School Diploma | 16 (47.1%) | 18 (52.9%) |
| College/Associate Degree | 39 (88.6%) | 5 (11.4%) |
| Bachelor's Degree or higher | 27 (87.1%) | 4 (12.9%) |
Occupancy by Age of Householder in Eagle Nest
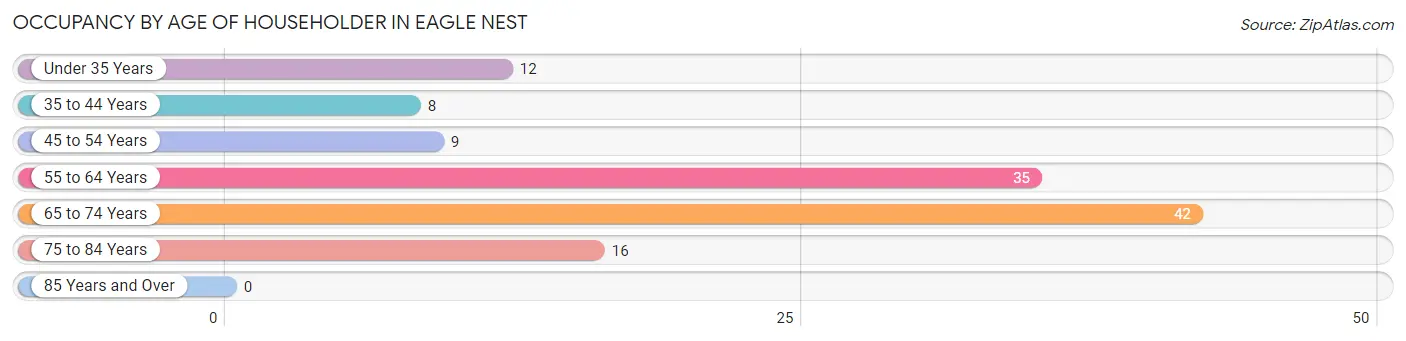
| Age Bracket | # Households | % Households |
| Under 35 Years | 12 | 9.8% |
| 35 to 44 Years | 8 | 6.6% |
| 45 to 54 Years | 9 | 7.4% |
| 55 to 64 Years | 35 | 28.7% |
| 65 to 74 Years | 42 | 34.4% |
| 75 to 84 Years | 16 | 13.1% |
| 85 Years and Over | 0 | 0.0% |
| Total | 122 | 100.0% |
Housing Finances in Eagle Nest
Median Income by Occupancy in Eagle Nest
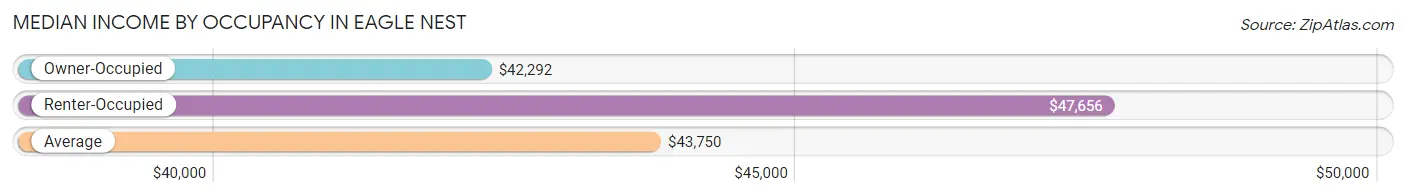
| Occupancy Type | # Households | Median Income |
| Owner-Occupied | 87 (71.3%) | $42,292 |
| Renter-Occupied | 35 (28.7%) | $47,656 |
| Average | 122 (100.0%) | $43,750 |
Occupancy by Householder Income Bracket in Eagle Nest
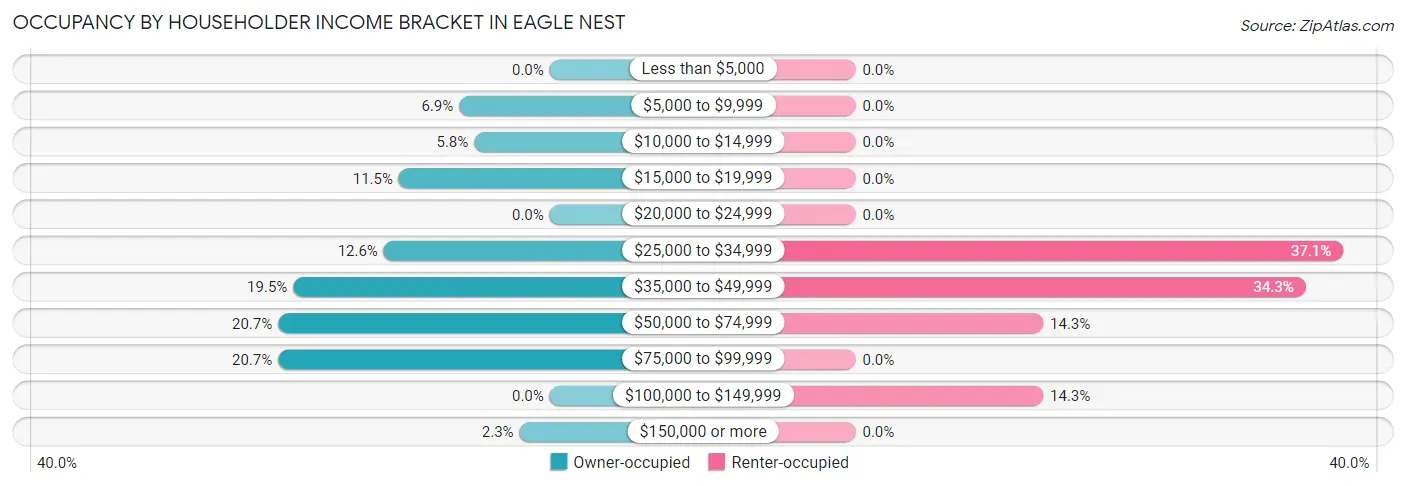
| Income Bracket | Owner-occupied | Renter-occupied |
| Less than $5,000 | 0 (0.0%) | 0 (0.0%) |
| $5,000 to $9,999 | 6 (6.9%) | 0 (0.0%) |
| $10,000 to $14,999 | 5 (5.8%) | 0 (0.0%) |
| $15,000 to $19,999 | 10 (11.5%) | 0 (0.0%) |
| $20,000 to $24,999 | 0 (0.0%) | 0 (0.0%) |
| $25,000 to $34,999 | 11 (12.6%) | 13 (37.1%) |
| $35,000 to $49,999 | 17 (19.5%) | 12 (34.3%) |
| $50,000 to $74,999 | 18 (20.7%) | 5 (14.3%) |
| $75,000 to $99,999 | 18 (20.7%) | 0 (0.0%) |
| $100,000 to $149,999 | 0 (0.0%) | 5 (14.3%) |
| $150,000 or more | 2 (2.3%) | 0 (0.0%) |
| Total | 87 (100.0%) | 35 (100.0%) |
Monthly Housing Cost Tiers in Eagle Nest
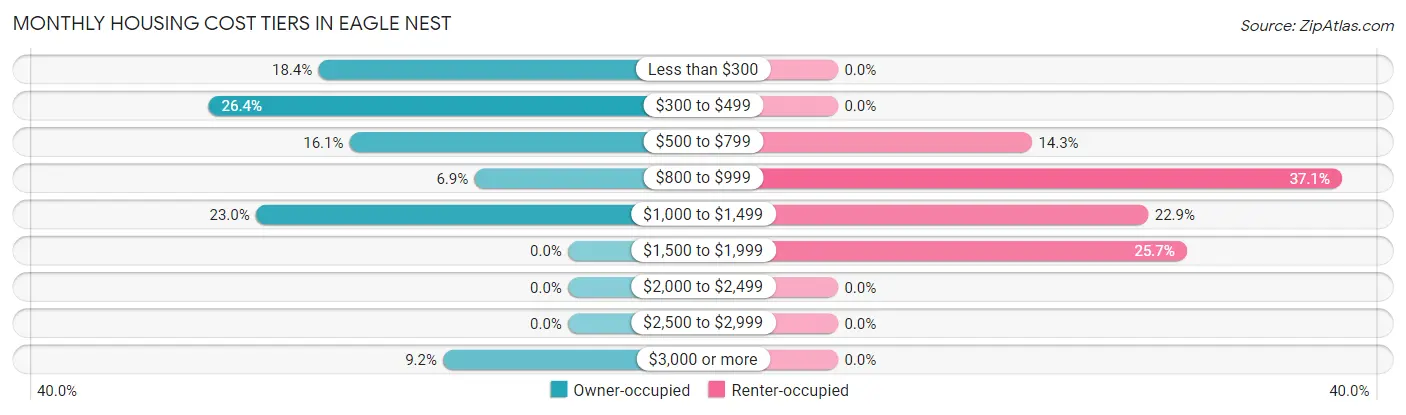
| Monthly Cost | Owner-occupied | Renter-occupied |
| Less than $300 | 16 (18.4%) | 0 (0.0%) |
| $300 to $499 | 23 (26.4%) | 0 (0.0%) |
| $500 to $799 | 14 (16.1%) | 5 (14.3%) |
| $800 to $999 | 6 (6.9%) | 13 (37.1%) |
| $1,000 to $1,499 | 20 (23.0%) | 8 (22.9%) |
| $1,500 to $1,999 | 0 (0.0%) | 9 (25.7%) |
| $2,000 to $2,499 | 0 (0.0%) | 0 (0.0%) |
| $2,500 to $2,999 | 0 (0.0%) | 0 (0.0%) |
| $3,000 or more | 8 (9.2%) | 0 (0.0%) |
| Total | 87 (100.0%) | 35 (100.0%) |
Physical Housing Characteristics in Eagle Nest
Housing Structures in Eagle Nest
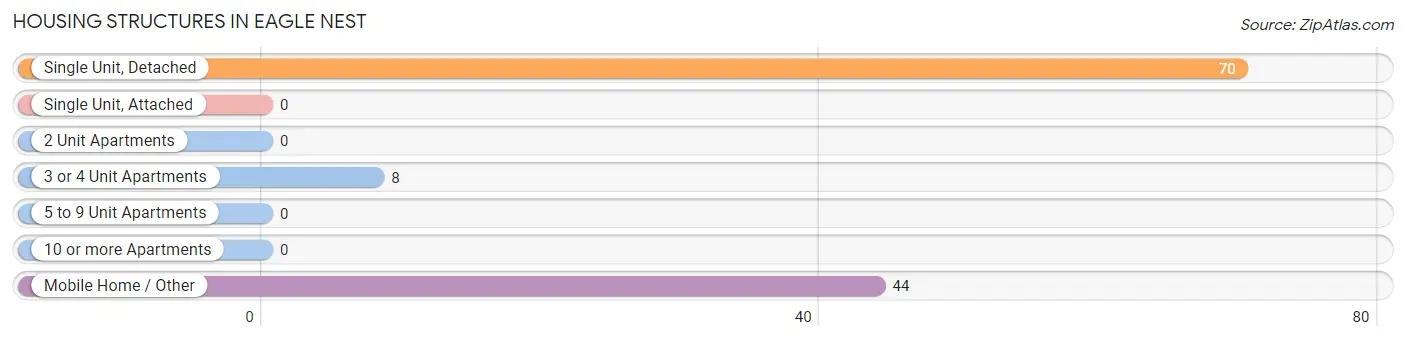
| Structure Type | # Housing Units | % Housing Units |
| Single Unit, Detached | 70 | 57.4% |
| Single Unit, Attached | 0 | 0.0% |
| 2 Unit Apartments | 0 | 0.0% |
| 3 or 4 Unit Apartments | 8 | 6.6% |
| 5 to 9 Unit Apartments | 0 | 0.0% |
| 10 or more Apartments | 0 | 0.0% |
| Mobile Home / Other | 44 | 36.1% |
| Total | 122 | 100.0% |
Housing Structures by Occupancy in Eagle Nest
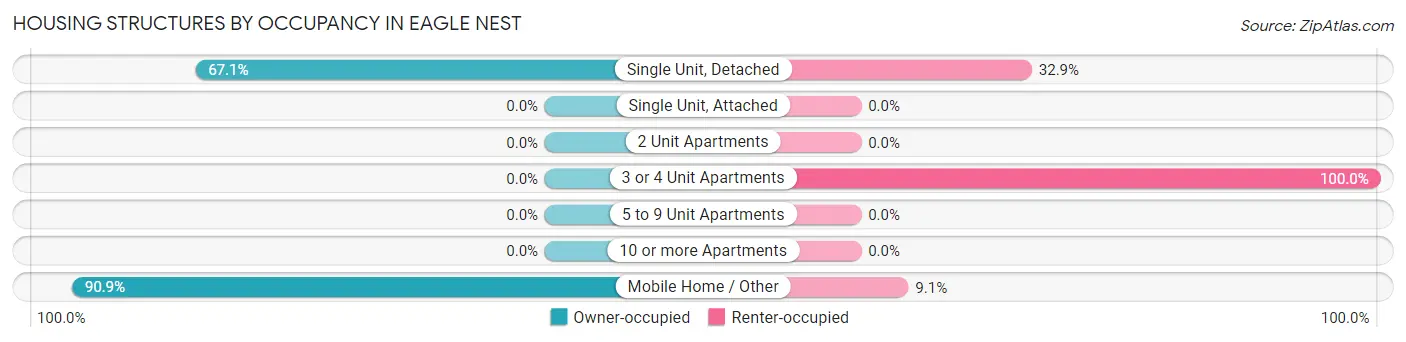
| Structure Type | Owner-occupied | Renter-occupied |
| Single Unit, Detached | 47 (67.1%) | 23 (32.9%) |
| Single Unit, Attached | 0 (0.0%) | 0 (0.0%) |
| 2 Unit Apartments | 0 (0.0%) | 0 (0.0%) |
| 3 or 4 Unit Apartments | 0 (0.0%) | 8 (100.0%) |
| 5 to 9 Unit Apartments | 0 (0.0%) | 0 (0.0%) |
| 10 or more Apartments | 0 (0.0%) | 0 (0.0%) |
| Mobile Home / Other | 40 (90.9%) | 4 (9.1%) |
| Total | 87 (71.3%) | 35 (28.7%) |
Housing Structures by Number of Rooms in Eagle Nest
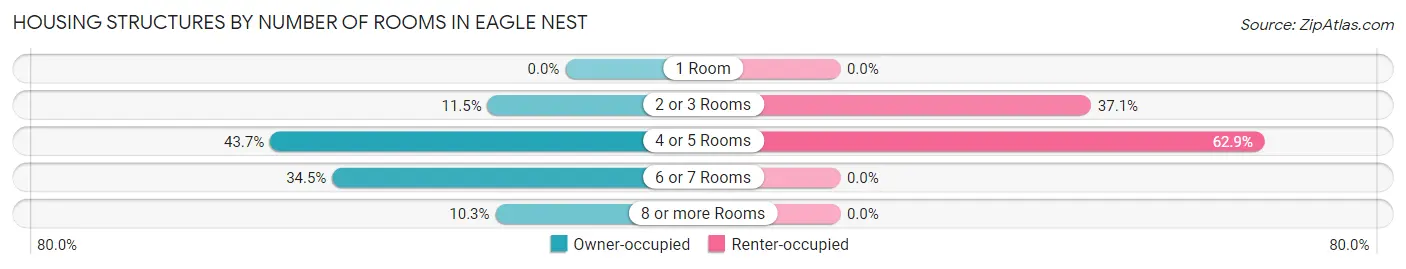
| Number of Rooms | Owner-occupied | Renter-occupied |
| 1 Room | 0 (0.0%) | 0 (0.0%) |
| 2 or 3 Rooms | 10 (11.5%) | 13 (37.1%) |
| 4 or 5 Rooms | 38 (43.7%) | 22 (62.9%) |
| 6 or 7 Rooms | 30 (34.5%) | 0 (0.0%) |
| 8 or more Rooms | 9 (10.3%) | 0 (0.0%) |
| Total | 87 (100.0%) | 35 (100.0%) |
Housing Structure by Heating Type in Eagle Nest
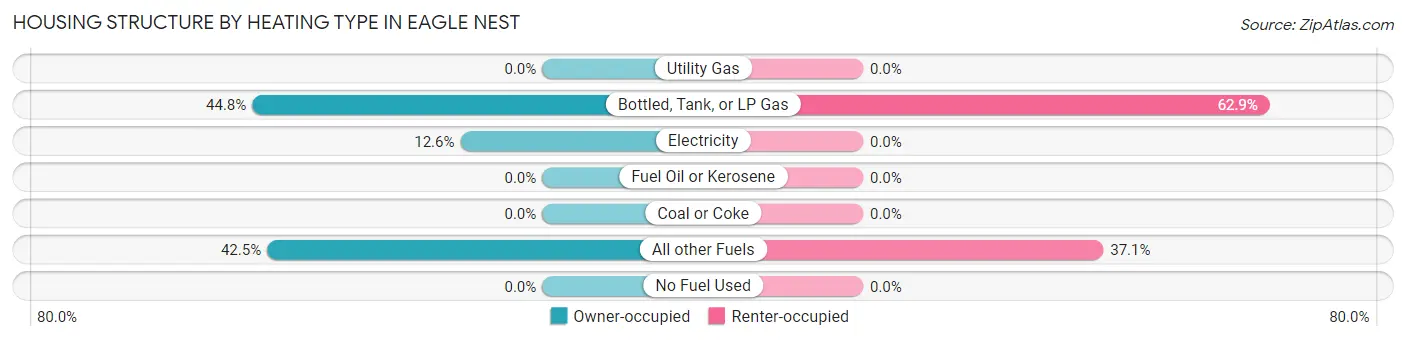
| Heating Type | Owner-occupied | Renter-occupied |
| Utility Gas | 0 (0.0%) | 0 (0.0%) |
| Bottled, Tank, or LP Gas | 39 (44.8%) | 22 (62.9%) |
| Electricity | 11 (12.6%) | 0 (0.0%) |
| Fuel Oil or Kerosene | 0 (0.0%) | 0 (0.0%) |
| Coal or Coke | 0 (0.0%) | 0 (0.0%) |
| All other Fuels | 37 (42.5%) | 13 (37.1%) |
| No Fuel Used | 0 (0.0%) | 0 (0.0%) |
| Total | 87 (100.0%) | 35 (100.0%) |
Household Vehicle Usage in Eagle Nest
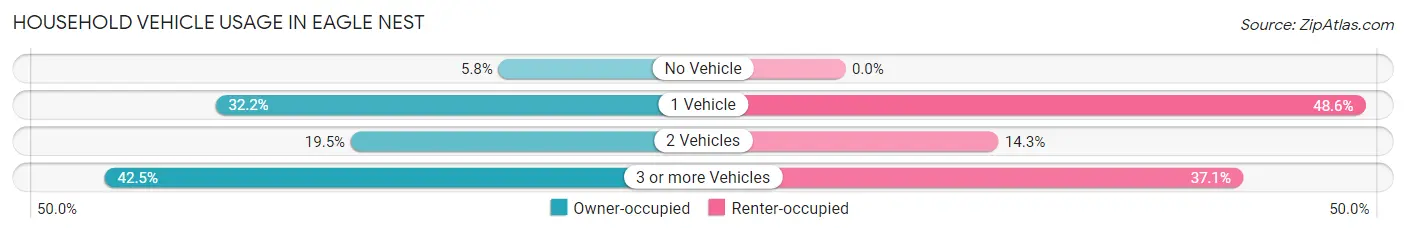
| Vehicles per Household | Owner-occupied | Renter-occupied |
| No Vehicle | 5 (5.8%) | 0 (0.0%) |
| 1 Vehicle | 28 (32.2%) | 17 (48.6%) |
| 2 Vehicles | 17 (19.5%) | 5 (14.3%) |
| 3 or more Vehicles | 37 (42.5%) | 13 (37.1%) |
| Total | 87 (100.0%) | 35 (100.0%) |
Real Estate & Mortgages in Eagle Nest
Real Estate and Mortgage Overview in Eagle Nest
| Characteristic | Without Mortgage | With Mortgage |
| Housing Units | 57 | 30 |
| Median Property Value | $182,500 | $0 |
| Median Household Income | $39,792 | $2 |
| Monthly Housing Costs | $368 | $8 |
| Real Estate Taxes | $660 | $0 |
Property Value by Mortgage Status in Eagle Nest
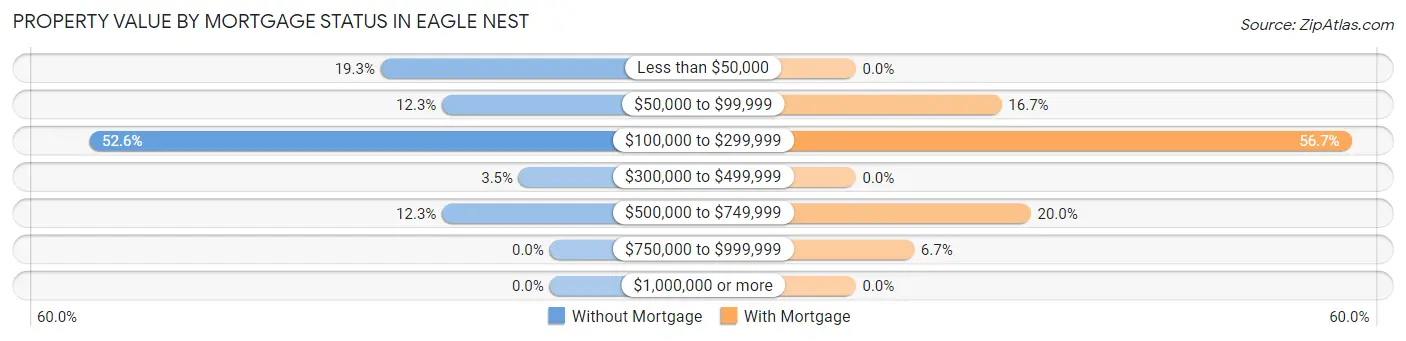
| Property Value | Without Mortgage | With Mortgage |
| Less than $50,000 | 11 (19.3%) | 0 (0.0%) |
| $50,000 to $99,999 | 7 (12.3%) | 5 (16.7%) |
| $100,000 to $299,999 | 30 (52.6%) | 17 (56.7%) |
| $300,000 to $499,999 | 2 (3.5%) | 0 (0.0%) |
| $500,000 to $749,999 | 7 (12.3%) | 6 (20.0%) |
| $750,000 to $999,999 | 0 (0.0%) | 2 (6.7%) |
| $1,000,000 or more | 0 (0.0%) | 0 (0.0%) |
| Total | 57 (100.0%) | 30 (100.0%) |
Household Income by Mortgage Status in Eagle Nest
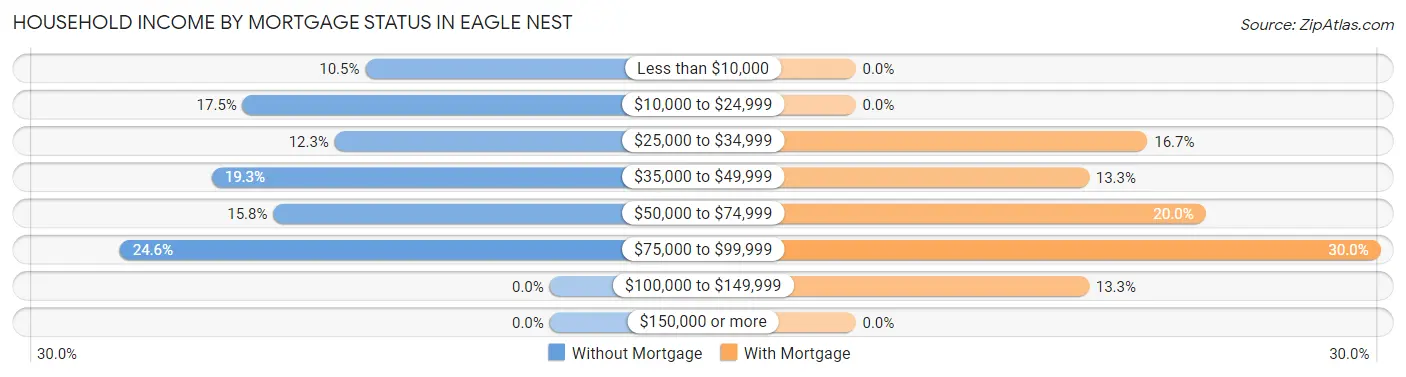
| Household Income | Without Mortgage | With Mortgage |
| Less than $10,000 | 6 (10.5%) | 0 (0.0%) |
| $10,000 to $24,999 | 10 (17.5%) | 0 (0.0%) |
| $25,000 to $34,999 | 7 (12.3%) | 5 (16.7%) |
| $35,000 to $49,999 | 11 (19.3%) | 4 (13.3%) |
| $50,000 to $74,999 | 9 (15.8%) | 6 (20.0%) |
| $75,000 to $99,999 | 14 (24.6%) | 9 (30.0%) |
| $100,000 to $149,999 | 0 (0.0%) | 4 (13.3%) |
| $150,000 or more | 0 (0.0%) | 0 (0.0%) |
| Total | 57 (100.0%) | 30 (100.0%) |
Property Value to Household Income Ratio in Eagle Nest
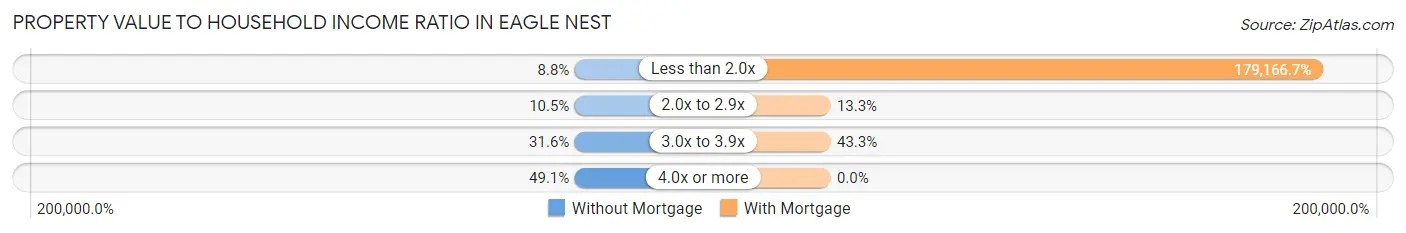
| Value-to-Income Ratio | Without Mortgage | With Mortgage |
| Less than 2.0x | 5 (8.8%) | 53,750 (179,166.7%) |
| 2.0x to 2.9x | 6 (10.5%) | 4 (13.3%) |
| 3.0x to 3.9x | 18 (31.6%) | 13 (43.3%) |
| 4.0x or more | 28 (49.1%) | 0 (0.0%) |
| Total | 57 (100.0%) | 30 (100.0%) |
Real Estate Taxes by Mortgage Status in Eagle Nest
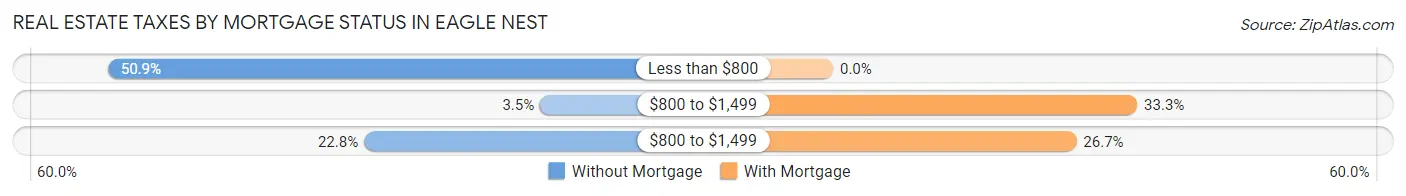
| Property Taxes | Without Mortgage | With Mortgage |
| Less than $800 | 29 (50.9%) | 0 (0.0%) |
| $800 to $1,499 | 2 (3.5%) | 10 (33.3%) |
| $800 to $1,499 | 13 (22.8%) | 8 (26.7%) |
| Total | 57 (100.0%) | 30 (100.0%) |
Health & Disability in Eagle Nest
Health Insurance Coverage by Age in Eagle Nest
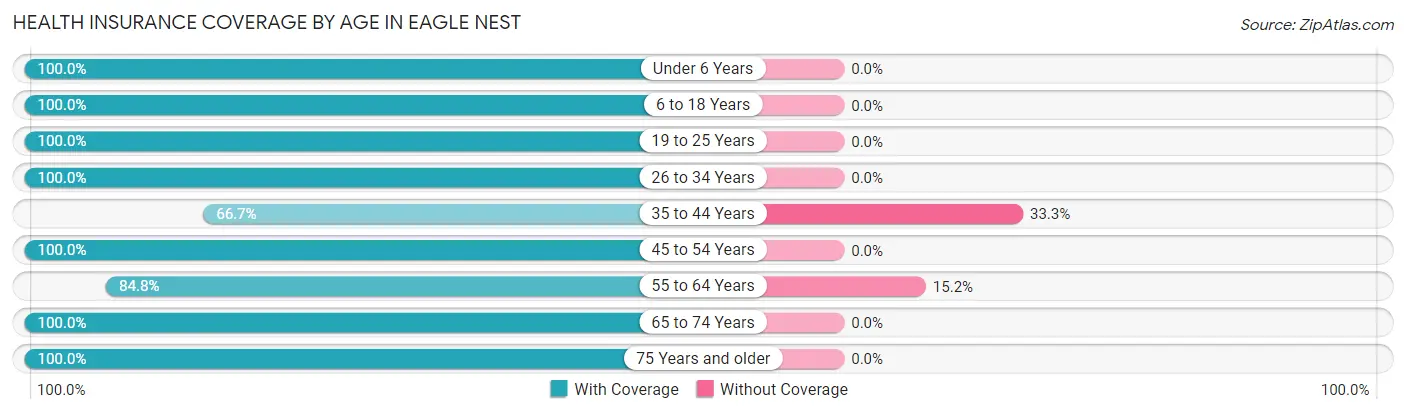
| Age Bracket | With Coverage | Without Coverage |
| Under 6 Years | 22 (100.0%) | 0 (0.0%) |
| 6 to 18 Years | 31 (100.0%) | 0 (0.0%) |
| 19 to 25 Years | 19 (100.0%) | 0 (0.0%) |
| 26 to 34 Years | 20 (100.0%) | 0 (0.0%) |
| 35 to 44 Years | 10 (66.7%) | 5 (33.3%) |
| 45 to 54 Years | 13 (100.0%) | 0 (0.0%) |
| 55 to 64 Years | 39 (84.8%) | 7 (15.2%) |
| 65 to 74 Years | 54 (100.0%) | 0 (0.0%) |
| 75 Years and older | 29 (100.0%) | 0 (0.0%) |
| Total | 237 (95.2%) | 12 (4.8%) |
Health Insurance Coverage by Citizenship Status in Eagle Nest

| Citizenship Status | With Coverage | Without Coverage |
| Native Born | 22 (100.0%) | 0 (0.0%) |
| Foreign Born, Citizen | 31 (100.0%) | 0 (0.0%) |
| Foreign Born, not a Citizen | 19 (100.0%) | 0 (0.0%) |
Health Insurance Coverage by Household Income in Eagle Nest
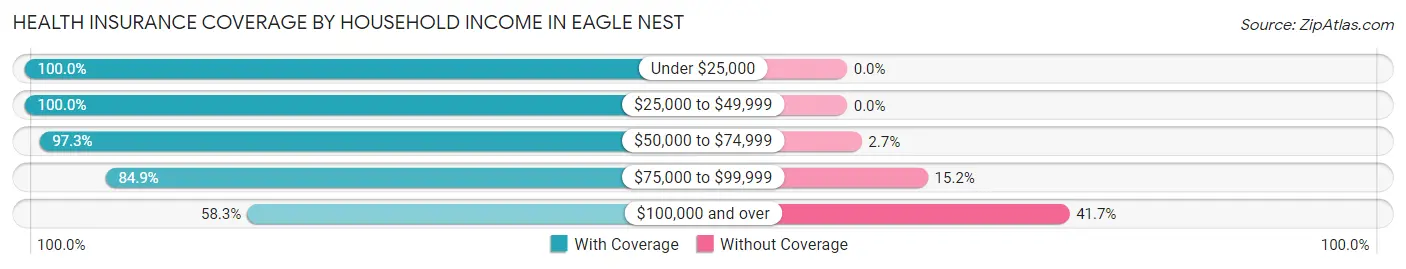
| Household Income | With Coverage | Without Coverage |
| Under $25,000 | 26 (100.0%) | 0 (0.0%) |
| $25,000 to $49,999 | 105 (100.0%) | 0 (0.0%) |
| $50,000 to $74,999 | 71 (97.3%) | 2 (2.7%) |
| $75,000 to $99,999 | 28 (84.9%) | 5 (15.1%) |
| $100,000 and over | 7 (58.3%) | 5 (41.7%) |
Public vs Private Health Insurance Coverage by Age in Eagle Nest
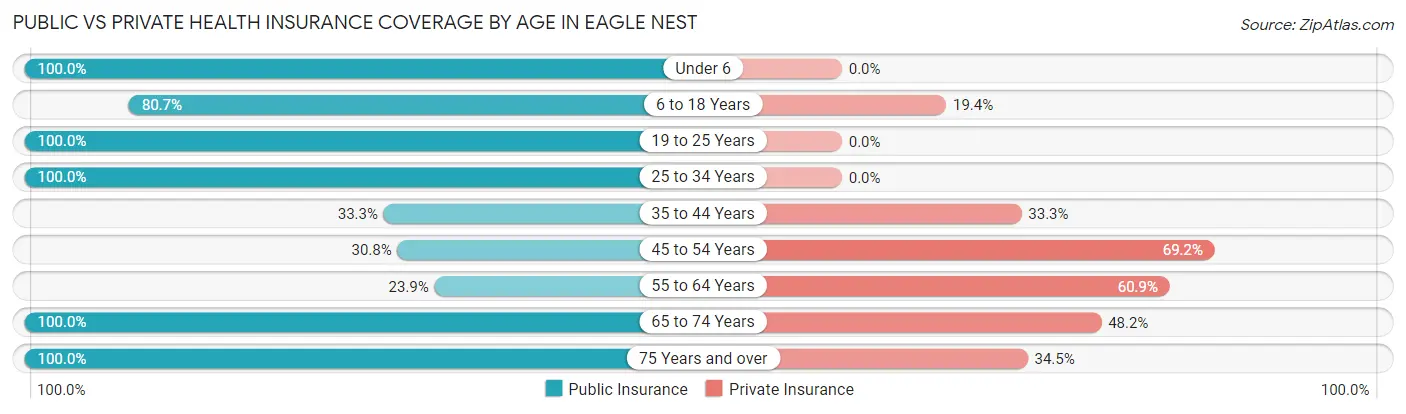
| Age Bracket | Public Insurance | Private Insurance |
| Under 6 | 22 (100.0%) | 0 (0.0%) |
| 6 to 18 Years | 25 (80.6%) | 6 (19.4%) |
| 19 to 25 Years | 19 (100.0%) | 0 (0.0%) |
| 25 to 34 Years | 20 (100.0%) | 0 (0.0%) |
| 35 to 44 Years | 5 (33.3%) | 5 (33.3%) |
| 45 to 54 Years | 4 (30.8%) | 9 (69.2%) |
| 55 to 64 Years | 11 (23.9%) | 28 (60.9%) |
| 65 to 74 Years | 54 (100.0%) | 26 (48.1%) |
| 75 Years and over | 29 (100.0%) | 10 (34.5%) |
| Total | 189 (75.9%) | 84 (33.7%) |
Disability Status by Sex by Age in Eagle Nest
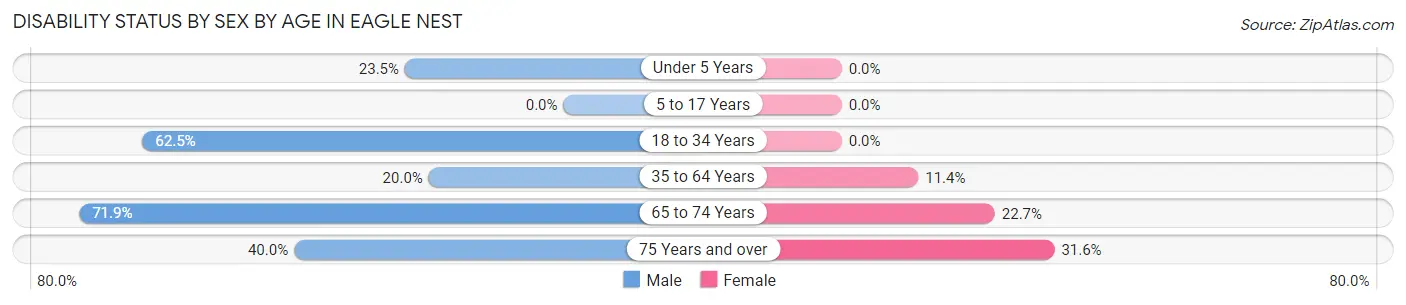
| Age Bracket | Male | Female |
| Under 5 Years | 4 (23.5%) | 0 (0.0%) |
| 5 to 17 Years | 0 (0.0%) | 0 (0.0%) |
| 18 to 34 Years | 10 (62.5%) | 0 (0.0%) |
| 35 to 64 Years | 6 (20.0%) | 5 (11.4%) |
| 65 to 74 Years | 23 (71.9%) | 5 (22.7%) |
| 75 Years and over | 4 (40.0%) | 6 (31.6%) |
Disability Class by Sex by Age in Eagle Nest
Disability Class: Hearing Difficulty
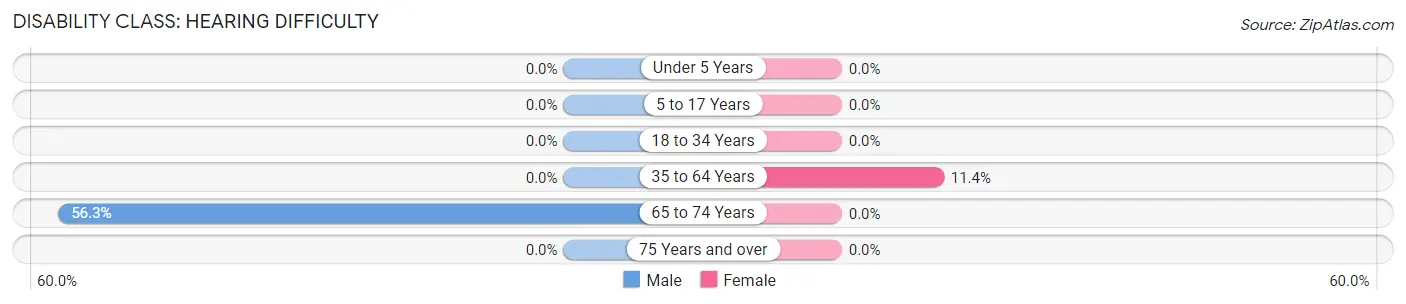
| Age Bracket | Male | Female |
| Under 5 Years | 0 (0.0%) | 0 (0.0%) |
| 5 to 17 Years | 0 (0.0%) | 0 (0.0%) |
| 18 to 34 Years | 0 (0.0%) | 0 (0.0%) |
| 35 to 64 Years | 0 (0.0%) | 5 (11.4%) |
| 65 to 74 Years | 18 (56.2%) | 0 (0.0%) |
| 75 Years and over | 0 (0.0%) | 0 (0.0%) |
Disability Class: Vision Difficulty
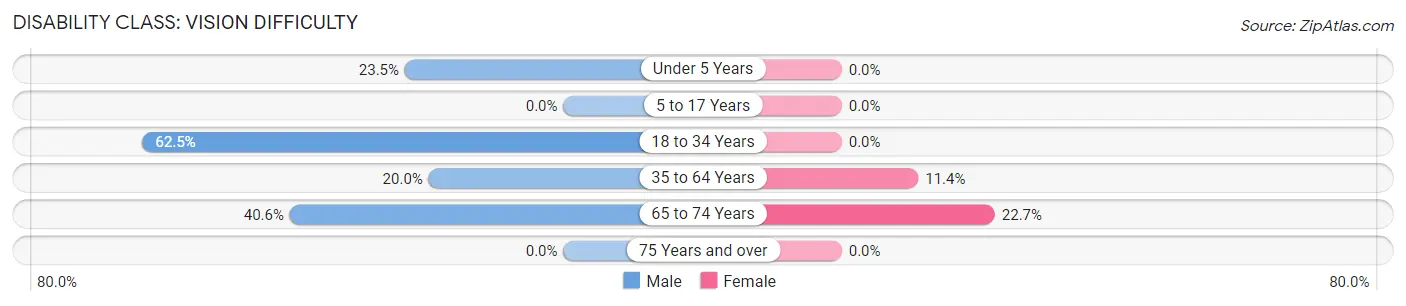
| Age Bracket | Male | Female |
| Under 5 Years | 4 (23.5%) | 0 (0.0%) |
| 5 to 17 Years | 0 (0.0%) | 0 (0.0%) |
| 18 to 34 Years | 10 (62.5%) | 0 (0.0%) |
| 35 to 64 Years | 6 (20.0%) | 5 (11.4%) |
| 65 to 74 Years | 13 (40.6%) | 5 (22.7%) |
| 75 Years and over | 0 (0.0%) | 0 (0.0%) |
Disability Class: Cognitive Difficulty
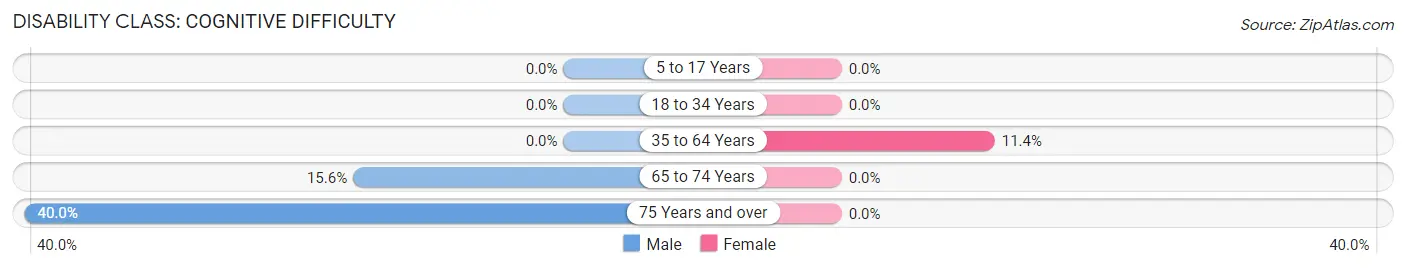
| Age Bracket | Male | Female |
| 5 to 17 Years | 0 (0.0%) | 0 (0.0%) |
| 18 to 34 Years | 0 (0.0%) | 0 (0.0%) |
| 35 to 64 Years | 0 (0.0%) | 5 (11.4%) |
| 65 to 74 Years | 5 (15.6%) | 0 (0.0%) |
| 75 Years and over | 4 (40.0%) | 0 (0.0%) |
Disability Class: Ambulatory Difficulty
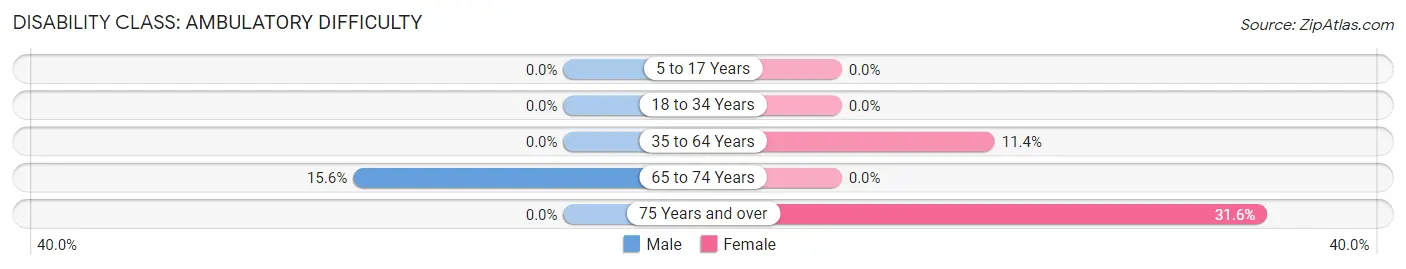
| Age Bracket | Male | Female |
| 5 to 17 Years | 0 (0.0%) | 0 (0.0%) |
| 18 to 34 Years | 0 (0.0%) | 0 (0.0%) |
| 35 to 64 Years | 0 (0.0%) | 5 (11.4%) |
| 65 to 74 Years | 5 (15.6%) | 0 (0.0%) |
| 75 Years and over | 0 (0.0%) | 6 (31.6%) |
Disability Class: Self-Care Difficulty

| Age Bracket | Male | Female |
| 5 to 17 Years | 0 (0.0%) | 0 (0.0%) |
| 18 to 34 Years | 0 (0.0%) | 0 (0.0%) |
| 35 to 64 Years | 0 (0.0%) | 5 (11.4%) |
| 65 to 74 Years | 0 (0.0%) | 0 (0.0%) |
| 75 Years and over | 0 (0.0%) | 0 (0.0%) |
Technology Access in Eagle Nest
Computing Device Access in Eagle Nest
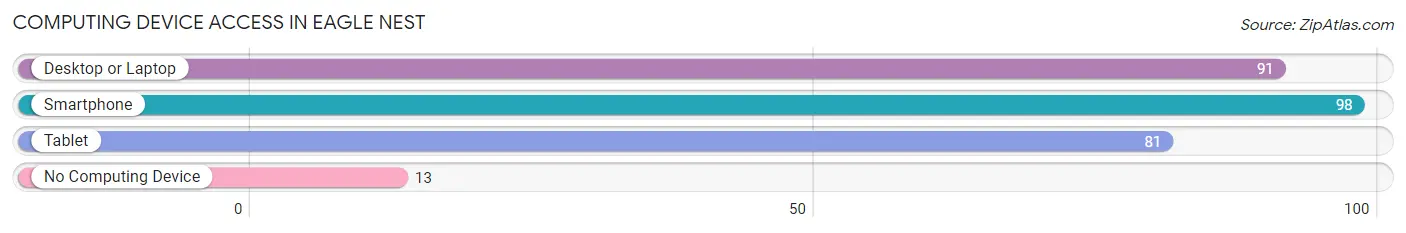
| Device Type | # Households | % Households |
| Desktop or Laptop | 91 | 74.6% |
| Smartphone | 98 | 80.3% |
| Tablet | 81 | 66.4% |
| No Computing Device | 13 | 10.7% |
| Total | 122 | 100.0% |
Internet Access in Eagle Nest
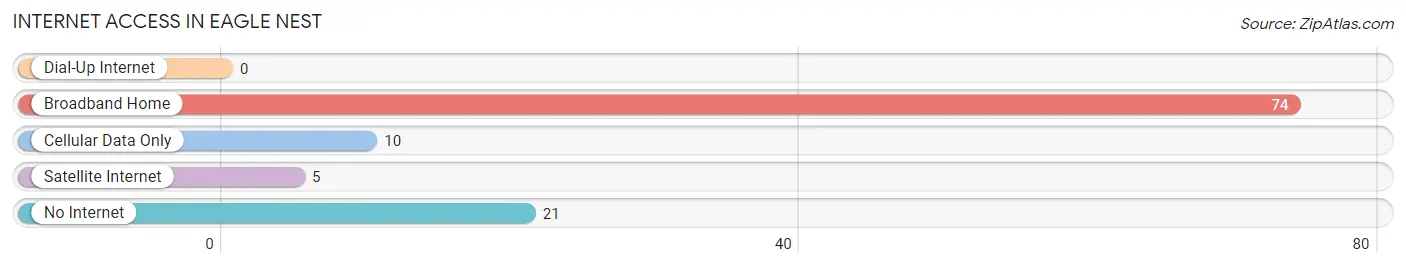
| Internet Type | # Households | % Households |
| Dial-Up Internet | 0 | 0.0% |
| Broadband Home | 74 | 60.7% |
| Cellular Data Only | 10 | 8.2% |
| Satellite Internet | 5 | 4.1% |
| No Internet | 21 | 17.2% |
| Total | 122 | 100.0% |
Eagle Nest Summary
Eagle Nest is a small village located in the Moreno Valley of northeastern New Mexico. It is situated at an elevation of 8,000 feet in the Sangre de Cristo Mountains, and is surrounded by the Carson National Forest. The village is located approximately 40 miles north of Taos, and is home to a population of approximately 300 people.
History
The area around Eagle Nest was first inhabited by the Taos Indians, who lived in the area for centuries before the arrival of the Spanish in the 16th century. The Spanish established a mission in the area in 1776, and the village of Eagle Nest was founded in 1876. The village was named after a nearby lake, which was named for the large number of bald eagles that nested in the area.
The village was originally a small farming and ranching community, and the local economy was largely based on the production of wool and cattle. In the late 19th century, the area began to attract tourists, and the village became a popular destination for hunting and fishing.
Geography
Eagle Nest is located in the Moreno Valley of northeastern New Mexico. The village is situated at an elevation of 8,000 feet in the Sangre de Cristo Mountains, and is surrounded by the Carson National Forest. The village is located approximately 40 miles north of Taos, and is home to a population of approximately 300 people.
The village is located in a mountainous region, and the surrounding area is characterized by rolling hills, forests, and meadows. The village is located near several lakes, including Eagle Nest Lake, which is the largest lake in the area. The lake is a popular destination for fishing, boating, and other recreational activities.
Economy
The local economy of Eagle Nest is largely based on tourism. The village is a popular destination for outdoor recreation, and the surrounding area is home to several ski resorts, hiking trails, and other attractions. The village is also home to several restaurants, shops, and other businesses that cater to tourists.
In addition to tourism, the local economy is also supported by agriculture and ranching. The area is home to several farms and ranches, and the production of wool and cattle is an important part of the local economy.
Demographics
As of the 2010 census, the population of Eagle Nest was 300. The racial makeup of the village was 94.7% White, 0.7% Native American, 0.3% Asian, 0.3% from other races, and 4.0% from two or more races. Hispanic or Latino of any race were 4.7% of the population.
The median household income in Eagle Nest was $37,500, and the median family income was $41,250. The per capita income for the village was $17,857. About 11.7% of families and 14.3% of the population were below the poverty line, including 18.2% of those under age 18 and none of those age 65 or over.
Common Questions
What is Per Capita Income in Eagle Nest?
Per Capita income in Eagle Nest is $24,686.
What is the Median Family Income in Eagle Nest?
Median Family Income in Eagle Nest is $58,036.
What is the Median Household income in Eagle Nest?
Median Household Income in Eagle Nest is $43,750.
What is Income or Wage Gap in Eagle Nest?
Income or Wage Gap in Eagle Nest is 8.5%.
Women in Eagle Nest earn 91.5 cents for every dollar earned by a man.
What is Inequality or Gini Index in Eagle Nest?
Inequality or Gini Index in Eagle Nest is 0.33.
What is the Total Population of Eagle Nest?
Total Population of Eagle Nest is 249.
What is the Total Male Population of Eagle Nest?
Total Male Population of Eagle Nest is 111.
What is the Total Female Population of Eagle Nest?
Total Female Population of Eagle Nest is 138.
What is the Ratio of Males per 100 Females in Eagle Nest?
There are 80.43 Males per 100 Females in Eagle Nest.
What is the Ratio of Females per 100 Males in Eagle Nest?
There are 124.32 Females per 100 Males in Eagle Nest.
What is the Median Population Age in Eagle Nest?
Median Population Age in Eagle Nest is 55.3 Years.
What is the Average Family Size in Eagle Nest
Average Family Size in Eagle Nest is 3.3 People.
What is the Average Household Size in Eagle Nest
Average Household Size in Eagle Nest is 2.0 People.
How Large is the Labor Force in Eagle Nest?
There are 93 People in the Labor Forcein in Eagle Nest.
What is the Percentage of People in the Labor Force in Eagle Nest?
47.4% of People are in the Labor Force in Eagle Nest.
What is the Unemployment Rate in Eagle Nest?
Unemployment Rate in Eagle Nest is 23.7%.