Dixon, NM Map & Demographics
Dixon Map
Dixon Overview
$17,260
PER CAPITA INCOME
$33,106
AVG FAMILY INCOME
$33,674
AVG HOUSEHOLD INCOME
68.8%
WAGE / INCOME GAP [ % ]
31.2¢/ $1
WAGE / INCOME GAP [ $ ]
0.47
INEQUALITY / GINI INDEX
1,049
TOTAL POPULATION
501
MALE POPULATION
548
FEMALE POPULATION
91.42
MALES / 100 FEMALES
109.38
FEMALES / 100 MALES
57.7
MEDIAN AGE
4.2
AVG FAMILY SIZE
2.6
AVG HOUSEHOLD SIZE
306
LABOR FORCE [ PEOPLE ]
35.0%
PERCENT IN LABOR FORCE
Dixon Zip Codes
Dixon Area Codes
Income in Dixon
Income Overview in Dixon
Per Capita Income in Dixon is $17,260, while median incomes of families and households are $33,106 and $33,674 respectively.
| Characteristic | Number | Measure |
| Per Capita Income | 1,049 | $17,260 |
| Median Family Income | 196 | $33,106 |
| Mean Family Income | 196 | $32,151 |
| Median Household Income | 399 | $33,674 |
| Mean Household Income | 399 | $39,601 |
| Income Deficit | 196 | $0 |
| Wage / Income Gap (%) | 1,049 | 68.85% |
| Wage / Income Gap ($) | 1,049 | 31.15¢ per $1 |
| Gini / Inequality Index | 1,049 | 0.47 |
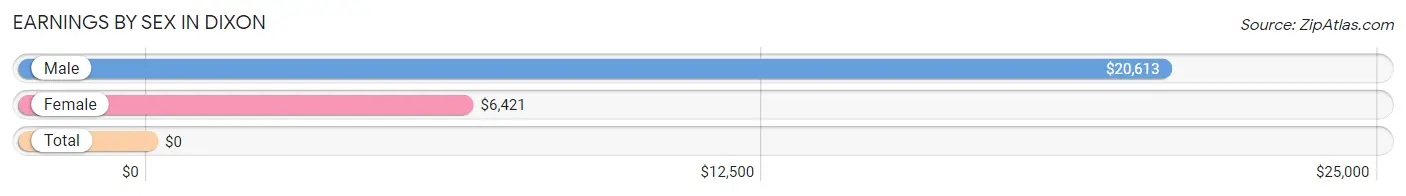
Earnings by Sex in Dixon
| Sex | Number | Average Earnings |
| Male | 245 (64.8%) | $20,613 |
| Female | 133 (35.2%) | $6,421 |
| Total | 378 (100.0%) | $0 |
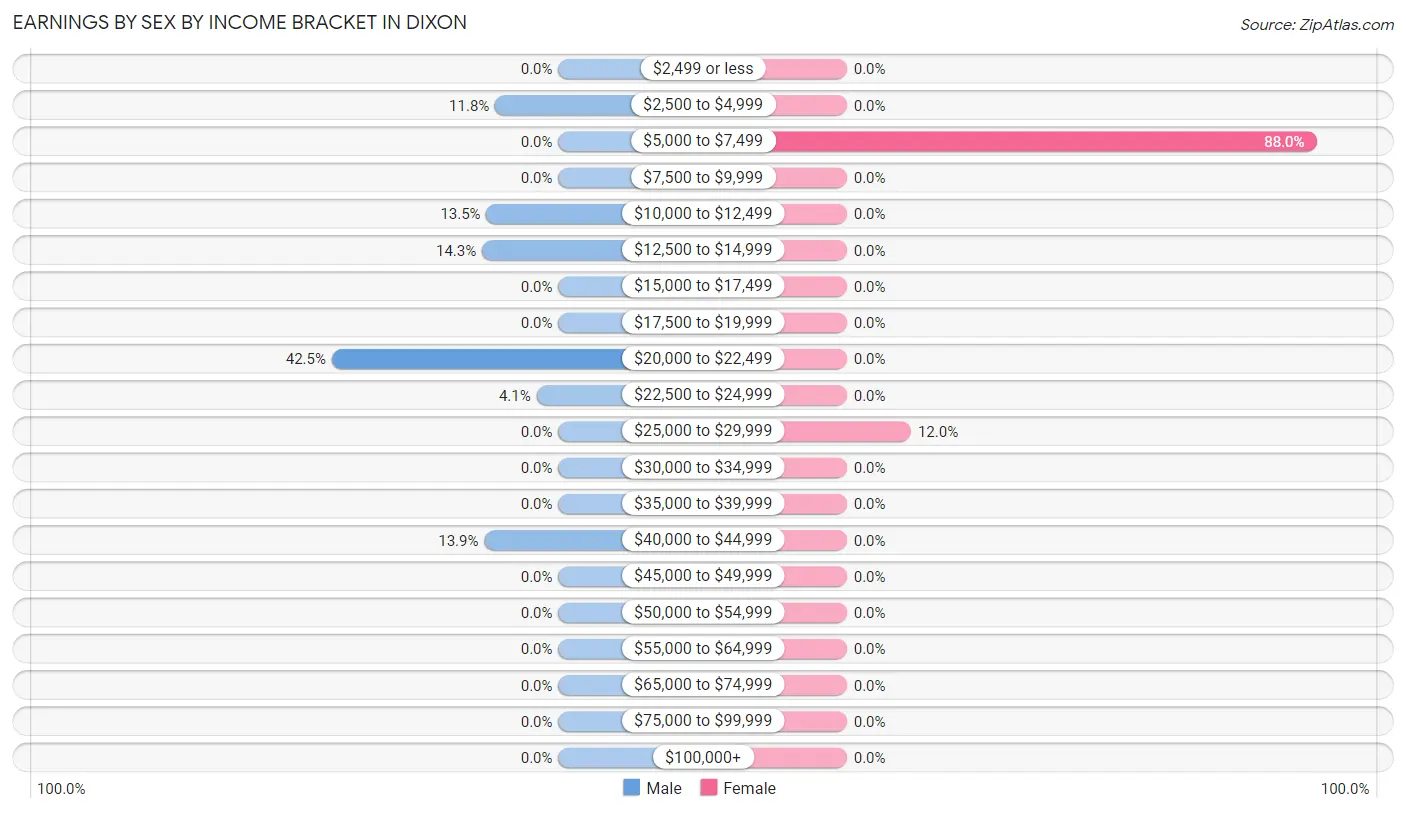
Earnings by Sex by Income Bracket in Dixon
The most common earnings brackets in Dixon are $20,000 to $22,499 for men (104 | 42.4%) and $5,000 to $7,499 for women (117 | 88.0%).
| Income | Male | Female |
| $2,499 or less | 0 (0.0%) | 0 (0.0%) |
| $2,500 to $4,999 | 29 (11.8%) | 0 (0.0%) |
| $5,000 to $7,499 | 0 (0.0%) | 117 (88.0%) |
| $7,500 to $9,999 | 0 (0.0%) | 0 (0.0%) |
| $10,000 to $12,499 | 33 (13.5%) | 0 (0.0%) |
| $12,500 to $14,999 | 35 (14.3%) | 0 (0.0%) |
| $15,000 to $17,499 | 0 (0.0%) | 0 (0.0%) |
| $17,500 to $19,999 | 0 (0.0%) | 0 (0.0%) |
| $20,000 to $22,499 | 104 (42.4%) | 0 (0.0%) |
| $22,500 to $24,999 | 10 (4.1%) | 0 (0.0%) |
| $25,000 to $29,999 | 0 (0.0%) | 16 (12.0%) |
| $30,000 to $34,999 | 0 (0.0%) | 0 (0.0%) |
| $35,000 to $39,999 | 0 (0.0%) | 0 (0.0%) |
| $40,000 to $44,999 | 34 (13.9%) | 0 (0.0%) |
| $45,000 to $49,999 | 0 (0.0%) | 0 (0.0%) |
| $50,000 to $54,999 | 0 (0.0%) | 0 (0.0%) |
| $55,000 to $64,999 | 0 (0.0%) | 0 (0.0%) |
| $65,000 to $74,999 | 0 (0.0%) | 0 (0.0%) |
| $75,000 to $99,999 | 0 (0.0%) | 0 (0.0%) |
| $100,000+ | 0 (0.0%) | 0 (0.0%) |
| Total | 245 (100.0%) | 133 (100.0%) |
Earnings by Sex by Educational Attainment in Dixon
| Educational Attainment | Male Income | Female Income |
| Less than High School | - | - |
| High School Diploma | - | - |
| College or Associate's Degree | - | - |
| Bachelor's Degree | - | - |
| Graduate Degree | - | - |
| Total | $20,493 | $6,558 |
Family Income in Dixon
Family Income Brackets in Dixon
According to the Dixon family income data, there are 62 families falling into the $15,000 to $24,999 income range, which is the most common income bracket and makes up 31.6% of all families.
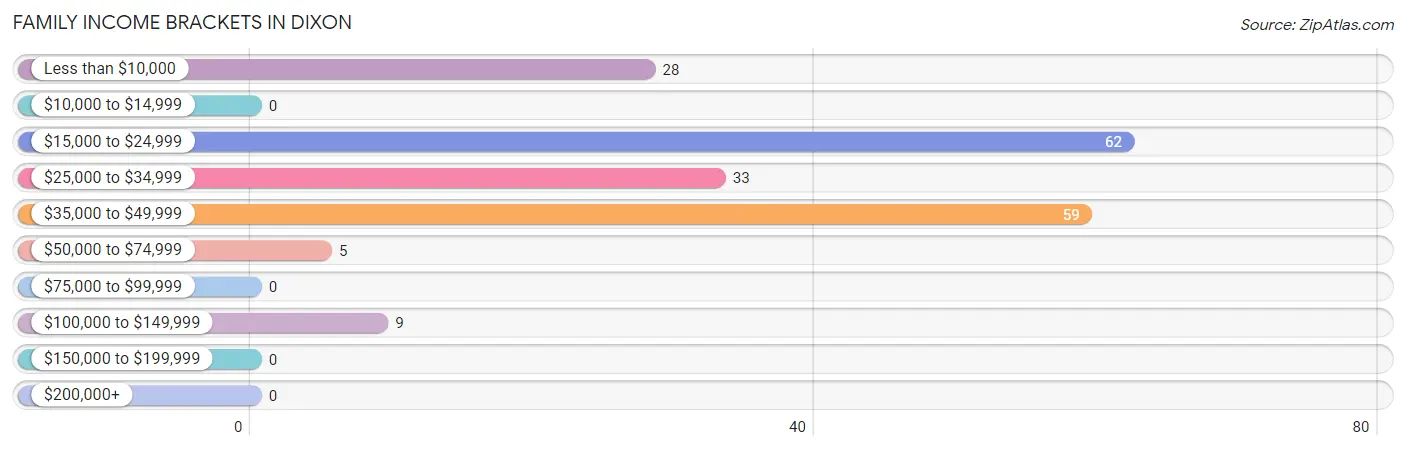
| Income Bracket | # Families | % Families |
| Less than $10,000 | 28 | 14.3% |
| $10,000 to $14,999 | 0 | 0.0% |
| $15,000 to $24,999 | 62 | 31.6% |
| $25,000 to $34,999 | 33 | 16.8% |
| $35,000 to $49,999 | 59 | 30.1% |
| $50,000 to $74,999 | 5 | 2.6% |
| $75,000 to $99,999 | 0 | 0.0% |
| $100,000 to $149,999 | 9 | 4.6% |
| $150,000 to $199,999 | 0 | 0.0% |
| $200,000+ | 0 | 0.0% |
Family Income by Famaliy Size in Dixon
2-person families (129 | 65.8%) account for the highest median family income in Dixon with $37,802 per family, while 2-person families (129 | 65.8%) have the highest median income of $18,901 per family member.
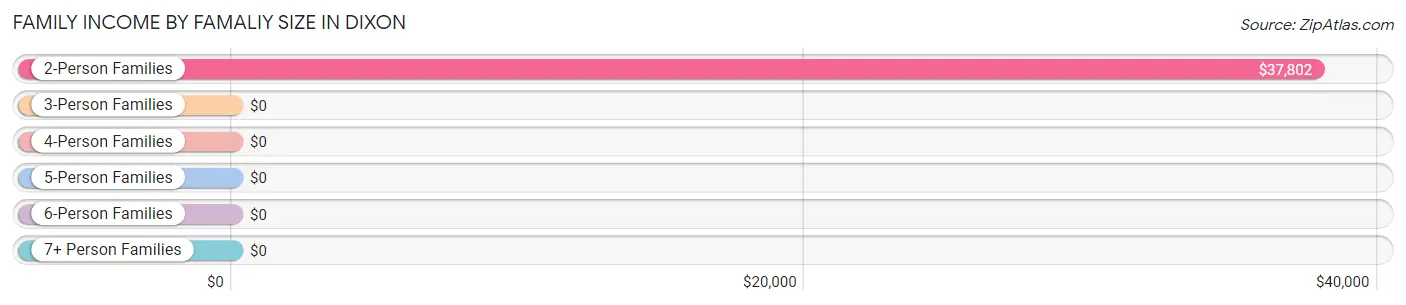
| Income Bracket | # Families | Median Income |
| 2-Person Families | 129 (65.8%) | $37,802 |
| 3-Person Families | 39 (19.9%) | $0 |
| 4-Person Families | 28 (14.3%) | $0 |
| 5-Person Families | 0 (0.0%) | $0 |
| 6-Person Families | 0 (0.0%) | $0 |
| 7+ Person Families | 0 (0.0%) | $0 |
| Total | 196 (100.0%) | $33,106 |
Family Income by Number of Earners in Dixon
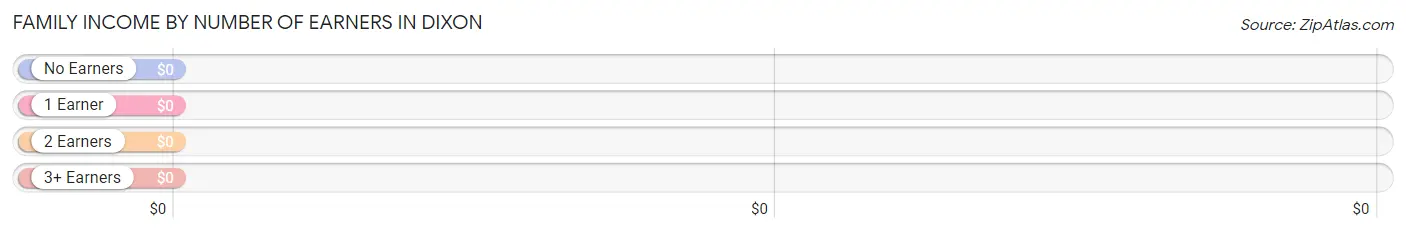
| Number of Earners | # Families | Median Income |
| No Earners | 53 (27.0%) | $0 |
| 1 Earner | 122 (62.2%) | $0 |
| 2 Earners | 21 (10.7%) | $0 |
| 3+ Earners | 0 (0.0%) | $0 |
| Total | 196 (100.0%) | $33,106 |
Household Income in Dixon
Household Income Brackets in Dixon
With 73 households falling in the category, the less than $10,000 income range is the most frequent in Dixon, accounting for 18.3% of all households.
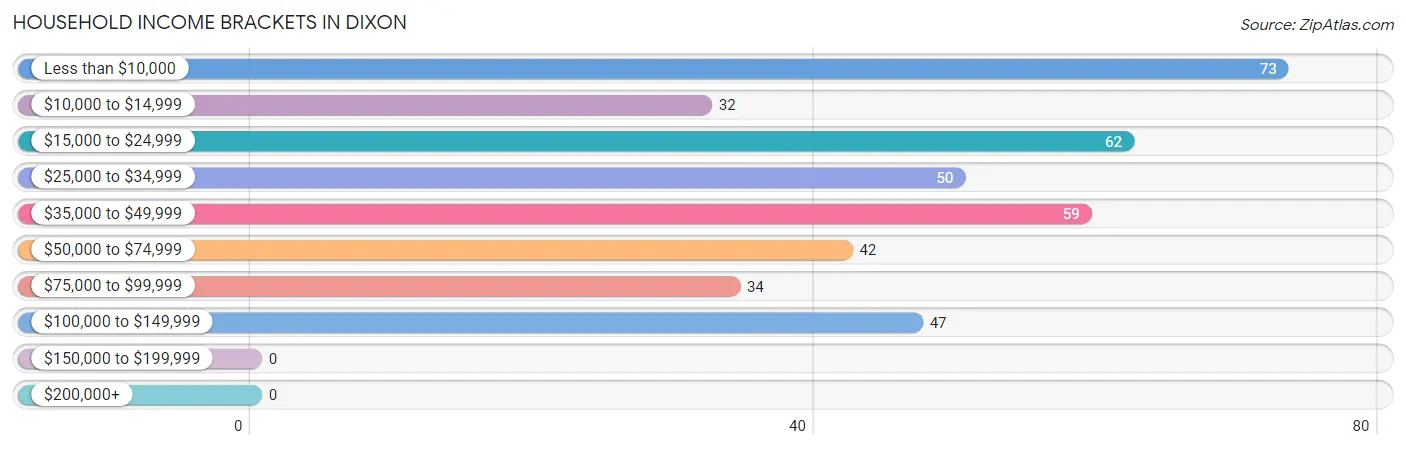
| Income Bracket | # Households | % Households |
| Less than $10,000 | 73 | 18.3% |
| $10,000 to $14,999 | 32 | 8.0% |
| $15,000 to $24,999 | 62 | 15.5% |
| $25,000 to $34,999 | 50 | 12.5% |
| $35,000 to $49,999 | 59 | 14.8% |
| $50,000 to $74,999 | 42 | 10.5% |
| $75,000 to $99,999 | 34 | 8.5% |
| $100,000 to $149,999 | 47 | 11.8% |
| $150,000 to $199,999 | 0 | 0.0% |
| $200,000+ | 0 | 0.0% |
Household Income by Householder Age in Dixon
The median household income in Dixon is $33,674, with the highest median household income of $44,250 found in the 65+ years age bracket for the primary householder. A total of 264 households (66.2%) fall into this category.
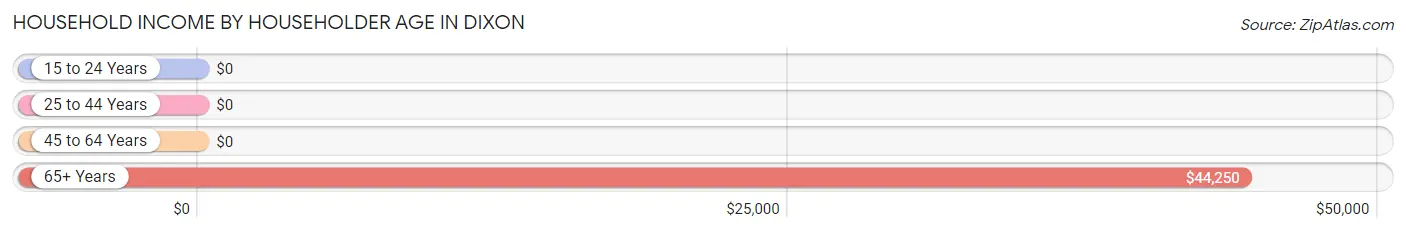
| Income Bracket | # Households | Median Income |
| 15 to 24 Years | 0 (0.0%) | $0 |
| 25 to 44 Years | 63 (15.8%) | $0 |
| 45 to 64 Years | 72 (18.0%) | $0 |
| 65+ Years | 264 (66.2%) | $44,250 |
| Total | 399 (100.0%) | $33,674 |
Poverty in Dixon
Income Below Poverty by Sex and Age in Dixon
With 34.1% poverty level for males and 66.2% for females among the residents of Dixon, 6 to 11 year old males and 5 year old females are the most vulnerable to poverty, with 40 males (100.0%) and 86 females (100.0%) in their respective age groups living below the poverty level.
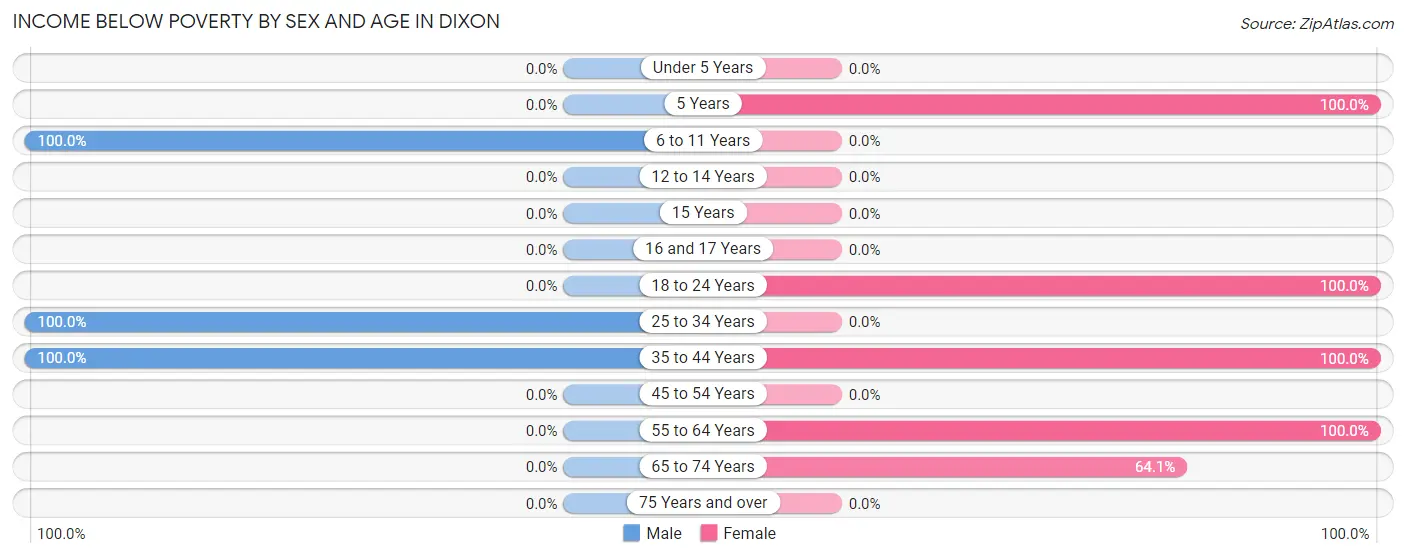
| Age Bracket | Male | Female |
| Under 5 Years | 0 (0.0%) | 0 (0.0%) |
| 5 Years | 0 (0.0%) | 86 (100.0%) |
| 6 to 11 Years | 40 (100.0%) | 0 (0.0%) |
| 12 to 14 Years | 0 (0.0%) | 0 (0.0%) |
| 15 Years | 0 (0.0%) | 0 (0.0%) |
| 16 and 17 Years | 0 (0.0%) | 0 (0.0%) |
| 18 to 24 Years | 0 (0.0%) | 52 (100.0%) |
| 25 to 34 Years | 24 (100.0%) | 0 (0.0%) |
| 35 to 44 Years | 107 (100.0%) | 28 (100.0%) |
| 45 to 54 Years | 0 (0.0%) | 0 (0.0%) |
| 55 to 64 Years | 0 (0.0%) | 72 (100.0%) |
| 65 to 74 Years | 0 (0.0%) | 125 (64.1%) |
| 75 Years and over | 0 (0.0%) | 0 (0.0%) |
| Total | 171 (34.1%) | 363 (66.2%) |
Income Above Poverty by Sex and Age in Dixon
According to the poverty statistics in Dixon, males aged under 5 years and females aged 25 to 34 years are the age groups that are most secure financially, with 100.0% of males and 100.0% of females in these age groups living above the poverty line.
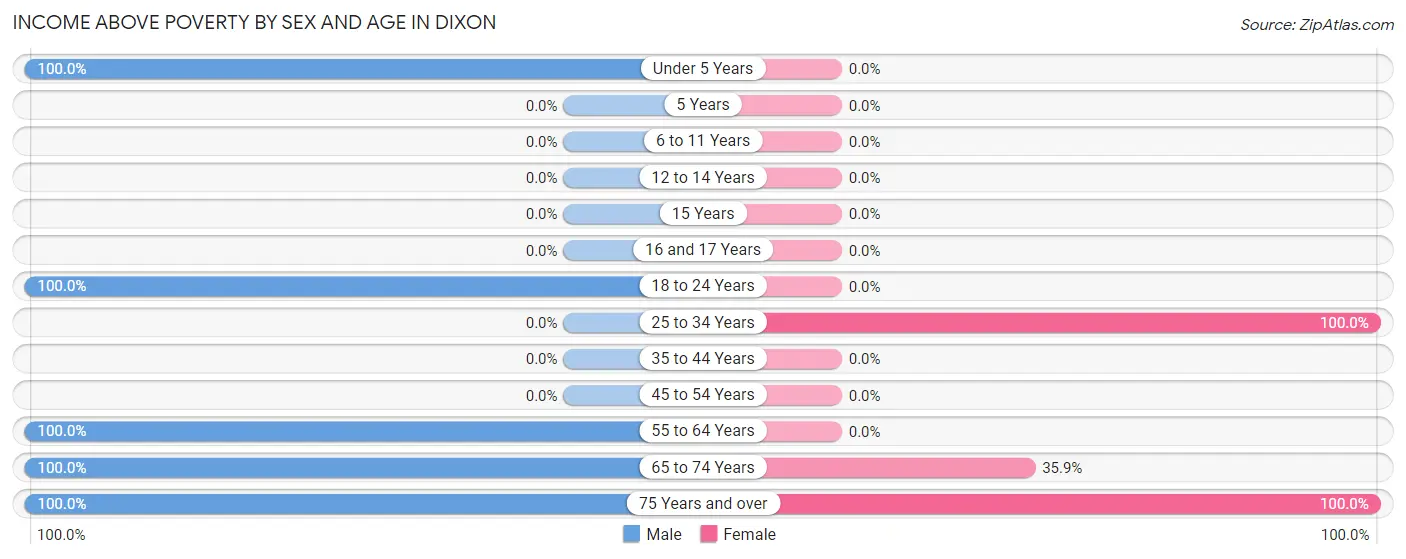
| Age Bracket | Male | Female |
| Under 5 Years | 48 (100.0%) | 0 (0.0%) |
| 5 Years | 0 (0.0%) | 0 (0.0%) |
| 6 to 11 Years | 0 (0.0%) | 0 (0.0%) |
| 12 to 14 Years | 0 (0.0%) | 0 (0.0%) |
| 15 Years | 0 (0.0%) | 0 (0.0%) |
| 16 and 17 Years | 0 (0.0%) | 0 (0.0%) |
| 18 to 24 Years | 10 (100.0%) | 0 (0.0%) |
| 25 to 34 Years | 0 (0.0%) | 60 (100.0%) |
| 35 to 44 Years | 0 (0.0%) | 0 (0.0%) |
| 45 to 54 Years | 0 (0.0%) | 0 (0.0%) |
| 55 to 64 Years | 104 (100.0%) | 0 (0.0%) |
| 65 to 74 Years | 66 (100.0%) | 70 (35.9%) |
| 75 Years and over | 102 (100.0%) | 55 (100.0%) |
| Total | 330 (65.9%) | 185 (33.8%) |
Income Below Poverty Among Married-Couple Families in Dixon
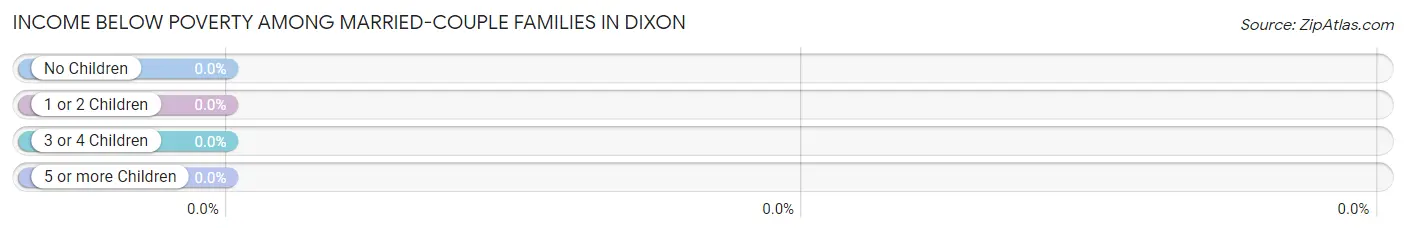
| Children | Above Poverty | Below Poverty |
| No Children | 69 (100.0%) | 0 (0.0%) |
| 1 or 2 Children | 0 (0.0%) | 0 (0.0%) |
| 3 or 4 Children | 0 (0.0%) | 0 (0.0%) |
| 5 or more Children | 0 (0.0%) | 0 (0.0%) |
| Total | 69 (100.0%) | 0 (0.0%) |
Income Below Poverty Among Single-Parent Households in Dixon
According to the poverty data in Dixon, 53.8% or 35 single-father households and 88.7% or 55 single-mother households are living below the poverty line. Among single-father households, those with no children have the highest poverty rate, with 35 households (53.8%) experiencing poverty. Likewise, among single-mother households, those with 1 or 2 children have the highest poverty rate, with 55 households (88.7%) falling below the poverty line.
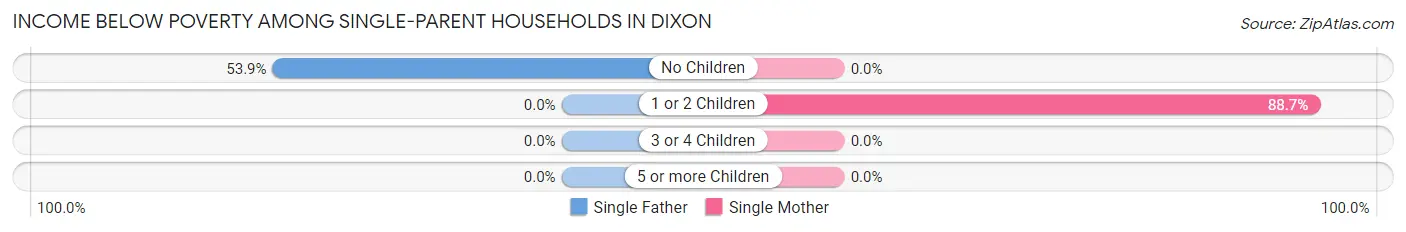
| Children | Single Father | Single Mother |
| No Children | 35 (53.8%) | 0 (0.0%) |
| 1 or 2 Children | 0 (0.0%) | 55 (88.7%) |
| 3 or 4 Children | 0 (0.0%) | 0 (0.0%) |
| 5 or more Children | 0 (0.0%) | 0 (0.0%) |
| Total | 35 (53.8%) | 55 (88.7%) |
Income Below Poverty Among Married-Couple vs Single-Parent Households in Dixon
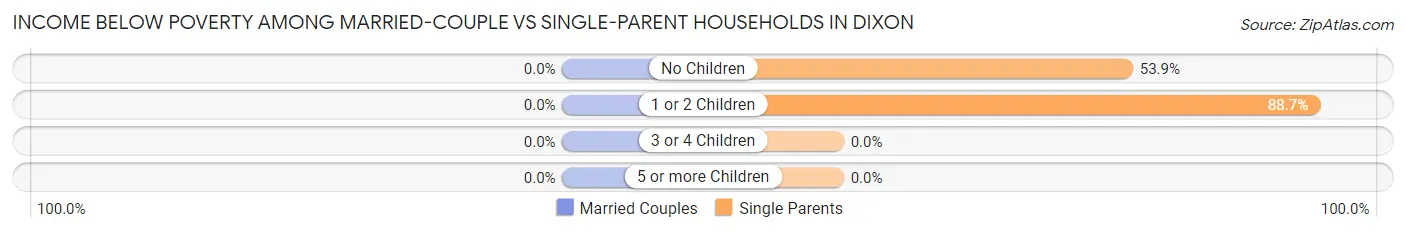
| Children | Married-Couple Families | Single-Parent Households |
| No Children | 0 (0.0%) | 35 (53.8%) |
| 1 or 2 Children | 0 (0.0%) | 55 (88.7%) |
| 3 or 4 Children | 0 (0.0%) | 0 (0.0%) |
| 5 or more Children | 0 (0.0%) | 0 (0.0%) |
| Total | 0 (0.0%) | 90 (70.9%) |
Race in Dixon
The most populous races in Dixon are White / Caucasian (648 | 61.8%), Hispanic or Latino (633 | 60.3%), and Two or more Races (262 | 25.0%).
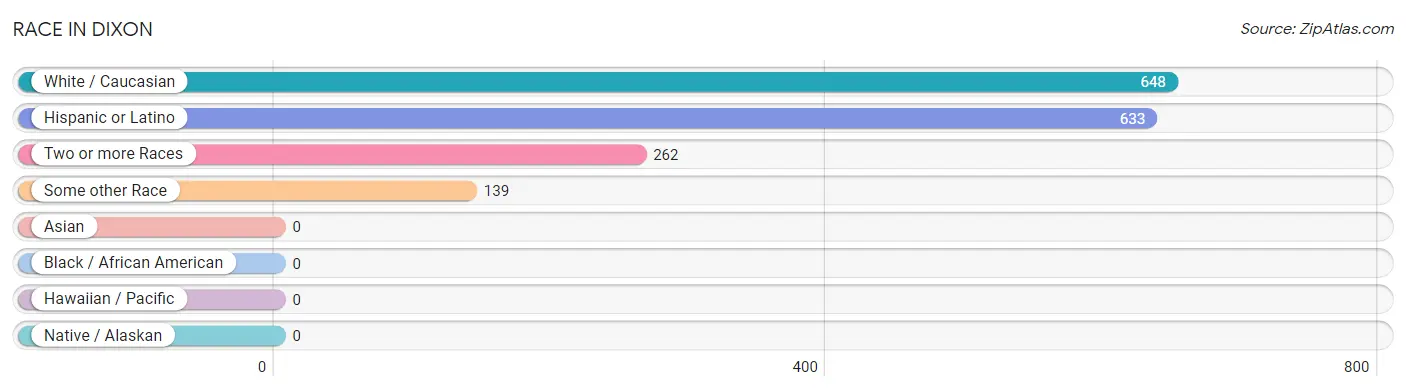
| Race | # Population | % Population |
| Asian | 0 | 0.0% |
| Black / African American | 0 | 0.0% |
| Hawaiian / Pacific | 0 | 0.0% |
| Hispanic or Latino | 633 | 60.3% |
| Native / Alaskan | 0 | 0.0% |
| White / Caucasian | 648 | 61.8% |
| Two or more Races | 262 | 25.0% |
| Some other Race | 139 | 13.3% |
| Total | 1,049 | 100.0% |
Ancestry in Dixon
The most populous ancestries reported in Dixon are Spanish (300 | 28.6%), Irish (166 | 15.8%), German (162 | 15.4%), Spaniard (139 | 13.3%), and Russian (108 | 10.3%), together accounting for 83.4% of all Dixon residents.
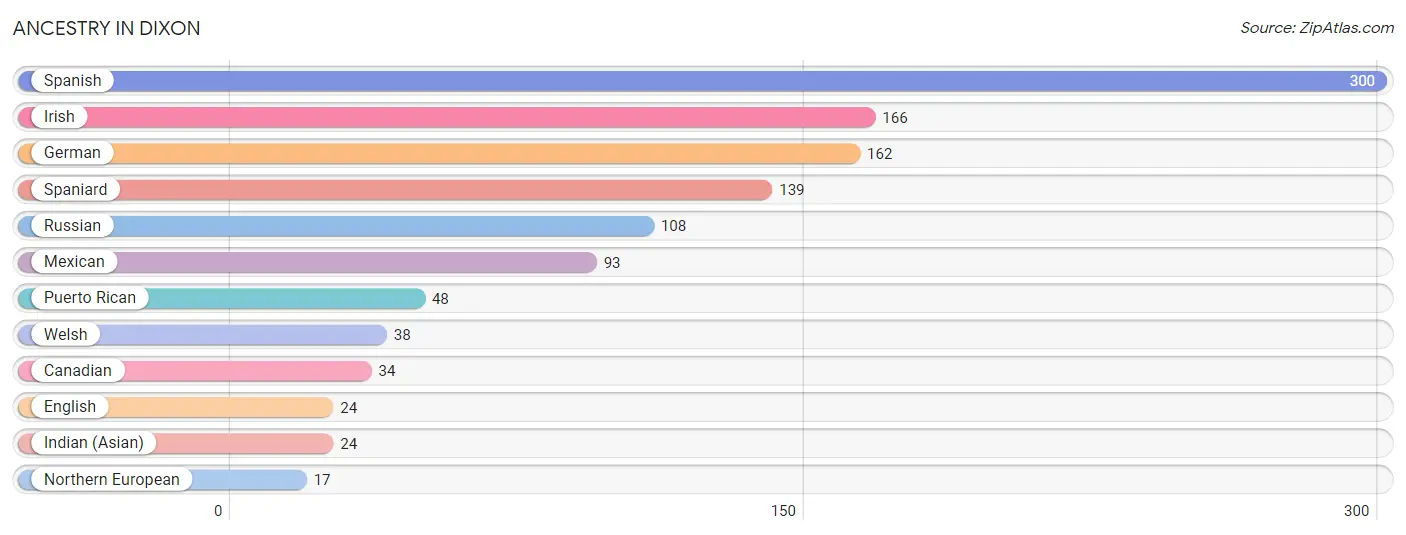
| Ancestry | # Population | % Population |
| Canadian | 34 | 3.2% |
| English | 24 | 2.3% |
| German | 162 | 15.4% |
| Indian (Asian) | 24 | 2.3% |
| Irish | 166 | 15.8% |
| Mexican | 93 | 8.9% |
| Northern European | 17 | 1.6% |
| Puerto Rican | 48 | 4.6% |
| Russian | 108 | 10.3% |
| Spaniard | 139 | 13.3% |
| Spanish | 300 | 28.6% |
| Welsh | 38 | 3.6% | View All 12 Rows |
Immigrants in Dixon
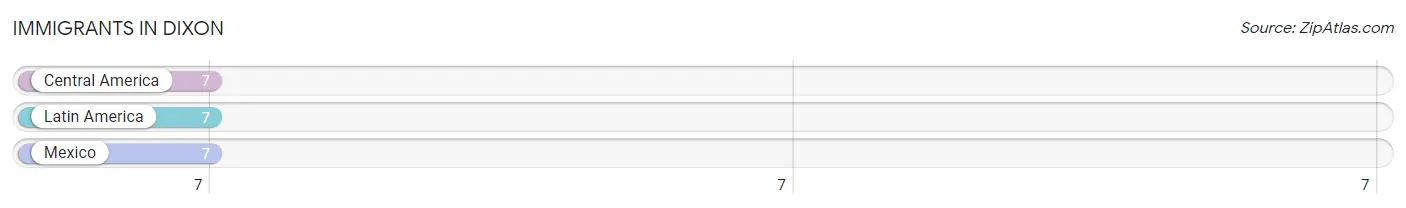
The most numerous immigrant groups reported in Dixon came from Central America (7 | 0.7%), Latin America (7 | 0.7%), and Mexico (7 | 0.7%), together accounting for 2.0% of all Dixon residents.
| Immigration Origin | # Population | % Population |
| Central America | 7 | 0.7% |
| Latin America | 7 | 0.7% |
| Mexico | 7 | 0.7% | View All 3 Rows |
Sex and Age in Dixon
Sex and Age in Dixon
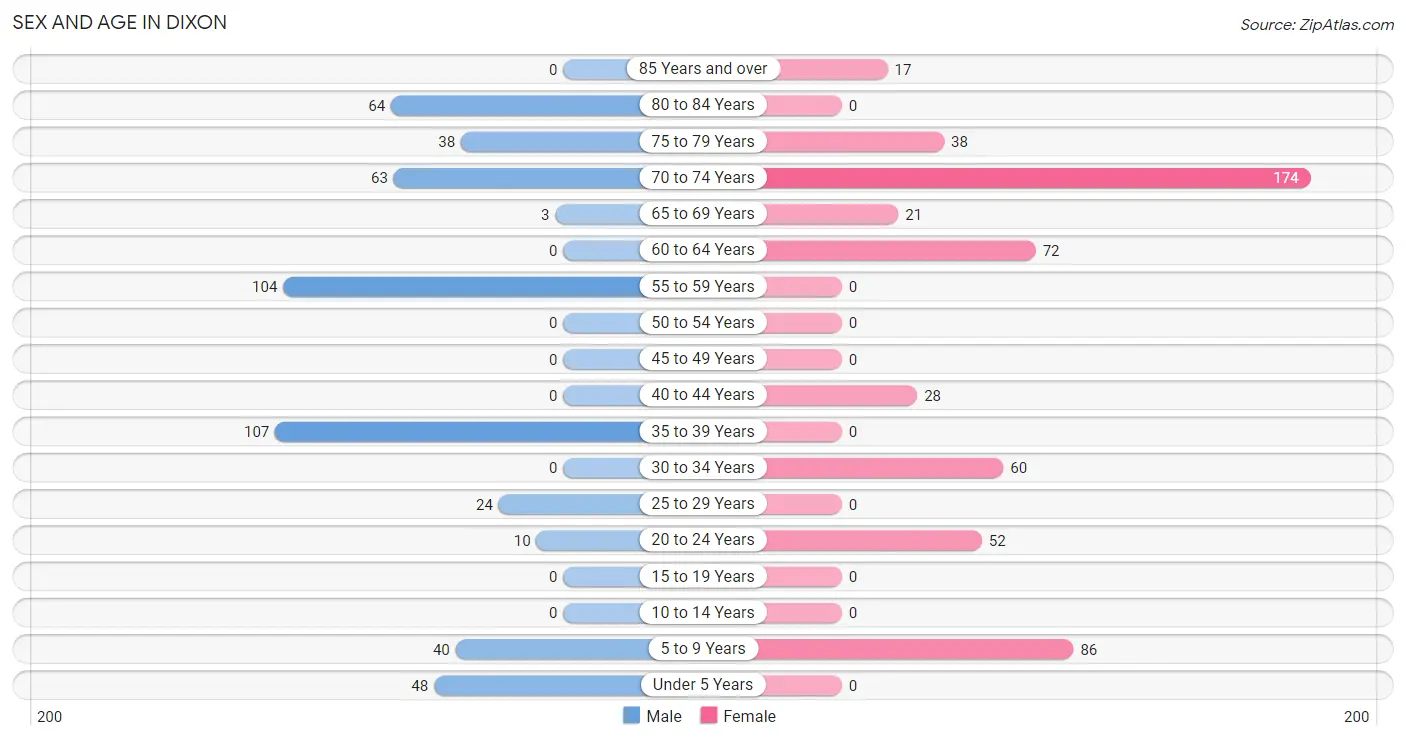
The most populous age groups in Dixon are 35 to 39 Years (107 | 21.4%) for men and 70 to 74 Years (174 | 31.8%) for women.
| Age Bracket | Male | Female |
| Under 5 Years | 48 (9.6%) | 0 (0.0%) |
| 5 to 9 Years | 40 (8.0%) | 86 (15.7%) |
| 10 to 14 Years | 0 (0.0%) | 0 (0.0%) |
| 15 to 19 Years | 0 (0.0%) | 0 (0.0%) |
| 20 to 24 Years | 10 (2.0%) | 52 (9.5%) |
| 25 to 29 Years | 24 (4.8%) | 0 (0.0%) |
| 30 to 34 Years | 0 (0.0%) | 60 (11.0%) |
| 35 to 39 Years | 107 (21.4%) | 0 (0.0%) |
| 40 to 44 Years | 0 (0.0%) | 28 (5.1%) |
| 45 to 49 Years | 0 (0.0%) | 0 (0.0%) |
| 50 to 54 Years | 0 (0.0%) | 0 (0.0%) |
| 55 to 59 Years | 104 (20.8%) | 0 (0.0%) |
| 60 to 64 Years | 0 (0.0%) | 72 (13.1%) |
| 65 to 69 Years | 3 (0.6%) | 21 (3.8%) |
| 70 to 74 Years | 63 (12.6%) | 174 (31.8%) |
| 75 to 79 Years | 38 (7.6%) | 38 (6.9%) |
| 80 to 84 Years | 64 (12.8%) | 0 (0.0%) |
| 85 Years and over | 0 (0.0%) | 17 (3.1%) |
| Total | 501 (100.0%) | 548 (100.0%) |
Families and Households in Dixon
Median Family Size in Dixon
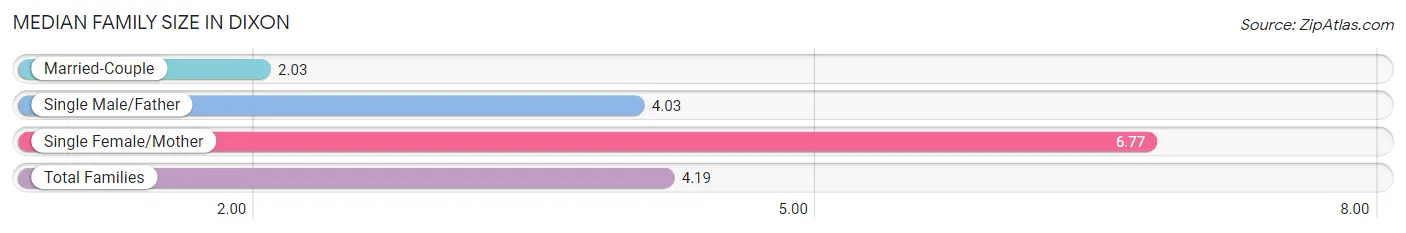
The median family size in Dixon is 4.19 persons per family, with single female/mother families (62 | 31.6%) accounting for the largest median family size of 6.77 persons per family. On the other hand, married-couple families (69 | 35.2%) represent the smallest median family size with 2.03 persons per family.
| Family Type | # Families | Family Size |
| Married-Couple | 69 (35.2%) | 2.03 |
| Single Male/Father | 65 (33.2%) | 4.03 |
| Single Female/Mother | 62 (31.6%) | 6.77 |
| Total Families | 196 (100.0%) | 4.19 |
Median Household Size in Dixon
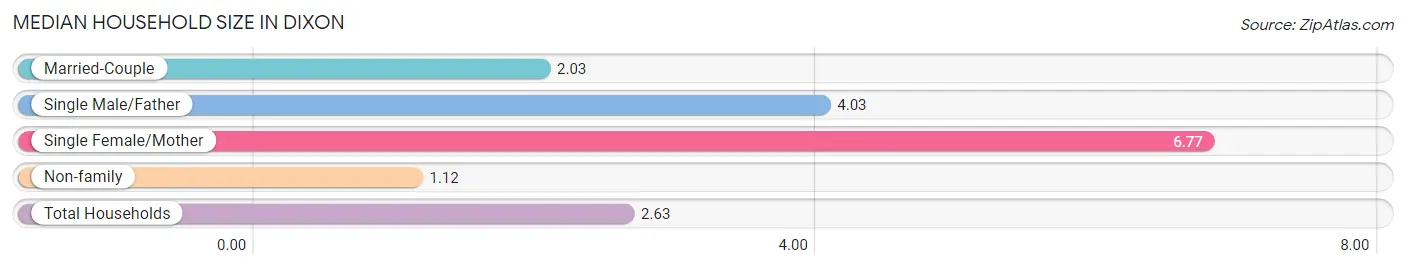
The median household size in Dixon is 2.63 persons per household, with single female/mother households (62 | 15.5%) accounting for the largest median household size of 6.77 persons per household. non-family households (203 | 50.9%) represent the smallest median household size with 1.12 persons per household.
| Household Type | # Households | Household Size |
| Married-Couple | 69 (17.3%) | 2.03 |
| Single Male/Father | 65 (16.3%) | 4.03 |
| Single Female/Mother | 62 (15.5%) | 6.77 |
| Non-family | 203 (50.9%) | 1.12 |
| Total Households | 399 (100.0%) | 2.63 |
Household Size by Marriage Status in Dixon
Out of a total of 399 households in Dixon, 196 (49.1%) are family households, while 203 (50.9%) are nonfamily households. The most numerous type of family households are 2-person households, comprising 129, and the most common type of nonfamily households are 1-person households, comprising 169.
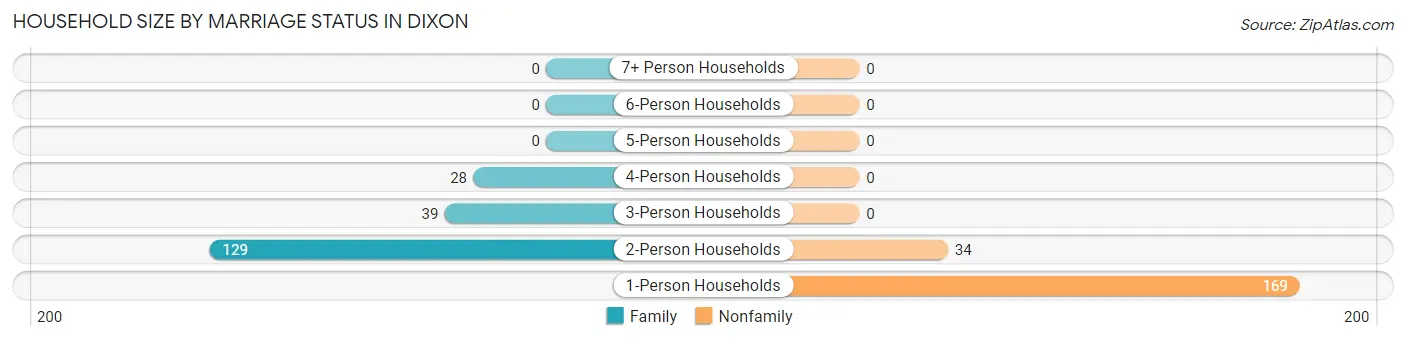
| Household Size | Family Households | Nonfamily Households |
| 1-Person Households | - | 169 (42.4%) |
| 2-Person Households | 129 (32.3%) | 34 (8.5%) |
| 3-Person Households | 39 (9.8%) | 0 (0.0%) |
| 4-Person Households | 28 (7.0%) | 0 (0.0%) |
| 5-Person Households | 0 (0.0%) | 0 (0.0%) |
| 6-Person Households | 0 (0.0%) | 0 (0.0%) |
| 7+ Person Households | 0 (0.0%) | 0 (0.0%) |
| Total | 196 (49.1%) | 203 (50.9%) |
Female Fertility in Dixon
Fertility by Age in Dixon
Average fertility rate in Dixon is 429.0 births per 1,000 women. Women in the age bracket of 20 to 34 years have the highest fertility rate with 536.0 births per 1,000 women. Women in the age bracket of 20 to 34 years acount for 100.0% of all women with births.
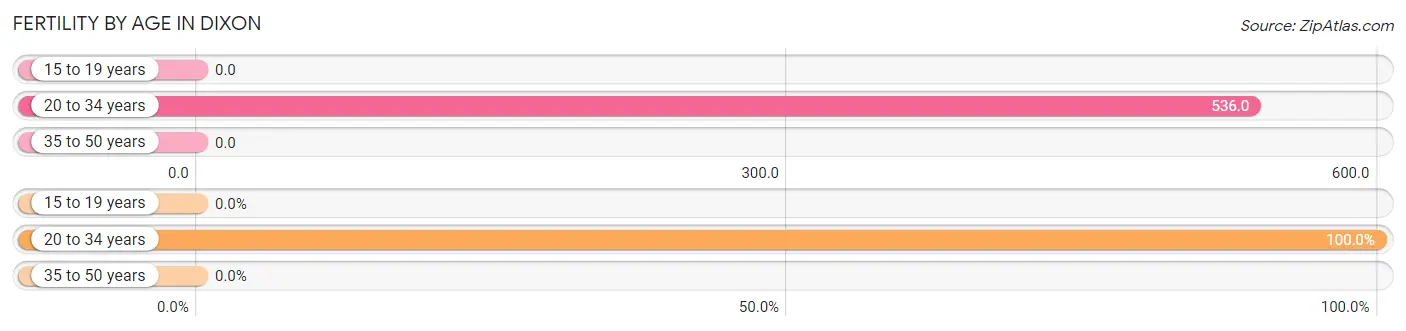
| Age Bracket | Women with Births | Births / 1,000 Women |
| 15 to 19 years | 0 (0.0%) | 0.0 |
| 20 to 34 years | 60 (100.0%) | 536.0 |
| 35 to 50 years | 0 (0.0%) | 0.0 |
| Total | 60 (100.0%) | 429.0 |
Fertility by Age by Marriage Status in Dixon
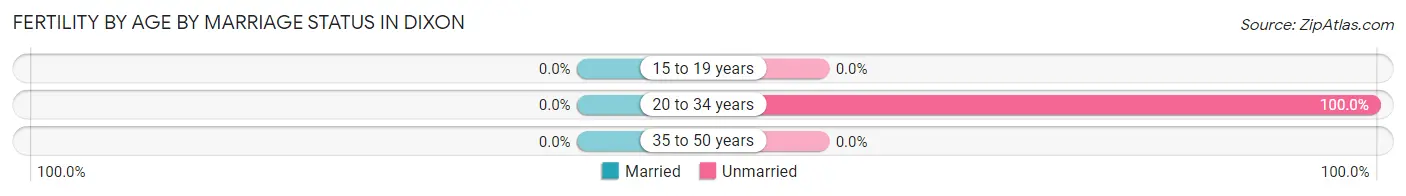
| Age Bracket | Married | Unmarried |
| 15 to 19 years | 0 (0.0%) | 0 (0.0%) |
| 20 to 34 years | 0 (0.0%) | 60 (100.0%) |
| 35 to 50 years | 0 (0.0%) | 0 (0.0%) |
| Total | 0 (0.0%) | 60 (100.0%) |
Fertility by Education in Dixon
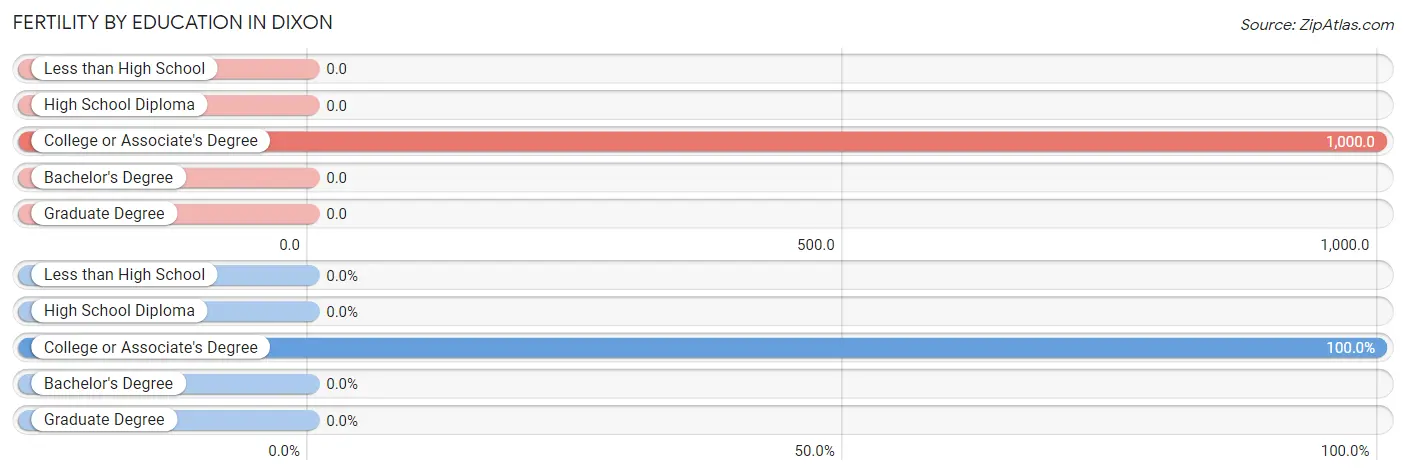
| Educational Attainment | Women with Births | Births / 1,000 Women |
| Less than High School | 0 (0.0%) | 0.0 |
| High School Diploma | 0 (0.0%) | 0.0 |
| College or Associate's Degree | 60 (100.0%) | 1,000.0 |
| Bachelor's Degree | 0 (0.0%) | 0.0 |
| Graduate Degree | 0 (0.0%) | 0.0 |
| Total | 60 (100.0%) | 429.0 |
Fertility by Education by Marriage Status in Dixon
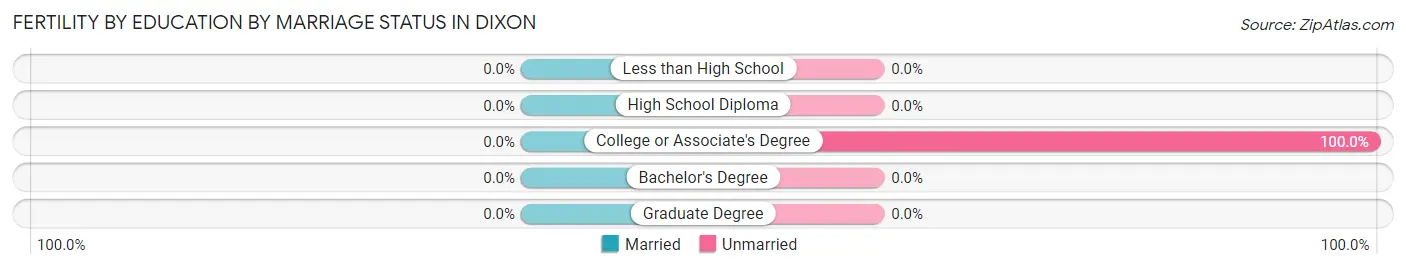
| Educational Attainment | Married | Unmarried |
| Less than High School | 0 (0.0%) | 0 (0.0%) |
| High School Diploma | 0 (0.0%) | 0 (0.0%) |
| College or Associate's Degree | 0 (0.0%) | 60 (100.0%) |
| Bachelor's Degree | 0 (0.0%) | 0 (0.0%) |
| Graduate Degree | 0 (0.0%) | 0 (0.0%) |
| Total | 0 (0.0%) | 60 (100.0%) |
Employment Characteristics in Dixon
Employment by Class of Employer in Dixon
Among the 271 employed individuals in Dixon, self-employed (incorporated) (122 | 45.0%), private company employees (97 | 35.8%), and federal government employees (52 | 19.2%) make up the most common classes of employment.
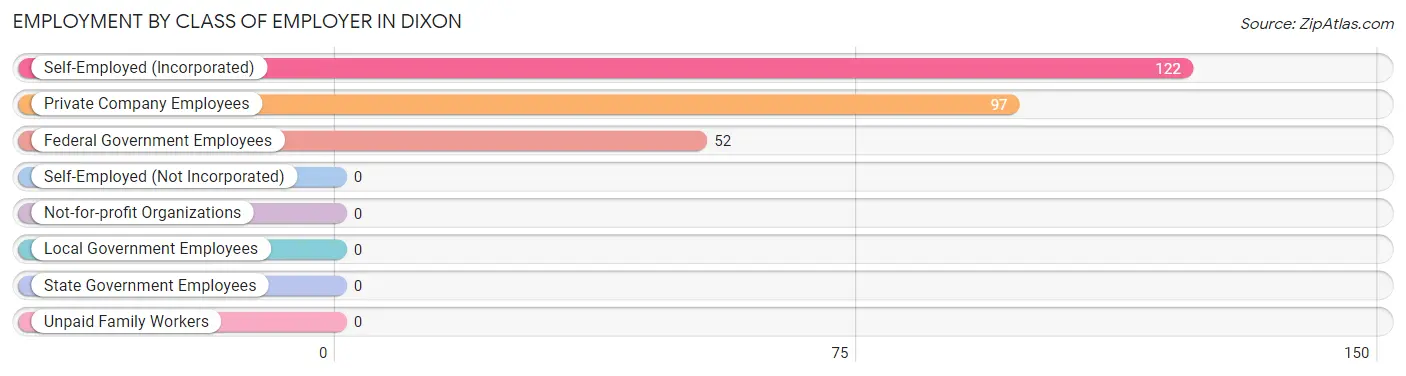
| Employer Class | # Employees | % Employees |
| Private Company Employees | 97 | 35.8% |
| Self-Employed (Incorporated) | 122 | 45.0% |
| Self-Employed (Not Incorporated) | 0 | 0.0% |
| Not-for-profit Organizations | 0 | 0.0% |
| Local Government Employees | 0 | 0.0% |
| State Government Employees | 0 | 0.0% |
| Federal Government Employees | 52 | 19.2% |
| Unpaid Family Workers | 0 | 0.0% |
| Total | 271 | 100.0% |
Employment Status by Age in Dixon
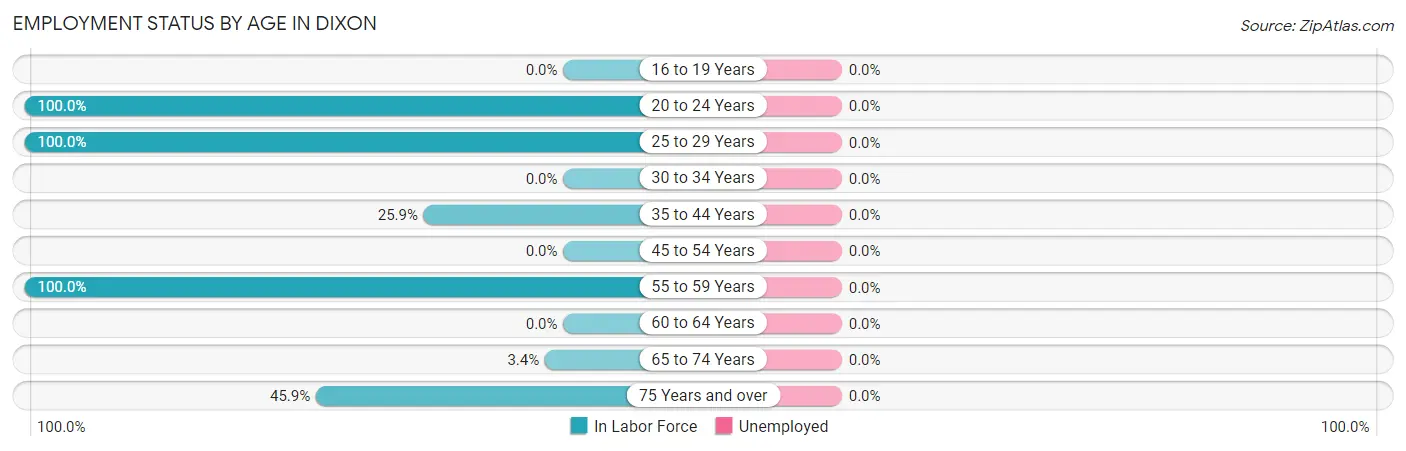
| Age Bracket | In Labor Force | Unemployed |
| 16 to 19 Years | 0 (0.0%) | 0 (0.0%) |
| 20 to 24 Years | 62 (100.0%) | 0 (0.0%) |
| 25 to 29 Years | 24 (100.0%) | 0 (0.0%) |
| 30 to 34 Years | 0 (0.0%) | 0 (0.0%) |
| 35 to 44 Years | 35 (25.9%) | 0 (0.0%) |
| 45 to 54 Years | 0 (0.0%) | 0 (0.0%) |
| 55 to 59 Years | 104 (100.0%) | 0 (0.0%) |
| 60 to 64 Years | 0 (0.0%) | 0 (0.0%) |
| 65 to 74 Years | 9 (3.4%) | 0 (0.0%) |
| 75 Years and over | 72 (45.9%) | 0 (0.0%) |
| Total | 306 (35.0%) | 0 (0.0%) |
Employment Status by Educational Attainment in Dixon
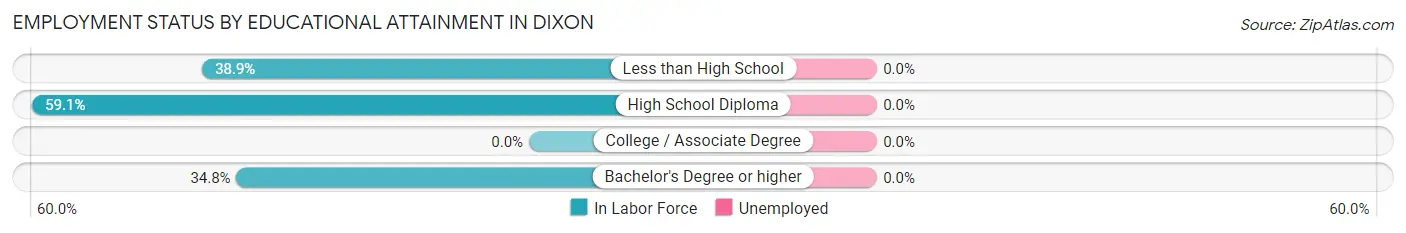
| Educational Attainment | In Labor Force | Unemployed |
| Less than High School | 35 (38.9%) | 0 (0.0%) |
| High School Diploma | 104 (59.1%) | 0 (0.0%) |
| College / Associate Degree | 0 (0.0%) | 0 (0.0%) |
| Bachelor's Degree or higher | 24 (34.8%) | 0 (0.0%) |
| Total | 163 (41.3%) | 0 (0.0%) |
Employment Occupations by Sex in Dixon
Management, Business, Science and Arts Occupations
The most common Management, Business, Science and Arts occupations in Dixon are Community & Social Service (34 | 11.1%), Education Instruction & Library (34 | 11.1%), and Business & Financial (9 | 2.9%).
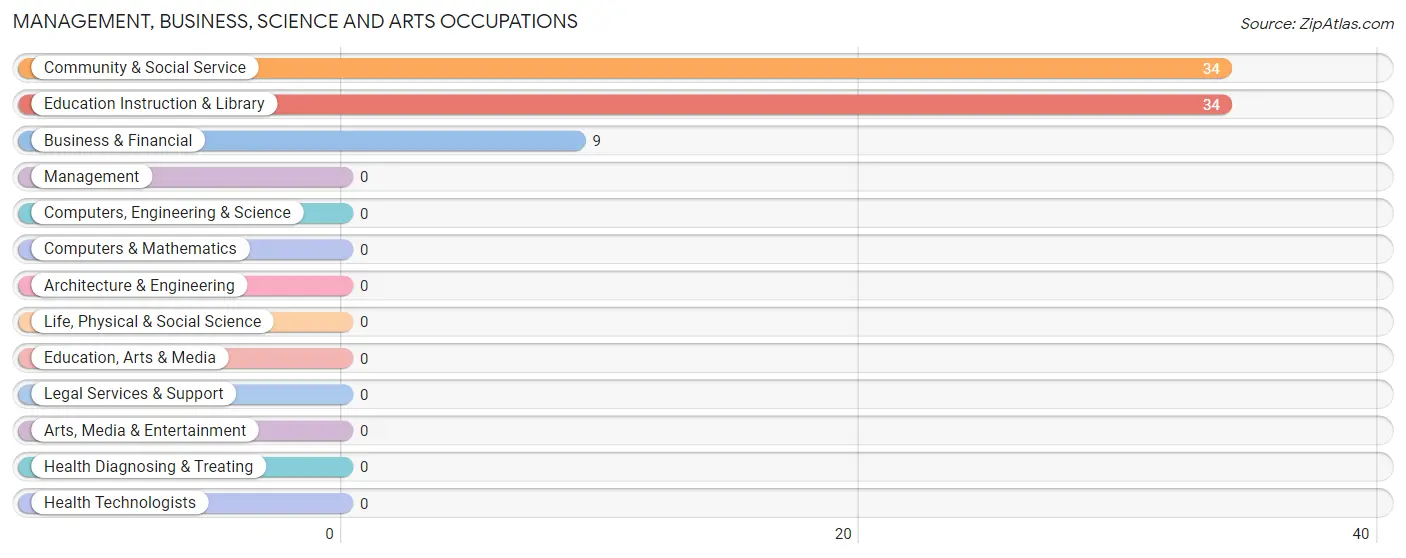
Management, Business, Science and Arts Occupations by Sex
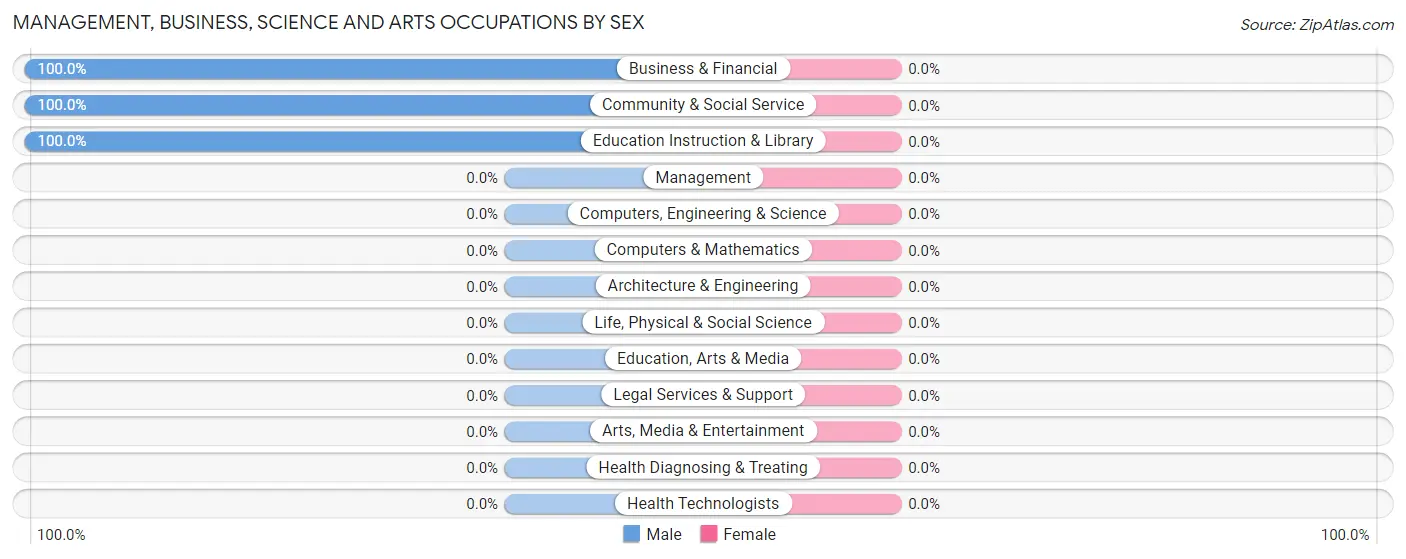
| Occupation | Male | Female |
| Management | 0 (0.0%) | 0 (0.0%) |
| Business & Financial | 9 (100.0%) | 0 (0.0%) |
| Computers, Engineering & Science | 0 (0.0%) | 0 (0.0%) |
| Computers & Mathematics | 0 (0.0%) | 0 (0.0%) |
| Architecture & Engineering | 0 (0.0%) | 0 (0.0%) |
| Life, Physical & Social Science | 0 (0.0%) | 0 (0.0%) |
| Community & Social Service | 34 (100.0%) | 0 (0.0%) |
| Education, Arts & Media | 0 (0.0%) | 0 (0.0%) |
| Legal Services & Support | 0 (0.0%) | 0 (0.0%) |
| Education Instruction & Library | 34 (100.0%) | 0 (0.0%) |
| Arts, Media & Entertainment | 0 (0.0%) | 0 (0.0%) |
| Health Diagnosing & Treating | 0 (0.0%) | 0 (0.0%) |
| Health Technologists | 0 (0.0%) | 0 (0.0%) |
| Total (Category) | 43 (100.0%) | 0 (0.0%) |
| Total (Overall) | 245 (80.1%) | 61 (19.9%) |
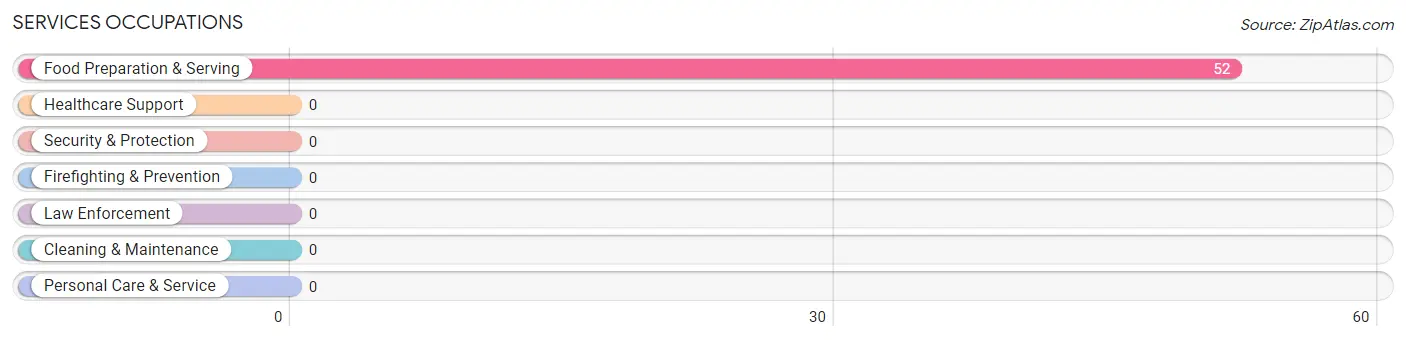
Services Occupations
The most common Services occupations in Dixon are , and Food Preparation & Serving (52 | 17.0%).
Services Occupations by Sex
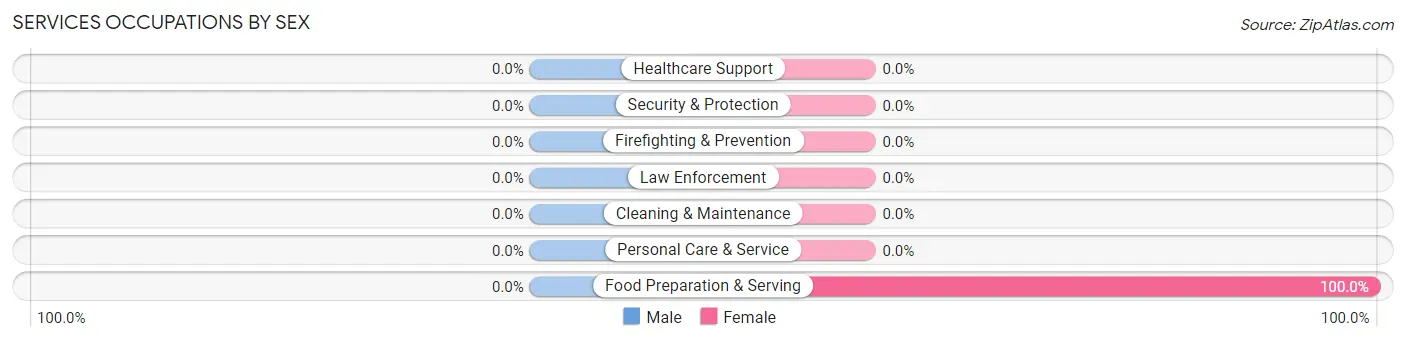
| Occupation | Male | Female |
| Healthcare Support | 0 (0.0%) | 0 (0.0%) |
| Security & Protection | 0 (0.0%) | 0 (0.0%) |
| Firefighting & Prevention | 0 (0.0%) | 0 (0.0%) |
| Law Enforcement | 0 (0.0%) | 0 (0.0%) |
| Food Preparation & Serving | 0 (0.0%) | 52 (100.0%) |
| Cleaning & Maintenance | 0 (0.0%) | 0 (0.0%) |
| Personal Care & Service | 0 (0.0%) | 0 (0.0%) |
| Total (Category) | 0 (0.0%) | 52 (100.0%) |
| Total (Overall) | 245 (80.1%) | 61 (19.9%) |
Sales and Office Occupations
Sales and Office Occupations by Sex
| Occupation | Male | Female |
| Sales & Related | 0 (0.0%) | 0 (0.0%) |
| Office & Administration | 0 (0.0%) | 0 (0.0%) |
| Total (Category) | 0 (0.0%) | 0 (0.0%) |
| Total (Overall) | 245 (80.1%) | 61 (19.9%) |
Natural Resources, Construction and Maintenance Occupations
The most common Natural Resources, Construction and Maintenance occupations in Dixon are Construction & Extraction (139 | 45.4%), and Farming, Fishing & Forestry (24 | 7.8%).
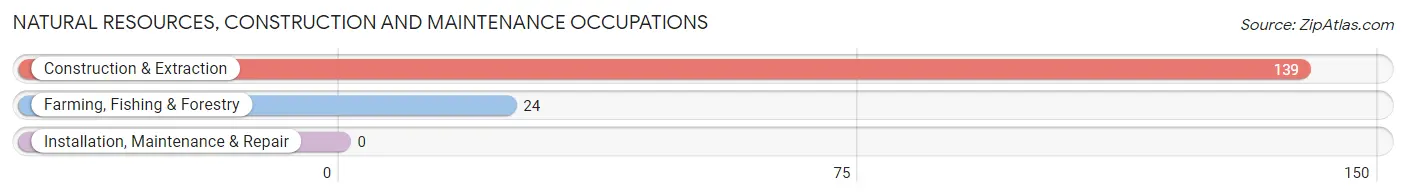
Natural Resources, Construction and Maintenance Occupations by Sex
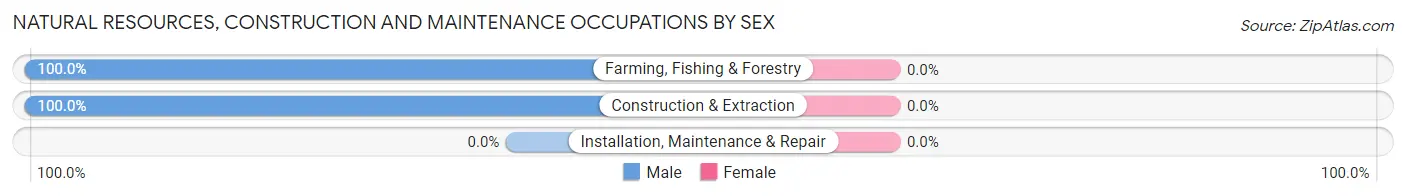
| Occupation | Male | Female |
| Farming, Fishing & Forestry | 24 (100.0%) | 0 (0.0%) |
| Construction & Extraction | 139 (100.0%) | 0 (0.0%) |
| Installation, Maintenance & Repair | 0 (0.0%) | 0 (0.0%) |
| Total (Category) | 163 (100.0%) | 0 (0.0%) |
| Total (Overall) | 245 (80.1%) | 61 (19.9%) |
Production, Transportation and Moving Occupations
The most common Production, Transportation and Moving occupations in Dixon are Material Moving (39 | 12.8%), and Transportation (9 | 2.9%).
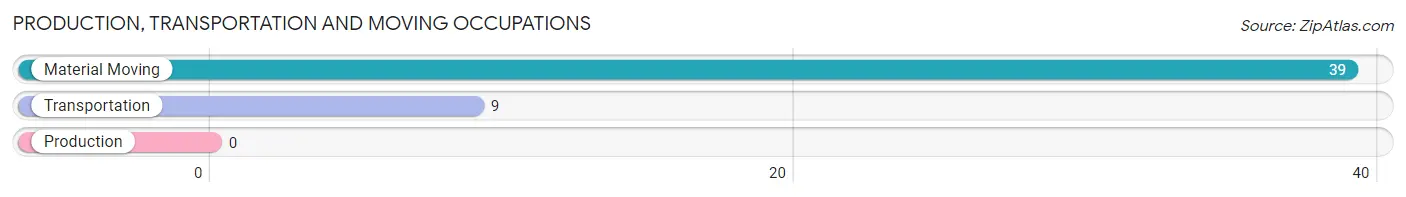
Production, Transportation and Moving Occupations by Sex
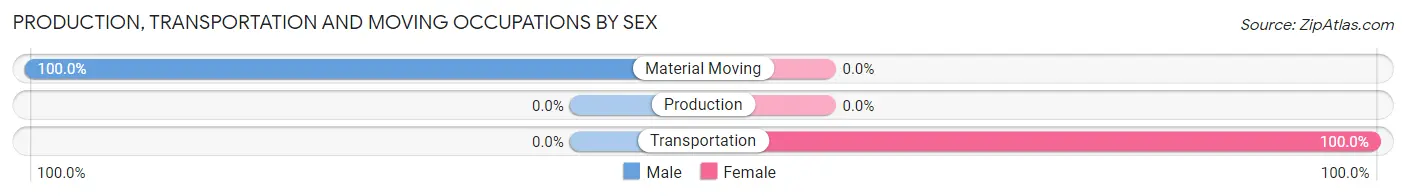
| Occupation | Male | Female |
| Production | 0 (0.0%) | 0 (0.0%) |
| Transportation | 0 (0.0%) | 9 (100.0%) |
| Material Moving | 39 (100.0%) | 0 (0.0%) |
| Total (Category) | 39 (81.2%) | 9 (18.8%) |
| Total (Overall) | 245 (80.1%) | 61 (19.9%) |
Employment Industries by Sex in Dixon
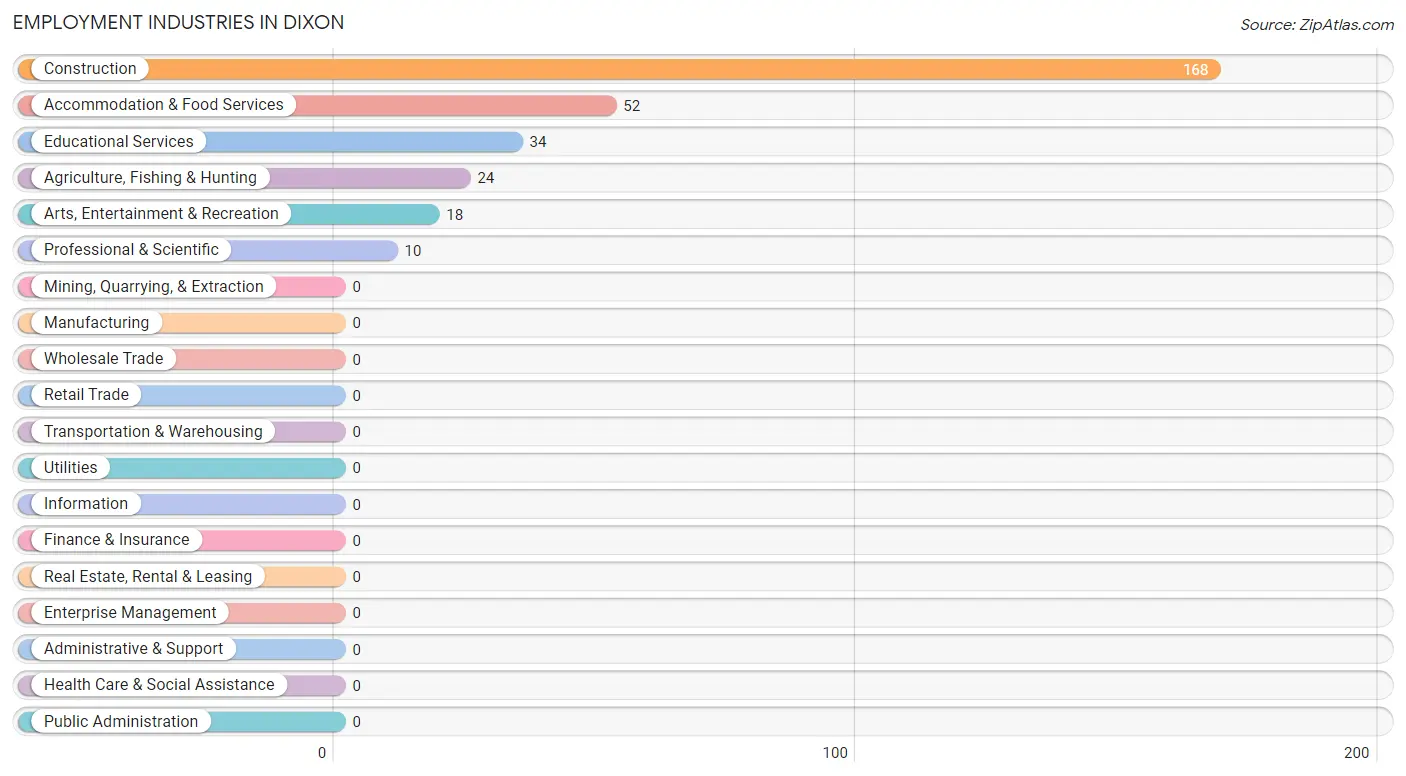
Employment Industries in Dixon
The major employment industries in Dixon include Construction (168 | 54.9%), Accommodation & Food Services (52 | 17.0%), Educational Services (34 | 11.1%), Agriculture, Fishing & Hunting (24 | 7.8%), and Arts, Entertainment & Recreation (18 | 5.9%).
Employment Industries by Sex in Dixon
The Dixon industries that see more men than women are Agriculture, Fishing & Hunting (100.0%), Construction (100.0%), and Professional & Scientific (100.0%), whereas the industries that tend to have a higher number of women are Accommodation & Food Services (100.0%), and Arts, Entertainment & Recreation (50.0%).
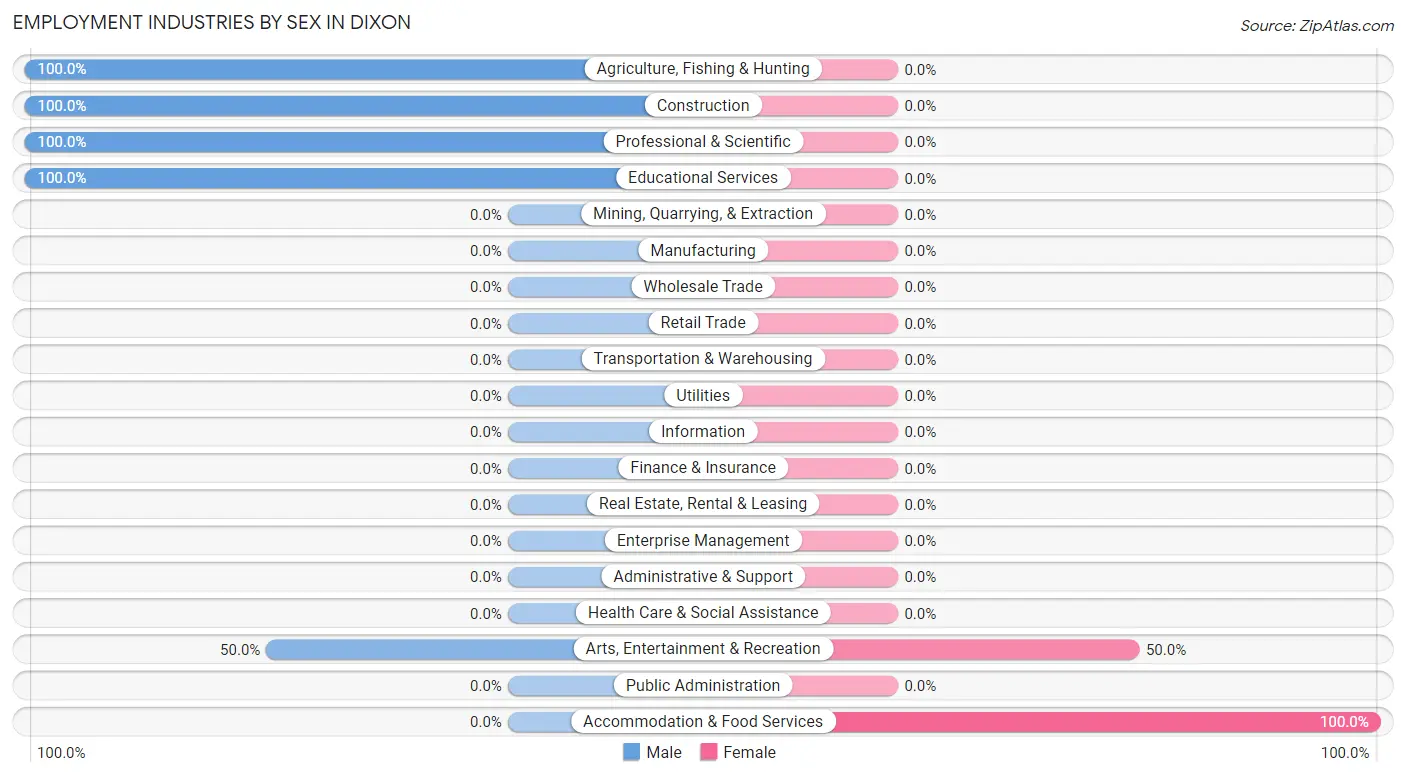
| Industry | Male | Female |
| Agriculture, Fishing & Hunting | 24 (100.0%) | 0 (0.0%) |
| Mining, Quarrying, & Extraction | 0 (0.0%) | 0 (0.0%) |
| Construction | 168 (100.0%) | 0 (0.0%) |
| Manufacturing | 0 (0.0%) | 0 (0.0%) |
| Wholesale Trade | 0 (0.0%) | 0 (0.0%) |
| Retail Trade | 0 (0.0%) | 0 (0.0%) |
| Transportation & Warehousing | 0 (0.0%) | 0 (0.0%) |
| Utilities | 0 (0.0%) | 0 (0.0%) |
| Information | 0 (0.0%) | 0 (0.0%) |
| Finance & Insurance | 0 (0.0%) | 0 (0.0%) |
| Real Estate, Rental & Leasing | 0 (0.0%) | 0 (0.0%) |
| Professional & Scientific | 10 (100.0%) | 0 (0.0%) |
| Enterprise Management | 0 (0.0%) | 0 (0.0%) |
| Administrative & Support | 0 (0.0%) | 0 (0.0%) |
| Educational Services | 34 (100.0%) | 0 (0.0%) |
| Health Care & Social Assistance | 0 (0.0%) | 0 (0.0%) |
| Arts, Entertainment & Recreation | 9 (50.0%) | 9 (50.0%) |
| Accommodation & Food Services | 0 (0.0%) | 52 (100.0%) |
| Public Administration | 0 (0.0%) | 0 (0.0%) |
| Total | 245 (80.1%) | 61 (19.9%) |
Education in Dixon
School Enrollment in Dixon
The most common levels of schooling among the 83 students in Dixon are kindergarten (43 | 51.8%), and elementary school (40 | 48.2%).
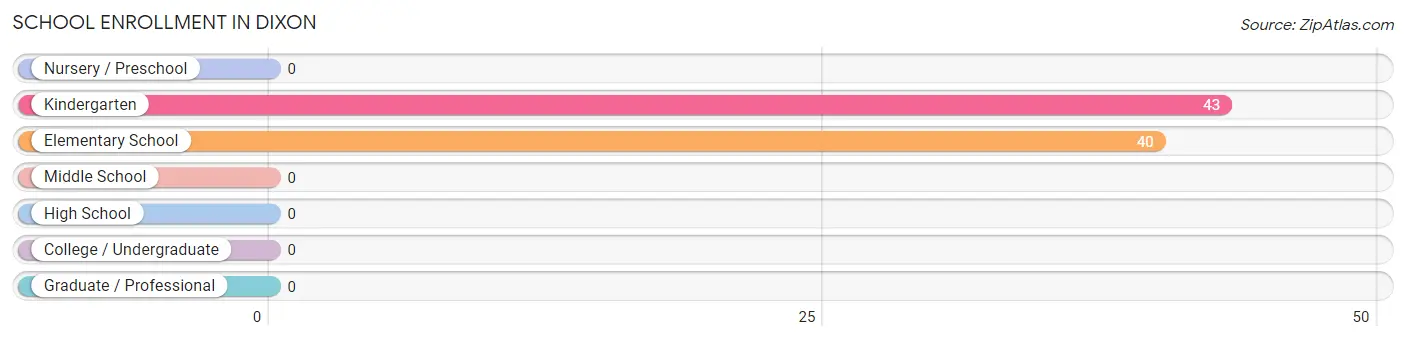
| School Level | # Students | % Students |
| Nursery / Preschool | 0 | 0.0% |
| Kindergarten | 43 | 51.8% |
| Elementary School | 40 | 48.2% |
| Middle School | 0 | 0.0% |
| High School | 0 | 0.0% |
| College / Undergraduate | 0 | 0.0% |
| Graduate / Professional | 0 | 0.0% |
| Total | 83 | 100.0% |
School Enrollment by Age by Funding Source in Dixon
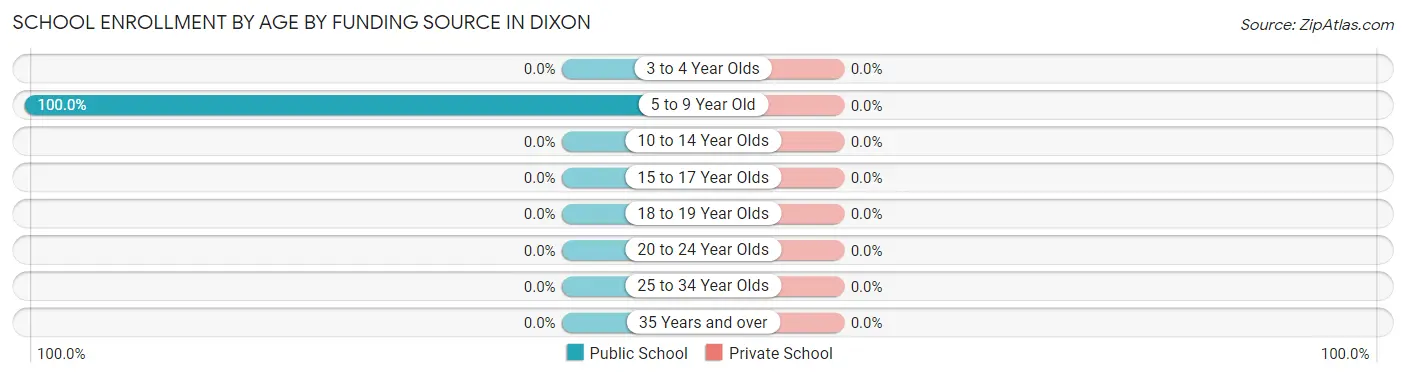
| Age Bracket | Public School | Private School |
| 3 to 4 Year Olds | 0 (0.0%) | 0 (0.0%) |
| 5 to 9 Year Old | 83 (100.0%) | 0 (0.0%) |
| 10 to 14 Year Olds | 0 (0.0%) | 0 (0.0%) |
| 15 to 17 Year Olds | 0 (0.0%) | 0 (0.0%) |
| 18 to 19 Year Olds | 0 (0.0%) | 0 (0.0%) |
| 20 to 24 Year Olds | 0 (0.0%) | 0 (0.0%) |
| 25 to 34 Year Olds | 0 (0.0%) | 0 (0.0%) |
| 35 Years and over | 0 (0.0%) | 0 (0.0%) |
| Total | 83 (100.0%) | 0 (0.0%) |
Educational Attainment by Field of Study in Dixon
Education (95 | 42.4%), social sciences (54 | 24.1%), literature & languages (34 | 15.2%), business (24 | 10.7%), and science & technology (17 | 7.6%) are the most common fields of study among 224 individuals in Dixon who have obtained a bachelor's degree or higher.
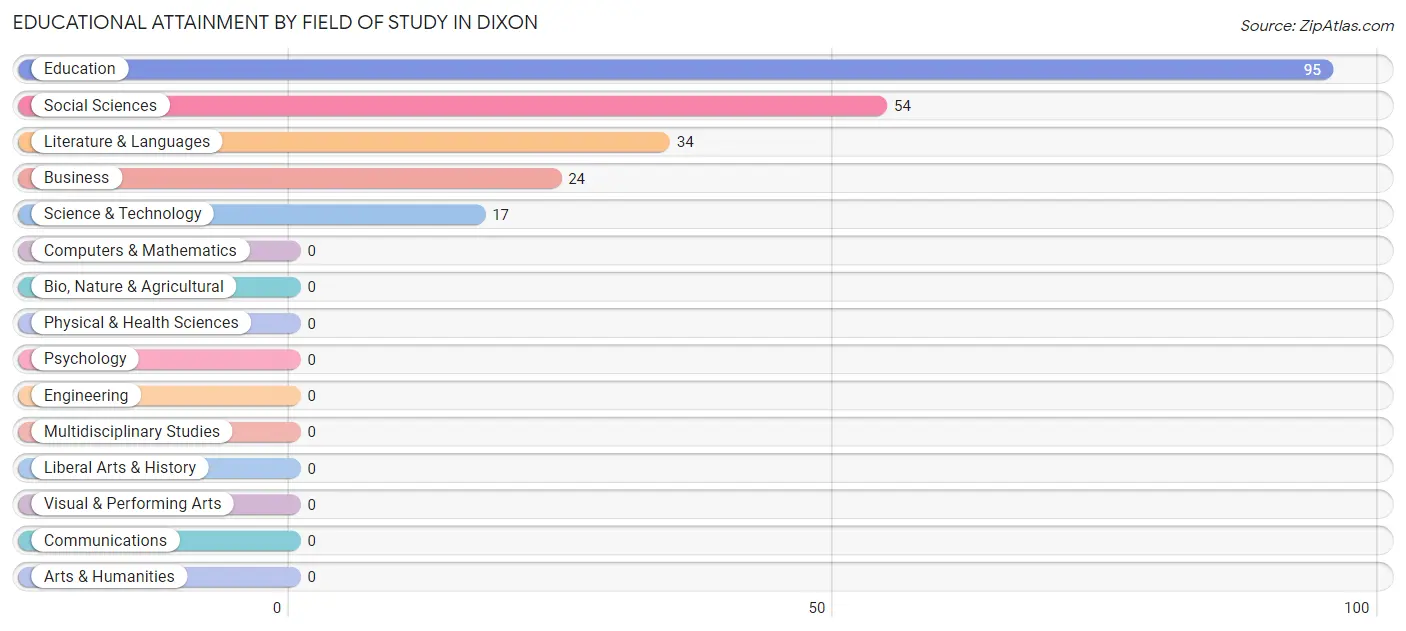
| Field of Study | # Graduates | % Graduates |
| Computers & Mathematics | 0 | 0.0% |
| Bio, Nature & Agricultural | 0 | 0.0% |
| Physical & Health Sciences | 0 | 0.0% |
| Psychology | 0 | 0.0% |
| Social Sciences | 54 | 24.1% |
| Engineering | 0 | 0.0% |
| Multidisciplinary Studies | 0 | 0.0% |
| Science & Technology | 17 | 7.6% |
| Business | 24 | 10.7% |
| Education | 95 | 42.4% |
| Literature & Languages | 34 | 15.2% |
| Liberal Arts & History | 0 | 0.0% |
| Visual & Performing Arts | 0 | 0.0% |
| Communications | 0 | 0.0% |
| Arts & Humanities | 0 | 0.0% |
| Total | 224 | 100.0% |
Transportation & Commute in Dixon
Vehicle Availability by Sex in Dixon
The most prevalent vehicle ownership categories in Dixon are males with 3 vehicles (201, accounting for 95.7%) and females with 3 vehicles (52, making up 329.5%).
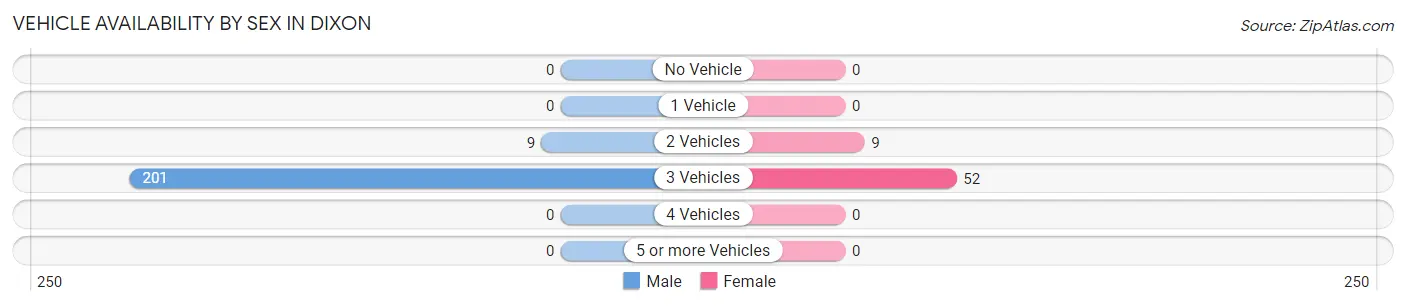
| Vehicles Available | Male | Female |
| No Vehicle | 0 (0.0%) | 0 (0.0%) |
| 1 Vehicle | 0 (0.0%) | 0 (0.0%) |
| 2 Vehicles | 9 (4.3%) | 9 (14.7%) |
| 3 Vehicles | 201 (95.7%) | 52 (85.3%) |
| 4 Vehicles | 0 (0.0%) | 0 (0.0%) |
| 5 or more Vehicles | 0 (0.0%) | 0 (0.0%) |
| Total | 210 (100.0%) | 61 (100.0%) |
Commute Time in Dixon
The most frequently occuring commute durations in Dixon are 5 to 9 minutes (104 commuters, 49.8%), less than 5 minutes (61 commuters, 29.2%), and 90 or more minutes (34 commuters, 16.3%).
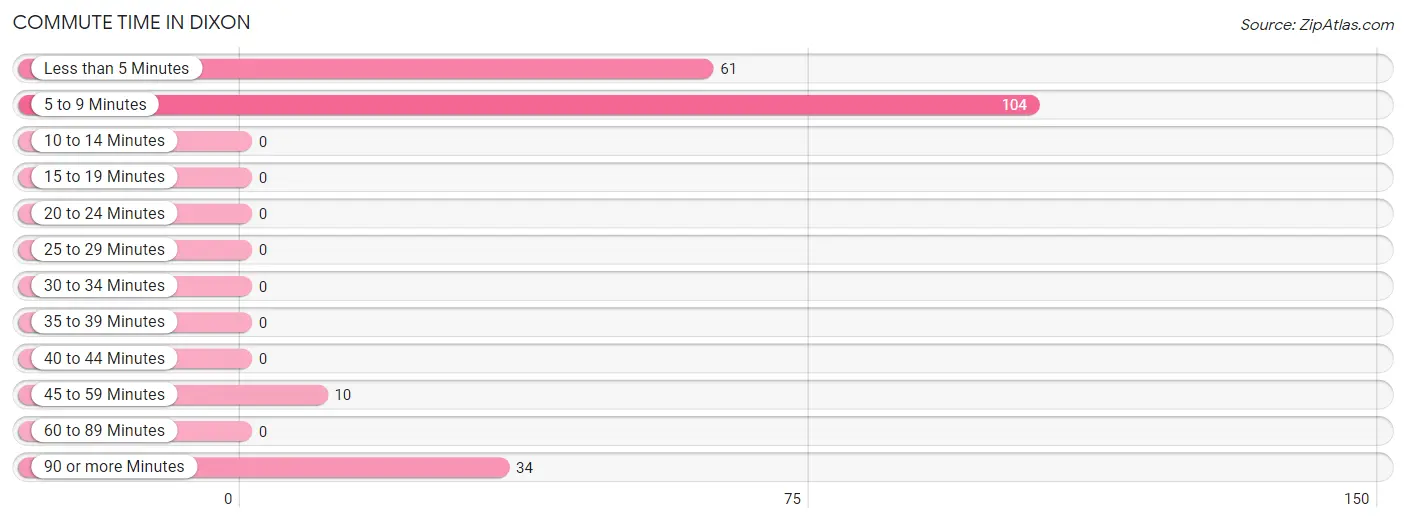
| Commute Time | # Commuters | % Commuters |
| Less than 5 Minutes | 61 | 29.2% |
| 5 to 9 Minutes | 104 | 49.8% |
| 10 to 14 Minutes | 0 | 0.0% |
| 15 to 19 Minutes | 0 | 0.0% |
| 20 to 24 Minutes | 0 | 0.0% |
| 25 to 29 Minutes | 0 | 0.0% |
| 30 to 34 Minutes | 0 | 0.0% |
| 35 to 39 Minutes | 0 | 0.0% |
| 40 to 44 Minutes | 0 | 0.0% |
| 45 to 59 Minutes | 10 | 4.8% |
| 60 to 89 Minutes | 0 | 0.0% |
| 90 or more Minutes | 34 | 16.3% |
Commute Time by Sex in Dixon
The most common commute times in Dixon are 5 to 9 minutes (104 commuters, 70.3%) for males and less than 5 minutes (61 commuters, 100.0%) for females.
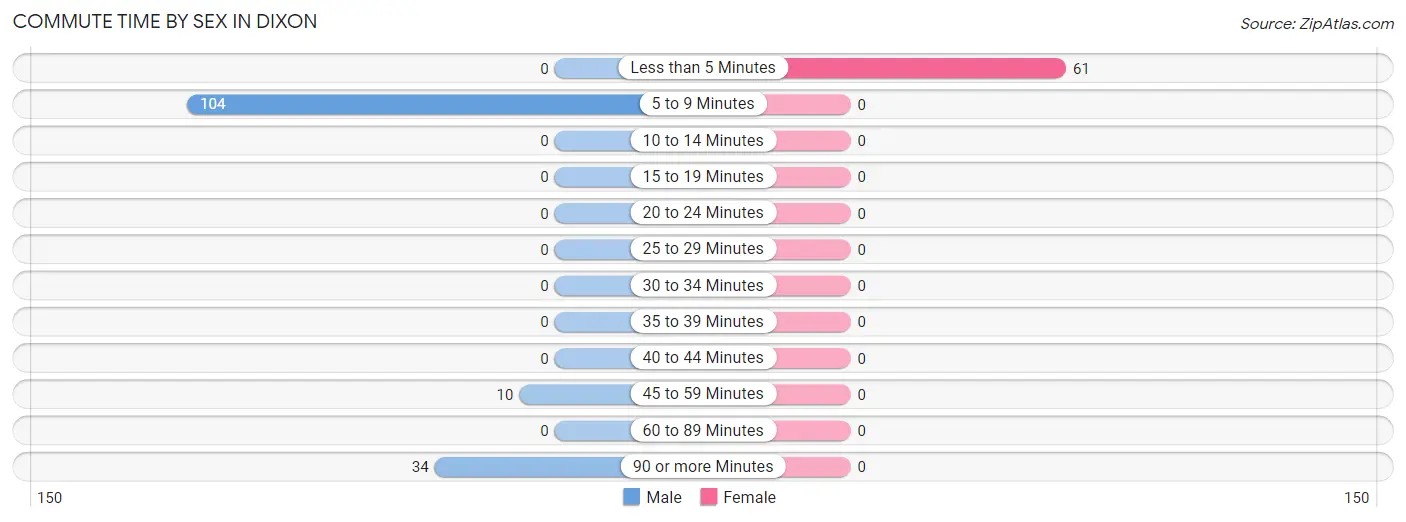
| Commute Time | Male | Female |
| Less than 5 Minutes | 0 (0.0%) | 61 (100.0%) |
| 5 to 9 Minutes | 104 (70.3%) | 0 (0.0%) |
| 10 to 14 Minutes | 0 (0.0%) | 0 (0.0%) |
| 15 to 19 Minutes | 0 (0.0%) | 0 (0.0%) |
| 20 to 24 Minutes | 0 (0.0%) | 0 (0.0%) |
| 25 to 29 Minutes | 0 (0.0%) | 0 (0.0%) |
| 30 to 34 Minutes | 0 (0.0%) | 0 (0.0%) |
| 35 to 39 Minutes | 0 (0.0%) | 0 (0.0%) |
| 40 to 44 Minutes | 0 (0.0%) | 0 (0.0%) |
| 45 to 59 Minutes | 10 (6.8%) | 0 (0.0%) |
| 60 to 89 Minutes | 0 (0.0%) | 0 (0.0%) |
| 90 or more Minutes | 34 (23.0%) | 0 (0.0%) |
Time of Departure to Work by Sex in Dixon
The most frequent times of departure to work in Dixon are 8:00 AM to 8:29 AM (104, 70.3%) for males and 6:00 AM to 6:29 AM (52, 85.3%) for females.
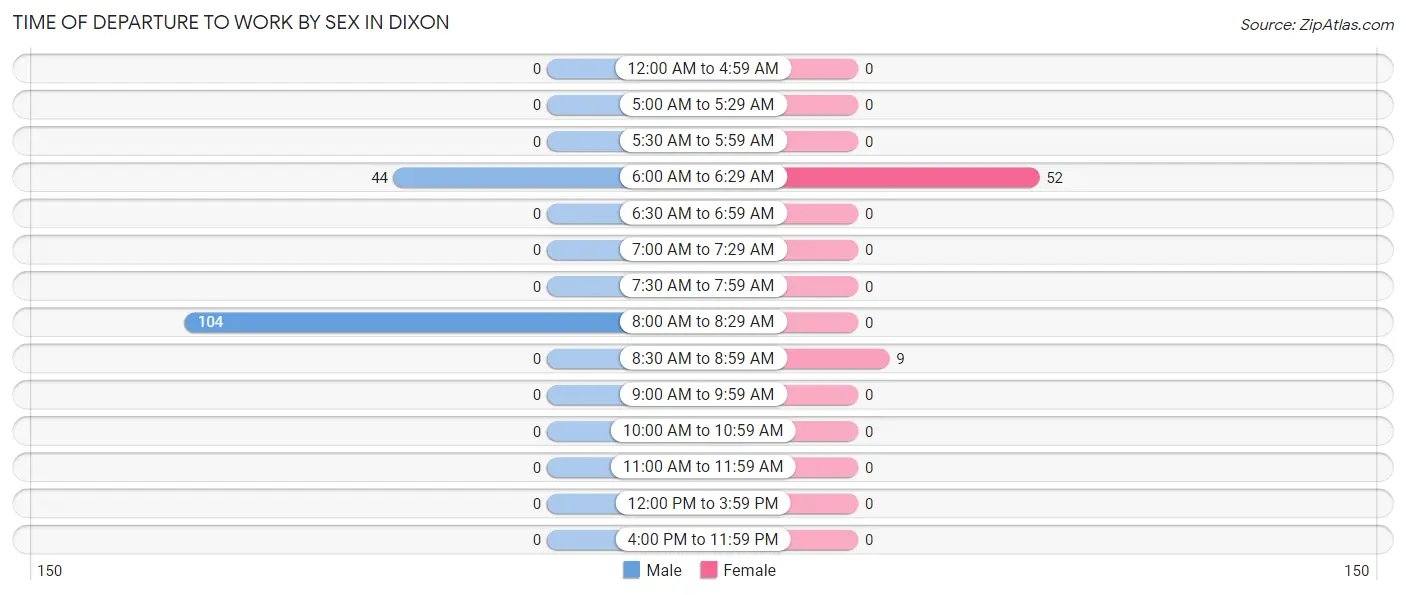
| Time of Departure | Male | Female |
| 12:00 AM to 4:59 AM | 0 (0.0%) | 0 (0.0%) |
| 5:00 AM to 5:29 AM | 0 (0.0%) | 0 (0.0%) |
| 5:30 AM to 5:59 AM | 0 (0.0%) | 0 (0.0%) |
| 6:00 AM to 6:29 AM | 44 (29.7%) | 52 (85.3%) |
| 6:30 AM to 6:59 AM | 0 (0.0%) | 0 (0.0%) |
| 7:00 AM to 7:29 AM | 0 (0.0%) | 0 (0.0%) |
| 7:30 AM to 7:59 AM | 0 (0.0%) | 0 (0.0%) |
| 8:00 AM to 8:29 AM | 104 (70.3%) | 0 (0.0%) |
| 8:30 AM to 8:59 AM | 0 (0.0%) | 9 (14.7%) |
| 9:00 AM to 9:59 AM | 0 (0.0%) | 0 (0.0%) |
| 10:00 AM to 10:59 AM | 0 (0.0%) | 0 (0.0%) |
| 11:00 AM to 11:59 AM | 0 (0.0%) | 0 (0.0%) |
| 12:00 PM to 3:59 PM | 0 (0.0%) | 0 (0.0%) |
| 4:00 PM to 11:59 PM | 0 (0.0%) | 0 (0.0%) |
| Total | 148 (100.0%) | 61 (100.0%) |
Housing Occupancy in Dixon
Occupancy by Ownership in Dixon
Of the total 399 dwellings in Dixon, owner-occupied units account for 399 (100.0%), while renter-occupied units make up 0 (0.0%).
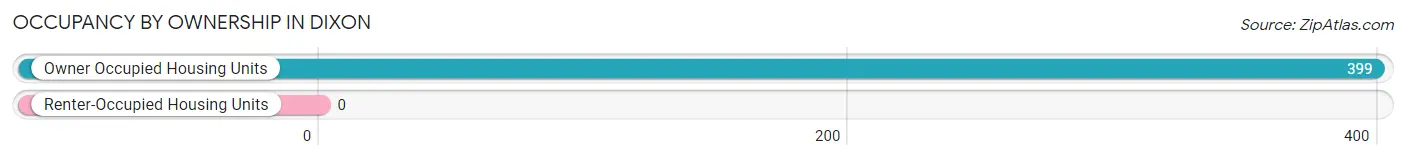
| Occupancy | # Housing Units | % Housing Units |
| Owner Occupied Housing Units | 399 | 100.0% |
| Renter-Occupied Housing Units | 0 | 0.0% |
| Total Occupied Housing Units | 399 | 100.0% |
Occupancy by Household Size in Dixon
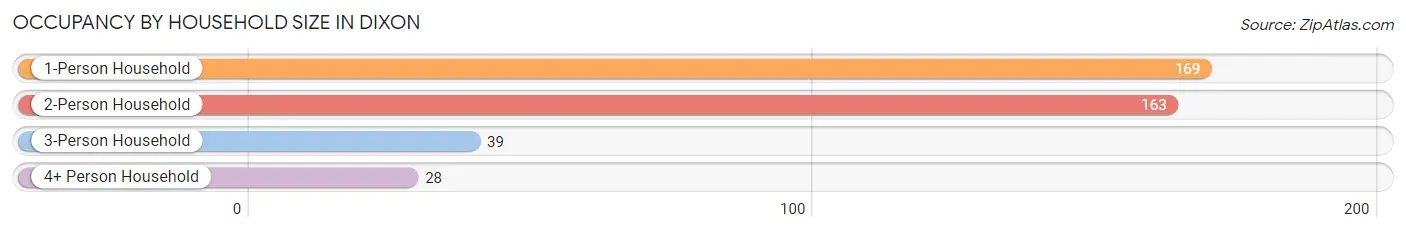
| Household Size | # Housing Units | % Housing Units |
| 1-Person Household | 169 | 42.4% |
| 2-Person Household | 163 | 40.8% |
| 3-Person Household | 39 | 9.8% |
| 4+ Person Household | 28 | 7.0% |
| Total Housing Units | 399 | 100.0% |
Occupancy by Ownership by Household Size in Dixon
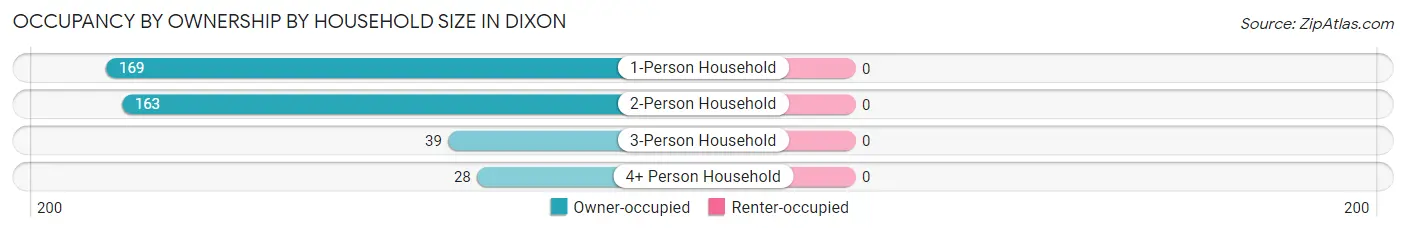
| Household Size | Owner-occupied | Renter-occupied |
| 1-Person Household | 169 (100.0%) | 0 (0.0%) |
| 2-Person Household | 163 (100.0%) | 0 (0.0%) |
| 3-Person Household | 39 (100.0%) | 0 (0.0%) |
| 4+ Person Household | 28 (100.0%) | 0 (0.0%) |
| Total Housing Units | 399 (100.0%) | 0 (0.0%) |
Occupancy by Educational Attainment in Dixon
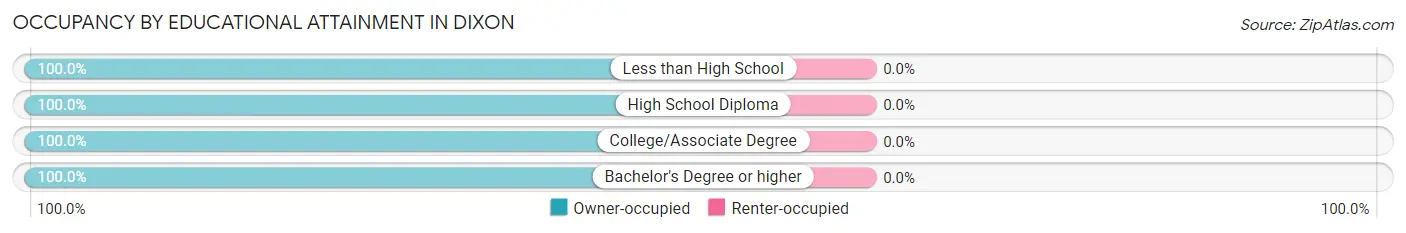
| Household Size | Owner-occupied | Renter-occupied |
| Less than High School | 193 (100.0%) | 0 (0.0%) |
| High School Diploma | 14 (100.0%) | 0 (0.0%) |
| College/Associate Degree | 26 (100.0%) | 0 (0.0%) |
| Bachelor's Degree or higher | 166 (100.0%) | 0 (0.0%) |
Occupancy by Age of Householder in Dixon
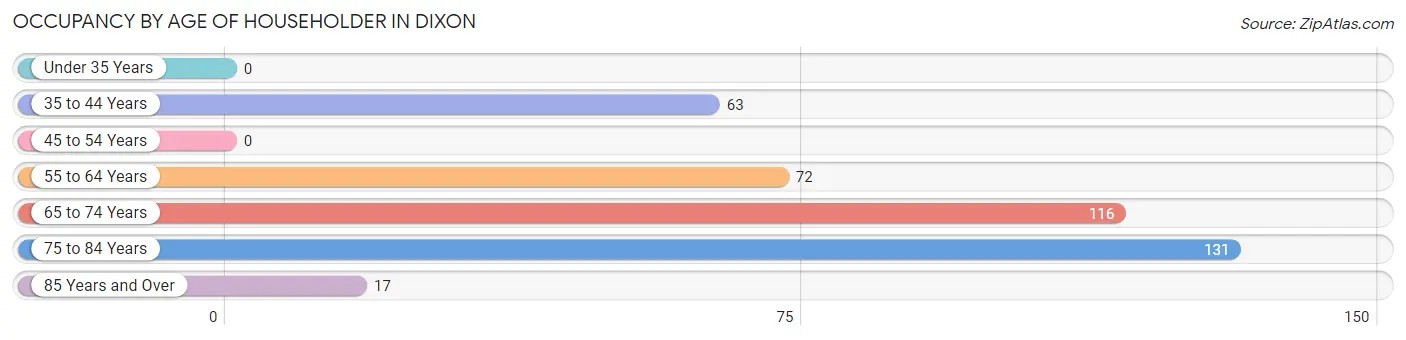
| Age Bracket | # Households | % Households |
| Under 35 Years | 0 | 0.0% |
| 35 to 44 Years | 63 | 15.8% |
| 45 to 54 Years | 0 | 0.0% |
| 55 to 64 Years | 72 | 18.0% |
| 65 to 74 Years | 116 | 29.1% |
| 75 to 84 Years | 131 | 32.8% |
| 85 Years and Over | 17 | 4.3% |
| Total | 399 | 100.0% |
Housing Finances in Dixon
Median Income by Occupancy in Dixon
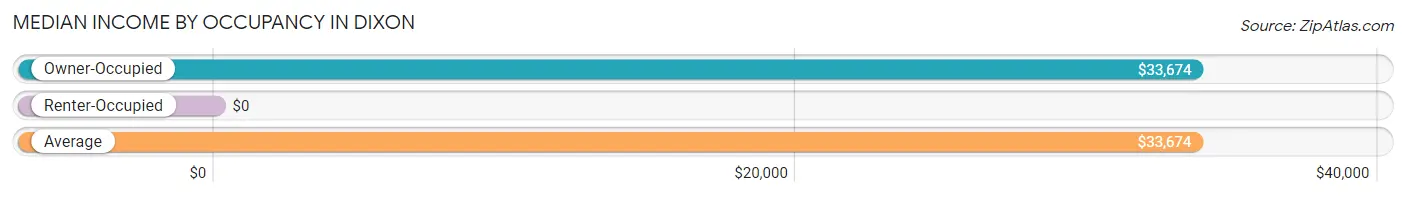
| Occupancy Type | # Households | Median Income |
| Owner-Occupied | 399 (100.0%) | $33,674 |
| Renter-Occupied | 0 (0.0%) | $0 |
| Average | 399 (100.0%) | $33,674 |
Occupancy by Householder Income Bracket in Dixon
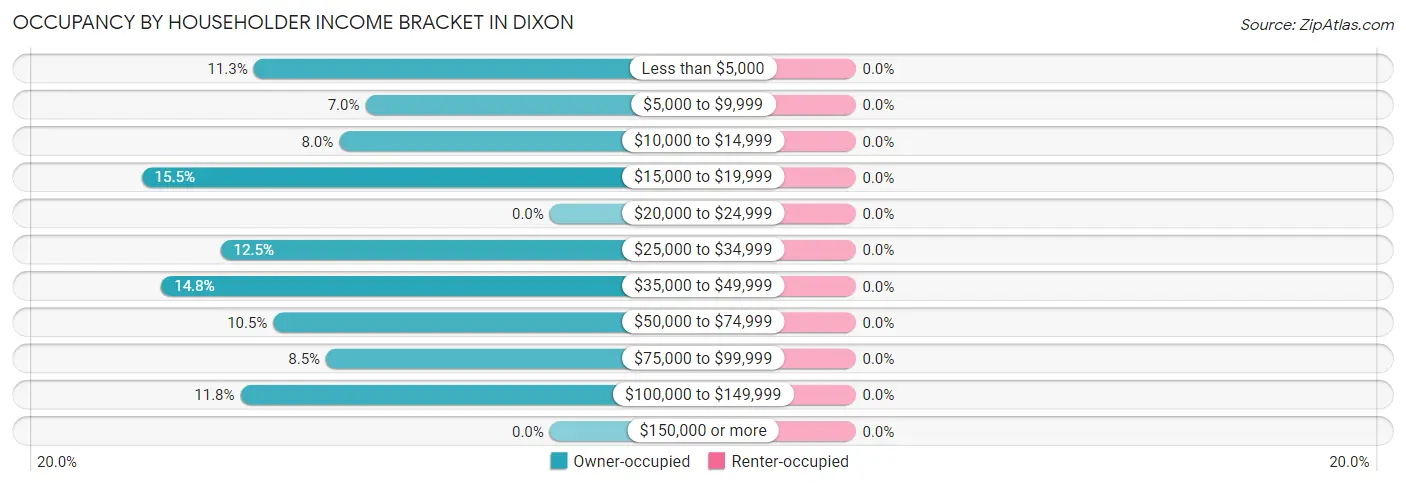
| Income Bracket | Owner-occupied | Renter-occupied |
| Less than $5,000 | 45 (11.3%) | 0 (0.0%) |
| $5,000 to $9,999 | 28 (7.0%) | 0 (0.0%) |
| $10,000 to $14,999 | 32 (8.0%) | 0 (0.0%) |
| $15,000 to $19,999 | 62 (15.5%) | 0 (0.0%) |
| $20,000 to $24,999 | 0 (0.0%) | 0 (0.0%) |
| $25,000 to $34,999 | 50 (12.5%) | 0 (0.0%) |
| $35,000 to $49,999 | 59 (14.8%) | 0 (0.0%) |
| $50,000 to $74,999 | 42 (10.5%) | 0 (0.0%) |
| $75,000 to $99,999 | 34 (8.5%) | 0 (0.0%) |
| $100,000 to $149,999 | 47 (11.8%) | 0 (0.0%) |
| $150,000 or more | 0 (0.0%) | 0 (0.0%) |
| Total | 399 (100.0%) | 0 (0.0%) |
Monthly Housing Cost Tiers in Dixon

| Monthly Cost | Owner-occupied | Renter-occupied |
| Less than $300 | 76 (19.1%) | 0 (0.0%) |
| $300 to $499 | 185 (46.4%) | 0 (0.0%) |
| $500 to $799 | 5 (1.3%) | 0 (0.0%) |
| $800 to $999 | 45 (11.3%) | 0 (0.0%) |
| $1,000 to $1,499 | 0 (0.0%) | 0 (0.0%) |
| $1,500 to $1,999 | 60 (15.0%) | 0 (0.0%) |
| $2,000 to $2,499 | 28 (7.0%) | 0 (0.0%) |
| $2,500 to $2,999 | 0 (0.0%) | 0 (0.0%) |
| $3,000 or more | 0 (0.0%) | 0 (0.0%) |
| Total | 399 (100.0%) | 0 (0.0%) |
Physical Housing Characteristics in Dixon
Housing Structures in Dixon
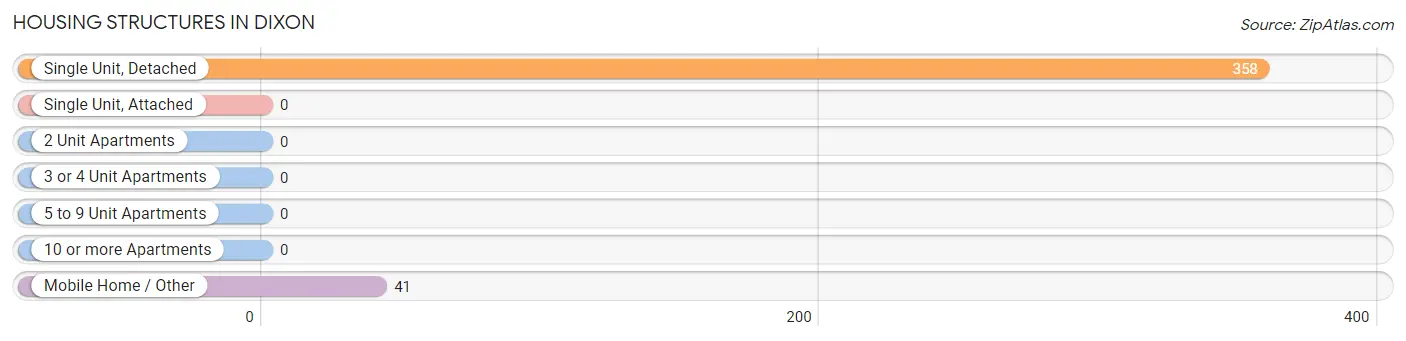
| Structure Type | # Housing Units | % Housing Units |
| Single Unit, Detached | 358 | 89.7% |
| Single Unit, Attached | 0 | 0.0% |
| 2 Unit Apartments | 0 | 0.0% |
| 3 or 4 Unit Apartments | 0 | 0.0% |
| 5 to 9 Unit Apartments | 0 | 0.0% |
| 10 or more Apartments | 0 | 0.0% |
| Mobile Home / Other | 41 | 10.3% |
| Total | 399 | 100.0% |
Housing Structures by Occupancy in Dixon
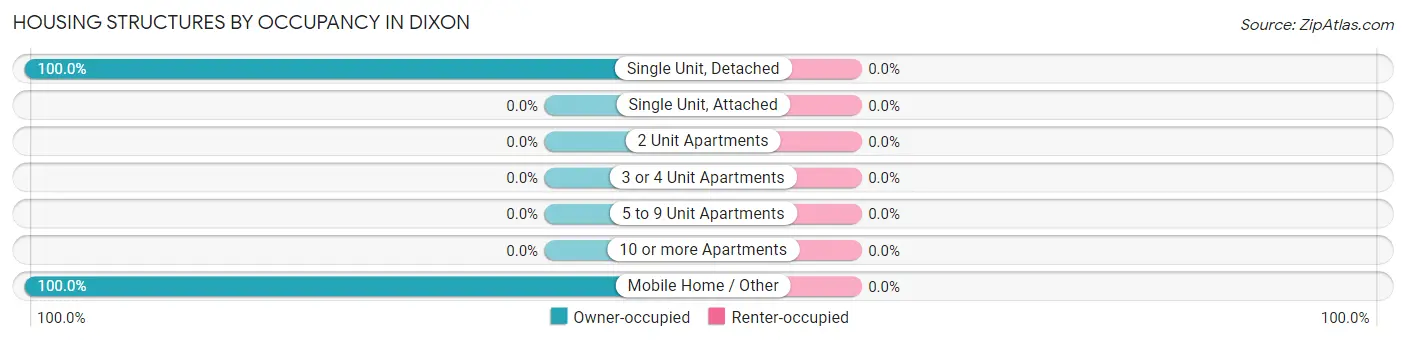
| Structure Type | Owner-occupied | Renter-occupied |
| Single Unit, Detached | 358 (100.0%) | 0 (0.0%) |
| Single Unit, Attached | 0 (0.0%) | 0 (0.0%) |
| 2 Unit Apartments | 0 (0.0%) | 0 (0.0%) |
| 3 or 4 Unit Apartments | 0 (0.0%) | 0 (0.0%) |
| 5 to 9 Unit Apartments | 0 (0.0%) | 0 (0.0%) |
| 10 or more Apartments | 0 (0.0%) | 0 (0.0%) |
| Mobile Home / Other | 41 (100.0%) | 0 (0.0%) |
| Total | 399 (100.0%) | 0 (0.0%) |
Housing Structures by Number of Rooms in Dixon
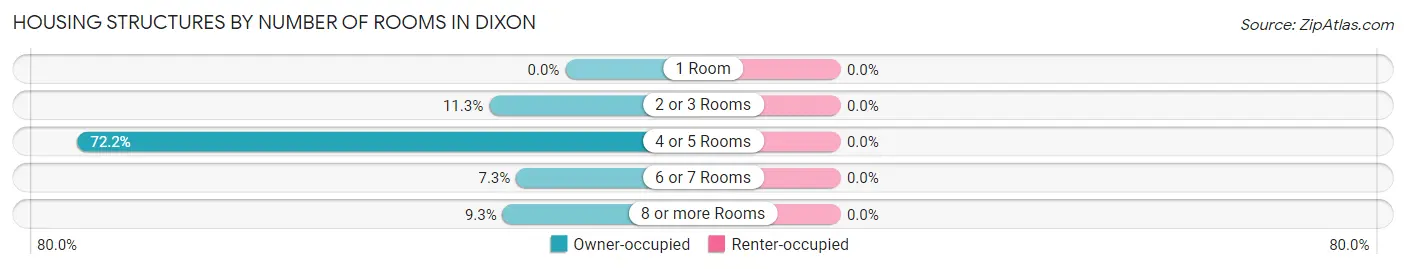
| Number of Rooms | Owner-occupied | Renter-occupied |
| 1 Room | 0 (0.0%) | 0 (0.0%) |
| 2 or 3 Rooms | 45 (11.3%) | 0 (0.0%) |
| 4 or 5 Rooms | 288 (72.2%) | 0 (0.0%) |
| 6 or 7 Rooms | 29 (7.3%) | 0 (0.0%) |
| 8 or more Rooms | 37 (9.3%) | 0 (0.0%) |
| Total | 399 (100.0%) | 0 (0.0%) |
Housing Structure by Heating Type in Dixon
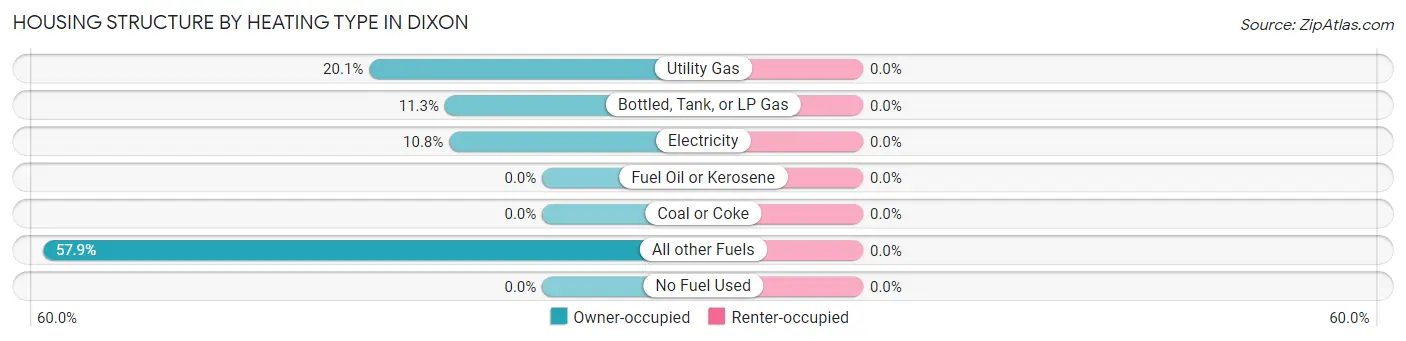
| Heating Type | Owner-occupied | Renter-occupied |
| Utility Gas | 80 (20.1%) | 0 (0.0%) |
| Bottled, Tank, or LP Gas | 45 (11.3%) | 0 (0.0%) |
| Electricity | 43 (10.8%) | 0 (0.0%) |
| Fuel Oil or Kerosene | 0 (0.0%) | 0 (0.0%) |
| Coal or Coke | 0 (0.0%) | 0 (0.0%) |
| All other Fuels | 231 (57.9%) | 0 (0.0%) |
| No Fuel Used | 0 (0.0%) | 0 (0.0%) |
| Total | 399 (100.0%) | 0 (0.0%) |
Household Vehicle Usage in Dixon
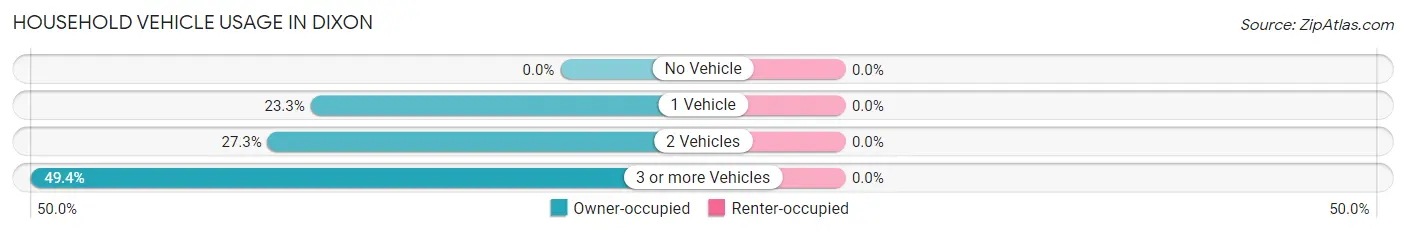
| Vehicles per Household | Owner-occupied | Renter-occupied |
| No Vehicle | 0 (0.0%) | 0 (0.0%) |
| 1 Vehicle | 93 (23.3%) | 0 (0.0%) |
| 2 Vehicles | 109 (27.3%) | 0 (0.0%) |
| 3 or more Vehicles | 197 (49.4%) | 0 (0.0%) |
| Total | 399 (100.0%) | 0 (0.0%) |
Real Estate & Mortgages in Dixon
Real Estate and Mortgage Overview in Dixon
| Characteristic | Without Mortgage | With Mortgage |
| Housing Units | 311 | 88 |
| Median Property Value | $257,700 | $461,500 |
| Median Household Income | $29,926 | $0 |
| Monthly Housing Costs | $411 | $0 |
| Real Estate Taxes | $1,010 | $0 |
Property Value by Mortgage Status in Dixon
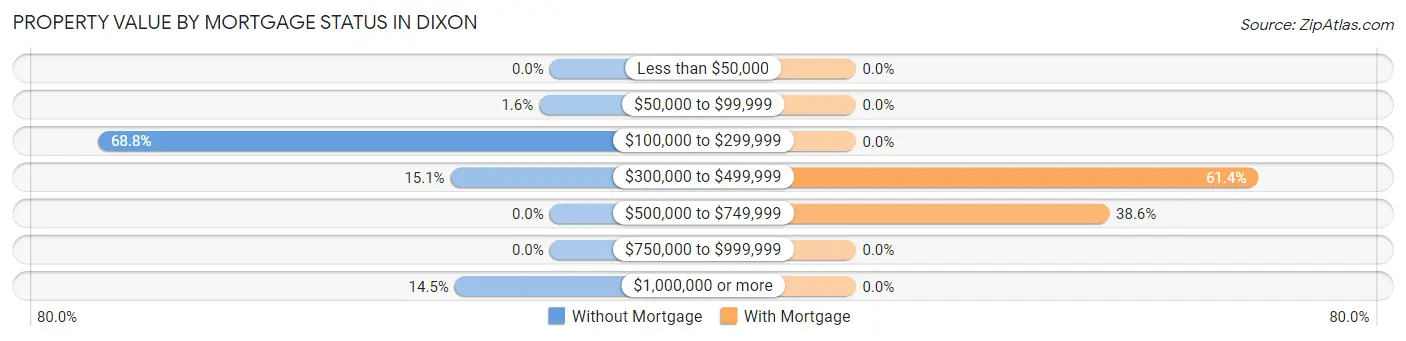
| Property Value | Without Mortgage | With Mortgage |
| Less than $50,000 | 0 (0.0%) | 0 (0.0%) |
| $50,000 to $99,999 | 5 (1.6%) | 0 (0.0%) |
| $100,000 to $299,999 | 214 (68.8%) | 0 (0.0%) |
| $300,000 to $499,999 | 47 (15.1%) | 54 (61.4%) |
| $500,000 to $749,999 | 0 (0.0%) | 34 (38.6%) |
| $750,000 to $999,999 | 0 (0.0%) | 0 (0.0%) |
| $1,000,000 or more | 45 (14.5%) | 0 (0.0%) |
| Total | 311 (100.0%) | 88 (100.0%) |
Household Income by Mortgage Status in Dixon
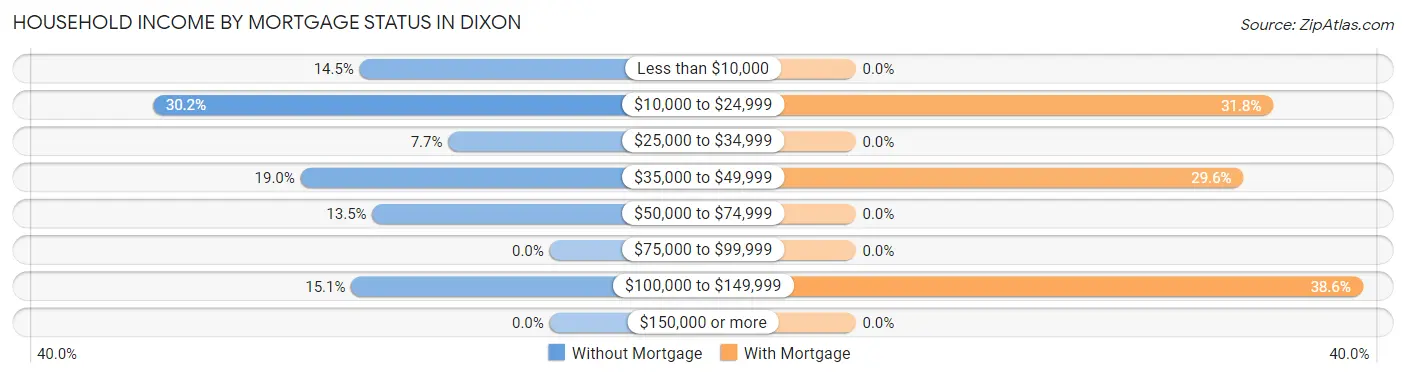
| Household Income | Without Mortgage | With Mortgage |
| Less than $10,000 | 45 (14.5%) | 0 (0.0%) |
| $10,000 to $24,999 | 94 (30.2%) | 28 (31.8%) |
| $25,000 to $34,999 | 24 (7.7%) | 0 (0.0%) |
| $35,000 to $49,999 | 59 (19.0%) | 26 (29.5%) |
| $50,000 to $74,999 | 42 (13.5%) | 0 (0.0%) |
| $75,000 to $99,999 | 0 (0.0%) | 0 (0.0%) |
| $100,000 to $149,999 | 47 (15.1%) | 34 (38.6%) |
| $150,000 or more | 0 (0.0%) | 0 (0.0%) |
| Total | 311 (100.0%) | 88 (100.0%) |
Property Value to Household Income Ratio in Dixon
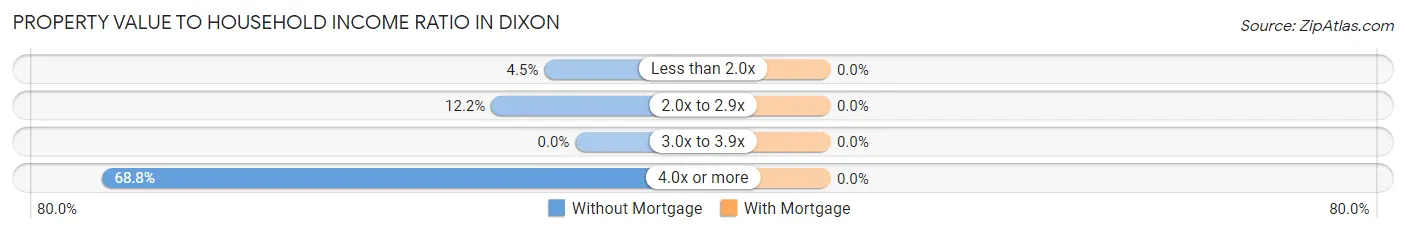
| Value-to-Income Ratio | Without Mortgage | With Mortgage |
| Less than 2.0x | 14 (4.5%) | 0 (0.0%) |
| 2.0x to 2.9x | 38 (12.2%) | 0 (0.0%) |
| 3.0x to 3.9x | 0 (0.0%) | 0 (0.0%) |
| 4.0x or more | 214 (68.8%) | 0 (0.0%) |
| Total | 311 (100.0%) | 88 (100.0%) |
Real Estate Taxes by Mortgage Status in Dixon
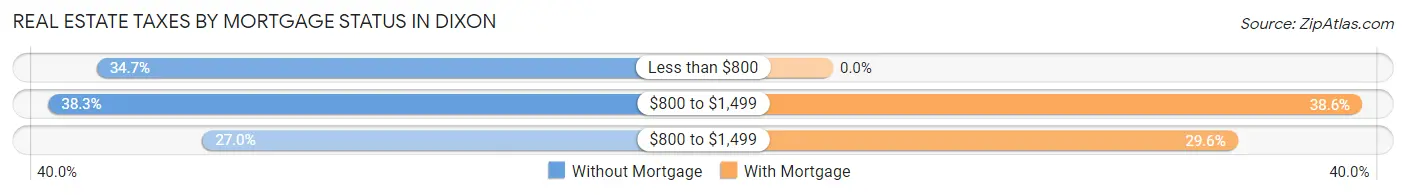
| Property Taxes | Without Mortgage | With Mortgage |
| Less than $800 | 108 (34.7%) | 0 (0.0%) |
| $800 to $1,499 | 119 (38.3%) | 34 (38.6%) |
| $800 to $1,499 | 84 (27.0%) | 26 (29.5%) |
| Total | 311 (100.0%) | 88 (100.0%) |
Health & Disability in Dixon
Health Insurance Coverage by Age in Dixon
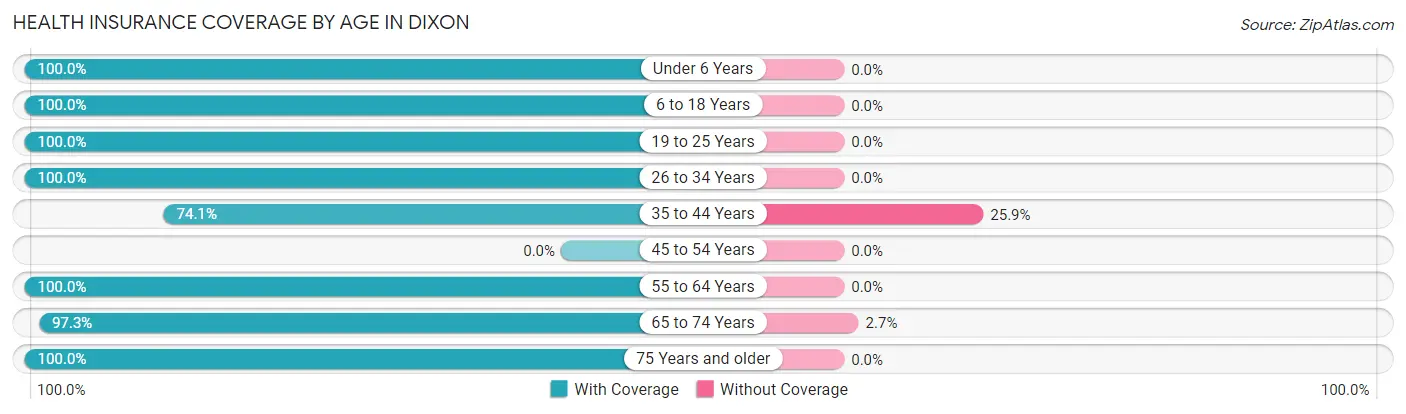
| Age Bracket | With Coverage | Without Coverage |
| Under 6 Years | 134 (100.0%) | 0 (0.0%) |
| 6 to 18 Years | 40 (100.0%) | 0 (0.0%) |
| 19 to 25 Years | 86 (100.0%) | 0 (0.0%) |
| 26 to 34 Years | 60 (100.0%) | 0 (0.0%) |
| 35 to 44 Years | 100 (74.1%) | 35 (25.9%) |
| 45 to 54 Years | 0 (0.0%) | 0 (0.0%) |
| 55 to 64 Years | 176 (100.0%) | 0 (0.0%) |
| 65 to 74 Years | 254 (97.3%) | 7 (2.7%) |
| 75 Years and older | 157 (100.0%) | 0 (0.0%) |
| Total | 1,007 (96.0%) | 42 (4.0%) |
Health Insurance Coverage by Citizenship Status in Dixon
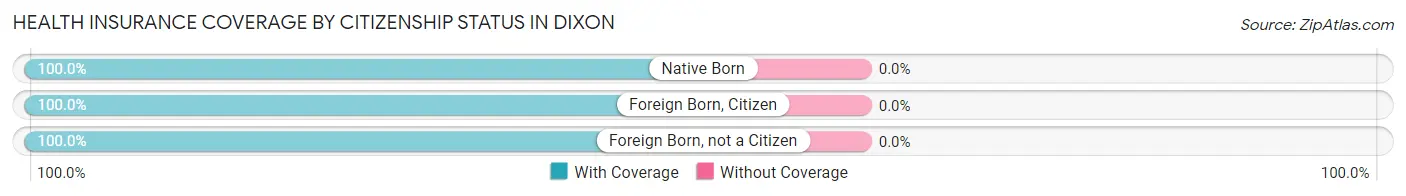
| Citizenship Status | With Coverage | Without Coverage |
| Native Born | 134 (100.0%) | 0 (0.0%) |
| Foreign Born, Citizen | 40 (100.0%) | 0 (0.0%) |
| Foreign Born, not a Citizen | 86 (100.0%) | 0 (0.0%) |
Health Insurance Coverage by Household Income in Dixon
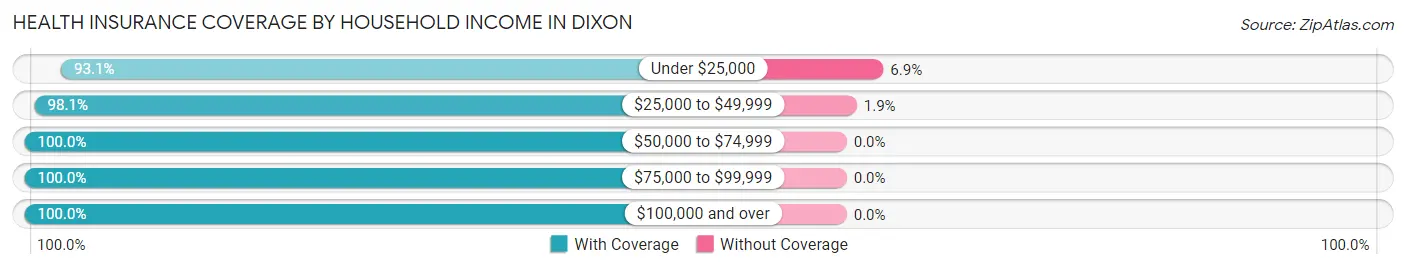
| Household Income | With Coverage | Without Coverage |
| Under $25,000 | 475 (93.1%) | 35 (6.9%) |
| $25,000 to $49,999 | 363 (98.1%) | 7 (1.9%) |
| $50,000 to $74,999 | 55 (100.0%) | 0 (0.0%) |
| $75,000 to $99,999 | 58 (100.0%) | 0 (0.0%) |
| $100,000 and over | 56 (100.0%) | 0 (0.0%) |
Public vs Private Health Insurance Coverage by Age in Dixon
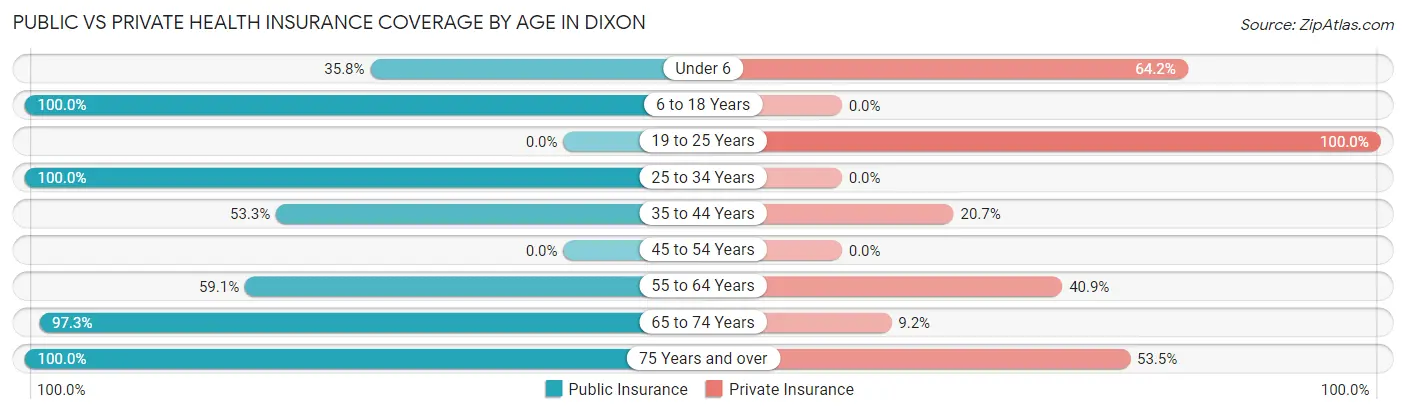
| Age Bracket | Public Insurance | Private Insurance |
| Under 6 | 48 (35.8%) | 86 (64.2%) |
| 6 to 18 Years | 40 (100.0%) | 0 (0.0%) |
| 19 to 25 Years | 0 (0.0%) | 86 (100.0%) |
| 25 to 34 Years | 60 (100.0%) | 0 (0.0%) |
| 35 to 44 Years | 72 (53.3%) | 28 (20.7%) |
| 45 to 54 Years | 0 (0.0%) | 0 (0.0%) |
| 55 to 64 Years | 104 (59.1%) | 72 (40.9%) |
| 65 to 74 Years | 254 (97.3%) | 24 (9.2%) |
| 75 Years and over | 157 (100.0%) | 84 (53.5%) |
| Total | 735 (70.1%) | 380 (36.2%) |
Disability Status by Sex by Age in Dixon
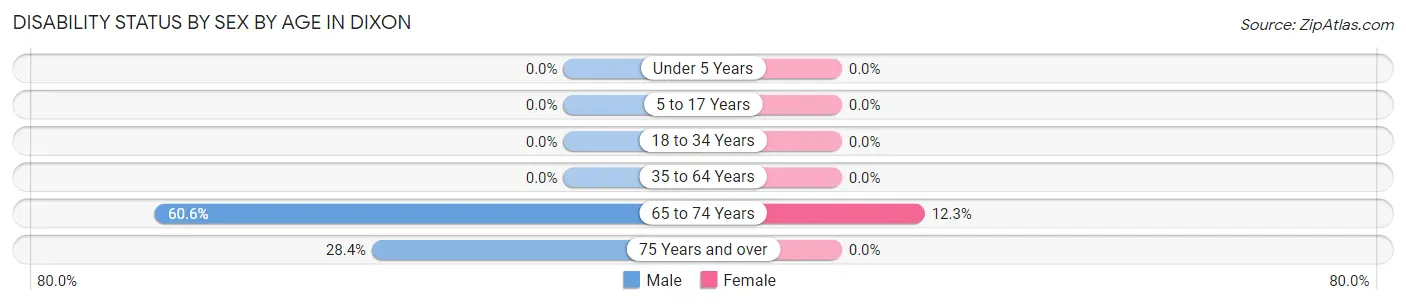
| Age Bracket | Male | Female |
| Under 5 Years | 0 (0.0%) | 0 (0.0%) |
| 5 to 17 Years | 0 (0.0%) | 0 (0.0%) |
| 18 to 34 Years | 0 (0.0%) | 0 (0.0%) |
| 35 to 64 Years | 0 (0.0%) | 0 (0.0%) |
| 65 to 74 Years | 40 (60.6%) | 24 (12.3%) |
| 75 Years and over | 29 (28.4%) | 0 (0.0%) |
Disability Class by Sex by Age in Dixon
Disability Class: Hearing Difficulty

| Age Bracket | Male | Female |
| Under 5 Years | 0 (0.0%) | 0 (0.0%) |
| 5 to 17 Years | 0 (0.0%) | 0 (0.0%) |
| 18 to 34 Years | 0 (0.0%) | 0 (0.0%) |
| 35 to 64 Years | 0 (0.0%) | 0 (0.0%) |
| 65 to 74 Years | 37 (56.1%) | 24 (12.3%) |
| 75 Years and over | 29 (28.4%) | 0 (0.0%) |
Disability Class: Vision Difficulty
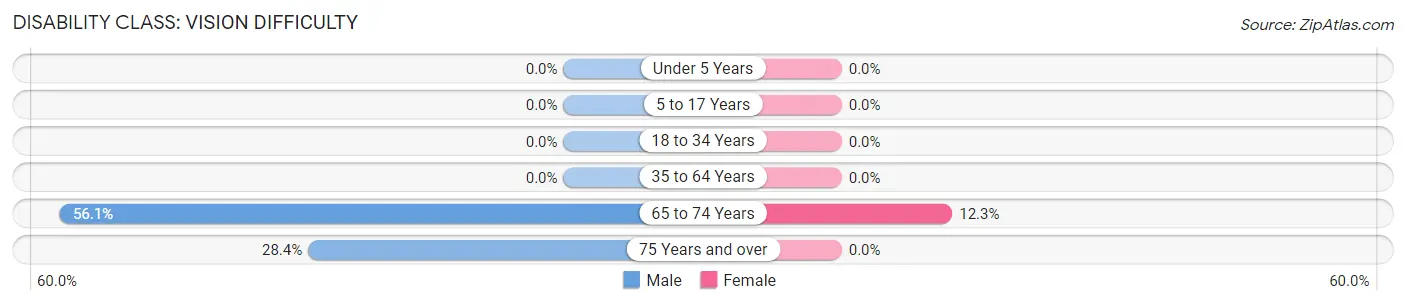
| Age Bracket | Male | Female |
| Under 5 Years | 0 (0.0%) | 0 (0.0%) |
| 5 to 17 Years | 0 (0.0%) | 0 (0.0%) |
| 18 to 34 Years | 0 (0.0%) | 0 (0.0%) |
| 35 to 64 Years | 0 (0.0%) | 0 (0.0%) |
| 65 to 74 Years | 37 (56.1%) | 24 (12.3%) |
| 75 Years and over | 29 (28.4%) | 0 (0.0%) |
Disability Class: Cognitive Difficulty
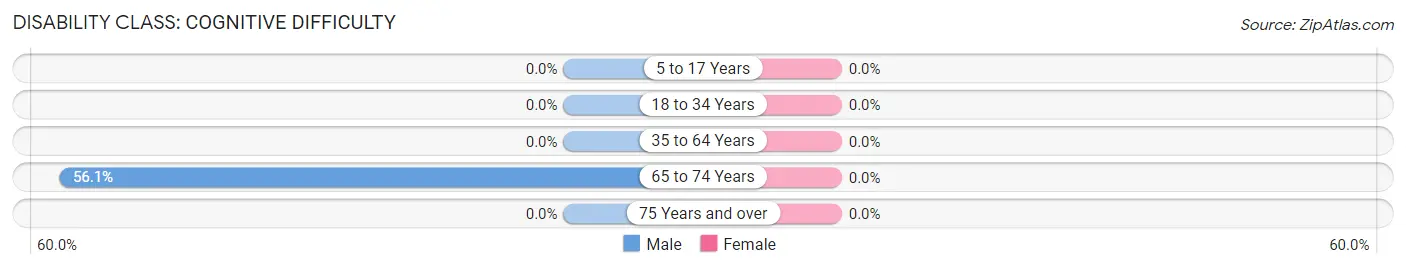
| Age Bracket | Male | Female |
| 5 to 17 Years | 0 (0.0%) | 0 (0.0%) |
| 18 to 34 Years | 0 (0.0%) | 0 (0.0%) |
| 35 to 64 Years | 0 (0.0%) | 0 (0.0%) |
| 65 to 74 Years | 37 (56.1%) | 0 (0.0%) |
| 75 Years and over | 0 (0.0%) | 0 (0.0%) |
Disability Class: Ambulatory Difficulty
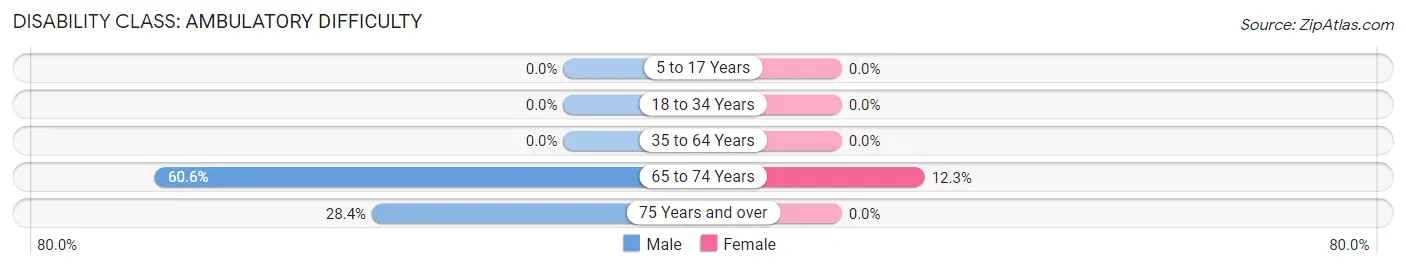
| Age Bracket | Male | Female |
| 5 to 17 Years | 0 (0.0%) | 0 (0.0%) |
| 18 to 34 Years | 0 (0.0%) | 0 (0.0%) |
| 35 to 64 Years | 0 (0.0%) | 0 (0.0%) |
| 65 to 74 Years | 40 (60.6%) | 24 (12.3%) |
| 75 Years and over | 29 (28.4%) | 0 (0.0%) |
Disability Class: Self-Care Difficulty
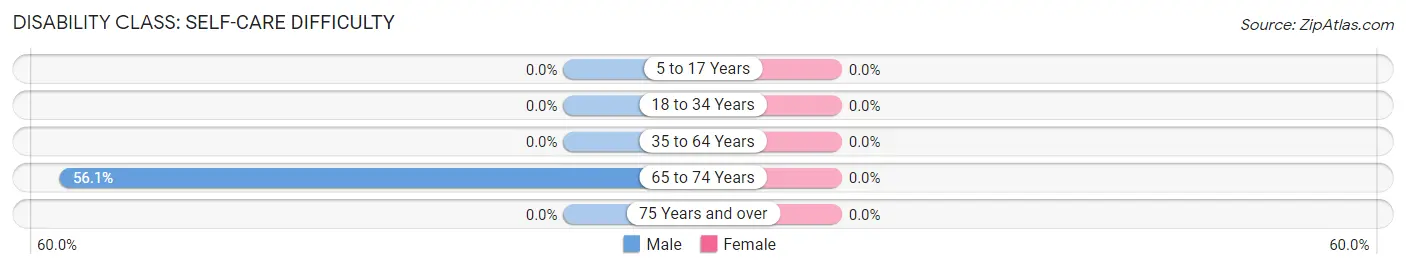
| Age Bracket | Male | Female |
| 5 to 17 Years | 0 (0.0%) | 0 (0.0%) |
| 18 to 34 Years | 0 (0.0%) | 0 (0.0%) |
| 35 to 64 Years | 0 (0.0%) | 0 (0.0%) |
| 65 to 74 Years | 37 (56.1%) | 0 (0.0%) |
| 75 Years and over | 0 (0.0%) | 0 (0.0%) |
Technology Access in Dixon
Computing Device Access in Dixon
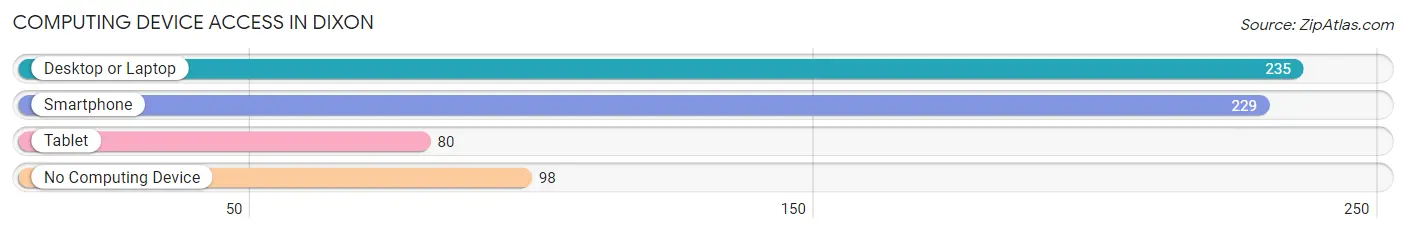
| Device Type | # Households | % Households |
| Desktop or Laptop | 235 | 58.9% |
| Smartphone | 229 | 57.4% |
| Tablet | 80 | 20.1% |
| No Computing Device | 98 | 24.6% |
| Total | 399 | 100.0% |
Internet Access in Dixon
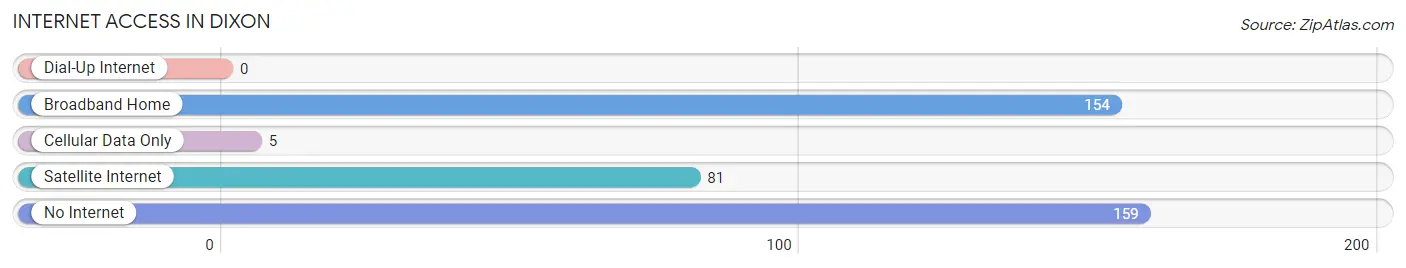
| Internet Type | # Households | % Households |
| Dial-Up Internet | 0 | 0.0% |
| Broadband Home | 154 | 38.6% |
| Cellular Data Only | 5 | 1.3% |
| Satellite Internet | 81 | 20.3% |
| No Internet | 159 | 39.9% |
| Total | 399 | 100.0% |
Dixon Summary
Dixon is a small unincorporated community located in Rio Arriba County, New Mexico. It is situated in the northern part of the state, approximately 25 miles south of the Colorado border. The town is located in the Chama Valley, which is part of the larger Rio Grande Valley. The population of Dixon was estimated to be 1,072 in the 2010 census.
History
The area that is now Dixon was originally inhabited by the Tewa people, who were part of the Pueblo culture. The first European settlers arrived in the area in the late 1800s, and the town was officially established in 1891. The town was named after a local rancher, John Dixon.
In the early 1900s, Dixon was a thriving agricultural community, with many farmers growing crops such as wheat, corn, and alfalfa. The town also had a number of businesses, including a general store, a blacksmith shop, and a hotel.
In the 1950s, the town began to decline as many of the local farmers moved away in search of better opportunities. The town’s population decreased from 1,200 in 1950 to just over 500 in 2000.
Geography
Dixon is located in the northern part of New Mexico, in the Chama Valley. The town is situated at an elevation of 6,890 feet above sea level. The area is characterized by rolling hills and mesas, with the Chama River running through the valley.
The climate in Dixon is semi-arid, with hot summers and cold winters. The average annual temperature is 54°F, and the average annual precipitation is 12.5 inches.
Economy
The economy of Dixon is largely based on agriculture. The town is home to several farms, which grow crops such as wheat, corn, and alfalfa. The town also has a number of small businesses, including a general store, a gas station, and a restaurant.
The town is also home to a number of tourist attractions, including the Chama Valley Historical Museum and the Dixon Historic District.
Demographics
As of the 2010 census, the population of Dixon was 1,072. The racial makeup of the town was 94.3% White, 0.7% African American, 0.7% Native American, 0.3% Asian, 0.1% Pacific Islander, and 3.0% from other races. The median household income was $30,938, and the median family income was $35,625.
Conclusion
Dixon is a small unincorporated community located in Rio Arriba County, New Mexico. It is situated in the northern part of the state, approximately 25 miles south of the Colorado border. The town is characterized by rolling hills and mesas, with the Chama River running through the valley. The economy of Dixon is largely based on agriculture, and the town is home to several tourist attractions. The population of Dixon was estimated to be 1,072 in the 2010 census.
Common Questions
What is Per Capita Income in Dixon?
Per Capita income in Dixon is $17,260.
What is the Median Family Income in Dixon?
Median Family Income in Dixon is $33,106.
What is the Median Household income in Dixon?
Median Household Income in Dixon is $33,674.
What is Income or Wage Gap in Dixon?
Income or Wage Gap in Dixon is 68.8%.
Women in Dixon earn 31.2 cents for every dollar earned by a man.
What is Inequality or Gini Index in Dixon?
Inequality or Gini Index in Dixon is 0.47.
What is the Total Population of Dixon?
Total Population of Dixon is 1,049.
What is the Total Male Population of Dixon?
Total Male Population of Dixon is 501.
What is the Total Female Population of Dixon?
Total Female Population of Dixon is 548.
What is the Ratio of Males per 100 Females in Dixon?
There are 91.42 Males per 100 Females in Dixon.
What is the Ratio of Females per 100 Males in Dixon?
There are 109.38 Females per 100 Males in Dixon.
What is the Median Population Age in Dixon?
Median Population Age in Dixon is 57.7 Years.
What is the Average Family Size in Dixon
Average Family Size in Dixon is 4.2 People.
What is the Average Household Size in Dixon
Average Household Size in Dixon is 2.6 People.
How Large is the Labor Force in Dixon?
There are 306 People in the Labor Forcein in Dixon.
What is the Percentage of People in the Labor Force in Dixon?
35.0% of People are in the Labor Force in Dixon.