Dexter, NM Map & Demographics
Dexter Map
Dexter Overview
$19,172
PER CAPITA INCOME
$64,318
AVG FAMILY INCOME
$48,750
AVG HOUSEHOLD INCOME
56.7%
WAGE / INCOME GAP [ % ]
43.3¢/ $1
WAGE / INCOME GAP [ $ ]
0.41
INEQUALITY / GINI INDEX
1,025
TOTAL POPULATION
524
MALE POPULATION
501
FEMALE POPULATION
104.59
MALES / 100 FEMALES
95.61
FEMALES / 100 MALES
34.7
MEDIAN AGE
2.9
AVG FAMILY SIZE
2.5
AVG HOUSEHOLD SIZE
447
LABOR FORCE [ PEOPLE ]
60.7%
PERCENT IN LABOR FORCE
9.6%
UNEMPLOYMENT RATE
Dexter Zip Codes
Dexter Area Codes
Income in Dexter
Income Overview in Dexter
Per Capita Income in Dexter is $19,172, while median incomes of families and households are $64,318 and $48,750 respectively.
| Characteristic | Number | Measure |
| Per Capita Income | 1,025 | $19,172 |
| Median Family Income | 328 | $64,318 |
| Mean Family Income | 328 | $61,987 |
| Median Household Income | 403 | $48,750 |
| Mean Household Income | 403 | $56,066 |
| Income Deficit | 328 | $0 |
| Wage / Income Gap (%) | 1,025 | 56.71% |
| Wage / Income Gap ($) | 1,025 | 43.29¢ per $1 |
| Gini / Inequality Index | 1,025 | 0.41 |
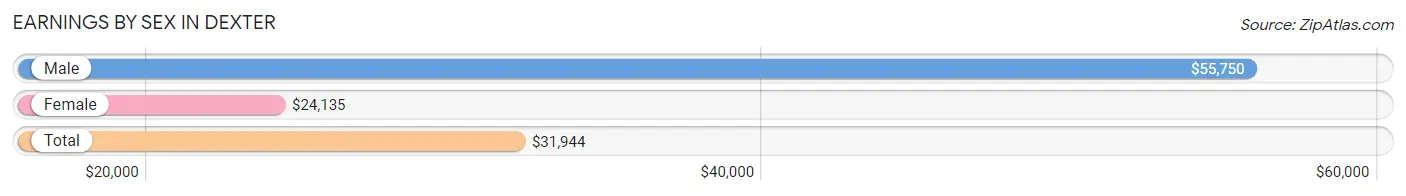
Earnings by Sex in Dexter
Average Earnings in Dexter are $31,944, $55,750 for men and $24,135 for women, a difference of 56.7%.
| Sex | Number | Average Earnings |
| Male | 283 (70.1%) | $55,750 |
| Female | 121 (29.9%) | $24,135 |
| Total | 404 (100.0%) | $31,944 |
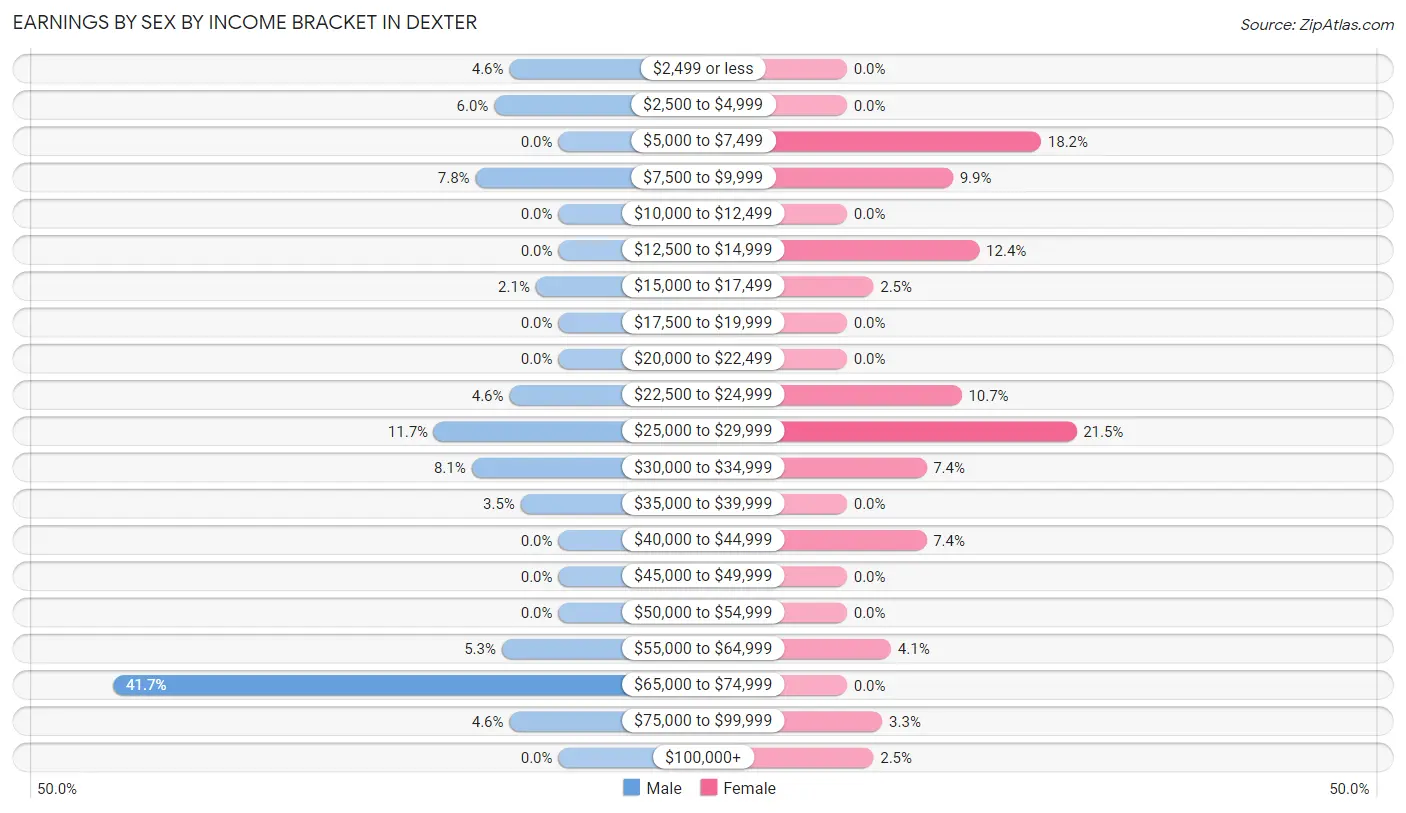
Earnings by Sex by Income Bracket in Dexter
The most common earnings brackets in Dexter are $65,000 to $74,999 for men (118 | 41.7%) and $25,000 to $29,999 for women (26 | 21.5%).
| Income | Male | Female |
| $2,499 or less | 13 (4.6%) | 0 (0.0%) |
| $2,500 to $4,999 | 17 (6.0%) | 0 (0.0%) |
| $5,000 to $7,499 | 0 (0.0%) | 22 (18.2%) |
| $7,500 to $9,999 | 22 (7.8%) | 12 (9.9%) |
| $10,000 to $12,499 | 0 (0.0%) | 0 (0.0%) |
| $12,500 to $14,999 | 0 (0.0%) | 15 (12.4%) |
| $15,000 to $17,499 | 6 (2.1%) | 3 (2.5%) |
| $17,500 to $19,999 | 0 (0.0%) | 0 (0.0%) |
| $20,000 to $22,499 | 0 (0.0%) | 0 (0.0%) |
| $22,500 to $24,999 | 13 (4.6%) | 13 (10.7%) |
| $25,000 to $29,999 | 33 (11.7%) | 26 (21.5%) |
| $30,000 to $34,999 | 23 (8.1%) | 9 (7.4%) |
| $35,000 to $39,999 | 10 (3.5%) | 0 (0.0%) |
| $40,000 to $44,999 | 0 (0.0%) | 9 (7.4%) |
| $45,000 to $49,999 | 0 (0.0%) | 0 (0.0%) |
| $50,000 to $54,999 | 0 (0.0%) | 0 (0.0%) |
| $55,000 to $64,999 | 15 (5.3%) | 5 (4.1%) |
| $65,000 to $74,999 | 118 (41.7%) | 0 (0.0%) |
| $75,000 to $99,999 | 13 (4.6%) | 4 (3.3%) |
| $100,000+ | 0 (0.0%) | 3 (2.5%) |
| Total | 283 (100.0%) | 121 (100.0%) |
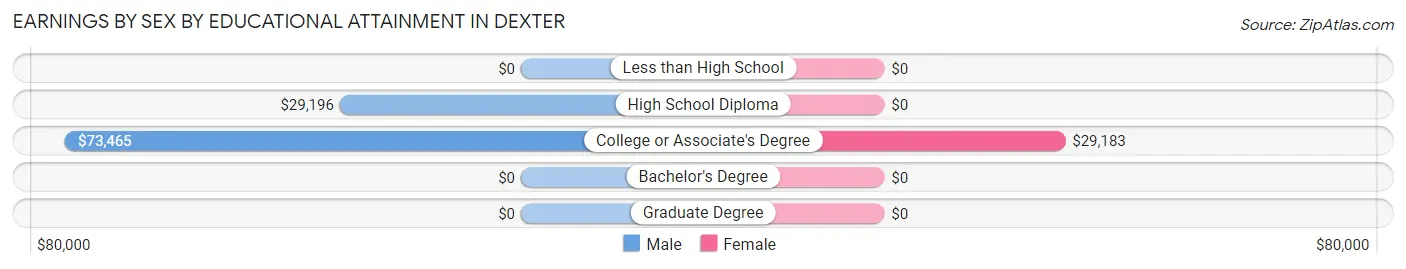
Earnings by Sex by Educational Attainment in Dexter
Average earnings in Dexter are $65,333 for men and $27,692 for women, a difference of 57.6%. Men with an educational attainment of college or associate's degree enjoy the highest average annual earnings of $73,465, while those with high school diploma education earn the least with $29,196. Women with an educational attainment of college or associate's degree earn the most with the average annual earnings of $29,183, while those with college or associate's degree education have the smallest earnings of $29,183.
| Educational Attainment | Male Income | Female Income |
| Less than High School | - | - |
| High School Diploma | $29,196 | $0 |
| College or Associate's Degree | $73,465 | $29,183 |
| Bachelor's Degree | - | - |
| Graduate Degree | - | - |
| Total | $65,333 | $27,692 |
Family Income in Dexter
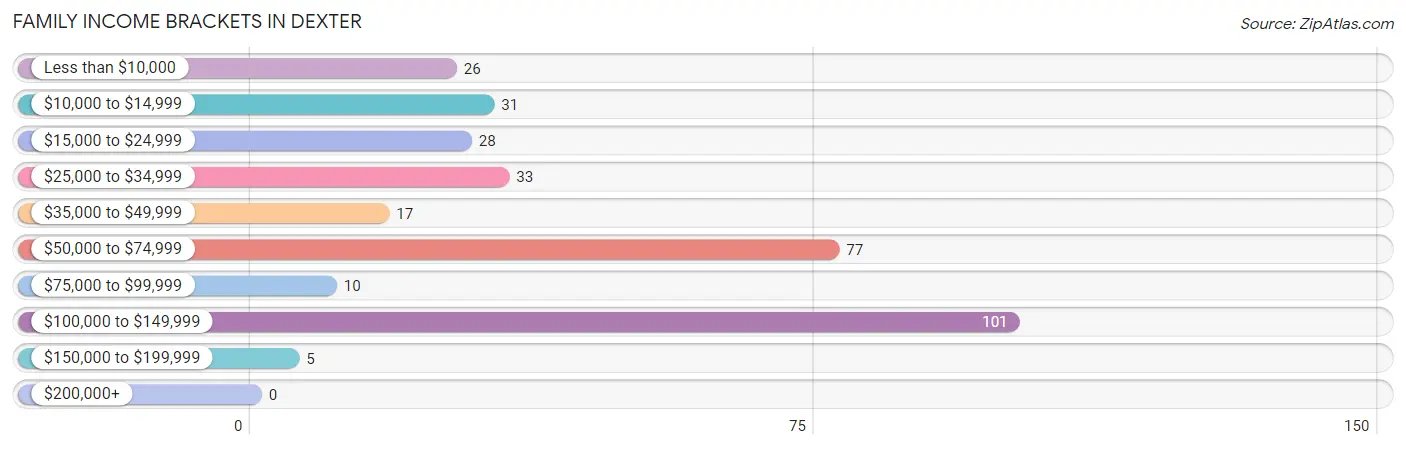
Family Income Brackets in Dexter
According to the Dexter family income data, there are 101 families falling into the $100,000 to $149,999 income range, which is the most common income bracket and makes up 30.8% of all families.
| Income Bracket | # Families | % Families |
| Less than $10,000 | 26 | 7.9% |
| $10,000 to $14,999 | 31 | 9.5% |
| $15,000 to $24,999 | 28 | 8.5% |
| $25,000 to $34,999 | 33 | 10.1% |
| $35,000 to $49,999 | 17 | 5.2% |
| $50,000 to $74,999 | 77 | 23.5% |
| $75,000 to $99,999 | 10 | 3.0% |
| $100,000 to $149,999 | 101 | 30.8% |
| $150,000 to $199,999 | 5 | 1.5% |
| $200,000+ | 0 | 0.0% |
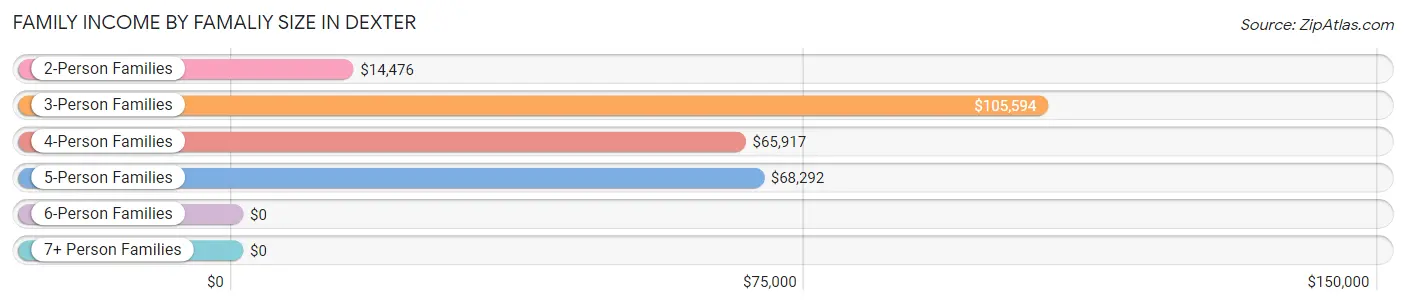
Family Income by Famaliy Size in Dexter
3-person families (164 | 50.0%) account for the highest median family income in Dexter with $105,594 per family, while 3-person families (164 | 50.0%) have the highest median income of $35,198 per family member.
| Income Bracket | # Families | Median Income |
| 2-Person Families | 77 (23.5%) | $14,476 |
| 3-Person Families | 164 (50.0%) | $105,594 |
| 4-Person Families | 35 (10.7%) | $65,917 |
| 5-Person Families | 41 (12.5%) | $68,292 |
| 6-Person Families | 11 (3.4%) | $0 |
| 7+ Person Families | 0 (0.0%) | $0 |
| Total | 328 (100.0%) | $64,318 |
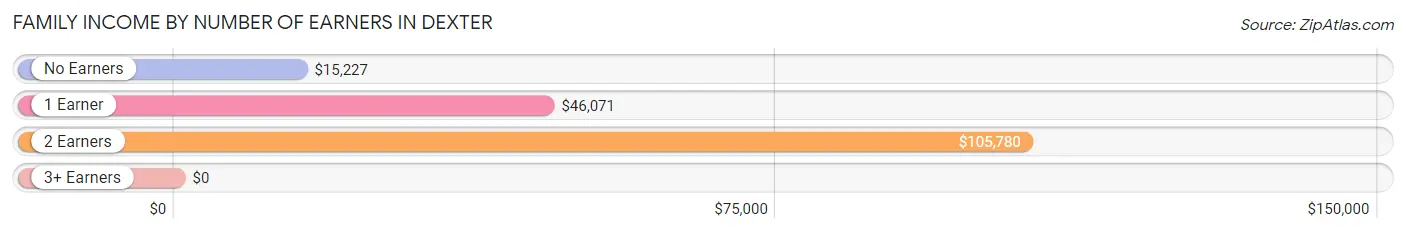
Family Income by Number of Earners in Dexter
| Number of Earners | # Families | Median Income |
| No Earners | 60 (18.3%) | $15,227 |
| 1 Earner | 94 (28.7%) | $46,071 |
| 2 Earners | 149 (45.4%) | $105,780 |
| 3+ Earners | 25 (7.6%) | $0 |
| Total | 328 (100.0%) | $64,318 |
Household Income in Dexter
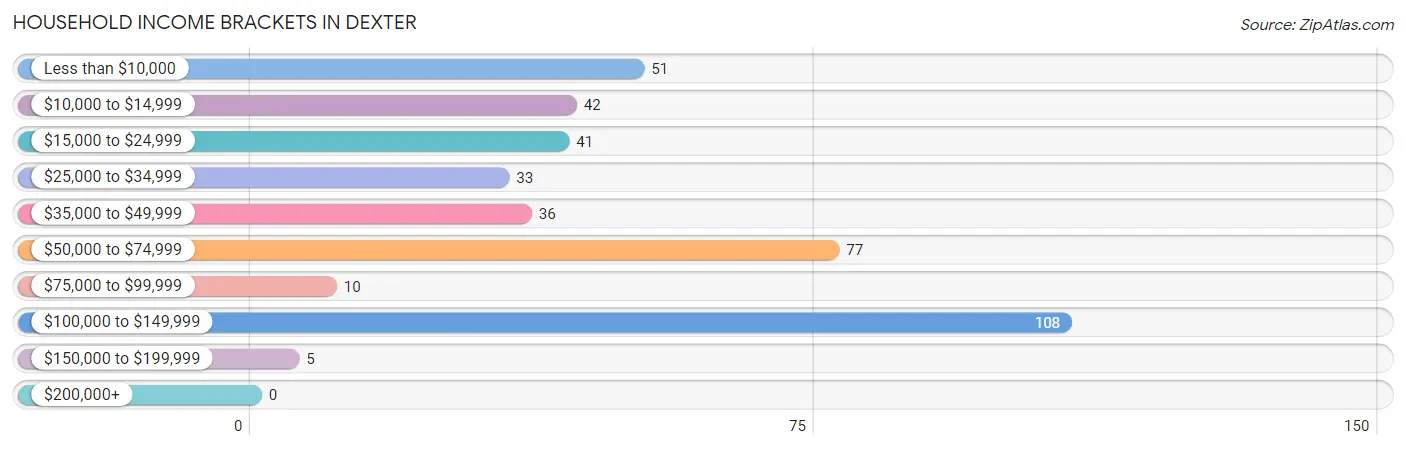
Household Income Brackets in Dexter
With 108 households falling in the category, the $100,000 to $149,999 income range is the most frequent in Dexter, accounting for 26.8% of all households.
| Income Bracket | # Households | % Households |
| Less than $10,000 | 51 | 12.7% |
| $10,000 to $14,999 | 42 | 10.4% |
| $15,000 to $24,999 | 41 | 10.2% |
| $25,000 to $34,999 | 33 | 8.2% |
| $35,000 to $49,999 | 36 | 8.9% |
| $50,000 to $74,999 | 77 | 19.1% |
| $75,000 to $99,999 | 10 | 2.5% |
| $100,000 to $149,999 | 108 | 26.8% |
| $150,000 to $199,999 | 5 | 1.2% |
| $200,000+ | 0 | 0.0% |
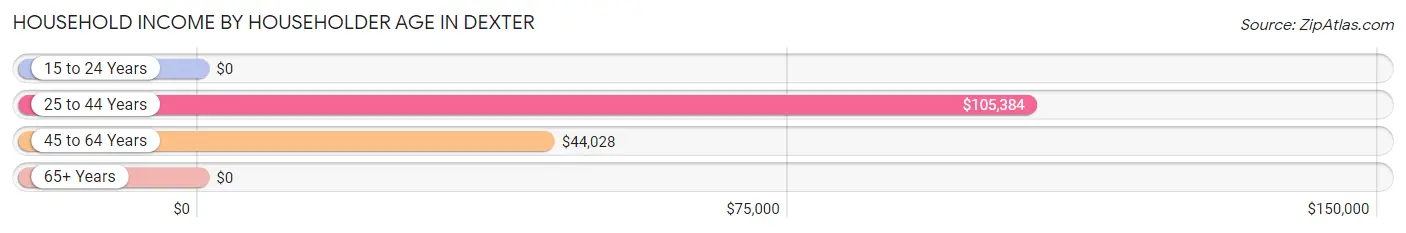
Household Income by Householder Age in Dexter
The median household income in Dexter is $48,750, with the highest median household income of $105,384 found in the 25 to 44 years age bracket for the primary householder. A total of 181 households (44.9%) fall into this category. Meanwhile, the 15 to 24 years age bracket for the primary householder has the lowest median household income of $0, with 13 households (3.2%) in this group.
| Income Bracket | # Households | Median Income |
| 15 to 24 Years | 13 (3.2%) | $0 |
| 25 to 44 Years | 181 (44.9%) | $105,384 |
| 45 to 64 Years | 109 (27.1%) | $44,028 |
| 65+ Years | 100 (24.8%) | $0 |
| Total | 403 (100.0%) | $48,750 |
Poverty in Dexter
Income Below Poverty by Sex and Age in Dexter
With 29.2% poverty level for males and 28.7% for females among the residents of Dexter, 12 to 14 year old males and 16 and 17 year old females are the most vulnerable to poverty, with 11 males (100.0%) and 8 females (100.0%) in their respective age groups living below the poverty level.
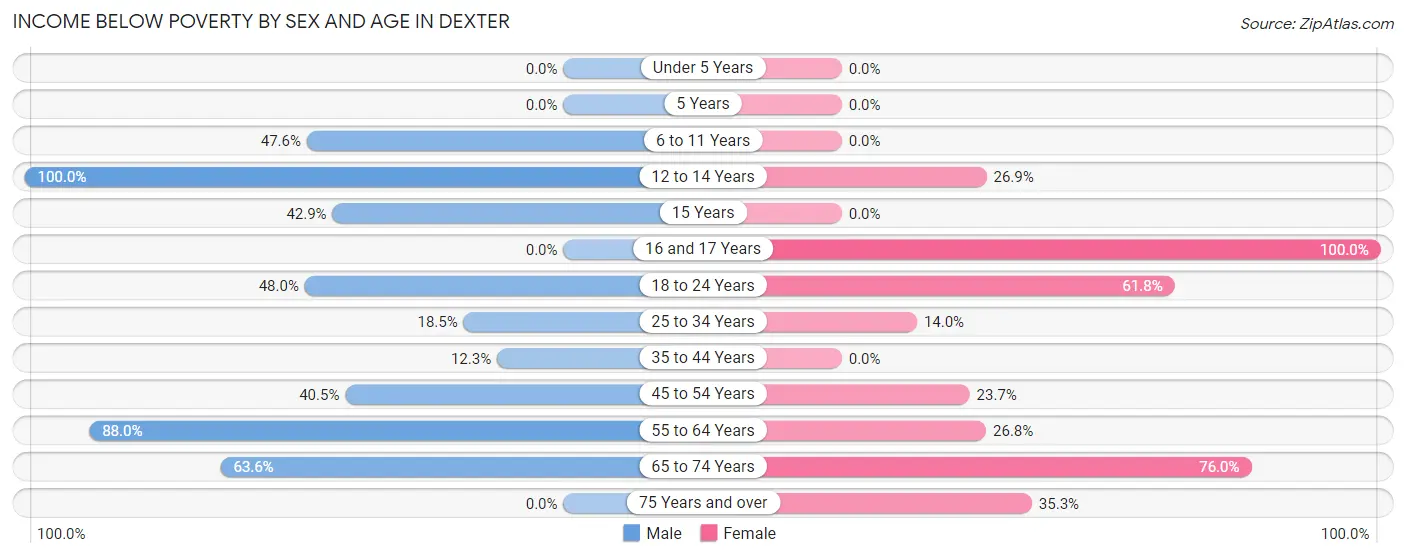
| Age Bracket | Male | Female |
| Under 5 Years | 0 (0.0%) | 0 (0.0%) |
| 5 Years | 0 (0.0%) | 0 (0.0%) |
| 6 to 11 Years | 20 (47.6%) | 0 (0.0%) |
| 12 to 14 Years | 11 (100.0%) | 18 (26.9%) |
| 15 Years | 18 (42.9%) | 0 (0.0%) |
| 16 and 17 Years | 0 (0.0%) | 8 (100.0%) |
| 18 to 24 Years | 12 (48.0%) | 21 (61.8%) |
| 25 to 34 Years | 15 (18.5%) | 12 (14.0%) |
| 35 to 44 Years | 17 (12.3%) | 0 (0.0%) |
| 45 to 54 Years | 17 (40.5%) | 14 (23.7%) |
| 55 to 64 Years | 22 (88.0%) | 15 (26.8%) |
| 65 to 74 Years | 21 (63.6%) | 38 (76.0%) |
| 75 Years and over | 0 (0.0%) | 18 (35.3%) |
| Total | 153 (29.2%) | 144 (28.7%) |
Income Above Poverty by Sex and Age in Dexter
According to the poverty statistics in Dexter, males aged under 5 years and females aged under 5 years are the age groups that are most secure financially, with 100.0% of males and 100.0% of females in these age groups living above the poverty line.
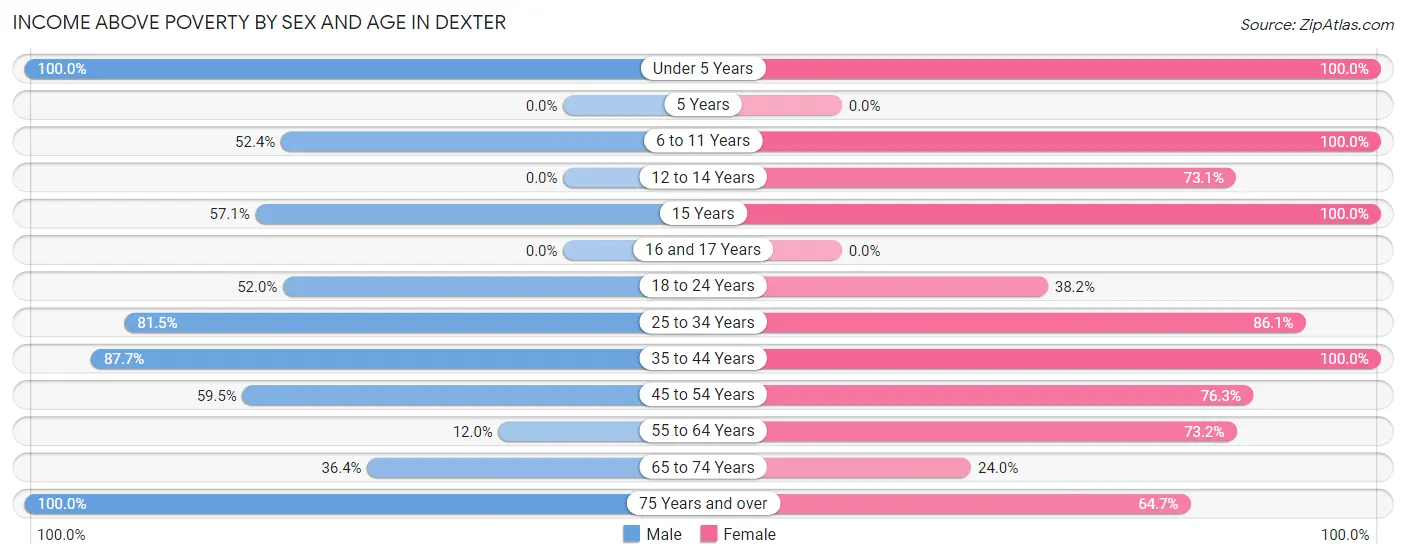
| Age Bracket | Male | Female |
| Under 5 Years | 53 (100.0%) | 5 (100.0%) |
| 5 Years | 0 (0.0%) | 0 (0.0%) |
| 6 to 11 Years | 22 (52.4%) | 55 (100.0%) |
| 12 to 14 Years | 0 (0.0%) | 49 (73.1%) |
| 15 Years | 24 (57.1%) | 13 (100.0%) |
| 16 and 17 Years | 0 (0.0%) | 0 (0.0%) |
| 18 to 24 Years | 13 (52.0%) | 13 (38.2%) |
| 25 to 34 Years | 66 (81.5%) | 74 (86.1%) |
| 35 to 44 Years | 121 (87.7%) | 17 (100.0%) |
| 45 to 54 Years | 25 (59.5%) | 45 (76.3%) |
| 55 to 64 Years | 3 (12.0%) | 41 (73.2%) |
| 65 to 74 Years | 12 (36.4%) | 12 (24.0%) |
| 75 Years and over | 32 (100.0%) | 33 (64.7%) |
| Total | 371 (70.8%) | 357 (71.3%) |
Income Below Poverty Among Married-Couple Families in Dexter
The poverty statistics for married-couple families in Dexter show that 21.6% or 53 of the total 245 families live below the poverty line. Families with no children have the highest poverty rate of 59.0%, comprising of 36 families. On the other hand, families with 1 or 2 children have the lowest poverty rate of 3.7%, which includes 6 families.
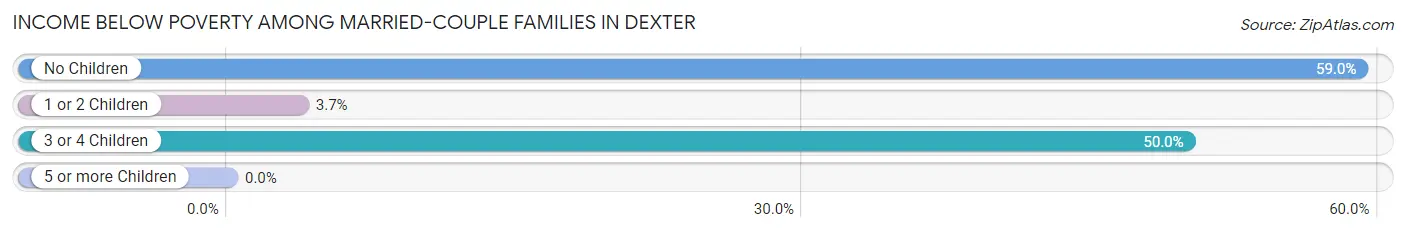
| Children | Above Poverty | Below Poverty |
| No Children | 25 (41.0%) | 36 (59.0%) |
| 1 or 2 Children | 156 (96.3%) | 6 (3.7%) |
| 3 or 4 Children | 11 (50.0%) | 11 (50.0%) |
| 5 or more Children | 0 (0.0%) | 0 (0.0%) |
| Total | 192 (78.4%) | 53 (21.6%) |
Income Below Poverty Among Single-Parent Households in Dexter
According to the poverty data in Dexter, 100.0% or 17 single-father households and 39.4% or 26 single-mother households are living below the poverty line. Among single-father households, those with no children have the highest poverty rate, with 17 households (100.0%) experiencing poverty. Likewise, among single-mother households, those with 3 or 4 children have the highest poverty rate, with 12 households (100.0%) falling below the poverty line.
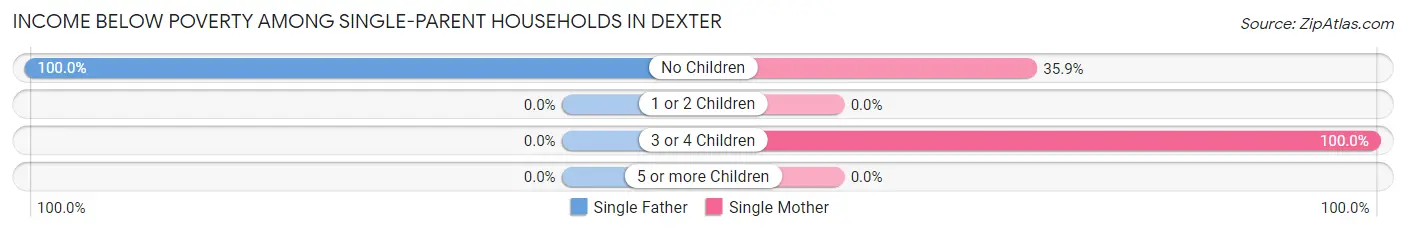
| Children | Single Father | Single Mother |
| No Children | 17 (100.0%) | 14 (35.9%) |
| 1 or 2 Children | 0 (0.0%) | 0 (0.0%) |
| 3 or 4 Children | 0 (0.0%) | 12 (100.0%) |
| 5 or more Children | 0 (0.0%) | 0 (0.0%) |
| Total | 17 (100.0%) | 26 (39.4%) |
Income Below Poverty Among Married-Couple vs Single-Parent Households in Dexter
The poverty data for Dexter shows that 53 of the married-couple family households (21.6%) and 43 of the single-parent households (51.8%) are living below the poverty level. Within the married-couple family households, those with no children have the highest poverty rate, with 36 households (59.0%) falling below the poverty line. Among the single-parent households, those with 3 or 4 children have the highest poverty rate, with 12 household (100.0%) living below poverty.
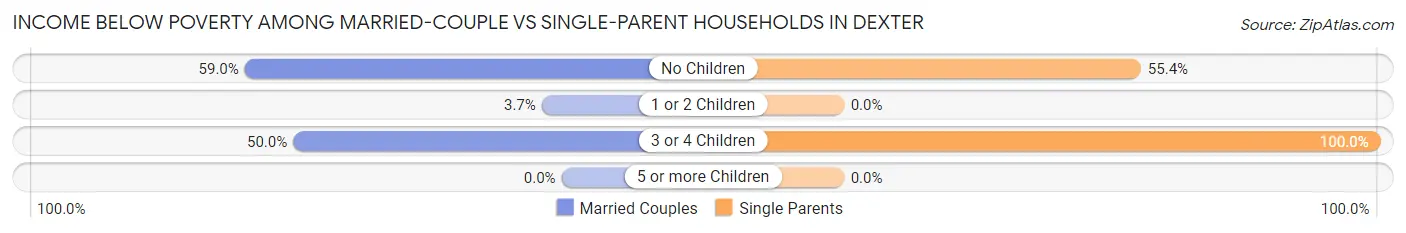
| Children | Married-Couple Families | Single-Parent Households |
| No Children | 36 (59.0%) | 31 (55.4%) |
| 1 or 2 Children | 6 (3.7%) | 0 (0.0%) |
| 3 or 4 Children | 11 (50.0%) | 12 (100.0%) |
| 5 or more Children | 0 (0.0%) | 0 (0.0%) |
| Total | 53 (21.6%) | 43 (51.8%) |
Race in Dexter
The most populous races in Dexter are Hispanic or Latino (910 | 88.8%), White / Caucasian (632 | 61.7%), and Two or more Races (372 | 36.3%).
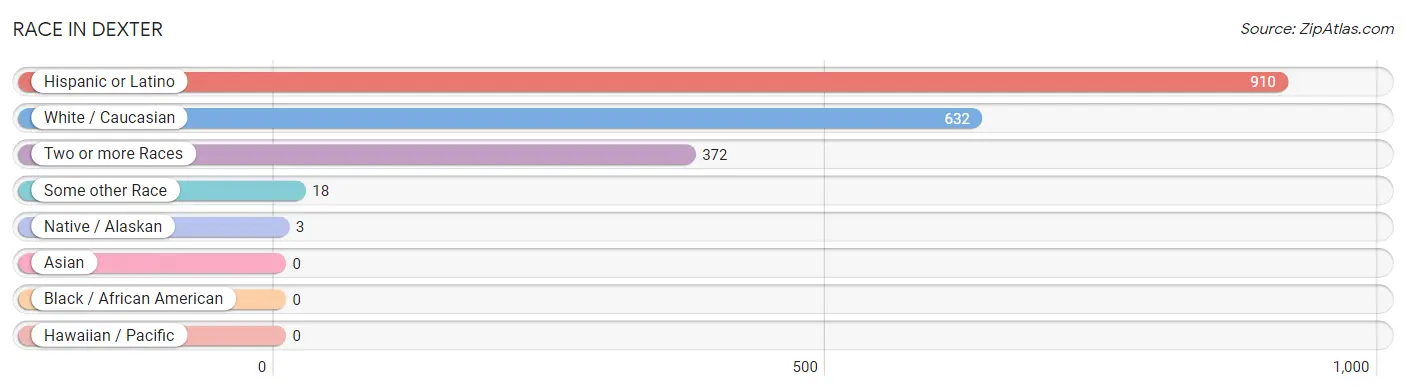
| Race | # Population | % Population |
| Asian | 0 | 0.0% |
| Black / African American | 0 | 0.0% |
| Hawaiian / Pacific | 0 | 0.0% |
| Hispanic or Latino | 910 | 88.8% |
| Native / Alaskan | 3 | 0.3% |
| White / Caucasian | 632 | 61.7% |
| Two or more Races | 372 | 36.3% |
| Some other Race | 18 | 1.8% |
| Total | 1,025 | 100.0% |
Ancestry in Dexter
The most populous ancestries reported in Dexter are Mexican (858 | 83.7%), American (24 | 2.3%), British (15 | 1.5%), Pueblo (10 | 1.0%), and Apache (9 | 0.9%), together accounting for 89.4% of all Dexter residents.
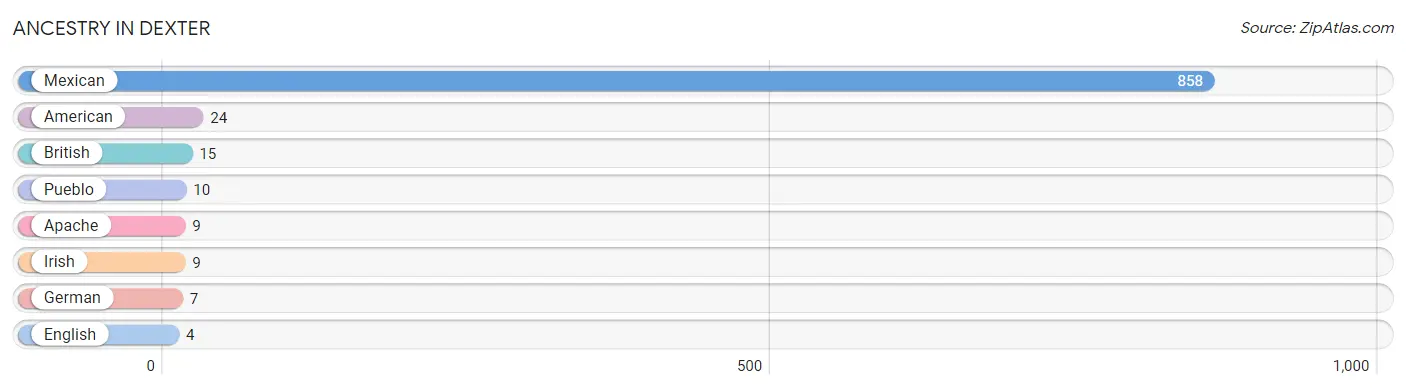
| Ancestry | # Population | % Population |
| American | 24 | 2.3% |
| Apache | 9 | 0.9% |
| British | 15 | 1.5% |
| English | 4 | 0.4% |
| German | 7 | 0.7% |
| Irish | 9 | 0.9% |
| Mexican | 858 | 83.7% |
| Pueblo | 10 | 1.0% | View All 8 Rows |
Immigrants in Dexter
The most numerous immigrant groups reported in Dexter came from Central America (230 | 22.4%), Latin America (230 | 22.4%), and Mexico (230 | 22.4%), together accounting for 67.3% of all Dexter residents.
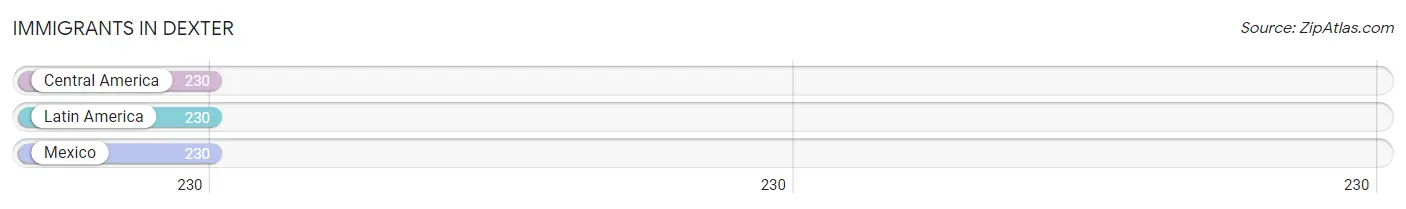
| Immigration Origin | # Population | % Population |
| Central America | 230 | 22.4% |
| Latin America | 230 | 22.4% |
| Mexico | 230 | 22.4% | View All 3 Rows |
Sex and Age in Dexter
Sex and Age in Dexter
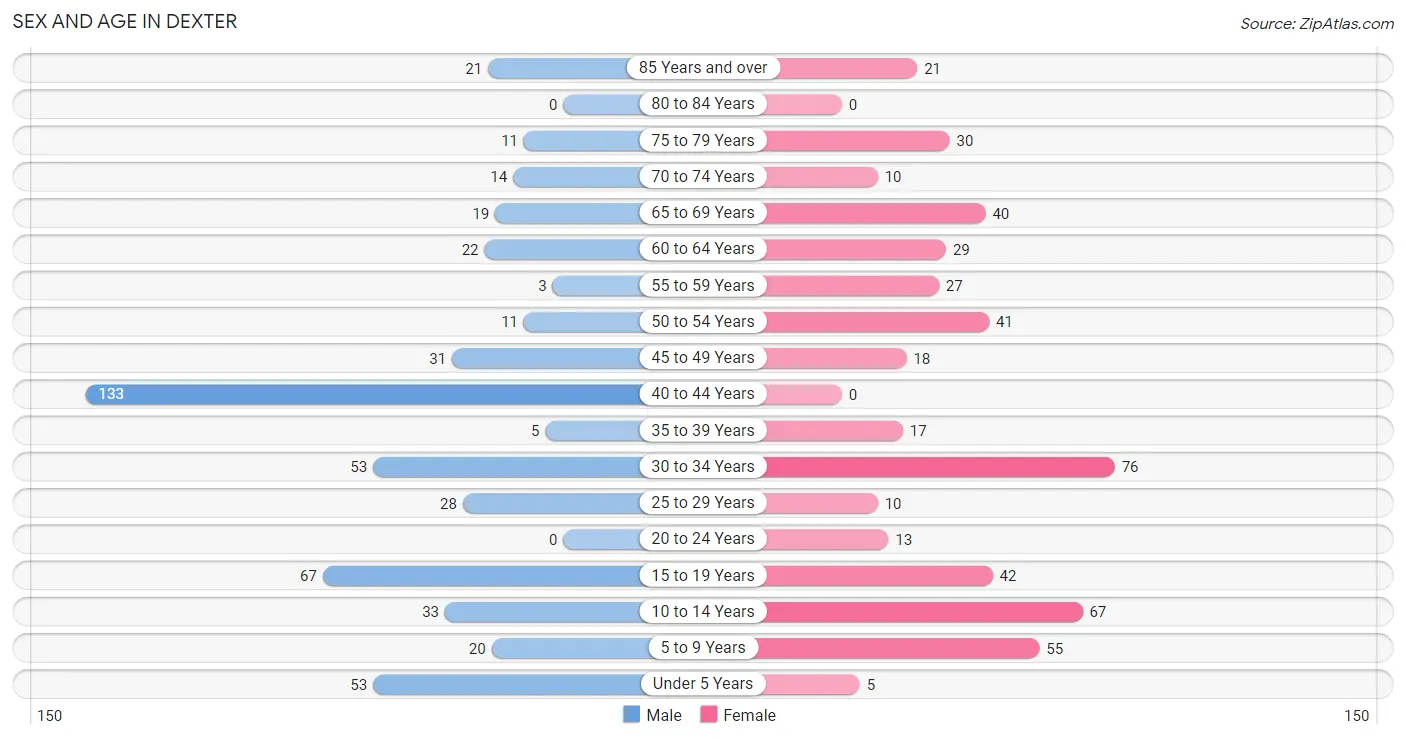
The most populous age groups in Dexter are 40 to 44 Years (133 | 25.4%) for men and 30 to 34 Years (76 | 15.2%) for women.
| Age Bracket | Male | Female |
| Under 5 Years | 53 (10.1%) | 5 (1.0%) |
| 5 to 9 Years | 20 (3.8%) | 55 (11.0%) |
| 10 to 14 Years | 33 (6.3%) | 67 (13.4%) |
| 15 to 19 Years | 67 (12.8%) | 42 (8.4%) |
| 20 to 24 Years | 0 (0.0%) | 13 (2.6%) |
| 25 to 29 Years | 28 (5.3%) | 10 (2.0%) |
| 30 to 34 Years | 53 (10.1%) | 76 (15.2%) |
| 35 to 39 Years | 5 (0.9%) | 17 (3.4%) |
| 40 to 44 Years | 133 (25.4%) | 0 (0.0%) |
| 45 to 49 Years | 31 (5.9%) | 18 (3.6%) |
| 50 to 54 Years | 11 (2.1%) | 41 (8.2%) |
| 55 to 59 Years | 3 (0.6%) | 27 (5.4%) |
| 60 to 64 Years | 22 (4.2%) | 29 (5.8%) |
| 65 to 69 Years | 19 (3.6%) | 40 (8.0%) |
| 70 to 74 Years | 14 (2.7%) | 10 (2.0%) |
| 75 to 79 Years | 11 (2.1%) | 30 (6.0%) |
| 80 to 84 Years | 0 (0.0%) | 0 (0.0%) |
| 85 Years and over | 21 (4.0%) | 21 (4.2%) |
| Total | 524 (100.0%) | 501 (100.0%) |
Families and Households in Dexter
Median Family Size in Dexter
The median family size in Dexter is 2.90 persons per family, with single female/mother families (66 | 20.1%) accounting for the largest median family size of 3.77 persons per family. On the other hand, single male/father families (17 | 5.2%) represent the smallest median family size with 1.71 persons per family.
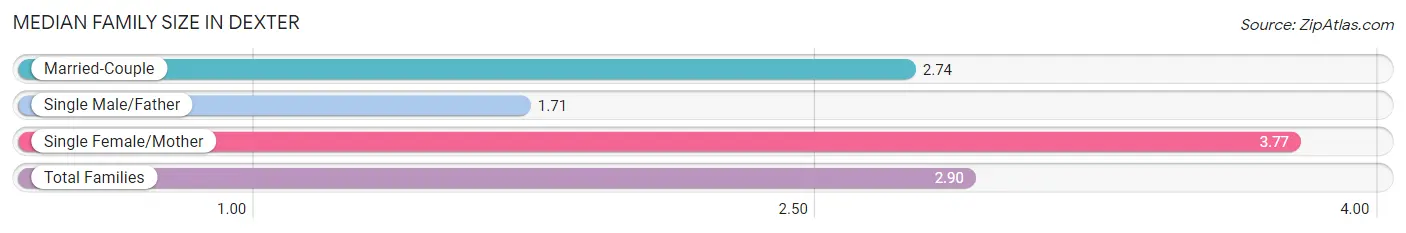
| Family Type | # Families | Family Size |
| Married-Couple | 245 (74.7%) | 2.74 |
| Single Male/Father | 17 (5.2%) | 1.71 |
| Single Female/Mother | 66 (20.1%) | 3.77 |
| Total Families | 328 (100.0%) | 2.90 |
Median Household Size in Dexter
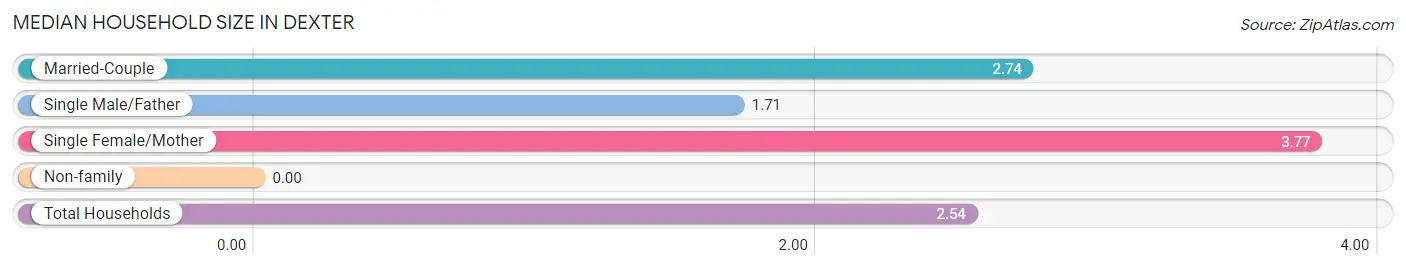
| Household Type | # Households | Household Size |
| Married-Couple | 245 (60.8%) | 2.74 |
| Single Male/Father | 17 (4.2%) | 1.71 |
| Single Female/Mother | 66 (16.4%) | 3.77 |
| Non-family | 75 (18.6%) | - |
| Total Households | 403 (100.0%) | 2.54 |
Household Size by Marriage Status in Dexter
Out of a total of 403 households in Dexter, 328 (81.4%) are family households, while 75 (18.6%) are nonfamily households. The most numerous type of family households are 3-person households, comprising 164, and the most common type of nonfamily households are 1-person households, comprising 75.
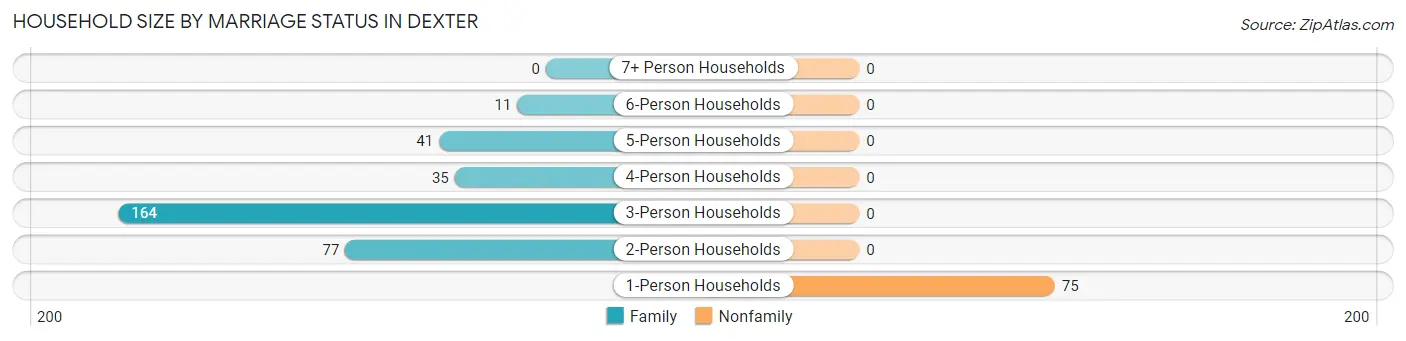
| Household Size | Family Households | Nonfamily Households |
| 1-Person Households | - | 75 (18.6%) |
| 2-Person Households | 77 (19.1%) | 0 (0.0%) |
| 3-Person Households | 164 (40.7%) | 0 (0.0%) |
| 4-Person Households | 35 (8.7%) | 0 (0.0%) |
| 5-Person Households | 41 (10.2%) | 0 (0.0%) |
| 6-Person Households | 11 (2.7%) | 0 (0.0%) |
| 7+ Person Households | 0 (0.0%) | 0 (0.0%) |
| Total | 328 (81.4%) | 75 (18.6%) |
Female Fertility in Dexter
Fertility by Age in Dexter
| Age Bracket | Women with Births | Births / 1,000 Women |
| 15 to 19 years | 0 (0.0%) | 0.0 |
| 20 to 34 years | 0 (0.0%) | 0.0 |
| 35 to 50 years | 0 (0.0%) | 0.0 |
| Total | 0 (0.0%) | 0.0 |
Fertility by Age by Marriage Status in Dexter
| Age Bracket | Married | Unmarried |
| 15 to 19 years | 0 (0.0%) | 0 (0.0%) |
| 20 to 34 years | 0 (0.0%) | 0 (0.0%) |
| 35 to 50 years | 0 (0.0%) | 0 (0.0%) |
| Total | 0 (0.0%) | 0 (0.0%) |
Fertility by Education in Dexter
| Educational Attainment | Women with Births | Births / 1,000 Women |
| Less than High School | 0 (0.0%) | 0.0 |
| High School Diploma | 0 (0.0%) | 0.0 |
| College or Associate's Degree | 0 (0.0%) | 0.0 |
| Bachelor's Degree | 0 (0.0%) | 0.0 |
| Graduate Degree | 0 (0.0%) | 0.0 |
| Total | 0 (0.0%) | 0.0 |
Fertility by Education by Marriage Status in Dexter
| Educational Attainment | Married | Unmarried |
| Less than High School | 0 (0.0%) | 0 (0.0%) |
| High School Diploma | 0 (0.0%) | 0 (0.0%) |
| College or Associate's Degree | 0 (0.0%) | 0 (0.0%) |
| Bachelor's Degree | 0 (0.0%) | 0 (0.0%) |
| Graduate Degree | 0 (0.0%) | 0 (0.0%) |
| Total | 0 (0.0%) | 0 (0.0%) |
Employment Characteristics in Dexter
Employment by Class of Employer in Dexter
Among the 404 employed individuals in Dexter, private company employees (210 | 52.0%), federal government employees (101 | 25.0%), and self-employed (not incorporated) (34 | 8.4%) make up the most common classes of employment.
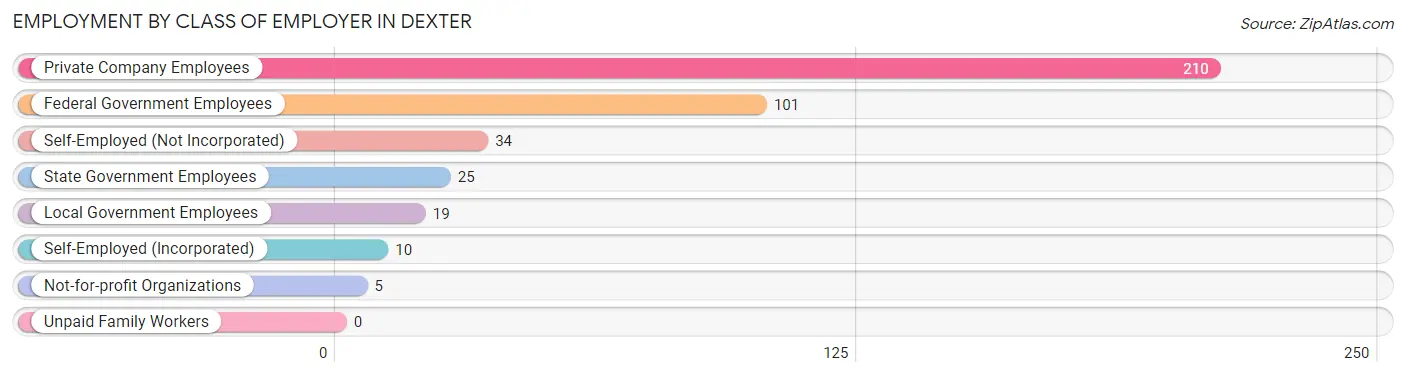
| Employer Class | # Employees | % Employees |
| Private Company Employees | 210 | 52.0% |
| Self-Employed (Incorporated) | 10 | 2.5% |
| Self-Employed (Not Incorporated) | 34 | 8.4% |
| Not-for-profit Organizations | 5 | 1.2% |
| Local Government Employees | 19 | 4.7% |
| State Government Employees | 25 | 6.2% |
| Federal Government Employees | 101 | 25.0% |
| Unpaid Family Workers | 0 | 0.0% |
| Total | 404 | 100.0% |
Employment Status by Age in Dexter
According to the labor force statistics for Dexter, out of the total population over 16 years of age (737), 60.7% or 447 individuals are in the labor force, with 9.6% or 43 of them unemployed. The age group with the highest labor force participation rate is 20 to 24 years, with 100.0% or 13 individuals in the labor force. Within the labor force, the 16 to 19 years age range has the highest percentage of unemployed individuals, with 45.7% or 21 of them being unemployed.
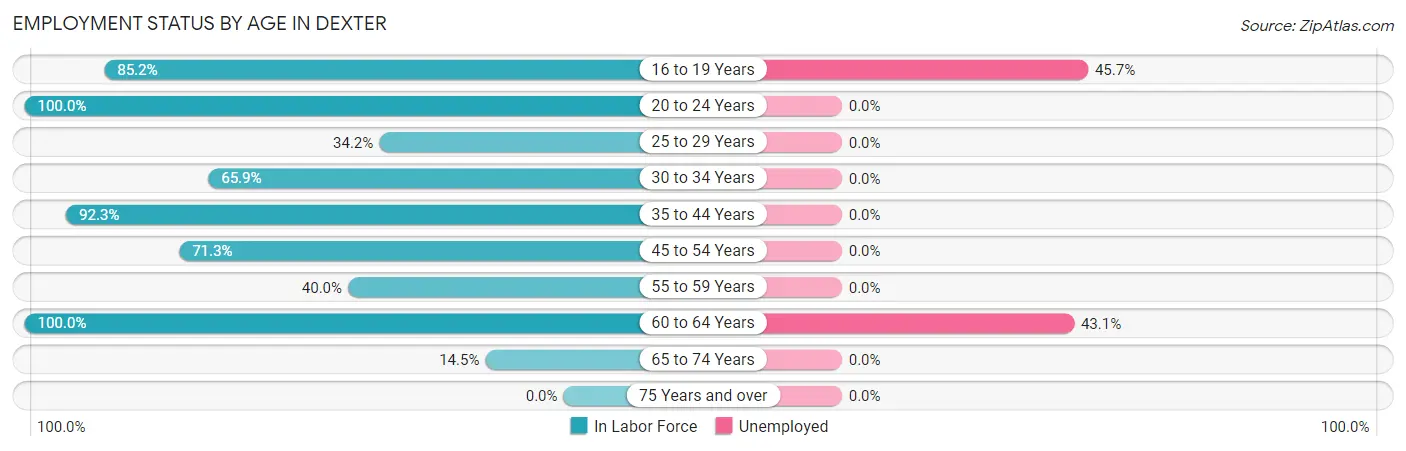
| Age Bracket | In Labor Force | Unemployed |
| 16 to 19 Years | 46 (85.2%) | 21 (45.7%) |
| 20 to 24 Years | 13 (100.0%) | 0 (0.0%) |
| 25 to 29 Years | 13 (34.2%) | 0 (0.0%) |
| 30 to 34 Years | 85 (65.9%) | 0 (0.0%) |
| 35 to 44 Years | 143 (92.3%) | 0 (0.0%) |
| 45 to 54 Years | 72 (71.3%) | 0 (0.0%) |
| 55 to 59 Years | 12 (40.0%) | 0 (0.0%) |
| 60 to 64 Years | 51 (100.0%) | 22 (43.1%) |
| 65 to 74 Years | 12 (14.5%) | 0 (0.0%) |
| 75 Years and over | 0 (0.0%) | 0 (0.0%) |
| Total | 447 (60.7%) | 43 (9.6%) |
Employment Status by Educational Attainment in Dexter
According to labor force statistics for Dexter, 74.6% of individuals (376) out of the total population between 25 and 64 years of age (504) are in the labor force, with 5.9% or 22 of them being unemployed. The group with the highest labor force participation rate are those with the educational attainment of bachelor's degree or higher, with 100.0% or 17 individuals in the labor force. Within the labor force, individuals with less than high school education have the highest percentage of unemployment, with 21.8% or 22 of them being unemployed.
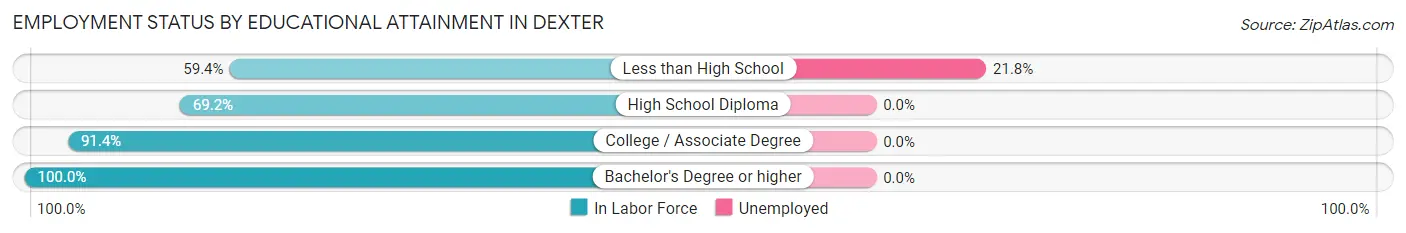
| Educational Attainment | In Labor Force | Unemployed |
| Less than High School | 101 (59.4%) | 37 (21.8%) |
| High School Diploma | 99 (69.2%) | 0 (0.0%) |
| College / Associate Degree | 159 (91.4%) | 0 (0.0%) |
| Bachelor's Degree or higher | 17 (100.0%) | 0 (0.0%) |
| Total | 376 (74.6%) | 30 (5.9%) |
Employment Occupations by Sex in Dexter
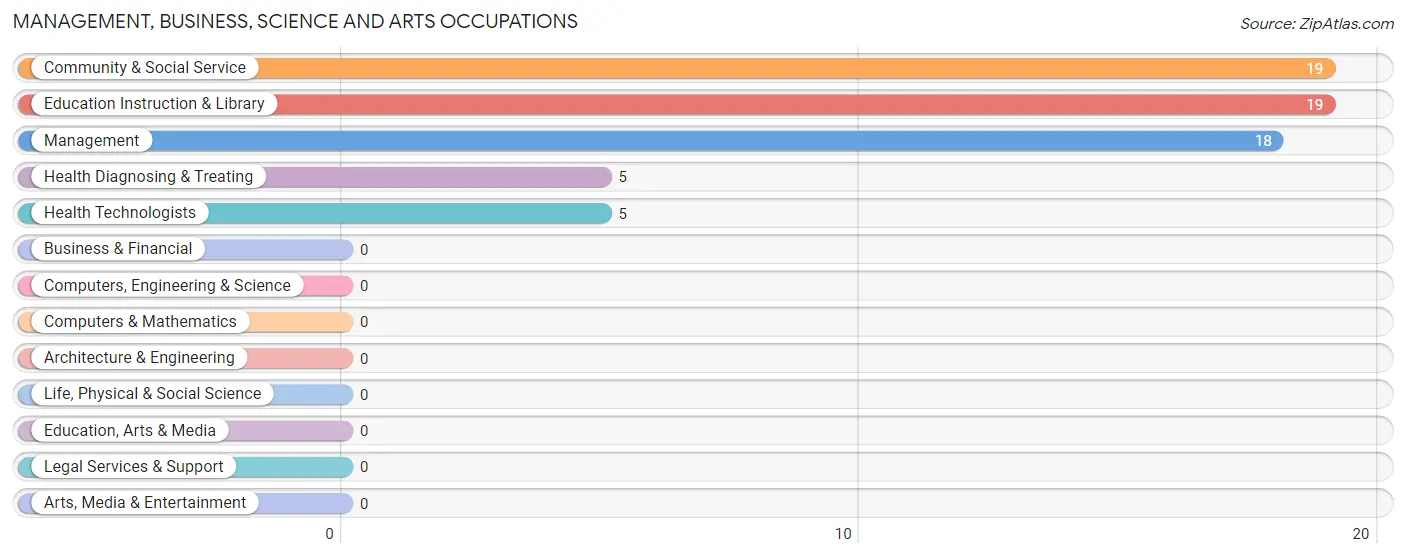
Management, Business, Science and Arts Occupations
The most common Management, Business, Science and Arts occupations in Dexter are Community & Social Service (19 | 4.7%), Education Instruction & Library (19 | 4.7%), Management (18 | 4.5%), Health Diagnosing & Treating (5 | 1.2%), and Health Technologists (5 | 1.2%).
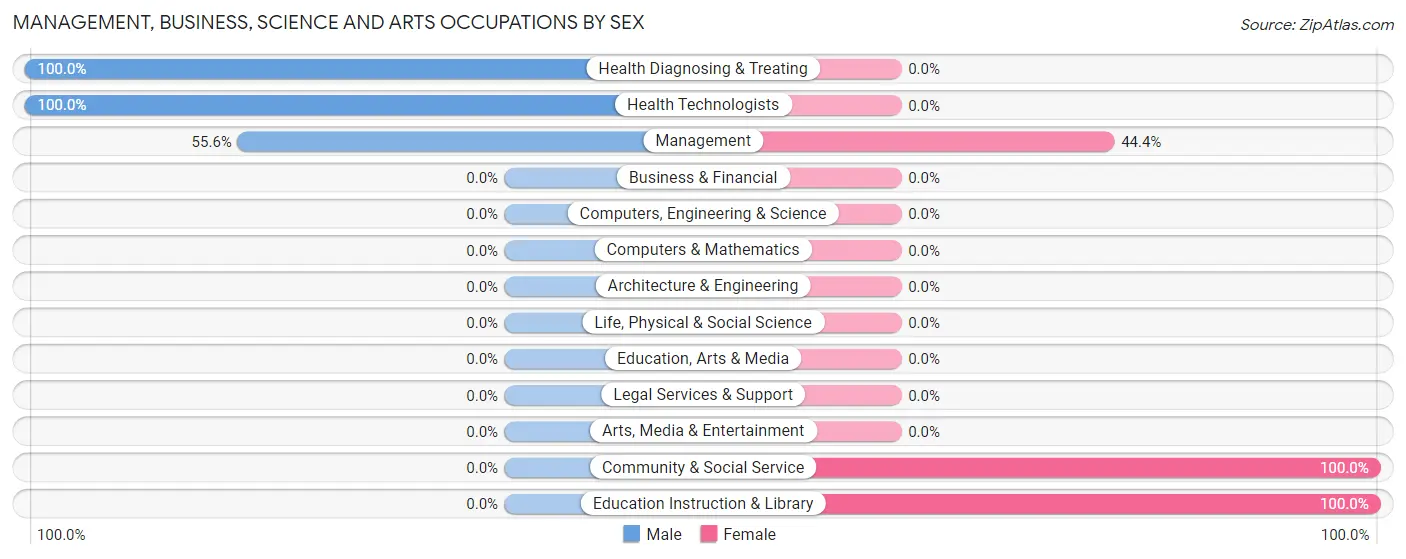
Management, Business, Science and Arts Occupations by Sex
Within the Management, Business, Science and Arts occupations in Dexter, the most male-oriented occupations are Health Diagnosing & Treating (100.0%), Health Technologists (100.0%), and Management (55.6%), while the most female-oriented occupations are Community & Social Service (100.0%), Education Instruction & Library (100.0%), and Management (44.4%).
| Occupation | Male | Female |
| Management | 10 (55.6%) | 8 (44.4%) |
| Business & Financial | 0 (0.0%) | 0 (0.0%) |
| Computers, Engineering & Science | 0 (0.0%) | 0 (0.0%) |
| Computers & Mathematics | 0 (0.0%) | 0 (0.0%) |
| Architecture & Engineering | 0 (0.0%) | 0 (0.0%) |
| Life, Physical & Social Science | 0 (0.0%) | 0 (0.0%) |
| Community & Social Service | 0 (0.0%) | 19 (100.0%) |
| Education, Arts & Media | 0 (0.0%) | 0 (0.0%) |
| Legal Services & Support | 0 (0.0%) | 0 (0.0%) |
| Education Instruction & Library | 0 (0.0%) | 19 (100.0%) |
| Arts, Media & Entertainment | 0 (0.0%) | 0 (0.0%) |
| Health Diagnosing & Treating | 5 (100.0%) | 0 (0.0%) |
| Health Technologists | 5 (100.0%) | 0 (0.0%) |
| Total (Category) | 15 (35.7%) | 27 (64.3%) |
| Total (Overall) | 283 (70.1%) | 121 (29.9%) |
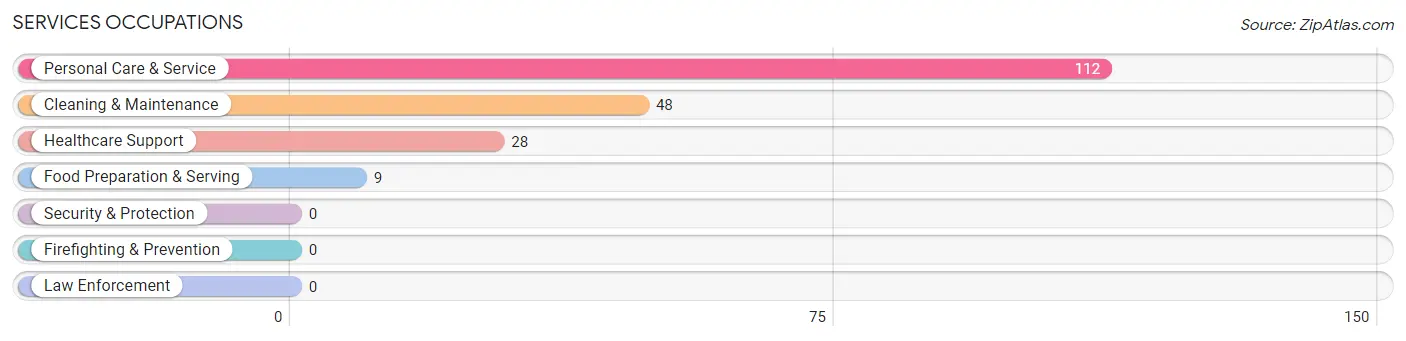
Services Occupations
The most common Services occupations in Dexter are Personal Care & Service (112 | 27.7%), Cleaning & Maintenance (48 | 11.9%), Healthcare Support (28 | 6.9%), and Food Preparation & Serving (9 | 2.2%).
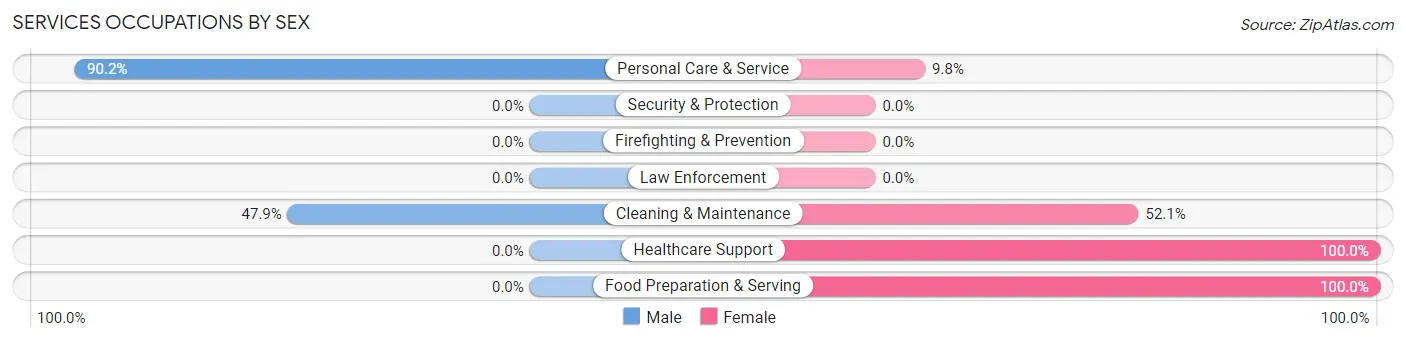
Services Occupations by Sex
Within the Services occupations in Dexter, the most male-oriented occupations are Personal Care & Service (90.2%), and Cleaning & Maintenance (47.9%), while the most female-oriented occupations are Healthcare Support (100.0%), Food Preparation & Serving (100.0%), and Cleaning & Maintenance (52.1%).
| Occupation | Male | Female |
| Healthcare Support | 0 (0.0%) | 28 (100.0%) |
| Security & Protection | 0 (0.0%) | 0 (0.0%) |
| Firefighting & Prevention | 0 (0.0%) | 0 (0.0%) |
| Law Enforcement | 0 (0.0%) | 0 (0.0%) |
| Food Preparation & Serving | 0 (0.0%) | 9 (100.0%) |
| Cleaning & Maintenance | 23 (47.9%) | 25 (52.1%) |
| Personal Care & Service | 101 (90.2%) | 11 (9.8%) |
| Total (Category) | 124 (62.9%) | 73 (37.1%) |
| Total (Overall) | 283 (70.1%) | 121 (29.9%) |
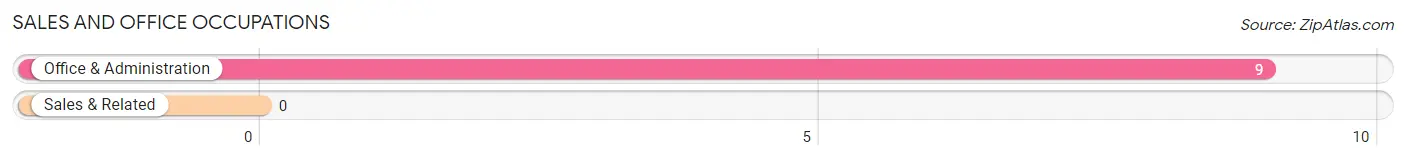
Sales and Office Occupations
The most common Sales and Office occupations in Dexter are , and Office & Administration (9 | 2.2%).
Sales and Office Occupations by Sex
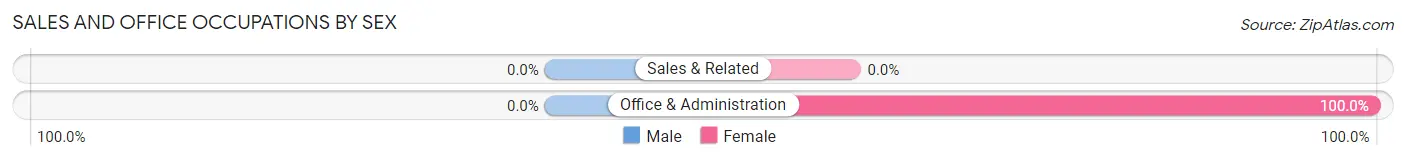
| Occupation | Male | Female |
| Sales & Related | 0 (0.0%) | 0 (0.0%) |
| Office & Administration | 0 (0.0%) | 9 (100.0%) |
| Total (Category) | 0 (0.0%) | 9 (100.0%) |
| Total (Overall) | 283 (70.1%) | 121 (29.9%) |
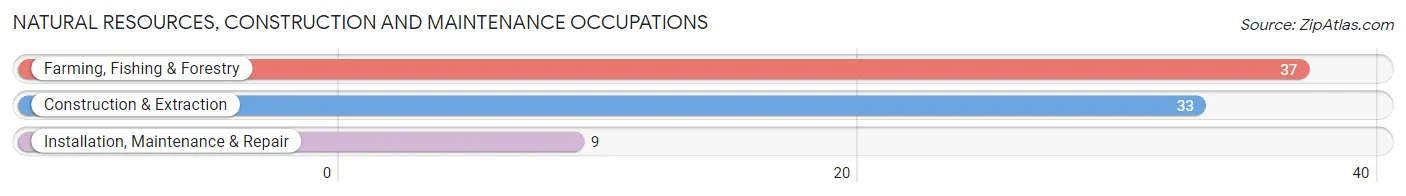
Natural Resources, Construction and Maintenance Occupations
The most common Natural Resources, Construction and Maintenance occupations in Dexter are Farming, Fishing & Forestry (37 | 9.2%), Construction & Extraction (33 | 8.2%), and Installation, Maintenance & Repair (9 | 2.2%).
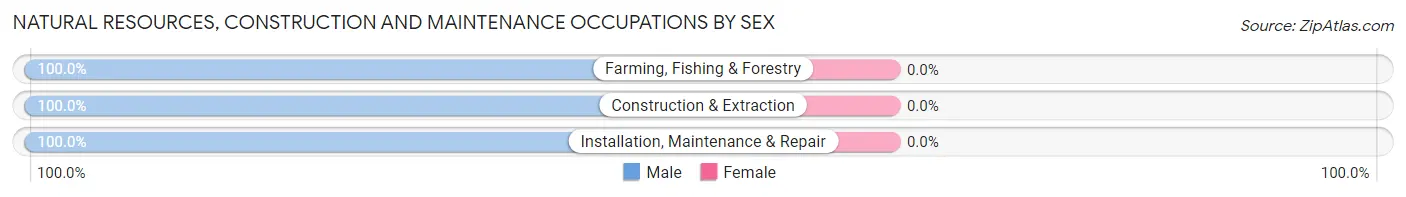
Natural Resources, Construction and Maintenance Occupations by Sex
| Occupation | Male | Female |
| Farming, Fishing & Forestry | 37 (100.0%) | 0 (0.0%) |
| Construction & Extraction | 33 (100.0%) | 0 (0.0%) |
| Installation, Maintenance & Repair | 9 (100.0%) | 0 (0.0%) |
| Total (Category) | 79 (100.0%) | 0 (0.0%) |
| Total (Overall) | 283 (70.1%) | 121 (29.9%) |
Production, Transportation and Moving Occupations
The most common Production, Transportation and Moving occupations in Dexter are Transportation (64 | 15.8%), and Production (13 | 3.2%).
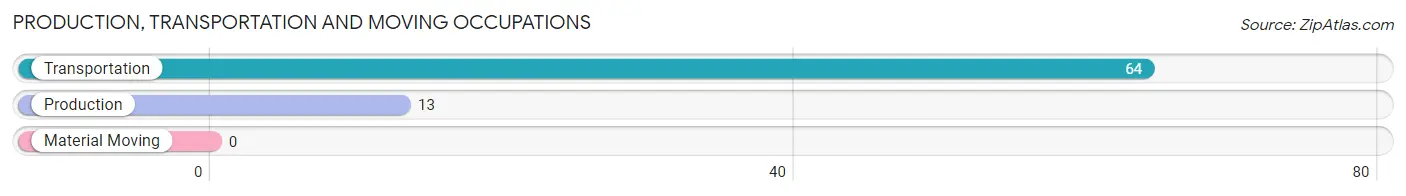
Production, Transportation and Moving Occupations by Sex
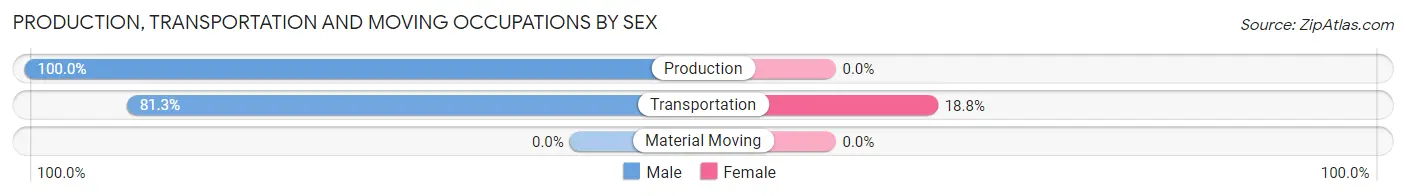
| Occupation | Male | Female |
| Production | 13 (100.0%) | 0 (0.0%) |
| Transportation | 52 (81.2%) | 12 (18.8%) |
| Material Moving | 0 (0.0%) | 0 (0.0%) |
| Total (Category) | 65 (84.4%) | 12 (15.6%) |
| Total (Overall) | 283 (70.1%) | 121 (29.9%) |
Employment Industries by Sex in Dexter
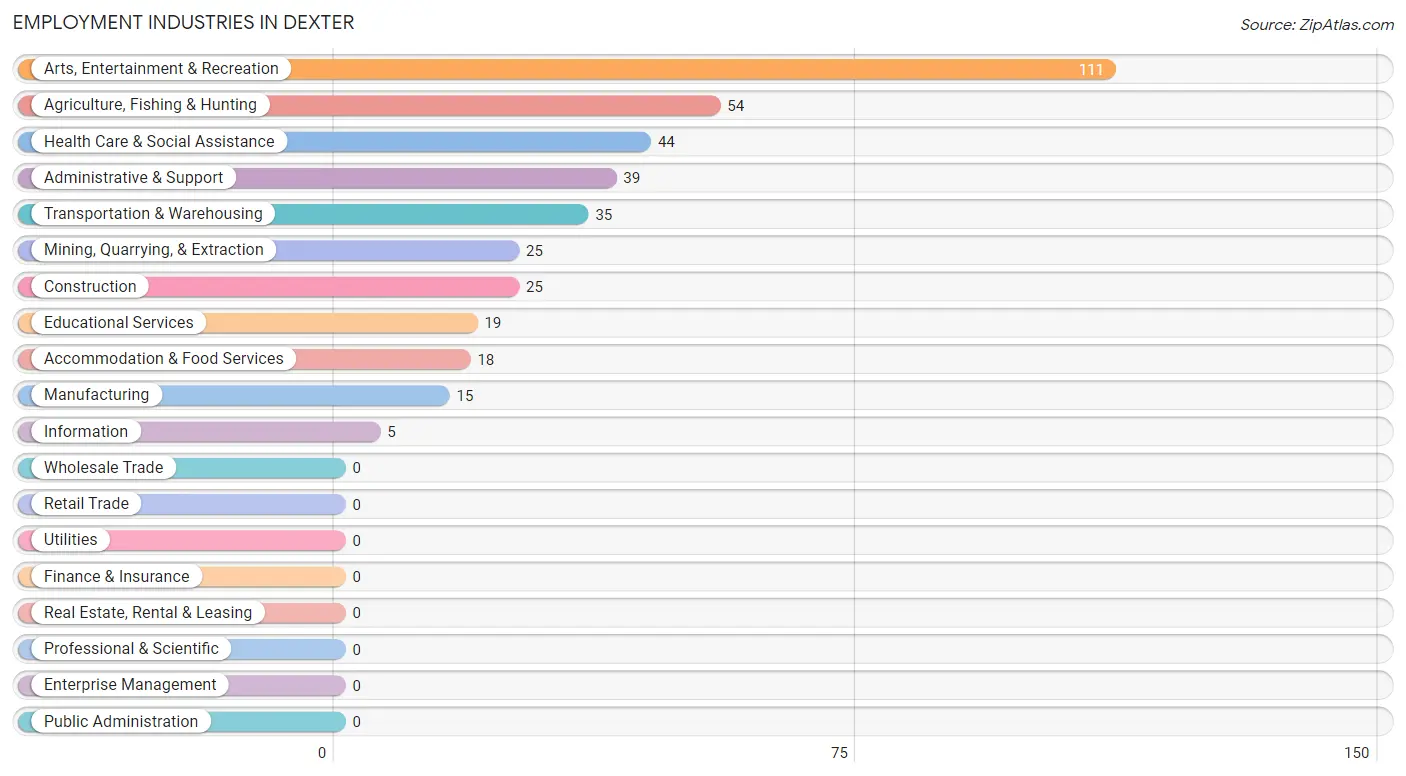
Employment Industries in Dexter
The major employment industries in Dexter include Arts, Entertainment & Recreation (111 | 27.5%), Agriculture, Fishing & Hunting (54 | 13.4%), Health Care & Social Assistance (44 | 10.9%), Administrative & Support (39 | 9.7%), and Transportation & Warehousing (35 | 8.7%).
Employment Industries by Sex in Dexter
The Dexter industries that see more men than women are Agriculture, Fishing & Hunting (100.0%), Construction (100.0%), and Manufacturing (100.0%), whereas the industries that tend to have a higher number of women are Information (100.0%), Educational Services (100.0%), and Accommodation & Food Services (100.0%).
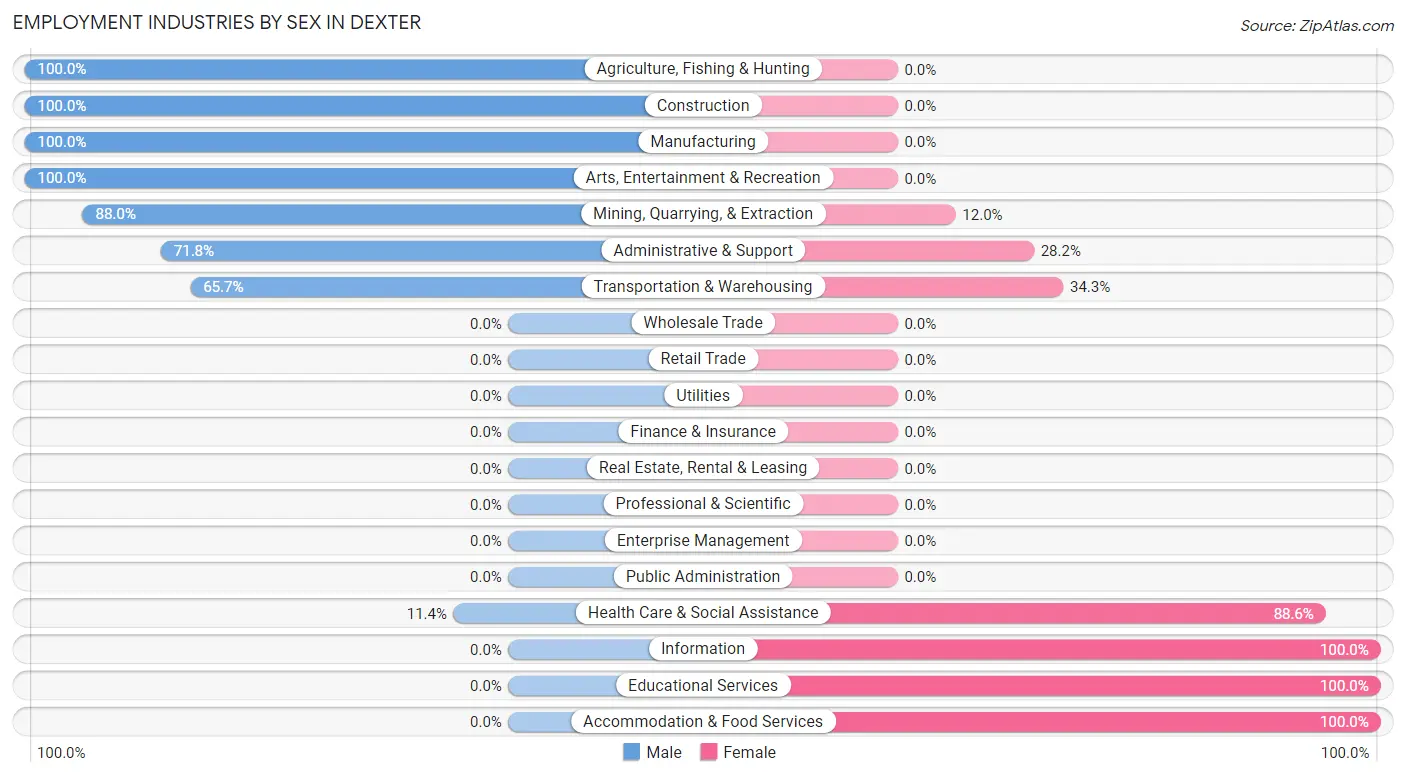
| Industry | Male | Female |
| Agriculture, Fishing & Hunting | 54 (100.0%) | 0 (0.0%) |
| Mining, Quarrying, & Extraction | 22 (88.0%) | 3 (12.0%) |
| Construction | 25 (100.0%) | 0 (0.0%) |
| Manufacturing | 15 (100.0%) | 0 (0.0%) |
| Wholesale Trade | 0 (0.0%) | 0 (0.0%) |
| Retail Trade | 0 (0.0%) | 0 (0.0%) |
| Transportation & Warehousing | 23 (65.7%) | 12 (34.3%) |
| Utilities | 0 (0.0%) | 0 (0.0%) |
| Information | 0 (0.0%) | 5 (100.0%) |
| Finance & Insurance | 0 (0.0%) | 0 (0.0%) |
| Real Estate, Rental & Leasing | 0 (0.0%) | 0 (0.0%) |
| Professional & Scientific | 0 (0.0%) | 0 (0.0%) |
| Enterprise Management | 0 (0.0%) | 0 (0.0%) |
| Administrative & Support | 28 (71.8%) | 11 (28.2%) |
| Educational Services | 0 (0.0%) | 19 (100.0%) |
| Health Care & Social Assistance | 5 (11.4%) | 39 (88.6%) |
| Arts, Entertainment & Recreation | 111 (100.0%) | 0 (0.0%) |
| Accommodation & Food Services | 0 (0.0%) | 18 (100.0%) |
| Public Administration | 0 (0.0%) | 0 (0.0%) |
| Total | 283 (70.1%) | 121 (29.9%) |
Education in Dexter
School Enrollment in Dexter
The most common levels of schooling among the 259 students in Dexter are middle school (89 | 34.4%), high school (76 | 29.3%), and elementary school (75 | 29.0%).
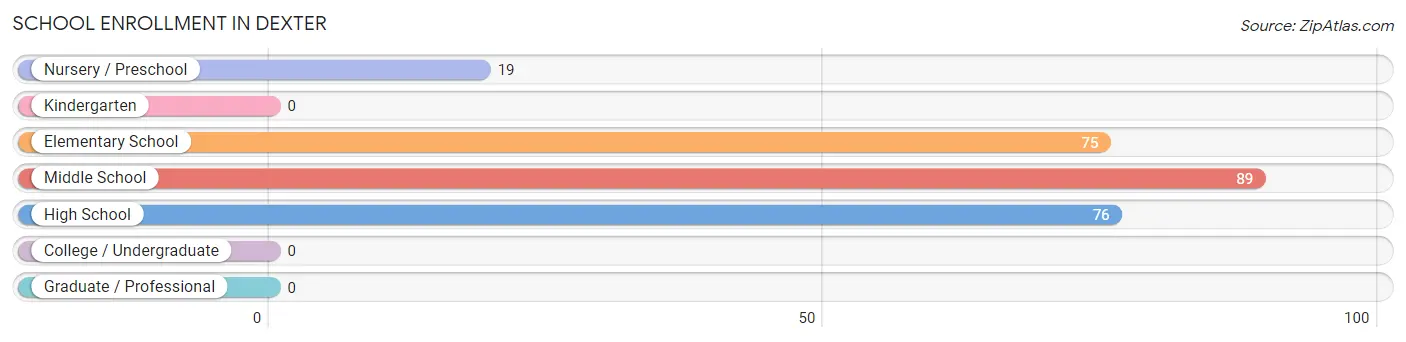
| School Level | # Students | % Students |
| Nursery / Preschool | 19 | 7.3% |
| Kindergarten | 0 | 0.0% |
| Elementary School | 75 | 29.0% |
| Middle School | 89 | 34.4% |
| High School | 76 | 29.3% |
| College / Undergraduate | 0 | 0.0% |
| Graduate / Professional | 0 | 0.0% |
| Total | 259 | 100.0% |
School Enrollment by Age by Funding Source in Dexter
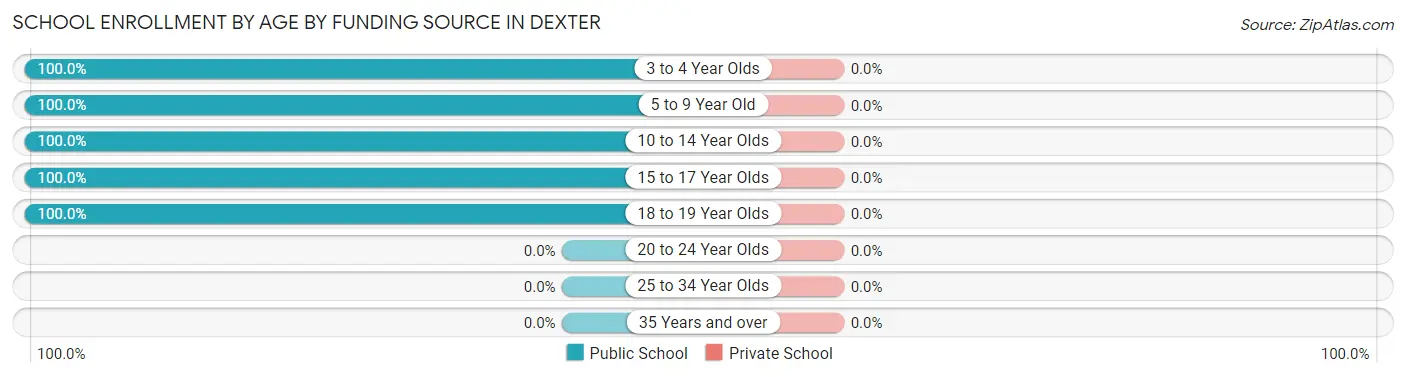
| Age Bracket | Public School | Private School |
| 3 to 4 Year Olds | 19 (100.0%) | 0 (0.0%) |
| 5 to 9 Year Old | 75 (100.0%) | 0 (0.0%) |
| 10 to 14 Year Olds | 89 (100.0%) | 0 (0.0%) |
| 15 to 17 Year Olds | 63 (100.0%) | 0 (0.0%) |
| 18 to 19 Year Olds | 13 (100.0%) | 0 (0.0%) |
| 20 to 24 Year Olds | 0 (0.0%) | 0 (0.0%) |
| 25 to 34 Year Olds | 0 (0.0%) | 0 (0.0%) |
| 35 Years and over | 0 (0.0%) | 0 (0.0%) |
| Total | 259 (100.0%) | 0 (0.0%) |
Educational Attainment by Field of Study in Dexter
Education (6 | 25.0%), psychology (5 | 20.8%), social sciences (5 | 20.8%), science & technology (5 | 20.8%), and business (3 | 12.5%) are the most common fields of study among 24 individuals in Dexter who have obtained a bachelor's degree or higher.
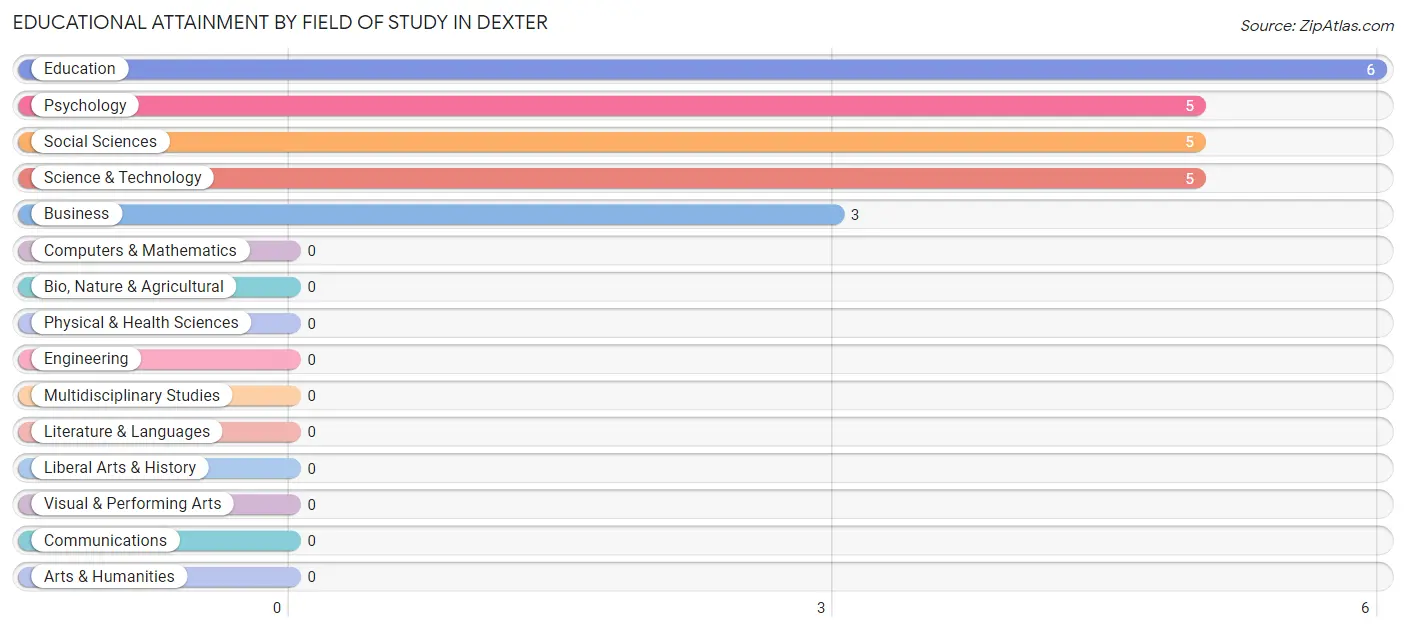
| Field of Study | # Graduates | % Graduates |
| Computers & Mathematics | 0 | 0.0% |
| Bio, Nature & Agricultural | 0 | 0.0% |
| Physical & Health Sciences | 0 | 0.0% |
| Psychology | 5 | 20.8% |
| Social Sciences | 5 | 20.8% |
| Engineering | 0 | 0.0% |
| Multidisciplinary Studies | 0 | 0.0% |
| Science & Technology | 5 | 20.8% |
| Business | 3 | 12.5% |
| Education | 6 | 25.0% |
| Literature & Languages | 0 | 0.0% |
| Liberal Arts & History | 0 | 0.0% |
| Visual & Performing Arts | 0 | 0.0% |
| Communications | 0 | 0.0% |
| Arts & Humanities | 0 | 0.0% |
| Total | 24 | 100.0% |
Transportation & Commute in Dexter
Vehicle Availability by Sex in Dexter
The most prevalent vehicle ownership categories in Dexter are males with 2 vehicles (136, accounting for 48.1%) and females with 2 vehicles (69, making up 112.4%).
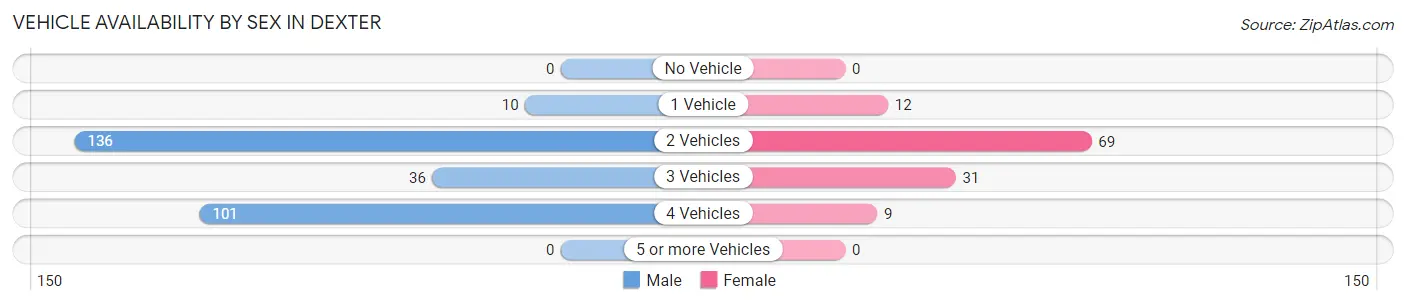
| Vehicles Available | Male | Female |
| No Vehicle | 0 (0.0%) | 0 (0.0%) |
| 1 Vehicle | 10 (3.5%) | 12 (9.9%) |
| 2 Vehicles | 136 (48.1%) | 69 (57.0%) |
| 3 Vehicles | 36 (12.7%) | 31 (25.6%) |
| 4 Vehicles | 101 (35.7%) | 9 (7.4%) |
| 5 or more Vehicles | 0 (0.0%) | 0 (0.0%) |
| Total | 283 (100.0%) | 121 (100.0%) |
Commute Time in Dexter
The most frequently occuring commute durations in Dexter are 5 to 9 minutes (171 commuters, 42.3%), 20 to 24 minutes (84 commuters, 20.8%), and 30 to 34 minutes (46 commuters, 11.4%).
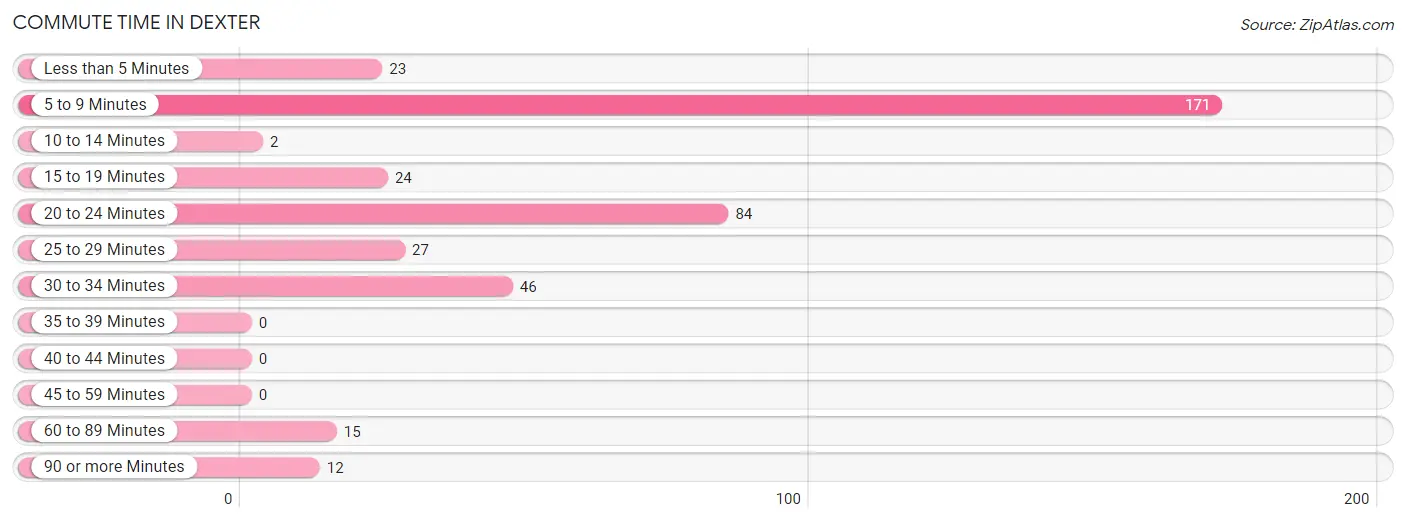
| Commute Time | # Commuters | % Commuters |
| Less than 5 Minutes | 23 | 5.7% |
| 5 to 9 Minutes | 171 | 42.3% |
| 10 to 14 Minutes | 2 | 0.5% |
| 15 to 19 Minutes | 24 | 5.9% |
| 20 to 24 Minutes | 84 | 20.8% |
| 25 to 29 Minutes | 27 | 6.7% |
| 30 to 34 Minutes | 46 | 11.4% |
| 35 to 39 Minutes | 0 | 0.0% |
| 40 to 44 Minutes | 0 | 0.0% |
| 45 to 59 Minutes | 0 | 0.0% |
| 60 to 89 Minutes | 15 | 3.7% |
| 90 or more Minutes | 12 | 3.0% |
Commute Time by Sex in Dexter
The most common commute times in Dexter are 5 to 9 minutes (156 commuters, 55.1%) for males and 25 to 29 minutes (27 commuters, 22.3%) for females.
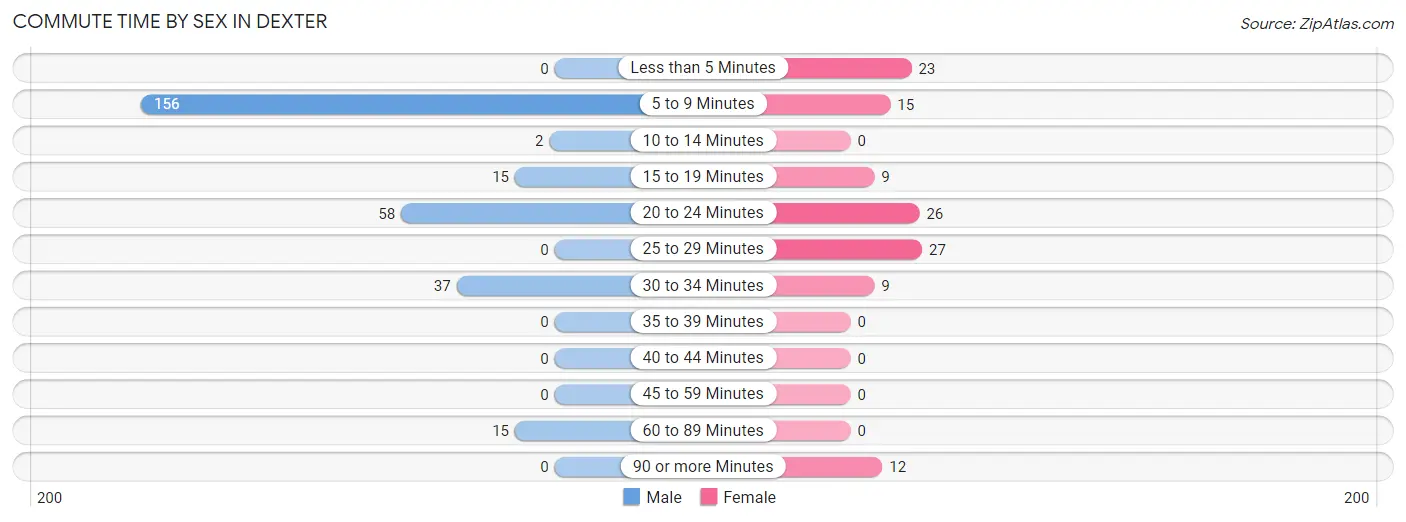
| Commute Time | Male | Female |
| Less than 5 Minutes | 0 (0.0%) | 23 (19.0%) |
| 5 to 9 Minutes | 156 (55.1%) | 15 (12.4%) |
| 10 to 14 Minutes | 2 (0.7%) | 0 (0.0%) |
| 15 to 19 Minutes | 15 (5.3%) | 9 (7.4%) |
| 20 to 24 Minutes | 58 (20.5%) | 26 (21.5%) |
| 25 to 29 Minutes | 0 (0.0%) | 27 (22.3%) |
| 30 to 34 Minutes | 37 (13.1%) | 9 (7.4%) |
| 35 to 39 Minutes | 0 (0.0%) | 0 (0.0%) |
| 40 to 44 Minutes | 0 (0.0%) | 0 (0.0%) |
| 45 to 59 Minutes | 0 (0.0%) | 0 (0.0%) |
| 60 to 89 Minutes | 15 (5.3%) | 0 (0.0%) |
| 90 or more Minutes | 0 (0.0%) | 12 (9.9%) |
Time of Departure to Work by Sex in Dexter
The most frequent times of departure to work in Dexter are 7:00 AM to 7:29 AM (119, 42.0%) for males and 7:00 AM to 7:29 AM (58, 47.9%) for females.
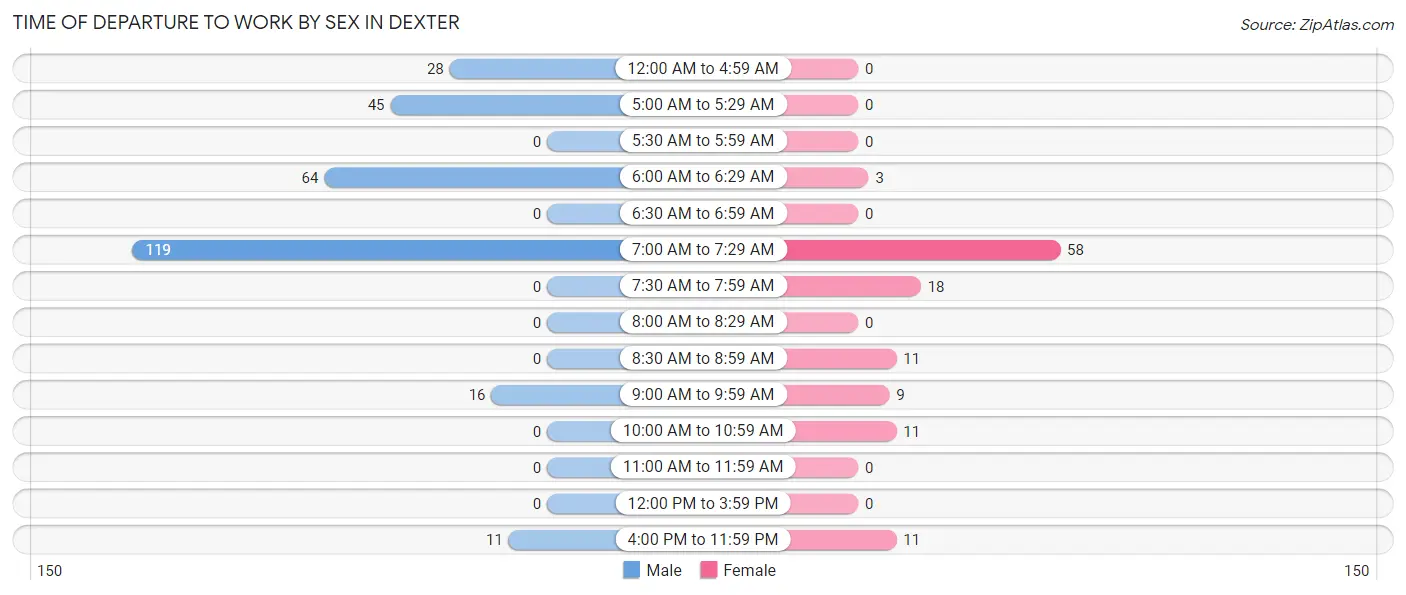
| Time of Departure | Male | Female |
| 12:00 AM to 4:59 AM | 28 (9.9%) | 0 (0.0%) |
| 5:00 AM to 5:29 AM | 45 (15.9%) | 0 (0.0%) |
| 5:30 AM to 5:59 AM | 0 (0.0%) | 0 (0.0%) |
| 6:00 AM to 6:29 AM | 64 (22.6%) | 3 (2.5%) |
| 6:30 AM to 6:59 AM | 0 (0.0%) | 0 (0.0%) |
| 7:00 AM to 7:29 AM | 119 (42.0%) | 58 (47.9%) |
| 7:30 AM to 7:59 AM | 0 (0.0%) | 18 (14.9%) |
| 8:00 AM to 8:29 AM | 0 (0.0%) | 0 (0.0%) |
| 8:30 AM to 8:59 AM | 0 (0.0%) | 11 (9.1%) |
| 9:00 AM to 9:59 AM | 16 (5.7%) | 9 (7.4%) |
| 10:00 AM to 10:59 AM | 0 (0.0%) | 11 (9.1%) |
| 11:00 AM to 11:59 AM | 0 (0.0%) | 0 (0.0%) |
| 12:00 PM to 3:59 PM | 0 (0.0%) | 0 (0.0%) |
| 4:00 PM to 11:59 PM | 11 (3.9%) | 11 (9.1%) |
| Total | 283 (100.0%) | 121 (100.0%) |
Housing Occupancy in Dexter
Occupancy by Ownership in Dexter
Of the total 403 dwellings in Dexter, owner-occupied units account for 344 (85.4%), while renter-occupied units make up 59 (14.6%).
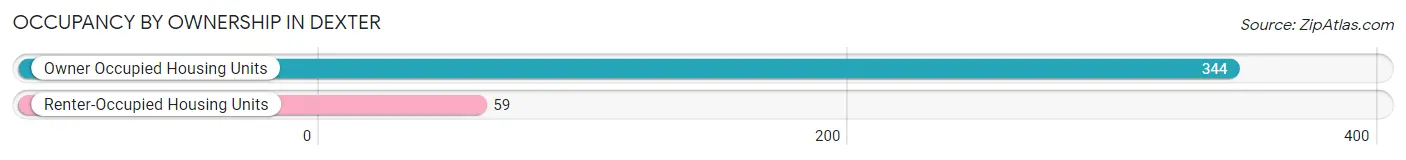
| Occupancy | # Housing Units | % Housing Units |
| Owner Occupied Housing Units | 344 | 85.4% |
| Renter-Occupied Housing Units | 59 | 14.6% |
| Total Occupied Housing Units | 403 | 100.0% |
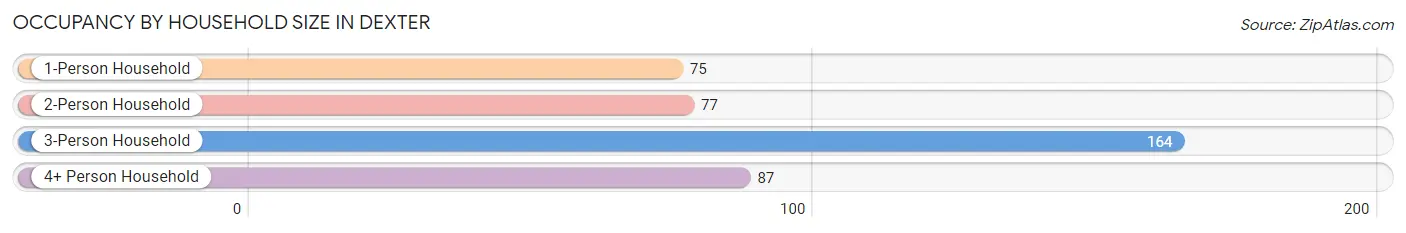
Occupancy by Household Size in Dexter
| Household Size | # Housing Units | % Housing Units |
| 1-Person Household | 75 | 18.6% |
| 2-Person Household | 77 | 19.1% |
| 3-Person Household | 164 | 40.7% |
| 4+ Person Household | 87 | 21.6% |
| Total Housing Units | 403 | 100.0% |
Occupancy by Ownership by Household Size in Dexter
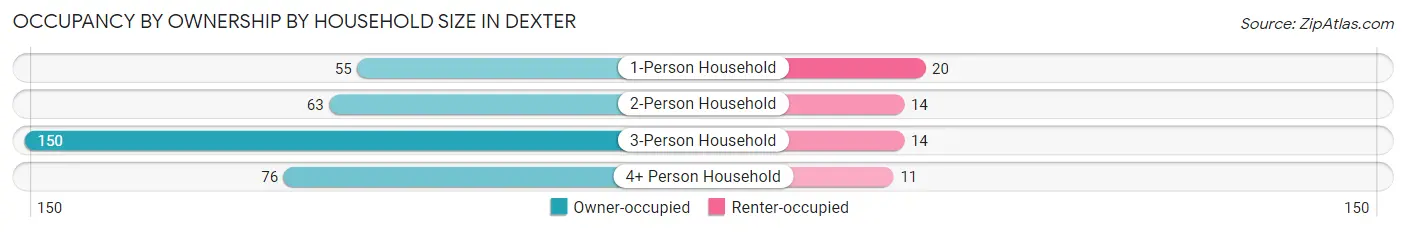
| Household Size | Owner-occupied | Renter-occupied |
| 1-Person Household | 55 (73.3%) | 20 (26.7%) |
| 2-Person Household | 63 (81.8%) | 14 (18.2%) |
| 3-Person Household | 150 (91.5%) | 14 (8.5%) |
| 4+ Person Household | 76 (87.4%) | 11 (12.6%) |
| Total Housing Units | 344 (85.4%) | 59 (14.6%) |
Occupancy by Educational Attainment in Dexter
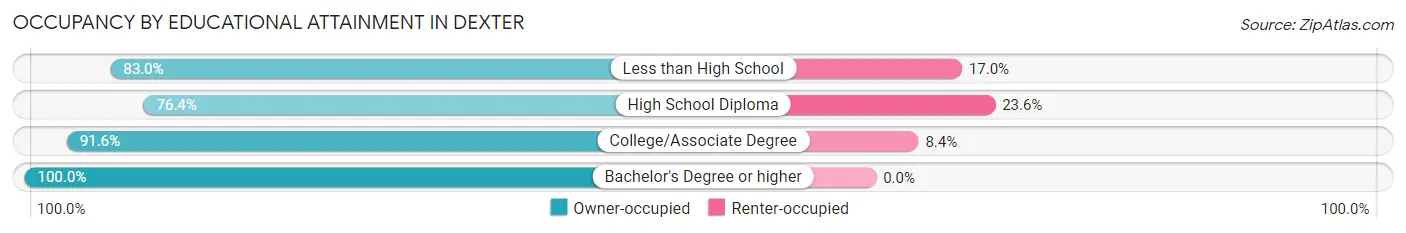
| Household Size | Owner-occupied | Renter-occupied |
| Less than High School | 122 (83.0%) | 25 (17.0%) |
| High School Diploma | 68 (76.4%) | 21 (23.6%) |
| College/Associate Degree | 142 (91.6%) | 13 (8.4%) |
| Bachelor's Degree or higher | 12 (100.0%) | 0 (0.0%) |
Occupancy by Age of Householder in Dexter
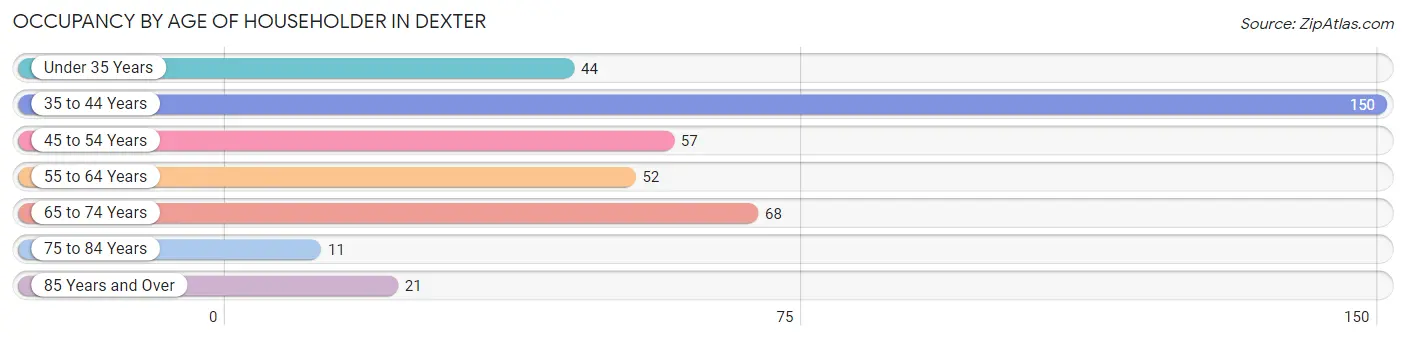
| Age Bracket | # Households | % Households |
| Under 35 Years | 44 | 10.9% |
| 35 to 44 Years | 150 | 37.2% |
| 45 to 54 Years | 57 | 14.1% |
| 55 to 64 Years | 52 | 12.9% |
| 65 to 74 Years | 68 | 16.9% |
| 75 to 84 Years | 11 | 2.7% |
| 85 Years and Over | 21 | 5.2% |
| Total | 403 | 100.0% |
Housing Finances in Dexter
Median Income by Occupancy in Dexter
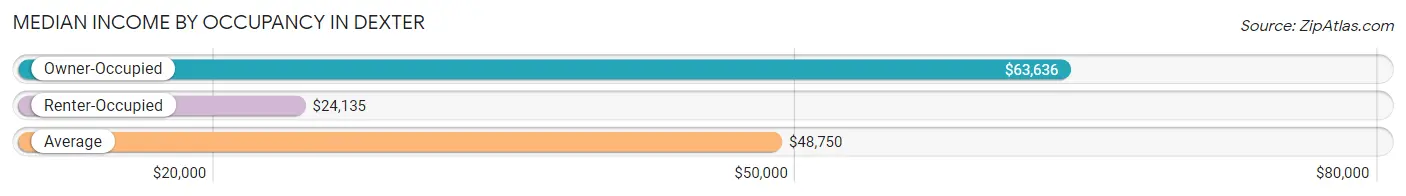
| Occupancy Type | # Households | Median Income |
| Owner-Occupied | 344 (85.4%) | $63,636 |
| Renter-Occupied | 59 (14.6%) | $24,135 |
| Average | 403 (100.0%) | $48,750 |
Occupancy by Householder Income Bracket in Dexter
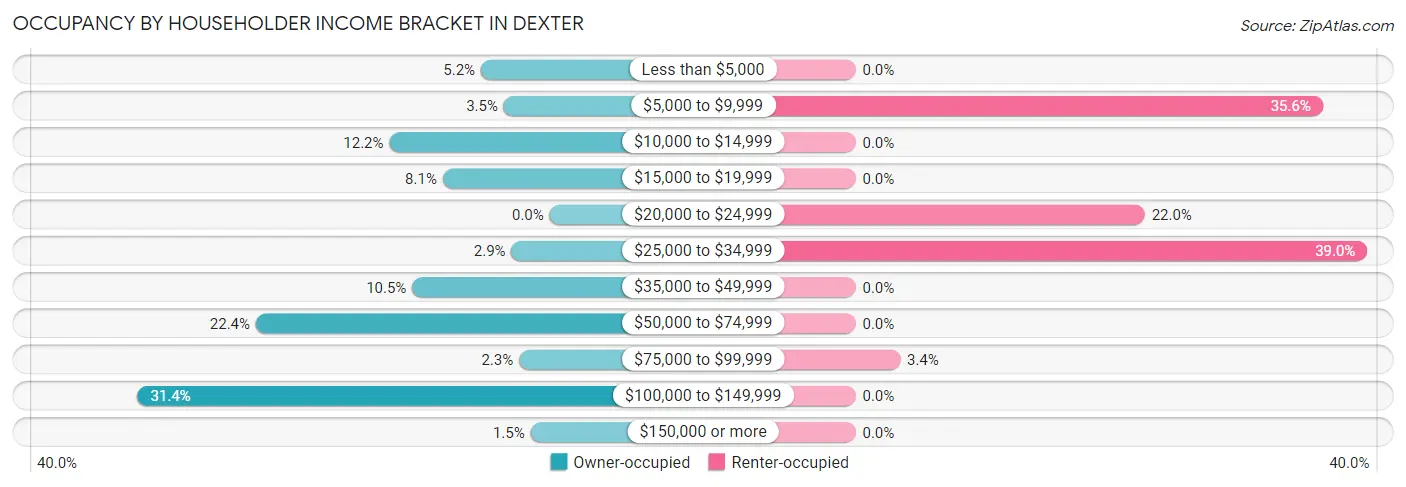
| Income Bracket | Owner-occupied | Renter-occupied |
| Less than $5,000 | 18 (5.2%) | 0 (0.0%) |
| $5,000 to $9,999 | 12 (3.5%) | 21 (35.6%) |
| $10,000 to $14,999 | 42 (12.2%) | 0 (0.0%) |
| $15,000 to $19,999 | 28 (8.1%) | 0 (0.0%) |
| $20,000 to $24,999 | 0 (0.0%) | 13 (22.0%) |
| $25,000 to $34,999 | 10 (2.9%) | 23 (39.0%) |
| $35,000 to $49,999 | 36 (10.5%) | 0 (0.0%) |
| $50,000 to $74,999 | 77 (22.4%) | 0 (0.0%) |
| $75,000 to $99,999 | 8 (2.3%) | 2 (3.4%) |
| $100,000 to $149,999 | 108 (31.4%) | 0 (0.0%) |
| $150,000 or more | 5 (1.5%) | 0 (0.0%) |
| Total | 344 (100.0%) | 59 (100.0%) |
Monthly Housing Cost Tiers in Dexter
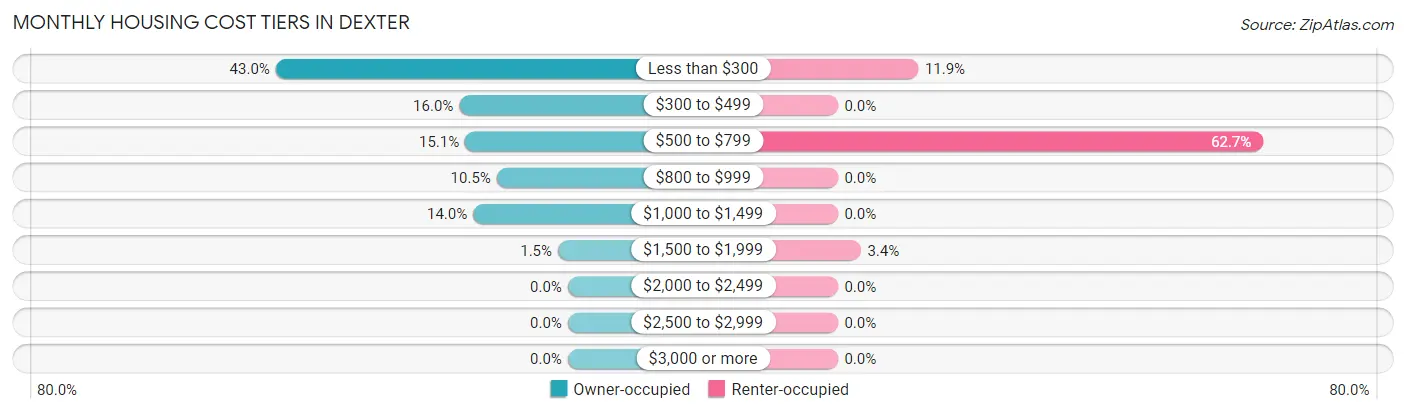
| Monthly Cost | Owner-occupied | Renter-occupied |
| Less than $300 | 148 (43.0%) | 7 (11.9%) |
| $300 to $499 | 55 (16.0%) | 0 (0.0%) |
| $500 to $799 | 52 (15.1%) | 37 (62.7%) |
| $800 to $999 | 36 (10.5%) | 0 (0.0%) |
| $1,000 to $1,499 | 48 (14.0%) | 0 (0.0%) |
| $1,500 to $1,999 | 5 (1.5%) | 2 (3.4%) |
| $2,000 to $2,499 | 0 (0.0%) | 0 (0.0%) |
| $2,500 to $2,999 | 0 (0.0%) | 0 (0.0%) |
| $3,000 or more | 0 (0.0%) | 0 (0.0%) |
| Total | 344 (100.0%) | 59 (100.0%) |
Physical Housing Characteristics in Dexter
Housing Structures in Dexter
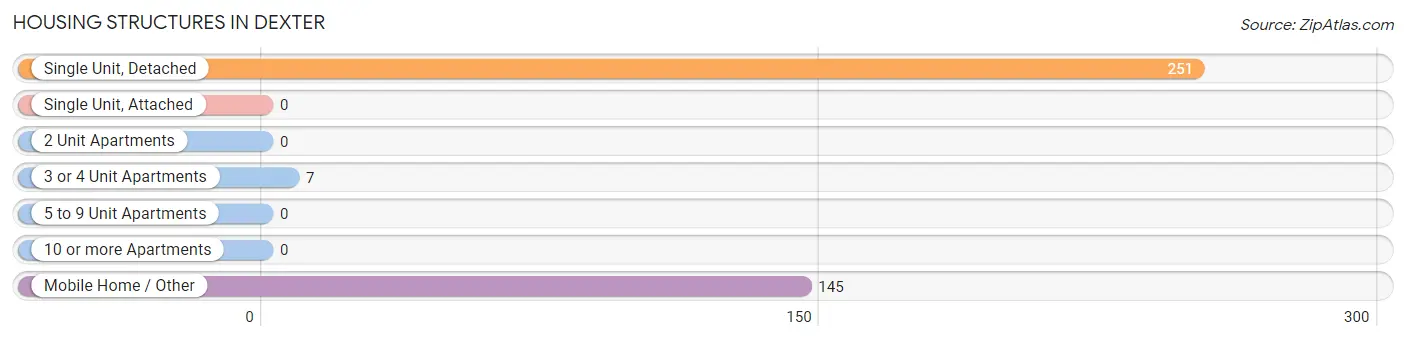
| Structure Type | # Housing Units | % Housing Units |
| Single Unit, Detached | 251 | 62.3% |
| Single Unit, Attached | 0 | 0.0% |
| 2 Unit Apartments | 0 | 0.0% |
| 3 or 4 Unit Apartments | 7 | 1.7% |
| 5 to 9 Unit Apartments | 0 | 0.0% |
| 10 or more Apartments | 0 | 0.0% |
| Mobile Home / Other | 145 | 36.0% |
| Total | 403 | 100.0% |
Housing Structures by Occupancy in Dexter
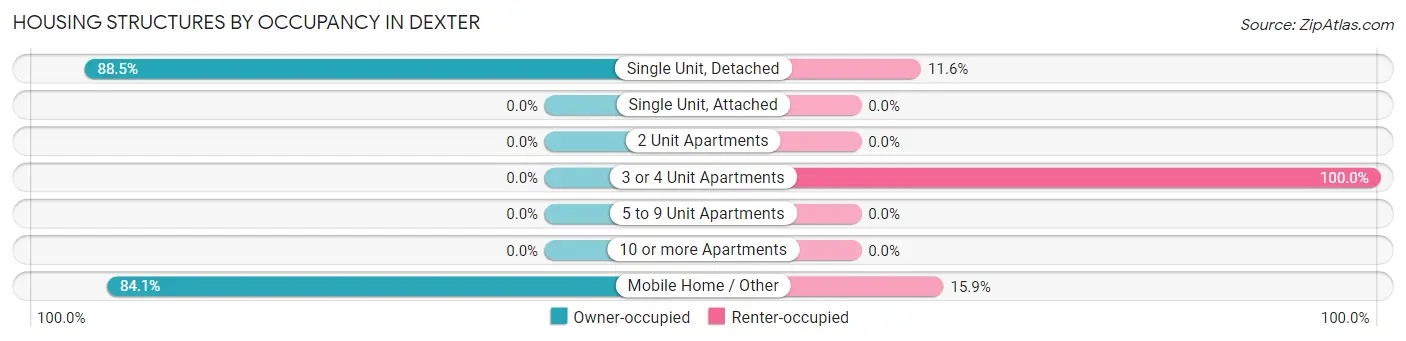
| Structure Type | Owner-occupied | Renter-occupied |
| Single Unit, Detached | 222 (88.4%) | 29 (11.6%) |
| Single Unit, Attached | 0 (0.0%) | 0 (0.0%) |
| 2 Unit Apartments | 0 (0.0%) | 0 (0.0%) |
| 3 or 4 Unit Apartments | 0 (0.0%) | 7 (100.0%) |
| 5 to 9 Unit Apartments | 0 (0.0%) | 0 (0.0%) |
| 10 or more Apartments | 0 (0.0%) | 0 (0.0%) |
| Mobile Home / Other | 122 (84.1%) | 23 (15.9%) |
| Total | 344 (85.4%) | 59 (14.6%) |
Housing Structures by Number of Rooms in Dexter
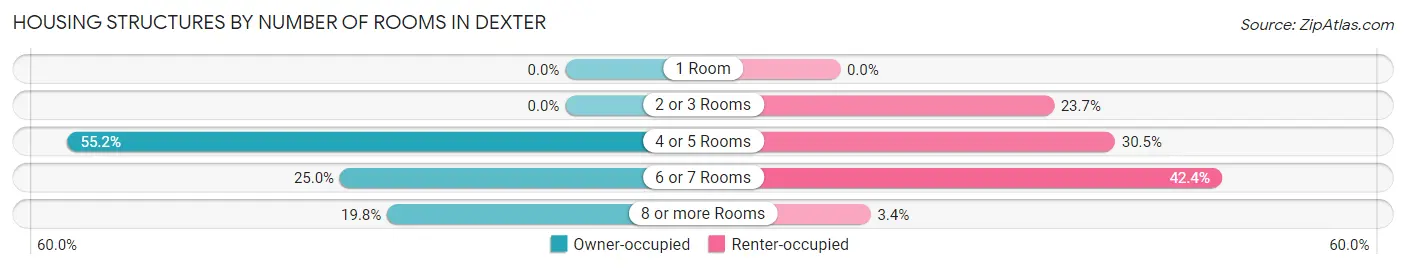
| Number of Rooms | Owner-occupied | Renter-occupied |
| 1 Room | 0 (0.0%) | 0 (0.0%) |
| 2 or 3 Rooms | 0 (0.0%) | 14 (23.7%) |
| 4 or 5 Rooms | 190 (55.2%) | 18 (30.5%) |
| 6 or 7 Rooms | 86 (25.0%) | 25 (42.4%) |
| 8 or more Rooms | 68 (19.8%) | 2 (3.4%) |
| Total | 344 (100.0%) | 59 (100.0%) |
Housing Structure by Heating Type in Dexter
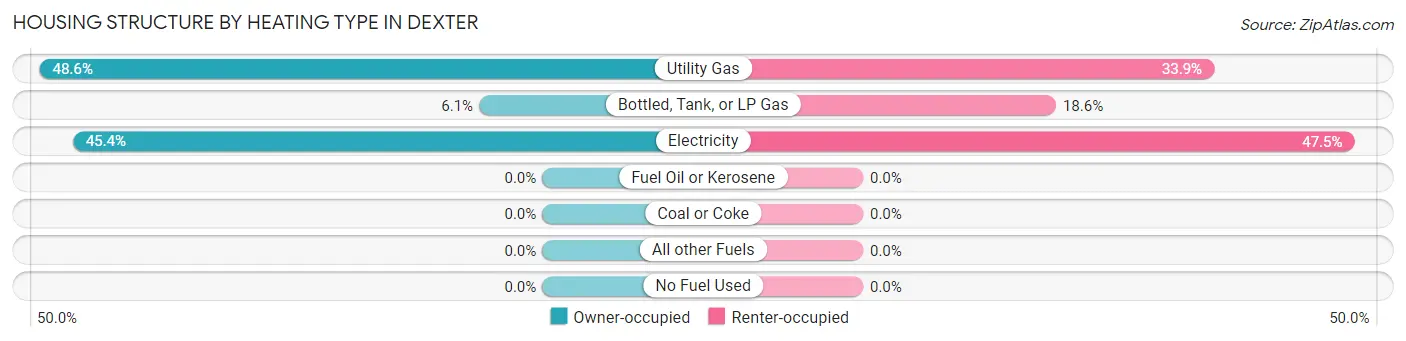
| Heating Type | Owner-occupied | Renter-occupied |
| Utility Gas | 167 (48.5%) | 20 (33.9%) |
| Bottled, Tank, or LP Gas | 21 (6.1%) | 11 (18.6%) |
| Electricity | 156 (45.4%) | 28 (47.5%) |
| Fuel Oil or Kerosene | 0 (0.0%) | 0 (0.0%) |
| Coal or Coke | 0 (0.0%) | 0 (0.0%) |
| All other Fuels | 0 (0.0%) | 0 (0.0%) |
| No Fuel Used | 0 (0.0%) | 0 (0.0%) |
| Total | 344 (100.0%) | 59 (100.0%) |
Household Vehicle Usage in Dexter
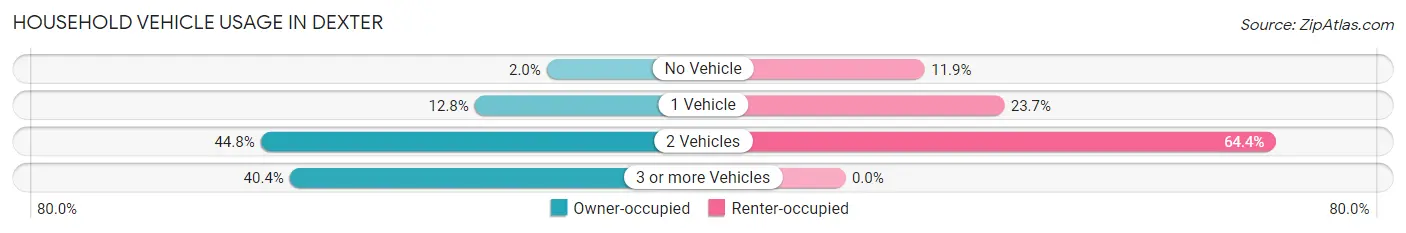
| Vehicles per Household | Owner-occupied | Renter-occupied |
| No Vehicle | 7 (2.0%) | 7 (11.9%) |
| 1 Vehicle | 44 (12.8%) | 14 (23.7%) |
| 2 Vehicles | 154 (44.8%) | 38 (64.4%) |
| 3 or more Vehicles | 139 (40.4%) | 0 (0.0%) |
| Total | 344 (100.0%) | 59 (100.0%) |
Real Estate & Mortgages in Dexter
Real Estate and Mortgage Overview in Dexter
| Characteristic | Without Mortgage | With Mortgage |
| Housing Units | 230 | 114 |
| Median Property Value | $95,100 | $99,400 |
| Median Household Income | - | - |
| Monthly Housing Costs | $210 | $0 |
| Real Estate Taxes | $369 | $0 |
Property Value by Mortgage Status in Dexter
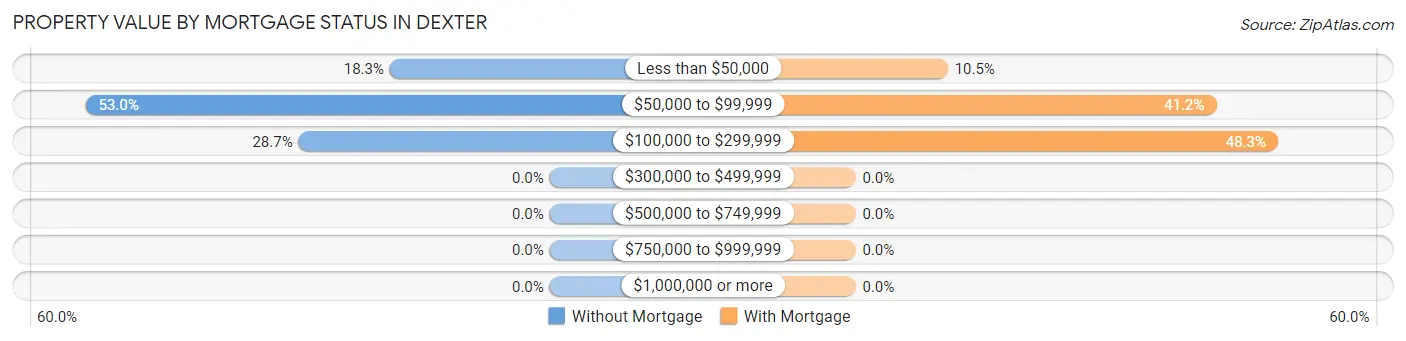
| Property Value | Without Mortgage | With Mortgage |
| Less than $50,000 | 42 (18.3%) | 12 (10.5%) |
| $50,000 to $99,999 | 122 (53.0%) | 47 (41.2%) |
| $100,000 to $299,999 | 66 (28.7%) | 55 (48.2%) |
| $300,000 to $499,999 | 0 (0.0%) | 0 (0.0%) |
| $500,000 to $749,999 | 0 (0.0%) | 0 (0.0%) |
| $750,000 to $999,999 | 0 (0.0%) | 0 (0.0%) |
| $1,000,000 or more | 0 (0.0%) | 0 (0.0%) |
| Total | 230 (100.0%) | 114 (100.0%) |
Household Income by Mortgage Status in Dexter
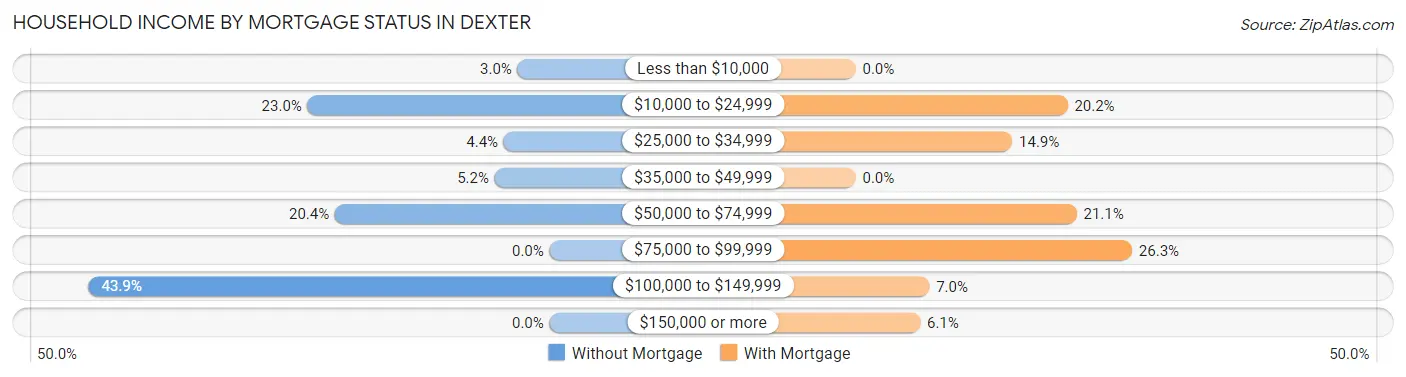
| Household Income | Without Mortgage | With Mortgage |
| Less than $10,000 | 7 (3.0%) | 0 (0.0%) |
| $10,000 to $24,999 | 53 (23.0%) | 23 (20.2%) |
| $25,000 to $34,999 | 10 (4.3%) | 17 (14.9%) |
| $35,000 to $49,999 | 12 (5.2%) | 0 (0.0%) |
| $50,000 to $74,999 | 47 (20.4%) | 24 (21.0%) |
| $75,000 to $99,999 | 0 (0.0%) | 30 (26.3%) |
| $100,000 to $149,999 | 101 (43.9%) | 8 (7.0%) |
| $150,000 or more | 0 (0.0%) | 7 (6.1%) |
| Total | 230 (100.0%) | 114 (100.0%) |
Property Value to Household Income Ratio in Dexter
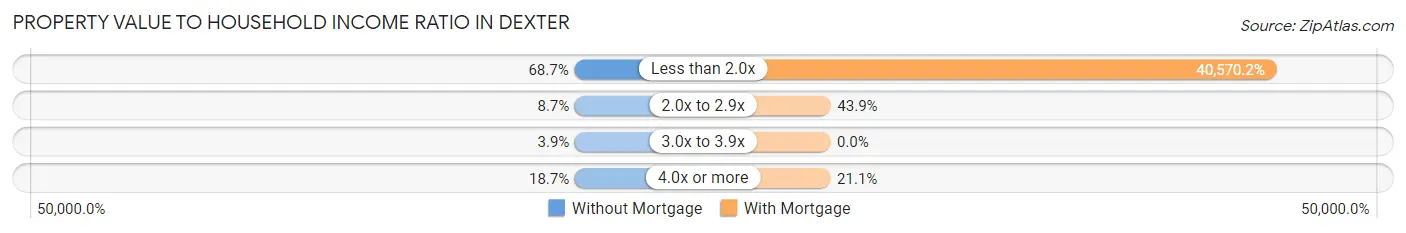
| Value-to-Income Ratio | Without Mortgage | With Mortgage |
| Less than 2.0x | 158 (68.7%) | 46,250 (40,570.2%) |
| 2.0x to 2.9x | 20 (8.7%) | 50 (43.9%) |
| 3.0x to 3.9x | 9 (3.9%) | 0 (0.0%) |
| 4.0x or more | 43 (18.7%) | 24 (21.0%) |
| Total | 230 (100.0%) | 114 (100.0%) |
Real Estate Taxes by Mortgage Status in Dexter
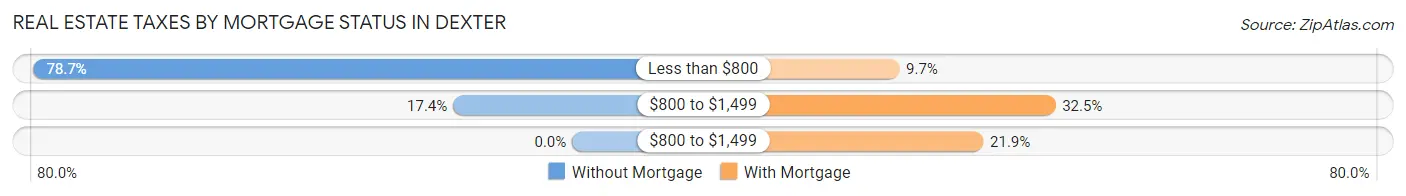
| Property Taxes | Without Mortgage | With Mortgage |
| Less than $800 | 181 (78.7%) | 11 (9.7%) |
| $800 to $1,499 | 40 (17.4%) | 37 (32.5%) |
| $800 to $1,499 | 0 (0.0%) | 25 (21.9%) |
| Total | 230 (100.0%) | 114 (100.0%) |
Health & Disability in Dexter
Health Insurance Coverage by Age in Dexter
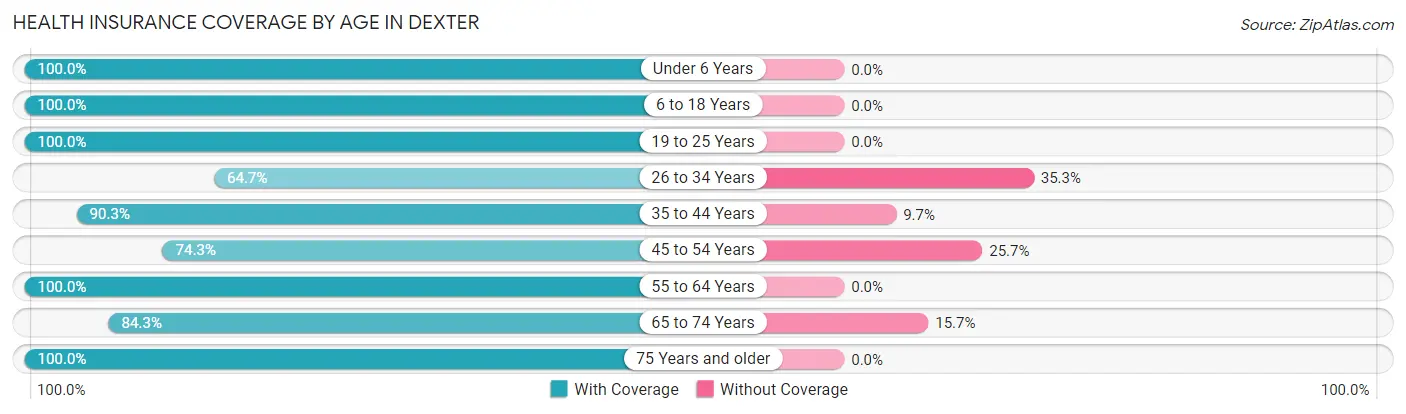
| Age Bracket | With Coverage | Without Coverage |
| Under 6 Years | 58 (100.0%) | 0 (0.0%) |
| 6 to 18 Years | 251 (100.0%) | 0 (0.0%) |
| 19 to 25 Years | 46 (100.0%) | 0 (0.0%) |
| 26 to 34 Years | 108 (64.7%) | 59 (35.3%) |
| 35 to 44 Years | 140 (90.3%) | 15 (9.7%) |
| 45 to 54 Years | 75 (74.3%) | 26 (25.7%) |
| 55 to 64 Years | 81 (100.0%) | 0 (0.0%) |
| 65 to 74 Years | 70 (84.3%) | 13 (15.7%) |
| 75 Years and older | 83 (100.0%) | 0 (0.0%) |
| Total | 912 (89.0%) | 113 (11.0%) |
Health Insurance Coverage by Citizenship Status in Dexter
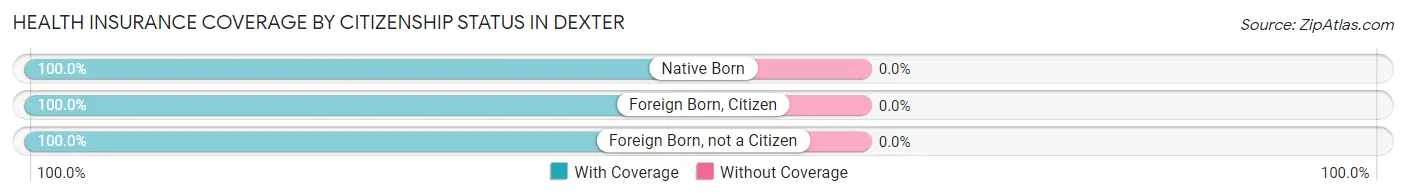
| Citizenship Status | With Coverage | Without Coverage |
| Native Born | 58 (100.0%) | 0 (0.0%) |
| Foreign Born, Citizen | 251 (100.0%) | 0 (0.0%) |
| Foreign Born, not a Citizen | 46 (100.0%) | 0 (0.0%) |
Health Insurance Coverage by Household Income in Dexter
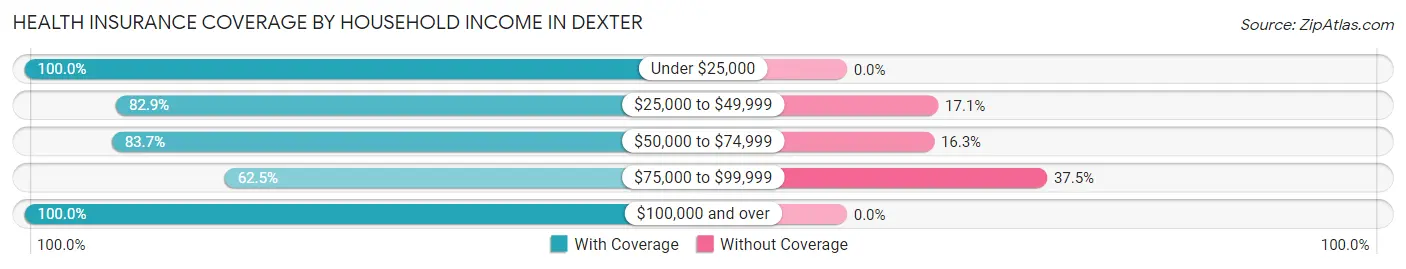
| Household Income | With Coverage | Without Coverage |
| Under $25,000 | 225 (100.0%) | 0 (0.0%) |
| $25,000 to $49,999 | 184 (82.9%) | 38 (17.1%) |
| $50,000 to $74,999 | 292 (83.7%) | 57 (16.3%) |
| $75,000 to $99,999 | 30 (62.5%) | 18 (37.5%) |
| $100,000 and over | 181 (100.0%) | 0 (0.0%) |
Public vs Private Health Insurance Coverage by Age in Dexter
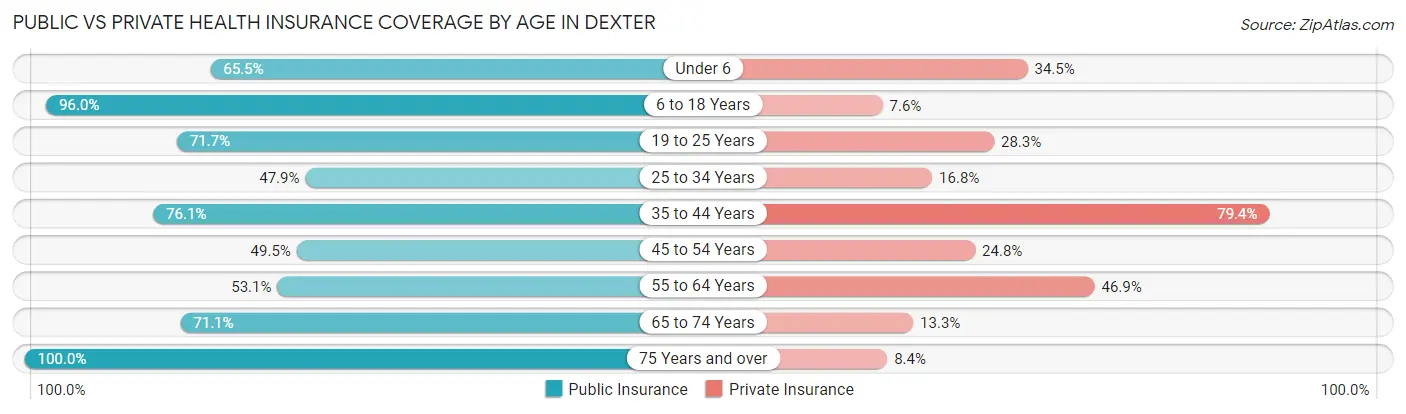
| Age Bracket | Public Insurance | Private Insurance |
| Under 6 | 38 (65.5%) | 20 (34.5%) |
| 6 to 18 Years | 241 (96.0%) | 19 (7.6%) |
| 19 to 25 Years | 33 (71.7%) | 13 (28.3%) |
| 25 to 34 Years | 80 (47.9%) | 28 (16.8%) |
| 35 to 44 Years | 118 (76.1%) | 123 (79.3%) |
| 45 to 54 Years | 50 (49.5%) | 25 (24.7%) |
| 55 to 64 Years | 43 (53.1%) | 38 (46.9%) |
| 65 to 74 Years | 59 (71.1%) | 11 (13.3%) |
| 75 Years and over | 83 (100.0%) | 7 (8.4%) |
| Total | 745 (72.7%) | 284 (27.7%) |
Disability Status by Sex by Age in Dexter
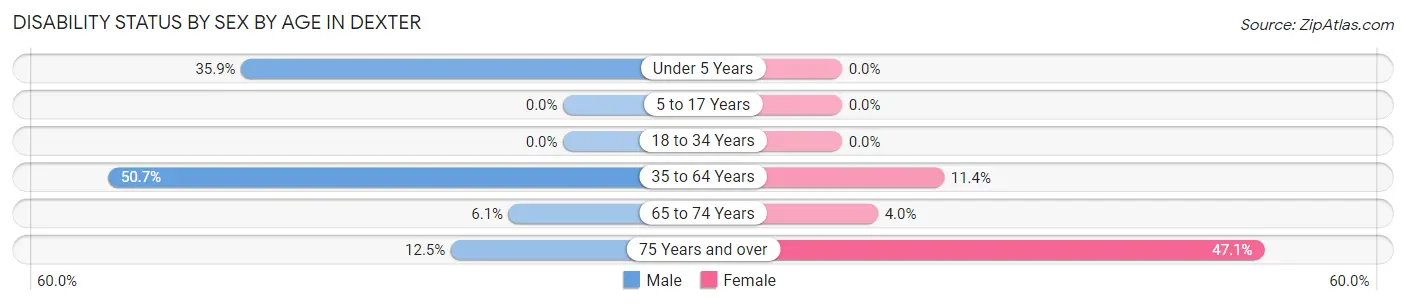
| Age Bracket | Male | Female |
| Under 5 Years | 19 (35.8%) | 0 (0.0%) |
| 5 to 17 Years | 0 (0.0%) | 0 (0.0%) |
| 18 to 34 Years | 0 (0.0%) | 0 (0.0%) |
| 35 to 64 Years | 104 (50.7%) | 15 (11.4%) |
| 65 to 74 Years | 2 (6.1%) | 2 (4.0%) |
| 75 Years and over | 4 (12.5%) | 24 (47.1%) |
Disability Class by Sex by Age in Dexter
Disability Class: Hearing Difficulty
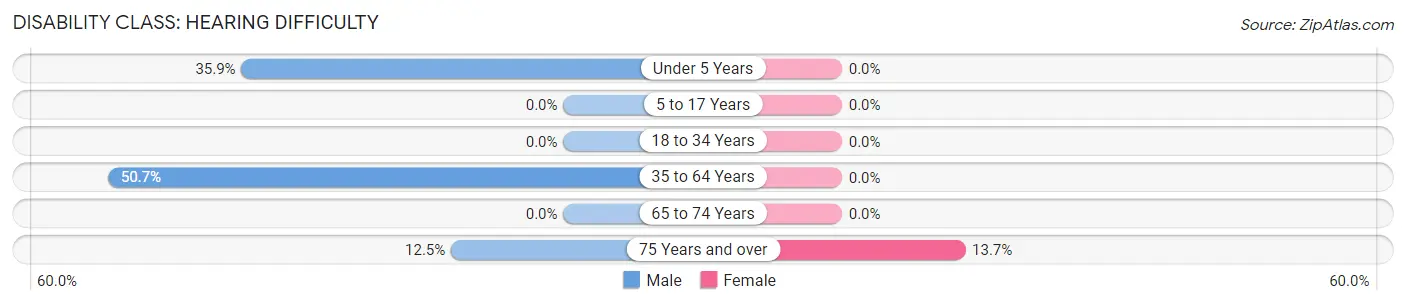
| Age Bracket | Male | Female |
| Under 5 Years | 19 (35.8%) | 0 (0.0%) |
| 5 to 17 Years | 0 (0.0%) | 0 (0.0%) |
| 18 to 34 Years | 0 (0.0%) | 0 (0.0%) |
| 35 to 64 Years | 104 (50.7%) | 0 (0.0%) |
| 65 to 74 Years | 0 (0.0%) | 0 (0.0%) |
| 75 Years and over | 4 (12.5%) | 7 (13.7%) |
Disability Class: Vision Difficulty
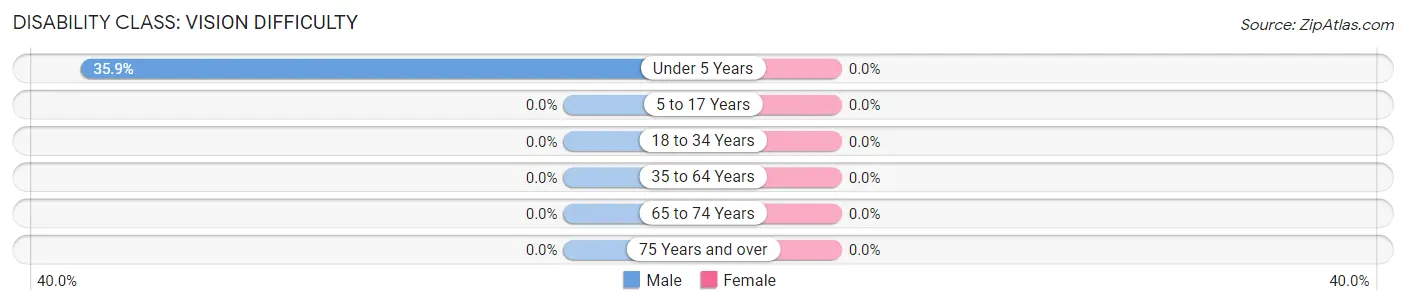
| Age Bracket | Male | Female |
| Under 5 Years | 19 (35.8%) | 0 (0.0%) |
| 5 to 17 Years | 0 (0.0%) | 0 (0.0%) |
| 18 to 34 Years | 0 (0.0%) | 0 (0.0%) |
| 35 to 64 Years | 0 (0.0%) | 0 (0.0%) |
| 65 to 74 Years | 0 (0.0%) | 0 (0.0%) |
| 75 Years and over | 0 (0.0%) | 0 (0.0%) |
Disability Class: Cognitive Difficulty
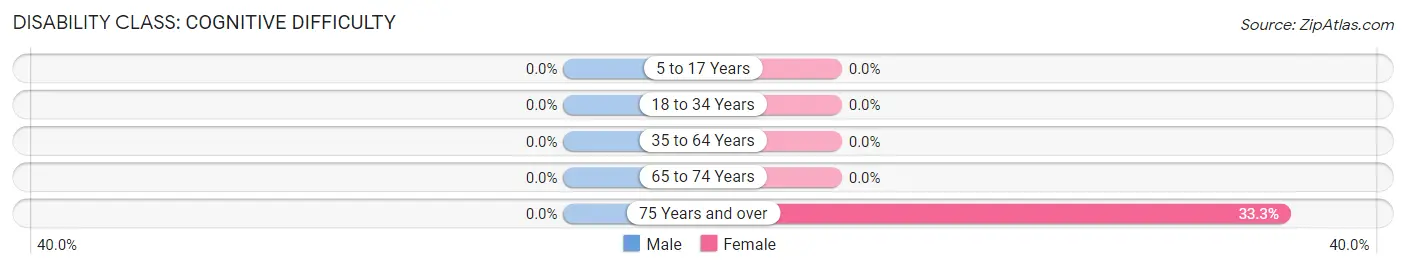
| Age Bracket | Male | Female |
| 5 to 17 Years | 0 (0.0%) | 0 (0.0%) |
| 18 to 34 Years | 0 (0.0%) | 0 (0.0%) |
| 35 to 64 Years | 0 (0.0%) | 0 (0.0%) |
| 65 to 74 Years | 0 (0.0%) | 0 (0.0%) |
| 75 Years and over | 0 (0.0%) | 17 (33.3%) |
Disability Class: Ambulatory Difficulty
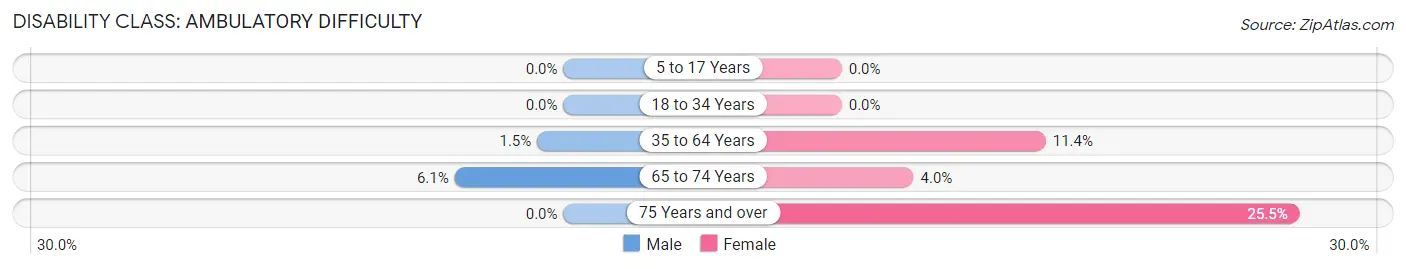
| Age Bracket | Male | Female |
| 5 to 17 Years | 0 (0.0%) | 0 (0.0%) |
| 18 to 34 Years | 0 (0.0%) | 0 (0.0%) |
| 35 to 64 Years | 3 (1.5%) | 15 (11.4%) |
| 65 to 74 Years | 2 (6.1%) | 2 (4.0%) |
| 75 Years and over | 0 (0.0%) | 13 (25.5%) |
Disability Class: Self-Care Difficulty
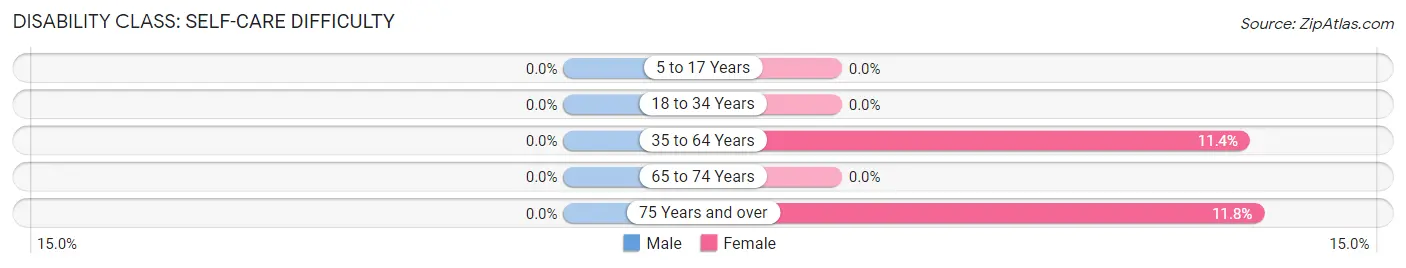
| Age Bracket | Male | Female |
| 5 to 17 Years | 0 (0.0%) | 0 (0.0%) |
| 18 to 34 Years | 0 (0.0%) | 0 (0.0%) |
| 35 to 64 Years | 0 (0.0%) | 15 (11.4%) |
| 65 to 74 Years | 0 (0.0%) | 0 (0.0%) |
| 75 Years and over | 0 (0.0%) | 6 (11.8%) |
Technology Access in Dexter
Computing Device Access in Dexter
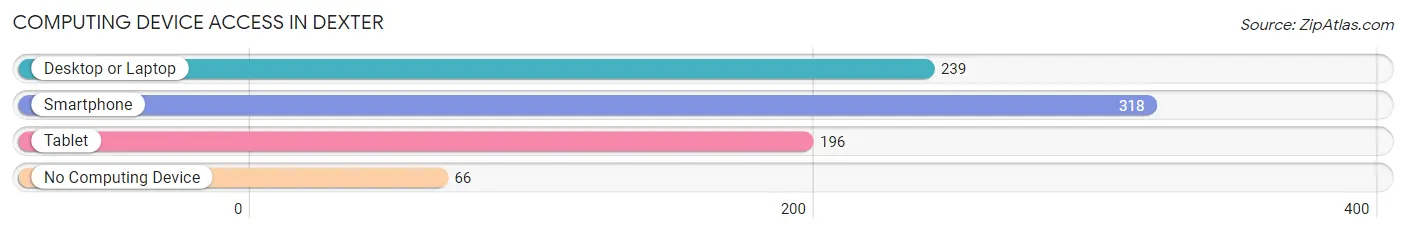
| Device Type | # Households | % Households |
| Desktop or Laptop | 239 | 59.3% |
| Smartphone | 318 | 78.9% |
| Tablet | 196 | 48.6% |
| No Computing Device | 66 | 16.4% |
| Total | 403 | 100.0% |
Internet Access in Dexter
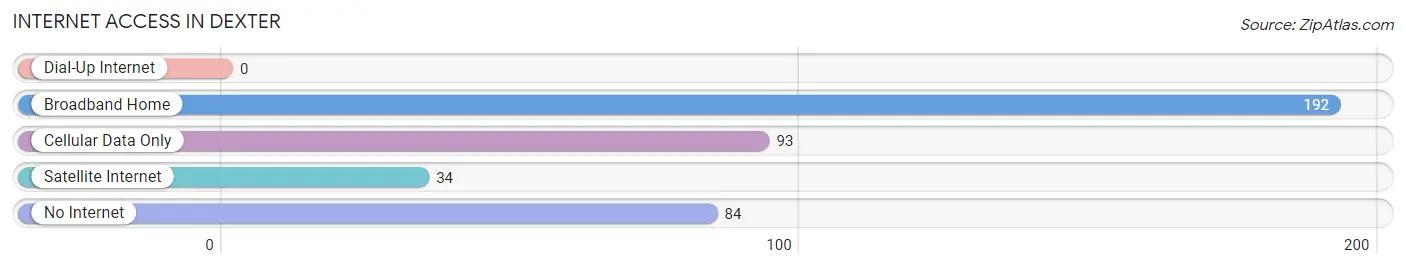
| Internet Type | # Households | % Households |
| Dial-Up Internet | 0 | 0.0% |
| Broadband Home | 192 | 47.6% |
| Cellular Data Only | 93 | 23.1% |
| Satellite Internet | 34 | 8.4% |
| No Internet | 84 | 20.8% |
| Total | 403 | 100.0% |
Dexter Summary
Dexter, New Mexico is a small town located in Chaves County in the southeastern part of the state. It is situated on the Pecos River, about 25 miles south of Roswell. The town was founded in 1885 and has a population of about 1,500 people.
Geography
Dexter is located in the Chihuahuan Desert, which is characterized by hot, dry summers and mild winters. The town is situated at an elevation of 4,000 feet and is surrounded by rolling hills and mesas. The Pecos River runs through the town, providing a source of water for the area.
The town is located in the Pecos Valley, which is a major agricultural region in the state. The area is known for its production of cotton, alfalfa, and other crops. The town is also home to several ranches, which raise cattle and other livestock.
Economy
The economy of Dexter is largely based on agriculture and ranching. The town is home to several cotton gins, which process cotton grown in the area. The town also has several feed stores, which provide feed for the local livestock.
The town is also home to several small businesses, including a grocery store, a hardware store, and a few restaurants. The town also has a small airport, which serves the local area.
Demographics
As of the 2010 census, the population of Dexter was 1,521. The racial makeup of the town was 79.3% White, 0.2% African American, 0.7% Native American, 0.2% Asian, 0.1% Pacific Islander, 17.2% from other races, and 2.5% from two or more races. Hispanic or Latino of any race were 33.2% of the population.
The median income for a household in the town was $25,938, and the median income for a family was $30,000. The per capita income for the town was $13,845. About 18.2% of families and 22.2% of the population were below the poverty line, including 28.3% of those under age 18 and 15.2% of those age 65 or over.
Conclusion
Dexter, New Mexico is a small town located in Chaves County in the southeastern part of the state. It is situated on the Pecos River, about 25 miles south of Roswell. The town was founded in 1885 and has a population of about 1,500 people. The economy of Dexter is largely based on agriculture and ranching, and the town is home to several small businesses. The racial makeup of the town is mostly White, with a significant Hispanic population. The median income for a household in the town is $25,938, and the per capita income is $13,845.
Common Questions
What is Per Capita Income in Dexter?
Per Capita income in Dexter is $19,172.
What is the Median Family Income in Dexter?
Median Family Income in Dexter is $64,318.
What is the Median Household income in Dexter?
Median Household Income in Dexter is $48,750.
What is Income or Wage Gap in Dexter?
Income or Wage Gap in Dexter is 56.7%.
Women in Dexter earn 43.3 cents for every dollar earned by a man.
What is Inequality or Gini Index in Dexter?
Inequality or Gini Index in Dexter is 0.41.
What is the Total Population of Dexter?
Total Population of Dexter is 1,025.
What is the Total Male Population of Dexter?
Total Male Population of Dexter is 524.
What is the Total Female Population of Dexter?
Total Female Population of Dexter is 501.
What is the Ratio of Males per 100 Females in Dexter?
There are 104.59 Males per 100 Females in Dexter.
What is the Ratio of Females per 100 Males in Dexter?
There are 95.61 Females per 100 Males in Dexter.
What is the Median Population Age in Dexter?
Median Population Age in Dexter is 34.7 Years.
What is the Average Family Size in Dexter
Average Family Size in Dexter is 2.9 People.
What is the Average Household Size in Dexter
Average Household Size in Dexter is 2.5 People.
How Large is the Labor Force in Dexter?
There are 447 People in the Labor Forcein in Dexter.
What is the Percentage of People in the Labor Force in Dexter?
60.7% of People are in the Labor Force in Dexter.
What is the Unemployment Rate in Dexter?
Unemployment Rate in Dexter is 9.6%.