Cuba, NM Map & Demographics
Cuba Map
Cuba Overview
$20,484
PER CAPITA INCOME
$45,781
AVG FAMILY INCOME
$34,432
AVG HOUSEHOLD INCOME
36.8%
WAGE / INCOME GAP [ % ]
63.2¢/ $1
WAGE / INCOME GAP [ $ ]
0.42
INEQUALITY / GINI INDEX
547
TOTAL POPULATION
256
MALE POPULATION
291
FEMALE POPULATION
87.97
MALES / 100 FEMALES
113.67
FEMALES / 100 MALES
36.5
MEDIAN AGE
3.5
AVG FAMILY SIZE
2.6
AVG HOUSEHOLD SIZE
236
LABOR FORCE [ PEOPLE ]
58.7%
PERCENT IN LABOR FORCE
8.5%
UNEMPLOYMENT RATE
Cuba Zip Codes
Cuba Area Codes
Income in Cuba
Income Overview in Cuba
Per Capita Income in Cuba is $20,484, while median incomes of families and households are $45,781 and $34,432 respectively.
| Characteristic | Number | Measure |
| Per Capita Income | 547 | $20,484 |
| Median Family Income | 115 | $45,781 |
| Mean Family Income | 115 | $59,238 |
| Median Household Income | 214 | $34,432 |
| Mean Household Income | 214 | $51,292 |
| Income Deficit | 115 | $0 |
| Wage / Income Gap (%) | 547 | 36.77% |
| Wage / Income Gap ($) | 547 | 63.23¢ per $1 |
| Gini / Inequality Index | 547 | 0.42 |
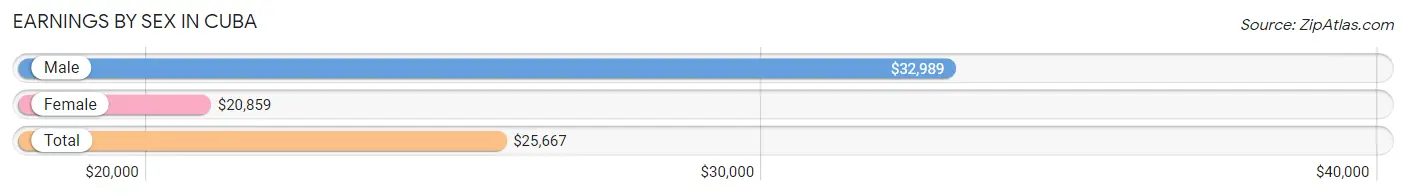
Earnings by Sex in Cuba
Average Earnings in Cuba are $25,667, $32,989 for men and $20,859 for women, a difference of 36.8%.
| Sex | Number | Average Earnings |
| Male | 133 (56.4%) | $32,989 |
| Female | 103 (43.6%) | $20,859 |
| Total | 236 (100.0%) | $25,667 |
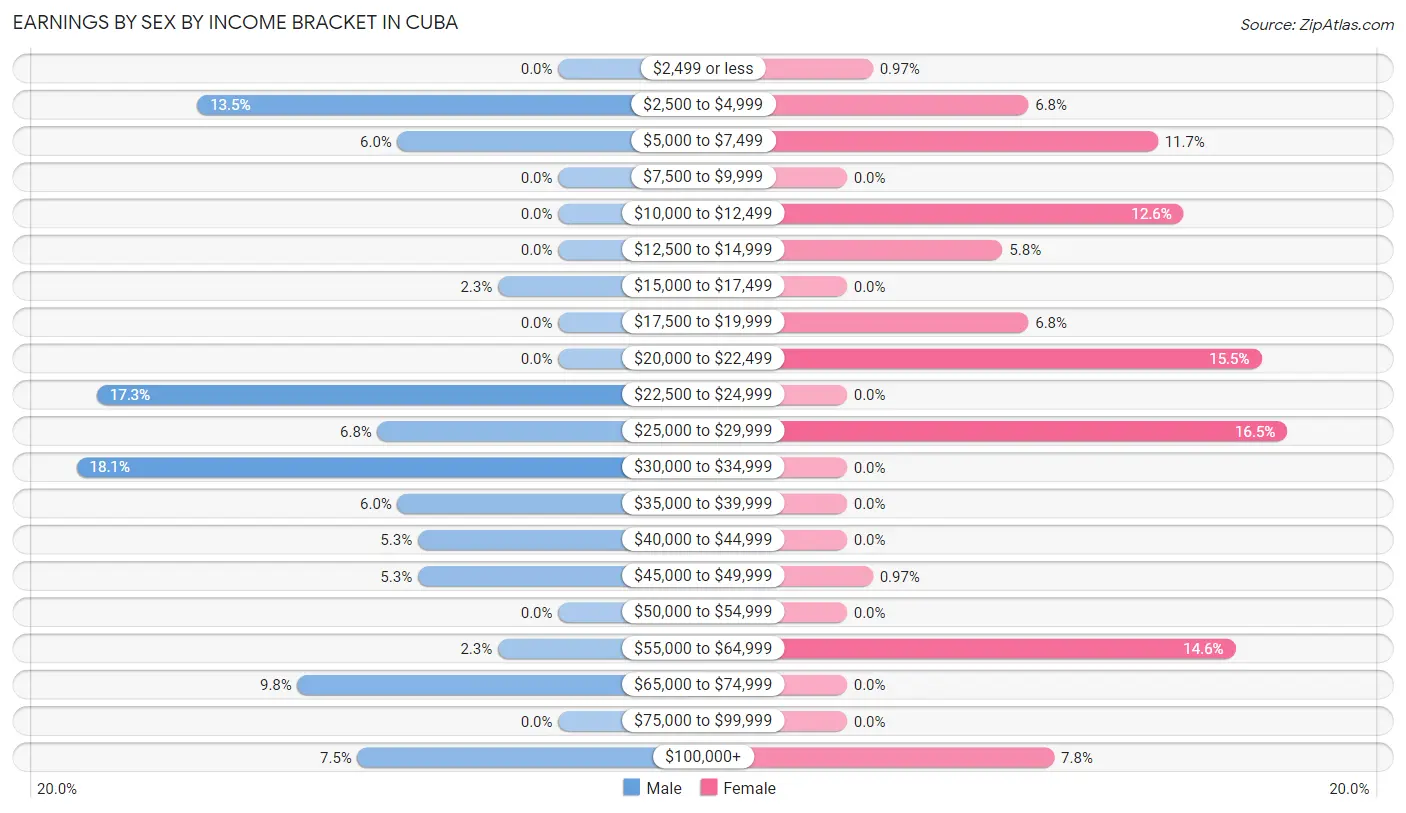
Earnings by Sex by Income Bracket in Cuba
The most common earnings brackets in Cuba are $30,000 to $34,999 for men (24 | 18.0%) and $25,000 to $29,999 for women (17 | 16.5%).
| Income | Male | Female |
| $2,499 or less | 0 (0.0%) | 1 (1.0%) |
| $2,500 to $4,999 | 18 (13.5%) | 7 (6.8%) |
| $5,000 to $7,499 | 8 (6.0%) | 12 (11.7%) |
| $7,500 to $9,999 | 0 (0.0%) | 0 (0.0%) |
| $10,000 to $12,499 | 0 (0.0%) | 13 (12.6%) |
| $12,500 to $14,999 | 0 (0.0%) | 6 (5.8%) |
| $15,000 to $17,499 | 3 (2.3%) | 0 (0.0%) |
| $17,500 to $19,999 | 0 (0.0%) | 7 (6.8%) |
| $20,000 to $22,499 | 0 (0.0%) | 16 (15.5%) |
| $22,500 to $24,999 | 23 (17.3%) | 0 (0.0%) |
| $25,000 to $29,999 | 9 (6.8%) | 17 (16.5%) |
| $30,000 to $34,999 | 24 (18.0%) | 0 (0.0%) |
| $35,000 to $39,999 | 8 (6.0%) | 0 (0.0%) |
| $40,000 to $44,999 | 7 (5.3%) | 0 (0.0%) |
| $45,000 to $49,999 | 7 (5.3%) | 1 (1.0%) |
| $50,000 to $54,999 | 0 (0.0%) | 0 (0.0%) |
| $55,000 to $64,999 | 3 (2.3%) | 15 (14.6%) |
| $65,000 to $74,999 | 13 (9.8%) | 0 (0.0%) |
| $75,000 to $99,999 | 0 (0.0%) | 0 (0.0%) |
| $100,000+ | 10 (7.5%) | 8 (7.8%) |
| Total | 133 (100.0%) | 103 (100.0%) |
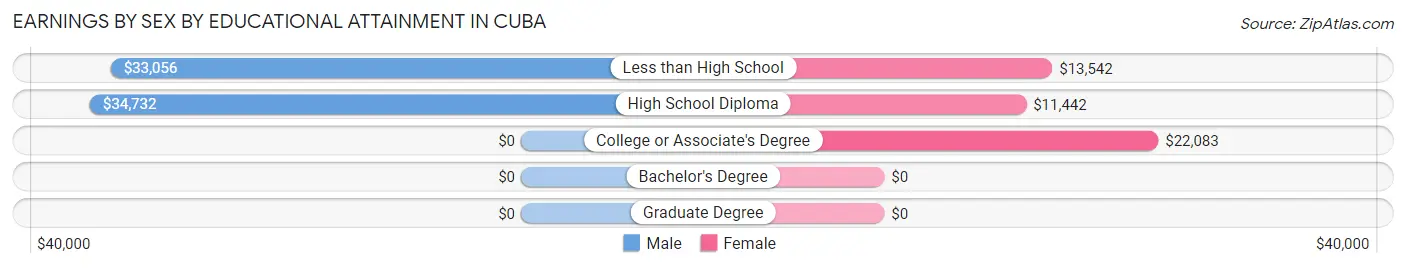
Earnings by Sex by Educational Attainment in Cuba
Average earnings in Cuba are $33,370 for men and $20,938 for women, a difference of 37.3%. Men with an educational attainment of high school diploma enjoy the highest average annual earnings of $34,732, while those with less than high school education earn the least with $33,056. Women with an educational attainment of college or associate's degree earn the most with the average annual earnings of $22,083, while those with high school diploma education have the smallest earnings of $11,442.
| Educational Attainment | Male Income | Female Income |
| Less than High School | $33,056 | $13,542 |
| High School Diploma | $34,732 | $11,442 |
| College or Associate's Degree | - | - |
| Bachelor's Degree | - | - |
| Graduate Degree | - | - |
| Total | $33,370 | $20,938 |
Family Income in Cuba
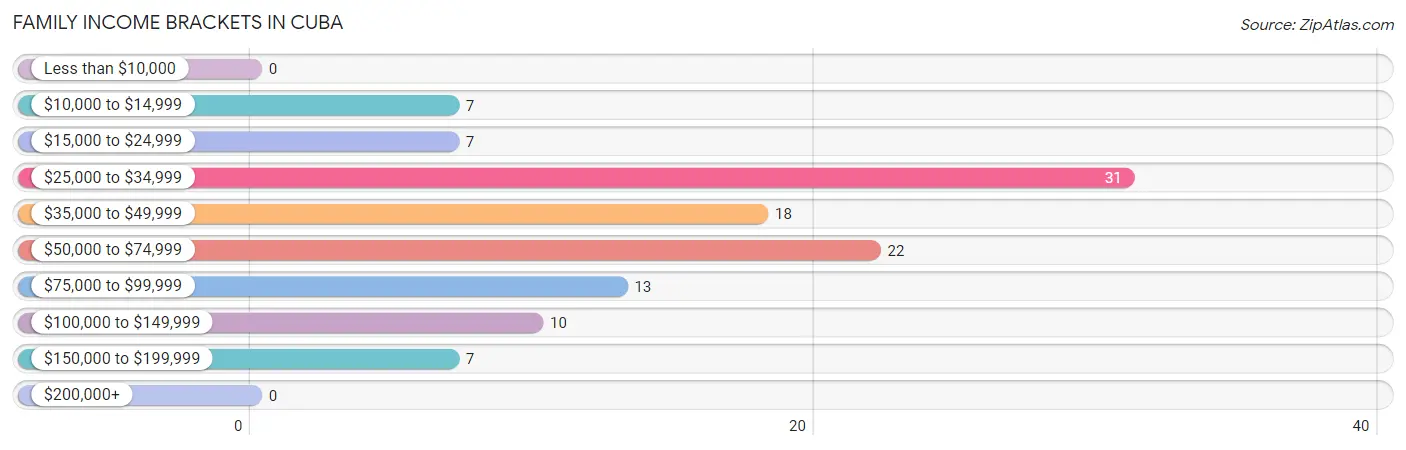
Family Income Brackets in Cuba
According to the Cuba family income data, there are 31 families falling into the $25,000 to $34,999 income range, which is the most common income bracket and makes up 27.0% of all families.
| Income Bracket | # Families | % Families |
| Less than $10,000 | 0 | 0.0% |
| $10,000 to $14,999 | 7 | 6.1% |
| $15,000 to $24,999 | 7 | 6.1% |
| $25,000 to $34,999 | 31 | 27.0% |
| $35,000 to $49,999 | 18 | 15.7% |
| $50,000 to $74,999 | 22 | 19.1% |
| $75,000 to $99,999 | 13 | 11.3% |
| $100,000 to $149,999 | 10 | 8.7% |
| $150,000 to $199,999 | 7 | 6.1% |
| $200,000+ | 0 | 0.0% |
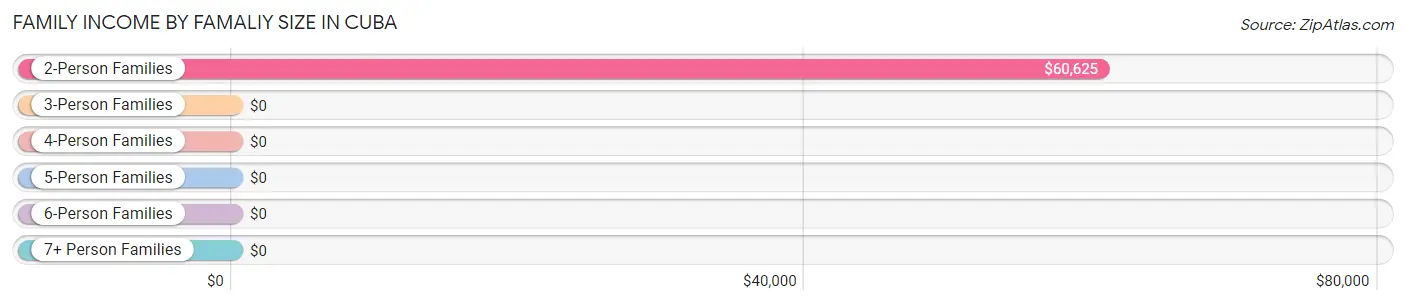
Family Income by Famaliy Size in Cuba
2-person families (18 | 15.7%) account for the highest median family income in Cuba with $60,625 per family, while 2-person families (18 | 15.7%) have the highest median income of $30,312 per family member.
| Income Bracket | # Families | Median Income |
| 2-Person Families | 18 (15.7%) | $60,625 |
| 3-Person Families | 46 (40.0%) | $0 |
| 4-Person Families | 39 (33.9%) | $0 |
| 5-Person Families | 10 (8.7%) | $0 |
| 6-Person Families | 2 (1.7%) | $0 |
| 7+ Person Families | 0 (0.0%) | $0 |
| Total | 115 (100.0%) | $45,781 |
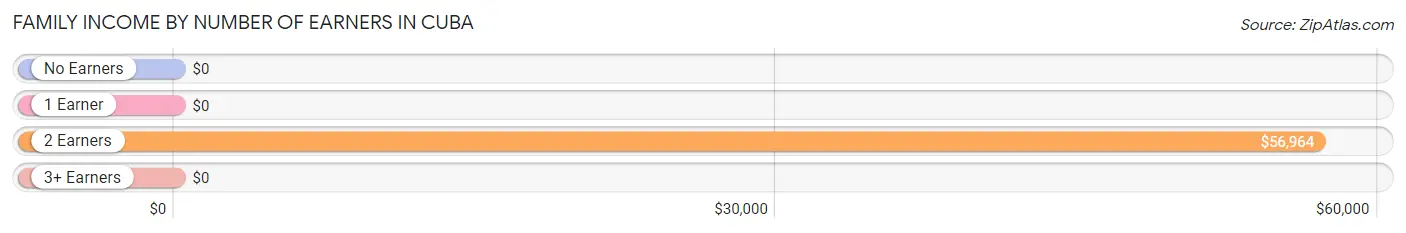
Family Income by Number of Earners in Cuba
| Number of Earners | # Families | Median Income |
| No Earners | 24 (20.9%) | $0 |
| 1 Earner | 48 (41.7%) | $0 |
| 2 Earners | 43 (37.4%) | $56,964 |
| 3+ Earners | 0 (0.0%) | $0 |
| Total | 115 (100.0%) | $45,781 |
Household Income in Cuba
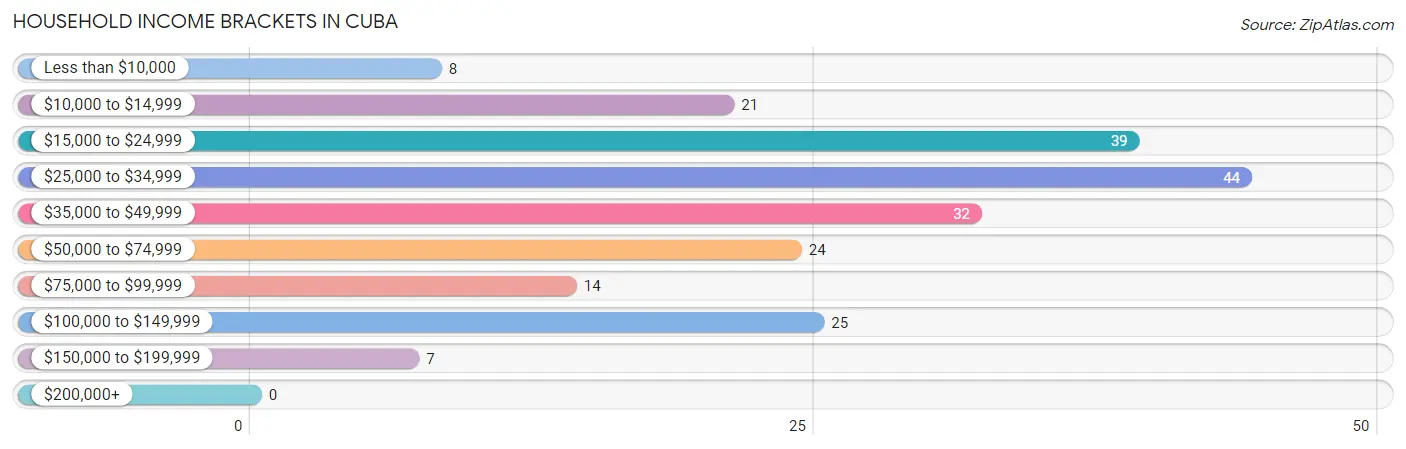
Household Income Brackets in Cuba
With 44 households falling in the category, the $25,000 to $34,999 income range is the most frequent in Cuba, accounting for 20.6% of all households.
| Income Bracket | # Households | % Households |
| Less than $10,000 | 8 | 3.7% |
| $10,000 to $14,999 | 21 | 9.8% |
| $15,000 to $24,999 | 39 | 18.2% |
| $25,000 to $34,999 | 44 | 20.6% |
| $35,000 to $49,999 | 32 | 15.0% |
| $50,000 to $74,999 | 24 | 11.2% |
| $75,000 to $99,999 | 14 | 6.5% |
| $100,000 to $149,999 | 25 | 11.7% |
| $150,000 to $199,999 | 7 | 3.3% |
| $200,000+ | 0 | 0.0% |
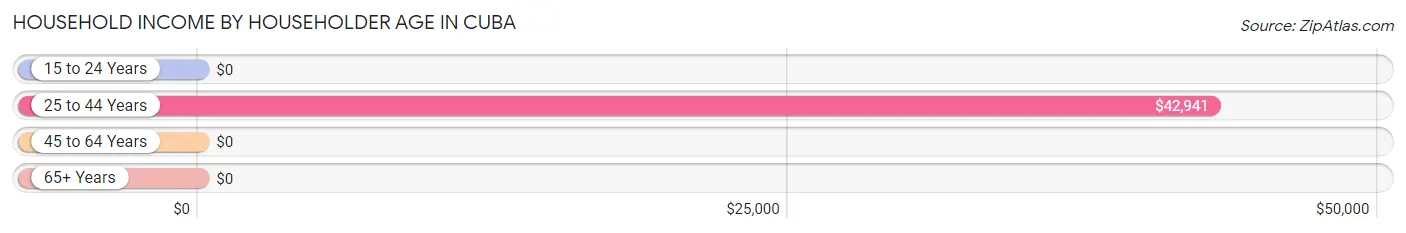
Household Income by Householder Age in Cuba
The median household income in Cuba is $34,432, with the highest median household income of $42,941 found in the 25 to 44 years age bracket for the primary householder. A total of 98 households (45.8%) fall into this category.
| Income Bracket | # Households | Median Income |
| 15 to 24 Years | 0 (0.0%) | $0 |
| 25 to 44 Years | 98 (45.8%) | $42,941 |
| 45 to 64 Years | 57 (26.6%) | $0 |
| 65+ Years | 59 (27.6%) | $0 |
| Total | 214 (100.0%) | $34,432 |
Poverty in Cuba
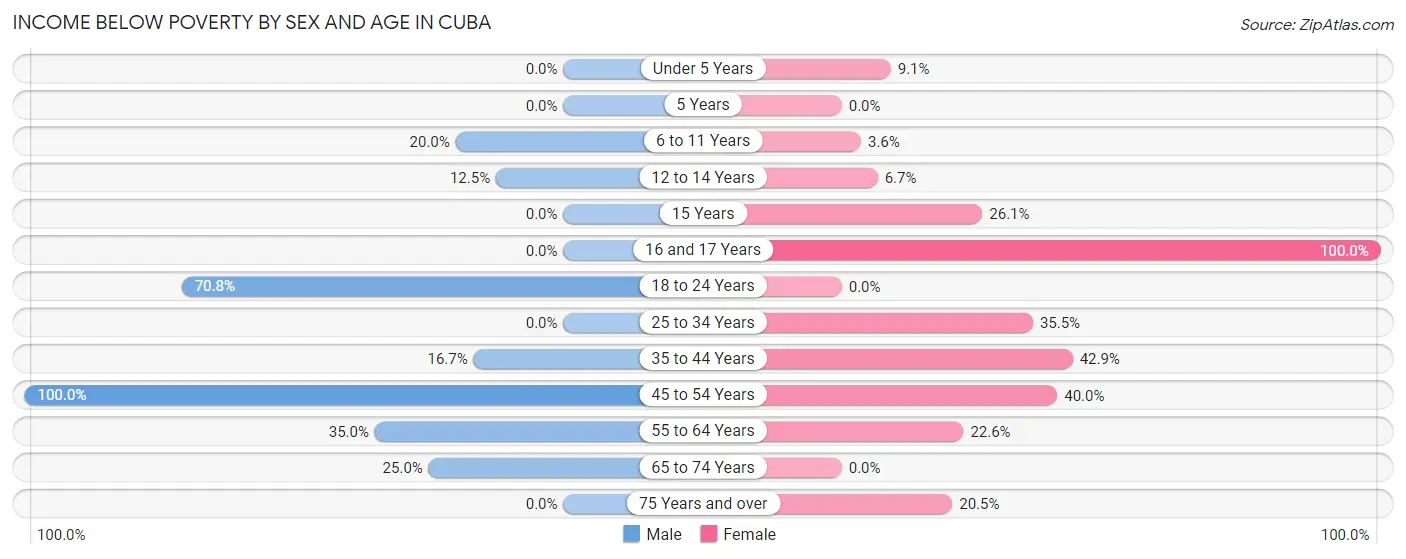
Income Below Poverty by Sex and Age in Cuba
With 23.4% poverty level for males and 22.7% for females among the residents of Cuba, 45 to 54 year old males and 16 and 17 year old females are the most vulnerable to poverty, with 14 males (100.0%) and 1 females (100.0%) in their respective age groups living below the poverty level.
| Age Bracket | Male | Female |
| Under 5 Years | 0 (0.0%) | 1 (9.1%) |
| 5 Years | 0 (0.0%) | 0 (0.0%) |
| 6 to 11 Years | 6 (20.0%) | 1 (3.6%) |
| 12 to 14 Years | 1 (12.5%) | 1 (6.7%) |
| 15 Years | 0 (0.0%) | 6 (26.1%) |
| 16 and 17 Years | 0 (0.0%) | 1 (100.0%) |
| 18 to 24 Years | 17 (70.8%) | 0 (0.0%) |
| 25 to 34 Years | 0 (0.0%) | 22 (35.5%) |
| 35 to 44 Years | 14 (16.7%) | 15 (42.9%) |
| 45 to 54 Years | 14 (100.0%) | 4 (40.0%) |
| 55 to 64 Years | 7 (35.0%) | 7 (22.6%) |
| 65 to 74 Years | 1 (25.0%) | 0 (0.0%) |
| 75 Years and over | 0 (0.0%) | 8 (20.5%) |
| Total | 60 (23.4%) | 66 (22.7%) |
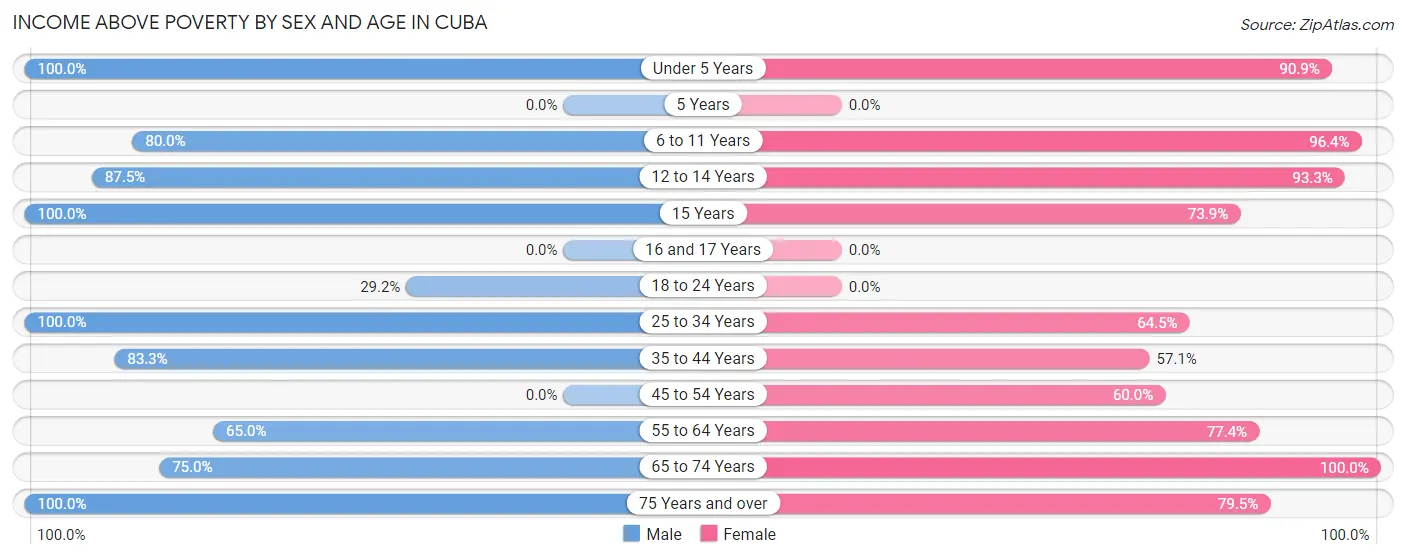
Income Above Poverty by Sex and Age in Cuba
According to the poverty statistics in Cuba, males aged under 5 years and females aged 65 to 74 years are the age groups that are most secure financially, with 100.0% of males and 100.0% of females in these age groups living above the poverty line.
| Age Bracket | Male | Female |
| Under 5 Years | 24 (100.0%) | 10 (90.9%) |
| 5 Years | 0 (0.0%) | 0 (0.0%) |
| 6 to 11 Years | 24 (80.0%) | 27 (96.4%) |
| 12 to 14 Years | 7 (87.5%) | 14 (93.3%) |
| 15 Years | 6 (100.0%) | 17 (73.9%) |
| 16 and 17 Years | 0 (0.0%) | 0 (0.0%) |
| 18 to 24 Years | 7 (29.2%) | 0 (0.0%) |
| 25 to 34 Years | 25 (100.0%) | 40 (64.5%) |
| 35 to 44 Years | 70 (83.3%) | 20 (57.1%) |
| 45 to 54 Years | 0 (0.0%) | 6 (60.0%) |
| 55 to 64 Years | 13 (65.0%) | 24 (77.4%) |
| 65 to 74 Years | 3 (75.0%) | 36 (100.0%) |
| 75 Years and over | 17 (100.0%) | 31 (79.5%) |
| Total | 196 (76.6%) | 225 (77.3%) |
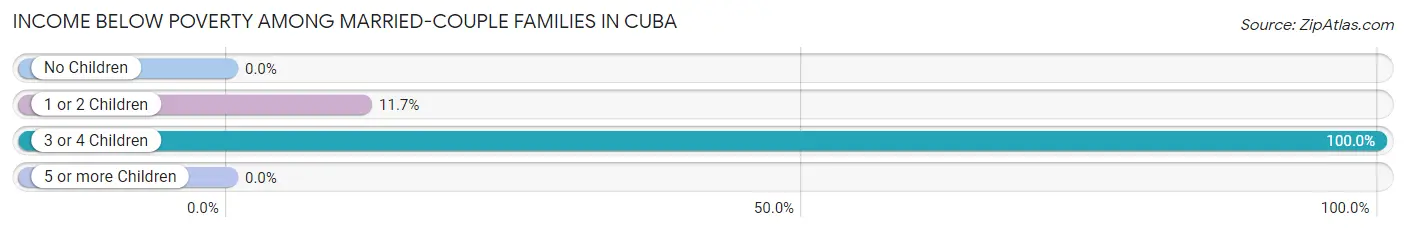
Income Below Poverty Among Married-Couple Families in Cuba
The poverty statistics for married-couple families in Cuba show that 10.5% or 9 of the total 86 families live below the poverty line. Families with 3 or 4 children have the highest poverty rate of 100.0%, comprising of 2 families. On the other hand, families with no children have the lowest poverty rate of 0.0%, which includes 0 families.
| Children | Above Poverty | Below Poverty |
| No Children | 24 (100.0%) | 0 (0.0%) |
| 1 or 2 Children | 53 (88.3%) | 7 (11.7%) |
| 3 or 4 Children | 0 (0.0%) | 2 (100.0%) |
| 5 or more Children | 0 (0.0%) | 0 (0.0%) |
| Total | 77 (89.5%) | 9 (10.5%) |
Income Below Poverty Among Single-Parent Households in Cuba
According to the poverty data in Cuba, 25.9% or 7 single-father households and 100.0% or 2 single-mother households are living below the poverty line. Among single-father households, those with no children have the highest poverty rate, with 7 households (77.8%) experiencing poverty. Likewise, among single-mother households, those with 3 or 4 children have the highest poverty rate, with 2 households (100.0%) falling below the poverty line.
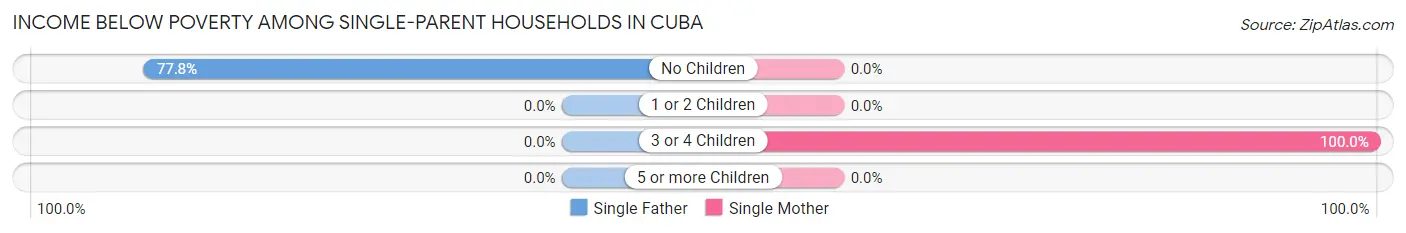
| Children | Single Father | Single Mother |
| No Children | 7 (77.8%) | 0 (0.0%) |
| 1 or 2 Children | 0 (0.0%) | 0 (0.0%) |
| 3 or 4 Children | 0 (0.0%) | 2 (100.0%) |
| 5 or more Children | 0 (0.0%) | 0 (0.0%) |
| Total | 7 (25.9%) | 2 (100.0%) |
Income Below Poverty Among Married-Couple vs Single-Parent Households in Cuba
The poverty data for Cuba shows that 9 of the married-couple family households (10.5%) and 9 of the single-parent households (31.0%) are living below the poverty level. Within the married-couple family households, those with 3 or 4 children have the highest poverty rate, with 2 households (100.0%) falling below the poverty line. Among the single-parent households, those with no children have the highest poverty rate, with 7 household (77.8%) living below poverty.
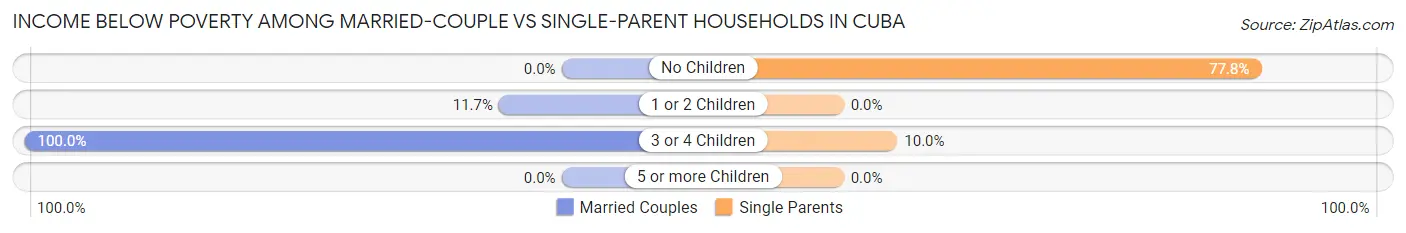
| Children | Married-Couple Families | Single-Parent Households |
| No Children | 0 (0.0%) | 7 (77.8%) |
| 1 or 2 Children | 7 (11.7%) | 0 (0.0%) |
| 3 or 4 Children | 2 (100.0%) | 2 (10.0%) |
| 5 or more Children | 0 (0.0%) | 0 (0.0%) |
| Total | 9 (10.5%) | 9 (31.0%) |
Race in Cuba
The most populous races in Cuba are Hispanic or Latino (310 | 56.7%), Native / Alaskan (171 | 31.3%), and Some other Race (156 | 28.5%).
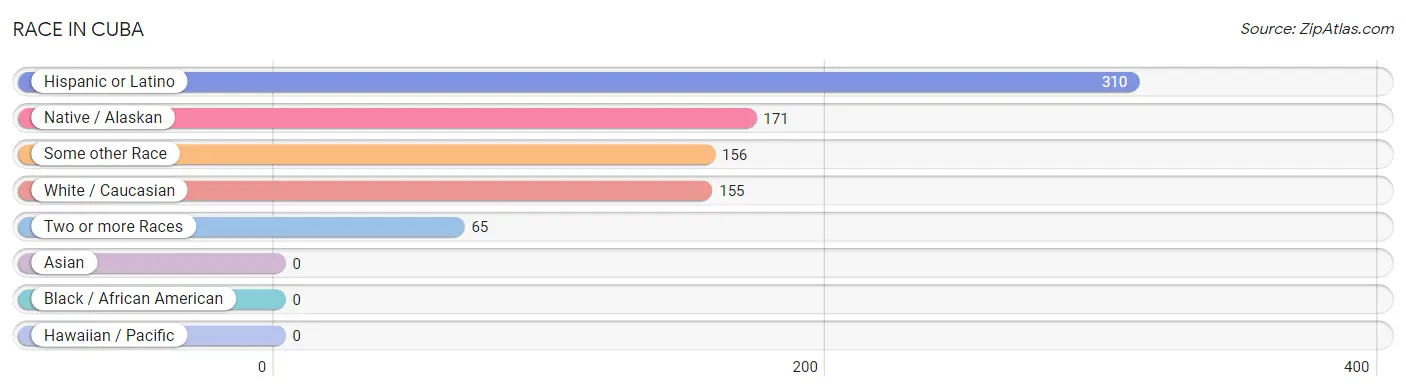
| Race | # Population | % Population |
| Asian | 0 | 0.0% |
| Black / African American | 0 | 0.0% |
| Hawaiian / Pacific | 0 | 0.0% |
| Hispanic or Latino | 310 | 56.7% |
| Native / Alaskan | 171 | 31.3% |
| White / Caucasian | 155 | 28.3% |
| Two or more Races | 65 | 11.9% |
| Some other Race | 156 | 28.5% |
| Total | 547 | 100.0% |
Ancestry in Cuba
The most populous ancestries reported in Cuba are Mexican (187 | 34.2%), Navajo (113 | 20.7%), Spanish (69 | 12.6%), Pueblo (67 | 12.2%), and Spaniard (23 | 4.2%), together accounting for 83.9% of all Cuba residents.
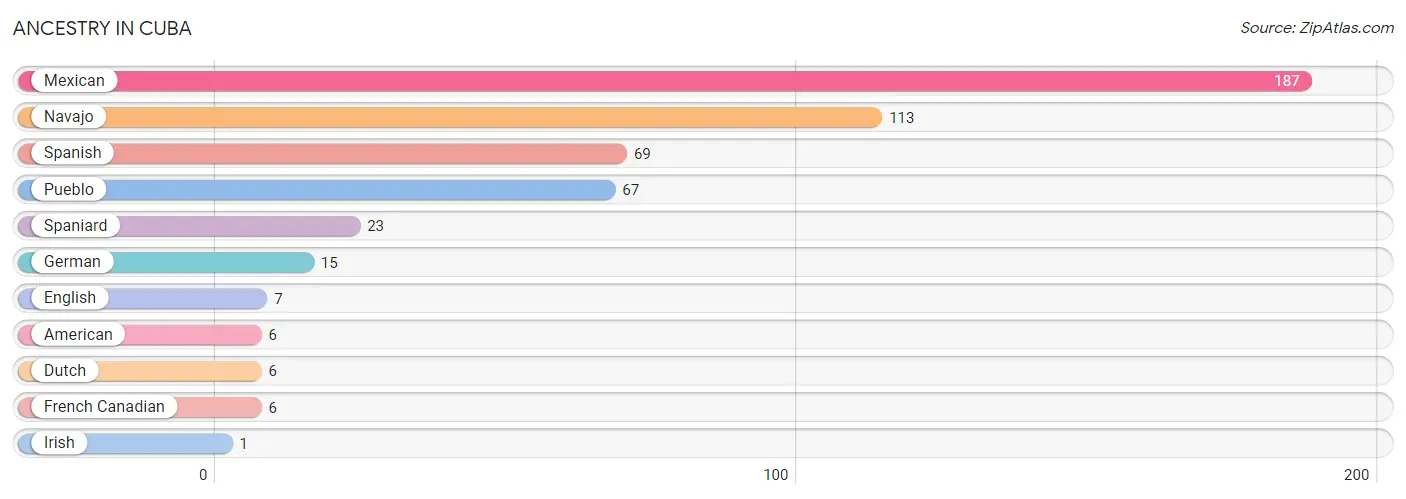
| Ancestry | # Population | % Population |
| American | 6 | 1.1% |
| Dutch | 6 | 1.1% |
| English | 7 | 1.3% |
| French Canadian | 6 | 1.1% |
| German | 15 | 2.7% |
| Irish | 1 | 0.2% |
| Mexican | 187 | 34.2% |
| Navajo | 113 | 20.7% |
| Pueblo | 67 | 12.2% |
| Spaniard | 23 | 4.2% |
| Spanish | 69 | 12.6% | View All 11 Rows |
Immigrants in Cuba
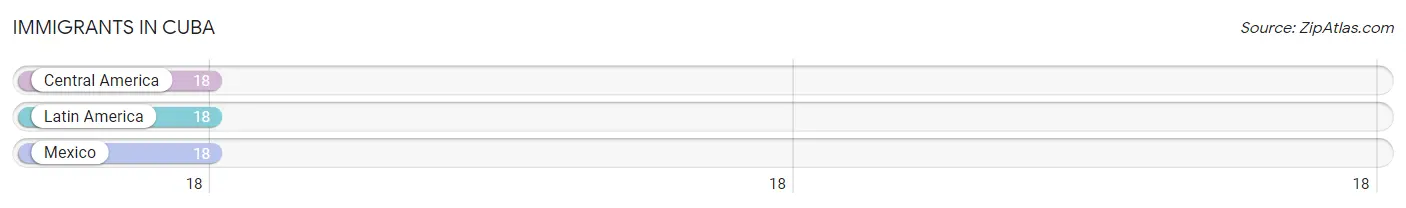
The most numerous immigrant groups reported in Cuba came from Central America (18 | 3.3%), Latin America (18 | 3.3%), and Mexico (18 | 3.3%), together accounting for 9.9% of all Cuba residents.
| Immigration Origin | # Population | % Population |
| Central America | 18 | 3.3% |
| Latin America | 18 | 3.3% |
| Mexico | 18 | 3.3% | View All 3 Rows |
Sex and Age in Cuba
Sex and Age in Cuba
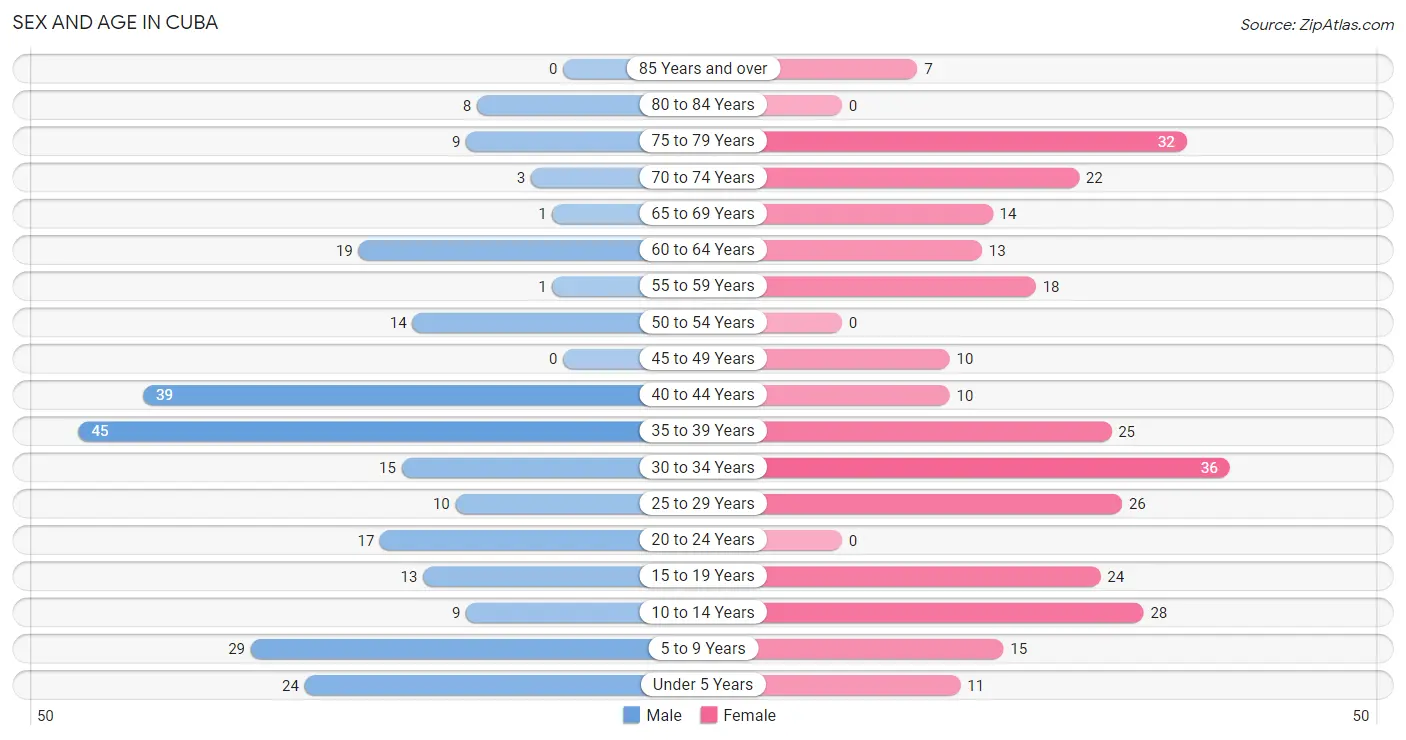
The most populous age groups in Cuba are 35 to 39 Years (45 | 17.6%) for men and 30 to 34 Years (36 | 12.4%) for women.
| Age Bracket | Male | Female |
| Under 5 Years | 24 (9.4%) | 11 (3.8%) |
| 5 to 9 Years | 29 (11.3%) | 15 (5.1%) |
| 10 to 14 Years | 9 (3.5%) | 28 (9.6%) |
| 15 to 19 Years | 13 (5.1%) | 24 (8.3%) |
| 20 to 24 Years | 17 (6.6%) | 0 (0.0%) |
| 25 to 29 Years | 10 (3.9%) | 26 (8.9%) |
| 30 to 34 Years | 15 (5.9%) | 36 (12.4%) |
| 35 to 39 Years | 45 (17.6%) | 25 (8.6%) |
| 40 to 44 Years | 39 (15.2%) | 10 (3.4%) |
| 45 to 49 Years | 0 (0.0%) | 10 (3.4%) |
| 50 to 54 Years | 14 (5.5%) | 0 (0.0%) |
| 55 to 59 Years | 1 (0.4%) | 18 (6.2%) |
| 60 to 64 Years | 19 (7.4%) | 13 (4.5%) |
| 65 to 69 Years | 1 (0.4%) | 14 (4.8%) |
| 70 to 74 Years | 3 (1.2%) | 22 (7.6%) |
| 75 to 79 Years | 9 (3.5%) | 32 (11.0%) |
| 80 to 84 Years | 8 (3.1%) | 0 (0.0%) |
| 85 Years and over | 0 (0.0%) | 7 (2.4%) |
| Total | 256 (100.0%) | 291 (100.0%) |
Families and Households in Cuba
Median Family Size in Cuba
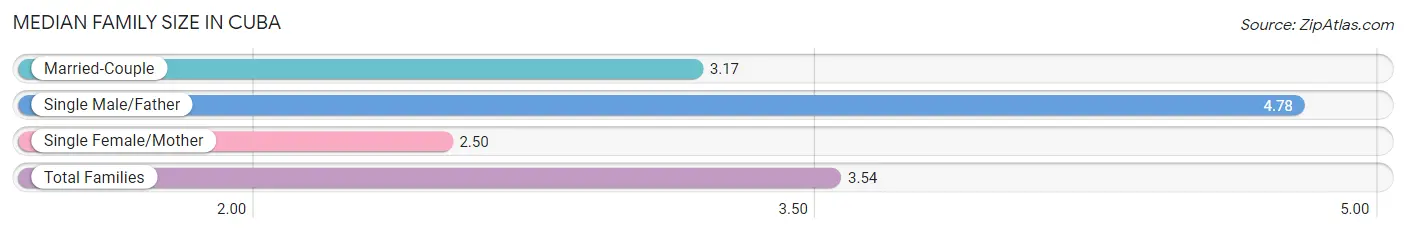
The median family size in Cuba is 3.54 persons per family, with single male/father families (27 | 23.5%) accounting for the largest median family size of 4.78 persons per family. On the other hand, single female/mother families (2 | 1.7%) represent the smallest median family size with 2.50 persons per family.
| Family Type | # Families | Family Size |
| Married-Couple | 86 (74.8%) | 3.17 |
| Single Male/Father | 27 (23.5%) | 4.78 |
| Single Female/Mother | 2 (1.7%) | 2.50 |
| Total Families | 115 (100.0%) | 3.54 |
Median Household Size in Cuba
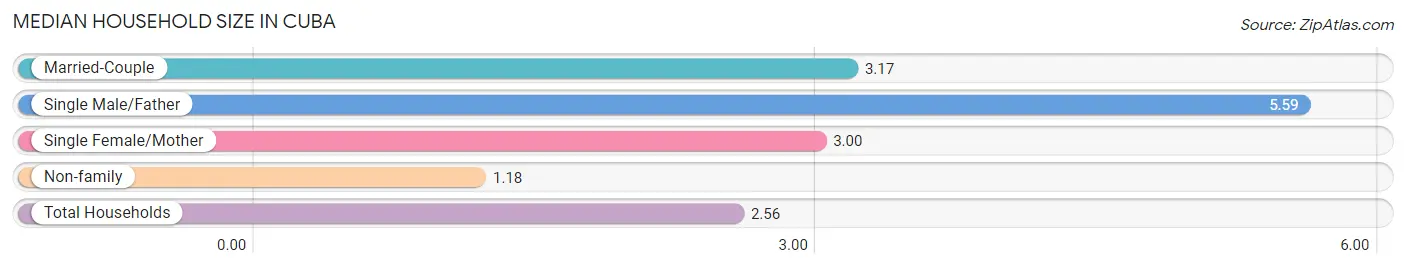
The median household size in Cuba is 2.56 persons per household, with single male/father households (27 | 12.6%) accounting for the largest median household size of 5.59 persons per household. non-family households (99 | 46.3%) represent the smallest median household size with 1.18 persons per household.
| Household Type | # Households | Household Size |
| Married-Couple | 86 (40.2%) | 3.17 |
| Single Male/Father | 27 (12.6%) | 5.59 |
| Single Female/Mother | 2 (0.9%) | 3.00 |
| Non-family | 99 (46.3%) | 1.18 |
| Total Households | 214 (100.0%) | 2.56 |
Household Size by Marriage Status in Cuba
Out of a total of 214 households in Cuba, 115 (53.7%) are family households, while 99 (46.3%) are nonfamily households. The most numerous type of family households are 3-person households, comprising 39, and the most common type of nonfamily households are 1-person households, comprising 84.
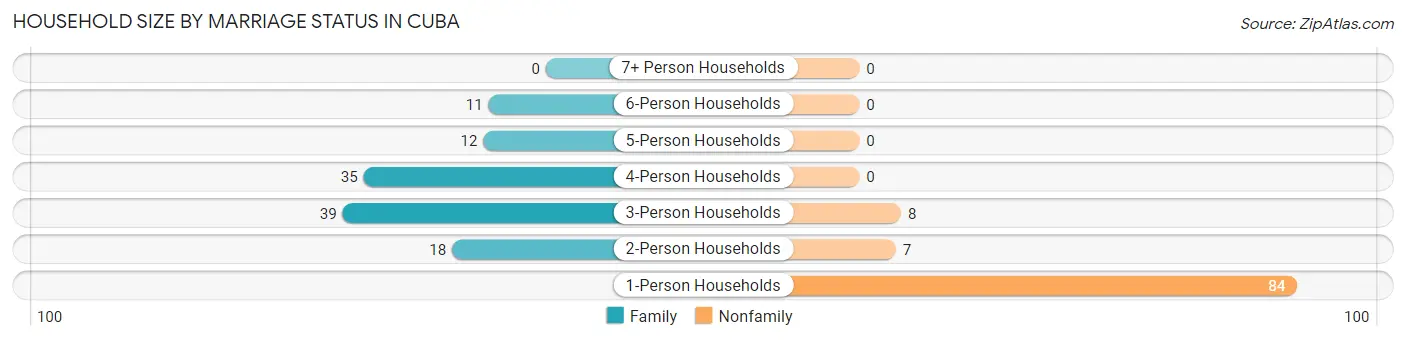
| Household Size | Family Households | Nonfamily Households |
| 1-Person Households | - | 84 (39.3%) |
| 2-Person Households | 18 (8.4%) | 7 (3.3%) |
| 3-Person Households | 39 (18.2%) | 8 (3.7%) |
| 4-Person Households | 35 (16.4%) | 0 (0.0%) |
| 5-Person Households | 12 (5.6%) | 0 (0.0%) |
| 6-Person Households | 11 (5.1%) | 0 (0.0%) |
| 7+ Person Households | 0 (0.0%) | 0 (0.0%) |
| Total | 115 (53.7%) | 99 (46.3%) |
Female Fertility in Cuba
Fertility by Age in Cuba
| Age Bracket | Women with Births | Births / 1,000 Women |
| 15 to 19 years | 0 (0.0%) | 0.0 |
| 20 to 34 years | 0 (0.0%) | 0.0 |
| 35 to 50 years | 0 (0.0%) | 0.0 |
| Total | 0 (0.0%) | 0.0 |
Fertility by Age by Marriage Status in Cuba
| Age Bracket | Married | Unmarried |
| 15 to 19 years | 0 (0.0%) | 0 (0.0%) |
| 20 to 34 years | 0 (0.0%) | 0 (0.0%) |
| 35 to 50 years | 0 (0.0%) | 0 (0.0%) |
| Total | 0 (0.0%) | 0 (0.0%) |
Fertility by Education in Cuba
| Educational Attainment | Women with Births | Births / 1,000 Women |
| Less than High School | 0 (0.0%) | 0.0 |
| High School Diploma | 0 (0.0%) | 0.0 |
| College or Associate's Degree | 0 (0.0%) | 0.0 |
| Bachelor's Degree | 0 (0.0%) | 0.0 |
| Graduate Degree | 0 (0.0%) | 0.0 |
| Total | 0 (0.0%) | 0.0 |
Fertility by Education by Marriage Status in Cuba
| Educational Attainment | Married | Unmarried |
| Less than High School | 0 (0.0%) | 0 (0.0%) |
| High School Diploma | 0 (0.0%) | 0 (0.0%) |
| College or Associate's Degree | 0 (0.0%) | 0 (0.0%) |
| Bachelor's Degree | 0 (0.0%) | 0 (0.0%) |
| Graduate Degree | 0 (0.0%) | 0 (0.0%) |
| Total | 0 (0.0%) | 0 (0.0%) |
Employment Characteristics in Cuba
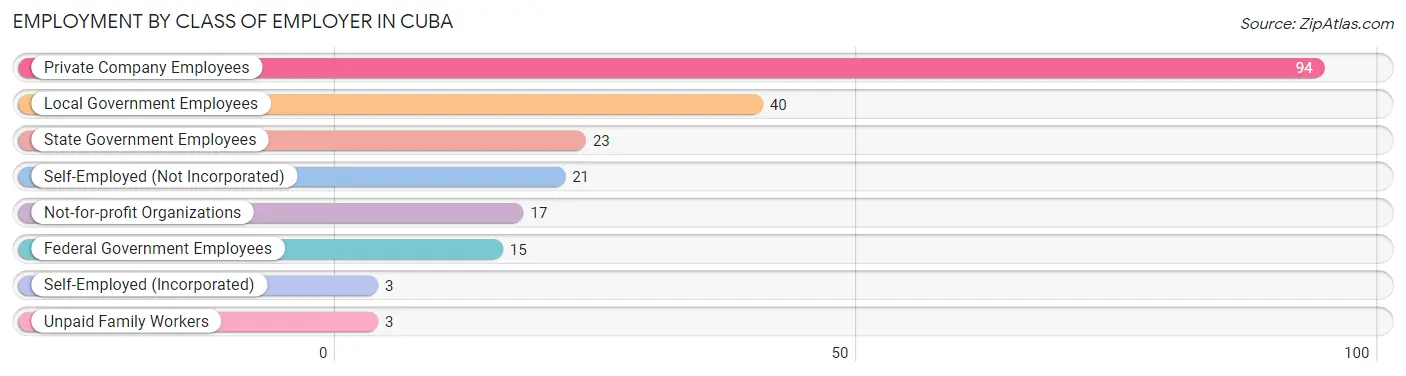
Employment by Class of Employer in Cuba
Among the 216 employed individuals in Cuba, private company employees (94 | 43.5%), local government employees (40 | 18.5%), and state government employees (23 | 10.6%) make up the most common classes of employment.
| Employer Class | # Employees | % Employees |
| Private Company Employees | 94 | 43.5% |
| Self-Employed (Incorporated) | 3 | 1.4% |
| Self-Employed (Not Incorporated) | 21 | 9.7% |
| Not-for-profit Organizations | 17 | 7.9% |
| Local Government Employees | 40 | 18.5% |
| State Government Employees | 23 | 10.6% |
| Federal Government Employees | 15 | 6.9% |
| Unpaid Family Workers | 3 | 1.4% |
| Total | 216 | 100.0% |
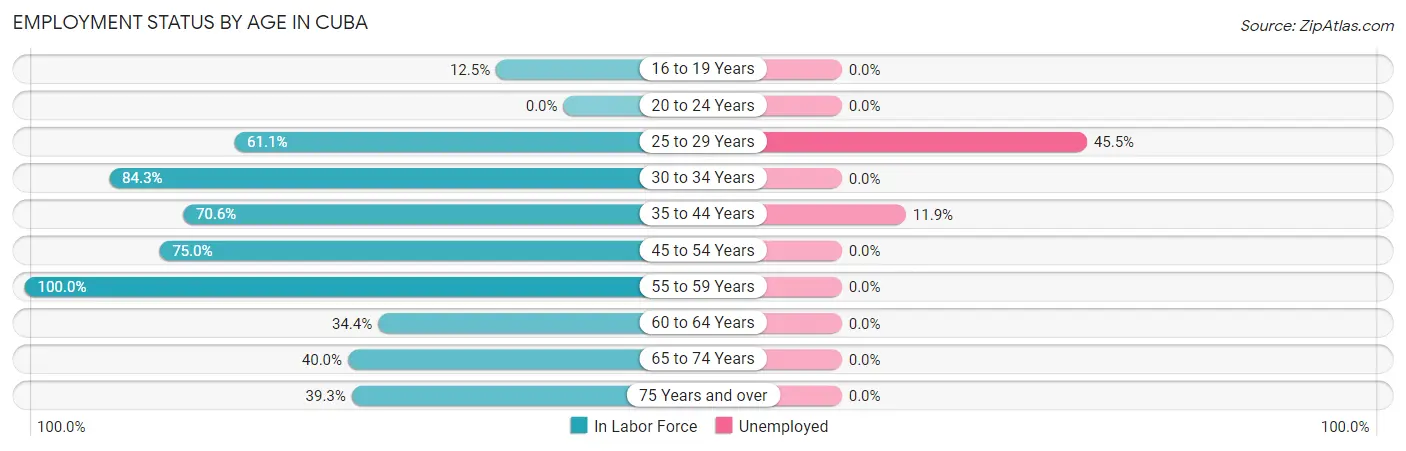
Employment Status by Age in Cuba
According to the labor force statistics for Cuba, out of the total population over 16 years of age (402), 58.7% or 236 individuals are in the labor force, with 8.5% or 20 of them unemployed. The age group with the highest labor force participation rate is 55 to 59 years, with 100.0% or 19 individuals in the labor force. Within the labor force, the 25 to 29 years age range has the highest percentage of unemployed individuals, with 45.5% or 10 of them being unemployed.
| Age Bracket | In Labor Force | Unemployed |
| 16 to 19 Years | 1 (12.5%) | 0 (0.0%) |
| 20 to 24 Years | 0 (0.0%) | 0 (0.0%) |
| 25 to 29 Years | 22 (61.1%) | 10 (45.5%) |
| 30 to 34 Years | 43 (84.3%) | 0 (0.0%) |
| 35 to 44 Years | 84 (70.6%) | 10 (11.9%) |
| 45 to 54 Years | 18 (75.0%) | 0 (0.0%) |
| 55 to 59 Years | 19 (100.0%) | 0 (0.0%) |
| 60 to 64 Years | 11 (34.4%) | 0 (0.0%) |
| 65 to 74 Years | 16 (40.0%) | 0 (0.0%) |
| 75 Years and over | 22 (39.3%) | 0 (0.0%) |
| Total | 236 (58.7%) | 20 (8.5%) |
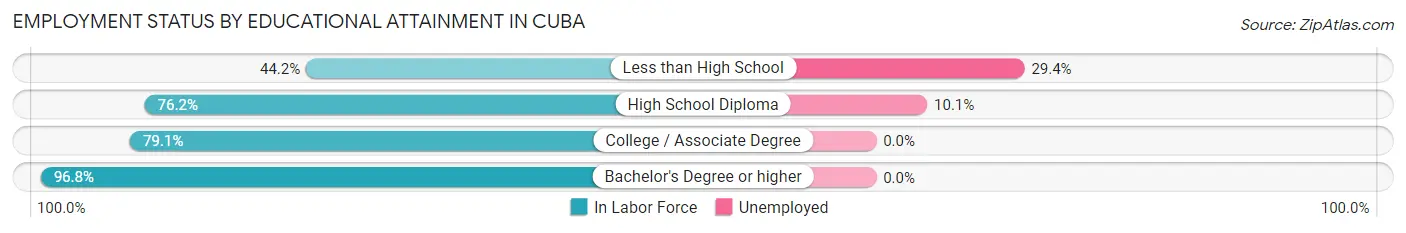
Employment Status by Educational Attainment in Cuba
According to labor force statistics for Cuba, 70.1% of individuals (197) out of the total population between 25 and 64 years of age (281) are in the labor force, with 10.2% or 20 of them being unemployed. The group with the highest labor force participation rate are those with the educational attainment of bachelor's degree or higher, with 96.8% or 30 individuals in the labor force. Within the labor force, individuals with less than high school education have the highest percentage of unemployment, with 29.4% or 10 of them being unemployed.
| Educational Attainment | In Labor Force | Unemployed |
| Less than High School | 34 (44.2%) | 23 (29.4%) |
| High School Diploma | 99 (76.2%) | 13 (10.1%) |
| College / Associate Degree | 34 (79.1%) | 0 (0.0%) |
| Bachelor's Degree or higher | 30 (96.8%) | 0 (0.0%) |
| Total | 197 (70.1%) | 29 (10.2%) |
Employment Occupations by Sex in Cuba
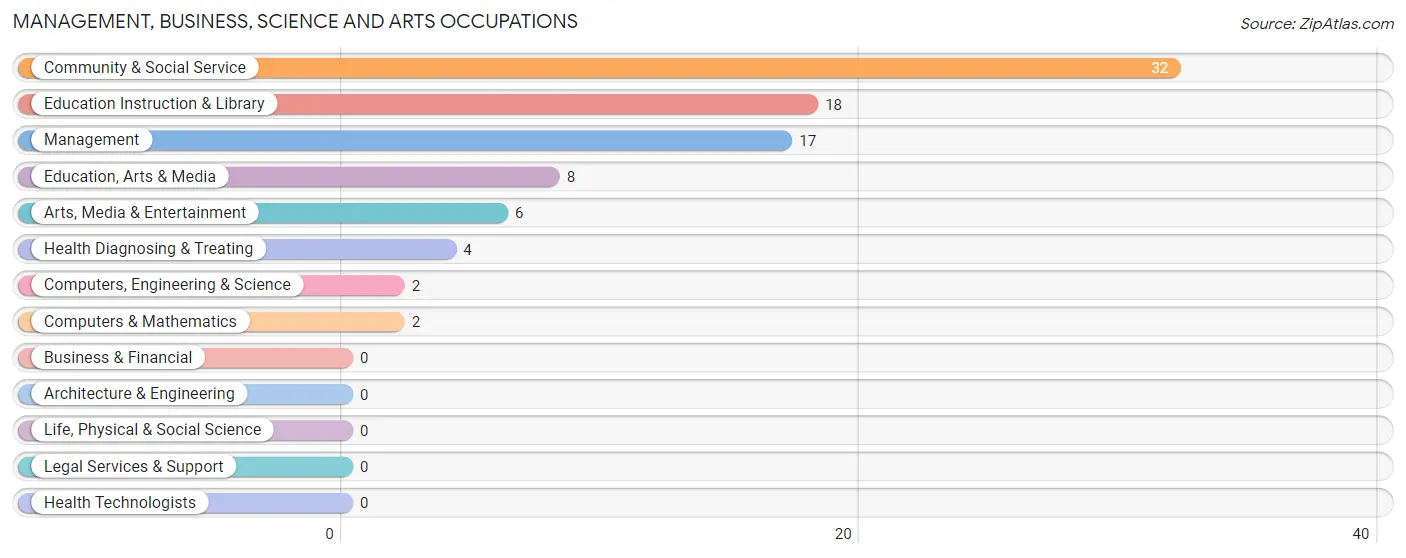
Management, Business, Science and Arts Occupations
The most common Management, Business, Science and Arts occupations in Cuba are Community & Social Service (32 | 14.8%), Education Instruction & Library (18 | 8.3%), Management (17 | 7.9%), Education, Arts & Media (8 | 3.7%), and Arts, Media & Entertainment (6 | 2.8%).
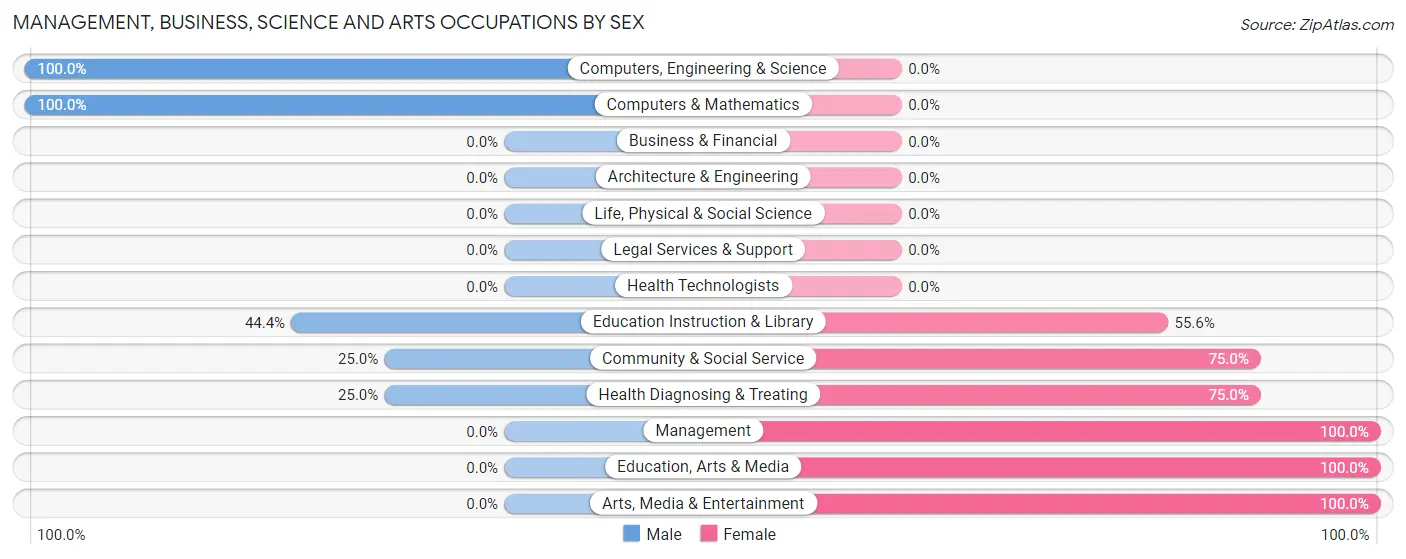
Management, Business, Science and Arts Occupations by Sex
Within the Management, Business, Science and Arts occupations in Cuba, the most male-oriented occupations are Computers, Engineering & Science (100.0%), Computers & Mathematics (100.0%), and Education Instruction & Library (44.4%), while the most female-oriented occupations are Management (100.0%), Education, Arts & Media (100.0%), and Arts, Media & Entertainment (100.0%).
| Occupation | Male | Female |
| Management | 0 (0.0%) | 17 (100.0%) |
| Business & Financial | 0 (0.0%) | 0 (0.0%) |
| Computers, Engineering & Science | 2 (100.0%) | 0 (0.0%) |
| Computers & Mathematics | 2 (100.0%) | 0 (0.0%) |
| Architecture & Engineering | 0 (0.0%) | 0 (0.0%) |
| Life, Physical & Social Science | 0 (0.0%) | 0 (0.0%) |
| Community & Social Service | 8 (25.0%) | 24 (75.0%) |
| Education, Arts & Media | 0 (0.0%) | 8 (100.0%) |
| Legal Services & Support | 0 (0.0%) | 0 (0.0%) |
| Education Instruction & Library | 8 (44.4%) | 10 (55.6%) |
| Arts, Media & Entertainment | 0 (0.0%) | 6 (100.0%) |
| Health Diagnosing & Treating | 1 (25.0%) | 3 (75.0%) |
| Health Technologists | 0 (0.0%) | 0 (0.0%) |
| Total (Category) | 11 (20.0%) | 44 (80.0%) |
| Total (Overall) | 121 (56.0%) | 95 (44.0%) |
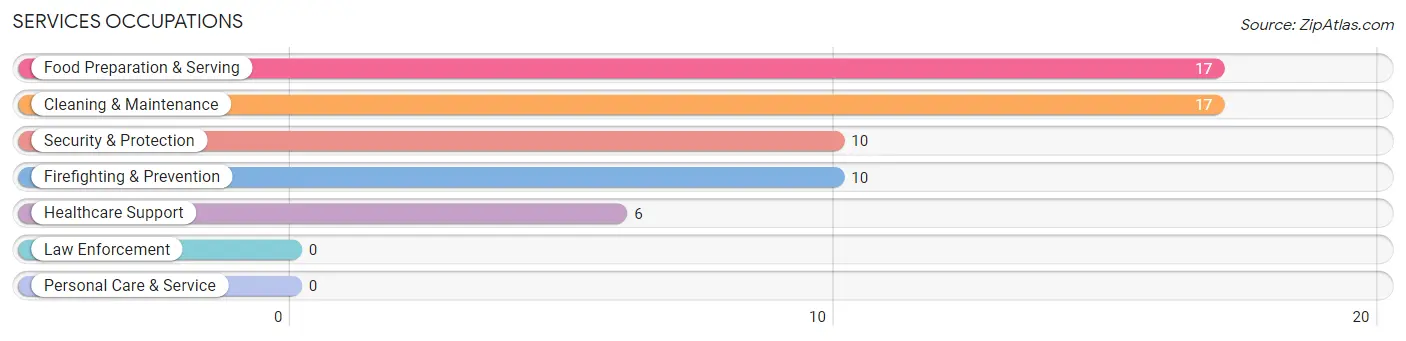
Services Occupations
The most common Services occupations in Cuba are Food Preparation & Serving (17 | 7.9%), Cleaning & Maintenance (17 | 7.9%), Security & Protection (10 | 4.6%), Firefighting & Prevention (10 | 4.6%), and Healthcare Support (6 | 2.8%).
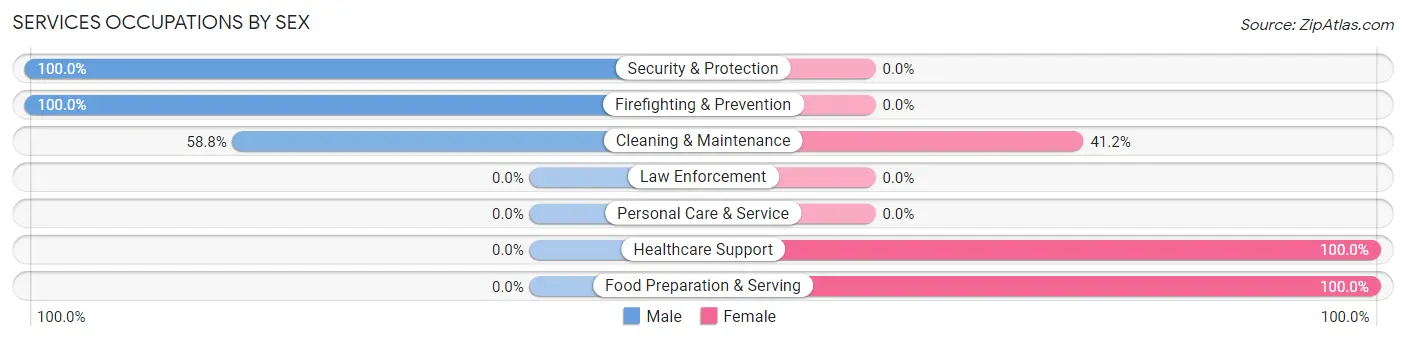
Services Occupations by Sex
Within the Services occupations in Cuba, the most male-oriented occupations are Security & Protection (100.0%), Firefighting & Prevention (100.0%), and Cleaning & Maintenance (58.8%), while the most female-oriented occupations are Healthcare Support (100.0%), Food Preparation & Serving (100.0%), and Cleaning & Maintenance (41.2%).
| Occupation | Male | Female |
| Healthcare Support | 0 (0.0%) | 6 (100.0%) |
| Security & Protection | 10 (100.0%) | 0 (0.0%) |
| Firefighting & Prevention | 10 (100.0%) | 0 (0.0%) |
| Law Enforcement | 0 (0.0%) | 0 (0.0%) |
| Food Preparation & Serving | 0 (0.0%) | 17 (100.0%) |
| Cleaning & Maintenance | 10 (58.8%) | 7 (41.2%) |
| Personal Care & Service | 0 (0.0%) | 0 (0.0%) |
| Total (Category) | 20 (40.0%) | 30 (60.0%) |
| Total (Overall) | 121 (56.0%) | 95 (44.0%) |
Sales and Office Occupations
The most common Sales and Office occupations in Cuba are Office & Administration (28 | 13.0%), and Sales & Related (20 | 9.3%).

Sales and Office Occupations by Sex
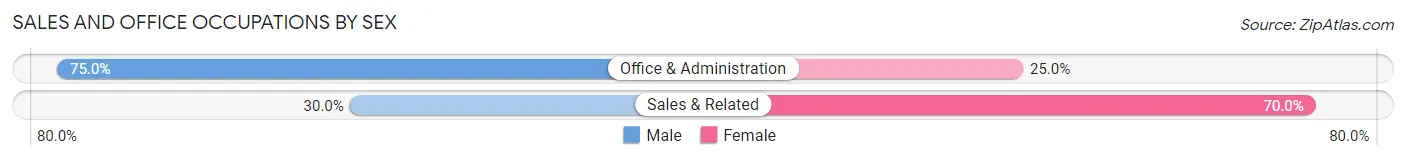
| Occupation | Male | Female |
| Sales & Related | 6 (30.0%) | 14 (70.0%) |
| Office & Administration | 21 (75.0%) | 7 (25.0%) |
| Total (Category) | 27 (56.2%) | 21 (43.8%) |
| Total (Overall) | 121 (56.0%) | 95 (44.0%) |
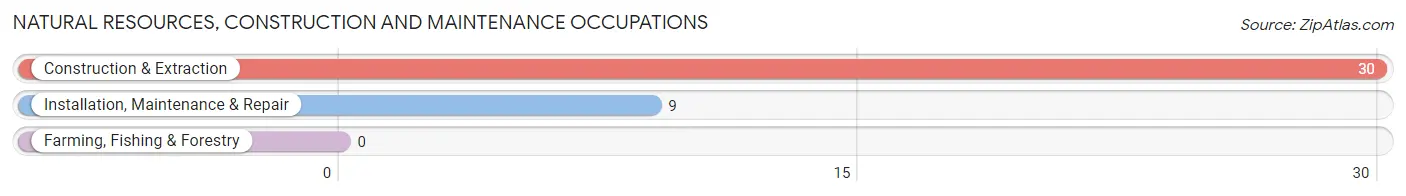
Natural Resources, Construction and Maintenance Occupations
The most common Natural Resources, Construction and Maintenance occupations in Cuba are Construction & Extraction (30 | 13.9%), and Installation, Maintenance & Repair (9 | 4.2%).
Natural Resources, Construction and Maintenance Occupations by Sex
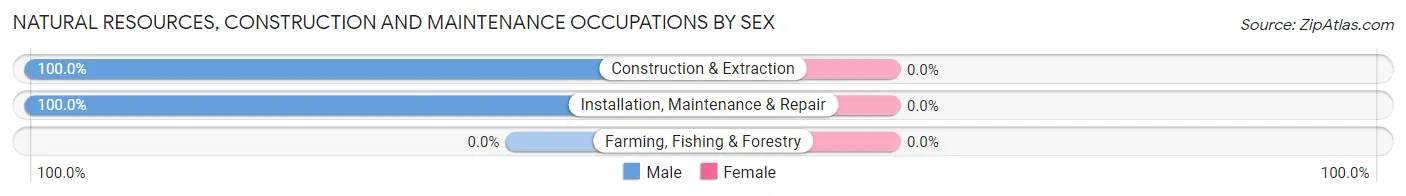
| Occupation | Male | Female |
| Farming, Fishing & Forestry | 0 (0.0%) | 0 (0.0%) |
| Construction & Extraction | 30 (100.0%) | 0 (0.0%) |
| Installation, Maintenance & Repair | 9 (100.0%) | 0 (0.0%) |
| Total (Category) | 39 (100.0%) | 0 (0.0%) |
| Total (Overall) | 121 (56.0%) | 95 (44.0%) |
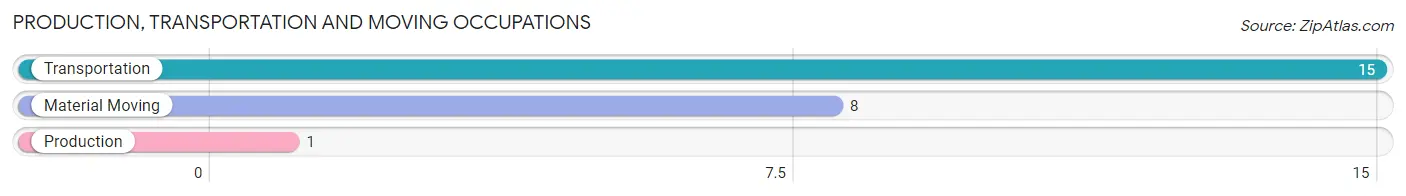
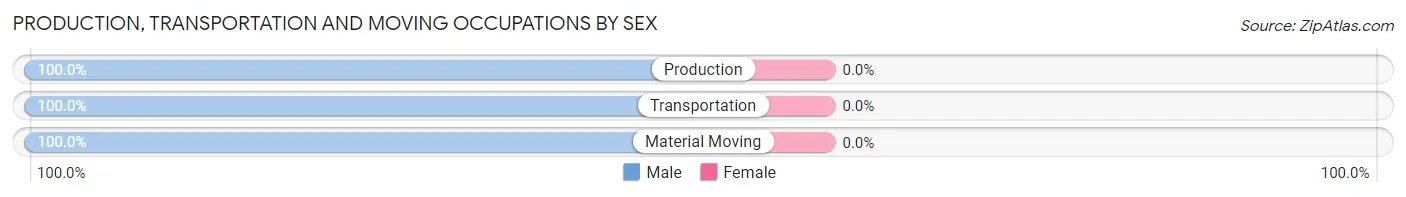
Production, Transportation and Moving Occupations
The most common Production, Transportation and Moving occupations in Cuba are Transportation (15 | 6.9%), Material Moving (8 | 3.7%), and Production (1 | 0.5%).
Production, Transportation and Moving Occupations by Sex
| Occupation | Male | Female |
| Production | 1 (100.0%) | 0 (0.0%) |
| Transportation | 15 (100.0%) | 0 (0.0%) |
| Material Moving | 8 (100.0%) | 0 (0.0%) |
| Total (Category) | 24 (100.0%) | 0 (0.0%) |
| Total (Overall) | 121 (56.0%) | 95 (44.0%) |
Employment Industries by Sex in Cuba
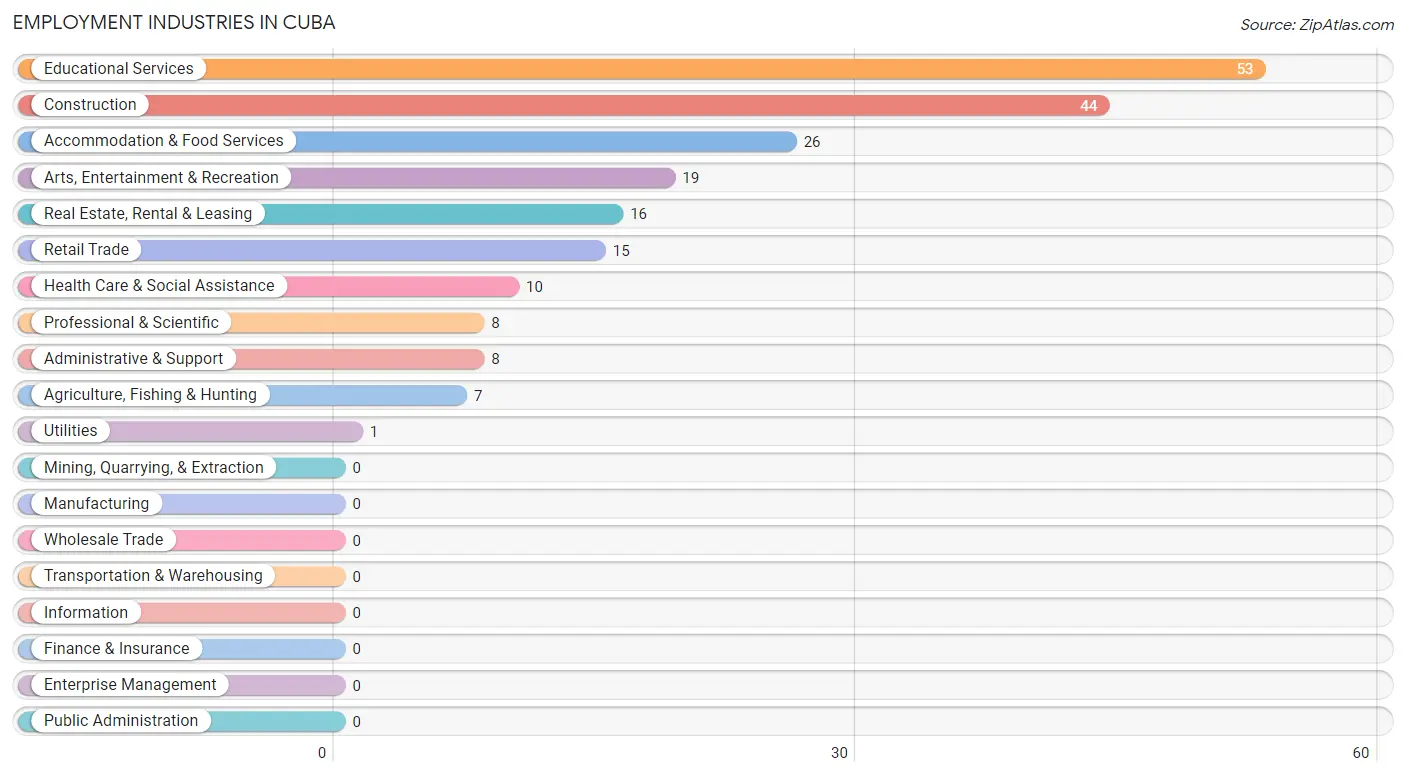
Employment Industries in Cuba
The major employment industries in Cuba include Educational Services (53 | 24.5%), Construction (44 | 20.4%), Accommodation & Food Services (26 | 12.0%), Arts, Entertainment & Recreation (19 | 8.8%), and Real Estate, Rental & Leasing (16 | 7.4%).
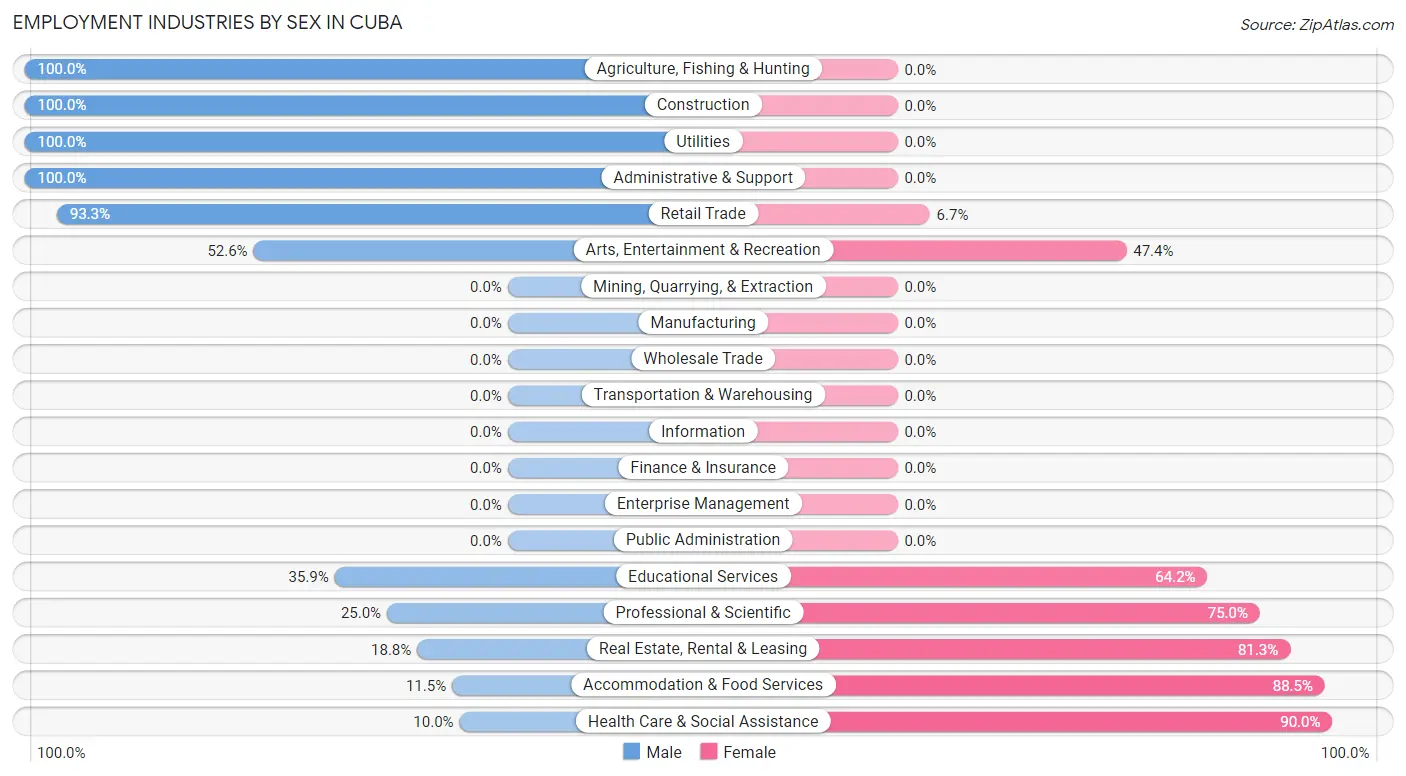
Employment Industries by Sex in Cuba
The Cuba industries that see more men than women are Agriculture, Fishing & Hunting (100.0%), Construction (100.0%), and Utilities (100.0%), whereas the industries that tend to have a higher number of women are Health Care & Social Assistance (90.0%), Accommodation & Food Services (88.5%), and Real Estate, Rental & Leasing (81.2%).
| Industry | Male | Female |
| Agriculture, Fishing & Hunting | 7 (100.0%) | 0 (0.0%) |
| Mining, Quarrying, & Extraction | 0 (0.0%) | 0 (0.0%) |
| Construction | 44 (100.0%) | 0 (0.0%) |
| Manufacturing | 0 (0.0%) | 0 (0.0%) |
| Wholesale Trade | 0 (0.0%) | 0 (0.0%) |
| Retail Trade | 14 (93.3%) | 1 (6.7%) |
| Transportation & Warehousing | 0 (0.0%) | 0 (0.0%) |
| Utilities | 1 (100.0%) | 0 (0.0%) |
| Information | 0 (0.0%) | 0 (0.0%) |
| Finance & Insurance | 0 (0.0%) | 0 (0.0%) |
| Real Estate, Rental & Leasing | 3 (18.8%) | 13 (81.2%) |
| Professional & Scientific | 2 (25.0%) | 6 (75.0%) |
| Enterprise Management | 0 (0.0%) | 0 (0.0%) |
| Administrative & Support | 8 (100.0%) | 0 (0.0%) |
| Educational Services | 19 (35.8%) | 34 (64.1%) |
| Health Care & Social Assistance | 1 (10.0%) | 9 (90.0%) |
| Arts, Entertainment & Recreation | 10 (52.6%) | 9 (47.4%) |
| Accommodation & Food Services | 3 (11.5%) | 23 (88.5%) |
| Public Administration | 0 (0.0%) | 0 (0.0%) |
| Total | 121 (56.0%) | 95 (44.0%) |
Education in Cuba
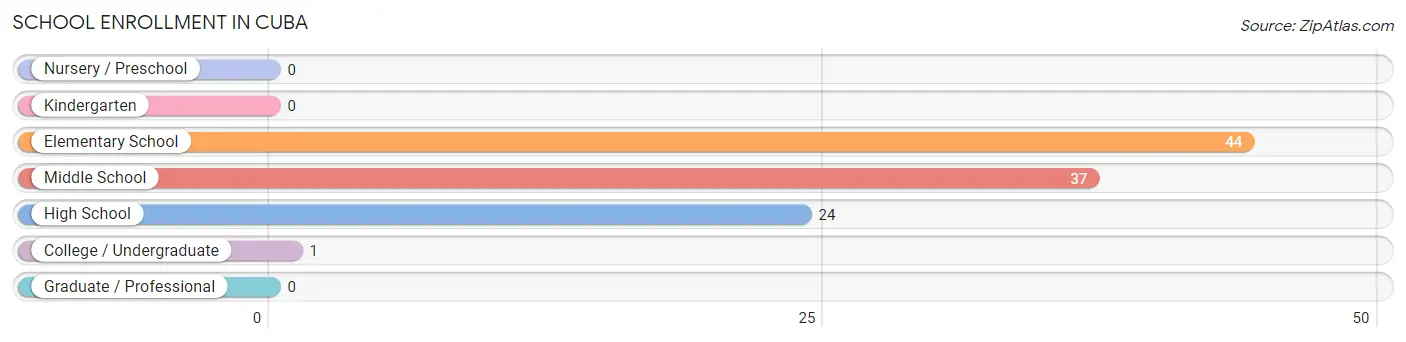
School Enrollment in Cuba
The most common levels of schooling among the 106 students in Cuba are elementary school (44 | 41.5%), middle school (37 | 34.9%), and high school (24 | 22.6%).
| School Level | # Students | % Students |
| Nursery / Preschool | 0 | 0.0% |
| Kindergarten | 0 | 0.0% |
| Elementary School | 44 | 41.5% |
| Middle School | 37 | 34.9% |
| High School | 24 | 22.6% |
| College / Undergraduate | 1 | 0.9% |
| Graduate / Professional | 0 | 0.0% |
| Total | 106 | 100.0% |
School Enrollment by Age by Funding Source in Cuba
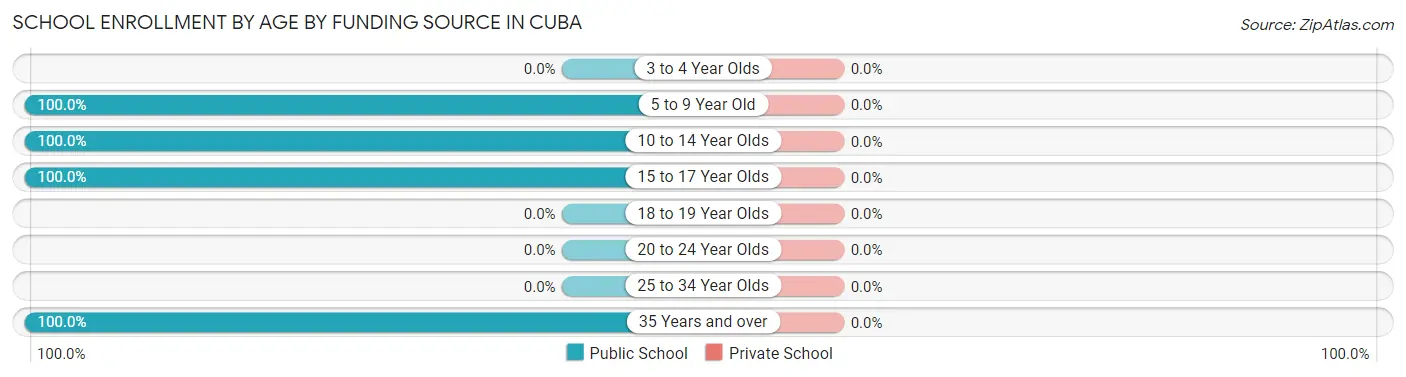
| Age Bracket | Public School | Private School |
| 3 to 4 Year Olds | 0 (0.0%) | 0 (0.0%) |
| 5 to 9 Year Old | 44 (100.0%) | 0 (0.0%) |
| 10 to 14 Year Olds | 37 (100.0%) | 0 (0.0%) |
| 15 to 17 Year Olds | 24 (100.0%) | 0 (0.0%) |
| 18 to 19 Year Olds | 0 (0.0%) | 0 (0.0%) |
| 20 to 24 Year Olds | 0 (0.0%) | 0 (0.0%) |
| 25 to 34 Year Olds | 0 (0.0%) | 0 (0.0%) |
| 35 Years and over | 1 (100.0%) | 0 (0.0%) |
| Total | 106 (100.0%) | 0 (0.0%) |
Educational Attainment by Field of Study in Cuba
Education (30 | 66.7%), arts & humanities (8 | 17.8%), physical & health sciences (6 | 13.3%), and liberal arts & history (1 | 2.2%) are the most common fields of study among 45 individuals in Cuba who have obtained a bachelor's degree or higher.
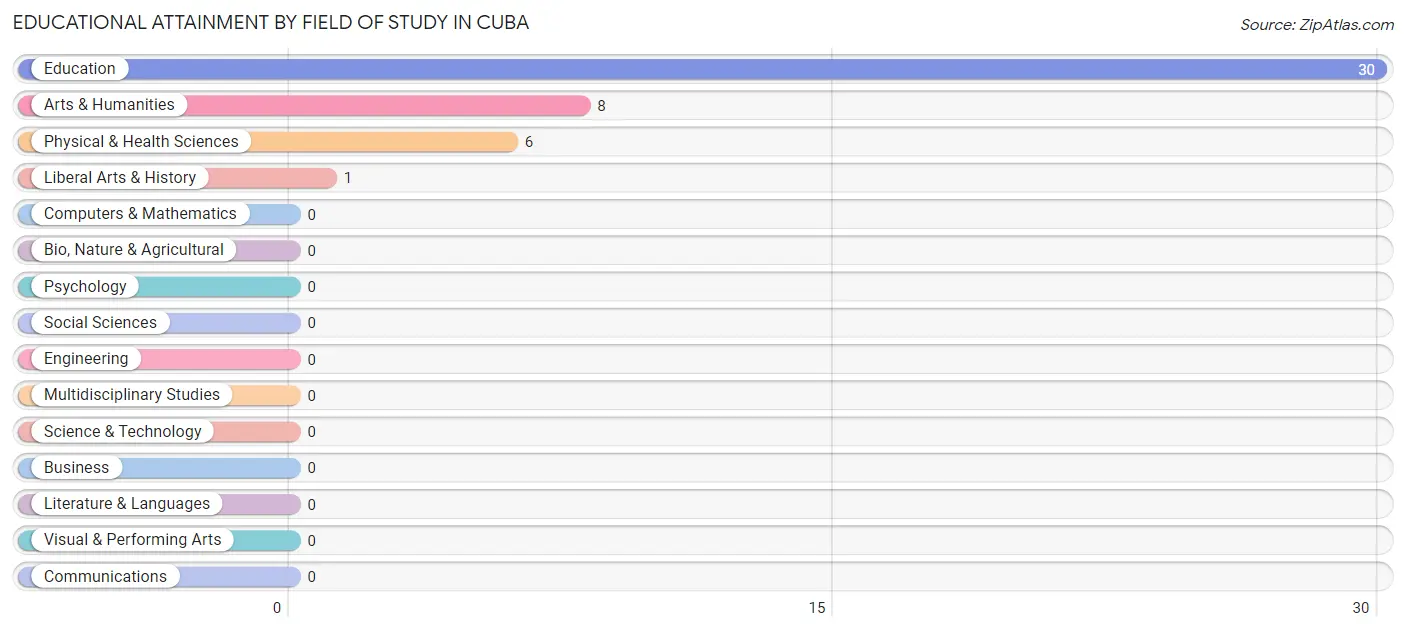
| Field of Study | # Graduates | % Graduates |
| Computers & Mathematics | 0 | 0.0% |
| Bio, Nature & Agricultural | 0 | 0.0% |
| Physical & Health Sciences | 6 | 13.3% |
| Psychology | 0 | 0.0% |
| Social Sciences | 0 | 0.0% |
| Engineering | 0 | 0.0% |
| Multidisciplinary Studies | 0 | 0.0% |
| Science & Technology | 0 | 0.0% |
| Business | 0 | 0.0% |
| Education | 30 | 66.7% |
| Literature & Languages | 0 | 0.0% |
| Liberal Arts & History | 1 | 2.2% |
| Visual & Performing Arts | 0 | 0.0% |
| Communications | 0 | 0.0% |
| Arts & Humanities | 8 | 17.8% |
| Total | 45 | 100.0% |
Transportation & Commute in Cuba
Vehicle Availability by Sex in Cuba
The most prevalent vehicle ownership categories in Cuba are males with 2 vehicles (74, accounting for 61.2%) and females with 2 vehicles (28, making up 77.9%).
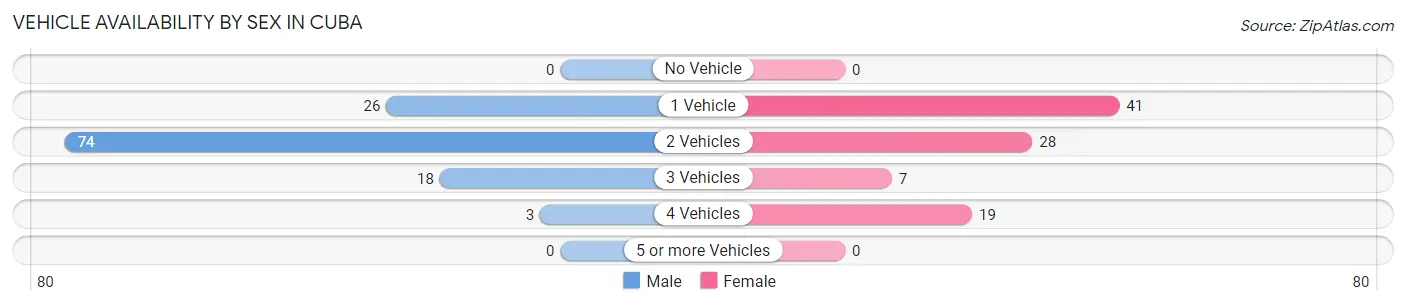
| Vehicles Available | Male | Female |
| No Vehicle | 0 (0.0%) | 0 (0.0%) |
| 1 Vehicle | 26 (21.5%) | 41 (43.2%) |
| 2 Vehicles | 74 (61.2%) | 28 (29.5%) |
| 3 Vehicles | 18 (14.9%) | 7 (7.4%) |
| 4 Vehicles | 3 (2.5%) | 19 (20.0%) |
| 5 or more Vehicles | 0 (0.0%) | 0 (0.0%) |
| Total | 121 (100.0%) | 95 (100.0%) |
Commute Time in Cuba
The most frequently occuring commute durations in Cuba are 15 to 19 minutes (56 commuters, 29.2%), 10 to 14 minutes (26 commuters, 13.5%), and less than 5 minutes (22 commuters, 11.5%).
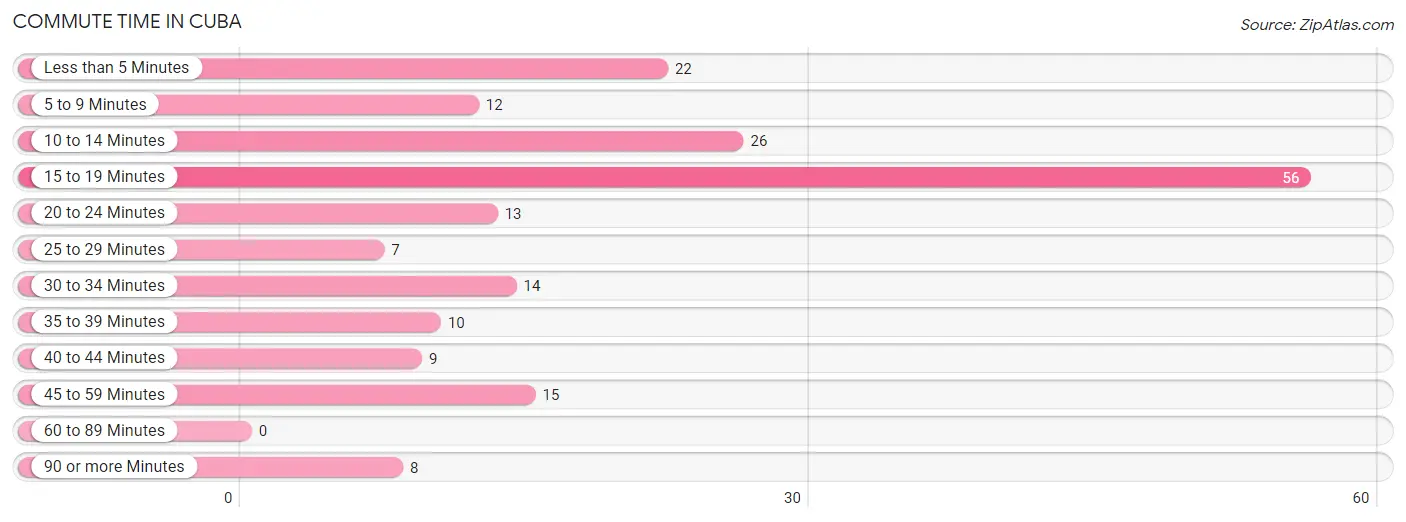
| Commute Time | # Commuters | % Commuters |
| Less than 5 Minutes | 22 | 11.5% |
| 5 to 9 Minutes | 12 | 6.2% |
| 10 to 14 Minutes | 26 | 13.5% |
| 15 to 19 Minutes | 56 | 29.2% |
| 20 to 24 Minutes | 13 | 6.8% |
| 25 to 29 Minutes | 7 | 3.6% |
| 30 to 34 Minutes | 14 | 7.3% |
| 35 to 39 Minutes | 10 | 5.2% |
| 40 to 44 Minutes | 9 | 4.7% |
| 45 to 59 Minutes | 15 | 7.8% |
| 60 to 89 Minutes | 0 | 0.0% |
| 90 or more Minutes | 8 | 4.2% |
Commute Time by Sex in Cuba
The most common commute times in Cuba are 15 to 19 minutes (46 commuters, 38.7%) for males and 20 to 24 minutes (13 commuters, 17.8%) for females.
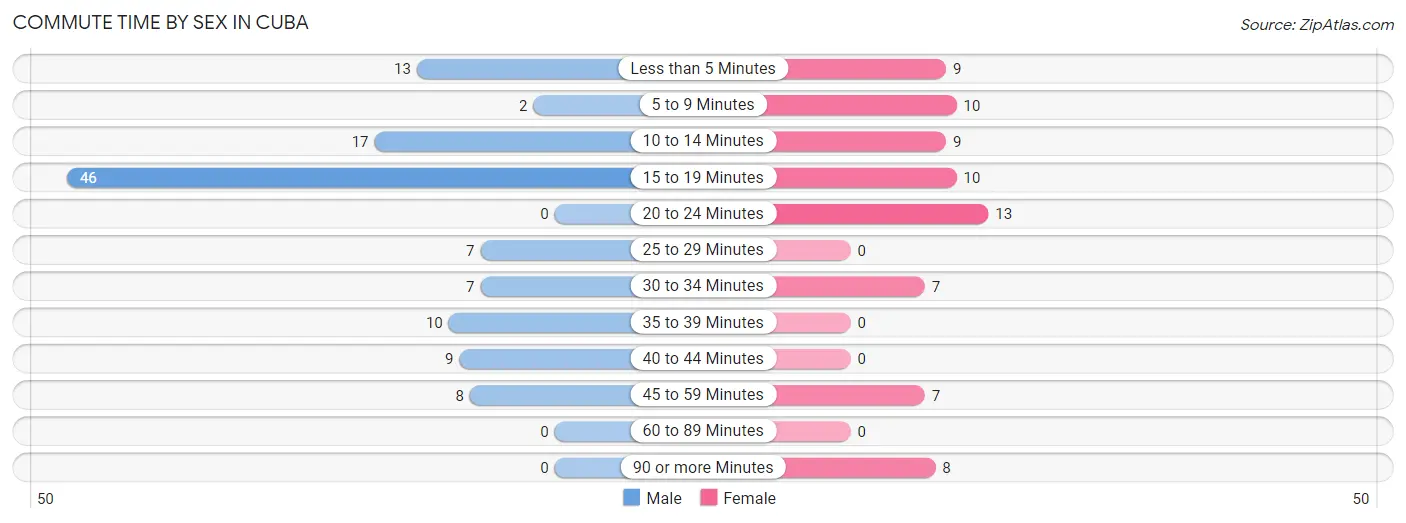
| Commute Time | Male | Female |
| Less than 5 Minutes | 13 (10.9%) | 9 (12.3%) |
| 5 to 9 Minutes | 2 (1.7%) | 10 (13.7%) |
| 10 to 14 Minutes | 17 (14.3%) | 9 (12.3%) |
| 15 to 19 Minutes | 46 (38.7%) | 10 (13.7%) |
| 20 to 24 Minutes | 0 (0.0%) | 13 (17.8%) |
| 25 to 29 Minutes | 7 (5.9%) | 0 (0.0%) |
| 30 to 34 Minutes | 7 (5.9%) | 7 (9.6%) |
| 35 to 39 Minutes | 10 (8.4%) | 0 (0.0%) |
| 40 to 44 Minutes | 9 (7.6%) | 0 (0.0%) |
| 45 to 59 Minutes | 8 (6.7%) | 7 (9.6%) |
| 60 to 89 Minutes | 0 (0.0%) | 0 (0.0%) |
| 90 or more Minutes | 0 (0.0%) | 8 (11.0%) |
Time of Departure to Work by Sex in Cuba
The most frequent times of departure to work in Cuba are 7:00 AM to 7:29 AM (38, 31.9%) for males and 7:00 AM to 7:29 AM (15, 20.5%) for females.
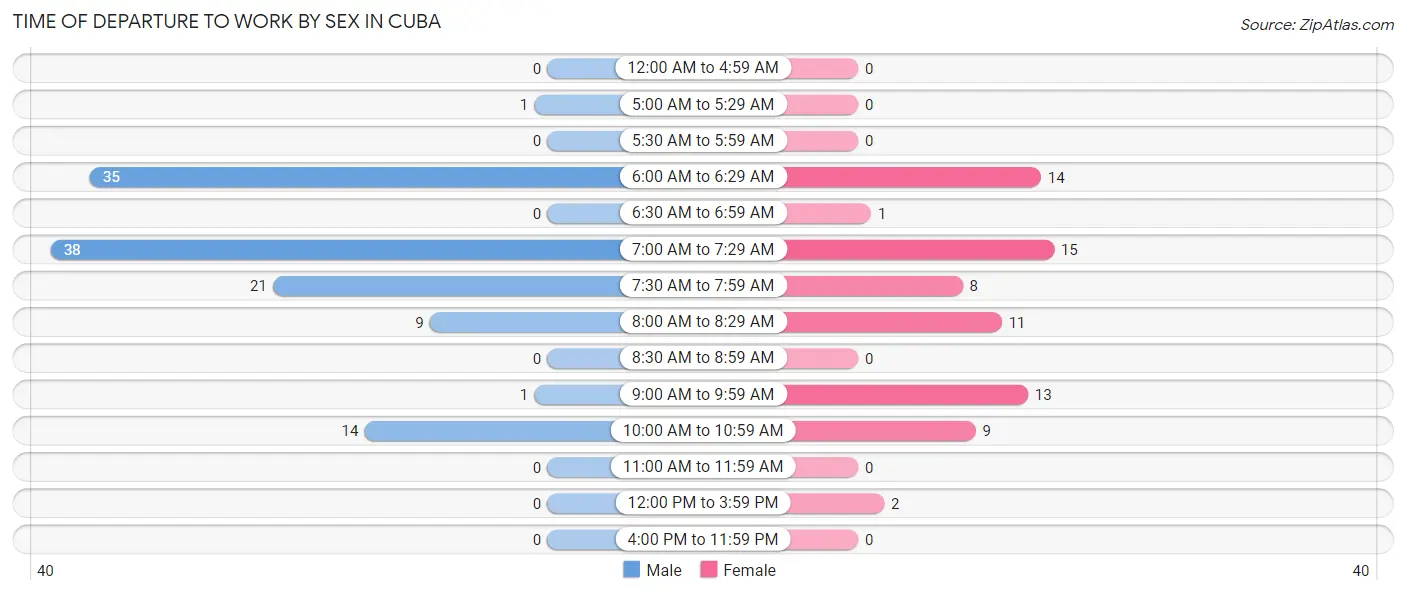
| Time of Departure | Male | Female |
| 12:00 AM to 4:59 AM | 0 (0.0%) | 0 (0.0%) |
| 5:00 AM to 5:29 AM | 1 (0.8%) | 0 (0.0%) |
| 5:30 AM to 5:59 AM | 0 (0.0%) | 0 (0.0%) |
| 6:00 AM to 6:29 AM | 35 (29.4%) | 14 (19.2%) |
| 6:30 AM to 6:59 AM | 0 (0.0%) | 1 (1.4%) |
| 7:00 AM to 7:29 AM | 38 (31.9%) | 15 (20.5%) |
| 7:30 AM to 7:59 AM | 21 (17.6%) | 8 (11.0%) |
| 8:00 AM to 8:29 AM | 9 (7.6%) | 11 (15.1%) |
| 8:30 AM to 8:59 AM | 0 (0.0%) | 0 (0.0%) |
| 9:00 AM to 9:59 AM | 1 (0.8%) | 13 (17.8%) |
| 10:00 AM to 10:59 AM | 14 (11.8%) | 9 (12.3%) |
| 11:00 AM to 11:59 AM | 0 (0.0%) | 0 (0.0%) |
| 12:00 PM to 3:59 PM | 0 (0.0%) | 2 (2.7%) |
| 4:00 PM to 11:59 PM | 0 (0.0%) | 0 (0.0%) |
| Total | 119 (100.0%) | 73 (100.0%) |
Housing Occupancy in Cuba
Occupancy by Ownership in Cuba
Of the total 214 dwellings in Cuba, owner-occupied units account for 138 (64.5%), while renter-occupied units make up 76 (35.5%).
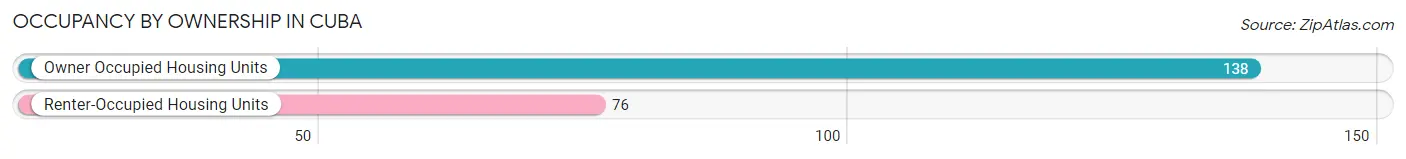
| Occupancy | # Housing Units | % Housing Units |
| Owner Occupied Housing Units | 138 | 64.5% |
| Renter-Occupied Housing Units | 76 | 35.5% |
| Total Occupied Housing Units | 214 | 100.0% |
Occupancy by Household Size in Cuba
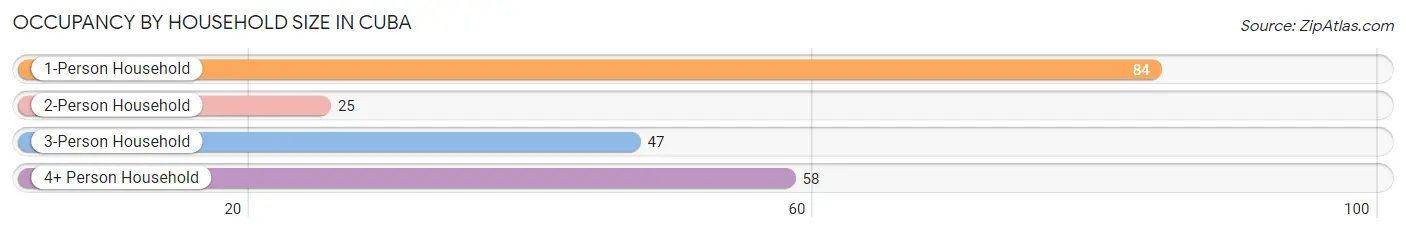
| Household Size | # Housing Units | % Housing Units |
| 1-Person Household | 84 | 39.3% |
| 2-Person Household | 25 | 11.7% |
| 3-Person Household | 47 | 22.0% |
| 4+ Person Household | 58 | 27.1% |
| Total Housing Units | 214 | 100.0% |
Occupancy by Ownership by Household Size in Cuba
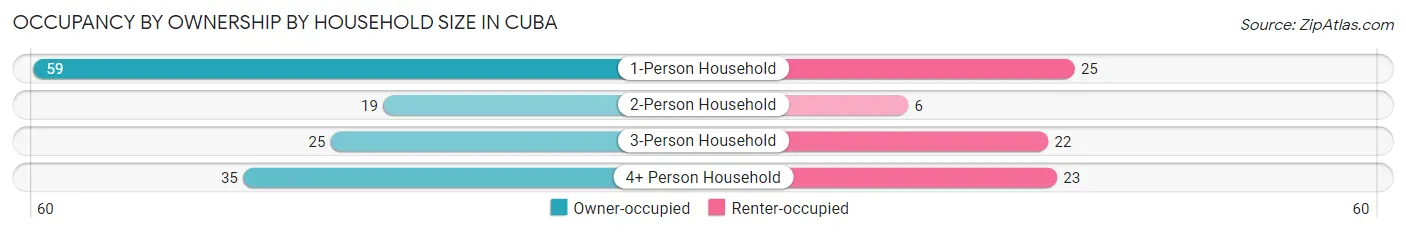
| Household Size | Owner-occupied | Renter-occupied |
| 1-Person Household | 59 (70.2%) | 25 (29.8%) |
| 2-Person Household | 19 (76.0%) | 6 (24.0%) |
| 3-Person Household | 25 (53.2%) | 22 (46.8%) |
| 4+ Person Household | 35 (60.3%) | 23 (39.7%) |
| Total Housing Units | 138 (64.5%) | 76 (35.5%) |
Occupancy by Educational Attainment in Cuba
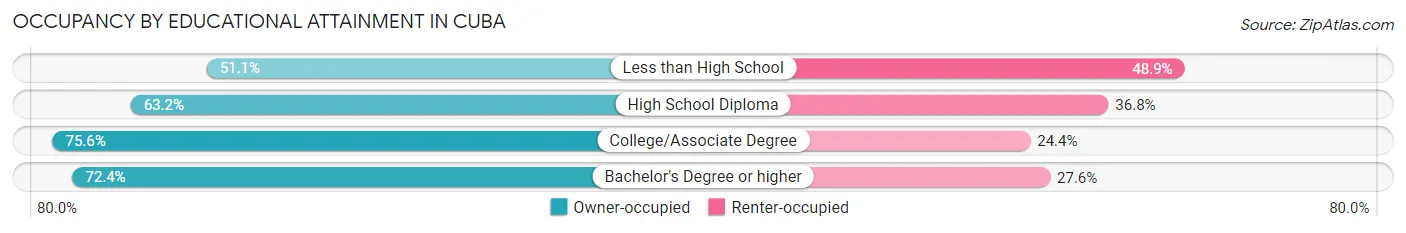
| Household Size | Owner-occupied | Renter-occupied |
| Less than High School | 23 (51.1%) | 22 (48.9%) |
| High School Diploma | 60 (63.2%) | 35 (36.8%) |
| College/Associate Degree | 34 (75.6%) | 11 (24.4%) |
| Bachelor's Degree or higher | 21 (72.4%) | 8 (27.6%) |
Occupancy by Age of Householder in Cuba
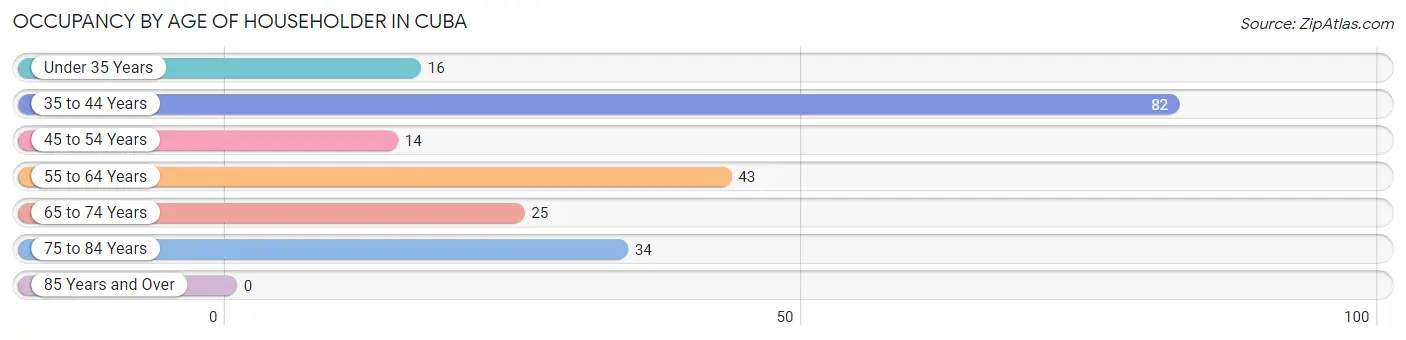
| Age Bracket | # Households | % Households |
| Under 35 Years | 16 | 7.5% |
| 35 to 44 Years | 82 | 38.3% |
| 45 to 54 Years | 14 | 6.5% |
| 55 to 64 Years | 43 | 20.1% |
| 65 to 74 Years | 25 | 11.7% |
| 75 to 84 Years | 34 | 15.9% |
| 85 Years and Over | 0 | 0.0% |
| Total | 214 | 100.0% |
Housing Finances in Cuba
Median Income by Occupancy in Cuba
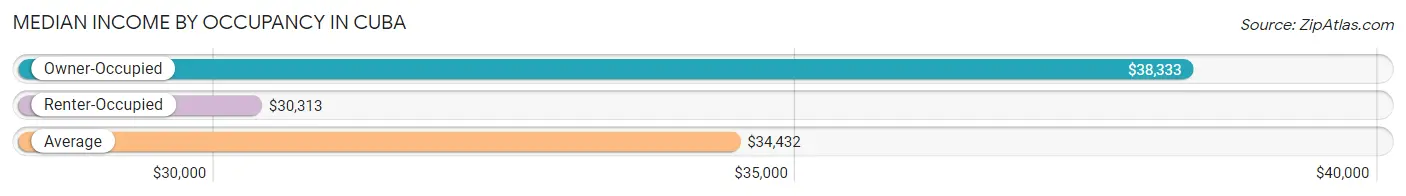
| Occupancy Type | # Households | Median Income |
| Owner-Occupied | 138 (64.5%) | $38,333 |
| Renter-Occupied | 76 (35.5%) | $30,313 |
| Average | 214 (100.0%) | $34,432 |
Occupancy by Householder Income Bracket in Cuba
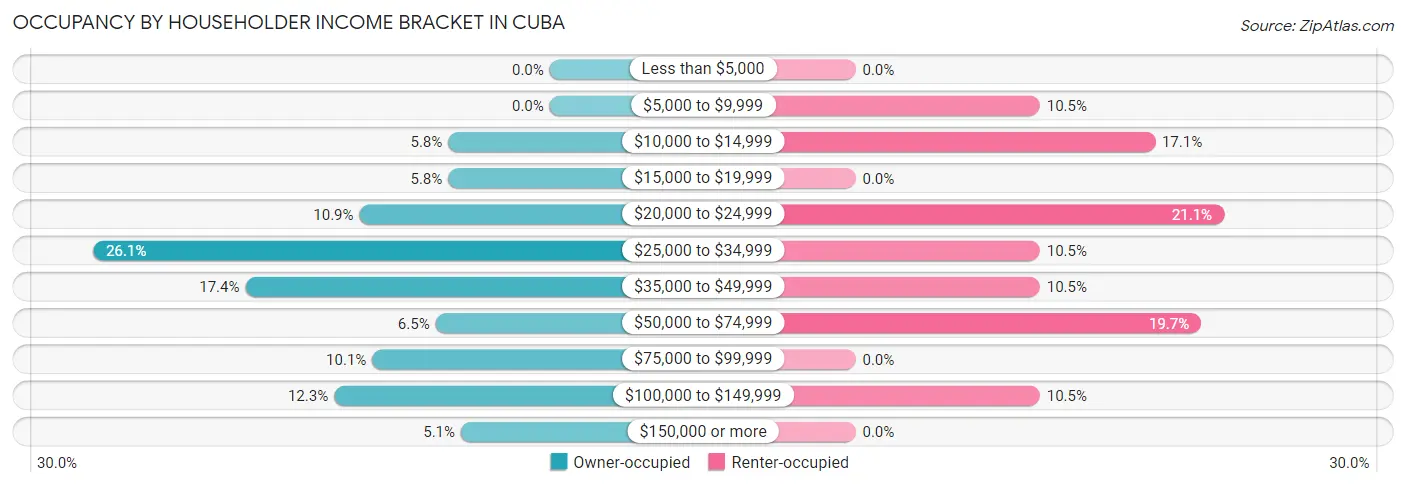
| Income Bracket | Owner-occupied | Renter-occupied |
| Less than $5,000 | 0 (0.0%) | 0 (0.0%) |
| $5,000 to $9,999 | 0 (0.0%) | 8 (10.5%) |
| $10,000 to $14,999 | 8 (5.8%) | 13 (17.1%) |
| $15,000 to $19,999 | 8 (5.8%) | 0 (0.0%) |
| $20,000 to $24,999 | 15 (10.9%) | 16 (21.0%) |
| $25,000 to $34,999 | 36 (26.1%) | 8 (10.5%) |
| $35,000 to $49,999 | 24 (17.4%) | 8 (10.5%) |
| $50,000 to $74,999 | 9 (6.5%) | 15 (19.7%) |
| $75,000 to $99,999 | 14 (10.1%) | 0 (0.0%) |
| $100,000 to $149,999 | 17 (12.3%) | 8 (10.5%) |
| $150,000 or more | 7 (5.1%) | 0 (0.0%) |
| Total | 138 (100.0%) | 76 (100.0%) |
Monthly Housing Cost Tiers in Cuba
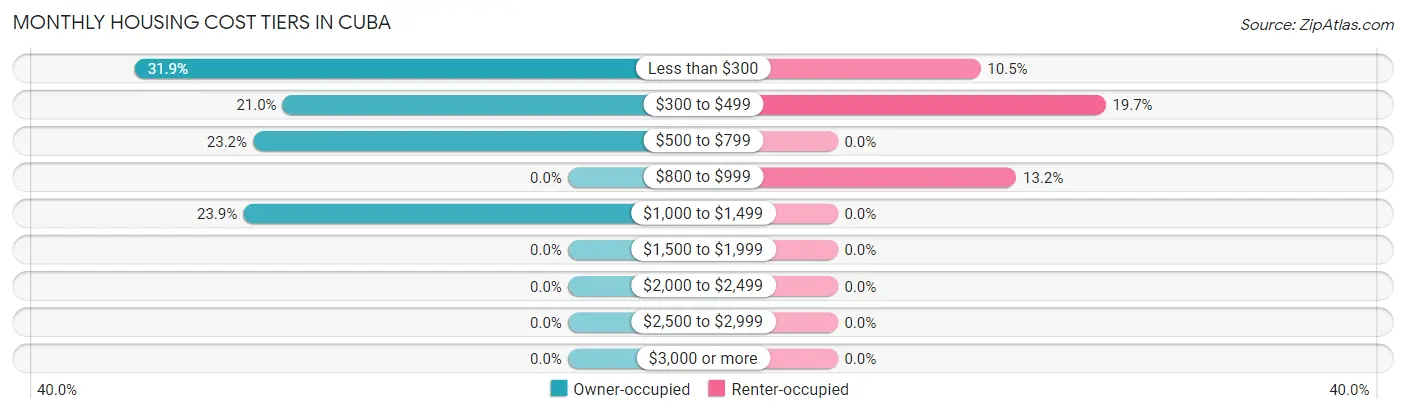
| Monthly Cost | Owner-occupied | Renter-occupied |
| Less than $300 | 44 (31.9%) | 8 (10.5%) |
| $300 to $499 | 29 (21.0%) | 15 (19.7%) |
| $500 to $799 | 32 (23.2%) | 0 (0.0%) |
| $800 to $999 | 0 (0.0%) | 10 (13.2%) |
| $1,000 to $1,499 | 33 (23.9%) | 0 (0.0%) |
| $1,500 to $1,999 | 0 (0.0%) | 0 (0.0%) |
| $2,000 to $2,499 | 0 (0.0%) | 0 (0.0%) |
| $2,500 to $2,999 | 0 (0.0%) | 0 (0.0%) |
| $3,000 or more | 0 (0.0%) | 0 (0.0%) |
| Total | 138 (100.0%) | 76 (100.0%) |
Physical Housing Characteristics in Cuba
Housing Structures in Cuba
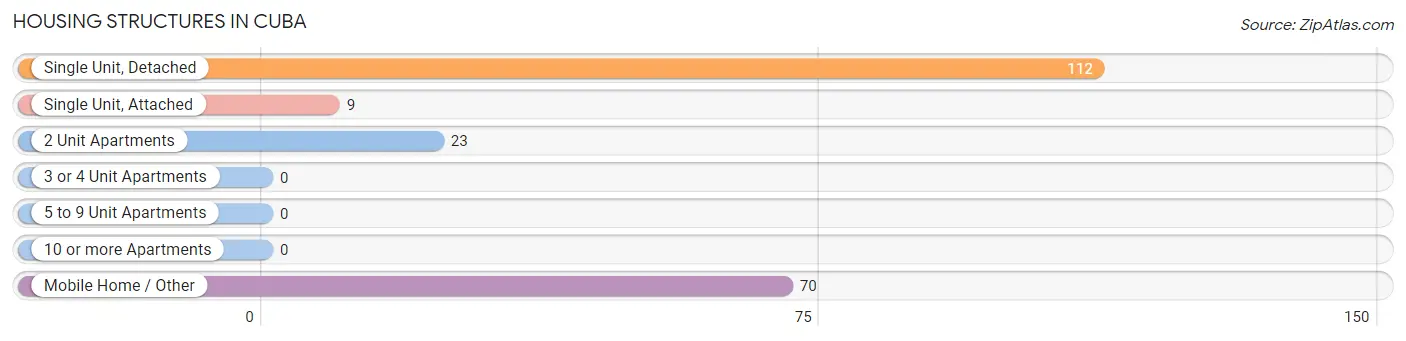
| Structure Type | # Housing Units | % Housing Units |
| Single Unit, Detached | 112 | 52.3% |
| Single Unit, Attached | 9 | 4.2% |
| 2 Unit Apartments | 23 | 10.7% |
| 3 or 4 Unit Apartments | 0 | 0.0% |
| 5 to 9 Unit Apartments | 0 | 0.0% |
| 10 or more Apartments | 0 | 0.0% |
| Mobile Home / Other | 70 | 32.7% |
| Total | 214 | 100.0% |
Housing Structures by Occupancy in Cuba
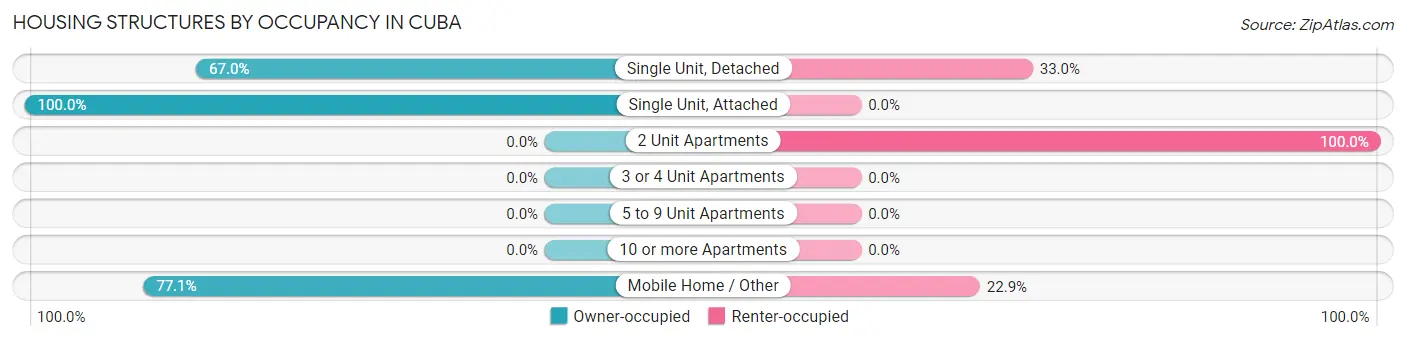
| Structure Type | Owner-occupied | Renter-occupied |
| Single Unit, Detached | 75 (67.0%) | 37 (33.0%) |
| Single Unit, Attached | 9 (100.0%) | 0 (0.0%) |
| 2 Unit Apartments | 0 (0.0%) | 23 (100.0%) |
| 3 or 4 Unit Apartments | 0 (0.0%) | 0 (0.0%) |
| 5 to 9 Unit Apartments | 0 (0.0%) | 0 (0.0%) |
| 10 or more Apartments | 0 (0.0%) | 0 (0.0%) |
| Mobile Home / Other | 54 (77.1%) | 16 (22.9%) |
| Total | 138 (64.5%) | 76 (35.5%) |
Housing Structures by Number of Rooms in Cuba
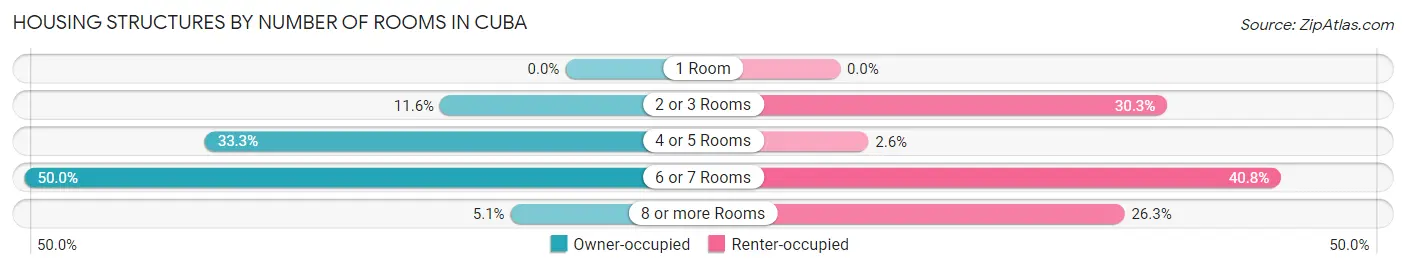
| Number of Rooms | Owner-occupied | Renter-occupied |
| 1 Room | 0 (0.0%) | 0 (0.0%) |
| 2 or 3 Rooms | 16 (11.6%) | 23 (30.3%) |
| 4 or 5 Rooms | 46 (33.3%) | 2 (2.6%) |
| 6 or 7 Rooms | 69 (50.0%) | 31 (40.8%) |
| 8 or more Rooms | 7 (5.1%) | 20 (26.3%) |
| Total | 138 (100.0%) | 76 (100.0%) |
Housing Structure by Heating Type in Cuba
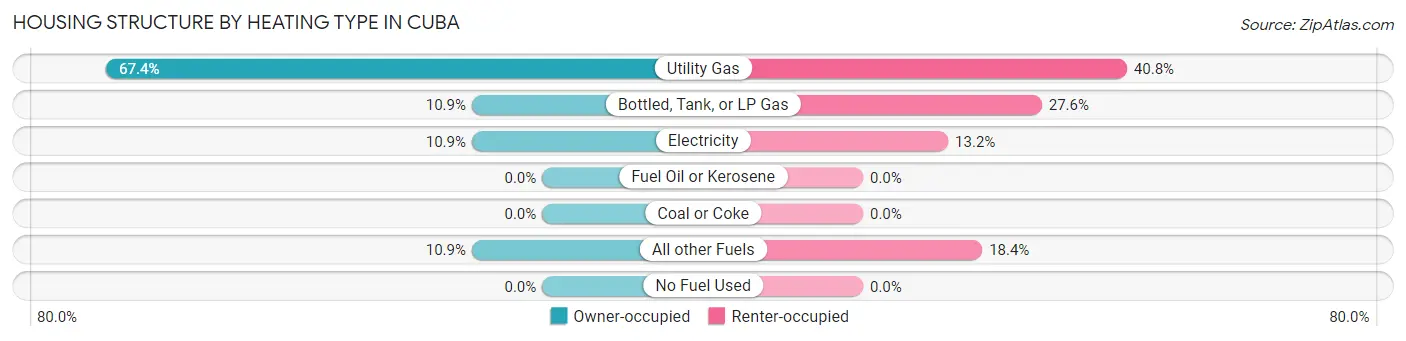
| Heating Type | Owner-occupied | Renter-occupied |
| Utility Gas | 93 (67.4%) | 31 (40.8%) |
| Bottled, Tank, or LP Gas | 15 (10.9%) | 21 (27.6%) |
| Electricity | 15 (10.9%) | 10 (13.2%) |
| Fuel Oil or Kerosene | 0 (0.0%) | 0 (0.0%) |
| Coal or Coke | 0 (0.0%) | 0 (0.0%) |
| All other Fuels | 15 (10.9%) | 14 (18.4%) |
| No Fuel Used | 0 (0.0%) | 0 (0.0%) |
| Total | 138 (100.0%) | 76 (100.0%) |
Household Vehicle Usage in Cuba
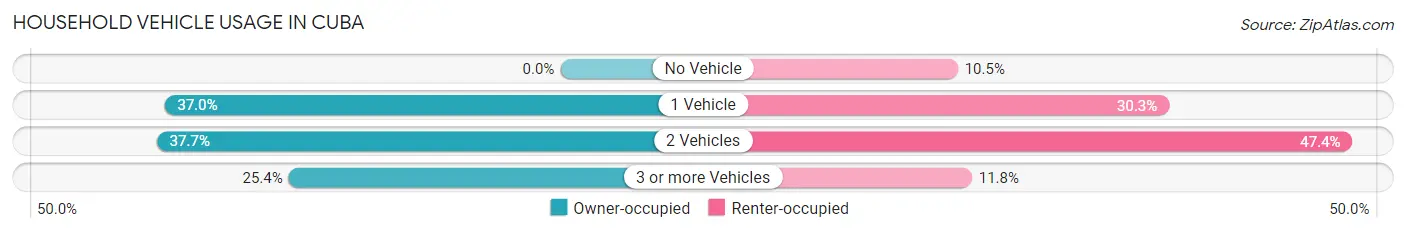
| Vehicles per Household | Owner-occupied | Renter-occupied |
| No Vehicle | 0 (0.0%) | 8 (10.5%) |
| 1 Vehicle | 51 (37.0%) | 23 (30.3%) |
| 2 Vehicles | 52 (37.7%) | 36 (47.4%) |
| 3 or more Vehicles | 35 (25.4%) | 9 (11.8%) |
| Total | 138 (100.0%) | 76 (100.0%) |
Real Estate & Mortgages in Cuba
Real Estate and Mortgage Overview in Cuba
| Characteristic | Without Mortgage | With Mortgage |
| Housing Units | 97 | 41 |
| Median Property Value | $135,900 | $207,300 |
| Median Household Income | $38,958 | $0 |
| Monthly Housing Costs | $360 | $0 |
| Real Estate Taxes | - | - |
Property Value by Mortgage Status in Cuba
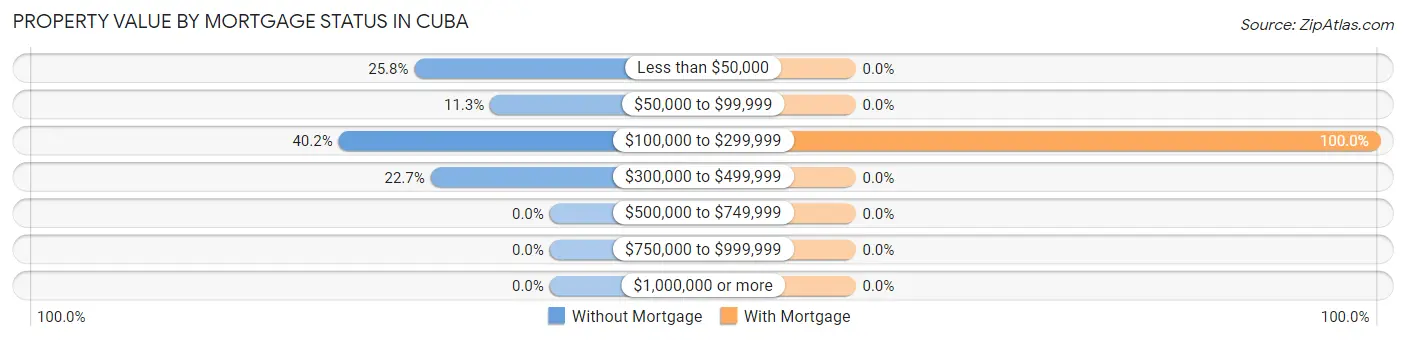
| Property Value | Without Mortgage | With Mortgage |
| Less than $50,000 | 25 (25.8%) | 0 (0.0%) |
| $50,000 to $99,999 | 11 (11.3%) | 0 (0.0%) |
| $100,000 to $299,999 | 39 (40.2%) | 41 (100.0%) |
| $300,000 to $499,999 | 22 (22.7%) | 0 (0.0%) |
| $500,000 to $749,999 | 0 (0.0%) | 0 (0.0%) |
| $750,000 to $999,999 | 0 (0.0%) | 0 (0.0%) |
| $1,000,000 or more | 0 (0.0%) | 0 (0.0%) |
| Total | 97 (100.0%) | 41 (100.0%) |
Household Income by Mortgage Status in Cuba
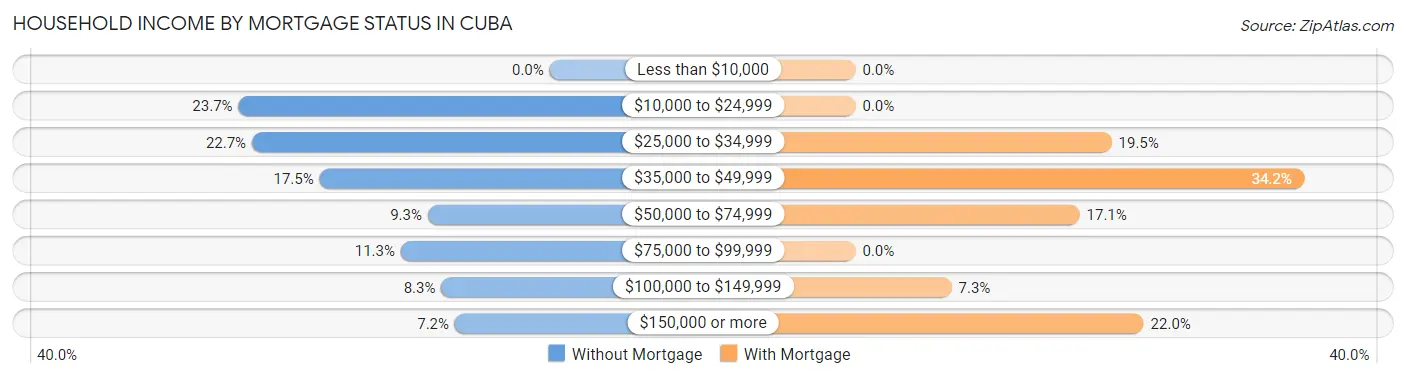
| Household Income | Without Mortgage | With Mortgage |
| Less than $10,000 | 0 (0.0%) | 0 (0.0%) |
| $10,000 to $24,999 | 23 (23.7%) | 0 (0.0%) |
| $25,000 to $34,999 | 22 (22.7%) | 8 (19.5%) |
| $35,000 to $49,999 | 17 (17.5%) | 14 (34.2%) |
| $50,000 to $74,999 | 9 (9.3%) | 7 (17.1%) |
| $75,000 to $99,999 | 11 (11.3%) | 0 (0.0%) |
| $100,000 to $149,999 | 8 (8.3%) | 3 (7.3%) |
| $150,000 or more | 7 (7.2%) | 9 (22.0%) |
| Total | 97 (100.0%) | 41 (100.0%) |
Property Value to Household Income Ratio in Cuba
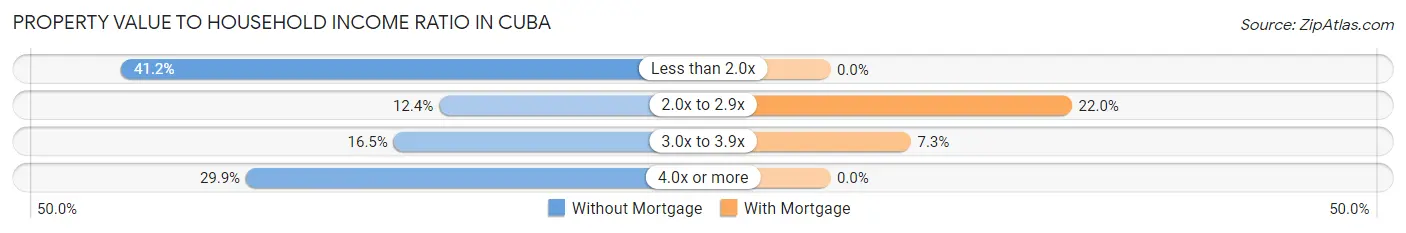
| Value-to-Income Ratio | Without Mortgage | With Mortgage |
| Less than 2.0x | 40 (41.2%) | 0 (0.0%) |
| 2.0x to 2.9x | 12 (12.4%) | 9 (22.0%) |
| 3.0x to 3.9x | 16 (16.5%) | 3 (7.3%) |
| 4.0x or more | 29 (29.9%) | 0 (0.0%) |
| Total | 97 (100.0%) | 41 (100.0%) |
Real Estate Taxes by Mortgage Status in Cuba
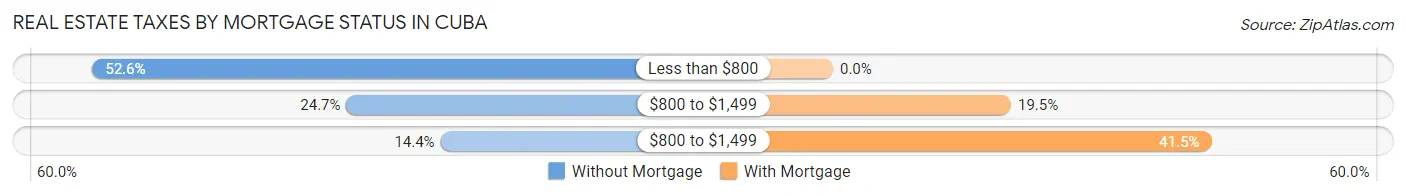
| Property Taxes | Without Mortgage | With Mortgage |
| Less than $800 | 51 (52.6%) | 0 (0.0%) |
| $800 to $1,499 | 24 (24.7%) | 8 (19.5%) |
| $800 to $1,499 | 14 (14.4%) | 17 (41.5%) |
| Total | 97 (100.0%) | 41 (100.0%) |
Health & Disability in Cuba
Health Insurance Coverage by Age in Cuba
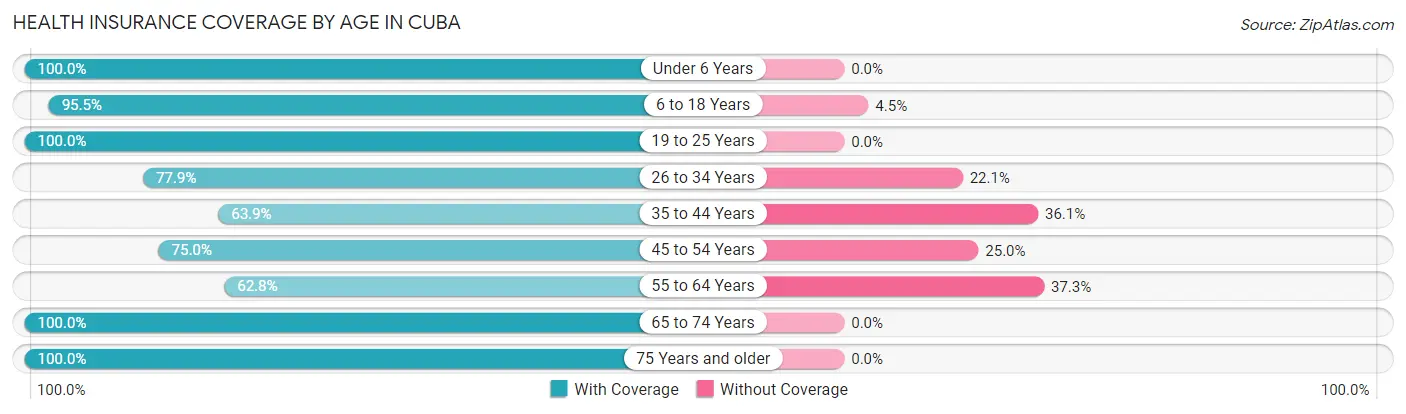
| Age Bracket | With Coverage | Without Coverage |
| Under 6 Years | 35 (100.0%) | 0 (0.0%) |
| 6 to 18 Years | 106 (95.5%) | 5 (4.5%) |
| 19 to 25 Years | 34 (100.0%) | 0 (0.0%) |
| 26 to 34 Years | 60 (77.9%) | 17 (22.1%) |
| 35 to 44 Years | 76 (63.9%) | 43 (36.1%) |
| 45 to 54 Years | 18 (75.0%) | 6 (25.0%) |
| 55 to 64 Years | 32 (62.7%) | 19 (37.2%) |
| 65 to 74 Years | 40 (100.0%) | 0 (0.0%) |
| 75 Years and older | 56 (100.0%) | 0 (0.0%) |
| Total | 457 (83.6%) | 90 (16.5%) |
Health Insurance Coverage by Citizenship Status in Cuba

| Citizenship Status | With Coverage | Without Coverage |
| Native Born | 35 (100.0%) | 0 (0.0%) |
| Foreign Born, Citizen | 106 (95.5%) | 5 (4.5%) |
| Foreign Born, not a Citizen | 34 (100.0%) | 0 (0.0%) |
Health Insurance Coverage by Household Income in Cuba
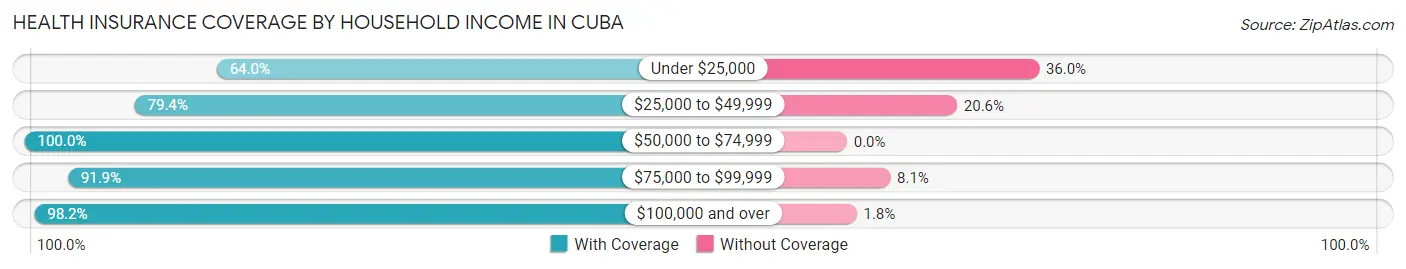
| Household Income | With Coverage | Without Coverage |
| Under $25,000 | 80 (64.0%) | 45 (36.0%) |
| $25,000 to $49,999 | 154 (79.4%) | 40 (20.6%) |
| $50,000 to $74,999 | 81 (100.0%) | 0 (0.0%) |
| $75,000 to $99,999 | 34 (91.9%) | 3 (8.1%) |
| $100,000 and over | 108 (98.2%) | 2 (1.8%) |
Public vs Private Health Insurance Coverage by Age in Cuba
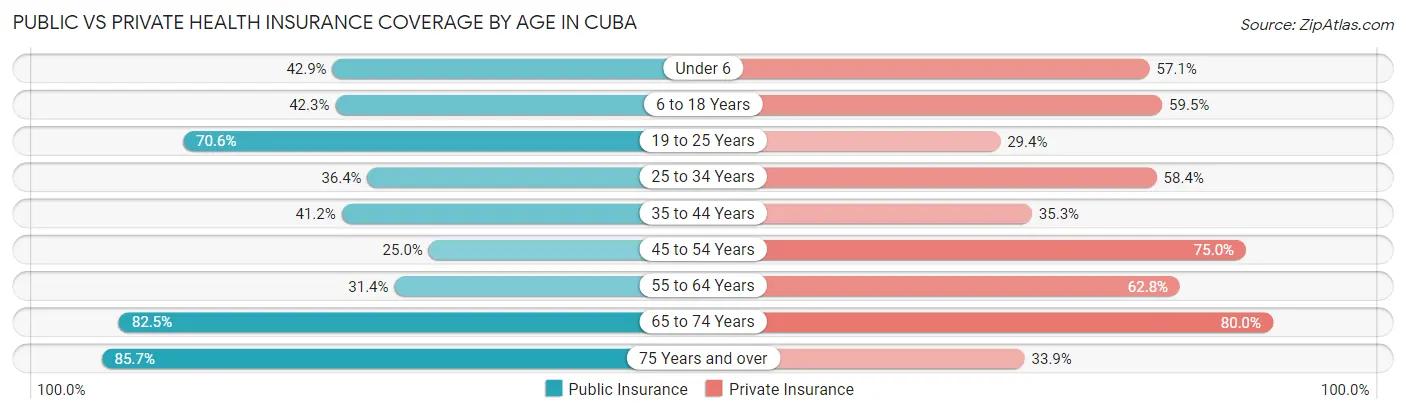
| Age Bracket | Public Insurance | Private Insurance |
| Under 6 | 15 (42.9%) | 20 (57.1%) |
| 6 to 18 Years | 47 (42.3%) | 66 (59.5%) |
| 19 to 25 Years | 24 (70.6%) | 10 (29.4%) |
| 25 to 34 Years | 28 (36.4%) | 45 (58.4%) |
| 35 to 44 Years | 49 (41.2%) | 42 (35.3%) |
| 45 to 54 Years | 6 (25.0%) | 18 (75.0%) |
| 55 to 64 Years | 16 (31.4%) | 32 (62.7%) |
| 65 to 74 Years | 33 (82.5%) | 32 (80.0%) |
| 75 Years and over | 48 (85.7%) | 19 (33.9%) |
| Total | 266 (48.6%) | 284 (51.9%) |
Disability Status by Sex by Age in Cuba
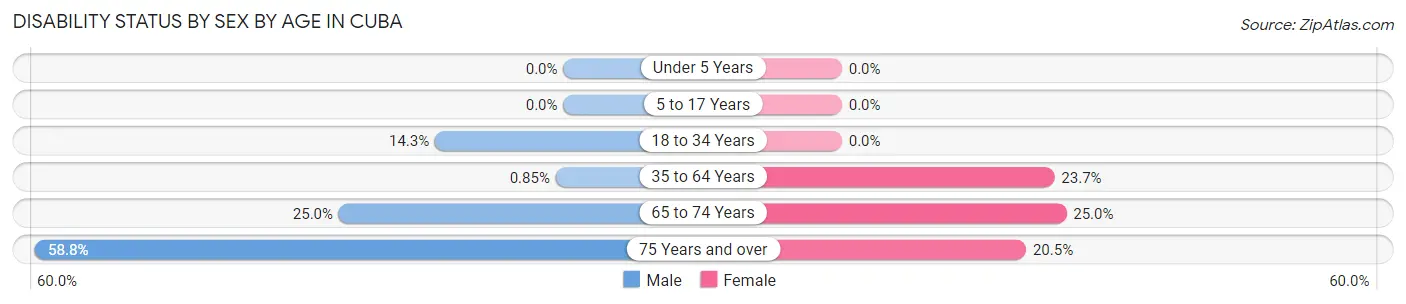
| Age Bracket | Male | Female |
| Under 5 Years | 0 (0.0%) | 0 (0.0%) |
| 5 to 17 Years | 0 (0.0%) | 0 (0.0%) |
| 18 to 34 Years | 7 (14.3%) | 0 (0.0%) |
| 35 to 64 Years | 1 (0.9%) | 18 (23.7%) |
| 65 to 74 Years | 1 (25.0%) | 9 (25.0%) |
| 75 Years and over | 10 (58.8%) | 8 (20.5%) |
Disability Class by Sex by Age in Cuba
Disability Class: Hearing Difficulty
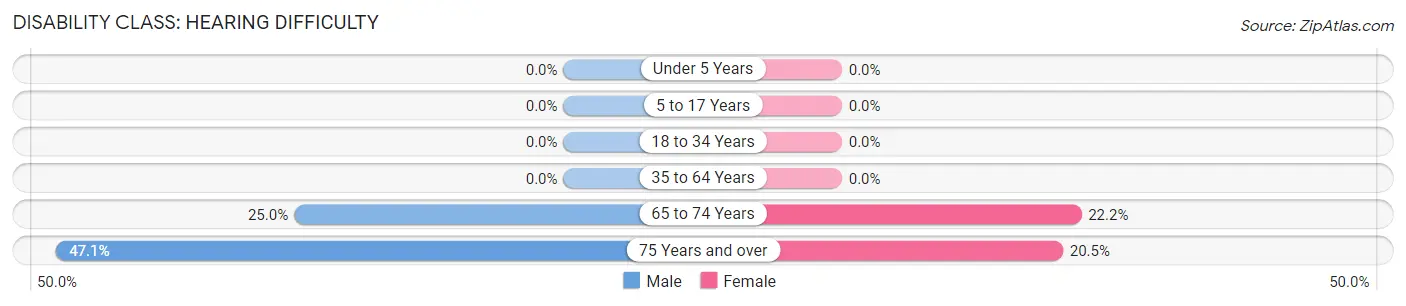
| Age Bracket | Male | Female |
| Under 5 Years | 0 (0.0%) | 0 (0.0%) |
| 5 to 17 Years | 0 (0.0%) | 0 (0.0%) |
| 18 to 34 Years | 0 (0.0%) | 0 (0.0%) |
| 35 to 64 Years | 0 (0.0%) | 0 (0.0%) |
| 65 to 74 Years | 1 (25.0%) | 8 (22.2%) |
| 75 Years and over | 8 (47.1%) | 8 (20.5%) |
Disability Class: Vision Difficulty
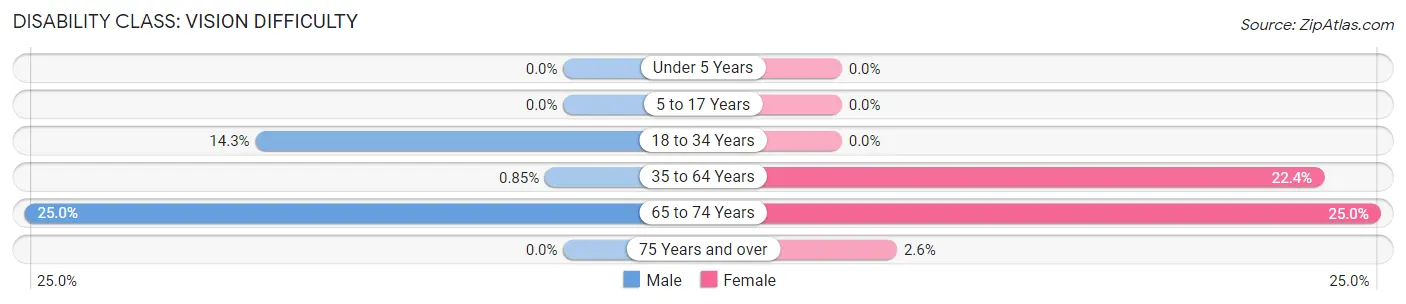
| Age Bracket | Male | Female |
| Under 5 Years | 0 (0.0%) | 0 (0.0%) |
| 5 to 17 Years | 0 (0.0%) | 0 (0.0%) |
| 18 to 34 Years | 7 (14.3%) | 0 (0.0%) |
| 35 to 64 Years | 1 (0.9%) | 17 (22.4%) |
| 65 to 74 Years | 1 (25.0%) | 9 (25.0%) |
| 75 Years and over | 0 (0.0%) | 1 (2.6%) |
Disability Class: Cognitive Difficulty
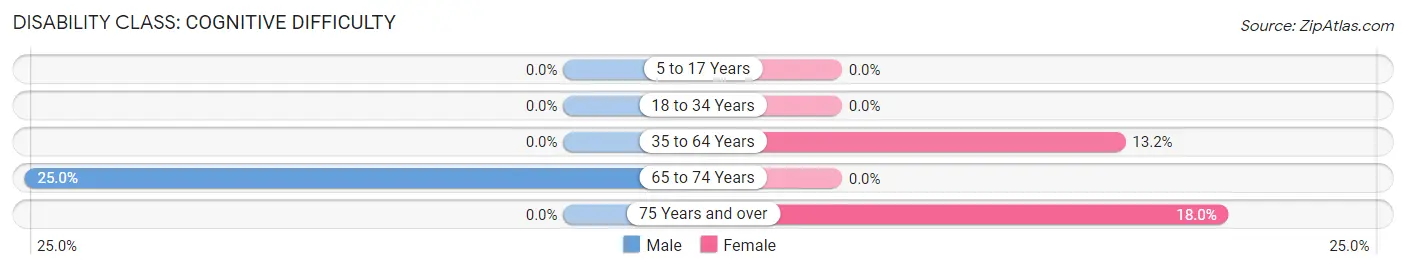
| Age Bracket | Male | Female |
| 5 to 17 Years | 0 (0.0%) | 0 (0.0%) |
| 18 to 34 Years | 0 (0.0%) | 0 (0.0%) |
| 35 to 64 Years | 0 (0.0%) | 10 (13.2%) |
| 65 to 74 Years | 1 (25.0%) | 0 (0.0%) |
| 75 Years and over | 0 (0.0%) | 7 (17.9%) |
Disability Class: Ambulatory Difficulty
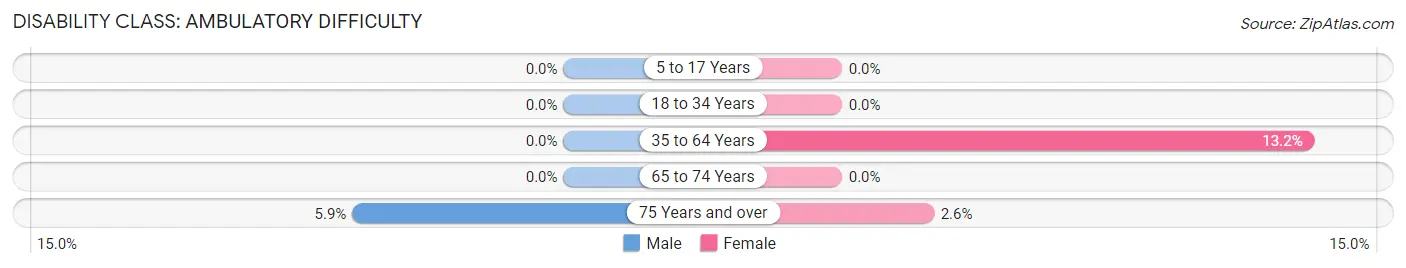
| Age Bracket | Male | Female |
| 5 to 17 Years | 0 (0.0%) | 0 (0.0%) |
| 18 to 34 Years | 0 (0.0%) | 0 (0.0%) |
| 35 to 64 Years | 0 (0.0%) | 10 (13.2%) |
| 65 to 74 Years | 0 (0.0%) | 0 (0.0%) |
| 75 Years and over | 1 (5.9%) | 1 (2.6%) |
Disability Class: Self-Care Difficulty
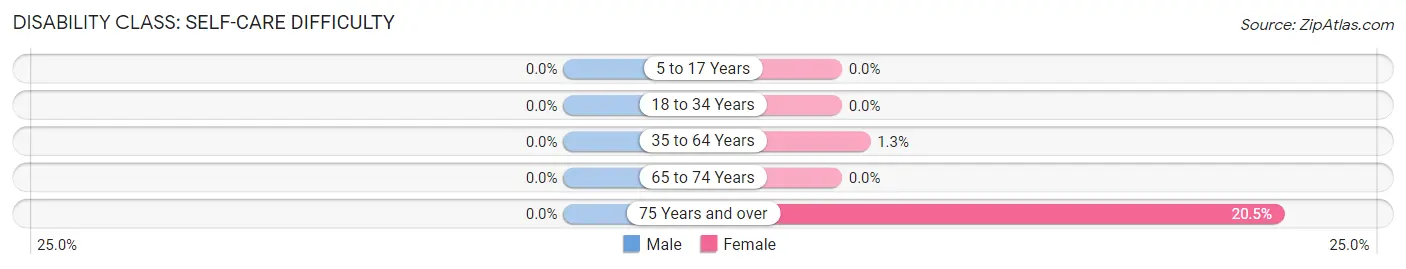
| Age Bracket | Male | Female |
| 5 to 17 Years | 0 (0.0%) | 0 (0.0%) |
| 18 to 34 Years | 0 (0.0%) | 0 (0.0%) |
| 35 to 64 Years | 0 (0.0%) | 1 (1.3%) |
| 65 to 74 Years | 0 (0.0%) | 0 (0.0%) |
| 75 Years and over | 0 (0.0%) | 8 (20.5%) |
Technology Access in Cuba
Computing Device Access in Cuba
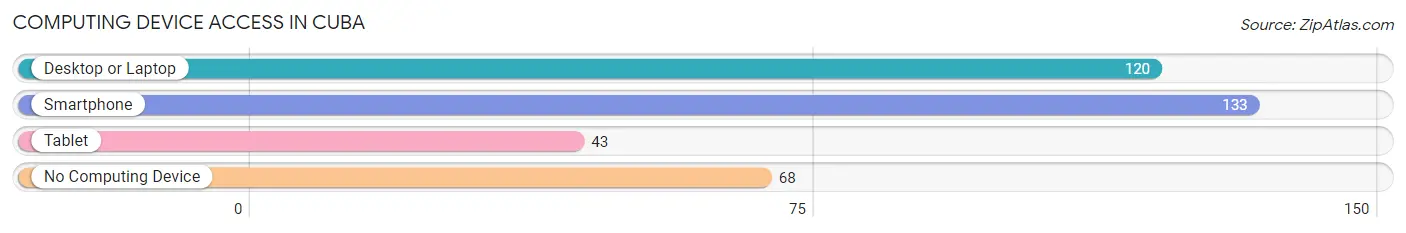
| Device Type | # Households | % Households |
| Desktop or Laptop | 120 | 56.1% |
| Smartphone | 133 | 62.2% |
| Tablet | 43 | 20.1% |
| No Computing Device | 68 | 31.8% |
| Total | 214 | 100.0% |
Internet Access in Cuba
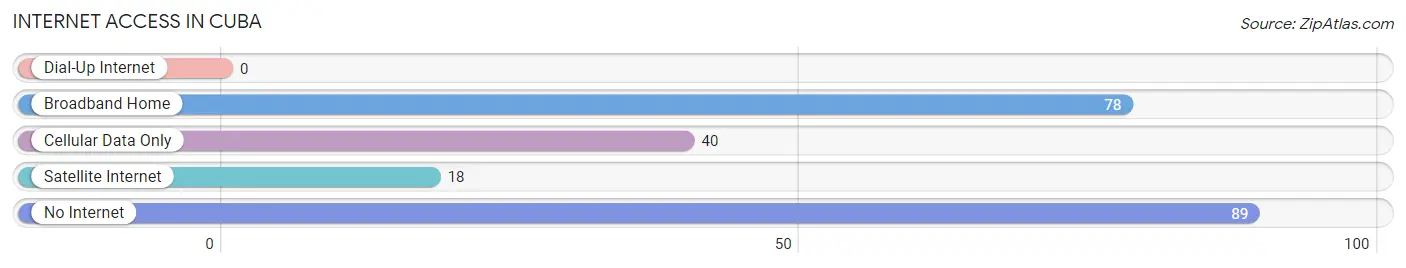
| Internet Type | # Households | % Households |
| Dial-Up Internet | 0 | 0.0% |
| Broadband Home | 78 | 36.4% |
| Cellular Data Only | 40 | 18.7% |
| Satellite Internet | 18 | 8.4% |
| No Internet | 89 | 41.6% |
| Total | 214 | 100.0% |
Cuba Summary
Cuba, New Mexico is a small town located in the northern part of the state, in the county of Sandoval. It is situated in the foothills of the Sangre de Cristo Mountains, and is surrounded by the Jemez Mountains to the north and the San Pedro Mountains to the south. The town is located at an elevation of 6,719 feet, and has a population of 1,945 as of the 2010 census.
History
The area around Cuba was first inhabited by the Tewa Indians, who lived in the area for centuries before the arrival of the Spanish in the 16th century. The Spanish established a mission in the area in 1620, and the town of Cuba was founded in 1867. The town was named after the Cuban revolutionary leader, José Martí, who had recently died in battle.
The town grew rapidly in the late 19th century, and by the early 20th century, it had become a major center for the mining and timber industries. The town was also home to a large number of sheep and cattle ranches.
In the 1950s, the town began to decline as the mining and timber industries moved away. The town was further impacted by the closure of the nearby Los Alamos National Laboratory in the 1970s.
Geography
Cuba is located in the northern part of New Mexico, in the county of Sandoval. It is situated in the foothills of the Sangre de Cristo Mountains, and is surrounded by the Jemez Mountains to the north and the San Pedro Mountains to the south. The town is located at an elevation of 6,719 feet, and has a total area of 1.3 square miles.
The climate in Cuba is semi-arid, with hot summers and cold winters. The average annual temperature is 54°F, and the average annual precipitation is 12.5 inches.
Economy
The economy of Cuba is largely based on tourism, as the town is a popular destination for outdoor activities such as hiking, camping, and fishing. The town is also home to a number of small businesses, including restaurants, shops, and galleries.
The town is also home to a number of government agencies, including the Bureau of Land Management, the U.S. Forest Service, and the U.S. Fish and Wildlife Service.
Demographics
As of the 2010 census, the population of Cuba was 1,945. The racial makeup of the town was 79.3% White, 0.7% African American, 0.7% Native American, 0.2% Asian, 0.1% Pacific Islander, 16.2% from other races, and 2.9% from two or more races. Hispanic or Latino of any race were 41.2% of the population.
The median income for a household in the town was $30,000, and the median income for a family was $35,000. The per capita income for the town was $14,000. About 18.2% of the population was below the poverty line.
Common Questions
What is Per Capita Income in Cuba?
Per Capita income in Cuba is $20,484.
What is the Median Family Income in Cuba?
Median Family Income in Cuba is $45,781.
What is the Median Household income in Cuba?
Median Household Income in Cuba is $34,432.
What is Income or Wage Gap in Cuba?
Income or Wage Gap in Cuba is 36.8%.
Women in Cuba earn 63.2 cents for every dollar earned by a man.
What is Inequality or Gini Index in Cuba?
Inequality or Gini Index in Cuba is 0.42.
What is the Total Population of Cuba?
Total Population of Cuba is 547.
What is the Total Male Population of Cuba?
Total Male Population of Cuba is 256.
What is the Total Female Population of Cuba?
Total Female Population of Cuba is 291.
What is the Ratio of Males per 100 Females in Cuba?
There are 87.97 Males per 100 Females in Cuba.
What is the Ratio of Females per 100 Males in Cuba?
There are 113.67 Females per 100 Males in Cuba.
What is the Median Population Age in Cuba?
Median Population Age in Cuba is 36.5 Years.
What is the Average Family Size in Cuba
Average Family Size in Cuba is 3.5 People.
What is the Average Household Size in Cuba
Average Household Size in Cuba is 2.6 People.
How Large is the Labor Force in Cuba?
There are 236 People in the Labor Forcein in Cuba.
What is the Percentage of People in the Labor Force in Cuba?
58.7% of People are in the Labor Force in Cuba.
What is the Unemployment Rate in Cuba?
Unemployment Rate in Cuba is 8.5%.