Crownpoint, NM Map & Demographics
Crownpoint Map
Crownpoint Overview
$17,743
PER CAPITA INCOME
$63,125
AVG FAMILY INCOME
$35,362
AVG HOUSEHOLD INCOME
15.0%
WAGE / INCOME GAP [ % ]
85.0¢/ $1
WAGE / INCOME GAP [ $ ]
$12,421
FAMILY INCOME DEFICIT
0.52
INEQUALITY / GINI INDEX
2,823
TOTAL POPULATION
1,257
MALE POPULATION
1,566
FEMALE POPULATION
80.27
MALES / 100 FEMALES
124.58
FEMALES / 100 MALES
34.2
MEDIAN AGE
4.2
AVG FAMILY SIZE
3.1
AVG HOUSEHOLD SIZE
1,140
LABOR FORCE [ PEOPLE ]
48.8%
PERCENT IN LABOR FORCE
12.8%
UNEMPLOYMENT RATE
Crownpoint Zip Codes
Crownpoint Area Codes
Income in Crownpoint
Income Overview in Crownpoint
Per Capita Income in Crownpoint is $17,743, while median incomes of families and households are $63,125 and $35,362 respectively.
| Characteristic | Number | Measure |
| Per Capita Income | 2,823 | $17,743 |
| Median Family Income | 524 | $63,125 |
| Mean Family Income | 524 | $63,123 |
| Median Household Income | 893 | $35,362 |
| Mean Household Income | 893 | $51,689 |
| Income Deficit | 524 | $12,421 |
| Wage / Income Gap (%) | 2,823 | 15.03% |
| Wage / Income Gap ($) | 2,823 | 84.97¢ per $1 |
| Gini / Inequality Index | 2,823 | 0.52 |
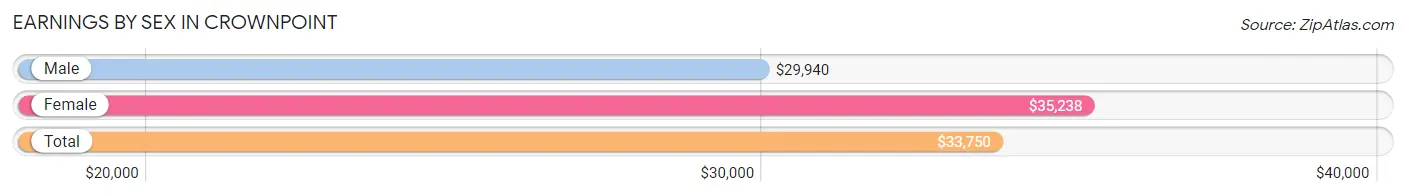
Earnings by Sex in Crownpoint
Average Earnings in Crownpoint are $33,750, $29,940 for men and $35,238 for women, a difference of 15.0%.
| Sex | Number | Average Earnings |
| Male | 569 (49.6%) | $29,940 |
| Female | 577 (50.3%) | $35,238 |
| Total | 1,146 (100.0%) | $33,750 |
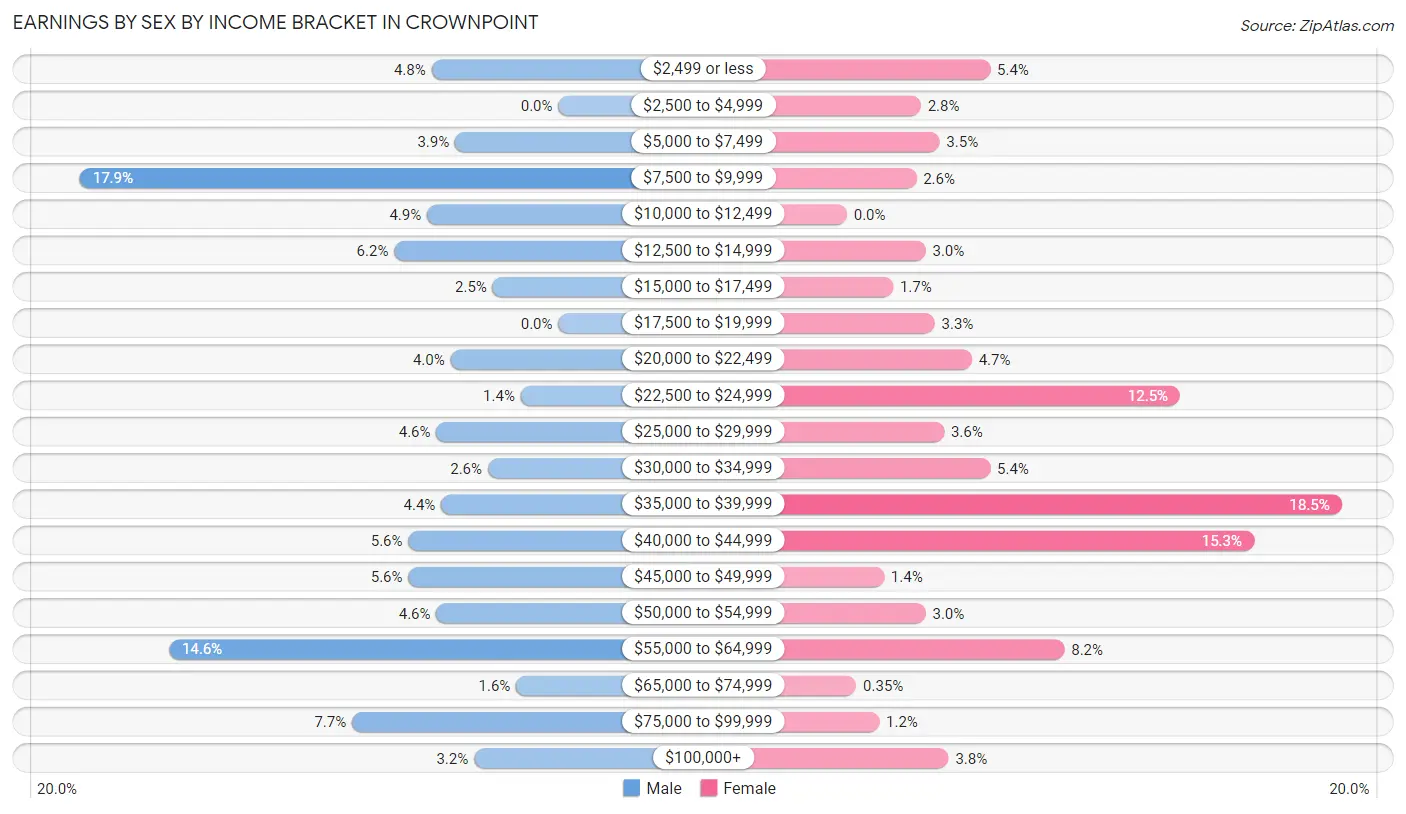
Earnings by Sex by Income Bracket in Crownpoint
The most common earnings brackets in Crownpoint are $7,500 to $9,999 for men (102 | 17.9%) and $35,000 to $39,999 for women (107 | 18.5%).
| Income | Male | Female |
| $2,499 or less | 27 (4.8%) | 31 (5.4%) |
| $2,500 to $4,999 | 0 (0.0%) | 16 (2.8%) |
| $5,000 to $7,499 | 22 (3.9%) | 20 (3.5%) |
| $7,500 to $9,999 | 102 (17.9%) | 15 (2.6%) |
| $10,000 to $12,499 | 28 (4.9%) | 0 (0.0%) |
| $12,500 to $14,999 | 35 (6.1%) | 17 (2.9%) |
| $15,000 to $17,499 | 14 (2.5%) | 10 (1.7%) |
| $17,500 to $19,999 | 0 (0.0%) | 19 (3.3%) |
| $20,000 to $22,499 | 23 (4.0%) | 27 (4.7%) |
| $22,500 to $24,999 | 8 (1.4%) | 72 (12.5%) |
| $25,000 to $29,999 | 26 (4.6%) | 21 (3.6%) |
| $30,000 to $34,999 | 15 (2.6%) | 31 (5.4%) |
| $35,000 to $39,999 | 25 (4.4%) | 107 (18.5%) |
| $40,000 to $44,999 | 32 (5.6%) | 88 (15.2%) |
| $45,000 to $49,999 | 32 (5.6%) | 8 (1.4%) |
| $50,000 to $54,999 | 26 (4.6%) | 17 (2.9%) |
| $55,000 to $64,999 | 83 (14.6%) | 47 (8.2%) |
| $65,000 to $74,999 | 9 (1.6%) | 2 (0.4%) |
| $75,000 to $99,999 | 44 (7.7%) | 7 (1.2%) |
| $100,000+ | 18 (3.2%) | 22 (3.8%) |
| Total | 569 (100.0%) | 577 (100.0%) |
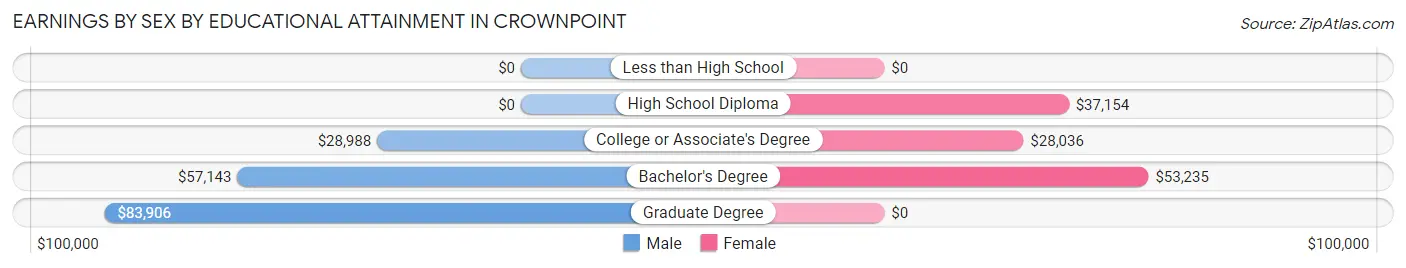
Earnings by Sex by Educational Attainment in Crownpoint
Average earnings in Crownpoint are $35,950 for men and $36,450 for women, a difference of 1.4%. Men with an educational attainment of graduate degree enjoy the highest average annual earnings of $83,906, while those with college or associate's degree education earn the least with $28,988. Women with an educational attainment of bachelor's degree earn the most with the average annual earnings of $53,235, while those with college or associate's degree education have the smallest earnings of $28,036.
| Educational Attainment | Male Income | Female Income |
| Less than High School | - | - |
| High School Diploma | - | - |
| College or Associate's Degree | $28,988 | $28,036 |
| Bachelor's Degree | $57,143 | $53,235 |
| Graduate Degree | $83,906 | $0 |
| Total | $35,950 | $36,450 |
Family Income in Crownpoint
Family Income Brackets in Crownpoint
According to the Crownpoint family income data, there are 139 families falling into the $75,000 to $99,999 income range, which is the most common income bracket and makes up 26.5% of all families. Conversely, the $150,000 to $199,999 income bracket is the least frequent group with only 11 families (2.1%) belonging to this category.
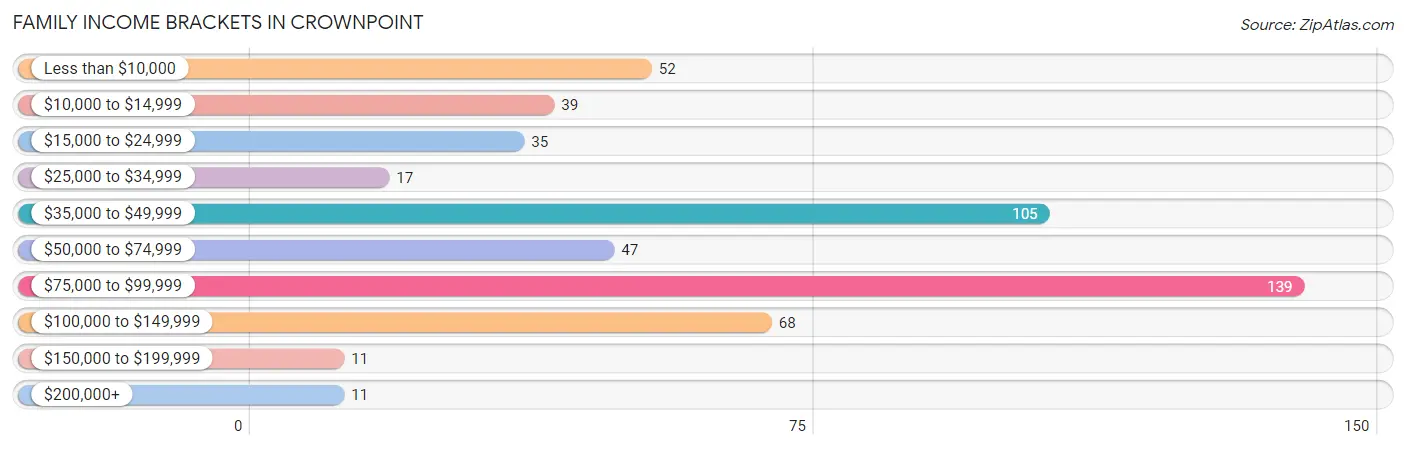
| Income Bracket | # Families | % Families |
| Less than $10,000 | 52 | 9.9% |
| $10,000 to $14,999 | 39 | 7.4% |
| $15,000 to $24,999 | 35 | 6.7% |
| $25,000 to $34,999 | 17 | 3.2% |
| $35,000 to $49,999 | 105 | 20.0% |
| $50,000 to $74,999 | 47 | 9.0% |
| $75,000 to $99,999 | 139 | 26.5% |
| $100,000 to $149,999 | 68 | 13.0% |
| $150,000 to $199,999 | 11 | 2.1% |
| $200,000+ | 11 | 2.1% |
Family Income by Famaliy Size in Crownpoint
4-person families (168 | 32.1%) account for the highest median family income in Crownpoint with $86,000 per family, while 2-person families (119 | 22.7%) have the highest median income of $22,054 per family member.
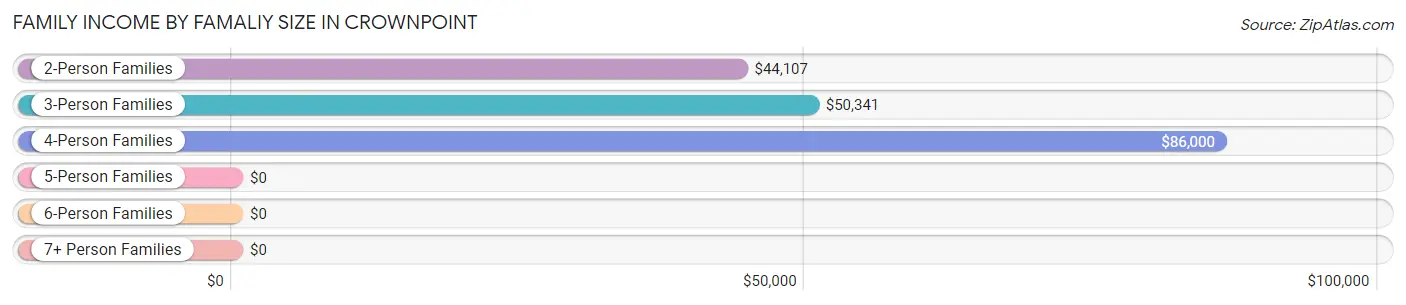
| Income Bracket | # Families | Median Income |
| 2-Person Families | 119 (22.7%) | $44,107 |
| 3-Person Families | 165 (31.5%) | $50,341 |
| 4-Person Families | 168 (32.1%) | $86,000 |
| 5-Person Families | 20 (3.8%) | $0 |
| 6-Person Families | 34 (6.5%) | $0 |
| 7+ Person Families | 18 (3.4%) | $0 |
| Total | 524 (100.0%) | $63,125 |
Family Income by Number of Earners in Crownpoint
The median family income in Crownpoint is $63,125, with families comprising 3+ earners (117) having the highest median family income of $87,075, while families with no earners (113) have the lowest median family income of $13,125, accounting for 22.3% and 21.6% of families, respectively.
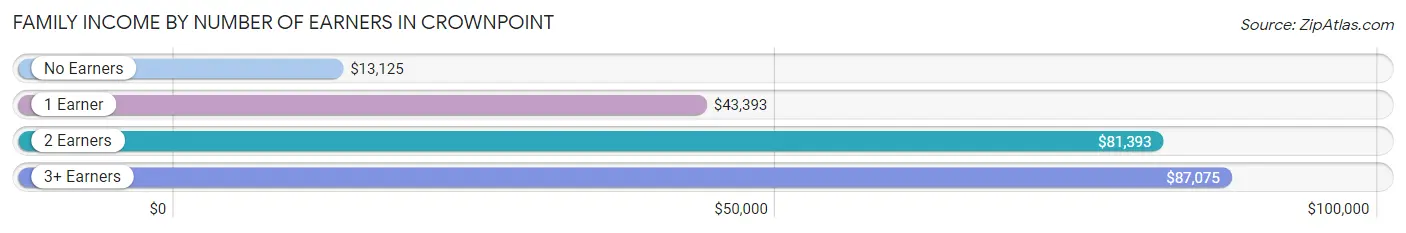
| Number of Earners | # Families | Median Income |
| No Earners | 113 (21.6%) | $13,125 |
| 1 Earner | 161 (30.7%) | $43,393 |
| 2 Earners | 133 (25.4%) | $81,393 |
| 3+ Earners | 117 (22.3%) | $87,075 |
| Total | 524 (100.0%) | $63,125 |
Household Income in Crownpoint
Household Income Brackets in Crownpoint
With 199 households falling in the category, the $10,000 to $14,999 income range is the most frequent in Crownpoint, accounting for 22.3% of all households. In contrast, only 26 households (2.9%) fall into the $200,000+ income bracket, making it the least populous group.
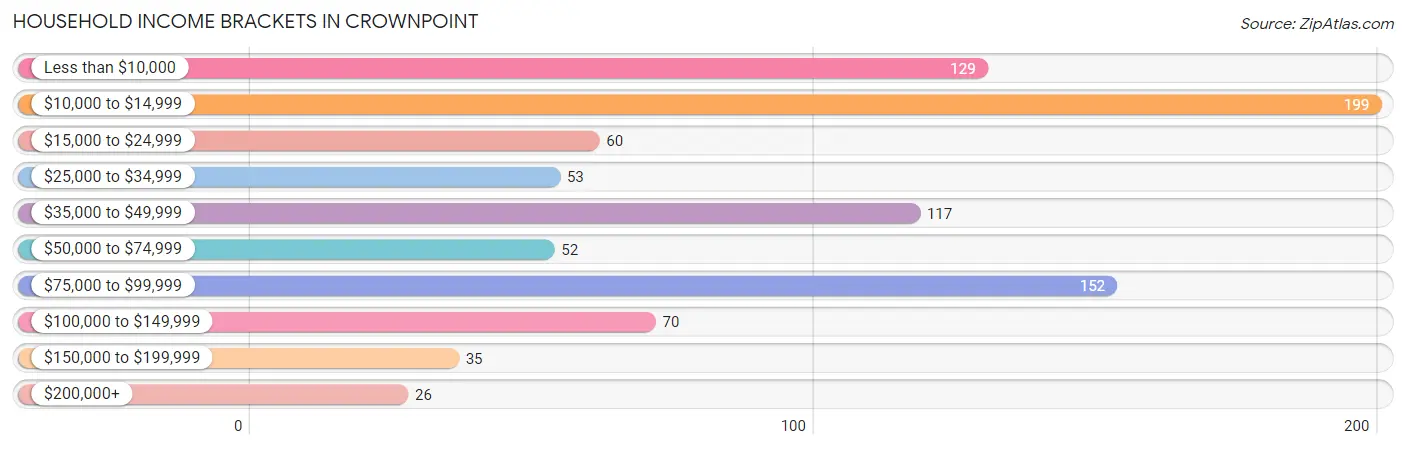
| Income Bracket | # Households | % Households |
| Less than $10,000 | 129 | 14.4% |
| $10,000 to $14,999 | 199 | 22.3% |
| $15,000 to $24,999 | 60 | 6.7% |
| $25,000 to $34,999 | 53 | 5.9% |
| $35,000 to $49,999 | 117 | 13.1% |
| $50,000 to $74,999 | 52 | 5.8% |
| $75,000 to $99,999 | 152 | 17.0% |
| $100,000 to $149,999 | 70 | 7.8% |
| $150,000 to $199,999 | 35 | 3.9% |
| $200,000+ | 26 | 2.9% |
Household Income by Householder Age in Crownpoint
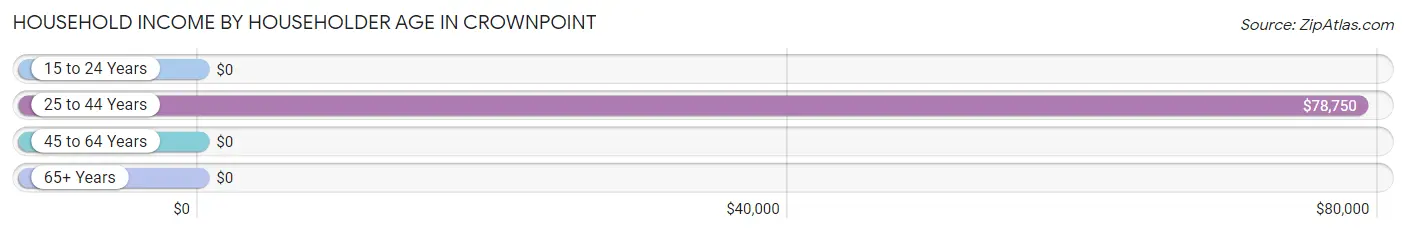
The median household income in Crownpoint is $35,362, with the highest median household income of $78,750 found in the 25 to 44 years age bracket for the primary householder. A total of 160 households (17.9%) fall into this category. Meanwhile, the 15 to 24 years age bracket for the primary householder has the lowest median household income of $0, with 8 households (0.9%) in this group.
| Income Bracket | # Households | Median Income |
| 15 to 24 Years | 8 (0.9%) | $0 |
| 25 to 44 Years | 160 (17.9%) | $78,750 |
| 45 to 64 Years | 499 (55.9%) | $0 |
| 65+ Years | 226 (25.3%) | $0 |
| Total | 893 (100.0%) | $35,362 |
Poverty in Crownpoint
Income Below Poverty by Sex and Age in Crownpoint
With 32.2% poverty level for males and 35.7% for females among the residents of Crownpoint, 5 year old males and 16 and 17 year old females are the most vulnerable to poverty, with 8 males (100.0%) and 73 females (77.7%) in their respective age groups living below the poverty level.
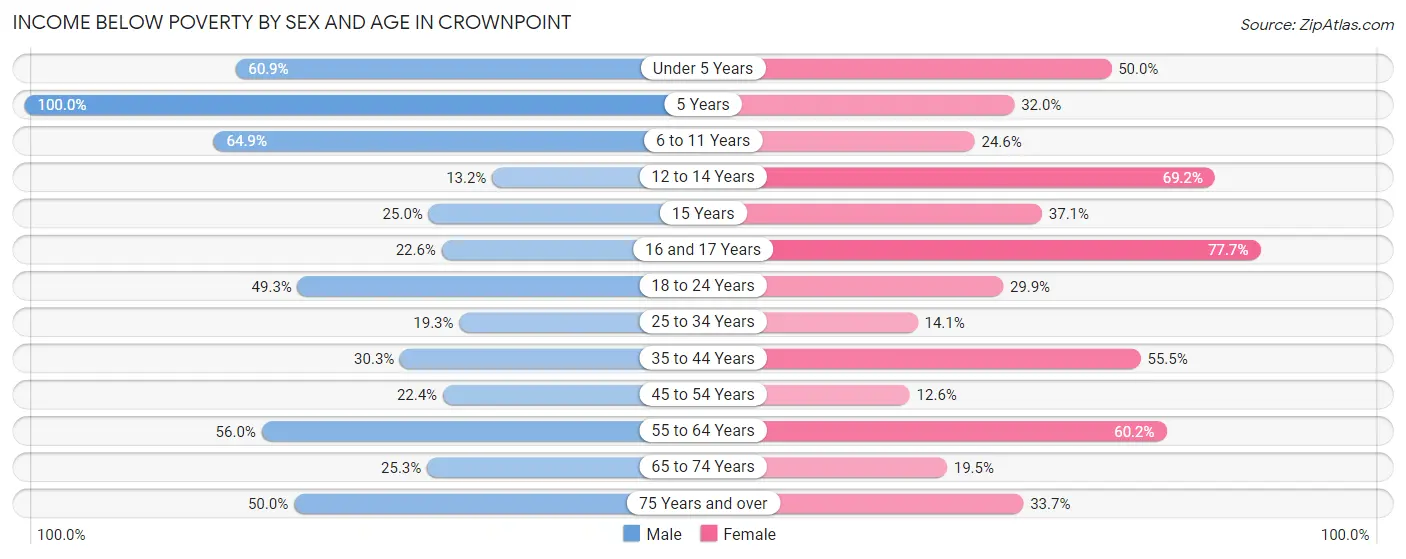
| Age Bracket | Male | Female |
| Under 5 Years | 14 (60.9%) | 18 (50.0%) |
| 5 Years | 8 (100.0%) | 8 (32.0%) |
| 6 to 11 Years | 37 (64.9%) | 34 (24.6%) |
| 12 to 14 Years | 7 (13.2%) | 18 (69.2%) |
| 15 Years | 8 (25.0%) | 13 (37.1%) |
| 16 and 17 Years | 7 (22.6%) | 73 (77.7%) |
| 18 to 24 Years | 36 (49.3%) | 32 (29.9%) |
| 25 to 34 Years | 55 (19.3%) | 45 (14.1%) |
| 35 to 44 Years | 63 (30.3%) | 61 (55.4%) |
| 45 to 54 Years | 40 (22.4%) | 16 (12.6%) |
| 55 to 64 Years | 70 (56.0%) | 162 (60.2%) |
| 65 to 74 Years | 22 (25.3%) | 23 (19.5%) |
| 75 Years and over | 18 (50.0%) | 32 (33.7%) |
| Total | 385 (32.2%) | 535 (35.7%) |
Income Above Poverty by Sex and Age in Crownpoint
According to the poverty statistics in Crownpoint, males aged 12 to 14 years and females aged 45 to 54 years are the age groups that are most secure financially, with 86.8% of males and 87.4% of females in these age groups living above the poverty line.
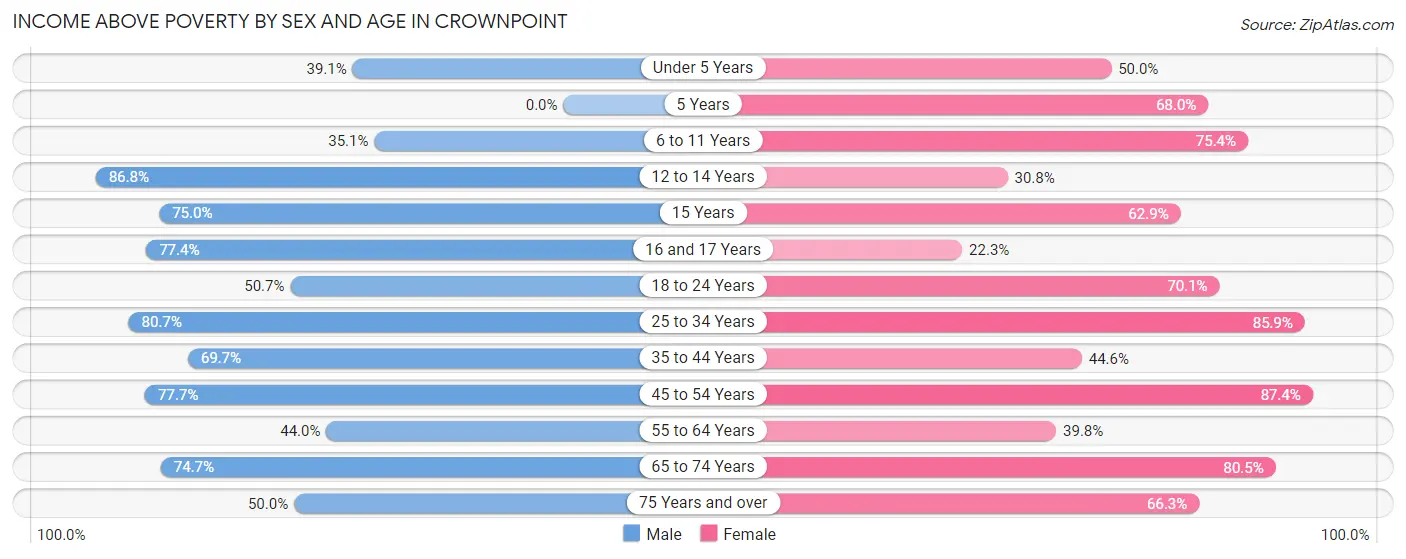
| Age Bracket | Male | Female |
| Under 5 Years | 9 (39.1%) | 18 (50.0%) |
| 5 Years | 0 (0.0%) | 17 (68.0%) |
| 6 to 11 Years | 20 (35.1%) | 104 (75.4%) |
| 12 to 14 Years | 46 (86.8%) | 8 (30.8%) |
| 15 Years | 24 (75.0%) | 22 (62.9%) |
| 16 and 17 Years | 24 (77.4%) | 21 (22.3%) |
| 18 to 24 Years | 37 (50.7%) | 75 (70.1%) |
| 25 to 34 Years | 230 (80.7%) | 275 (85.9%) |
| 35 to 44 Years | 145 (69.7%) | 49 (44.6%) |
| 45 to 54 Years | 139 (77.6%) | 111 (87.4%) |
| 55 to 64 Years | 55 (44.0%) | 107 (39.8%) |
| 65 to 74 Years | 65 (74.7%) | 95 (80.5%) |
| 75 Years and over | 18 (50.0%) | 63 (66.3%) |
| Total | 812 (67.8%) | 965 (64.3%) |
Income Below Poverty Among Married-Couple Families in Crownpoint
The poverty statistics for married-couple families in Crownpoint show that 27.6% or 45 of the total 163 families live below the poverty line. Families with 3 or 4 children have the highest poverty rate of 66.7%, comprising of 18 families. On the other hand, families with no children have the lowest poverty rate of 14.1%, which includes 11 families.
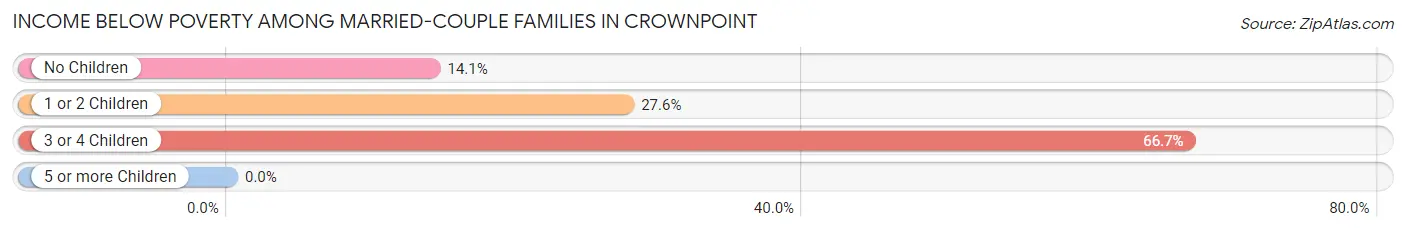
| Children | Above Poverty | Below Poverty |
| No Children | 67 (85.9%) | 11 (14.1%) |
| 1 or 2 Children | 42 (72.4%) | 16 (27.6%) |
| 3 or 4 Children | 9 (33.3%) | 18 (66.7%) |
| 5 or more Children | 0 (0.0%) | 0 (0.0%) |
| Total | 118 (72.4%) | 45 (27.6%) |
Income Below Poverty Among Single-Parent Households in Crownpoint
According to the poverty data in Crownpoint, 41.7% or 43 single-father households and 22.1% or 57 single-mother households are living below the poverty line. Among single-father households, those with 3 or 4 children have the highest poverty rate, with 6 households (100.0%) experiencing poverty. Likewise, among single-mother households, those with 1 or 2 children have the highest poverty rate, with 25 households (22.7%) falling below the poverty line.
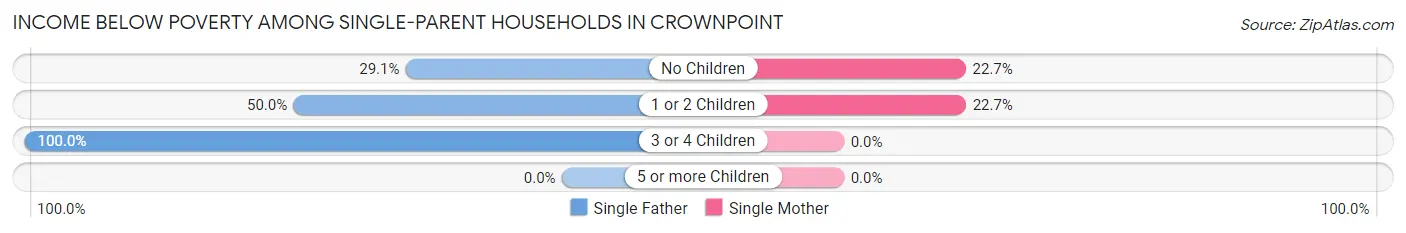
| Children | Single Father | Single Mother |
| No Children | 16 (29.1%) | 32 (22.7%) |
| 1 or 2 Children | 21 (50.0%) | 25 (22.7%) |
| 3 or 4 Children | 6 (100.0%) | 0 (0.0%) |
| 5 or more Children | 0 (0.0%) | 0 (0.0%) |
| Total | 43 (41.7%) | 57 (22.1%) |
Income Below Poverty Among Married-Couple vs Single-Parent Households in Crownpoint
The poverty data for Crownpoint shows that 45 of the married-couple family households (27.6%) and 100 of the single-parent households (27.7%) are living below the poverty level. Within the married-couple family households, those with 3 or 4 children have the highest poverty rate, with 18 households (66.7%) falling below the poverty line. Among the single-parent households, those with 3 or 4 children have the highest poverty rate, with 6 household (46.2%) living below poverty.
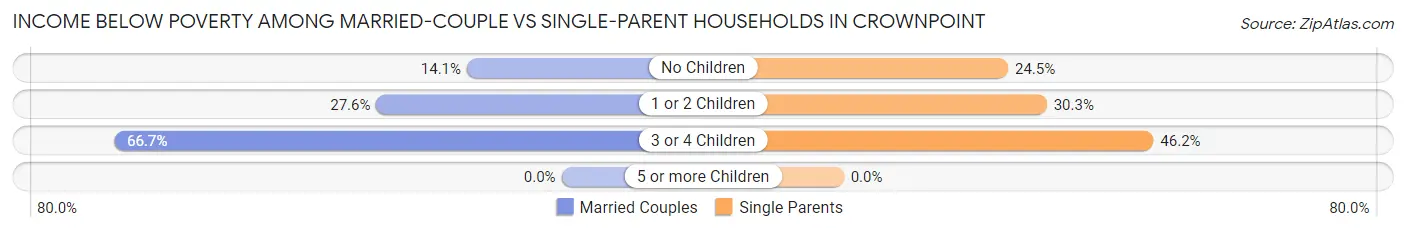
| Children | Married-Couple Families | Single-Parent Households |
| No Children | 11 (14.1%) | 48 (24.5%) |
| 1 or 2 Children | 16 (27.6%) | 46 (30.3%) |
| 3 or 4 Children | 18 (66.7%) | 6 (46.2%) |
| 5 or more Children | 0 (0.0%) | 0 (0.0%) |
| Total | 45 (27.6%) | 100 (27.7%) |
Race in Crownpoint
The most populous races in Crownpoint are Native / Alaskan (2,573 | 91.1%), Two or more Races (129 | 4.6%), and White / Caucasian (94 | 3.3%).
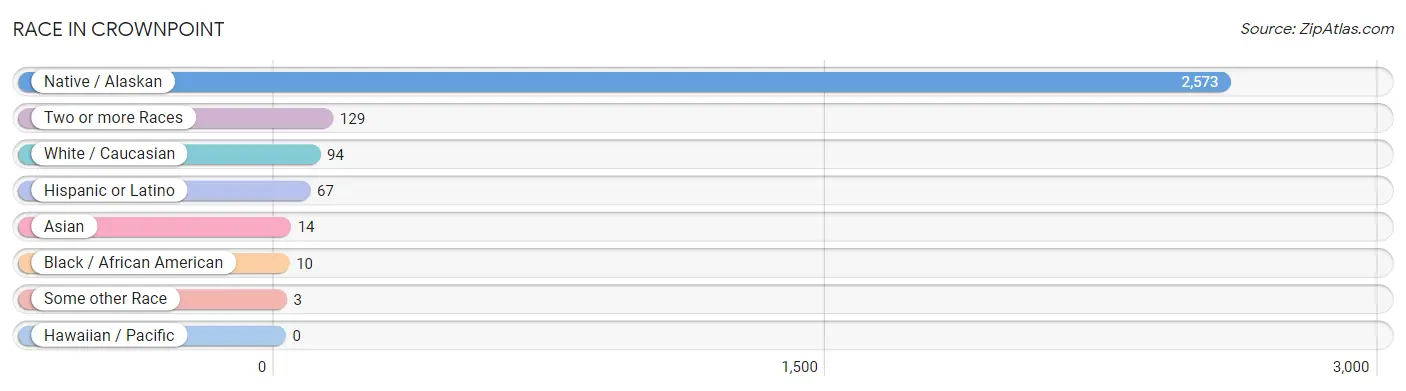
| Race | # Population | % Population |
| Asian | 14 | 0.5% |
| Black / African American | 10 | 0.4% |
| Hawaiian / Pacific | 0 | 0.0% |
| Hispanic or Latino | 67 | 2.4% |
| Native / Alaskan | 2,573 | 91.1% |
| White / Caucasian | 94 | 3.3% |
| Two or more Races | 129 | 4.6% |
| Some other Race | 3 | 0.1% |
| Total | 2,823 | 100.0% |
Ancestry in Crownpoint
The most populous ancestries reported in Crownpoint are Navajo (2,586 | 91.6%), Mexican (56 | 2.0%), Pueblo (50 | 1.8%), Irish (39 | 1.4%), and American (28 | 1.0%), together accounting for 97.7% of all Crownpoint residents.
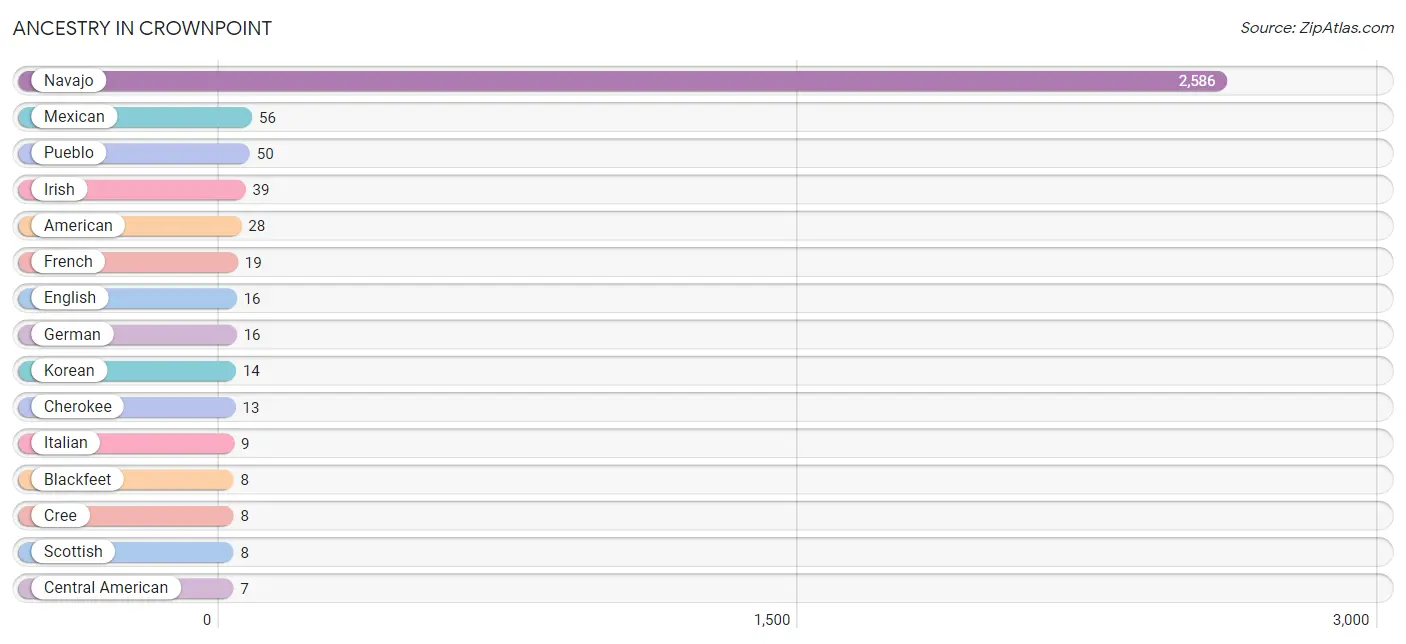
| Ancestry | # Population | % Population |
| Alaska Native | 3 | 0.1% |
| American | 28 | 1.0% |
| Blackfeet | 8 | 0.3% |
| Central American | 7 | 0.3% |
| Cherokee | 13 | 0.5% |
| Cree | 8 | 0.3% |
| English | 16 | 0.6% |
| French | 19 | 0.7% |
| German | 16 | 0.6% |
| Guatemalan | 7 | 0.3% |
| Irish | 39 | 1.4% |
| Italian | 9 | 0.3% |
| Korean | 14 | 0.5% |
| Mexican | 56 | 2.0% |
| Navajo | 2,586 | 91.6% |
| Pueblo | 50 | 1.8% |
| Puerto Rican | 4 | 0.1% |
| Scottish | 8 | 0.3% | View All 18 Rows |
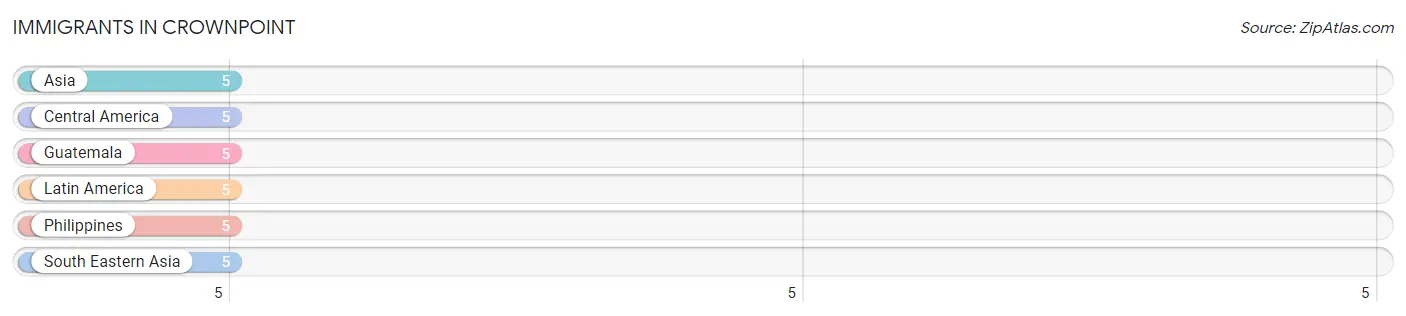
Immigrants in Crownpoint
The most numerous immigrant groups reported in Crownpoint came from Asia (5 | 0.2%), Central America (5 | 0.2%), Guatemala (5 | 0.2%), Latin America (5 | 0.2%), and Philippines (5 | 0.2%), together accounting for 0.9% of all Crownpoint residents.
| Immigration Origin | # Population | % Population |
| Asia | 5 | 0.2% |
| Central America | 5 | 0.2% |
| Guatemala | 5 | 0.2% |
| Latin America | 5 | 0.2% |
| Philippines | 5 | 0.2% |
| South Eastern Asia | 5 | 0.2% | View All 6 Rows |
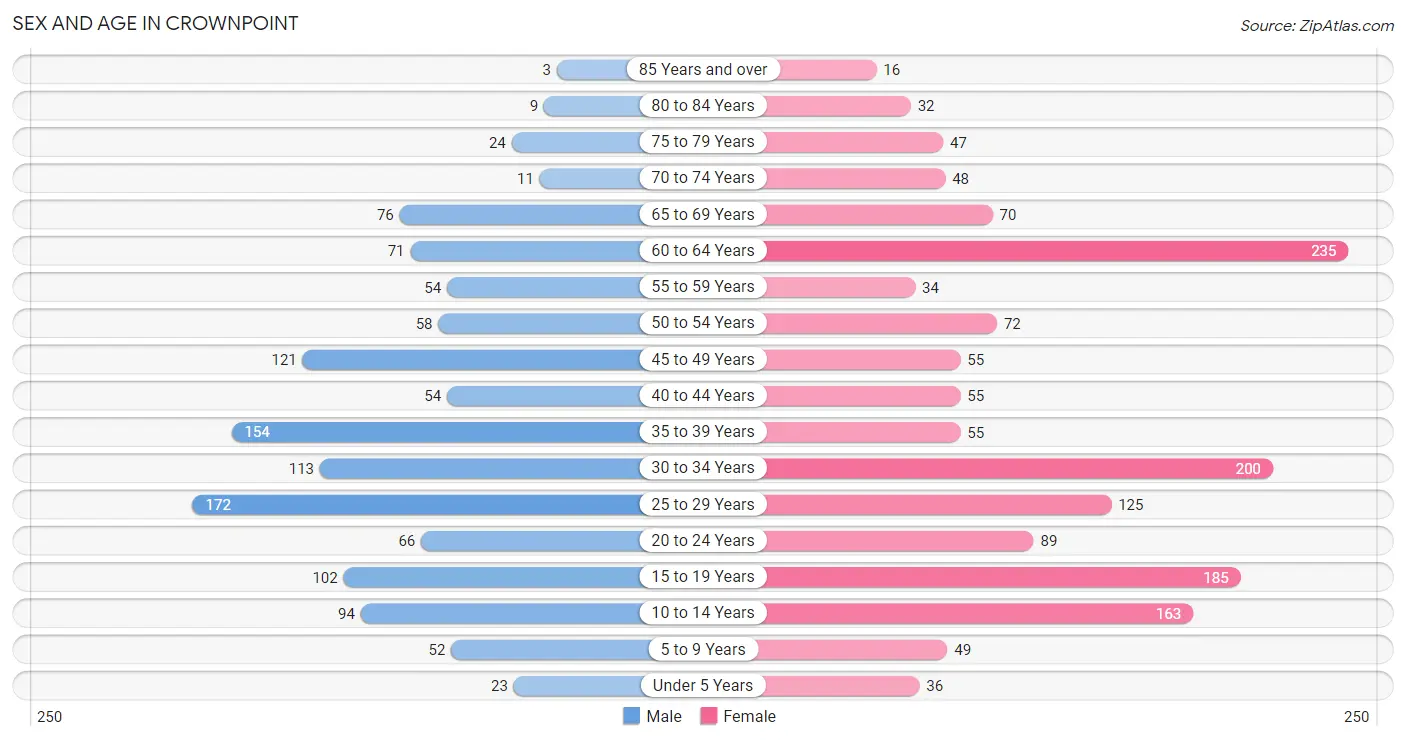
Sex and Age in Crownpoint
Sex and Age in Crownpoint
The most populous age groups in Crownpoint are 25 to 29 Years (172 | 13.7%) for men and 60 to 64 Years (235 | 15.0%) for women.
| Age Bracket | Male | Female |
| Under 5 Years | 23 (1.8%) | 36 (2.3%) |
| 5 to 9 Years | 52 (4.1%) | 49 (3.1%) |
| 10 to 14 Years | 94 (7.5%) | 163 (10.4%) |
| 15 to 19 Years | 102 (8.1%) | 185 (11.8%) |
| 20 to 24 Years | 66 (5.2%) | 89 (5.7%) |
| 25 to 29 Years | 172 (13.7%) | 125 (8.0%) |
| 30 to 34 Years | 113 (9.0%) | 200 (12.8%) |
| 35 to 39 Years | 154 (12.2%) | 55 (3.5%) |
| 40 to 44 Years | 54 (4.3%) | 55 (3.5%) |
| 45 to 49 Years | 121 (9.6%) | 55 (3.5%) |
| 50 to 54 Years | 58 (4.6%) | 72 (4.6%) |
| 55 to 59 Years | 54 (4.3%) | 34 (2.2%) |
| 60 to 64 Years | 71 (5.7%) | 235 (15.0%) |
| 65 to 69 Years | 76 (6.0%) | 70 (4.5%) |
| 70 to 74 Years | 11 (0.9%) | 48 (3.1%) |
| 75 to 79 Years | 24 (1.9%) | 47 (3.0%) |
| 80 to 84 Years | 9 (0.7%) | 32 (2.0%) |
| 85 Years and over | 3 (0.2%) | 16 (1.0%) |
| Total | 1,257 (100.0%) | 1,566 (100.0%) |
Families and Households in Crownpoint
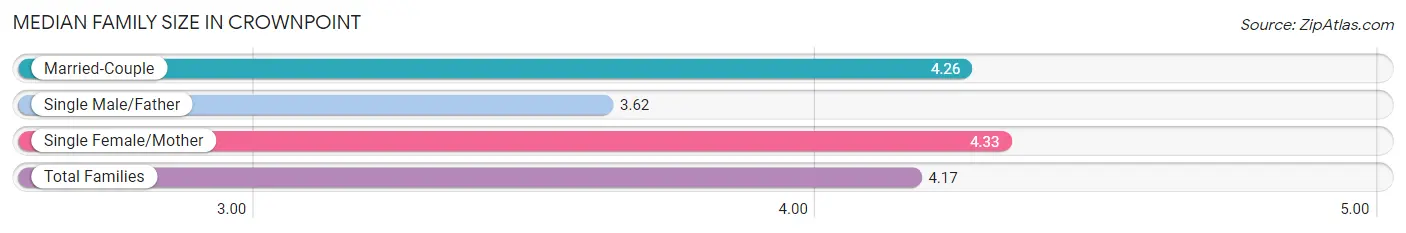
Median Family Size in Crownpoint
The median family size in Crownpoint is 4.17 persons per family, with single female/mother families (258 | 49.2%) accounting for the largest median family size of 4.33 persons per family. On the other hand, single male/father families (103 | 19.7%) represent the smallest median family size with 3.62 persons per family.
| Family Type | # Families | Family Size |
| Married-Couple | 163 (31.1%) | 4.26 |
| Single Male/Father | 103 (19.7%) | 3.62 |
| Single Female/Mother | 258 (49.2%) | 4.33 |
| Total Families | 524 (100.0%) | 4.17 |
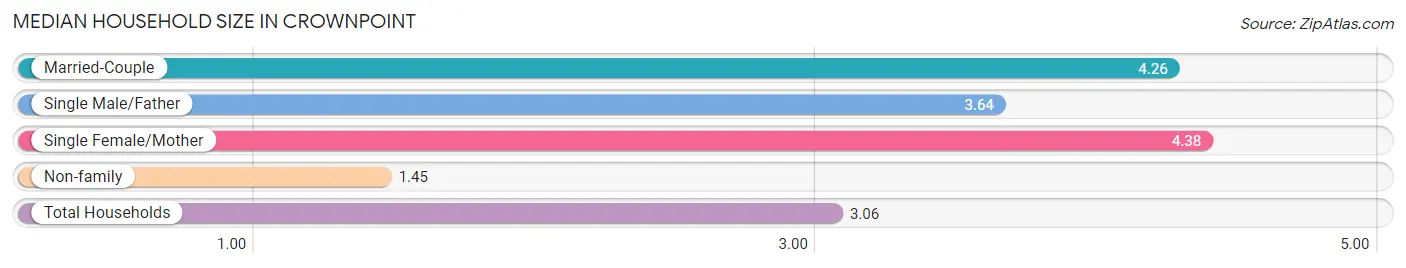
Median Household Size in Crownpoint
The median household size in Crownpoint is 3.06 persons per household, with single female/mother households (258 | 28.9%) accounting for the largest median household size of 4.38 persons per household. non-family households (369 | 41.3%) represent the smallest median household size with 1.45 persons per household.
| Household Type | # Households | Household Size |
| Married-Couple | 163 (18.2%) | 4.26 |
| Single Male/Father | 103 (11.5%) | 3.64 |
| Single Female/Mother | 258 (28.9%) | 4.38 |
| Non-family | 369 (41.3%) | 1.45 |
| Total Households | 893 (100.0%) | 3.06 |
Household Size by Marriage Status in Crownpoint
Out of a total of 893 households in Crownpoint, 524 (58.7%) are family households, while 369 (41.3%) are nonfamily households. The most numerous type of family households are 4-person households, comprising 177, and the most common type of nonfamily households are 1-person households, comprising 318.
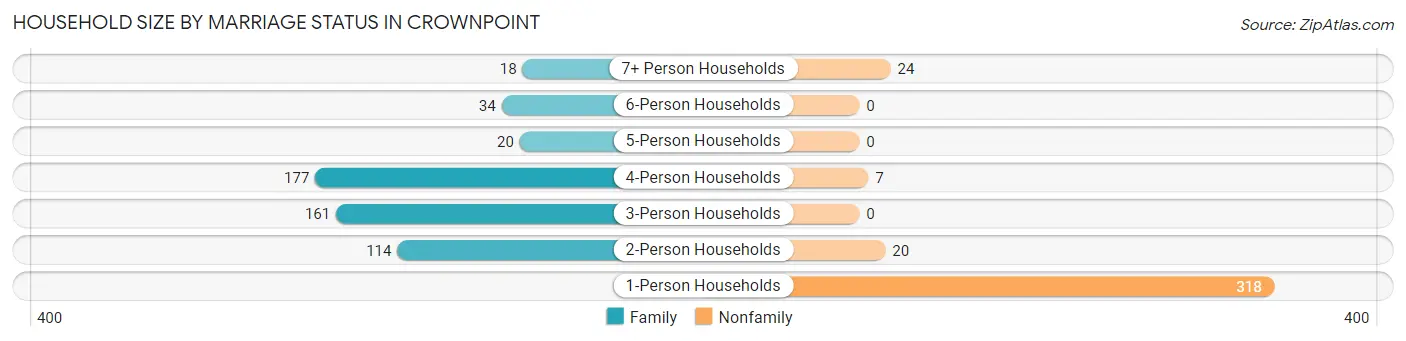
| Household Size | Family Households | Nonfamily Households |
| 1-Person Households | - | 318 (35.6%) |
| 2-Person Households | 114 (12.8%) | 20 (2.2%) |
| 3-Person Households | 161 (18.0%) | 0 (0.0%) |
| 4-Person Households | 177 (19.8%) | 7 (0.8%) |
| 5-Person Households | 20 (2.2%) | 0 (0.0%) |
| 6-Person Households | 34 (3.8%) | 0 (0.0%) |
| 7+ Person Households | 18 (2.0%) | 24 (2.7%) |
| Total | 524 (58.7%) | 369 (41.3%) |
Female Fertility in Crownpoint
Fertility by Age in Crownpoint
Average fertility rate in Crownpoint is 10.0 births per 1,000 women. Women in the age bracket of 20 to 34 years have the highest fertility rate with 19.0 births per 1,000 women. Women in the age bracket of 20 to 34 years acount for 100.0% of all women with births.
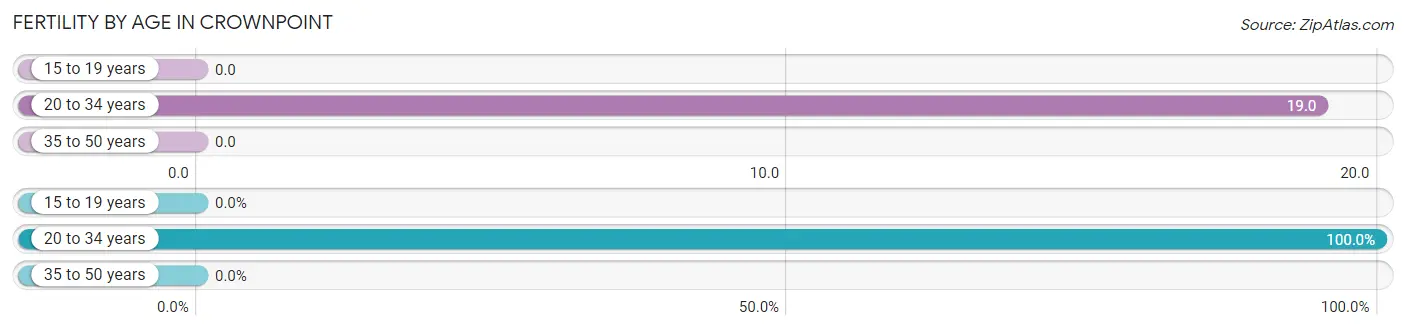
| Age Bracket | Women with Births | Births / 1,000 Women |
| 15 to 19 years | 0 (0.0%) | 0.0 |
| 20 to 34 years | 8 (100.0%) | 19.0 |
| 35 to 50 years | 0 (0.0%) | 0.0 |
| Total | 8 (100.0%) | 10.0 |
Fertility by Age by Marriage Status in Crownpoint
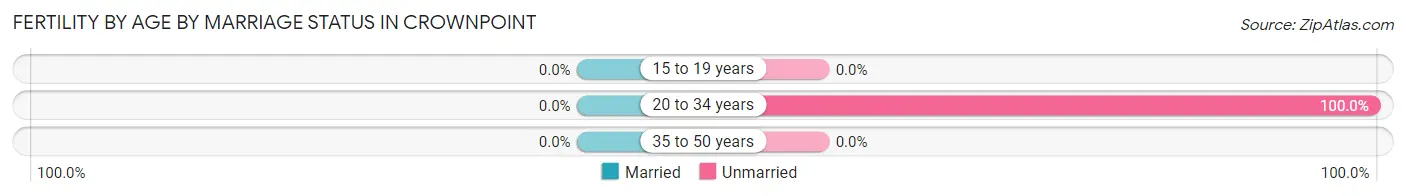
| Age Bracket | Married | Unmarried |
| 15 to 19 years | 0 (0.0%) | 0 (0.0%) |
| 20 to 34 years | 0 (0.0%) | 8 (100.0%) |
| 35 to 50 years | 0 (0.0%) | 0 (0.0%) |
| Total | 0 (0.0%) | 8 (100.0%) |
Fertility by Education in Crownpoint
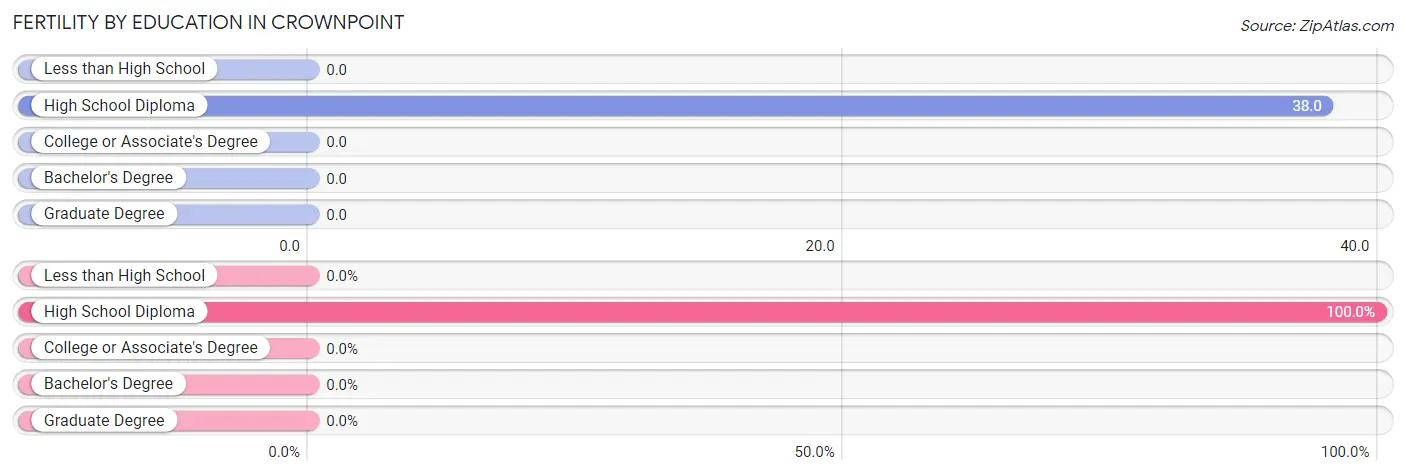
| Educational Attainment | Women with Births | Births / 1,000 Women |
| Less than High School | 0 (0.0%) | 0.0 |
| High School Diploma | 8 (100.0%) | 38.0 |
| College or Associate's Degree | 0 (0.0%) | 0.0 |
| Bachelor's Degree | 0 (0.0%) | 0.0 |
| Graduate Degree | 0 (0.0%) | 0.0 |
| Total | 8 (100.0%) | 10.0 |
Fertility by Education by Marriage Status in Crownpoint
| Educational Attainment | Married | Unmarried |
| Less than High School | 0 (0.0%) | 0 (0.0%) |
| High School Diploma | 0 (0.0%) | 8 (100.0%) |
| College or Associate's Degree | 0 (0.0%) | 0 (0.0%) |
| Bachelor's Degree | 0 (0.0%) | 0 (0.0%) |
| Graduate Degree | 0 (0.0%) | 0 (0.0%) |
| Total | 0 (0.0%) | 8 (100.0%) |
Employment Characteristics in Crownpoint
Employment by Class of Employer in Crownpoint
Among the 994 employed individuals in Crownpoint, private company employees (441 | 44.4%), federal government employees (258 | 26.0%), and local government employees (106 | 10.7%) make up the most common classes of employment.
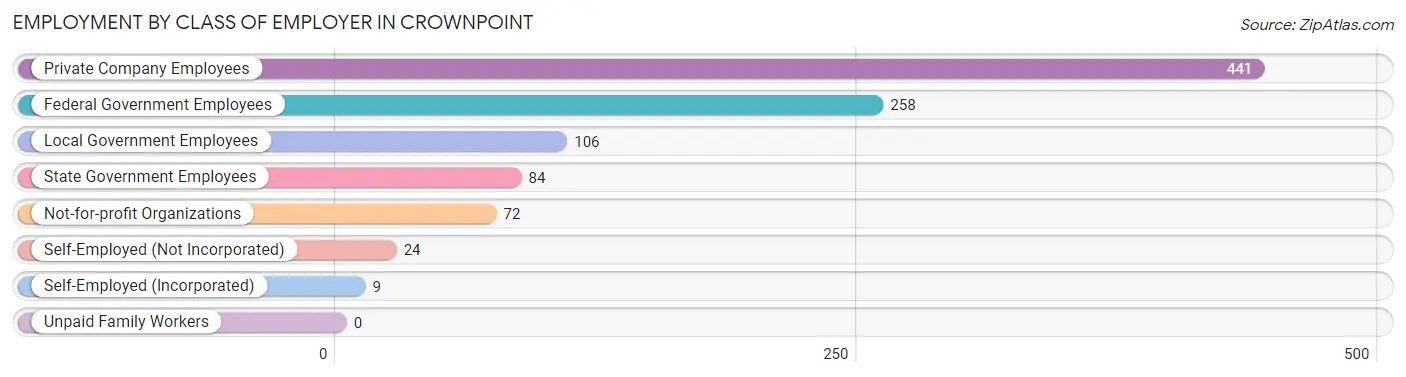
| Employer Class | # Employees | % Employees |
| Private Company Employees | 441 | 44.4% |
| Self-Employed (Incorporated) | 9 | 0.9% |
| Self-Employed (Not Incorporated) | 24 | 2.4% |
| Not-for-profit Organizations | 72 | 7.2% |
| Local Government Employees | 106 | 10.7% |
| State Government Employees | 84 | 8.5% |
| Federal Government Employees | 258 | 26.0% |
| Unpaid Family Workers | 0 | 0.0% |
| Total | 994 | 100.0% |
Employment Status by Age in Crownpoint
According to the labor force statistics for Crownpoint, out of the total population over 16 years of age (2,336), 48.8% or 1,140 individuals are in the labor force, with 12.8% or 146 of them unemployed. The age group with the highest labor force participation rate is 45 to 54 years, with 78.4% or 240 individuals in the labor force. Within the labor force, the 35 to 44 years age range has the highest percentage of unemployed individuals, with 37.3% or 69 of them being unemployed.
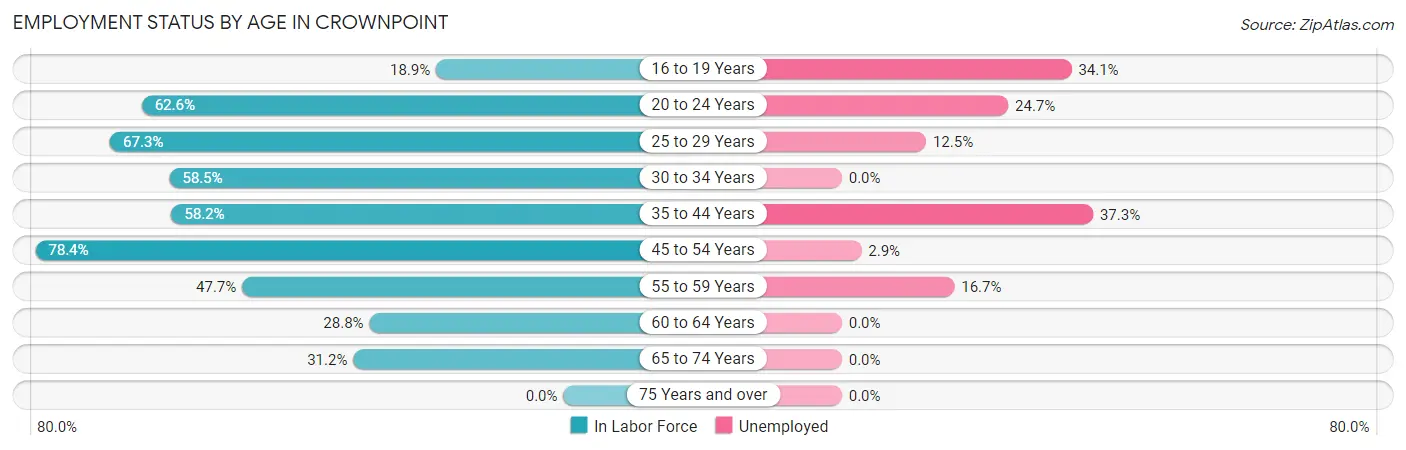
| Age Bracket | In Labor Force | Unemployed |
| 16 to 19 Years | 41 (18.9%) | 14 (34.1%) |
| 20 to 24 Years | 97 (62.6%) | 24 (24.7%) |
| 25 to 29 Years | 200 (67.3%) | 25 (12.5%) |
| 30 to 34 Years | 183 (58.5%) | 0 (0.0%) |
| 35 to 44 Years | 185 (58.2%) | 69 (37.3%) |
| 45 to 54 Years | 240 (78.4%) | 7 (2.9%) |
| 55 to 59 Years | 42 (47.7%) | 7 (16.7%) |
| 60 to 64 Years | 88 (28.8%) | 0 (0.0%) |
| 65 to 74 Years | 64 (31.2%) | 0 (0.0%) |
| 75 Years and over | 0 (0.0%) | 0 (0.0%) |
| Total | 1,140 (48.8%) | 146 (12.8%) |
Employment Status by Educational Attainment in Crownpoint
According to labor force statistics for Crownpoint, 57.6% of individuals (938) out of the total population between 25 and 64 years of age (1,628) are in the labor force, with 11.5% or 108 of them being unemployed. The group with the highest labor force participation rate are those with the educational attainment of bachelor's degree or higher, with 80.6% or 158 individuals in the labor force. Within the labor force, individuals with high school diploma education have the highest percentage of unemployment, with 17.2% or 55 of them being unemployed.
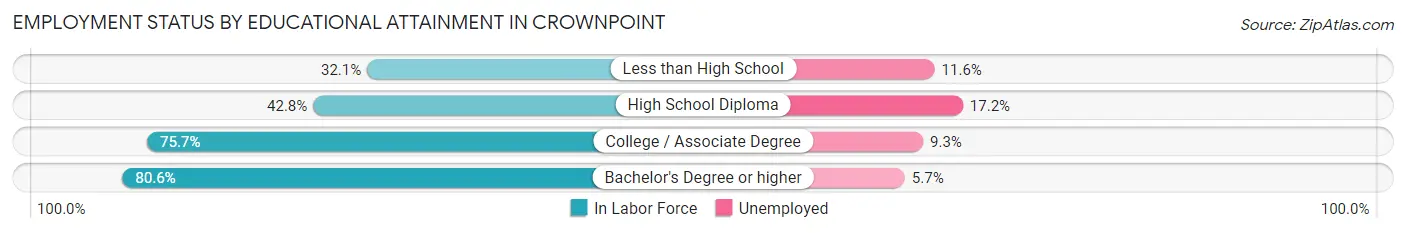
| Educational Attainment | In Labor Force | Unemployed |
| Less than High School | 43 (32.1%) | 16 (11.6%) |
| High School Diploma | 319 (42.8%) | 128 (17.2%) |
| College / Associate Degree | 418 (75.7%) | 51 (9.3%) |
| Bachelor's Degree or higher | 158 (80.6%) | 11 (5.7%) |
| Total | 938 (57.6%) | 187 (11.5%) |
Employment Occupations by Sex in Crownpoint
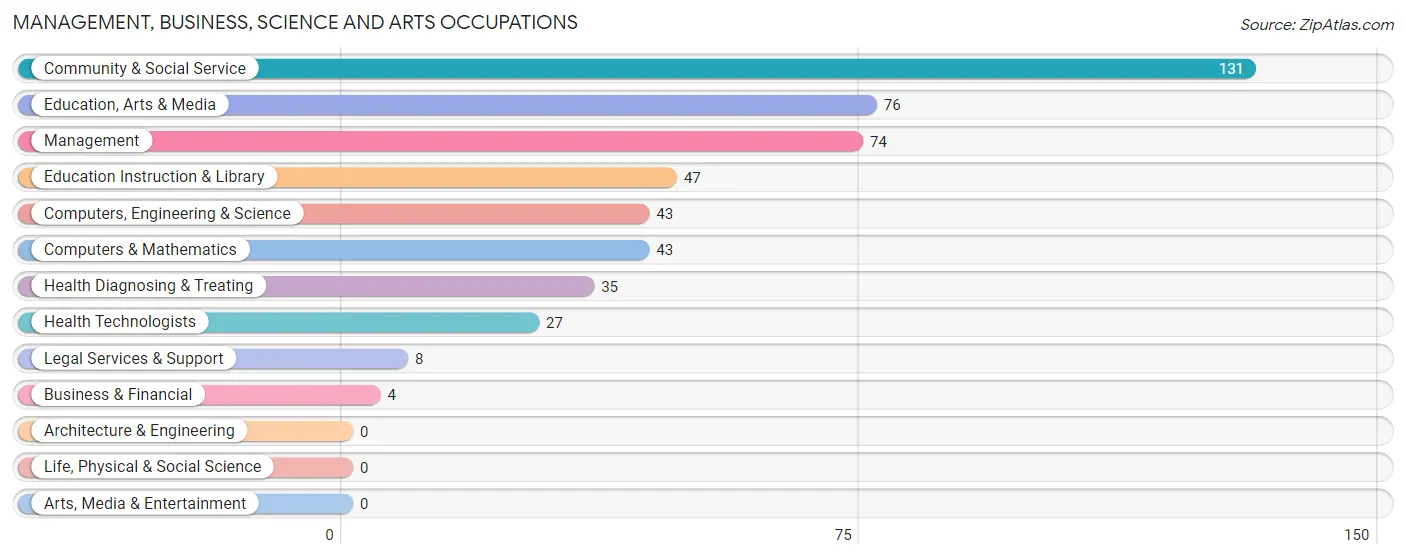
Management, Business, Science and Arts Occupations
The most common Management, Business, Science and Arts occupations in Crownpoint are Community & Social Service (131 | 13.2%), Education, Arts & Media (76 | 7.6%), Management (74 | 7.4%), Education Instruction & Library (47 | 4.7%), and Computers, Engineering & Science (43 | 4.3%).
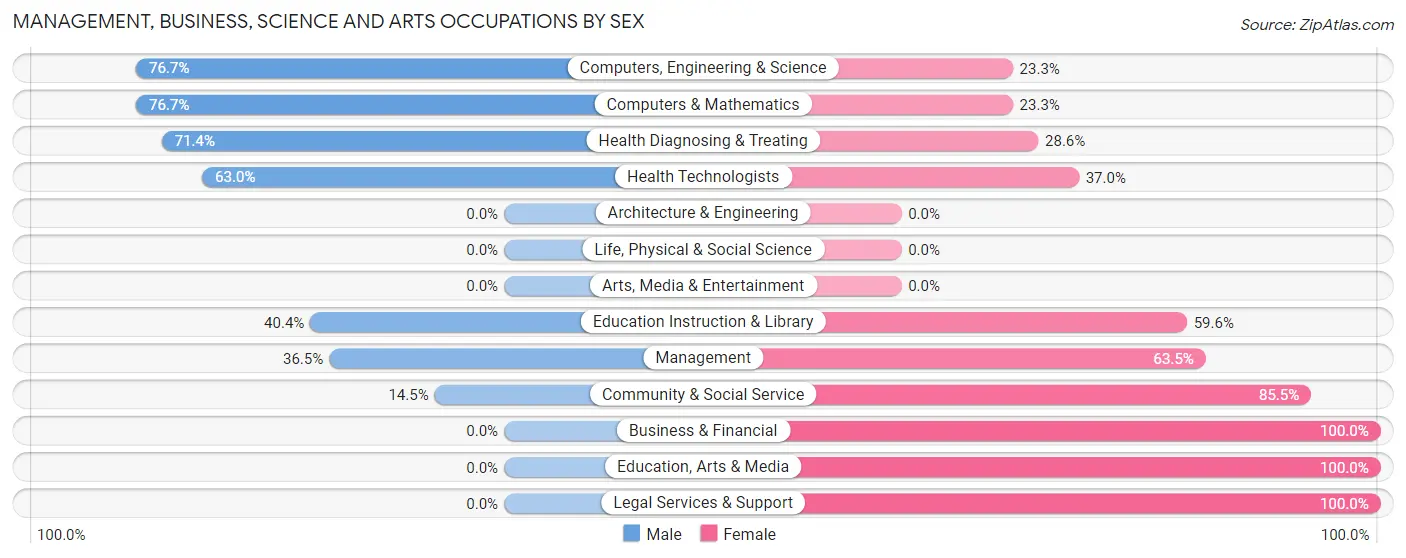
Management, Business, Science and Arts Occupations by Sex
Within the Management, Business, Science and Arts occupations in Crownpoint, the most male-oriented occupations are Computers, Engineering & Science (76.7%), Computers & Mathematics (76.7%), and Health Diagnosing & Treating (71.4%), while the most female-oriented occupations are Business & Financial (100.0%), Education, Arts & Media (100.0%), and Legal Services & Support (100.0%).
| Occupation | Male | Female |
| Management | 27 (36.5%) | 47 (63.5%) |
| Business & Financial | 0 (0.0%) | 4 (100.0%) |
| Computers, Engineering & Science | 33 (76.7%) | 10 (23.3%) |
| Computers & Mathematics | 33 (76.7%) | 10 (23.3%) |
| Architecture & Engineering | 0 (0.0%) | 0 (0.0%) |
| Life, Physical & Social Science | 0 (0.0%) | 0 (0.0%) |
| Community & Social Service | 19 (14.5%) | 112 (85.5%) |
| Education, Arts & Media | 0 (0.0%) | 76 (100.0%) |
| Legal Services & Support | 0 (0.0%) | 8 (100.0%) |
| Education Instruction & Library | 19 (40.4%) | 28 (59.6%) |
| Arts, Media & Entertainment | 0 (0.0%) | 0 (0.0%) |
| Health Diagnosing & Treating | 25 (71.4%) | 10 (28.6%) |
| Health Technologists | 17 (63.0%) | 10 (37.0%) |
| Total (Category) | 104 (36.2%) | 183 (63.8%) |
| Total (Overall) | 448 (45.1%) | 546 (54.9%) |
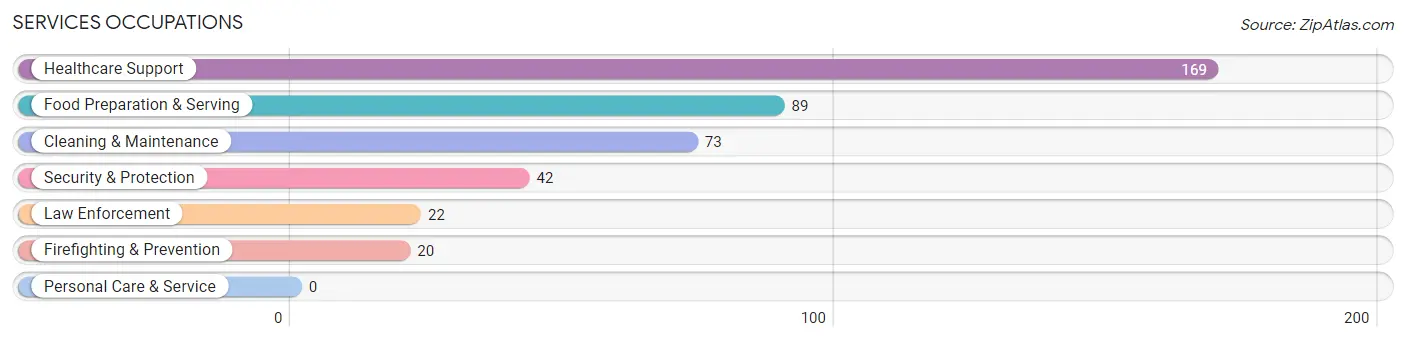
Services Occupations
The most common Services occupations in Crownpoint are Healthcare Support (169 | 17.0%), Food Preparation & Serving (89 | 8.9%), Cleaning & Maintenance (73 | 7.3%), Security & Protection (42 | 4.2%), and Law Enforcement (22 | 2.2%).
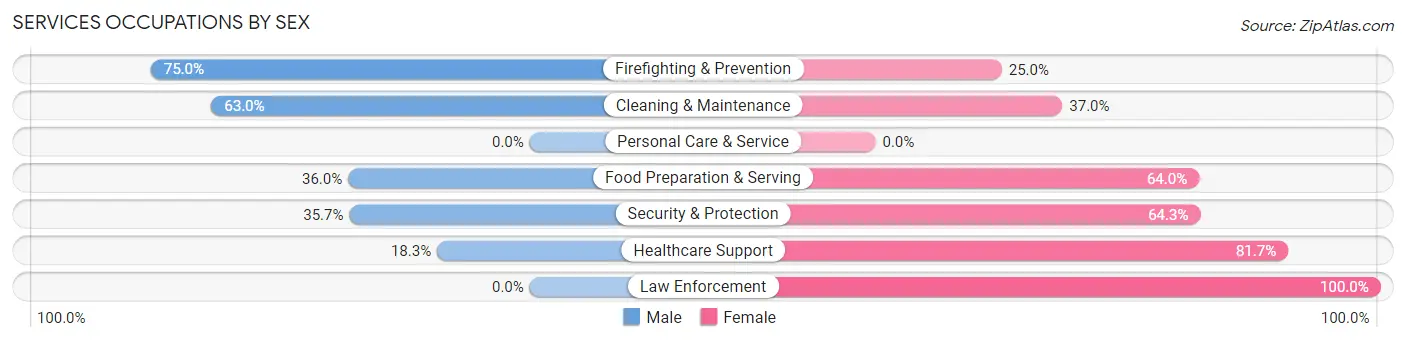
Services Occupations by Sex
Within the Services occupations in Crownpoint, the most male-oriented occupations are Firefighting & Prevention (75.0%), Cleaning & Maintenance (63.0%), and Food Preparation & Serving (36.0%), while the most female-oriented occupations are Law Enforcement (100.0%), Healthcare Support (81.7%), and Security & Protection (64.3%).
| Occupation | Male | Female |
| Healthcare Support | 31 (18.3%) | 138 (81.7%) |
| Security & Protection | 15 (35.7%) | 27 (64.3%) |
| Firefighting & Prevention | 15 (75.0%) | 5 (25.0%) |
| Law Enforcement | 0 (0.0%) | 22 (100.0%) |
| Food Preparation & Serving | 32 (36.0%) | 57 (64.0%) |
| Cleaning & Maintenance | 46 (63.0%) | 27 (37.0%) |
| Personal Care & Service | 0 (0.0%) | 0 (0.0%) |
| Total (Category) | 124 (33.2%) | 249 (66.8%) |
| Total (Overall) | 448 (45.1%) | 546 (54.9%) |
Sales and Office Occupations
The most common Sales and Office occupations in Crownpoint are Sales & Related (100 | 10.1%), and Office & Administration (81 | 8.2%).
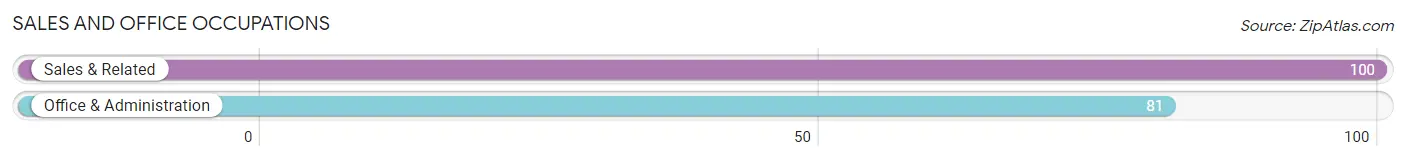
Sales and Office Occupations by Sex
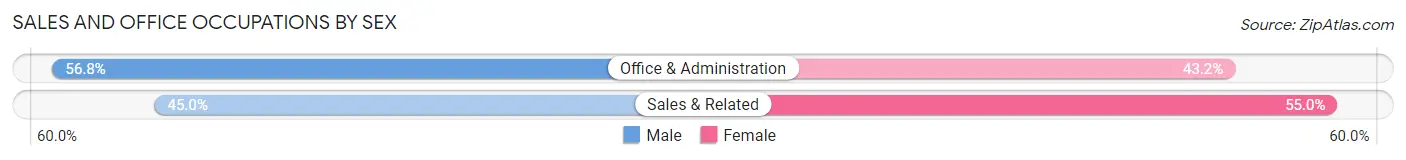
| Occupation | Male | Female |
| Sales & Related | 45 (45.0%) | 55 (55.0%) |
| Office & Administration | 46 (56.8%) | 35 (43.2%) |
| Total (Category) | 91 (50.3%) | 90 (49.7%) |
| Total (Overall) | 448 (45.1%) | 546 (54.9%) |
Natural Resources, Construction and Maintenance Occupations
The most common Natural Resources, Construction and Maintenance occupations in Crownpoint are Construction & Extraction (49 | 4.9%), and Installation, Maintenance & Repair (34 | 3.4%).
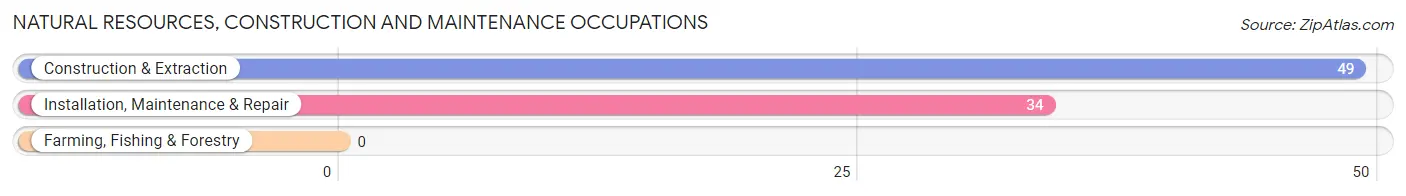
Natural Resources, Construction and Maintenance Occupations by Sex
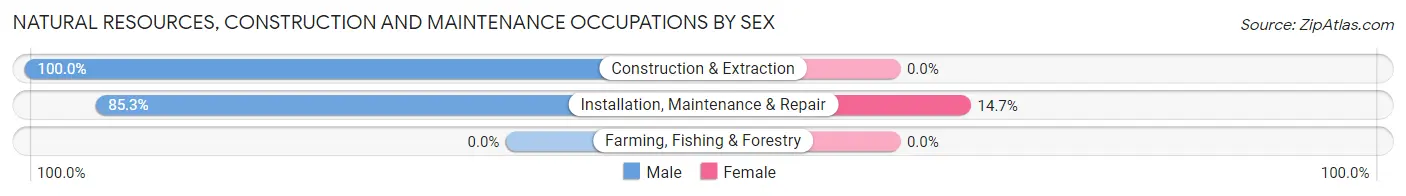
| Occupation | Male | Female |
| Farming, Fishing & Forestry | 0 (0.0%) | 0 (0.0%) |
| Construction & Extraction | 49 (100.0%) | 0 (0.0%) |
| Installation, Maintenance & Repair | 29 (85.3%) | 5 (14.7%) |
| Total (Category) | 78 (94.0%) | 5 (6.0%) |
| Total (Overall) | 448 (45.1%) | 546 (54.9%) |
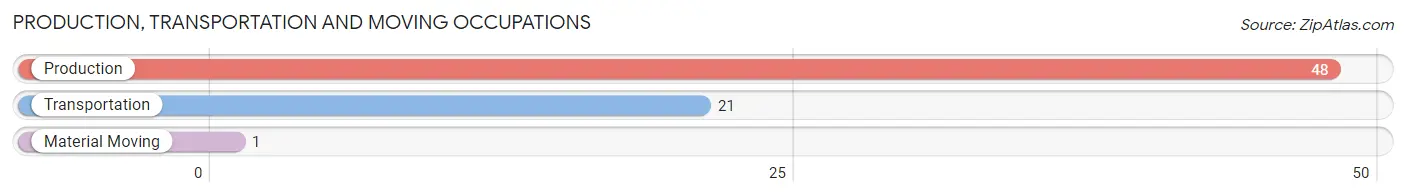
Production, Transportation and Moving Occupations
The most common Production, Transportation and Moving occupations in Crownpoint are Production (48 | 4.8%), Transportation (21 | 2.1%), and Material Moving (1 | 0.1%).
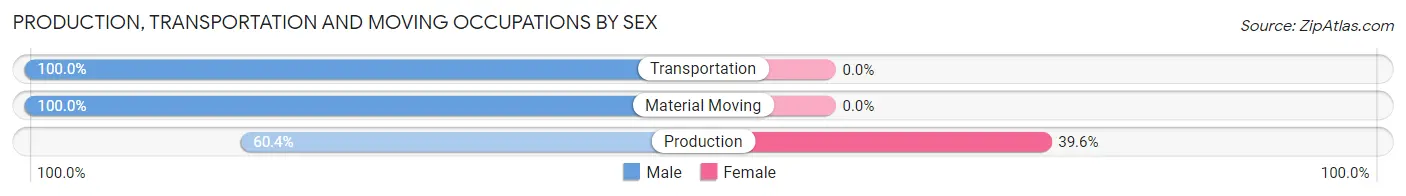
Production, Transportation and Moving Occupations by Sex
| Occupation | Male | Female |
| Production | 29 (60.4%) | 19 (39.6%) |
| Transportation | 21 (100.0%) | 0 (0.0%) |
| Material Moving | 1 (100.0%) | 0 (0.0%) |
| Total (Category) | 51 (72.9%) | 19 (27.1%) |
| Total (Overall) | 448 (45.1%) | 546 (54.9%) |
Employment Industries by Sex in Crownpoint
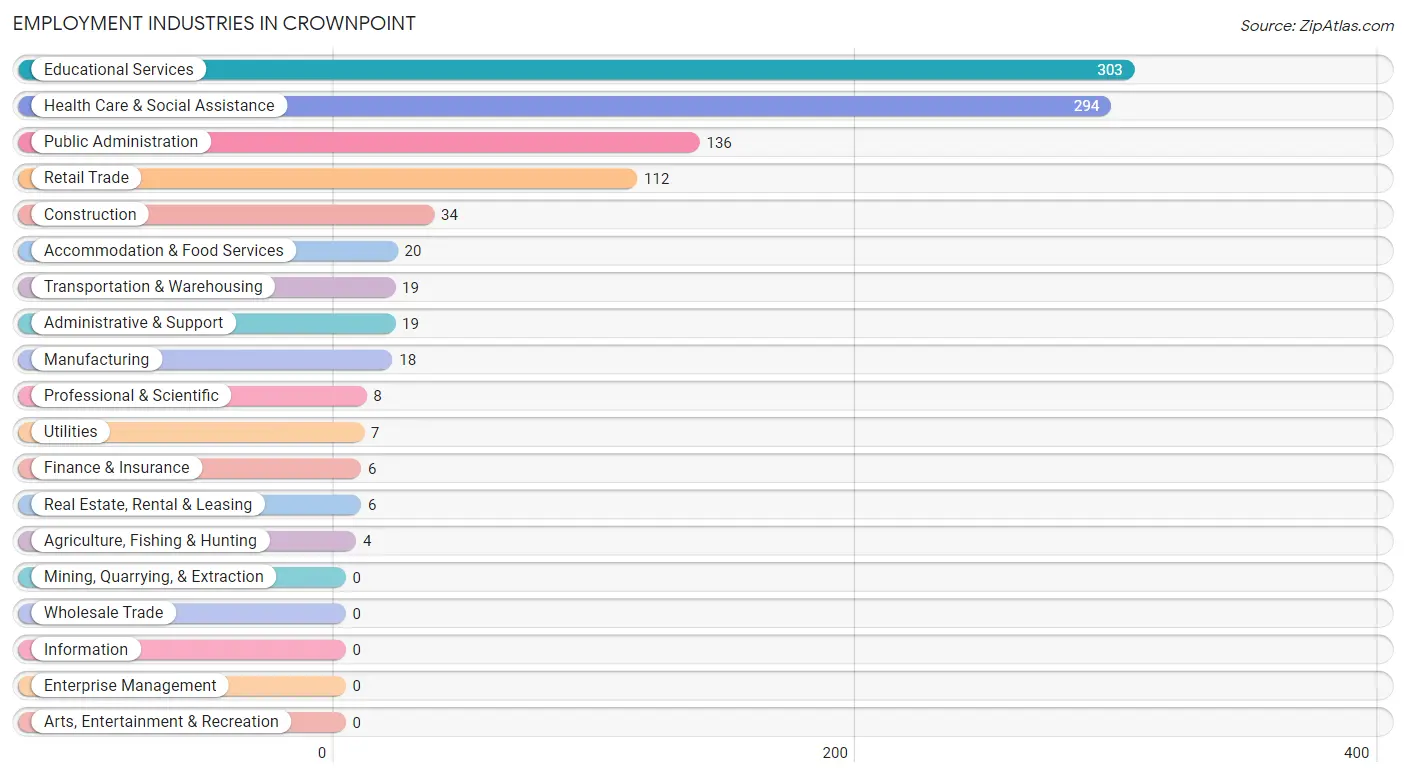
Employment Industries in Crownpoint
The major employment industries in Crownpoint include Educational Services (303 | 30.5%), Health Care & Social Assistance (294 | 29.6%), Public Administration (136 | 13.7%), Retail Trade (112 | 11.3%), and Construction (34 | 3.4%).
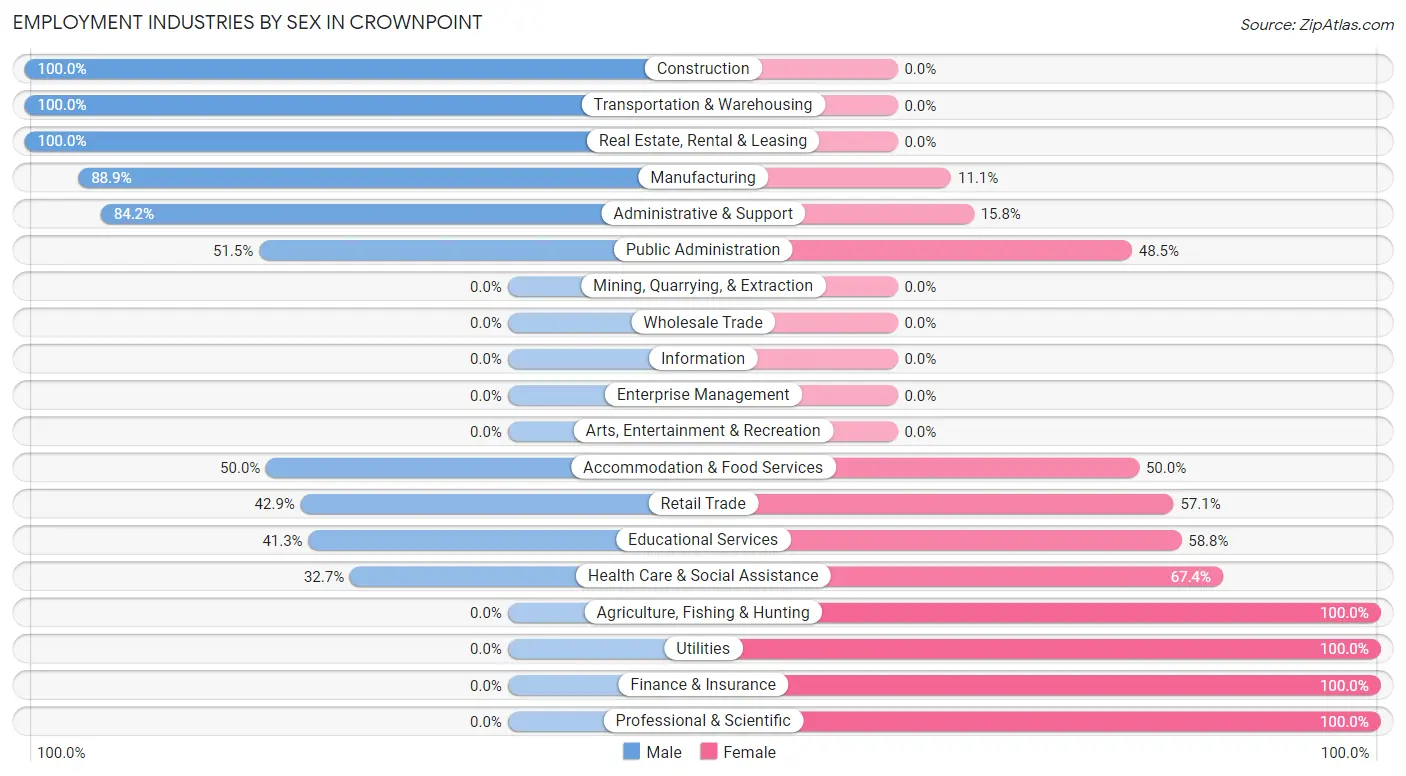
Employment Industries by Sex in Crownpoint
The Crownpoint industries that see more men than women are Construction (100.0%), Transportation & Warehousing (100.0%), and Real Estate, Rental & Leasing (100.0%), whereas the industries that tend to have a higher number of women are Agriculture, Fishing & Hunting (100.0%), Utilities (100.0%), and Finance & Insurance (100.0%).
| Industry | Male | Female |
| Agriculture, Fishing & Hunting | 0 (0.0%) | 4 (100.0%) |
| Mining, Quarrying, & Extraction | 0 (0.0%) | 0 (0.0%) |
| Construction | 34 (100.0%) | 0 (0.0%) |
| Manufacturing | 16 (88.9%) | 2 (11.1%) |
| Wholesale Trade | 0 (0.0%) | 0 (0.0%) |
| Retail Trade | 48 (42.9%) | 64 (57.1%) |
| Transportation & Warehousing | 19 (100.0%) | 0 (0.0%) |
| Utilities | 0 (0.0%) | 7 (100.0%) |
| Information | 0 (0.0%) | 0 (0.0%) |
| Finance & Insurance | 0 (0.0%) | 6 (100.0%) |
| Real Estate, Rental & Leasing | 6 (100.0%) | 0 (0.0%) |
| Professional & Scientific | 0 (0.0%) | 8 (100.0%) |
| Enterprise Management | 0 (0.0%) | 0 (0.0%) |
| Administrative & Support | 16 (84.2%) | 3 (15.8%) |
| Educational Services | 125 (41.2%) | 178 (58.8%) |
| Health Care & Social Assistance | 96 (32.7%) | 198 (67.3%) |
| Arts, Entertainment & Recreation | 0 (0.0%) | 0 (0.0%) |
| Accommodation & Food Services | 10 (50.0%) | 10 (50.0%) |
| Public Administration | 70 (51.5%) | 66 (48.5%) |
| Total | 448 (45.1%) | 546 (54.9%) |
Education in Crownpoint
School Enrollment in Crownpoint
The most common levels of schooling among the 787 students in Crownpoint are college / undergraduate (250 | 31.8%), middle school (228 | 29.0%), and high school (208 | 26.4%).
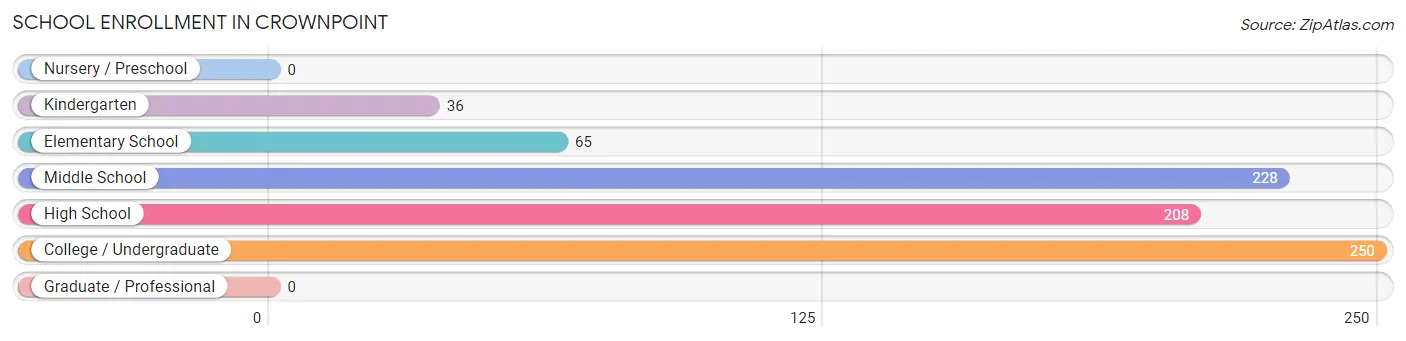
| School Level | # Students | % Students |
| Nursery / Preschool | 0 | 0.0% |
| Kindergarten | 36 | 4.6% |
| Elementary School | 65 | 8.3% |
| Middle School | 228 | 29.0% |
| High School | 208 | 26.4% |
| College / Undergraduate | 250 | 31.8% |
| Graduate / Professional | 0 | 0.0% |
| Total | 787 | 100.0% |
School Enrollment by Age by Funding Source in Crownpoint
Out of a total of 787 students who are enrolled in schools in Crownpoint, 17 (2.2%) attend a private institution, while the remaining 770 (97.8%) are enrolled in public schools. The age group of 18 to 19 year olds has the highest likelihood of being enrolled in private schools, with 17 (21.0% in the age bracket) enrolled. Conversely, the age group of 5 to 9 year old has the lowest likelihood of being enrolled in a private school, with 101 (100.0% in the age bracket) attending a public institution.
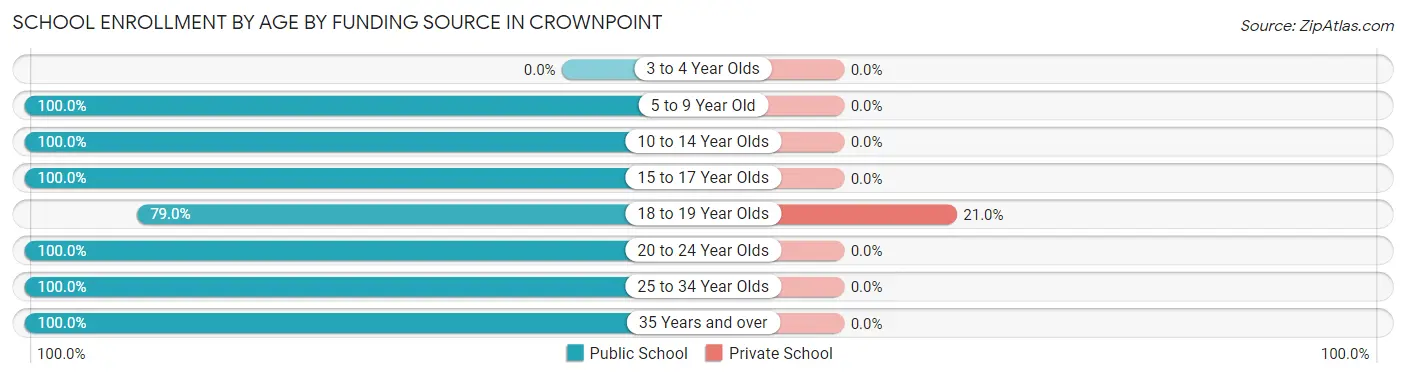
| Age Bracket | Public School | Private School |
| 3 to 4 Year Olds | 0 (0.0%) | 0 (0.0%) |
| 5 to 9 Year Old | 101 (100.0%) | 0 (0.0%) |
| 10 to 14 Year Olds | 249 (100.0%) | 0 (0.0%) |
| 15 to 17 Year Olds | 179 (100.0%) | 0 (0.0%) |
| 18 to 19 Year Olds | 64 (79.0%) | 17 (21.0%) |
| 20 to 24 Year Olds | 30 (100.0%) | 0 (0.0%) |
| 25 to 34 Year Olds | 105 (100.0%) | 0 (0.0%) |
| 35 Years and over | 42 (100.0%) | 0 (0.0%) |
| Total | 770 (97.8%) | 17 (2.2%) |
Educational Attainment by Field of Study in Crownpoint
Business (54 | 21.9%), education (54 | 21.9%), science & technology (51 | 20.6%), engineering (16 | 6.5%), and communications (13 | 5.3%) are the most common fields of study among 247 individuals in Crownpoint who have obtained a bachelor's degree or higher.
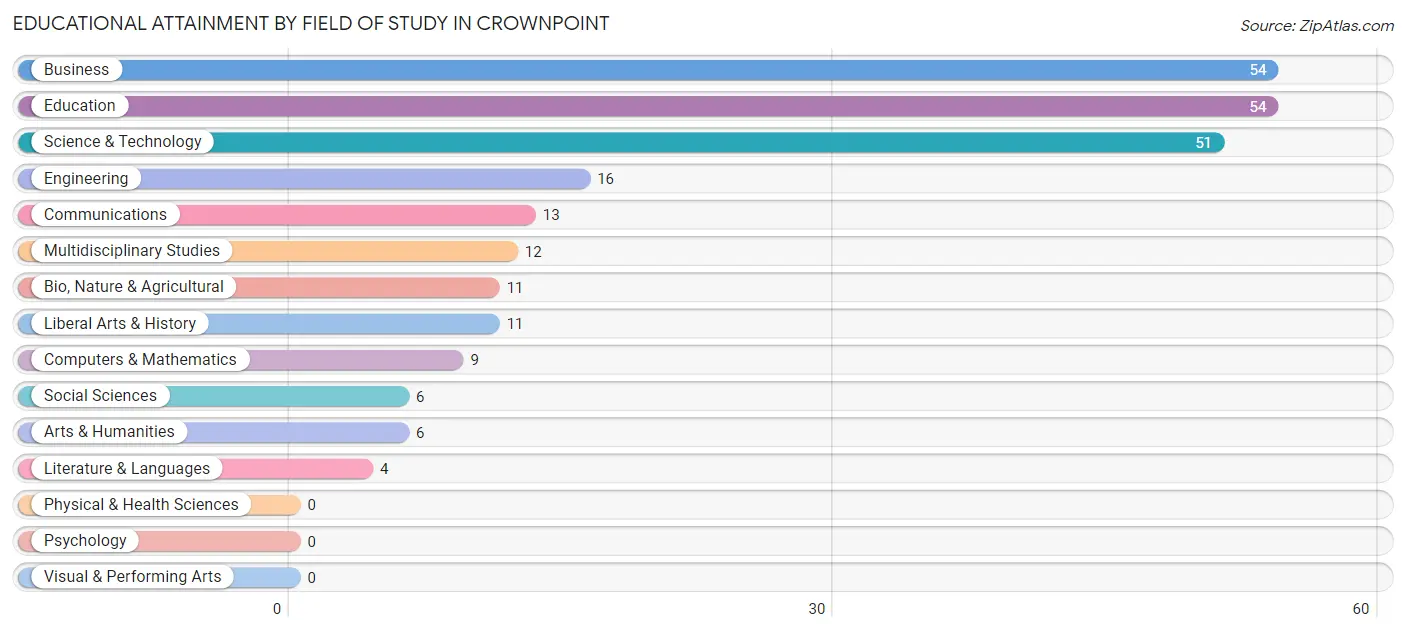
| Field of Study | # Graduates | % Graduates |
| Computers & Mathematics | 9 | 3.6% |
| Bio, Nature & Agricultural | 11 | 4.4% |
| Physical & Health Sciences | 0 | 0.0% |
| Psychology | 0 | 0.0% |
| Social Sciences | 6 | 2.4% |
| Engineering | 16 | 6.5% |
| Multidisciplinary Studies | 12 | 4.9% |
| Science & Technology | 51 | 20.6% |
| Business | 54 | 21.9% |
| Education | 54 | 21.9% |
| Literature & Languages | 4 | 1.6% |
| Liberal Arts & History | 11 | 4.4% |
| Visual & Performing Arts | 0 | 0.0% |
| Communications | 13 | 5.3% |
| Arts & Humanities | 6 | 2.4% |
| Total | 247 | 100.0% |
Transportation & Commute in Crownpoint
Vehicle Availability by Sex in Crownpoint
The most prevalent vehicle ownership categories in Crownpoint are males with 2 vehicles (145, accounting for 32.4%) and females with 2 vehicles (179, making up 27.7%).
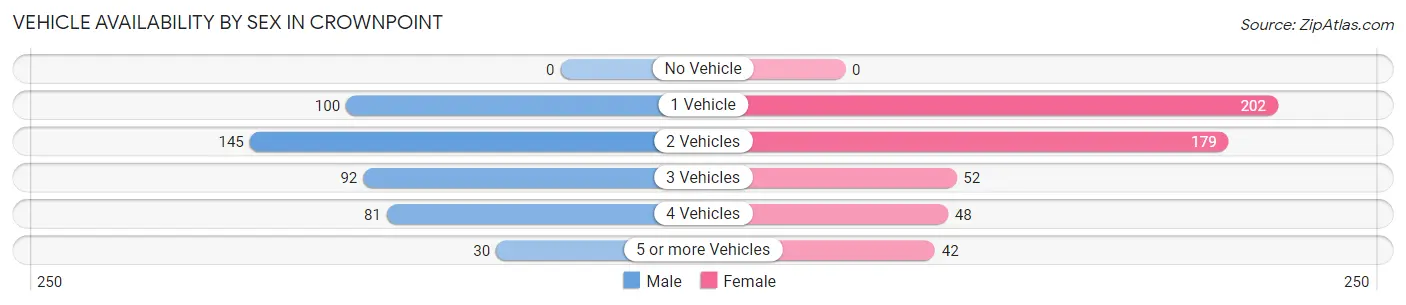
| Vehicles Available | Male | Female |
| No Vehicle | 0 (0.0%) | 0 (0.0%) |
| 1 Vehicle | 100 (22.3%) | 202 (38.6%) |
| 2 Vehicles | 145 (32.4%) | 179 (34.2%) |
| 3 Vehicles | 92 (20.5%) | 52 (9.9%) |
| 4 Vehicles | 81 (18.1%) | 48 (9.2%) |
| 5 or more Vehicles | 30 (6.7%) | 42 (8.0%) |
| Total | 448 (100.0%) | 523 (100.0%) |
Commute Time in Crownpoint
The most frequently occuring commute durations in Crownpoint are 5 to 9 minutes (278 commuters, 29.9%), 15 to 19 minutes (193 commuters, 20.7%), and 10 to 14 minutes (124 commuters, 13.3%).
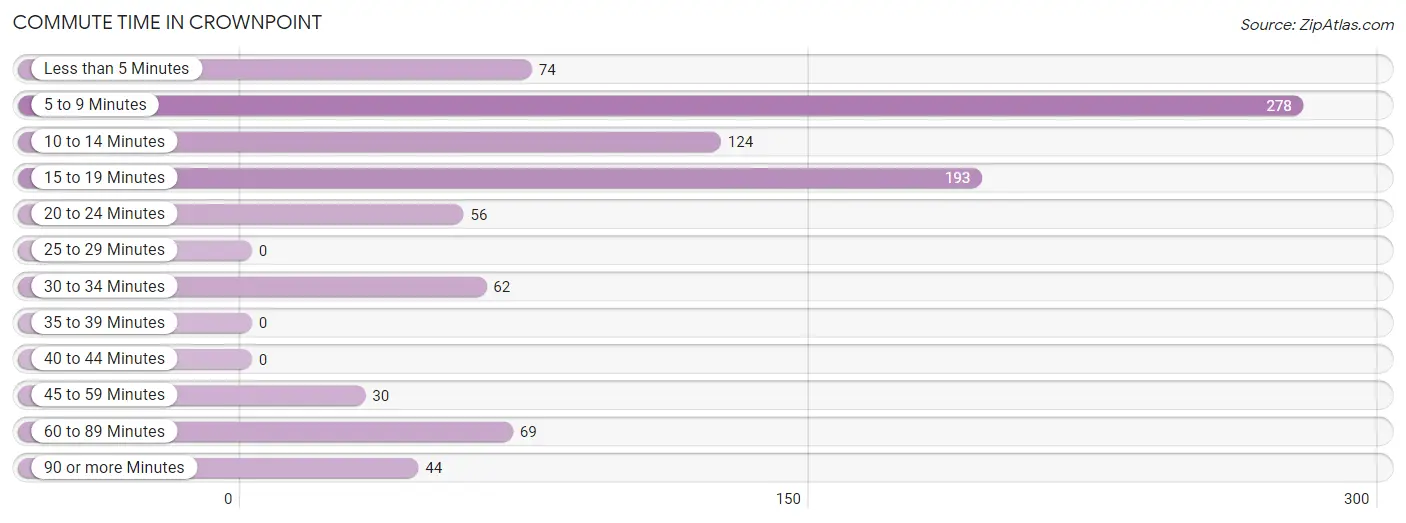
| Commute Time | # Commuters | % Commuters |
| Less than 5 Minutes | 74 | 8.0% |
| 5 to 9 Minutes | 278 | 29.9% |
| 10 to 14 Minutes | 124 | 13.3% |
| 15 to 19 Minutes | 193 | 20.7% |
| 20 to 24 Minutes | 56 | 6.0% |
| 25 to 29 Minutes | 0 | 0.0% |
| 30 to 34 Minutes | 62 | 6.7% |
| 35 to 39 Minutes | 0 | 0.0% |
| 40 to 44 Minutes | 0 | 0.0% |
| 45 to 59 Minutes | 30 | 3.2% |
| 60 to 89 Minutes | 69 | 7.4% |
| 90 or more Minutes | 44 | 4.7% |
Commute Time by Sex in Crownpoint
The most common commute times in Crownpoint are 10 to 14 minutes (94 commuters, 22.4%) for males and 5 to 9 minutes (194 commuters, 38.0%) for females.
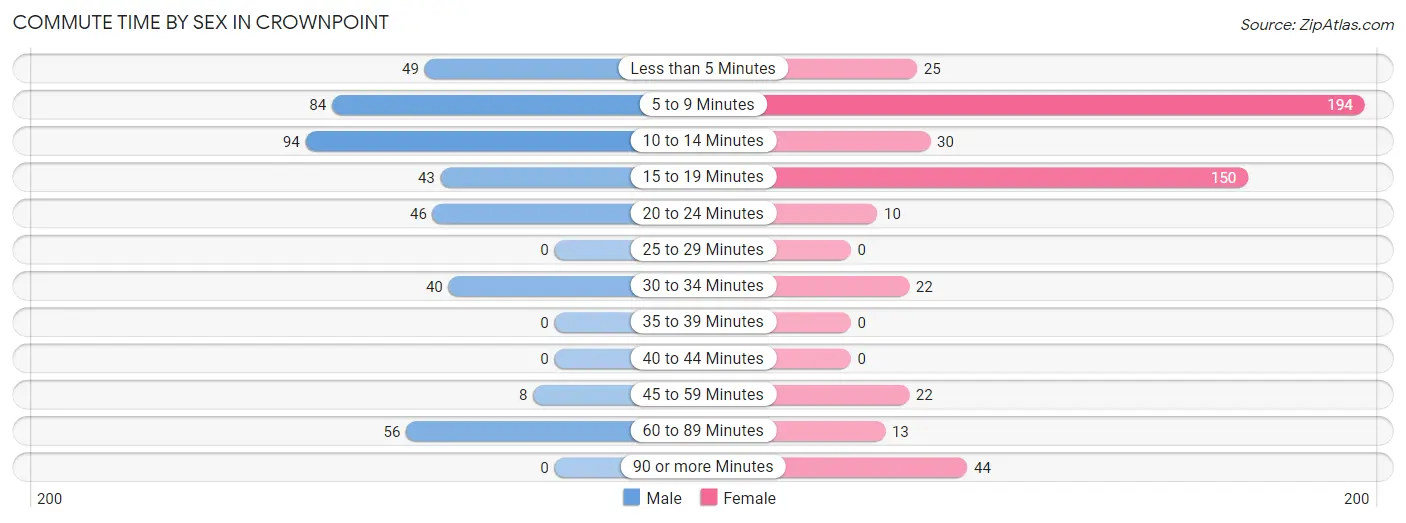
| Commute Time | Male | Female |
| Less than 5 Minutes | 49 (11.7%) | 25 (4.9%) |
| 5 to 9 Minutes | 84 (20.0%) | 194 (38.0%) |
| 10 to 14 Minutes | 94 (22.4%) | 30 (5.9%) |
| 15 to 19 Minutes | 43 (10.2%) | 150 (29.4%) |
| 20 to 24 Minutes | 46 (11.0%) | 10 (2.0%) |
| 25 to 29 Minutes | 0 (0.0%) | 0 (0.0%) |
| 30 to 34 Minutes | 40 (9.5%) | 22 (4.3%) |
| 35 to 39 Minutes | 0 (0.0%) | 0 (0.0%) |
| 40 to 44 Minutes | 0 (0.0%) | 0 (0.0%) |
| 45 to 59 Minutes | 8 (1.9%) | 22 (4.3%) |
| 60 to 89 Minutes | 56 (13.3%) | 13 (2.5%) |
| 90 or more Minutes | 0 (0.0%) | 44 (8.6%) |
Time of Departure to Work by Sex in Crownpoint
The most frequent times of departure to work in Crownpoint are 7:30 AM to 7:59 AM (186, 44.3%) for males and 7:30 AM to 7:59 AM (200, 39.2%) for females.
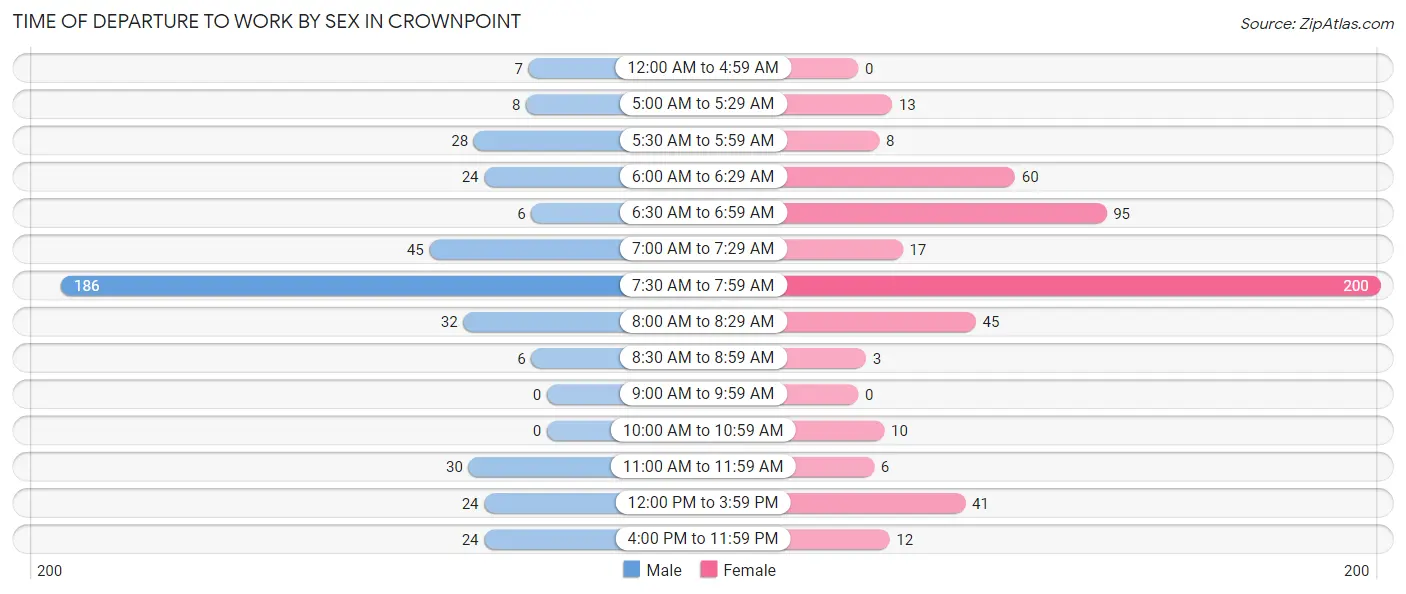
| Time of Departure | Male | Female |
| 12:00 AM to 4:59 AM | 7 (1.7%) | 0 (0.0%) |
| 5:00 AM to 5:29 AM | 8 (1.9%) | 13 (2.5%) |
| 5:30 AM to 5:59 AM | 28 (6.7%) | 8 (1.6%) |
| 6:00 AM to 6:29 AM | 24 (5.7%) | 60 (11.8%) |
| 6:30 AM to 6:59 AM | 6 (1.4%) | 95 (18.6%) |
| 7:00 AM to 7:29 AM | 45 (10.7%) | 17 (3.3%) |
| 7:30 AM to 7:59 AM | 186 (44.3%) | 200 (39.2%) |
| 8:00 AM to 8:29 AM | 32 (7.6%) | 45 (8.8%) |
| 8:30 AM to 8:59 AM | 6 (1.4%) | 3 (0.6%) |
| 9:00 AM to 9:59 AM | 0 (0.0%) | 0 (0.0%) |
| 10:00 AM to 10:59 AM | 0 (0.0%) | 10 (2.0%) |
| 11:00 AM to 11:59 AM | 30 (7.1%) | 6 (1.2%) |
| 12:00 PM to 3:59 PM | 24 (5.7%) | 41 (8.0%) |
| 4:00 PM to 11:59 PM | 24 (5.7%) | 12 (2.4%) |
| Total | 420 (100.0%) | 510 (100.0%) |
Housing Occupancy in Crownpoint
Occupancy by Ownership in Crownpoint
Of the total 893 dwellings in Crownpoint, owner-occupied units account for 476 (53.3%), while renter-occupied units make up 417 (46.7%).
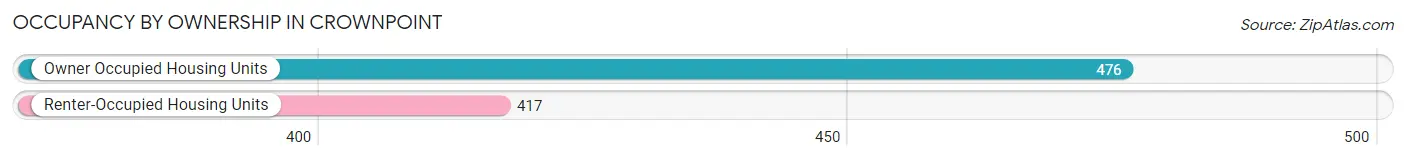
| Occupancy | # Housing Units | % Housing Units |
| Owner Occupied Housing Units | 476 | 53.3% |
| Renter-Occupied Housing Units | 417 | 46.7% |
| Total Occupied Housing Units | 893 | 100.0% |
Occupancy by Household Size in Crownpoint
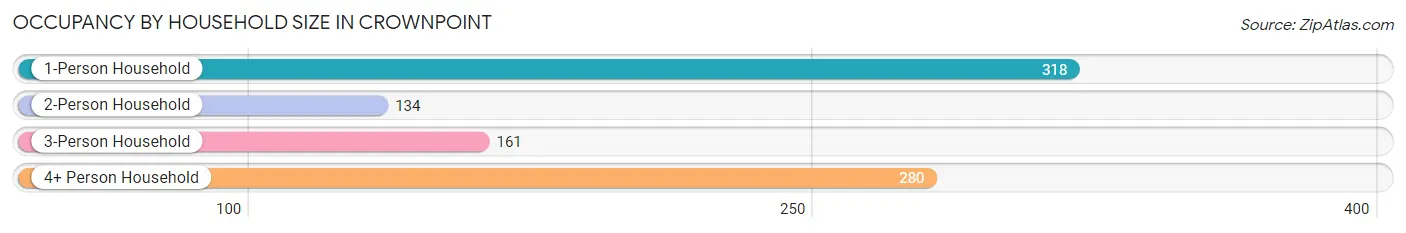
| Household Size | # Housing Units | % Housing Units |
| 1-Person Household | 318 | 35.6% |
| 2-Person Household | 134 | 15.0% |
| 3-Person Household | 161 | 18.0% |
| 4+ Person Household | 280 | 31.4% |
| Total Housing Units | 893 | 100.0% |
Occupancy by Ownership by Household Size in Crownpoint
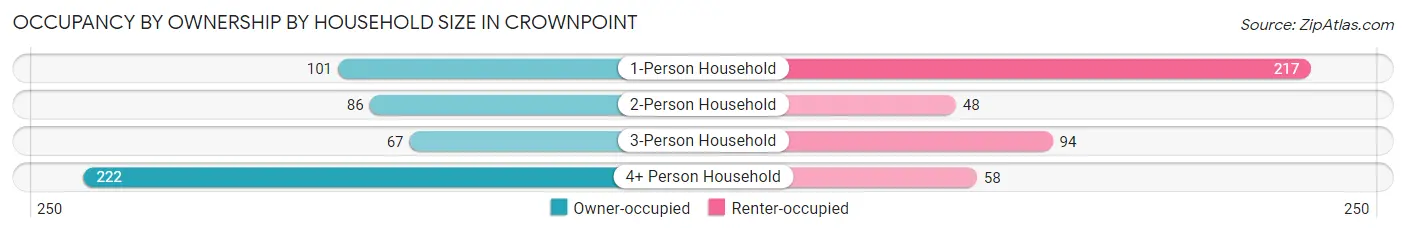
| Household Size | Owner-occupied | Renter-occupied |
| 1-Person Household | 101 (31.8%) | 217 (68.2%) |
| 2-Person Household | 86 (64.2%) | 48 (35.8%) |
| 3-Person Household | 67 (41.6%) | 94 (58.4%) |
| 4+ Person Household | 222 (79.3%) | 58 (20.7%) |
| Total Housing Units | 476 (53.3%) | 417 (46.7%) |
Occupancy by Educational Attainment in Crownpoint
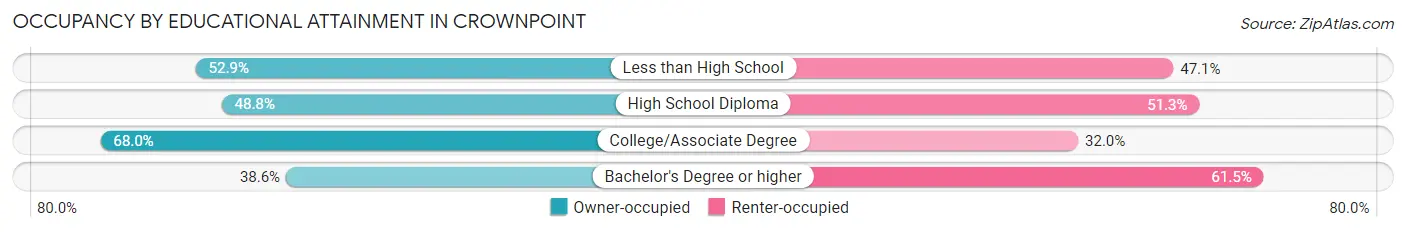
| Household Size | Owner-occupied | Renter-occupied |
| Less than High School | 46 (52.9%) | 41 (47.1%) |
| High School Diploma | 175 (48.7%) | 184 (51.2%) |
| College/Associate Degree | 191 (68.0%) | 90 (32.0%) |
| Bachelor's Degree or higher | 64 (38.6%) | 102 (61.5%) |
Occupancy by Age of Householder in Crownpoint
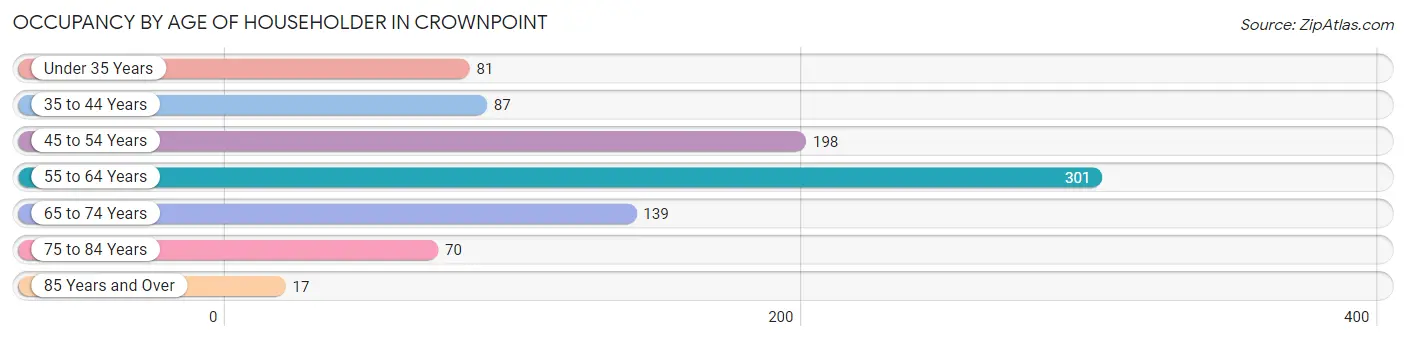
| Age Bracket | # Households | % Households |
| Under 35 Years | 81 | 9.1% |
| 35 to 44 Years | 87 | 9.7% |
| 45 to 54 Years | 198 | 22.2% |
| 55 to 64 Years | 301 | 33.7% |
| 65 to 74 Years | 139 | 15.6% |
| 75 to 84 Years | 70 | 7.8% |
| 85 Years and Over | 17 | 1.9% |
| Total | 893 | 100.0% |
Housing Finances in Crownpoint
Median Income by Occupancy in Crownpoint
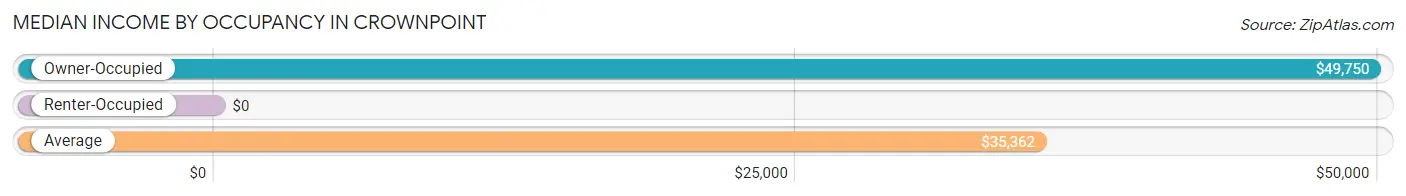
| Occupancy Type | # Households | Median Income |
| Owner-Occupied | 476 (53.3%) | $49,750 |
| Renter-Occupied | 417 (46.7%) | $0 |
| Average | 893 (100.0%) | $35,362 |
Occupancy by Householder Income Bracket in Crownpoint
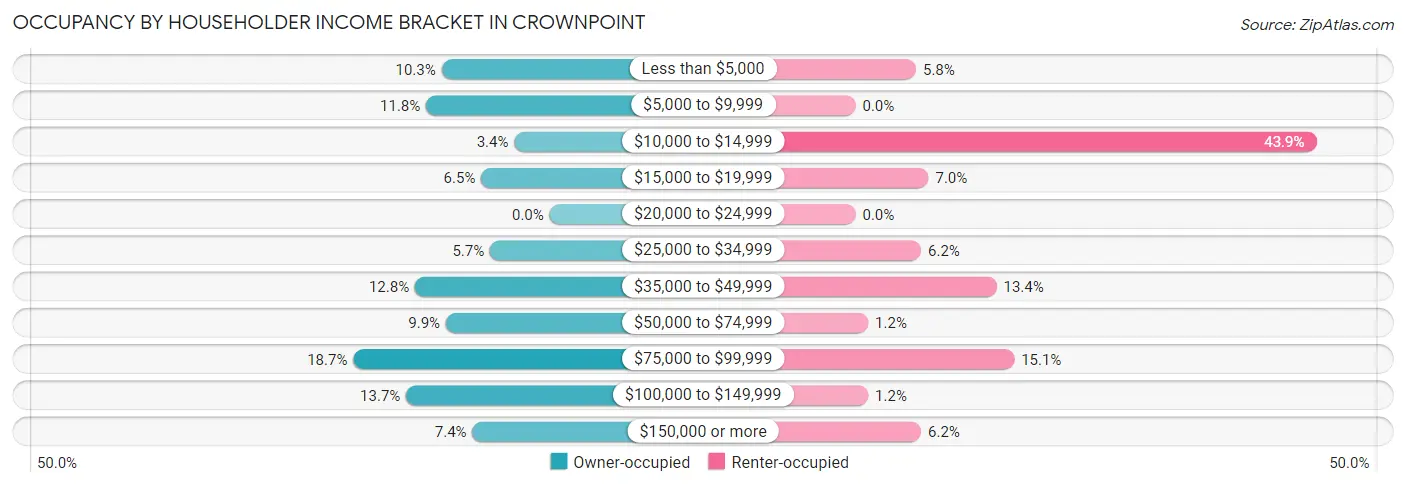
| Income Bracket | Owner-occupied | Renter-occupied |
| Less than $5,000 | 49 (10.3%) | 24 (5.8%) |
| $5,000 to $9,999 | 56 (11.8%) | 0 (0.0%) |
| $10,000 to $14,999 | 16 (3.4%) | 183 (43.9%) |
| $15,000 to $19,999 | 31 (6.5%) | 29 (7.0%) |
| $20,000 to $24,999 | 0 (0.0%) | 0 (0.0%) |
| $25,000 to $34,999 | 27 (5.7%) | 26 (6.2%) |
| $35,000 to $49,999 | 61 (12.8%) | 56 (13.4%) |
| $50,000 to $74,999 | 47 (9.9%) | 5 (1.2%) |
| $75,000 to $99,999 | 89 (18.7%) | 63 (15.1%) |
| $100,000 to $149,999 | 65 (13.7%) | 5 (1.2%) |
| $150,000 or more | 35 (7.3%) | 26 (6.2%) |
| Total | 476 (100.0%) | 417 (100.0%) |
Monthly Housing Cost Tiers in Crownpoint
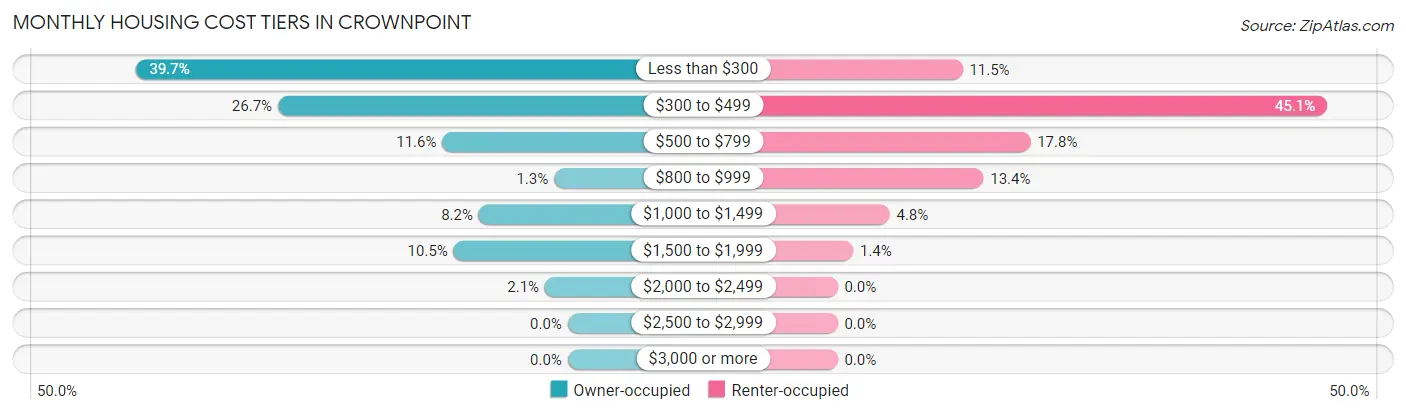
| Monthly Cost | Owner-occupied | Renter-occupied |
| Less than $300 | 189 (39.7%) | 48 (11.5%) |
| $300 to $499 | 127 (26.7%) | 188 (45.1%) |
| $500 to $799 | 55 (11.6%) | 74 (17.7%) |
| $800 to $999 | 6 (1.3%) | 56 (13.4%) |
| $1,000 to $1,499 | 39 (8.2%) | 20 (4.8%) |
| $1,500 to $1,999 | 50 (10.5%) | 6 (1.4%) |
| $2,000 to $2,499 | 10 (2.1%) | 0 (0.0%) |
| $2,500 to $2,999 | 0 (0.0%) | 0 (0.0%) |
| $3,000 or more | 0 (0.0%) | 0 (0.0%) |
| Total | 476 (100.0%) | 417 (100.0%) |
Physical Housing Characteristics in Crownpoint
Housing Structures in Crownpoint
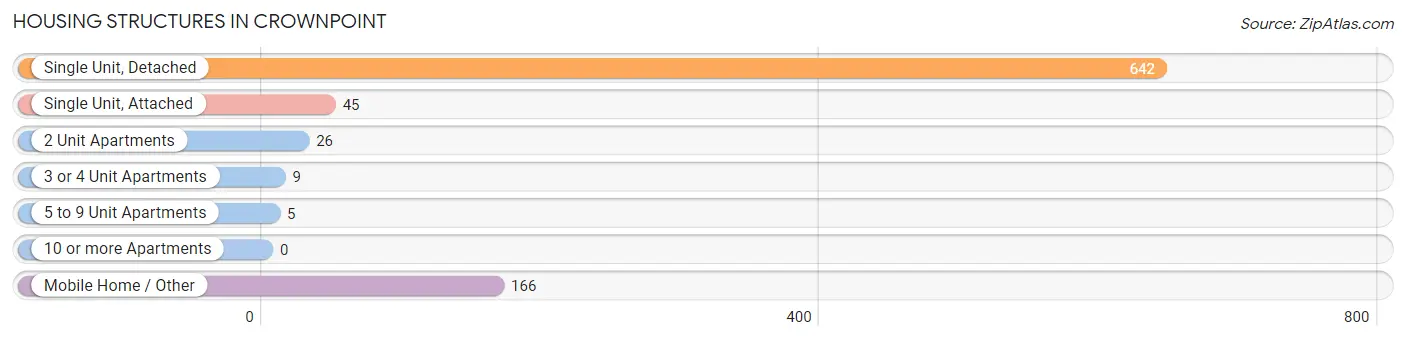
| Structure Type | # Housing Units | % Housing Units |
| Single Unit, Detached | 642 | 71.9% |
| Single Unit, Attached | 45 | 5.0% |
| 2 Unit Apartments | 26 | 2.9% |
| 3 or 4 Unit Apartments | 9 | 1.0% |
| 5 to 9 Unit Apartments | 5 | 0.6% |
| 10 or more Apartments | 0 | 0.0% |
| Mobile Home / Other | 166 | 18.6% |
| Total | 893 | 100.0% |
Housing Structures by Occupancy in Crownpoint
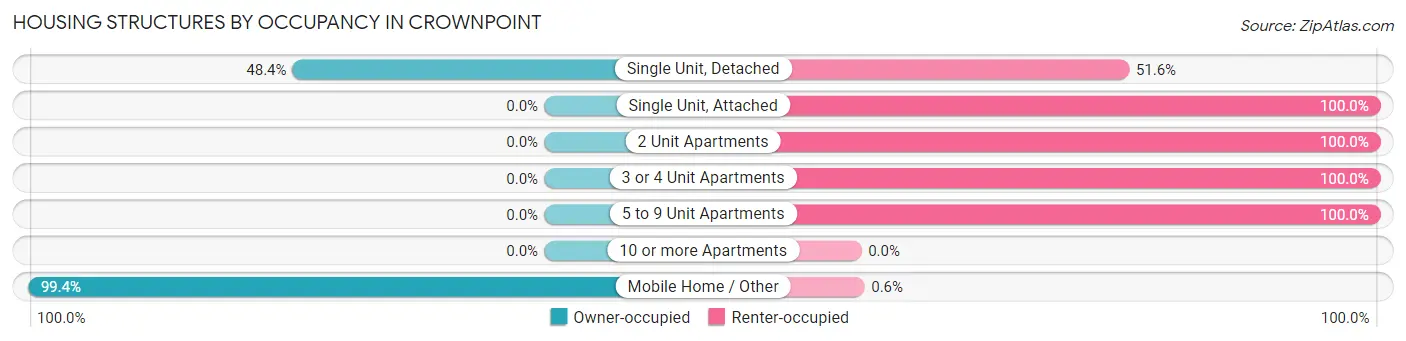
| Structure Type | Owner-occupied | Renter-occupied |
| Single Unit, Detached | 311 (48.4%) | 331 (51.6%) |
| Single Unit, Attached | 0 (0.0%) | 45 (100.0%) |
| 2 Unit Apartments | 0 (0.0%) | 26 (100.0%) |
| 3 or 4 Unit Apartments | 0 (0.0%) | 9 (100.0%) |
| 5 to 9 Unit Apartments | 0 (0.0%) | 5 (100.0%) |
| 10 or more Apartments | 0 (0.0%) | 0 (0.0%) |
| Mobile Home / Other | 165 (99.4%) | 1 (0.6%) |
| Total | 476 (53.3%) | 417 (46.7%) |
Housing Structures by Number of Rooms in Crownpoint
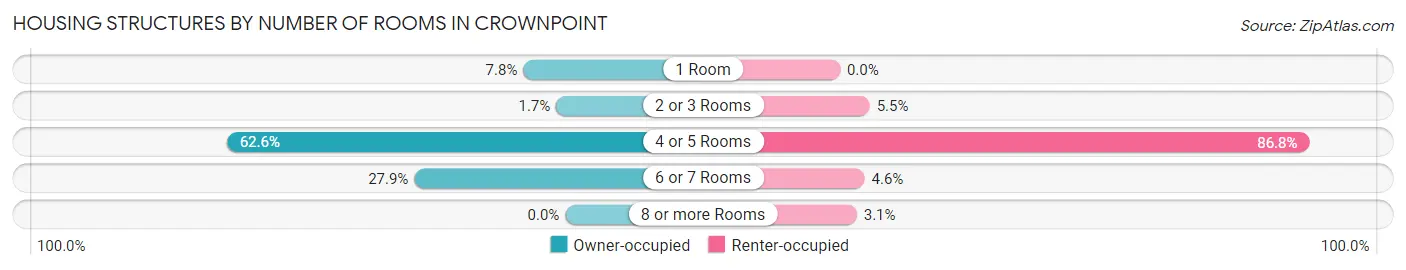
| Number of Rooms | Owner-occupied | Renter-occupied |
| 1 Room | 37 (7.8%) | 0 (0.0%) |
| 2 or 3 Rooms | 8 (1.7%) | 23 (5.5%) |
| 4 or 5 Rooms | 298 (62.6%) | 362 (86.8%) |
| 6 or 7 Rooms | 133 (27.9%) | 19 (4.6%) |
| 8 or more Rooms | 0 (0.0%) | 13 (3.1%) |
| Total | 476 (100.0%) | 417 (100.0%) |
Housing Structure by Heating Type in Crownpoint
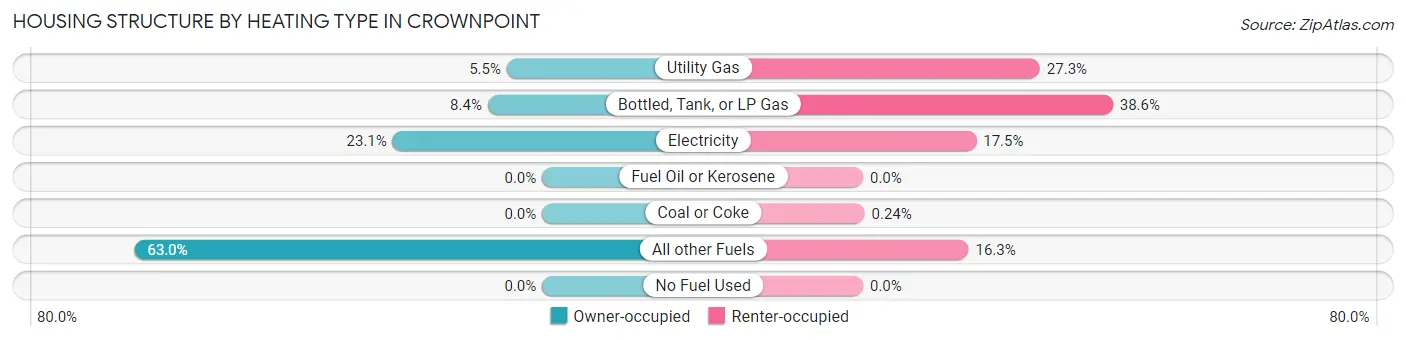
| Heating Type | Owner-occupied | Renter-occupied |
| Utility Gas | 26 (5.5%) | 114 (27.3%) |
| Bottled, Tank, or LP Gas | 40 (8.4%) | 161 (38.6%) |
| Electricity | 110 (23.1%) | 73 (17.5%) |
| Fuel Oil or Kerosene | 0 (0.0%) | 0 (0.0%) |
| Coal or Coke | 0 (0.0%) | 1 (0.2%) |
| All other Fuels | 300 (63.0%) | 68 (16.3%) |
| No Fuel Used | 0 (0.0%) | 0 (0.0%) |
| Total | 476 (100.0%) | 417 (100.0%) |
Household Vehicle Usage in Crownpoint
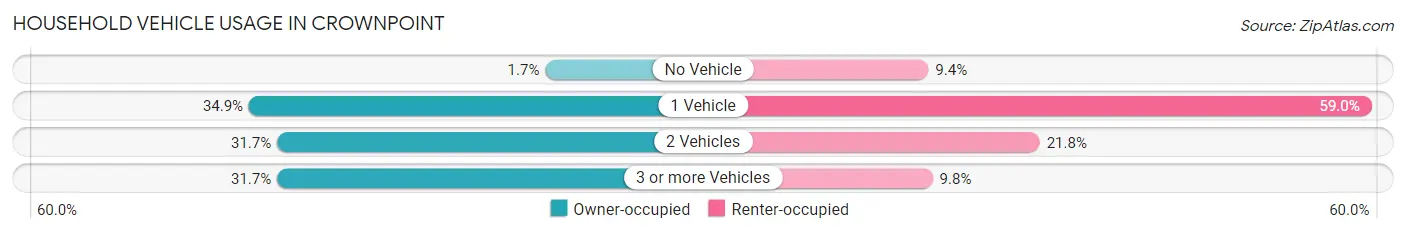
| Vehicles per Household | Owner-occupied | Renter-occupied |
| No Vehicle | 8 (1.7%) | 39 (9.3%) |
| 1 Vehicle | 166 (34.9%) | 246 (59.0%) |
| 2 Vehicles | 151 (31.7%) | 91 (21.8%) |
| 3 or more Vehicles | 151 (31.7%) | 41 (9.8%) |
| Total | 476 (100.0%) | 417 (100.0%) |
Real Estate & Mortgages in Crownpoint
Real Estate and Mortgage Overview in Crownpoint
| Characteristic | Without Mortgage | With Mortgage |
| Housing Units | 365 | 111 |
| Median Property Value | $49,000 | $66,100 |
| Median Household Income | $45,417 | $0 |
| Monthly Housing Costs | $290 | $0 |
| Real Estate Taxes | - | - |
Property Value by Mortgage Status in Crownpoint
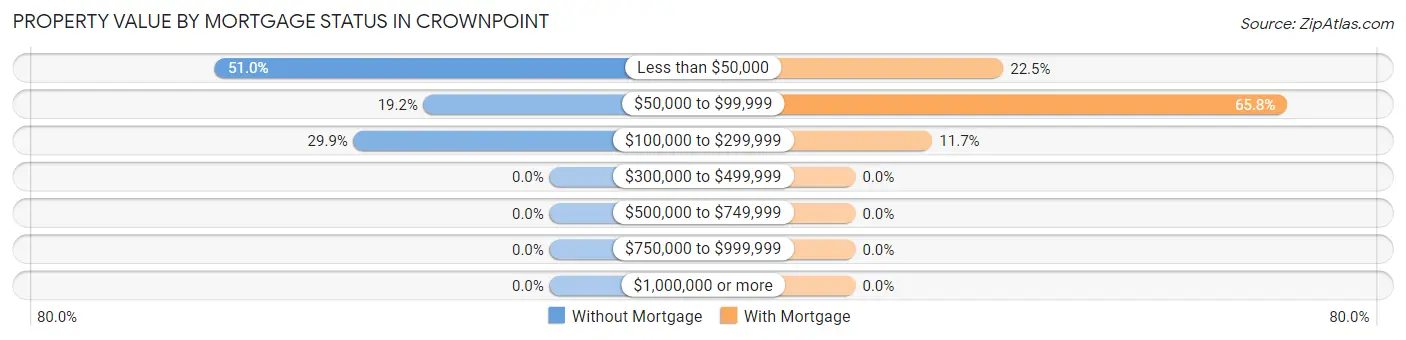
| Property Value | Without Mortgage | With Mortgage |
| Less than $50,000 | 186 (51.0%) | 25 (22.5%) |
| $50,000 to $99,999 | 70 (19.2%) | 73 (65.8%) |
| $100,000 to $299,999 | 109 (29.9%) | 13 (11.7%) |
| $300,000 to $499,999 | 0 (0.0%) | 0 (0.0%) |
| $500,000 to $749,999 | 0 (0.0%) | 0 (0.0%) |
| $750,000 to $999,999 | 0 (0.0%) | 0 (0.0%) |
| $1,000,000 or more | 0 (0.0%) | 0 (0.0%) |
| Total | 365 (100.0%) | 111 (100.0%) |
Household Income by Mortgage Status in Crownpoint
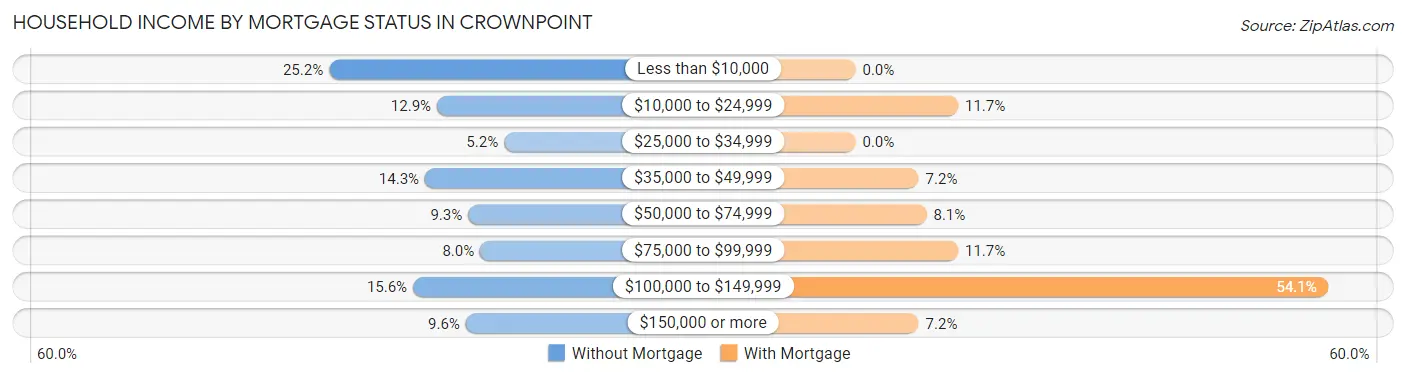
| Household Income | Without Mortgage | With Mortgage |
| Less than $10,000 | 92 (25.2%) | 0 (0.0%) |
| $10,000 to $24,999 | 47 (12.9%) | 13 (11.7%) |
| $25,000 to $34,999 | 19 (5.2%) | 0 (0.0%) |
| $35,000 to $49,999 | 52 (14.2%) | 8 (7.2%) |
| $50,000 to $74,999 | 34 (9.3%) | 9 (8.1%) |
| $75,000 to $99,999 | 29 (8.0%) | 13 (11.7%) |
| $100,000 to $149,999 | 57 (15.6%) | 60 (54.0%) |
| $150,000 or more | 35 (9.6%) | 8 (7.2%) |
| Total | 365 (100.0%) | 111 (100.0%) |
Property Value to Household Income Ratio in Crownpoint
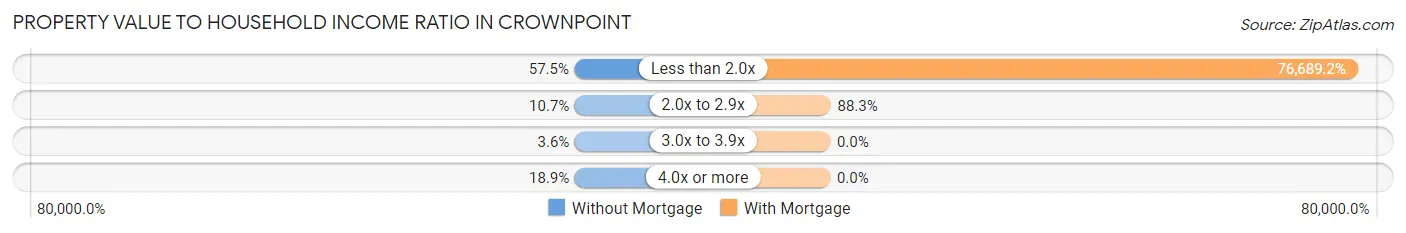
| Value-to-Income Ratio | Without Mortgage | With Mortgage |
| Less than 2.0x | 210 (57.5%) | 85,125 (76,689.2%) |
| 2.0x to 2.9x | 39 (10.7%) | 98 (88.3%) |
| 3.0x to 3.9x | 13 (3.6%) | 0 (0.0%) |
| 4.0x or more | 69 (18.9%) | 0 (0.0%) |
| Total | 365 (100.0%) | 111 (100.0%) |
Real Estate Taxes by Mortgage Status in Crownpoint
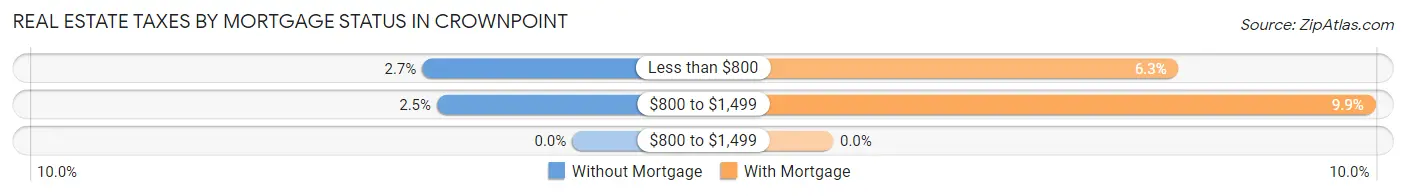
| Property Taxes | Without Mortgage | With Mortgage |
| Less than $800 | 10 (2.7%) | 7 (6.3%) |
| $800 to $1,499 | 9 (2.5%) | 11 (9.9%) |
| $800 to $1,499 | 0 (0.0%) | 0 (0.0%) |
| Total | 365 (100.0%) | 111 (100.0%) |
Health & Disability in Crownpoint
Health Insurance Coverage by Age in Crownpoint
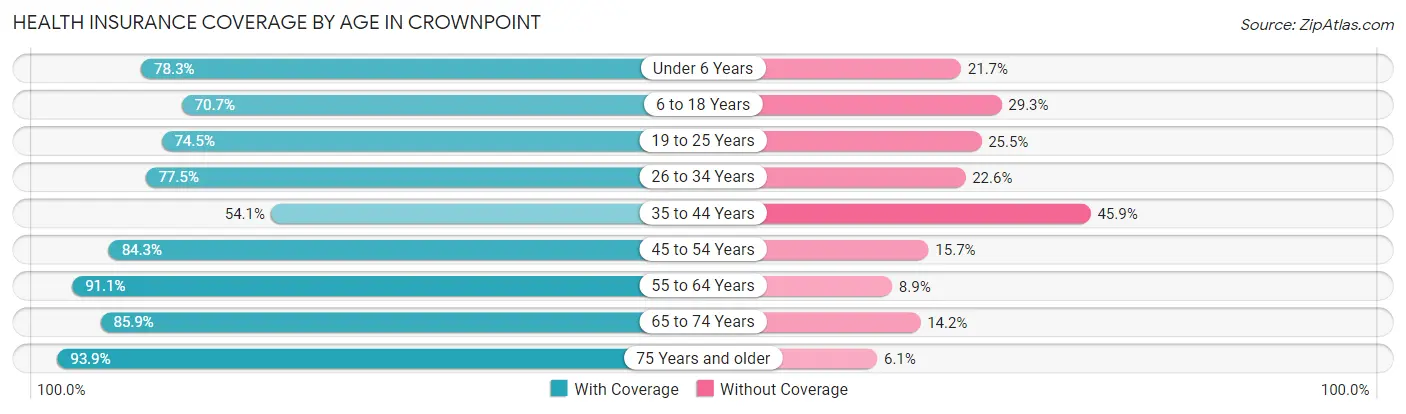
| Age Bracket | With Coverage | Without Coverage |
| Under 6 Years | 72 (78.3%) | 20 (21.7%) |
| 6 to 18 Years | 391 (70.7%) | 162 (29.3%) |
| 19 to 25 Years | 175 (74.5%) | 60 (25.5%) |
| 26 to 34 Years | 450 (77.4%) | 131 (22.6%) |
| 35 to 44 Years | 172 (54.1%) | 146 (45.9%) |
| 45 to 54 Years | 258 (84.3%) | 48 (15.7%) |
| 55 to 64 Years | 359 (91.1%) | 35 (8.9%) |
| 65 to 74 Years | 176 (85.9%) | 29 (14.1%) |
| 75 Years and older | 123 (93.9%) | 8 (6.1%) |
| Total | 2,176 (77.3%) | 639 (22.7%) |
Health Insurance Coverage by Citizenship Status in Crownpoint
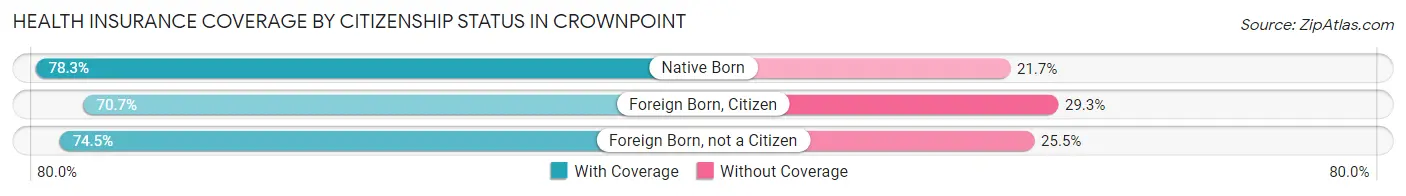
| Citizenship Status | With Coverage | Without Coverage |
| Native Born | 72 (78.3%) | 20 (21.7%) |
| Foreign Born, Citizen | 391 (70.7%) | 162 (29.3%) |
| Foreign Born, not a Citizen | 175 (74.5%) | 60 (25.5%) |
Health Insurance Coverage by Household Income in Crownpoint
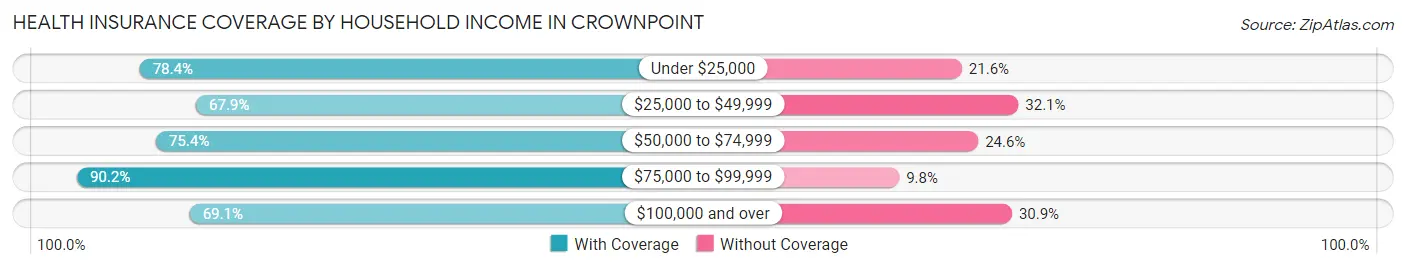
| Household Income | With Coverage | Without Coverage |
| Under $25,000 | 578 (78.4%) | 159 (21.6%) |
| $25,000 to $49,999 | 399 (67.9%) | 189 (32.1%) |
| $50,000 to $74,999 | 147 (75.4%) | 48 (24.6%) |
| $75,000 to $99,999 | 606 (90.2%) | 66 (9.8%) |
| $100,000 and over | 375 (69.1%) | 168 (30.9%) |
Public vs Private Health Insurance Coverage by Age in Crownpoint
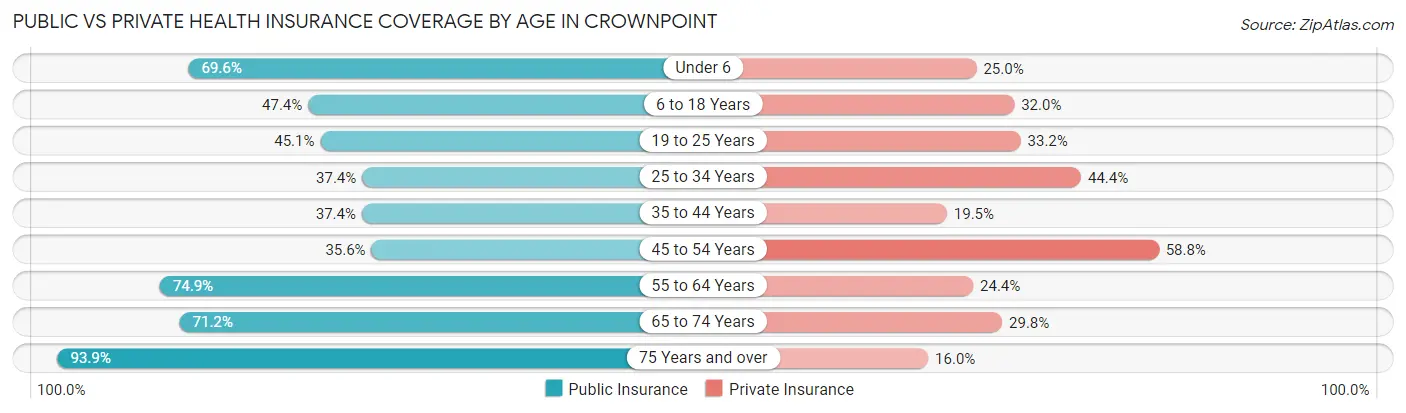
| Age Bracket | Public Insurance | Private Insurance |
| Under 6 | 64 (69.6%) | 23 (25.0%) |
| 6 to 18 Years | 262 (47.4%) | 177 (32.0%) |
| 19 to 25 Years | 106 (45.1%) | 78 (33.2%) |
| 25 to 34 Years | 217 (37.3%) | 258 (44.4%) |
| 35 to 44 Years | 119 (37.4%) | 62 (19.5%) |
| 45 to 54 Years | 109 (35.6%) | 180 (58.8%) |
| 55 to 64 Years | 295 (74.9%) | 96 (24.4%) |
| 65 to 74 Years | 146 (71.2%) | 61 (29.8%) |
| 75 Years and over | 123 (93.9%) | 21 (16.0%) |
| Total | 1,441 (51.2%) | 956 (34.0%) |
Disability Status by Sex by Age in Crownpoint
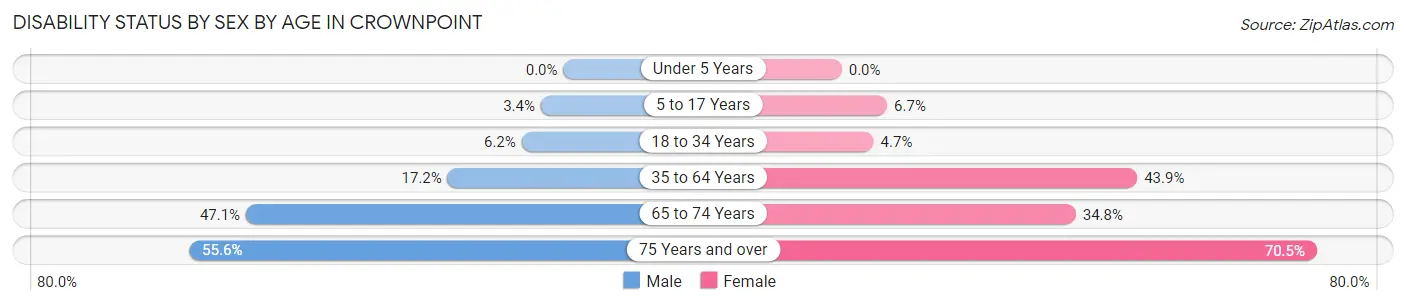
| Age Bracket | Male | Female |
| Under 5 Years | 0 (0.0%) | 0 (0.0%) |
| 5 to 17 Years | 7 (3.4%) | 23 (6.7%) |
| 18 to 34 Years | 24 (6.2%) | 22 (4.7%) |
| 35 to 64 Years | 88 (17.2%) | 222 (43.9%) |
| 65 to 74 Years | 41 (47.1%) | 41 (34.7%) |
| 75 Years and over | 20 (55.6%) | 67 (70.5%) |
Disability Class by Sex by Age in Crownpoint
Disability Class: Hearing Difficulty
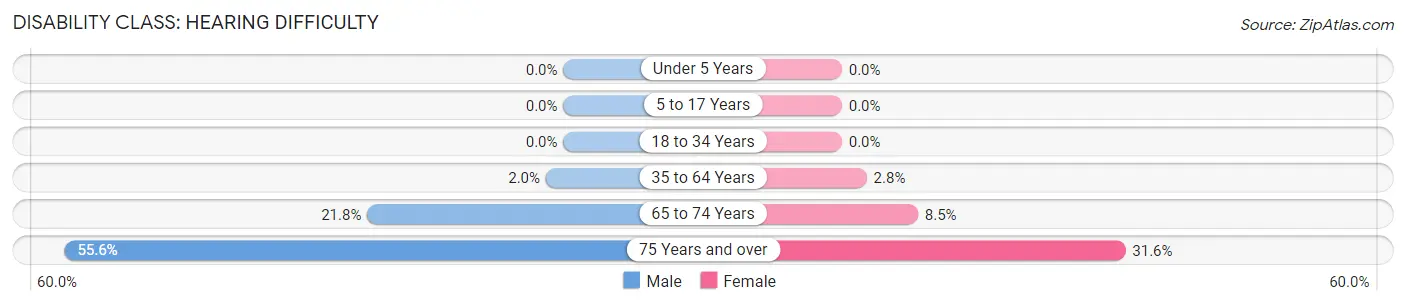
| Age Bracket | Male | Female |
| Under 5 Years | 0 (0.0%) | 0 (0.0%) |
| 5 to 17 Years | 0 (0.0%) | 0 (0.0%) |
| 18 to 34 Years | 0 (0.0%) | 0 (0.0%) |
| 35 to 64 Years | 10 (1.9%) | 14 (2.8%) |
| 65 to 74 Years | 19 (21.8%) | 10 (8.5%) |
| 75 Years and over | 20 (55.6%) | 30 (31.6%) |
Disability Class: Vision Difficulty
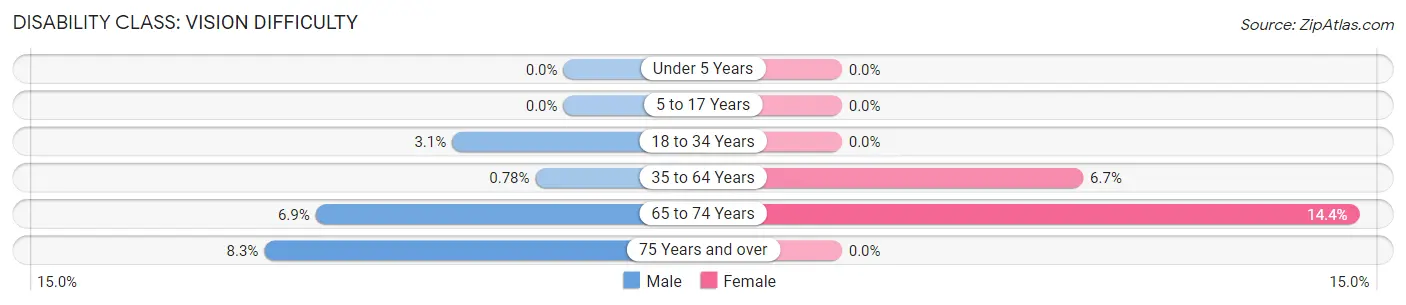
| Age Bracket | Male | Female |
| Under 5 Years | 0 (0.0%) | 0 (0.0%) |
| 5 to 17 Years | 0 (0.0%) | 0 (0.0%) |
| 18 to 34 Years | 12 (3.1%) | 0 (0.0%) |
| 35 to 64 Years | 4 (0.8%) | 34 (6.7%) |
| 65 to 74 Years | 6 (6.9%) | 17 (14.4%) |
| 75 Years and over | 3 (8.3%) | 0 (0.0%) |
Disability Class: Cognitive Difficulty
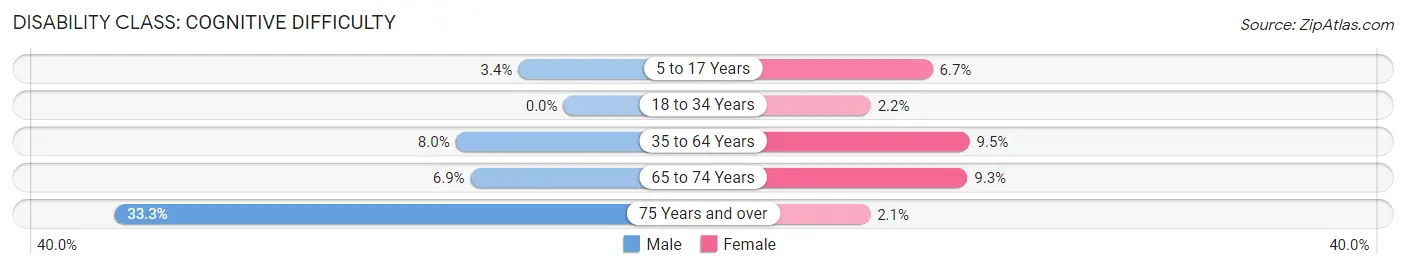
| Age Bracket | Male | Female |
| 5 to 17 Years | 7 (3.4%) | 23 (6.7%) |
| 18 to 34 Years | 0 (0.0%) | 10 (2.1%) |
| 35 to 64 Years | 41 (8.0%) | 48 (9.5%) |
| 65 to 74 Years | 6 (6.9%) | 11 (9.3%) |
| 75 Years and over | 12 (33.3%) | 2 (2.1%) |
Disability Class: Ambulatory Difficulty
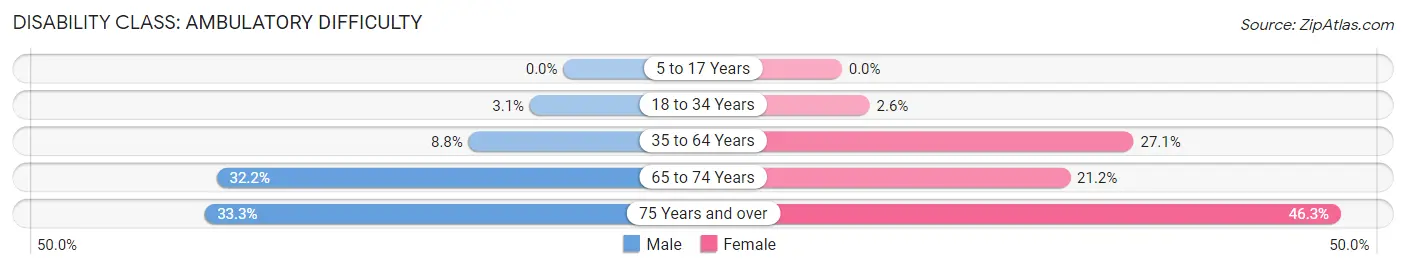
| Age Bracket | Male | Female |
| 5 to 17 Years | 0 (0.0%) | 0 (0.0%) |
| 18 to 34 Years | 12 (3.1%) | 12 (2.6%) |
| 35 to 64 Years | 45 (8.8%) | 137 (27.1%) |
| 65 to 74 Years | 28 (32.2%) | 25 (21.2%) |
| 75 Years and over | 12 (33.3%) | 44 (46.3%) |
Disability Class: Self-Care Difficulty
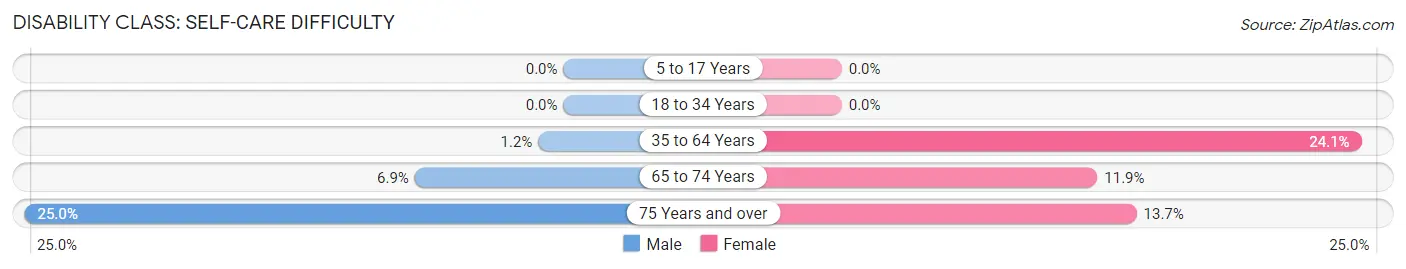
| Age Bracket | Male | Female |
| 5 to 17 Years | 0 (0.0%) | 0 (0.0%) |
| 18 to 34 Years | 0 (0.0%) | 0 (0.0%) |
| 35 to 64 Years | 6 (1.2%) | 122 (24.1%) |
| 65 to 74 Years | 6 (6.9%) | 14 (11.9%) |
| 75 Years and over | 9 (25.0%) | 13 (13.7%) |
Technology Access in Crownpoint
Computing Device Access in Crownpoint
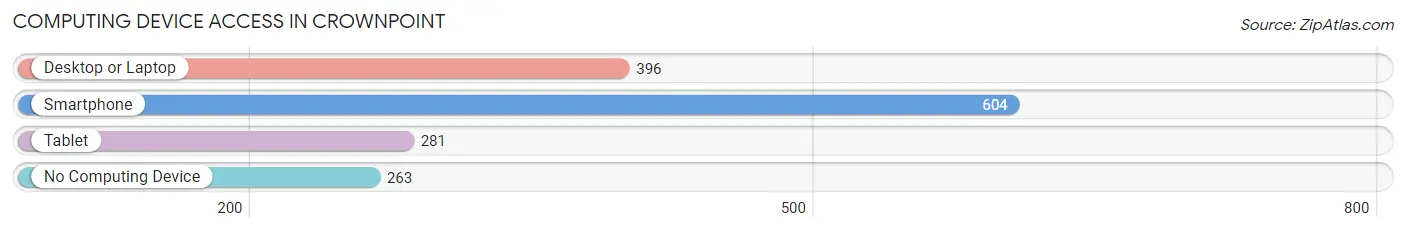
| Device Type | # Households | % Households |
| Desktop or Laptop | 396 | 44.3% |
| Smartphone | 604 | 67.6% |
| Tablet | 281 | 31.5% |
| No Computing Device | 263 | 29.4% |
| Total | 893 | 100.0% |
Internet Access in Crownpoint
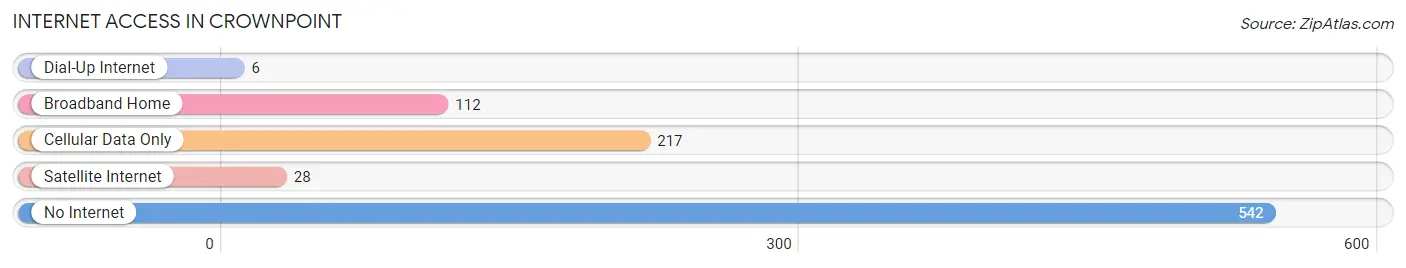
| Internet Type | # Households | % Households |
| Dial-Up Internet | 6 | 0.7% |
| Broadband Home | 112 | 12.5% |
| Cellular Data Only | 217 | 24.3% |
| Satellite Internet | 28 | 3.1% |
| No Internet | 542 | 60.7% |
| Total | 893 | 100.0% |
Crownpoint Summary
Crownpoint, New Mexico is a small town located in the northwest corner of the state, in the heart of the Navajo Nation. It is situated in the Chuska Mountains, near the Arizona border, and is home to a population of approximately 2,000 people. The town is known for its rich cultural heritage, and is home to a variety of Native American tribes, including the Navajo, Hopi, and Zuni.
History
Crownpoint was originally established in the late 1800s as a trading post for the Navajo people. The town was named after a nearby mountain peak, which was said to resemble a crown. In the early 1900s, the town was home to a number of businesses, including a hotel, a general store, and a post office.
In the 1930s, the town was the site of a major uranium mining operation. The uranium was used to fuel the atomic bomb that was dropped on Hiroshima, Japan during World War II. The mining operation was eventually shut down in the 1950s, and the town has since become a quiet, rural community.
Geography
Crownpoint is located in the northwest corner of New Mexico, in the heart of the Navajo Nation. The town is situated in the Chuska Mountains, near the Arizona border. The town is surrounded by a variety of natural features, including the Chuska Mountains, the San Juan River, and the Navajo Nation Reservation.
The town is located at an elevation of 6,000 feet, and has a semi-arid climate. The average temperature in the summer is around 80 degrees Fahrenheit, and the average temperature in the winter is around 40 degrees Fahrenheit.
Economy
Crownpoint’s economy is largely based on tourism and agriculture. The town is home to a number of tourist attractions, including the Navajo Nation Museum, the Chuska Mountains, and the San Juan River. The town is also home to a number of agricultural operations, including cattle ranches, sheep farms, and orchards.
The town is also home to a number of businesses, including restaurants, hotels, and retail stores. The town is also home to a number of government offices, including the Navajo Nation Tribal Council and the Bureau of Indian Affairs.
Demographics
As of the 2010 census, the population of Crownpoint was 2,039. The town is predominantly Native American, with the majority of the population being Navajo. The town is also home to a small number of Hispanic and White residents.
The median household income in Crownpoint is $25,000, and the median home value is $90,000. The town has a poverty rate of 28.3%, and the unemployment rate is 8.3%.
Conclusion
Crownpoint, New Mexico is a small town located in the northwest corner of the state, in the heart of the Navajo Nation. The town is known for its rich cultural heritage, and is home to a variety of Native American tribes. The town’s economy is largely based on tourism and agriculture, and the town is home to a number of businesses, government offices, and tourist attractions. The population of Crownpoint is predominantly Native American, with the majority of the population being Navajo. The town has a median household income of $25,000, and the median home value is $90,000.
Common Questions
What is Per Capita Income in Crownpoint?
Per Capita income in Crownpoint is $17,743.
What is the Median Family Income in Crownpoint?
Median Family Income in Crownpoint is $63,125.
What is the Median Household income in Crownpoint?
Median Household Income in Crownpoint is $35,362.
What is Income or Wage Gap in Crownpoint?
Income or Wage Gap in Crownpoint is 15.0%.
Women in Crownpoint earn 85.0 cents for every dollar earned by a man.
What is Family Income Deficit in Crownpoint?
Family Income Deficit in Crownpoint is $12,421.
Families that are below poverty line in Crownpoint earn $12,421 less on average than the poverty threshold level.
What is Inequality or Gini Index in Crownpoint?
Inequality or Gini Index in Crownpoint is 0.52.
What is the Total Population of Crownpoint?
Total Population of Crownpoint is 2,823.
What is the Total Male Population of Crownpoint?
Total Male Population of Crownpoint is 1,257.
What is the Total Female Population of Crownpoint?
Total Female Population of Crownpoint is 1,566.
What is the Ratio of Males per 100 Females in Crownpoint?
There are 80.27 Males per 100 Females in Crownpoint.
What is the Ratio of Females per 100 Males in Crownpoint?
There are 124.58 Females per 100 Males in Crownpoint.
What is the Median Population Age in Crownpoint?
Median Population Age in Crownpoint is 34.2 Years.
What is the Average Family Size in Crownpoint
Average Family Size in Crownpoint is 4.2 People.
What is the Average Household Size in Crownpoint
Average Household Size in Crownpoint is 3.1 People.
How Large is the Labor Force in Crownpoint?
There are 1,140 People in the Labor Forcein in Crownpoint.
What is the Percentage of People in the Labor Force in Crownpoint?
48.8% of People are in the Labor Force in Crownpoint.
What is the Unemployment Rate in Crownpoint?
Unemployment Rate in Crownpoint is 12.8%.