Earnings by Sex by Educational Attainment in Conchas Dam
Educational Attainment
Male Income
Female Income
Less than High School
-
-
High School Diploma
-
-
College or Associate's Degree
-
-
Bachelor's Degree
-
-
Graduate Degree
-
-
Total
-
-
Family Income in Conchas Dam
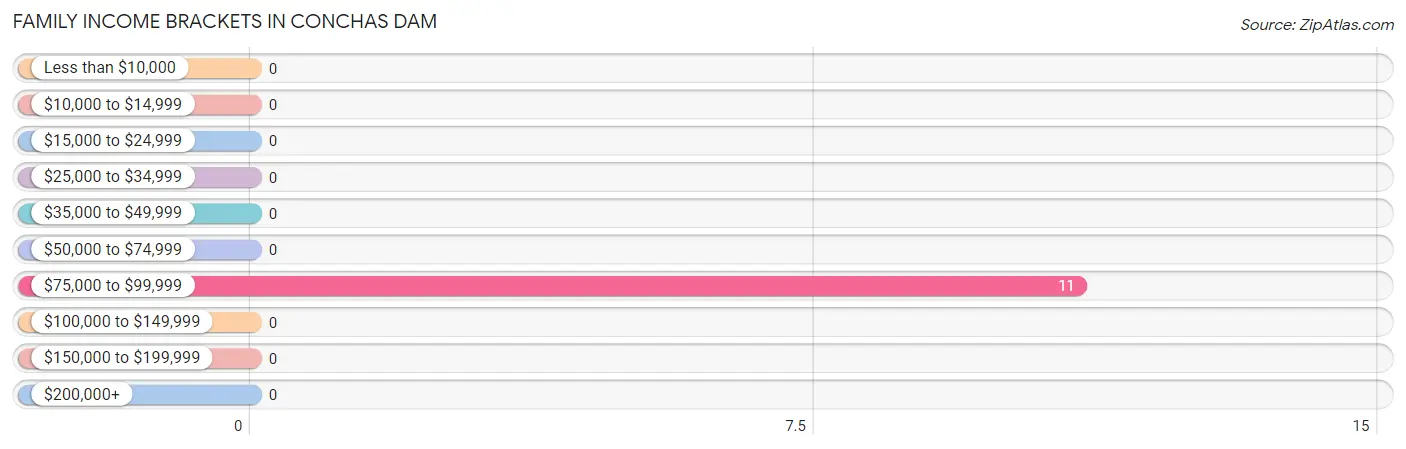
Family Income Brackets in Conchas Dam
According to the Conchas Dam family income data, there are 11 families falling into the $75,000 to $99,999 income range, which is the most common income bracket and makes up 100.0% of all families.
Income Bracket
# Families
% Families
Less than $10,000
0
0.0%
$10,000 to $14,999
0
0.0%
$15,000 to $24,999
0
0.0%
$25,000 to $34,999
0
0.0%
$35,000 to $49,999
0
0.0%
$50,000 to $74,999
0
0.0%
$75,000 to $99,999
11
100.0%
$100,000 to $149,999
0
0.0%
$150,000 to $199,999
0
0.0%
$200,000+
0
0.0%
Family Income by Famaliy Size in Conchas Dam
Income Bracket
# Families
Median Income
2-Person Families
11 (100.0%)
$0
3-Person Families
0 (0.0%)
$0
4-Person Families
0 (0.0%)
$0
5-Person Families
0 (0.0%)
$0
6-Person Families
0 (0.0%)
$0
7+ Person Families
0 (0.0%)
$0
Total
11 (100.0%)
$0
Family Income by Number of Earners in Conchas Dam
Number of Earners
# Families
Median Income
No Earners
0 (0.0%)
$0
1 Earner
11 (100.0%)
$0
2 Earners
0 (0.0%)
$0
3+ Earners
0 (0.0%)
$0
Total
11 (100.0%)
$0
Household Income in Conchas Dam
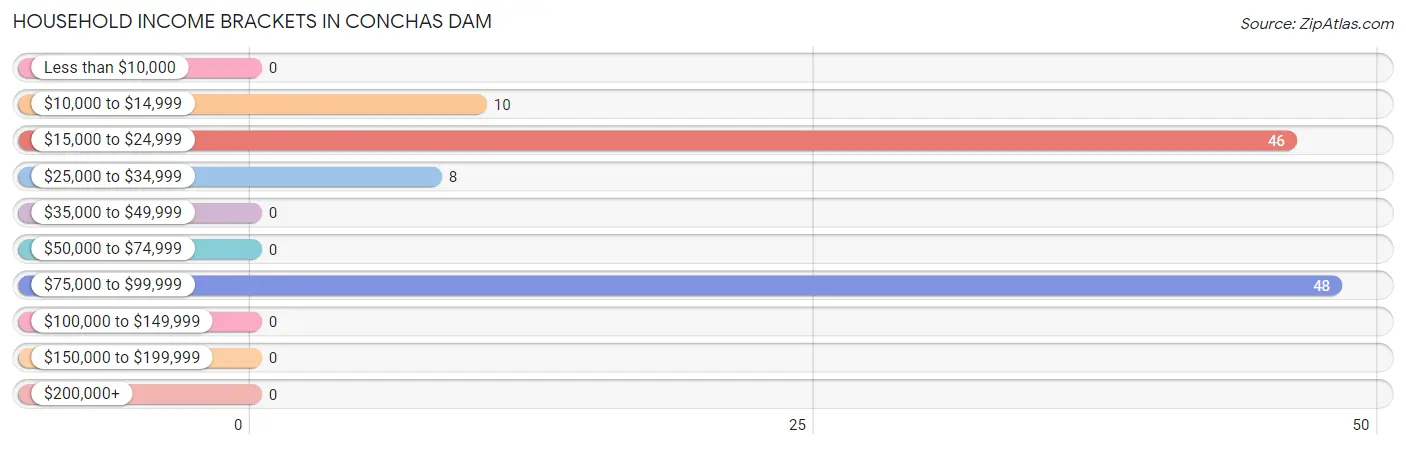
Household Income Brackets in Conchas Dam
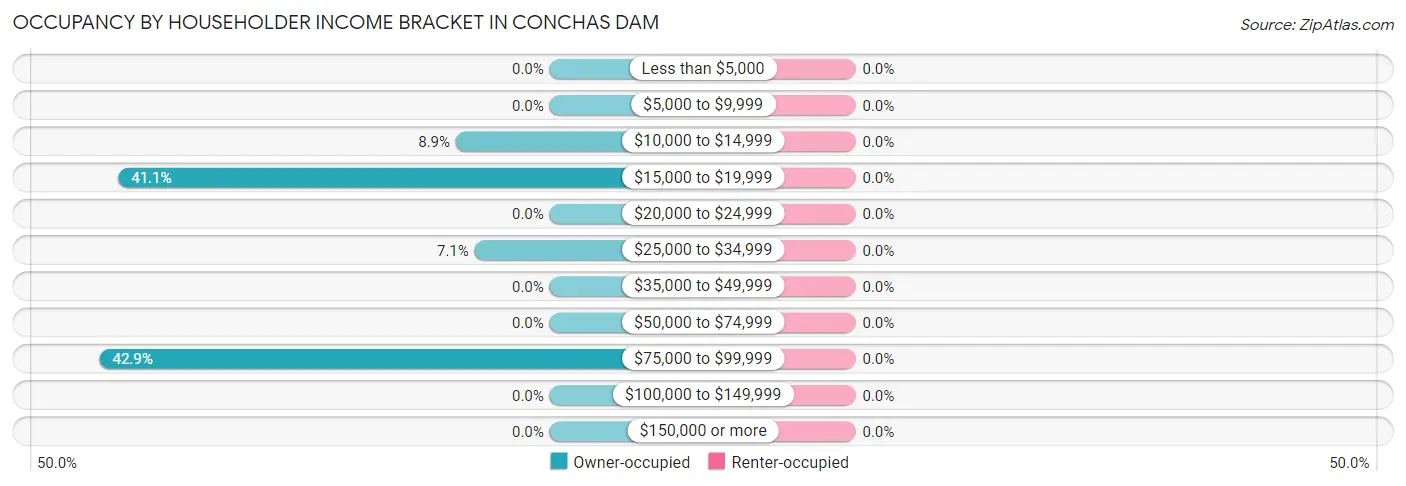
With 48 households falling in the category, the $75,000 to $99,999 income range is the most frequent in Conchas Dam, accounting for 42.9% of all households.
Income Bracket
# Households
% Households
Less than $10,000
0
0.0%
$10,000 to $14,999
10
8.9%
$15,000 to $24,999
46
41.1%
$25,000 to $34,999
8
7.1%
$35,000 to $49,999
0
0.0%
$50,000 to $74,999
0
0.0%
$75,000 to $99,999
48
42.9%
$100,000 to $149,999
0
0.0%
$150,000 to $199,999
0
0.0%
$200,000+
0
0.0%
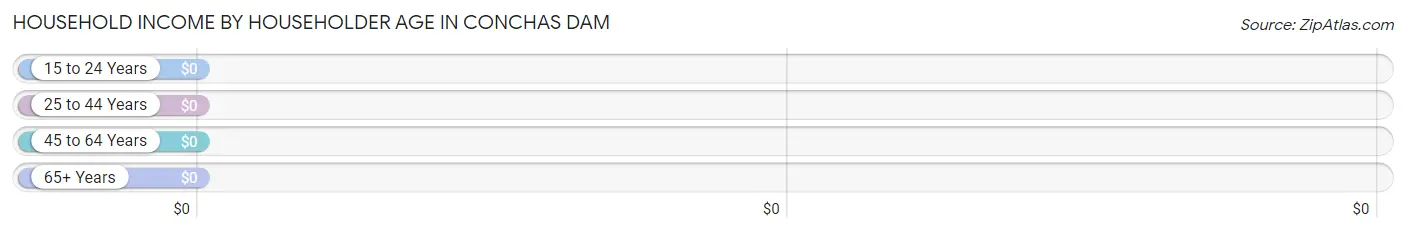
Household Income by Householder Age in Conchas Dam
Income Bracket
# Households
Median Income
15 to 24 Years
0 (0.0%)
$0
25 to 44 Years
8 (7.1%)
$0
45 to 64 Years
21 (18.8%)
$0
65+ Years
83 (74.1%)
$0
Total
112 (100.0%)
$0
Poverty in Conchas Dam
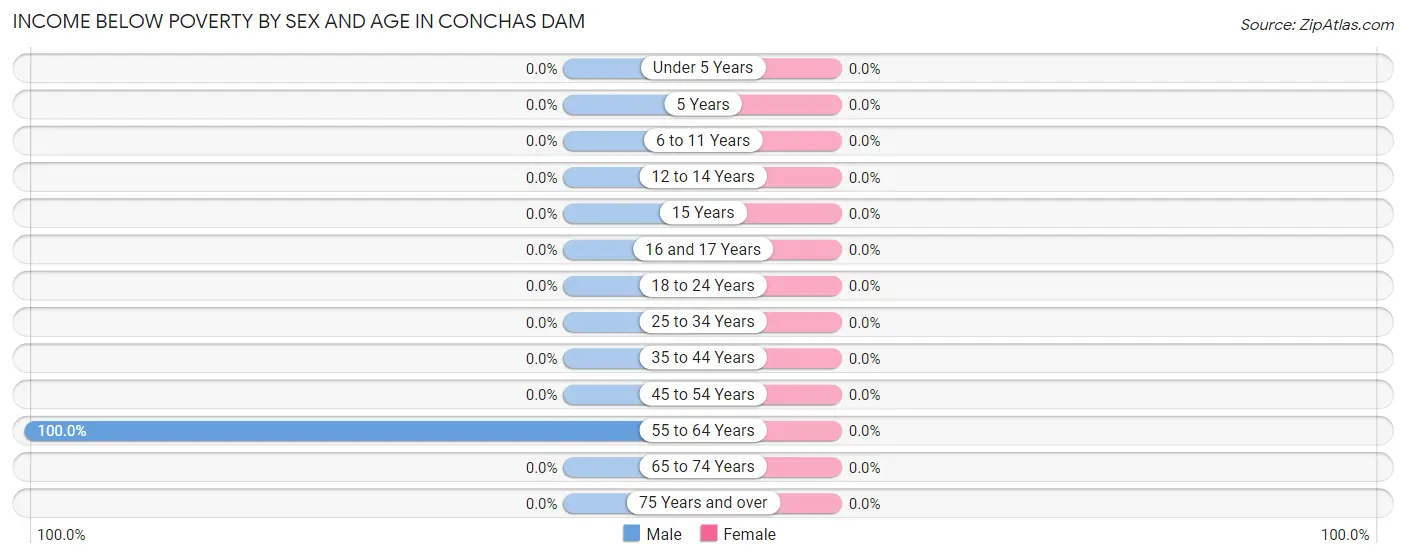
Income Below Poverty by Sex and Age in Conchas Dam
Age Bracket
Male
Female
Under 5 Years
0 (0.0%)
0 (0.0%)
5 Years
0 (0.0%)
0 (0.0%)
6 to 11 Years
0 (0.0%)
0 (0.0%)
12 to 14 Years
0 (0.0%)
0 (0.0%)
15 Years
0 (0.0%)
0 (0.0%)
16 and 17 Years
0 (0.0%)
0 (0.0%)
18 to 24 Years
0 (0.0%)
0 (0.0%)
25 to 34 Years
0 (0.0%)
0 (0.0%)
35 to 44 Years
0 (0.0%)
0 (0.0%)
45 to 54 Years
0 (0.0%)
0 (0.0%)
55 to 64 Years
10 (100.0%)
0 (0.0%)
65 to 74 Years
0 (0.0%)
0 (0.0%)
75 Years and over
0 (0.0%)
0 (0.0%)
Total
10 (15.1%)
0 (0.0%)
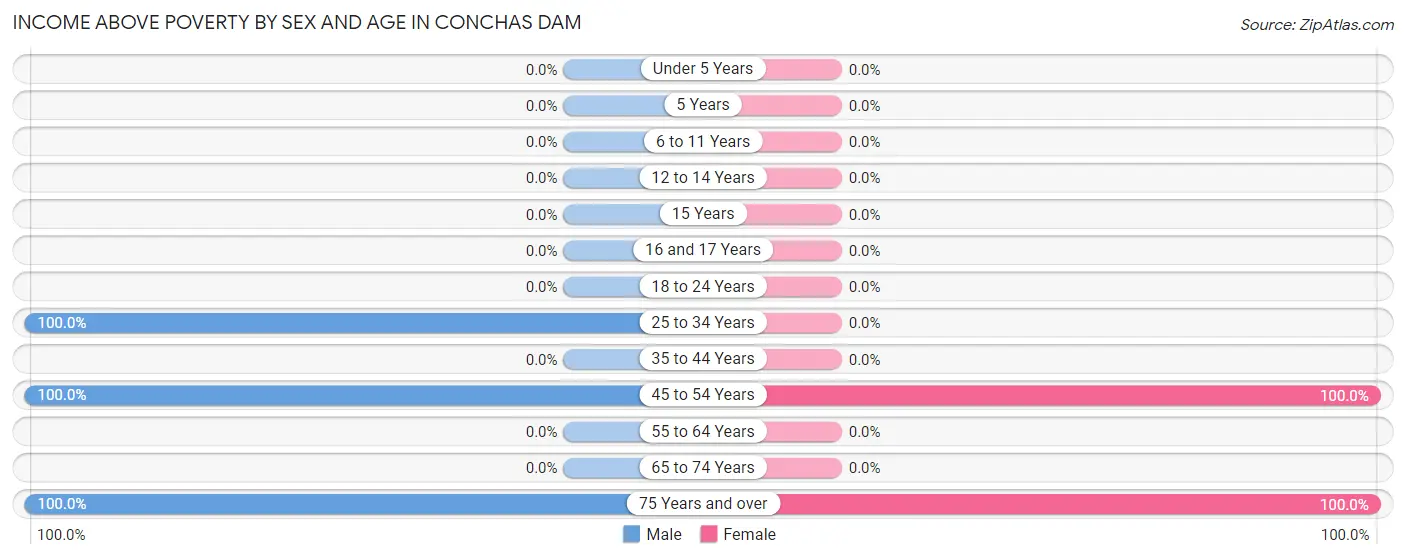
Income Above Poverty by Sex and Age in Conchas Dam
According to the poverty statistics in Conchas Dam, males aged 25 to 34 years and females aged 45 to 54 years are the age groups that are most secure financially, with 100.0% of males and 100.0% of females in these age groups living above the poverty line.
Age Bracket
Male
Female
Under 5 Years
0 (0.0%)
0 (0.0%)
5 Years
0 (0.0%)
0 (0.0%)
6 to 11 Years
0 (0.0%)
0 (0.0%)
12 to 14 Years
0 (0.0%)
0 (0.0%)
15 Years
0 (0.0%)
0 (0.0%)
16 and 17 Years
0 (0.0%)
0 (0.0%)
18 to 24 Years
0 (0.0%)
0 (0.0%)
25 to 34 Years
8 (100.0%)
0 (0.0%)
35 to 44 Years
0 (0.0%)
0 (0.0%)
45 to 54 Years
11 (100.0%)
35 (100.0%)
55 to 64 Years
0 (0.0%)
0 (0.0%)
65 to 74 Years
0 (0.0%)
0 (0.0%)
75 Years and over
37 (100.0%)
46 (100.0%)
Total
56 (84.9%)
81 (100.0%)
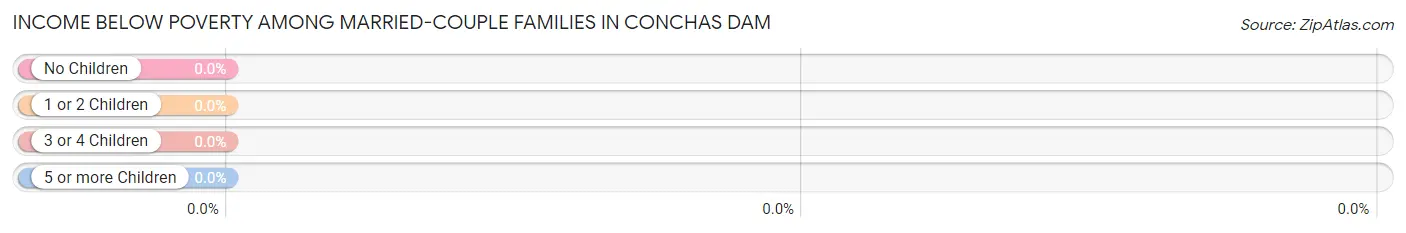
Income Below Poverty Among Married-Couple Families in Conchas Dam
Children
Above Poverty
Below Poverty
No Children
11 (100.0%)
0 (0.0%)
1 or 2 Children
0 (0.0%)
0 (0.0%)
3 or 4 Children
0 (0.0%)
0 (0.0%)
5 or more Children
0 (0.0%)
0 (0.0%)
Total
11 (100.0%)
0 (0.0%)
Income Below Poverty Among Single-Parent Households in Conchas Dam
Children
Single Father
Single Mother
No Children
0 (0.0%)
0 (0.0%)
1 or 2 Children
0 (0.0%)
0 (0.0%)
3 or 4 Children
0 (0.0%)
0 (0.0%)
5 or more Children
0 (0.0%)
0 (0.0%)
Total
0 (0.0%)
0 (0.0%)
Income Below Poverty Among Married-Couple vs Single-Parent Households in Conchas Dam
Children
Married-Couple Families
Single-Parent Households
No Children
0 (0.0%)
0 (0.0%)
1 or 2 Children
0 (0.0%)
0 (0.0%)
3 or 4 Children
0 (0.0%)
0 (0.0%)
5 or more Children
0 (0.0%)
0 (0.0%)
Total
0 (0.0%)
0 (0.0%)
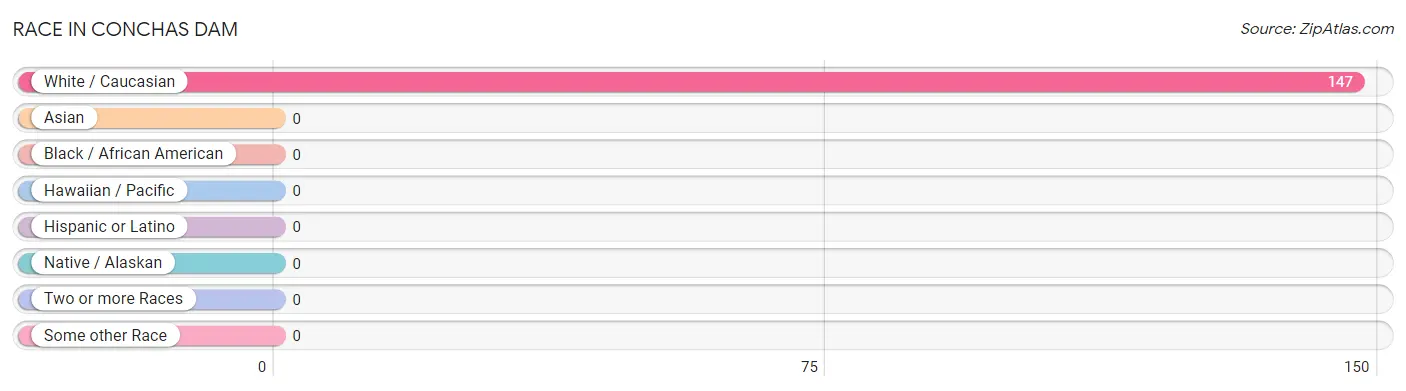
Race in Conchas Dam
The most populous races in Conchas Dam are , and White / Caucasian (147 | 100.0%).
Race
# Population
% Population
Asian
0
0.0%
Black / African American
0
0.0%
Hawaiian / Pacific
0
0.0%
Hispanic or Latino
0
0.0%
Native / Alaskan
0
0.0%
White / Caucasian
147
100.0%
Two or more Races
0
0.0%
Some other Race
0
0.0%
Total
147
100.0%
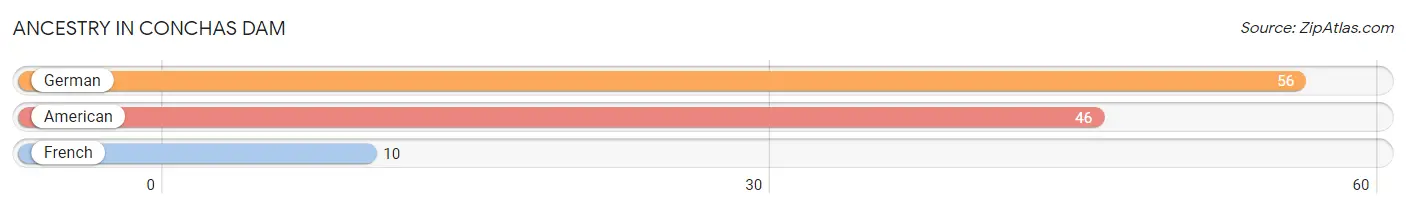
Ancestry in Conchas Dam
The most populous ancestries reported in Conchas Dam are German (56 | 38.1%), American (46 | 31.3%), and French (10 | 6.8%), together accounting for 76.2% of all Conchas Dam residents.
Ancestry
# Population
% Population
American
46
31.3%
French
10
6.8%
German
56
38.1%
View All 3 Rows
Immigrants in Conchas Dam
Immigration Origin
# Population
% Population
View All 0 Rows
Sex and Age in Conchas Dam
Sex and Age in Conchas Dam
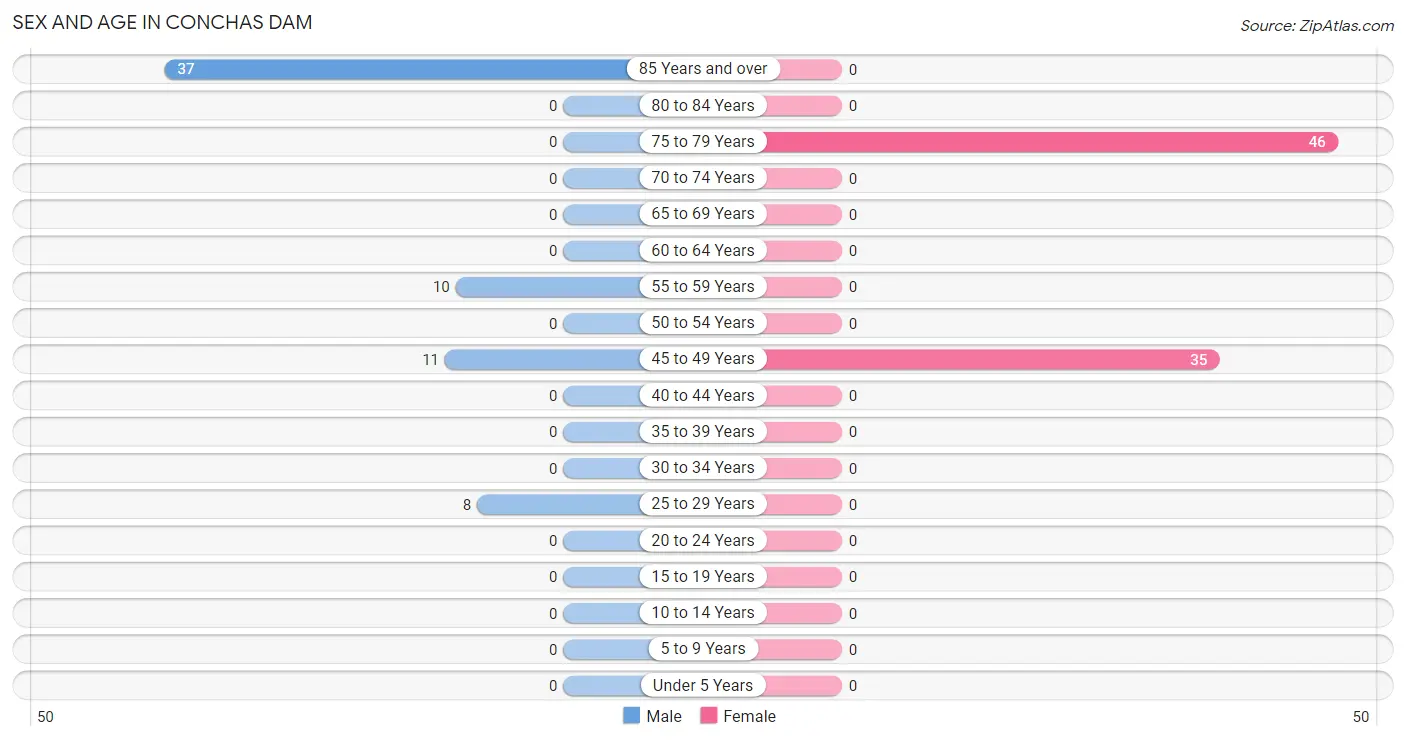
The most populous age groups in Conchas Dam are 85 Years and over (37 | 56.1%) for men and 75 to 79 Years (46 | 56.8%) for women.
Age Bracket
Male
Female
Under 5 Years
0 (0.0%)
0 (0.0%)
5 to 9 Years
0 (0.0%)
0 (0.0%)
10 to 14 Years
0 (0.0%)
0 (0.0%)
15 to 19 Years
0 (0.0%)
0 (0.0%)
20 to 24 Years
0 (0.0%)
0 (0.0%)
25 to 29 Years
8 (12.1%)
0 (0.0%)
30 to 34 Years
0 (0.0%)
0 (0.0%)
35 to 39 Years
0 (0.0%)
0 (0.0%)
40 to 44 Years
0 (0.0%)
0 (0.0%)
45 to 49 Years
11 (16.7%)
35 (43.2%)
50 to 54 Years
0 (0.0%)
0 (0.0%)
55 to 59 Years
10 (15.1%)
0 (0.0%)
60 to 64 Years
0 (0.0%)
0 (0.0%)
65 to 69 Years
0 (0.0%)
0 (0.0%)
70 to 74 Years
0 (0.0%)
0 (0.0%)
75 to 79 Years
0 (0.0%)
46 (56.8%)
80 to 84 Years
0 (0.0%)
0 (0.0%)
85 Years and over
37 (56.1%)
0 (0.0%)
Total
66 (100.0%)
81 (100.0%)
Families and Households in Conchas Dam
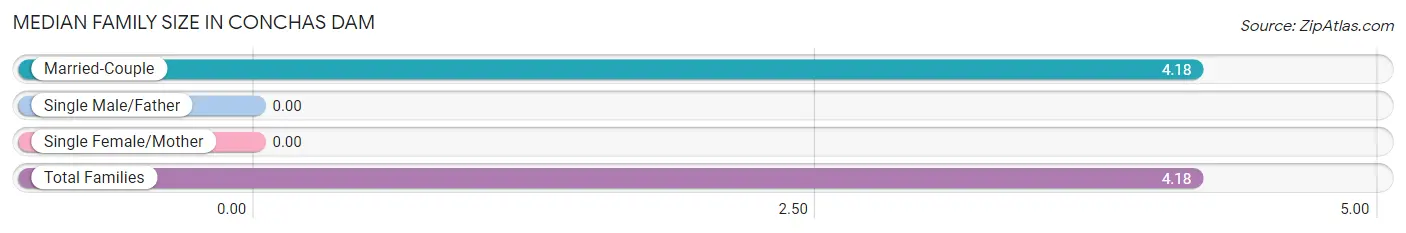
Median Family Size in Conchas Dam
Family Type
# Families
Family Size
Married-Couple
11 (100.0%)
4.18
Single Male/Father
0 (0.0%)
-
Single Female/Mother
0 (0.0%)
-
Total Families
11 (100.0%)
4.18
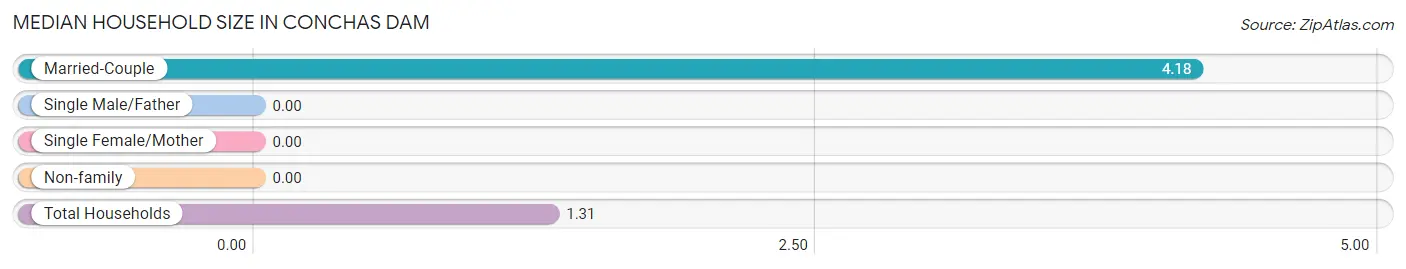
Median Household Size in Conchas Dam
Household Type
# Households
Household Size
Married-Couple
11 (9.8%)
4.18
Single Male/Father
0 (0.0%)
-
Single Female/Mother
0 (0.0%)
-
Non-family
101 (90.2%)
-
Total Households
112 (100.0%)
1.31
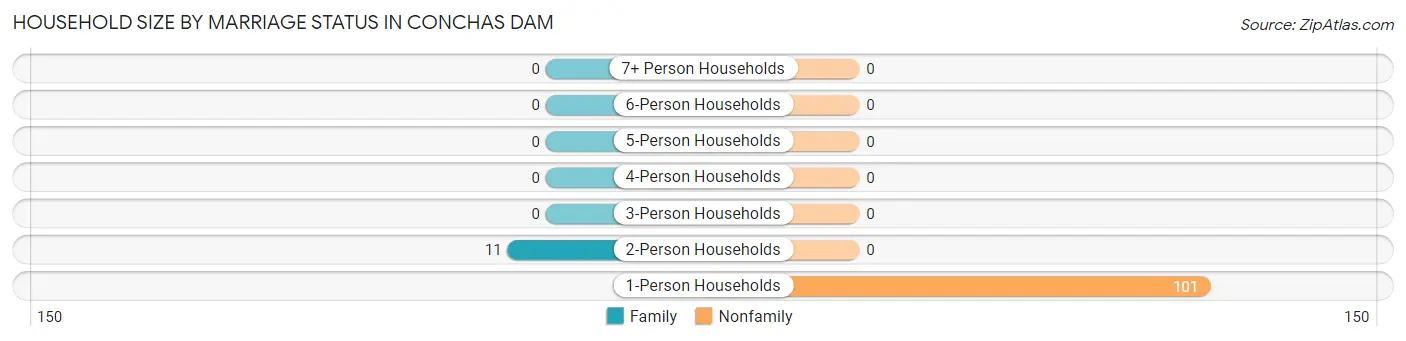
Household Size by Marriage Status in Conchas Dam
Out of a total of 112 households in Conchas Dam, 11 (9.8%) are family households, while 101 (90.2%) are nonfamily households. The most numerous type of family households are 2-person households, comprising 11, and the most common type of nonfamily households are 1-person households, comprising 101.
Household Size
Family Households
Nonfamily Households
1-Person Households
-
101 (90.2%)
2-Person Households
11 (9.8%)
0 (0.0%)
3-Person Households
0 (0.0%)
0 (0.0%)
4-Person Households
0 (0.0%)
0 (0.0%)
5-Person Households
0 (0.0%)
0 (0.0%)
6-Person Households
0 (0.0%)
0 (0.0%)
7+ Person Households
0 (0.0%)
0 (0.0%)
Total
11 (9.8%)
101 (90.2%)
Female Fertility in Conchas Dam
Fertility by Age in Conchas Dam
Age Bracket
Women with Births
Births / 1,000 Women
15 to 19 years
0 (0.0%)
0.0
20 to 34 years
0 (0.0%)
0.0
35 to 50 years
0 (0.0%)
0.0
Total
0 (0.0%)
0.0
Fertility by Age by Marriage Status in Conchas Dam
Age Bracket
Married
Unmarried
15 to 19 years
0 (0.0%)
0 (0.0%)
20 to 34 years
0 (0.0%)
0 (0.0%)
35 to 50 years
0 (0.0%)
0 (0.0%)
Total
0 (0.0%)
0 (0.0%)
Fertility by Education in Conchas Dam
Educational Attainment
Women with Births
Births / 1,000 Women
Less than High School
0 (0.0%)
0.0
High School Diploma
0 (0.0%)
0.0
College or Associate's Degree
0 (0.0%)
0.0
Bachelor's Degree
0 (0.0%)
0.0
Graduate Degree
0 (0.0%)
0.0
Total
0 (0.0%)
0.0
Fertility by Education by Marriage Status in Conchas Dam
Educational Attainment
Married
Unmarried
Less than High School
0 (0.0%)
0 (0.0%)
High School Diploma
0 (0.0%)
0 (0.0%)
College or Associate's Degree
0 (0.0%)
0 (0.0%)
Bachelor's Degree
0 (0.0%)
0 (0.0%)
Graduate Degree
0 (0.0%)
0 (0.0%)
Total
0 (0.0%)
0 (0.0%)
Employment Characteristics in Conchas Dam
Employment by Class of Employer in Conchas Dam
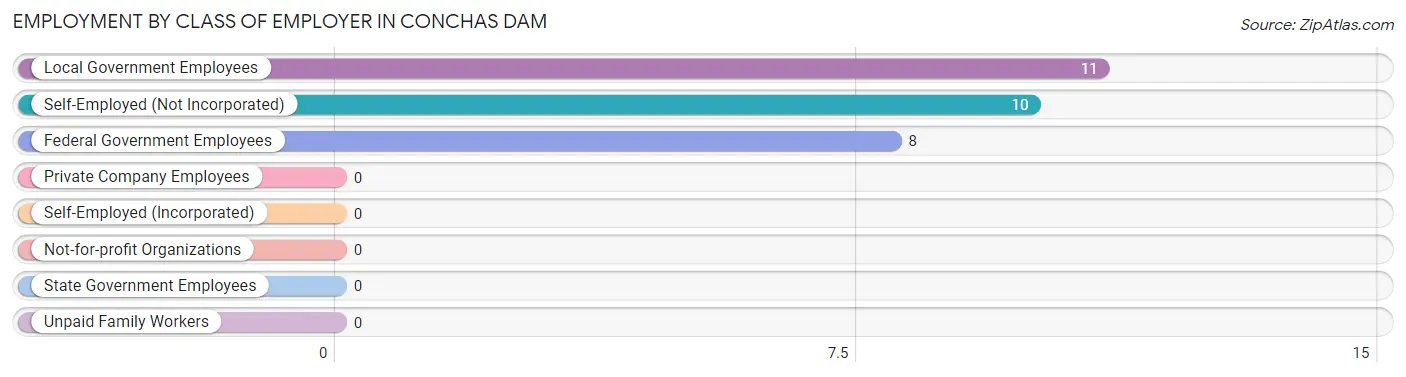
Among the 29 employed individuals in Conchas Dam, local government employees (11 | 37.9%), self-employed (not incorporated) (10 | 34.5%), and federal government employees (8 | 27.6%) make up the most common classes of employment.
Employer Class
# Employees
% Employees
Private Company Employees
0
0.0%
Self-Employed (Incorporated)
0
0.0%
Self-Employed (Not Incorporated)
10
34.5%
Not-for-profit Organizations
0
0.0%
Local Government Employees
11
37.9%
State Government Employees
0
0.0%
Federal Government Employees
8
27.6%
Unpaid Family Workers
0
0.0%
Total
29
100.0%
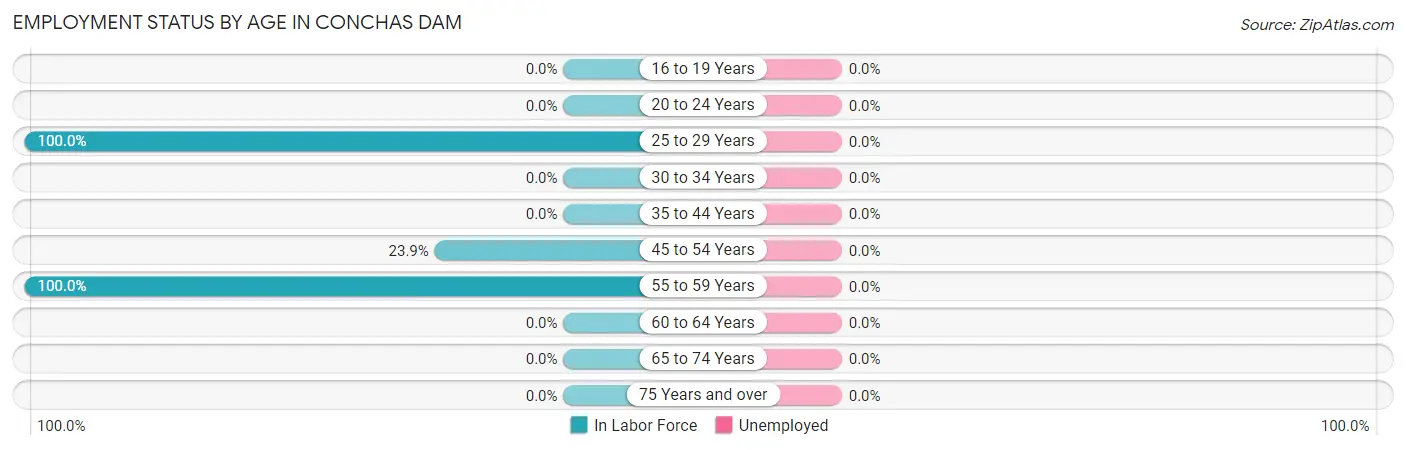
Employment Status by Age in Conchas Dam
Age Bracket
In Labor Force
Unemployed
16 to 19 Years
0 (0.0%)
0 (0.0%)
20 to 24 Years
0 (0.0%)
0 (0.0%)
25 to 29 Years
8 (100.0%)
0 (0.0%)
30 to 34 Years
0 (0.0%)
0 (0.0%)
35 to 44 Years
0 (0.0%)
0 (0.0%)
45 to 54 Years
11 (23.9%)
0 (0.0%)
55 to 59 Years
10 (100.0%)
0 (0.0%)
60 to 64 Years
0 (0.0%)
0 (0.0%)
65 to 74 Years
0 (0.0%)
0 (0.0%)
75 Years and over
0 (0.0%)
0 (0.0%)
Total
29 (19.7%)
0 (0.0%)
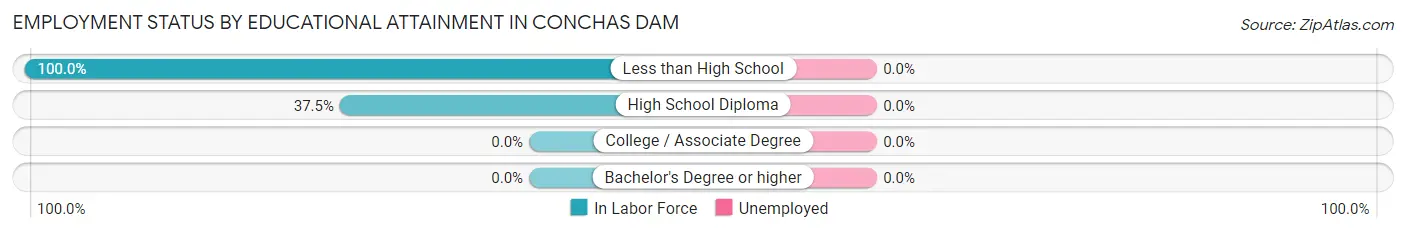
Employment Status by Educational Attainment in Conchas Dam
Educational Attainment
In Labor Force
Unemployed
Less than High School
8 (100.0%)
0 (0.0%)
High School Diploma
21 (37.5%)
0 (0.0%)
College / Associate Degree
0 (0.0%)
0 (0.0%)
Bachelor's Degree or higher
0 (0.0%)
0 (0.0%)
Total
29 (45.3%)
0 (0.0%)
Employment Occupations by Sex in Conchas Dam
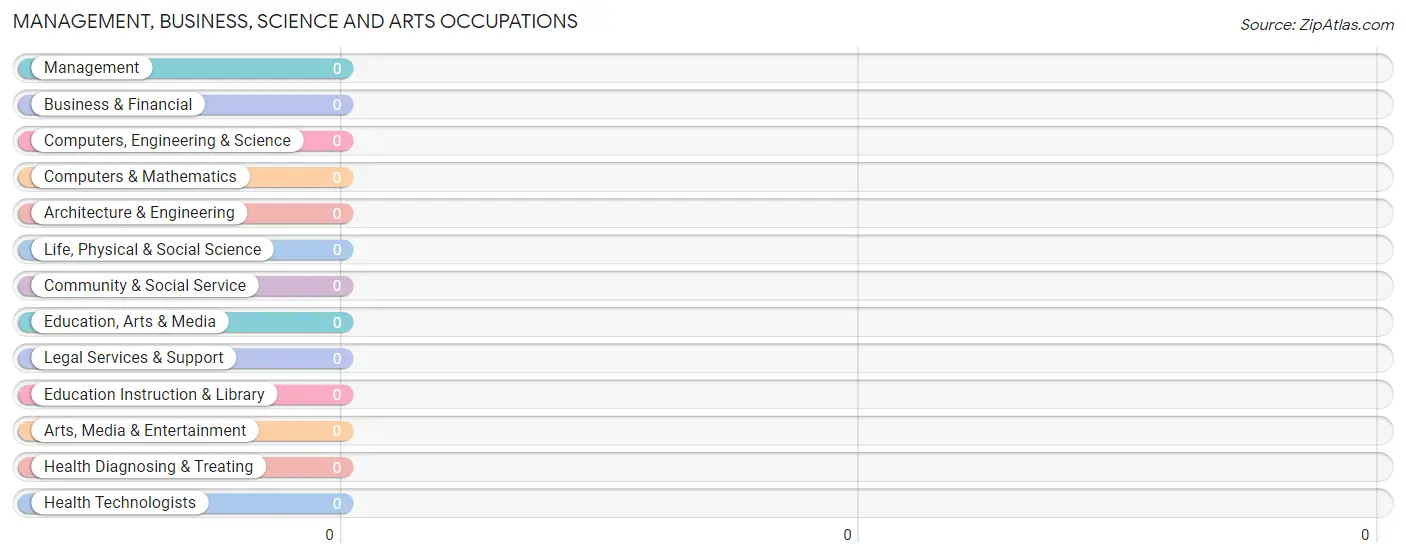
Management, Business, Science and Arts Occupations
Management, Business, Science and Arts Occupations by Sex
Occupation
Male
Female
Management
0 (0.0%)
0 (0.0%)
Business & Financial
0 (0.0%)
0 (0.0%)
Computers, Engineering & Science
0 (0.0%)
0 (0.0%)
Computers & Mathematics
0 (0.0%)
0 (0.0%)
Architecture & Engineering
0 (0.0%)
0 (0.0%)
Life, Physical & Social Science
0 (0.0%)
0 (0.0%)
Community & Social Service
0 (0.0%)
0 (0.0%)
Education, Arts & Media
0 (0.0%)
0 (0.0%)
Legal Services & Support
0 (0.0%)
0 (0.0%)
Education Instruction & Library
0 (0.0%)
0 (0.0%)
Arts, Media & Entertainment
0 (0.0%)
0 (0.0%)
Health Diagnosing & Treating
0 (0.0%)
0 (0.0%)
Health Technologists
0 (0.0%)
0 (0.0%)
Total (Category)
0 (0.0%)
0 (0.0%)
Total (Overall)
29 (100.0%)
0 (0.0%)
Services Occupations
Services Occupations by Sex
Occupation
Male
Female
Healthcare Support
0 (0.0%)
0 (0.0%)
Security & Protection
0 (0.0%)
0 (0.0%)
Firefighting & Prevention
0 (0.0%)
0 (0.0%)
Law Enforcement
0 (0.0%)
0 (0.0%)
Food Preparation & Serving
0 (0.0%)
0 (0.0%)
Cleaning & Maintenance
0 (0.0%)
0 (0.0%)
Personal Care & Service
0 (0.0%)
0 (0.0%)
Total (Category)
0 (0.0%)
0 (0.0%)
Total (Overall)
29 (100.0%)
0 (0.0%)
Sales and Office Occupations
Sales and Office Occupations by Sex
Occupation
Male
Female
Sales & Related
0 (0.0%)
0 (0.0%)
Office & Administration
0 (0.0%)
0 (0.0%)
Total (Category)
0 (0.0%)
0 (0.0%)
Total (Overall)
29 (100.0%)
0 (0.0%)
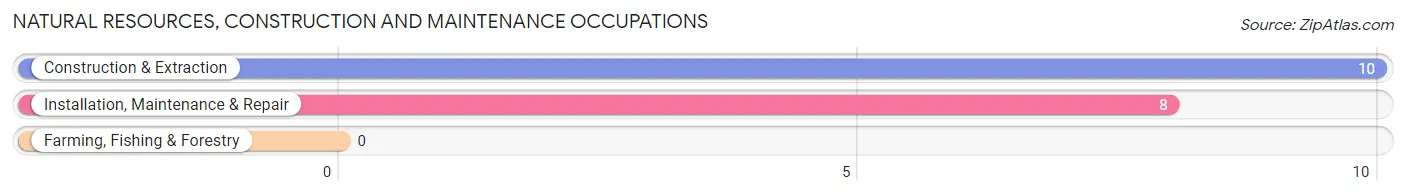
Natural Resources, Construction and Maintenance Occupations
The most common Natural Resources, Construction and Maintenance occupations in Conchas Dam are Construction & Extraction (10 | 34.5%), and Installation, Maintenance & Repair (8 | 27.6%).
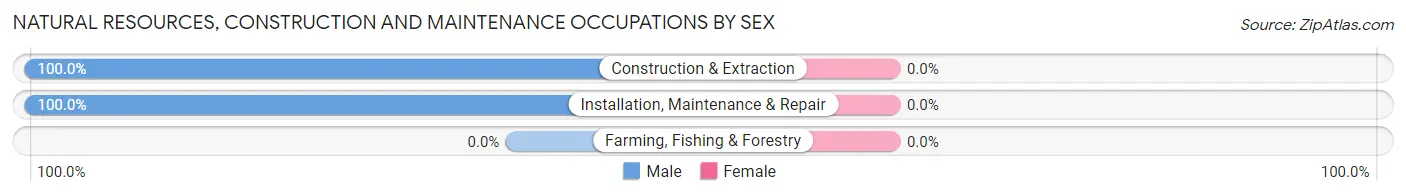
Natural Resources, Construction and Maintenance Occupations by Sex
Occupation
Male
Female
Farming, Fishing & Forestry
0 (0.0%)
0 (0.0%)
Construction & Extraction
10 (100.0%)
0 (0.0%)
Installation, Maintenance & Repair
8 (100.0%)
0 (0.0%)
Total (Category)
18 (100.0%)
0 (0.0%)
Total (Overall)
29 (100.0%)
0 (0.0%)
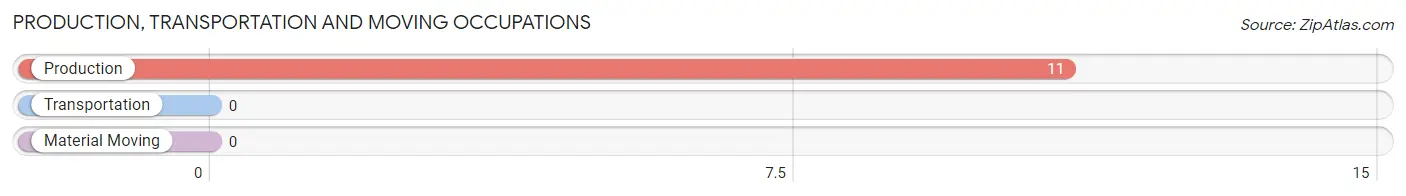
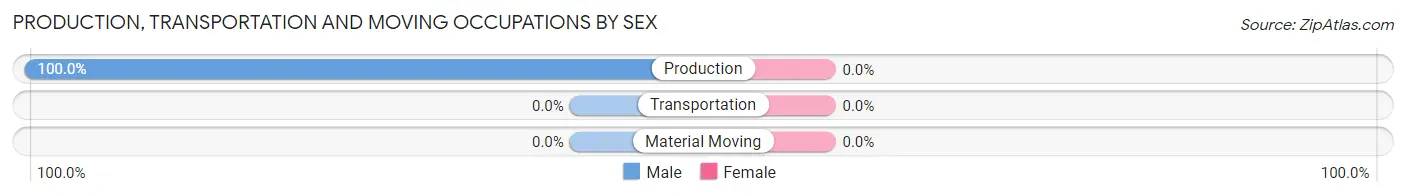
Production, Transportation and Moving Occupations
The most common Production, Transportation and Moving occupations in Conchas Dam are , and Production (11 | 37.9%).
Production, Transportation and Moving Occupations by Sex
Occupation
Male
Female
Production
11 (100.0%)
0 (0.0%)
Transportation
0 (0.0%)
0 (0.0%)
Material Moving
0 (0.0%)
0 (0.0%)
Total (Category)
11 (100.0%)
0 (0.0%)
Total (Overall)
29 (100.0%)
0 (0.0%)
Employment Industries by Sex in Conchas Dam
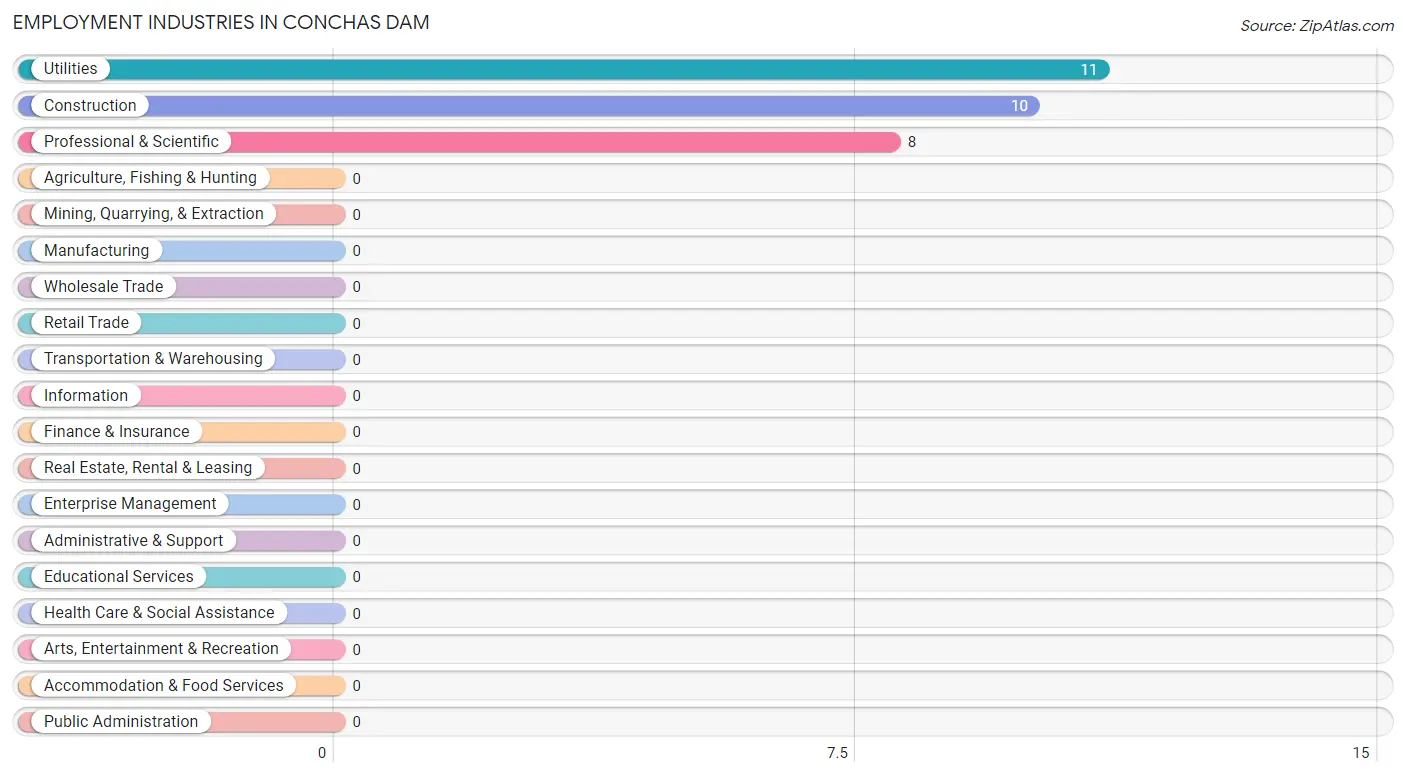
Employment Industries in Conchas Dam
The major employment industries in Conchas Dam include Utilities (11 | 37.9%), Construction (10 | 34.5%), and Professional & Scientific (8 | 27.6%).
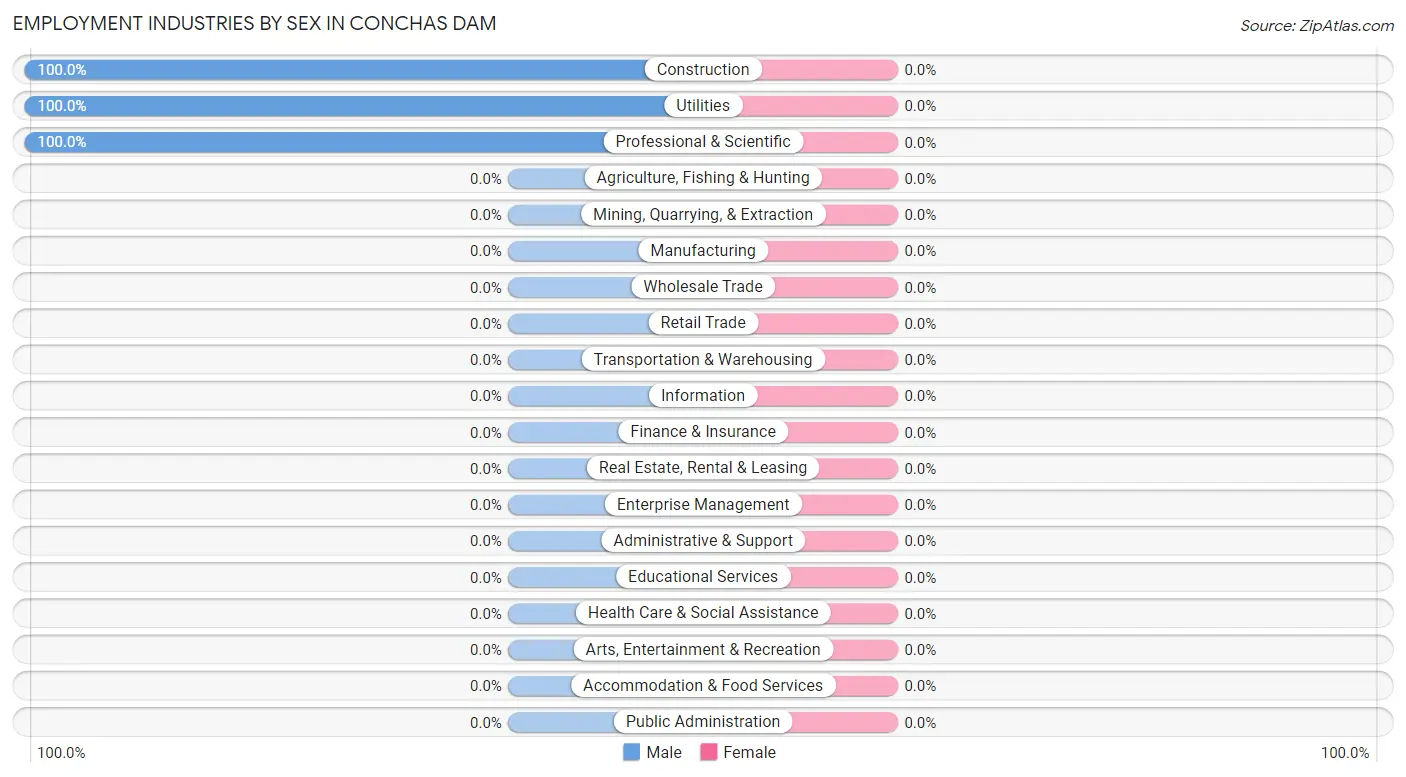
Employment Industries by Sex in Conchas Dam
Industry
Male
Female
Agriculture, Fishing & Hunting
0 (0.0%)
0 (0.0%)
Mining, Quarrying, & Extraction
0 (0.0%)
0 (0.0%)
Construction
10 (100.0%)
0 (0.0%)
Manufacturing
0 (0.0%)
0 (0.0%)
Wholesale Trade
0 (0.0%)
0 (0.0%)
Retail Trade
0 (0.0%)
0 (0.0%)
Transportation & Warehousing
0 (0.0%)
0 (0.0%)
Utilities
11 (100.0%)
0 (0.0%)
Information
0 (0.0%)
0 (0.0%)
Finance & Insurance
0 (0.0%)
0 (0.0%)
Real Estate, Rental & Leasing
0 (0.0%)
0 (0.0%)
Professional & Scientific
8 (100.0%)
0 (0.0%)
Enterprise Management
0 (0.0%)
0 (0.0%)
Administrative & Support
0 (0.0%)
0 (0.0%)
Educational Services
0 (0.0%)
0 (0.0%)
Health Care & Social Assistance
0 (0.0%)
0 (0.0%)
Arts, Entertainment & Recreation
0 (0.0%)
0 (0.0%)
Accommodation & Food Services
0 (0.0%)
0 (0.0%)
Public Administration
0 (0.0%)
0 (0.0%)
Total
29 (100.0%)
0 (0.0%)
Education in Conchas Dam
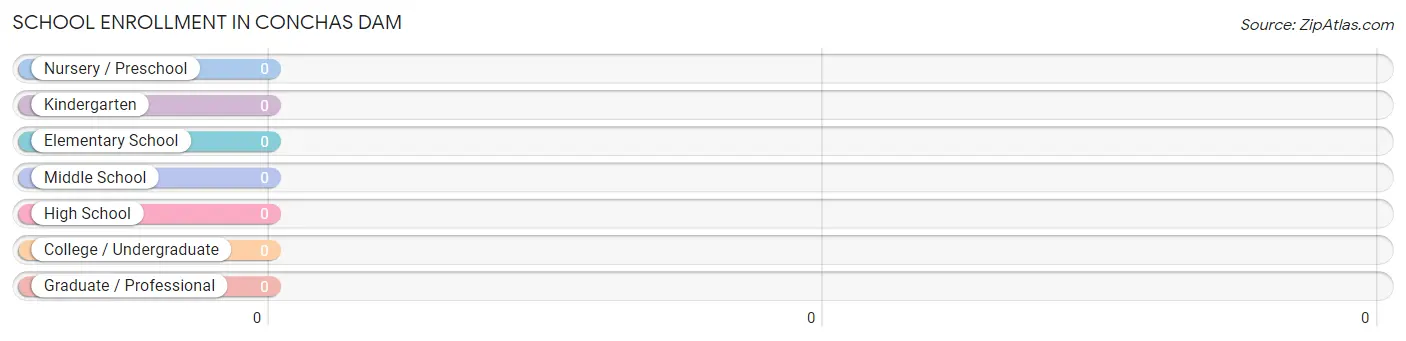
School Enrollment in Conchas Dam
School Level
# Students
% Students
Nursery / Preschool
0
0.0%
Kindergarten
0
0.0%
Elementary School
0
0.0%
Middle School
0
0.0%
High School
0
0.0%
College / Undergraduate
0
0.0%
Graduate / Professional
0
0.0%
Total
0
0.0%
School Enrollment by Age by Funding Source in Conchas Dam
Age Bracket
Public School
Private School
3 to 4 Year Olds
0 (0.0%)
0 (0.0%)
5 to 9 Year Old
0 (0.0%)
0 (0.0%)
10 to 14 Year Olds
0 (0.0%)
0 (0.0%)
15 to 17 Year Olds
0 (0.0%)
0 (0.0%)
18 to 19 Year Olds
0 (0.0%)
0 (0.0%)
20 to 24 Year Olds
0 (0.0%)
0 (0.0%)
25 to 34 Year Olds
0 (0.0%)
0 (0.0%)
35 Years and over
0 (0.0%)
0 (0.0%)
Total
0 (0.0%)
0 (0.0%)
Educational Attainment by Field of Study in Conchas Dam
Field of Study
# Graduates
% Graduates
Computers & Mathematics
0
0.0%
Bio, Nature & Agricultural
0
0.0%
Physical & Health Sciences
0
0.0%
Psychology
0
0.0%
Social Sciences
0
0.0%
Engineering
0
0.0%
Multidisciplinary Studies
0
0.0%
Science & Technology
0
0.0%
Business
0
0.0%
Education
0
0.0%
Literature & Languages
0
0.0%
Liberal Arts & History
0
0.0%
Visual & Performing Arts
0
0.0%
Communications
0
0.0%
Arts & Humanities
0
0.0%
Total
0
0.0%
Transportation & Commute in Conchas Dam
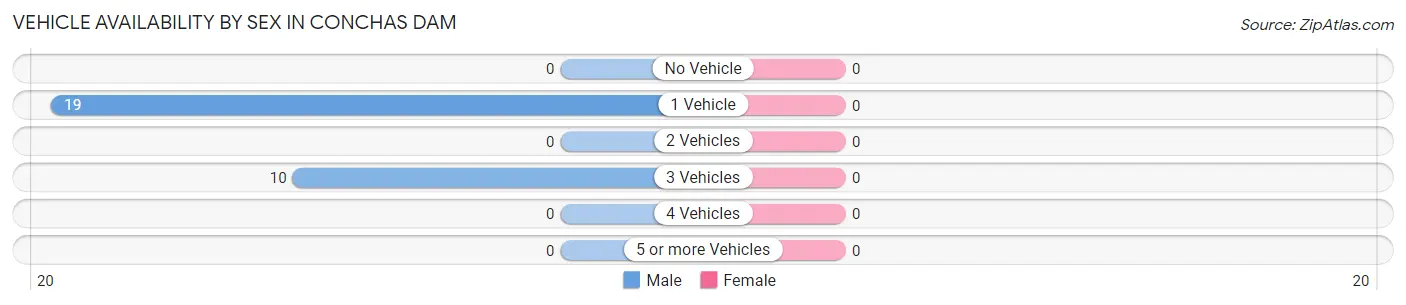
Vehicle Availability by Sex in Conchas Dam
Vehicles Available
Male
Female
No Vehicle
0 (0.0%)
0 (0.0%)
1 Vehicle
19 (65.5%)
0 (0.0%)
2 Vehicles
0 (0.0%)
0 (0.0%)
3 Vehicles
10 (34.5%)
0 (0.0%)
4 Vehicles
0 (0.0%)
0 (0.0%)
5 or more Vehicles
0 (0.0%)
0 (0.0%)
Total
29 (100.0%)
0 (0.0%)
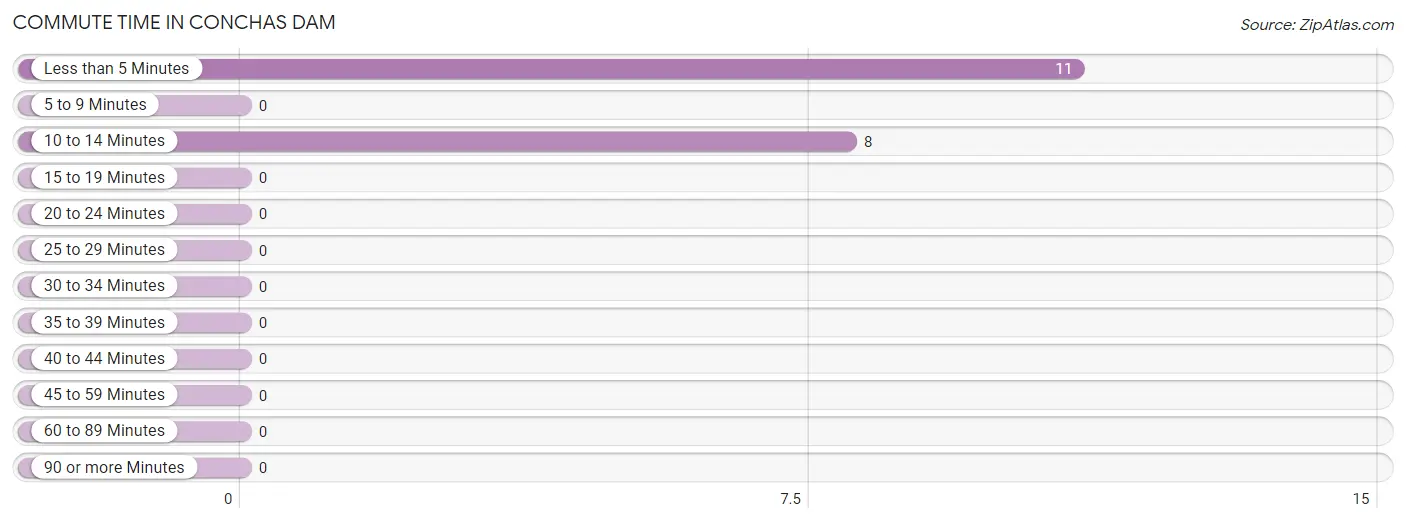
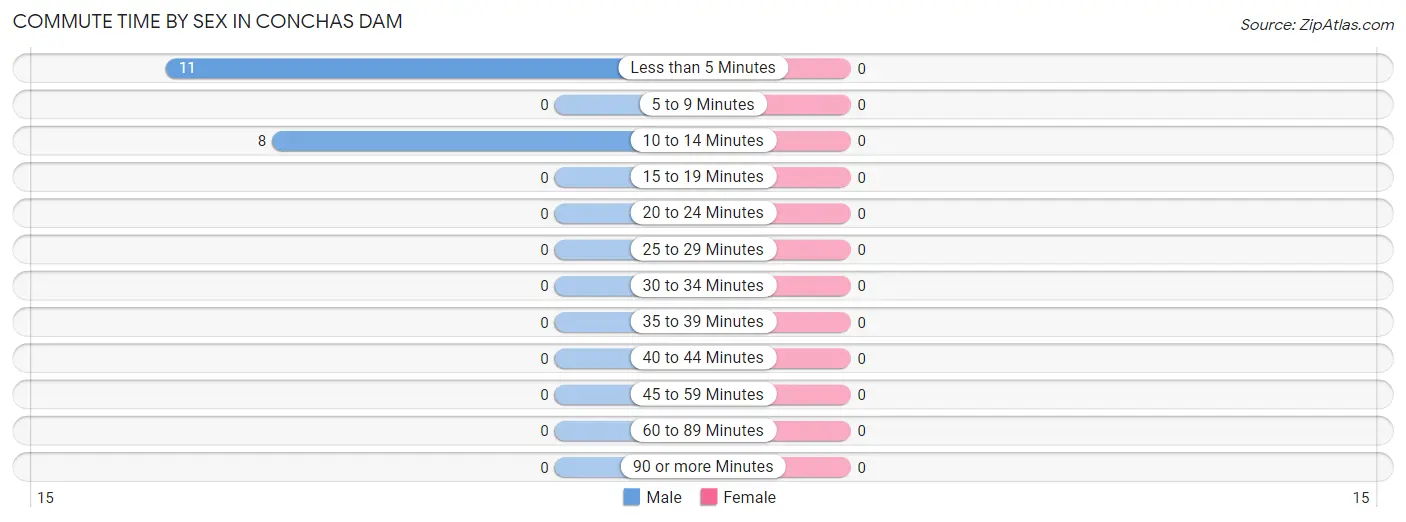
Commute Time in Conchas Dam
The most frequently occuring commute durations in Conchas Dam are less than 5 minutes (11 commuters, 57.9%), 10 to 14 minutes (8 commuters, 42.1%), and 5 to 9 minutes (0 commuters, 0.0%).
Commute Time
# Commuters
% Commuters
Less than 5 Minutes
11
57.9%
5 to 9 Minutes
0
0.0%
10 to 14 Minutes
8
42.1%
15 to 19 Minutes
0
0.0%
20 to 24 Minutes
0
0.0%
25 to 29 Minutes
0
0.0%
30 to 34 Minutes
0
0.0%
35 to 39 Minutes
0
0.0%
40 to 44 Minutes
0
0.0%
45 to 59 Minutes
0
0.0%
60 to 89 Minutes
0
0.0%
90 or more Minutes
0
0.0%
Commute Time by Sex in Conchas Dam
Commute Time
Male
Female
Less than 5 Minutes
11 (57.9%)
0 (0.0%)
5 to 9 Minutes
0 (0.0%)
0 (0.0%)
10 to 14 Minutes
8 (42.1%)
0 (0.0%)
15 to 19 Minutes
0 (0.0%)
0 (0.0%)
20 to 24 Minutes
0 (0.0%)
0 (0.0%)
25 to 29 Minutes
0 (0.0%)
0 (0.0%)
30 to 34 Minutes
0 (0.0%)
0 (0.0%)
35 to 39 Minutes
0 (0.0%)
0 (0.0%)
40 to 44 Minutes
0 (0.0%)
0 (0.0%)
45 to 59 Minutes
0 (0.0%)
0 (0.0%)
60 to 89 Minutes
0 (0.0%)
0 (0.0%)
90 or more Minutes
0 (0.0%)
0 (0.0%)
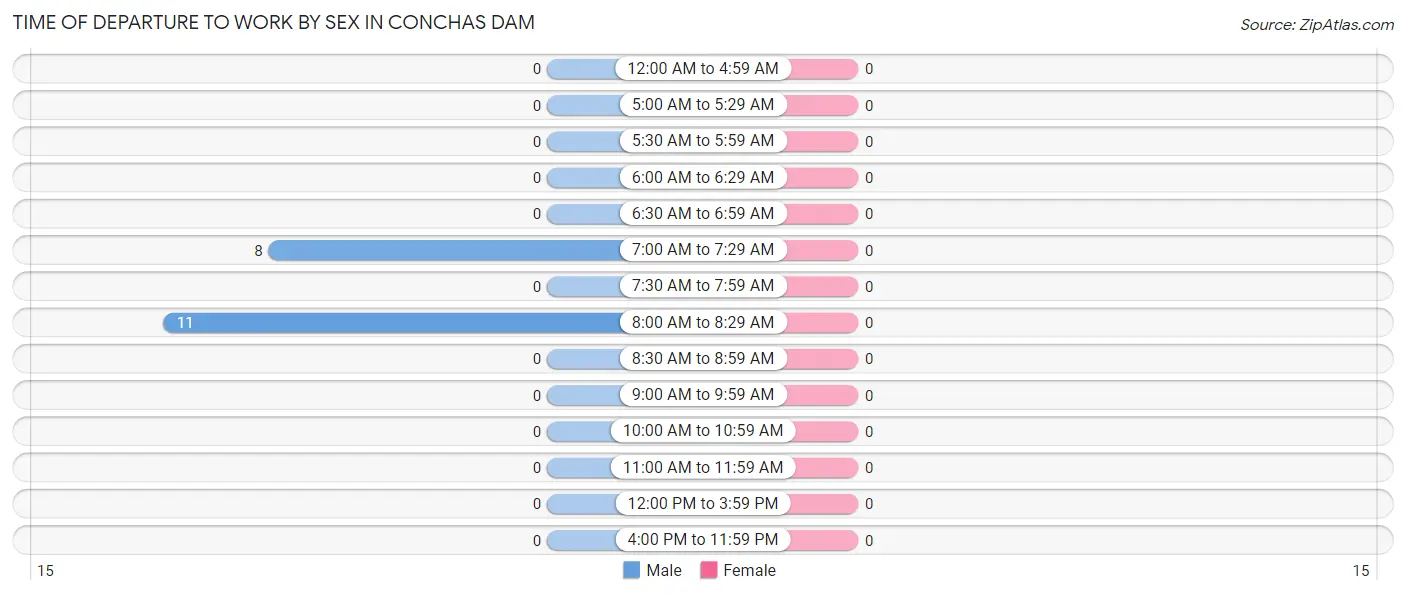
Time of Departure to Work by Sex in Conchas Dam
Time of Departure
Male
Female
12:00 AM to 4:59 AM
0 (0.0%)
0 (0.0%)
5:00 AM to 5:29 AM
0 (0.0%)
0 (0.0%)
5:30 AM to 5:59 AM
0 (0.0%)
0 (0.0%)
6:00 AM to 6:29 AM
0 (0.0%)
0 (0.0%)
6:30 AM to 6:59 AM
0 (0.0%)
0 (0.0%)
7:00 AM to 7:29 AM
8 (42.1%)
0 (0.0%)
7:30 AM to 7:59 AM
0 (0.0%)
0 (0.0%)
8:00 AM to 8:29 AM
11 (57.9%)
0 (0.0%)
8:30 AM to 8:59 AM
0 (0.0%)
0 (0.0%)
9:00 AM to 9:59 AM
0 (0.0%)
0 (0.0%)
10:00 AM to 10:59 AM
0 (0.0%)
0 (0.0%)
11:00 AM to 11:59 AM
0 (0.0%)
0 (0.0%)
12:00 PM to 3:59 PM
0 (0.0%)
0 (0.0%)
4:00 PM to 11:59 PM
0 (0.0%)
0 (0.0%)
Total
19 (100.0%)
0 (0.0%)
Housing Occupancy in Conchas Dam
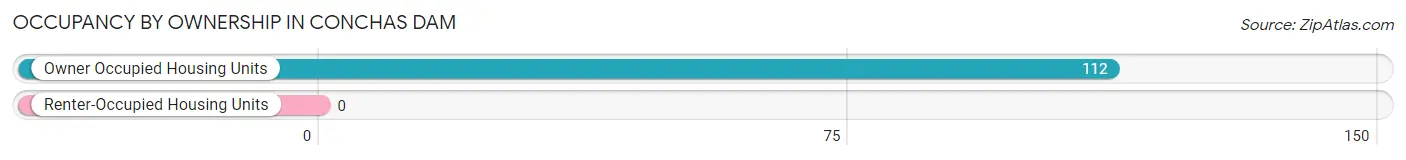
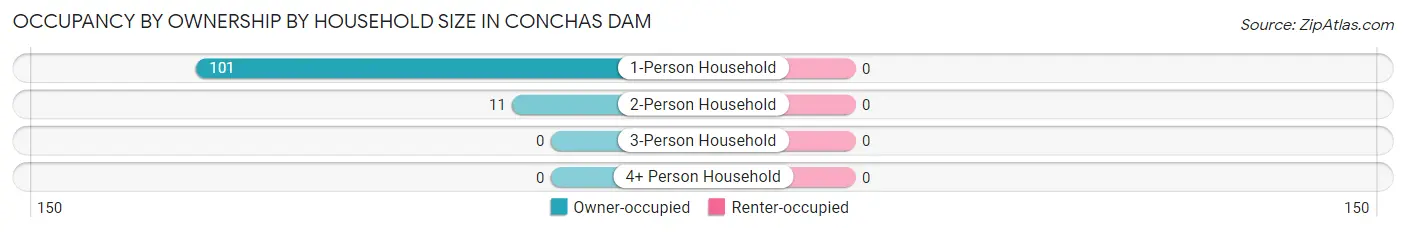
Occupancy by Ownership in Conchas Dam
Of the total 112 dwellings in Conchas Dam, owner-occupied units account for 112 (100.0%), while renter-occupied units make up 0 (0.0%).
Occupancy
# Housing Units
% Housing Units
Owner Occupied Housing Units
112
100.0%
Renter-Occupied Housing Units
0
0.0%
Total Occupied Housing Units
112
100.0%
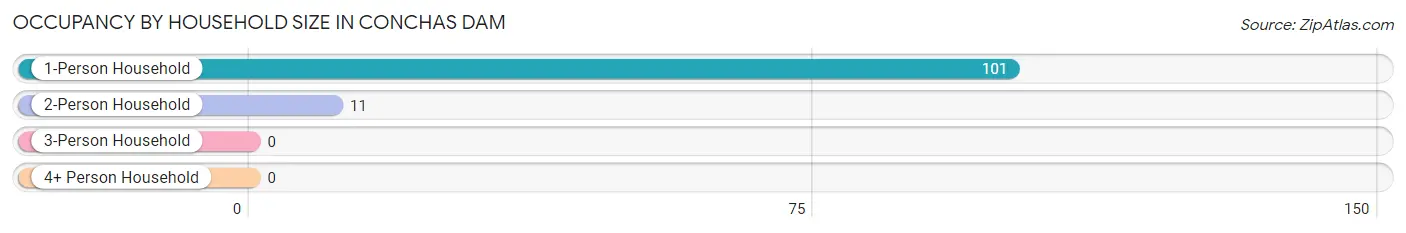
Occupancy by Household Size in Conchas Dam
Household Size
# Housing Units
% Housing Units
1-Person Household
101
90.2%
2-Person Household
11
9.8%
3-Person Household
0
0.0%
4+ Person Household
0
0.0%
Total Housing Units
112
100.0%
Occupancy by Ownership by Household Size in Conchas Dam
Household Size
Owner-occupied
Renter-occupied
1-Person Household
101 (100.0%)
0 (0.0%)
2-Person Household
11 (100.0%)
0 (0.0%)
3-Person Household
0 (0.0%)
0 (0.0%)
4+ Person Household
0 (0.0%)
0 (0.0%)
Total Housing Units
112 (100.0%)
0 (0.0%)
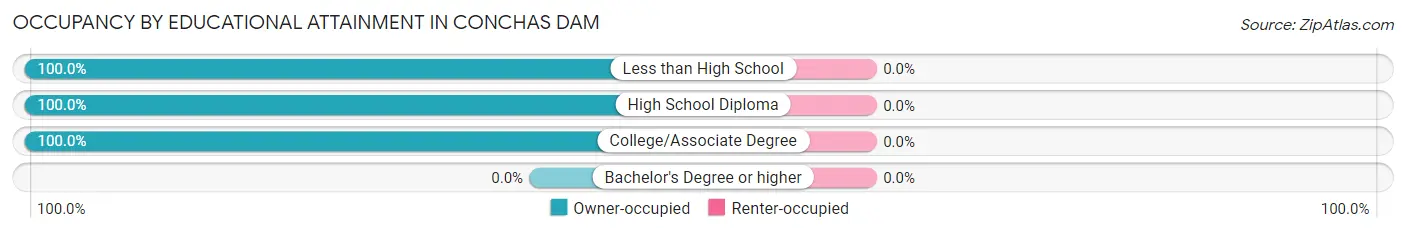
Occupancy by Educational Attainment in Conchas Dam
Household Size
Owner-occupied
Renter-occupied
Less than High School
8 (100.0%)
0 (0.0%)
High School Diploma
58 (100.0%)
0 (0.0%)
College/Associate Degree
46 (100.0%)
0 (0.0%)
Bachelor's Degree or higher
0 (0.0%)
0 (0.0%)
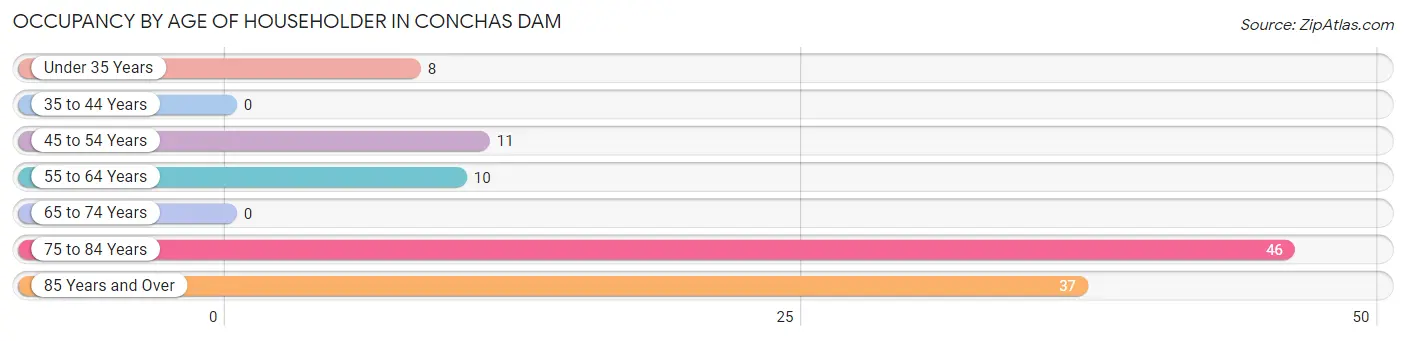
Occupancy by Age of Householder in Conchas Dam
Age Bracket
# Households
% Households
Under 35 Years
8
7.1%
35 to 44 Years
0
0.0%
45 to 54 Years
11
9.8%
55 to 64 Years
10
8.9%
65 to 74 Years
0
0.0%
75 to 84 Years
46
41.1%
85 Years and Over
37
33.0%
Total
112
100.0%
Housing Finances in Conchas Dam
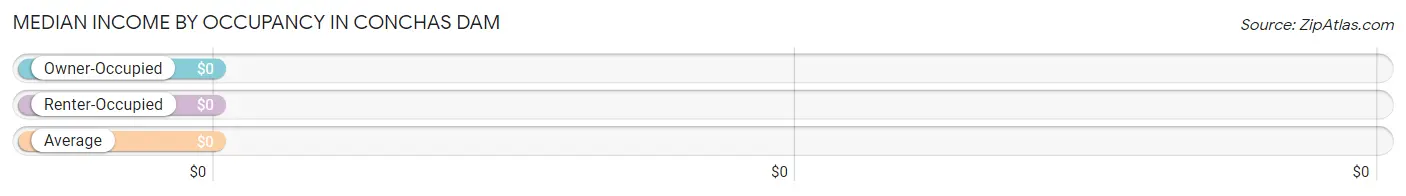
Median Income by Occupancy in Conchas Dam
Occupancy Type
# Households
Median Income
Owner-Occupied
112 (100.0%)
$0
Renter-Occupied
0 (0.0%)
$0
Average
112 (100.0%)
$0
Occupancy by Householder Income Bracket in Conchas Dam
Income Bracket
Owner-occupied
Renter-occupied
Less than $5,000
0 (0.0%)
0 (0.0%)
$5,000 to $9,999
0 (0.0%)
0 (0.0%)
$10,000 to $14,999
10 (8.9%)
0 (0.0%)
$15,000 to $19,999
46 (41.1%)
0 (0.0%)
$20,000 to $24,999
0 (0.0%)
0 (0.0%)
$25,000 to $34,999
8 (7.1%)
0 (0.0%)
$35,000 to $49,999
0 (0.0%)
0 (0.0%)
$50,000 to $74,999
0 (0.0%)
0 (0.0%)
$75,000 to $99,999
48 (42.9%)
0 (0.0%)
$100,000 to $149,999
0 (0.0%)
0 (0.0%)
$150,000 or more
0 (0.0%)
0 (0.0%)
Total
112 (100.0%)
0 (0.0%)
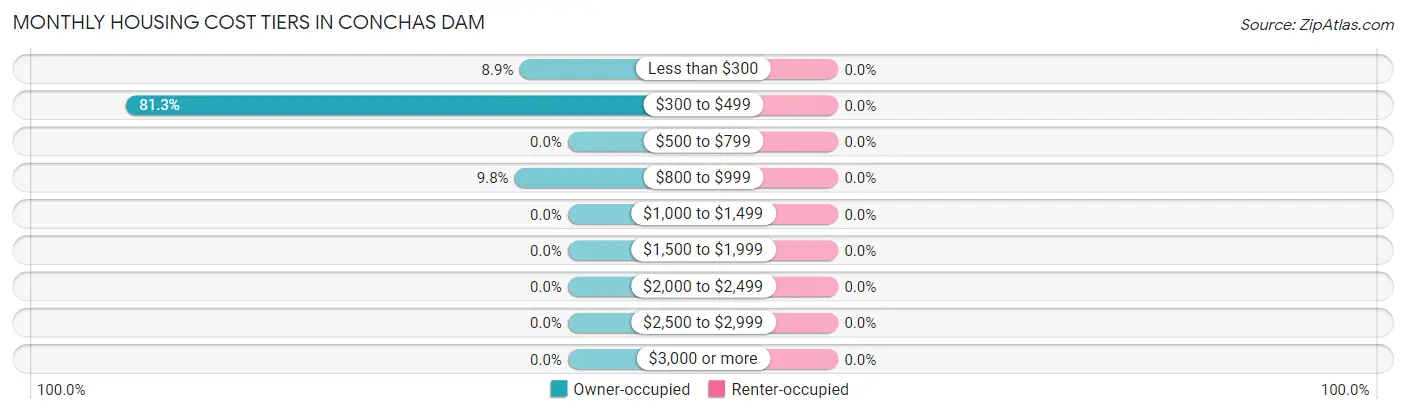
Monthly Housing Cost Tiers in Conchas Dam
Monthly Cost
Owner-occupied
Renter-occupied
Less than $300
10 (8.9%)
0 (0.0%)
$300 to $499
91 (81.2%)
0 (0.0%)
$500 to $799
0 (0.0%)
0 (0.0%)
$800 to $999
11 (9.8%)
0 (0.0%)
$1,000 to $1,499
0 (0.0%)
0 (0.0%)
$1,500 to $1,999
0 (0.0%)
0 (0.0%)
$2,000 to $2,499
0 (0.0%)
0 (0.0%)
$2,500 to $2,999
0 (0.0%)
0 (0.0%)
$3,000 or more
0 (0.0%)
0 (0.0%)
Total
112 (100.0%)
0 (0.0%)
Physical Housing Characteristics in Conchas Dam
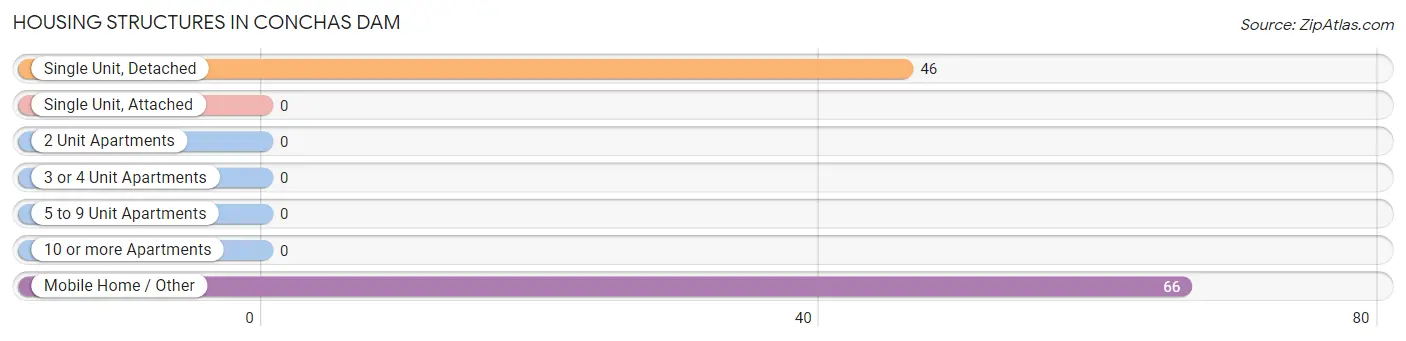
Housing Structures in Conchas Dam
Structure Type
# Housing Units
% Housing Units
Single Unit, Detached
46
41.1%
Single Unit, Attached
0
0.0%
2 Unit Apartments
0
0.0%
3 or 4 Unit Apartments
0
0.0%
5 to 9 Unit Apartments
0
0.0%
10 or more Apartments
0
0.0%
Mobile Home / Other
66
58.9%
Total
112
100.0%
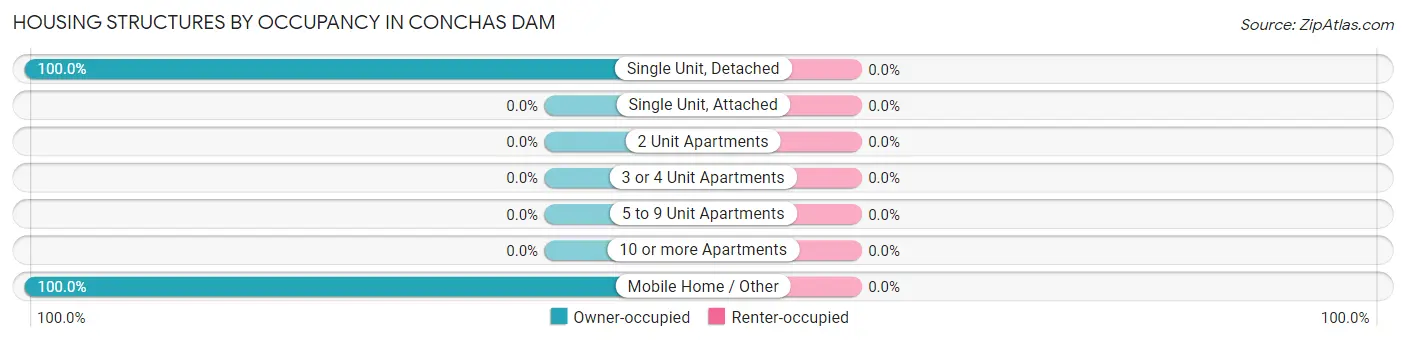
Housing Structures by Occupancy in Conchas Dam
Structure Type
Owner-occupied
Renter-occupied
Single Unit, Detached
46 (100.0%)
0 (0.0%)
Single Unit, Attached
0 (0.0%)
0 (0.0%)
2 Unit Apartments
0 (0.0%)
0 (0.0%)
3 or 4 Unit Apartments
0 (0.0%)
0 (0.0%)
5 to 9 Unit Apartments
0 (0.0%)
0 (0.0%)
10 or more Apartments
0 (0.0%)
0 (0.0%)
Mobile Home / Other
66 (100.0%)
0 (0.0%)
Total
112 (100.0%)
0 (0.0%)
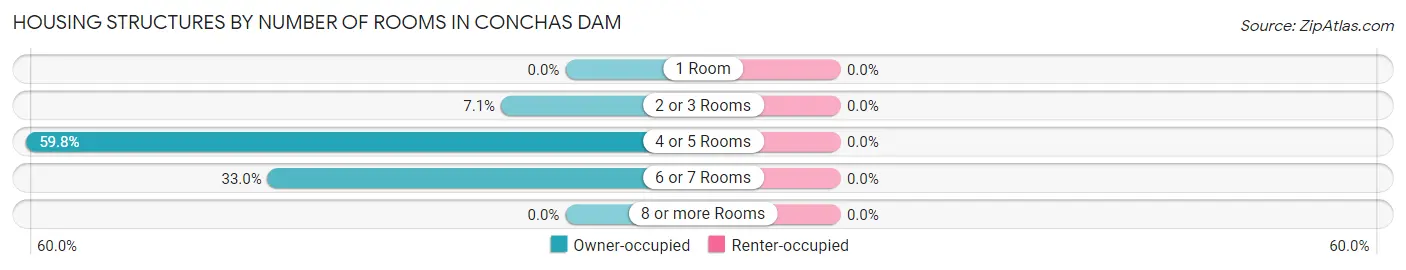
Housing Structures by Number of Rooms in Conchas Dam
Number of Rooms
Owner-occupied
Renter-occupied
1 Room
0 (0.0%)
0 (0.0%)
2 or 3 Rooms
8 (7.1%)
0 (0.0%)
4 or 5 Rooms
67 (59.8%)
0 (0.0%)
6 or 7 Rooms
37 (33.0%)
0 (0.0%)
8 or more Rooms
0 (0.0%)
0 (0.0%)
Total
112 (100.0%)
0 (0.0%)
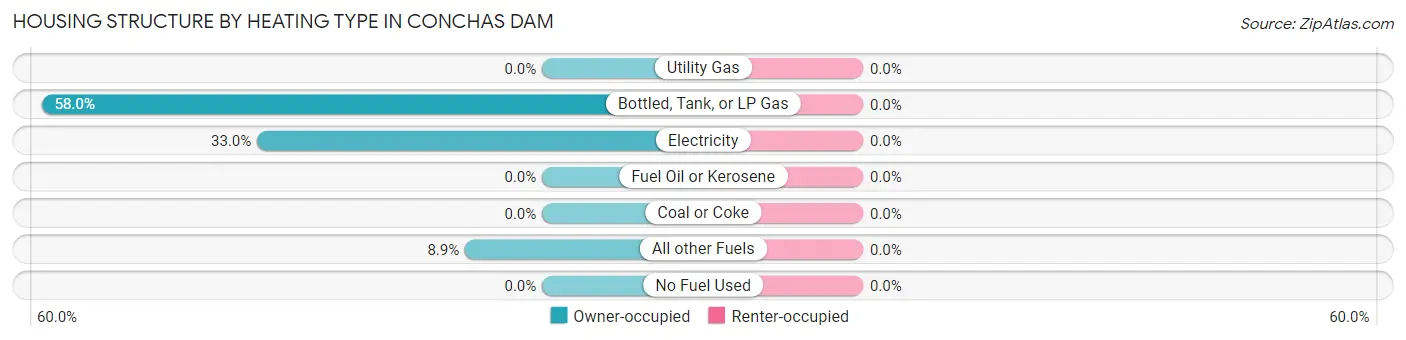
Housing Structure by Heating Type in Conchas Dam
Heating Type
Owner-occupied
Renter-occupied
Utility Gas
0 (0.0%)
0 (0.0%)
Bottled, Tank, or LP Gas
65 (58.0%)
0 (0.0%)
Electricity
37 (33.0%)
0 (0.0%)
Fuel Oil or Kerosene
0 (0.0%)
0 (0.0%)
Coal or Coke
0 (0.0%)
0 (0.0%)
All other Fuels
10 (8.9%)
0 (0.0%)
No Fuel Used
0 (0.0%)
0 (0.0%)
Total
112 (100.0%)
0 (0.0%)
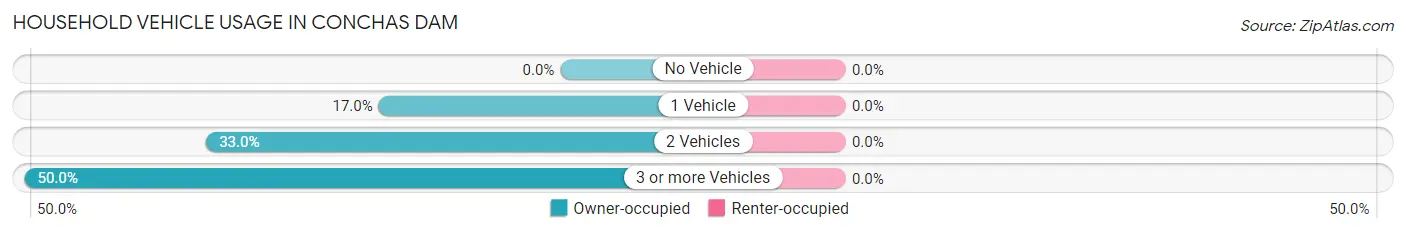
Household Vehicle Usage in Conchas Dam
Vehicles per Household
Owner-occupied
Renter-occupied
No Vehicle
0 (0.0%)
0 (0.0%)
1 Vehicle
19 (17.0%)
0 (0.0%)
2 Vehicles
37 (33.0%)
0 (0.0%)
3 or more Vehicles
56 (50.0%)
0 (0.0%)
Total
112 (100.0%)
0 (0.0%)
Real Estate & Mortgages in Conchas Dam
Real Estate and Mortgage Overview in Conchas Dam
Characteristic
Without Mortgage
With Mortgage
Housing Units
101
11
Median Property Value
-
-
Median Household Income
-
-
Monthly Housing Costs
$338
$0
Real Estate Taxes
-
-
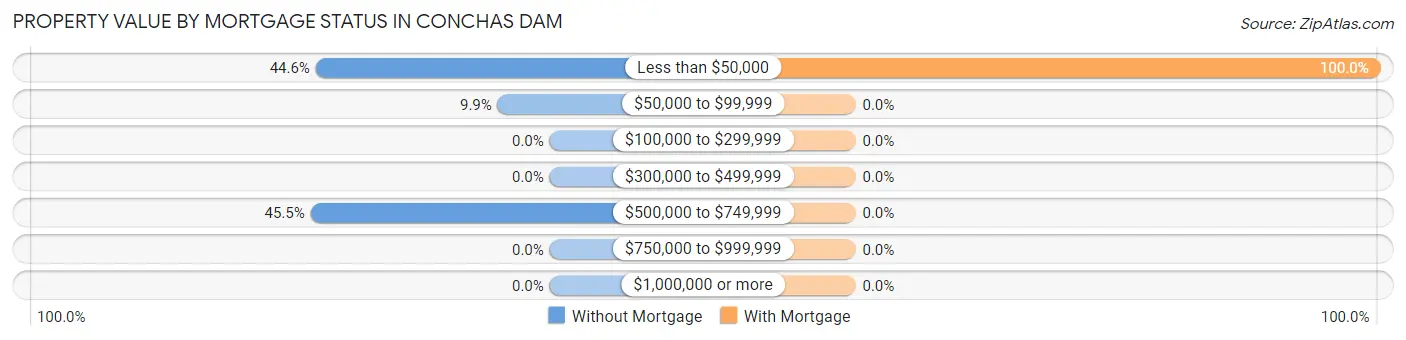
Property Value by Mortgage Status in Conchas Dam
Property Value
Without Mortgage
With Mortgage
Less than $50,000
45 (44.6%)
11 (100.0%)
$50,000 to $99,999
10 (9.9%)
0 (0.0%)
$100,000 to $299,999
0 (0.0%)
0 (0.0%)
$300,000 to $499,999
0 (0.0%)
0 (0.0%)
$500,000 to $749,999
46 (45.5%)
0 (0.0%)
$750,000 to $999,999
0 (0.0%)
0 (0.0%)
$1,000,000 or more
0 (0.0%)
0 (0.0%)
Total
101 (100.0%)
11 (100.0%)
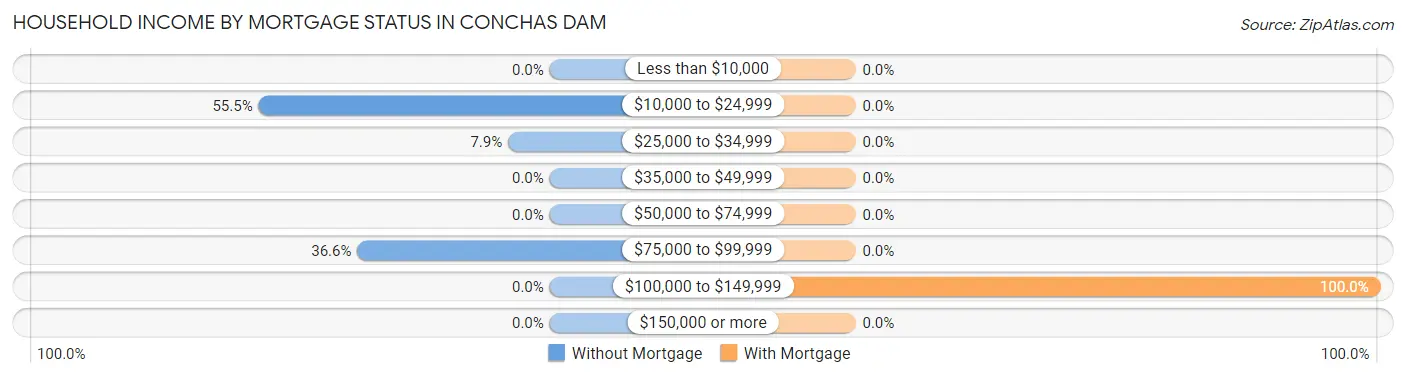
Household Income by Mortgage Status in Conchas Dam
Household Income
Without Mortgage
With Mortgage
Less than $10,000
0 (0.0%)
0 (0.0%)
$10,000 to $24,999
56 (55.4%)
0 (0.0%)
$25,000 to $34,999
8 (7.9%)
0 (0.0%)
$35,000 to $49,999
0 (0.0%)
0 (0.0%)
$50,000 to $74,999
0 (0.0%)
0 (0.0%)
$75,000 to $99,999
37 (36.6%)
0 (0.0%)
$100,000 to $149,999
0 (0.0%)
11 (100.0%)
$150,000 or more
0 (0.0%)
0 (0.0%)
Total
101 (100.0%)
11 (100.0%)
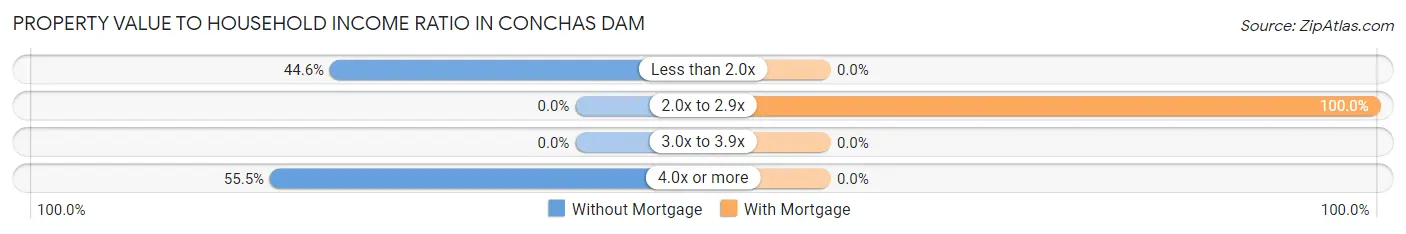
Property Value to Household Income Ratio in Conchas Dam
Value-to-Income Ratio
Without Mortgage
With Mortgage
Less than 2.0x
45 (44.6%)
0 (0.0%)
2.0x to 2.9x
0 (0.0%)
11 (100.0%)
3.0x to 3.9x
0 (0.0%)
0 (0.0%)
4.0x or more
56 (55.4%)
0 (0.0%)
Total
101 (100.0%)
11 (100.0%)
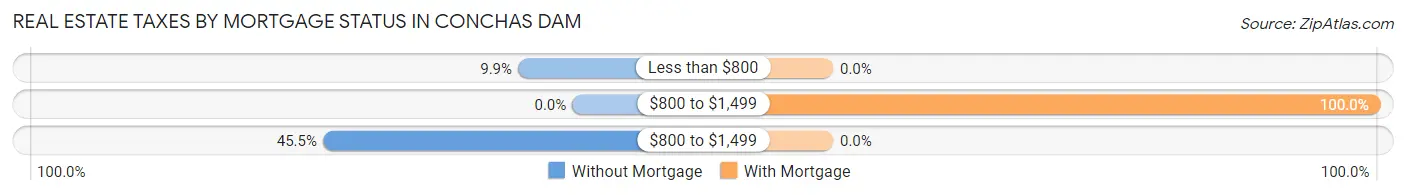
Real Estate Taxes by Mortgage Status in Conchas Dam
Property Taxes
Without Mortgage
With Mortgage
Less than $800
10 (9.9%)
0 (0.0%)
$800 to $1,499
0 (0.0%)
11 (100.0%)
$800 to $1,499
46 (45.5%)
0 (0.0%)
Total
101 (100.0%)
11 (100.0%)
Health & Disability in Conchas Dam
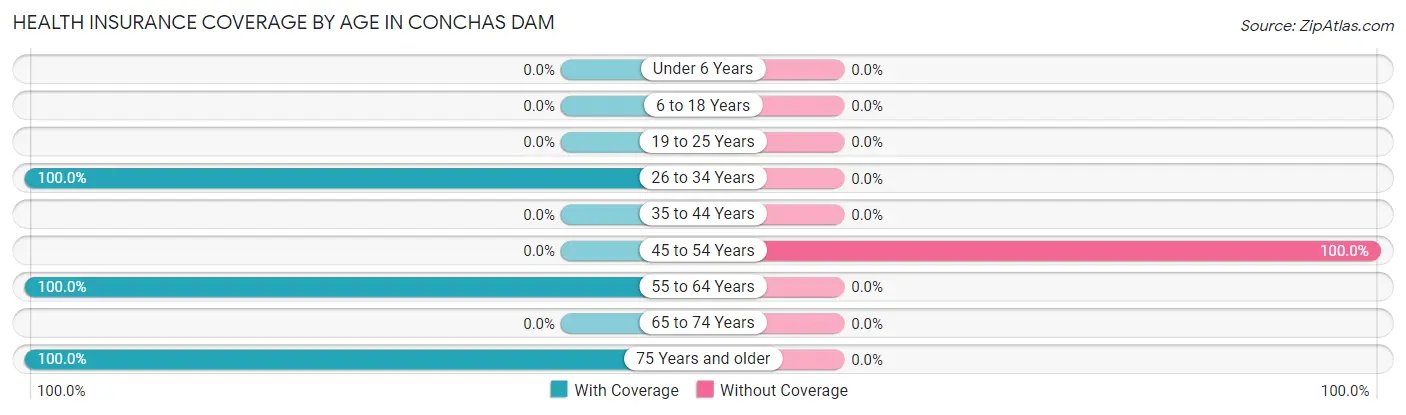
Health Insurance Coverage by Age in Conchas Dam
Age Bracket
With Coverage
Without Coverage
Under 6 Years
0 (0.0%)
0 (0.0%)
6 to 18 Years
0 (0.0%)
0 (0.0%)
19 to 25 Years
0 (0.0%)
0 (0.0%)
26 to 34 Years
8 (100.0%)
0 (0.0%)
35 to 44 Years
0 (0.0%)
0 (0.0%)
45 to 54 Years
0 (0.0%)
46 (100.0%)
55 to 64 Years
10 (100.0%)
0 (0.0%)
65 to 74 Years
0 (0.0%)
0 (0.0%)
75 Years and older
83 (100.0%)
0 (0.0%)
Total
101 (68.7%)
46 (31.3%)
Health Insurance Coverage by Citizenship Status in Conchas Dam
Citizenship Status
With Coverage
Without Coverage
Native Born
0 (0.0%)
0 (0.0%)
Foreign Born, Citizen
0 (0.0%)
0 (0.0%)
Foreign Born, not a Citizen
0 (0.0%)
0 (0.0%)
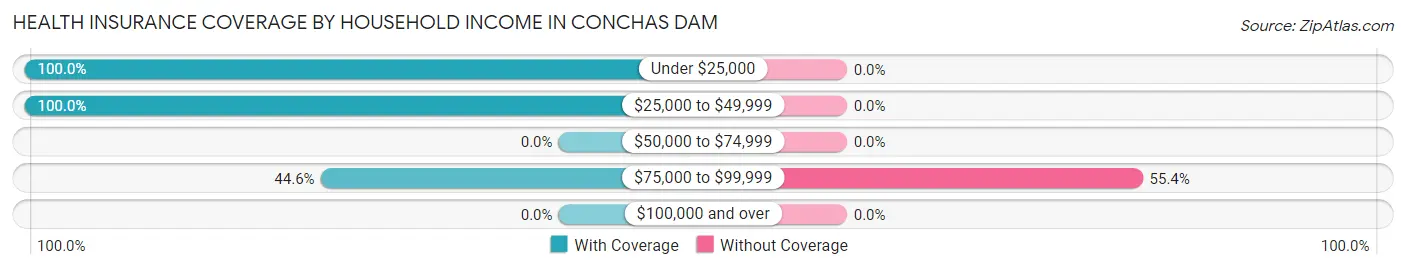
Health Insurance Coverage by Household Income in Conchas Dam
Household Income
With Coverage
Without Coverage
Under $25,000
56 (100.0%)
0 (0.0%)
$25,000 to $49,999
8 (100.0%)
0 (0.0%)
$50,000 to $74,999
0 (0.0%)
0 (0.0%)
$75,000 to $99,999
37 (44.6%)
46 (55.4%)
$100,000 and over
0 (0.0%)
0 (0.0%)
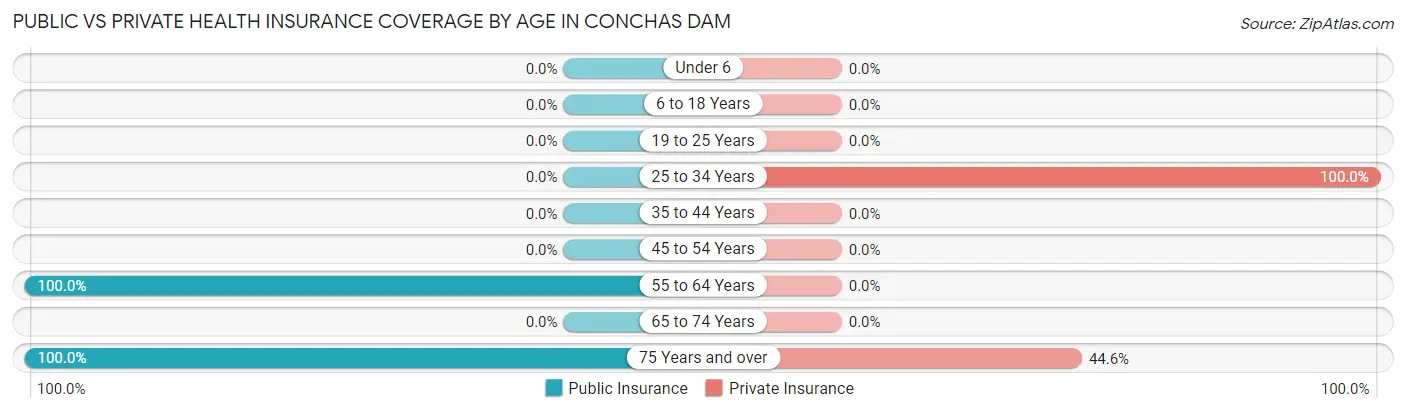
Public vs Private Health Insurance Coverage by Age in Conchas Dam
Age Bracket
Public Insurance
Private Insurance
Under 6
0 (0.0%)
0 (0.0%)
6 to 18 Years
0 (0.0%)
0 (0.0%)
19 to 25 Years
0 (0.0%)
0 (0.0%)
25 to 34 Years
0 (0.0%)
8 (100.0%)
35 to 44 Years
0 (0.0%)
0 (0.0%)
45 to 54 Years
0 (0.0%)
0 (0.0%)
55 to 64 Years
10 (100.0%)
0 (0.0%)
65 to 74 Years
0 (0.0%)
0 (0.0%)
75 Years and over
83 (100.0%)
37 (44.6%)
Total
93 (63.3%)
45 (30.6%)
Disability Status by Sex by Age in Conchas Dam
Age Bracket
Male
Female
Under 5 Years
0 (0.0%)
0 (0.0%)
5 to 17 Years
0 (0.0%)
0 (0.0%)
18 to 34 Years
0 (0.0%)
0 (0.0%)
35 to 64 Years
0 (0.0%)
0 (0.0%)
65 to 74 Years
0 (0.0%)
0 (0.0%)
75 Years and over
0 (0.0%)
0 (0.0%)
Disability Class by Sex by Age in Conchas Dam
Disability Class: Hearing Difficulty
Age Bracket
Male
Female
Under 5 Years
0 (0.0%)
0 (0.0%)
5 to 17 Years
0 (0.0%)
0 (0.0%)
18 to 34 Years
0 (0.0%)
0 (0.0%)
35 to 64 Years
0 (0.0%)
0 (0.0%)
65 to 74 Years
0 (0.0%)
0 (0.0%)
75 Years and over
0 (0.0%)
0 (0.0%)
Disability Class: Vision Difficulty
Age Bracket
Male
Female
Under 5 Years
0 (0.0%)
0 (0.0%)
5 to 17 Years
0 (0.0%)
0 (0.0%)
18 to 34 Years
0 (0.0%)
0 (0.0%)
35 to 64 Years
0 (0.0%)
0 (0.0%)
65 to 74 Years
0 (0.0%)
0 (0.0%)
75 Years and over
0 (0.0%)
0 (0.0%)
Disability Class: Cognitive Difficulty
Age Bracket
Male
Female
5 to 17 Years
0 (0.0%)
0 (0.0%)
18 to 34 Years
0 (0.0%)
0 (0.0%)
35 to 64 Years
0 (0.0%)
0 (0.0%)
65 to 74 Years
0 (0.0%)
0 (0.0%)
75 Years and over
0 (0.0%)
0 (0.0%)
Disability Class: Ambulatory Difficulty
Age Bracket
Male
Female
5 to 17 Years
0 (0.0%)
0 (0.0%)
18 to 34 Years
0 (0.0%)
0 (0.0%)
35 to 64 Years
0 (0.0%)
0 (0.0%)
65 to 74 Years
0 (0.0%)
0 (0.0%)
75 Years and over
0 (0.0%)
0 (0.0%)
Disability Class: Self-Care Difficulty
Age Bracket
Male
Female
5 to 17 Years
0 (0.0%)
0 (0.0%)
18 to 34 Years
0 (0.0%)
0 (0.0%)
35 to 64 Years
0 (0.0%)
0 (0.0%)
65 to 74 Years
0 (0.0%)
0 (0.0%)
75 Years and over
0 (0.0%)
0 (0.0%)
Technology Access in Conchas Dam
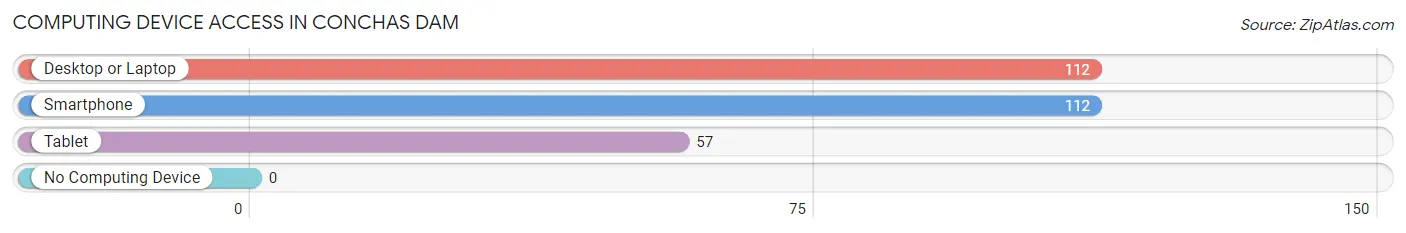
Computing Device Access in Conchas Dam
Device Type
# Households
% Households
Desktop or Laptop
112
100.0%
Smartphone
112
100.0%
Tablet
57
50.9%
No Computing Device
0
0.0%
Total
112
100.0%
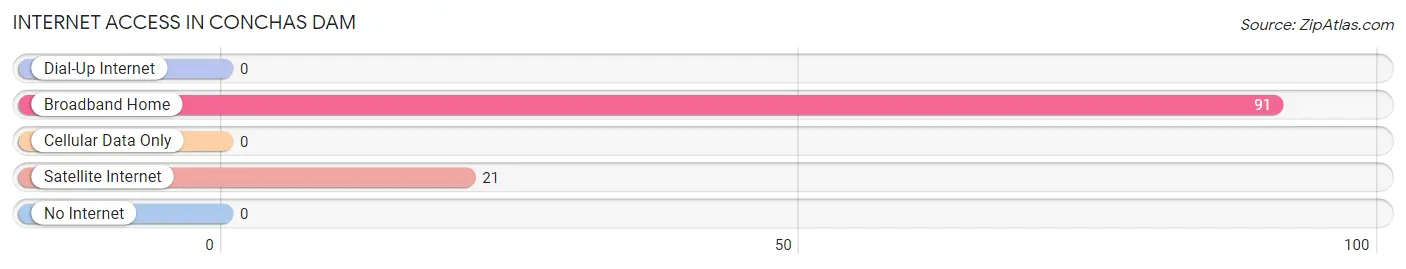
Internet Access in Conchas Dam
Internet Type
# Households
% Households
Dial-Up Internet
0
0.0%
Broadband Home
91
81.2%
Cellular Data Only
0
0.0%
Satellite Internet
21
18.8%
No Internet
0
0.0%
Total
112
100.0%
Conchas Dam Summary
Conchas Dam is a small community located in San Miguel County, New Mexico. It is situated on the Canadian River, approximately 40 miles northeast of Tucumcari. The town was established in the early 1930s as a result of the construction of the Conchas Dam, which was built to provide irrigation water for the surrounding area.
Geography
Conchas Dam is located in the eastern part of San Miguel County, New Mexico. It is situated on the Canadian River, approximately 40 miles northeast of Tucumcari. The town is located at an elevation of 4,000 feet above sea level. The surrounding area is mostly flat, with some rolling hills. The climate is semi-arid, with hot summers and mild winters.
Economy
The economy of Conchas Dam is largely based on agriculture. The town is home to several farms and ranches, which produce a variety of crops, including alfalfa, corn, wheat, and cotton. The town also has a small manufacturing sector, which produces a variety of products, including furniture, clothing, and food products.
Demographics
As of the 2010 census, the population of Conchas Dam was 1,072. The racial makeup of the town was 94.3% White, 0.3% African American, 0.7% Native American, 0.2% Asian, 0.1% Pacific Islander, 2.3% from other races, and 2.3% from two or more races. Hispanic or Latino of any race were 8.2% of the population.
The median household income in Conchas Dam was $30,938, and the median family income was $35,625. The per capita income for the town was $14,945. About 17.2% of families and 20.2% of the population were below the poverty line, including 28.3% of those under age 18 and 10.2% of those age 65 or over.
History
Conchas Dam was established in the early 1930s as a result of the construction of the Conchas Dam, which was built to provide irrigation water for the surrounding area. The dam was completed in 1934, and the town was officially incorporated in 1936. The town was named after the nearby Conchas River, which was named by Spanish explorers in the late 1700s.
In the 1950s, the town began to experience a population boom, as many people moved to the area to take advantage of the newly available irrigation water. The town continued to grow throughout the 1960s and 1970s, and by the 1980s, it had become a popular tourist destination.
Today, Conchas Dam is a small, rural community with a population of just over 1,000 people. The town is home to several farms and ranches, as well as a small manufacturing sector. The town is also a popular destination for outdoor recreation, such as fishing, boating, and camping.
Common Questions
What is Per Capita Income in Conchas Dam?
Per Capita income in Conchas Dam is $32,687.
What is Inequality or Gini Index in Conchas Dam?
Inequality or Gini Index in Conchas Dam is 0.35.
What is the Total Population of Conchas Dam?
Total Population of Conchas Dam is 147.
What is the Total Male Population of Conchas Dam?
Total Male Population of Conchas Dam is 66.
What is the Total Female Population of Conchas Dam?
Total Female Population of Conchas Dam is 81.
What is the Ratio of Males per 100 Females in Conchas Dam?
There are 81.48 Males per 100 Females in Conchas Dam.
What is the Ratio of Females per 100 Males in Conchas Dam?
There are 122.73 Females per 100 Males in Conchas Dam.
What is the Median Population Age in Conchas Dam?
Median Population Age in Conchas Dam is 76.2 Years.
What is the Average Family Size in Conchas Dam
Average Family Size in Conchas Dam is 4.2 People.
What is the Average Household Size in Conchas Dam
Average Household Size in Conchas Dam is 1.3 People.
How Large is the Labor Force in Conchas Dam?
There are 29 People in the Labor Forcein in Conchas Dam.
What is the Percentage of People in the Labor Force in Conchas Dam?
19.7% of People are in the Labor Force in Conchas Dam.
Report Title
Report Link
HTML Copy & Paste Link
Social Media
Copy and paste the folowing code into any webpage where you would like this interactive chart to display