Cloudcroft, NM Map & Demographics
Cloudcroft Map
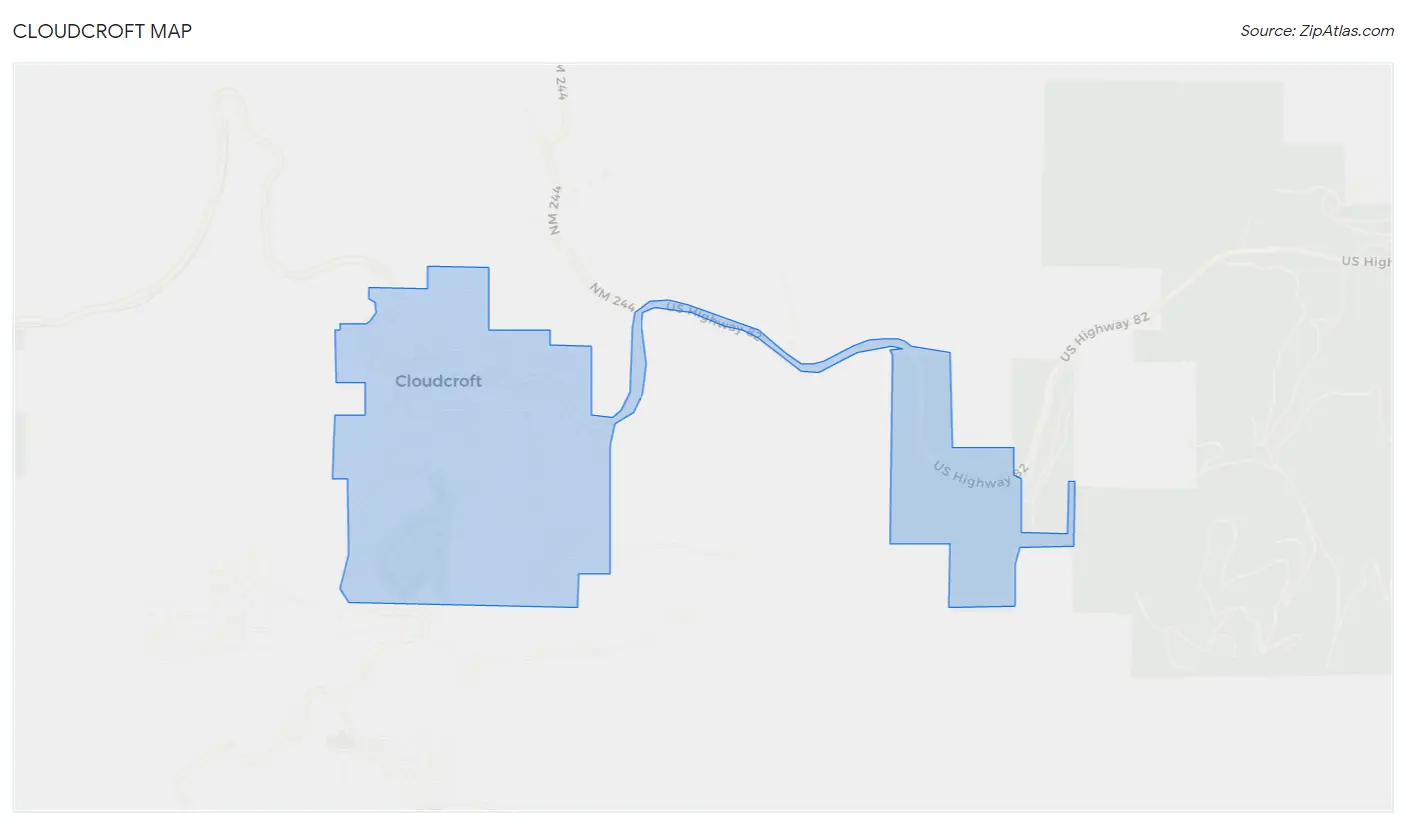
Cloudcroft Overview
$36,182
PER CAPITA INCOME
$94,643
AVG FAMILY INCOME
$51,484
AVG HOUSEHOLD INCOME
0.49
INEQUALITY / GINI INDEX
862
TOTAL POPULATION
402
MALE POPULATION
460
FEMALE POPULATION
87.39
MALES / 100 FEMALES
114.43
FEMALES / 100 MALES
49.1
MEDIAN AGE
4.4
AVG FAMILY SIZE
2.6
AVG HOUSEHOLD SIZE
257
LABOR FORCE [ PEOPLE ]
41.6%
PERCENT IN LABOR FORCE
Cloudcroft Zip Codes
Income in Cloudcroft
Income Overview in Cloudcroft
Per Capita Income in Cloudcroft is $36,182, while median incomes of families and households are $94,643 and $51,484 respectively.
| Characteristic | Number | Measure |
| Per Capita Income | 862 | $36,182 |
| Median Family Income | 138 | $94,643 |
| Mean Family Income | 138 | $131,827 |
| Median Household Income | 325 | $51,484 |
| Mean Household Income | 325 | $85,477 |
| Income Deficit | 138 | $0 |
| Wage / Income Gap (%) | 862 | 0.00% |
| Wage / Income Gap ($) | 862 | 100.00¢ per $1 |
| Gini / Inequality Index | 862 | 0.49 |
Earnings by Sex in Cloudcroft
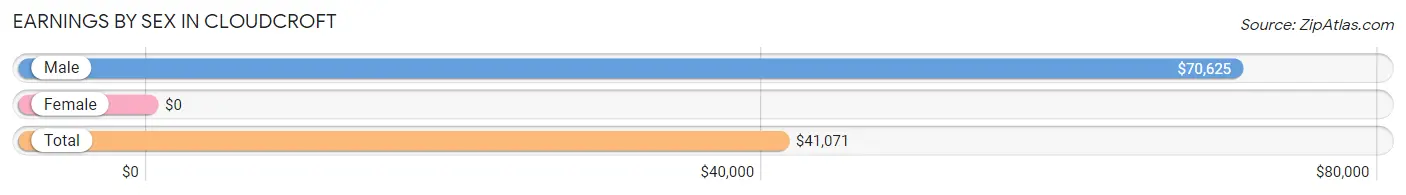
| Sex | Number | Average Earnings |
| Male | 148 (52.5%) | $70,625 |
| Female | 134 (47.5%) | $0 |
| Total | 282 (100.0%) | $41,071 |
Earnings by Sex by Income Bracket in Cloudcroft
The most common earnings brackets in Cloudcroft are $100,000+ for men (40 | 27.0%) and $10,000 to $12,499 for women (69 | 51.5%).
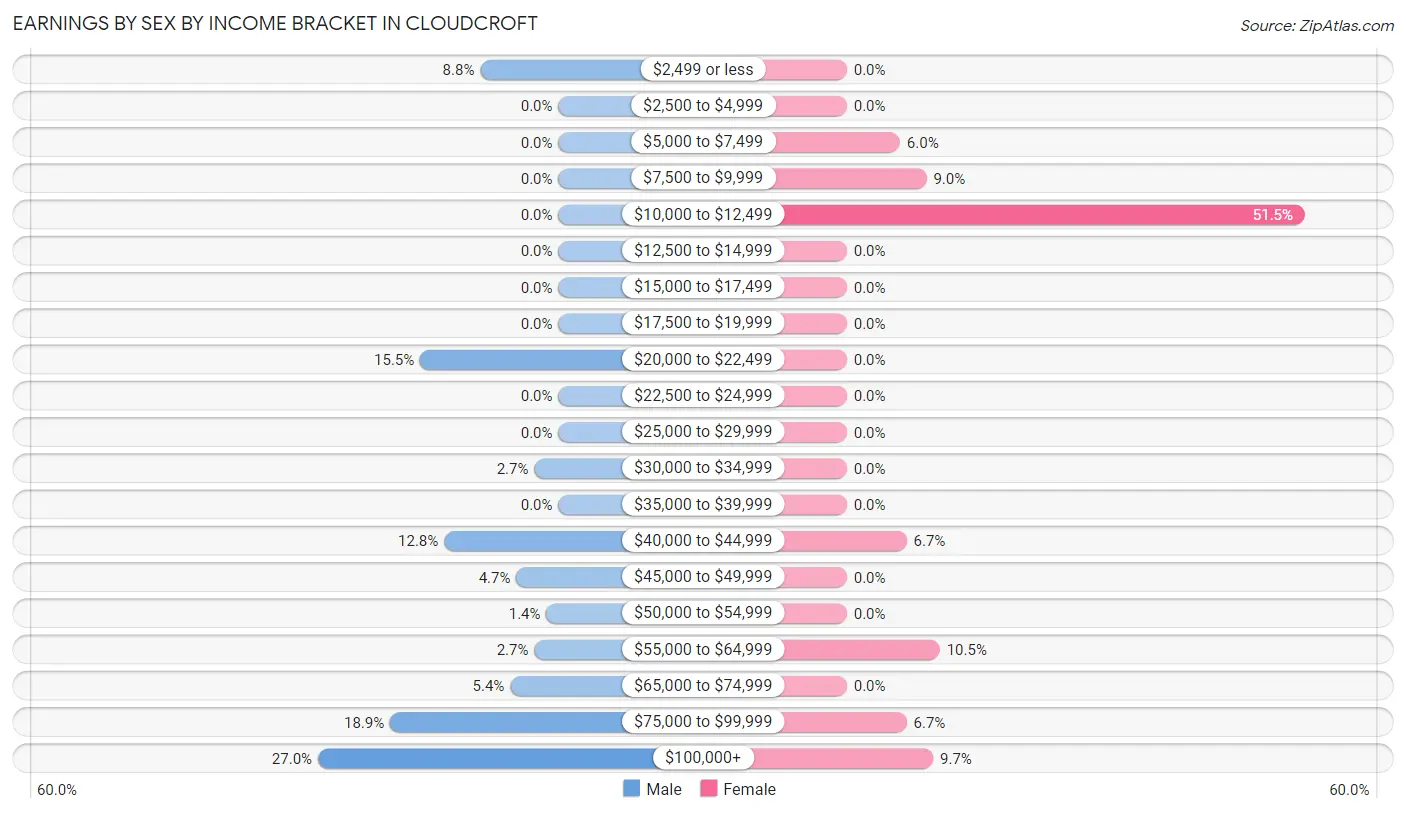
| Income | Male | Female |
| $2,499 or less | 13 (8.8%) | 0 (0.0%) |
| $2,500 to $4,999 | 0 (0.0%) | 0 (0.0%) |
| $5,000 to $7,499 | 0 (0.0%) | 8 (6.0%) |
| $7,500 to $9,999 | 0 (0.0%) | 12 (9.0%) |
| $10,000 to $12,499 | 0 (0.0%) | 69 (51.5%) |
| $12,500 to $14,999 | 0 (0.0%) | 0 (0.0%) |
| $15,000 to $17,499 | 0 (0.0%) | 0 (0.0%) |
| $17,500 to $19,999 | 0 (0.0%) | 0 (0.0%) |
| $20,000 to $22,499 | 23 (15.5%) | 0 (0.0%) |
| $22,500 to $24,999 | 0 (0.0%) | 0 (0.0%) |
| $25,000 to $29,999 | 0 (0.0%) | 0 (0.0%) |
| $30,000 to $34,999 | 4 (2.7%) | 0 (0.0%) |
| $35,000 to $39,999 | 0 (0.0%) | 0 (0.0%) |
| $40,000 to $44,999 | 19 (12.8%) | 9 (6.7%) |
| $45,000 to $49,999 | 7 (4.7%) | 0 (0.0%) |
| $50,000 to $54,999 | 2 (1.3%) | 0 (0.0%) |
| $55,000 to $64,999 | 4 (2.7%) | 14 (10.4%) |
| $65,000 to $74,999 | 8 (5.4%) | 0 (0.0%) |
| $75,000 to $99,999 | 28 (18.9%) | 9 (6.7%) |
| $100,000+ | 40 (27.0%) | 13 (9.7%) |
| Total | 148 (100.0%) | 134 (100.0%) |
Earnings by Sex by Educational Attainment in Cloudcroft
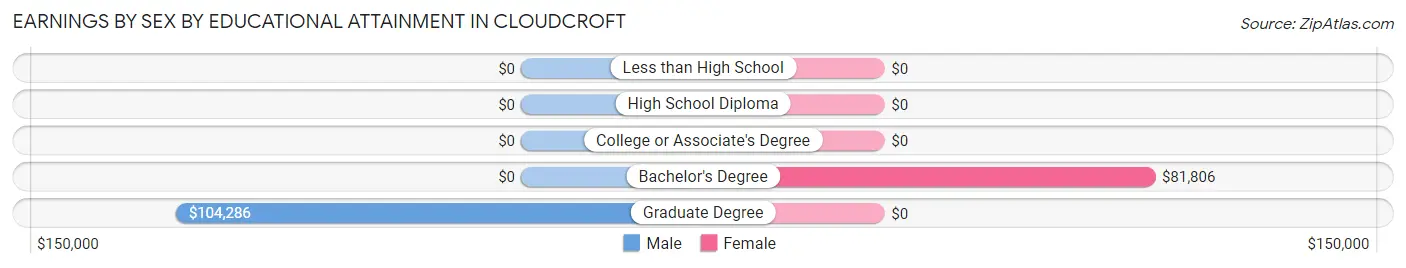
| Educational Attainment | Male Income | Female Income |
| Less than High School | - | - |
| High School Diploma | - | - |
| College or Associate's Degree | - | - |
| Bachelor's Degree | - | - |
| Graduate Degree | $104,286 | $0 |
| Total | $75,179 | $0 |
Family Income in Cloudcroft
Family Income Brackets in Cloudcroft
According to the Cloudcroft family income data, there are 34 families falling into the $75,000 to $99,999 income range, which is the most common income bracket and makes up 24.6% of all families.
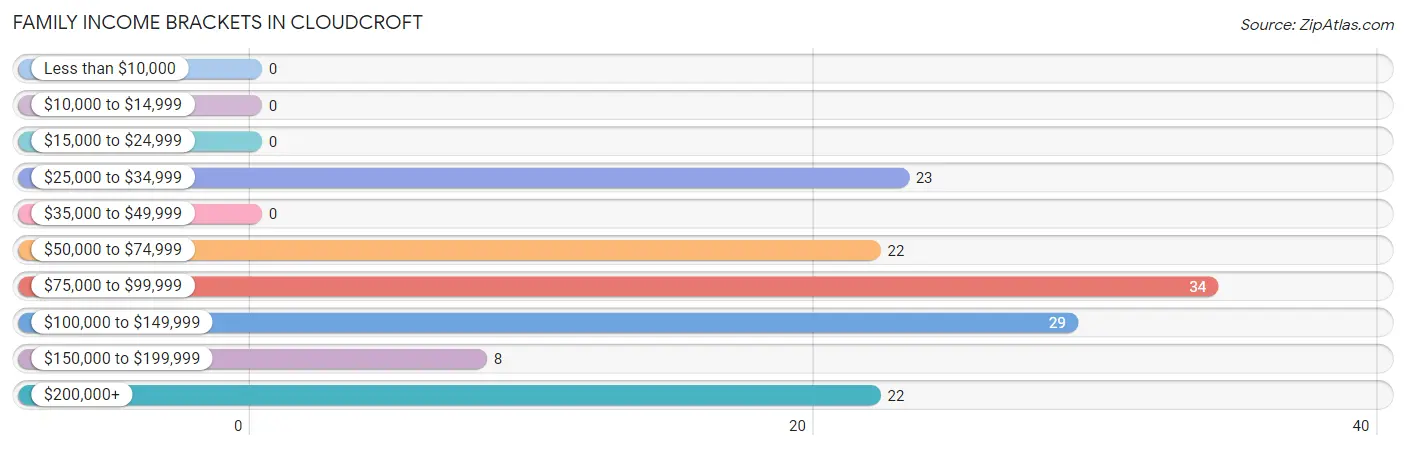
| Income Bracket | # Families | % Families |
| Less than $10,000 | 0 | 0.0% |
| $10,000 to $14,999 | 0 | 0.0% |
| $15,000 to $24,999 | 0 | 0.0% |
| $25,000 to $34,999 | 23 | 16.7% |
| $35,000 to $49,999 | 0 | 0.0% |
| $50,000 to $74,999 | 22 | 15.9% |
| $75,000 to $99,999 | 34 | 24.6% |
| $100,000 to $149,999 | 29 | 21.0% |
| $150,000 to $199,999 | 8 | 5.8% |
| $200,000+ | 22 | 15.9% |
Family Income by Famaliy Size in Cloudcroft
2-person families (75 | 54.3%) account for the highest median family income in Cloudcroft with $104,821 per family, while 2-person families (75 | 54.3%) have the highest median income of $52,410 per family member.
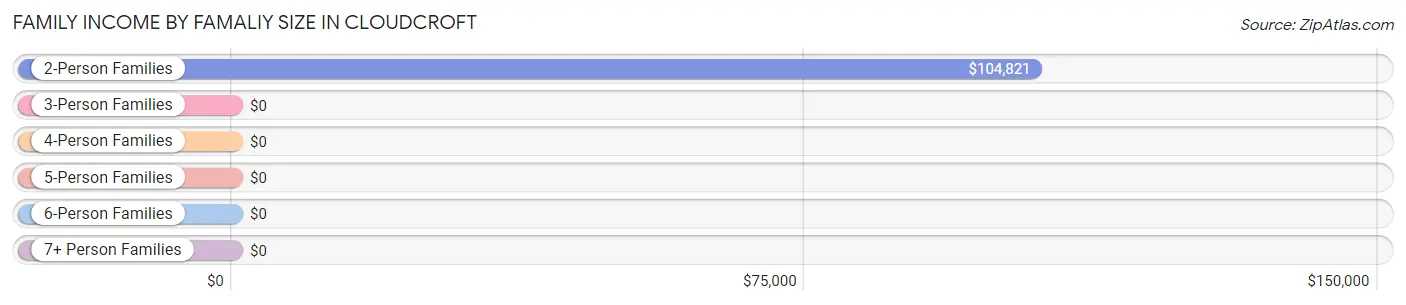
| Income Bracket | # Families | Median Income |
| 2-Person Families | 75 (54.3%) | $104,821 |
| 3-Person Families | 15 (10.9%) | $0 |
| 4-Person Families | 14 (10.1%) | $0 |
| 5-Person Families | 11 (8.0%) | $0 |
| 6-Person Families | 0 (0.0%) | $0 |
| 7+ Person Families | 23 (16.7%) | $0 |
| Total | 138 (100.0%) | $94,643 |
Family Income by Number of Earners in Cloudcroft
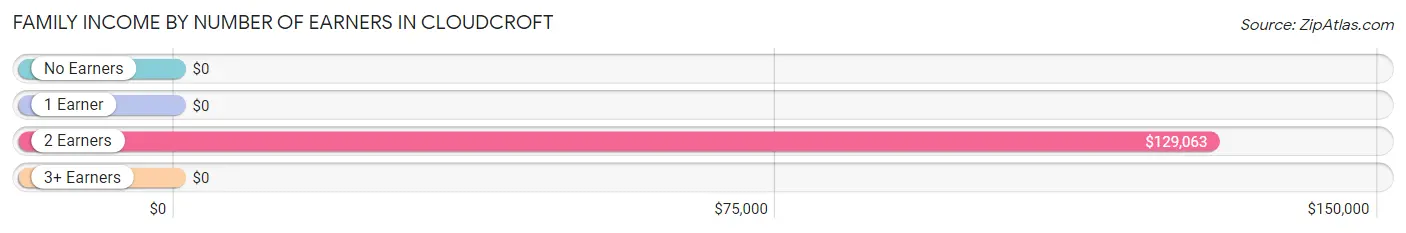
| Number of Earners | # Families | Median Income |
| No Earners | 34 (24.6%) | $0 |
| 1 Earner | 65 (47.1%) | $0 |
| 2 Earners | 22 (15.9%) | $129,063 |
| 3+ Earners | 17 (12.3%) | $0 |
| Total | 138 (100.0%) | $94,643 |
Household Income in Cloudcroft
Household Income Brackets in Cloudcroft
With 78 households falling in the category, the $35,000 to $49,999 income range is the most frequent in Cloudcroft, accounting for 24.0% of all households. In contrast, only 4 households (1.2%) fall into the less than $10,000 income bracket, making it the least populous group.
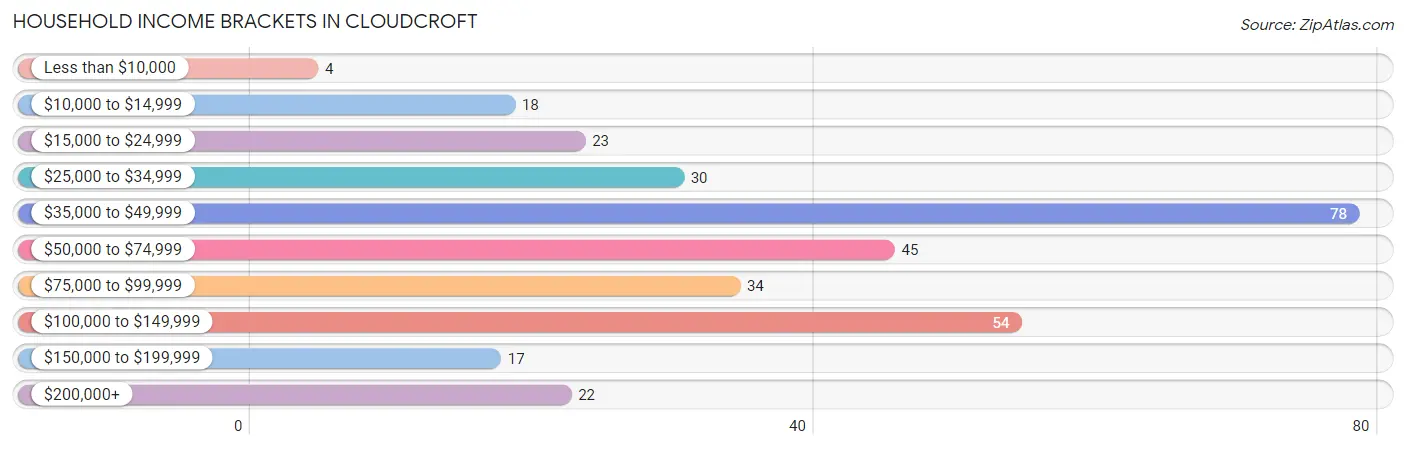
| Income Bracket | # Households | % Households |
| Less than $10,000 | 4 | 1.2% |
| $10,000 to $14,999 | 18 | 5.5% |
| $15,000 to $24,999 | 23 | 7.1% |
| $25,000 to $34,999 | 30 | 9.2% |
| $35,000 to $49,999 | 78 | 24.0% |
| $50,000 to $74,999 | 45 | 13.8% |
| $75,000 to $99,999 | 34 | 10.5% |
| $100,000 to $149,999 | 54 | 16.6% |
| $150,000 to $199,999 | 17 | 5.2% |
| $200,000+ | 22 | 6.8% |
Household Income by Householder Age in Cloudcroft
The median household income in Cloudcroft is $51,484, with the highest median household income of $59,688 found in the 65+ years age bracket for the primary householder. A total of 129 households (39.7%) fall into this category.
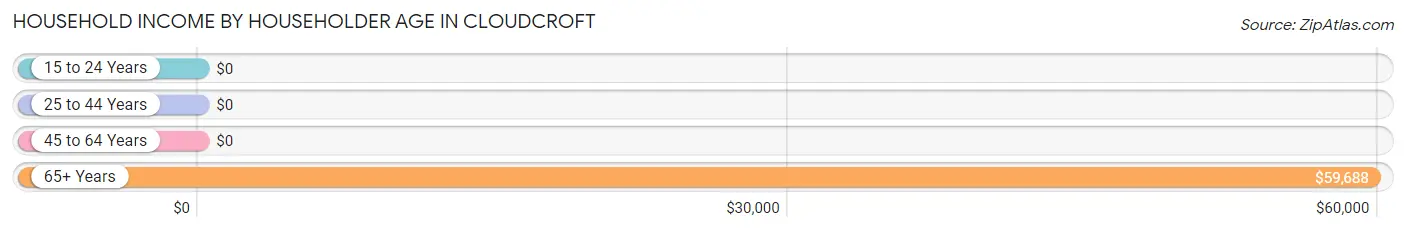
| Income Bracket | # Households | Median Income |
| 15 to 24 Years | 0 (0.0%) | $0 |
| 25 to 44 Years | 52 (16.0%) | $0 |
| 45 to 64 Years | 144 (44.3%) | $0 |
| 65+ Years | 129 (39.7%) | $59,688 |
| Total | 325 (100.0%) | $51,484 |
Poverty in Cloudcroft
Income Below Poverty by Sex and Age in Cloudcroft
With 39.6% poverty level for males and 40.6% for females among the residents of Cloudcroft, under 5 year old males and under 5 year old females are the most vulnerable to poverty, with 25 males (100.0%) and 25 females (78.1%) in their respective age groups living below the poverty level.
| Age Bracket | Male | Female |
| Under 5 Years | 25 (100.0%) | 25 (78.1%) |
| 5 Years | 30 (88.2%) | 0 (0.0%) |
| 6 to 11 Years | 0 (0.0%) | 45 (69.2%) |
| 12 to 14 Years | 37 (61.7%) | 0 (0.0%) |
| 15 Years | 0 (0.0%) | 0 (0.0%) |
| 16 and 17 Years | 33 (100.0%) | 0 (0.0%) |
| 18 to 24 Years | 0 (0.0%) | 0 (0.0%) |
| 25 to 34 Years | 0 (0.0%) | 0 (0.0%) |
| 35 to 44 Years | 23 (100.0%) | 29 (50.9%) |
| 45 to 54 Years | 0 (0.0%) | 18 (30.0%) |
| 55 to 64 Years | 0 (0.0%) | 63 (53.8%) |
| 65 to 74 Years | 0 (0.0%) | 0 (0.0%) |
| 75 Years and over | 11 (21.6%) | 7 (13.7%) |
| Total | 159 (39.6%) | 187 (40.6%) |
Income Above Poverty by Sex and Age in Cloudcroft
According to the poverty statistics in Cloudcroft, males aged 6 to 11 years and females aged 12 to 14 years are the age groups that are most secure financially, with 100.0% of males and 100.0% of females in these age groups living above the poverty line.
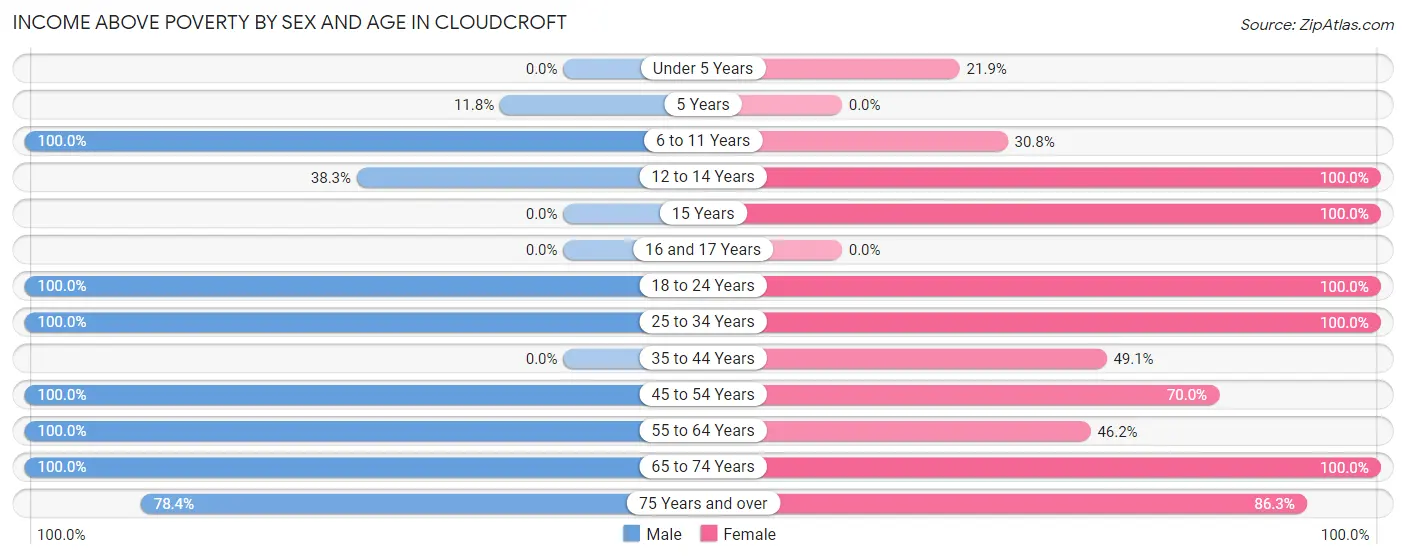
| Age Bracket | Male | Female |
| Under 5 Years | 0 (0.0%) | 7 (21.9%) |
| 5 Years | 4 (11.8%) | 0 (0.0%) |
| 6 to 11 Years | 4 (100.0%) | 20 (30.8%) |
| 12 to 14 Years | 23 (38.3%) | 7 (100.0%) |
| 15 Years | 0 (0.0%) | 17 (100.0%) |
| 16 and 17 Years | 0 (0.0%) | 0 (0.0%) |
| 18 to 24 Years | 13 (100.0%) | 12 (100.0%) |
| 25 to 34 Years | 6 (100.0%) | 6 (100.0%) |
| 35 to 44 Years | 0 (0.0%) | 28 (49.1%) |
| 45 to 54 Years | 64 (100.0%) | 42 (70.0%) |
| 55 to 64 Years | 35 (100.0%) | 54 (46.2%) |
| 65 to 74 Years | 54 (100.0%) | 36 (100.0%) |
| 75 Years and over | 40 (78.4%) | 44 (86.3%) |
| Total | 243 (60.5%) | 273 (59.4%) |
Income Below Poverty Among Married-Couple Families in Cloudcroft
The poverty statistics for married-couple families in Cloudcroft show that 21.7% or 23 of the total 106 families live below the poverty line. Families with 5 or more children have the highest poverty rate of 100.0%, comprising of 23 families. On the other hand, families with no children have the lowest poverty rate of 0.0%, which includes 0 families.
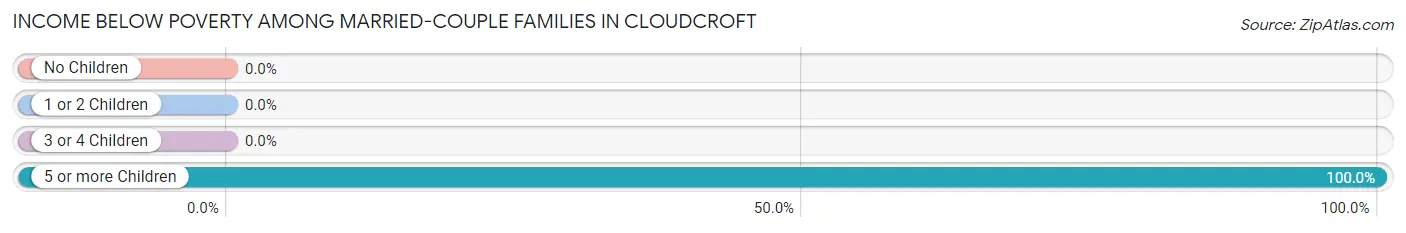
| Children | Above Poverty | Below Poverty |
| No Children | 71 (100.0%) | 0 (0.0%) |
| 1 or 2 Children | 12 (100.0%) | 0 (0.0%) |
| 3 or 4 Children | 0 (0.0%) | 0 (0.0%) |
| 5 or more Children | 0 (0.0%) | 23 (100.0%) |
| Total | 83 (78.3%) | 23 (21.7%) |
Income Below Poverty Among Single-Parent Households in Cloudcroft
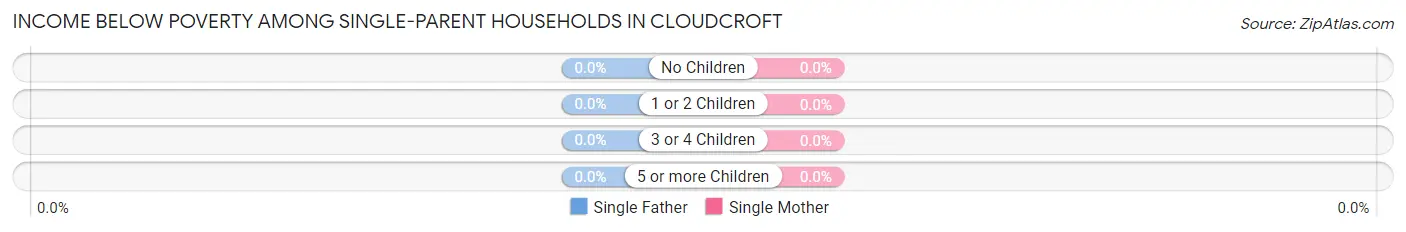
| Children | Single Father | Single Mother |
| No Children | 0 (0.0%) | 0 (0.0%) |
| 1 or 2 Children | 0 (0.0%) | 0 (0.0%) |
| 3 or 4 Children | 0 (0.0%) | 0 (0.0%) |
| 5 or more Children | 0 (0.0%) | 0 (0.0%) |
| Total | 0 (0.0%) | 0 (0.0%) |
Income Below Poverty Among Married-Couple vs Single-Parent Households in Cloudcroft
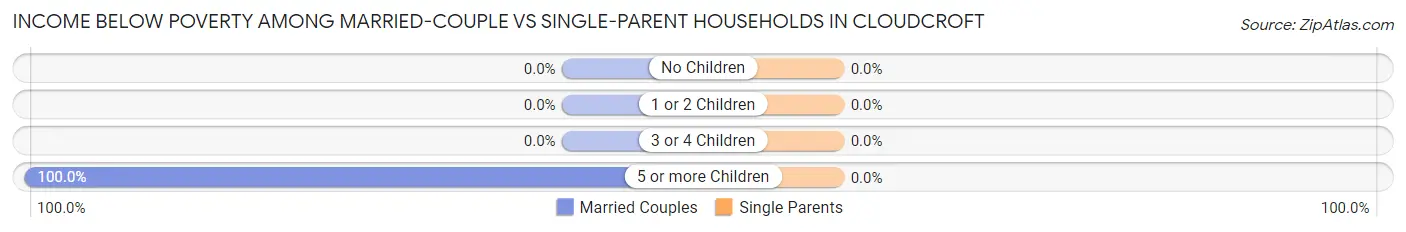
| Children | Married-Couple Families | Single-Parent Households |
| No Children | 0 (0.0%) | 0 (0.0%) |
| 1 or 2 Children | 0 (0.0%) | 0 (0.0%) |
| 3 or 4 Children | 0 (0.0%) | 0 (0.0%) |
| 5 or more Children | 23 (100.0%) | 0 (0.0%) |
| Total | 23 (21.7%) | 0 (0.0%) |
Race in Cloudcroft
The most populous races in Cloudcroft are White / Caucasian (840 | 97.5%), Hispanic or Latino (125 | 14.5%), and Native / Alaskan (20 | 2.3%).
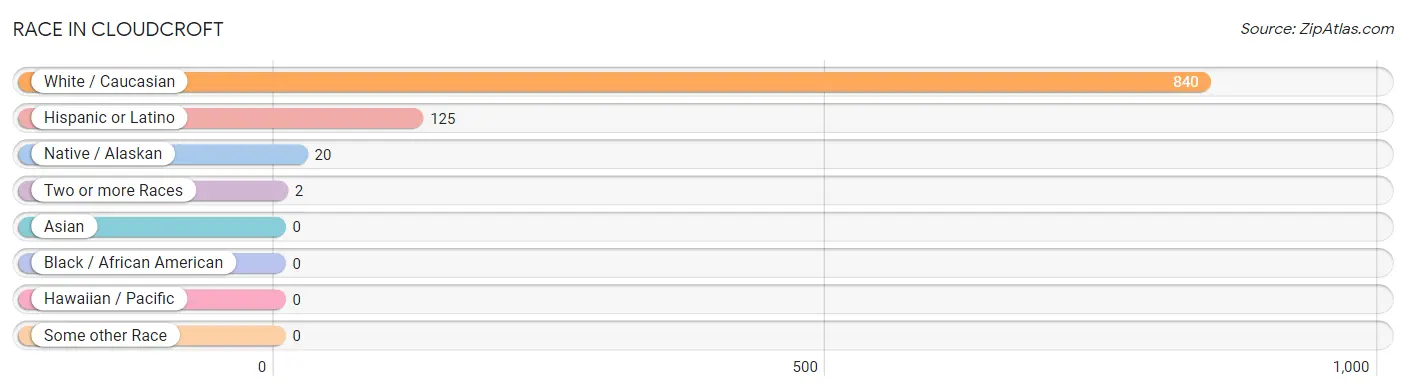
| Race | # Population | % Population |
| Asian | 0 | 0.0% |
| Black / African American | 0 | 0.0% |
| Hawaiian / Pacific | 0 | 0.0% |
| Hispanic or Latino | 125 | 14.5% |
| Native / Alaskan | 20 | 2.3% |
| White / Caucasian | 840 | 97.5% |
| Two or more Races | 2 | 0.2% |
| Some other Race | 0 | 0.0% |
| Total | 862 | 100.0% |
Ancestry in Cloudcroft
The most populous ancestries reported in Cloudcroft are German (261 | 30.3%), Scottish (170 | 19.7%), Irish (155 | 18.0%), English (154 | 17.9%), and Dutch (148 | 17.2%), together accounting for 103.0% of all Cloudcroft residents.
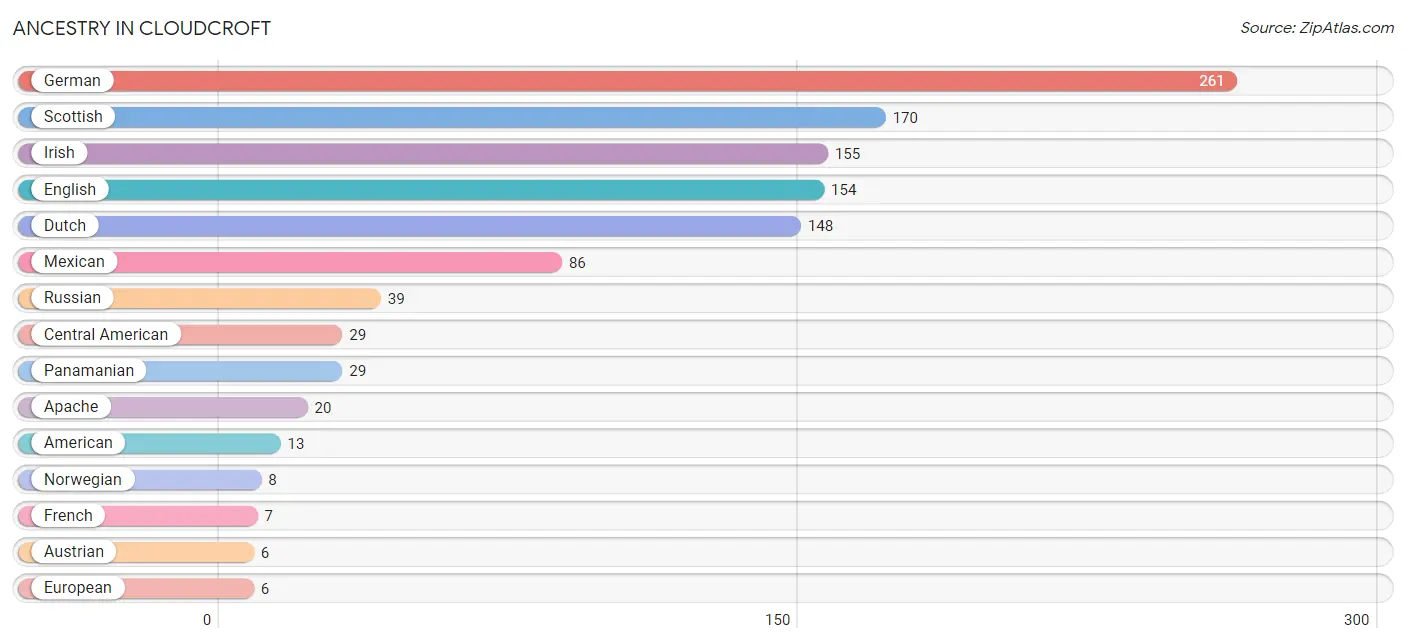
| Ancestry | # Population | % Population |
| American | 13 | 1.5% |
| Apache | 20 | 2.3% |
| Austrian | 6 | 0.7% |
| Central American | 29 | 3.4% |
| Dutch | 148 | 17.2% |
| English | 154 | 17.9% |
| European | 6 | 0.7% |
| French | 7 | 0.8% |
| German | 261 | 30.3% |
| Indian (Asian) | 2 | 0.2% |
| Irish | 155 | 18.0% |
| Mexican | 86 | 10.0% |
| Norwegian | 8 | 0.9% |
| Panamanian | 29 | 3.4% |
| Russian | 39 | 4.5% |
| Scottish | 170 | 19.7% |
| Welsh | 6 | 0.7% | View All 17 Rows |
Immigrants in Cloudcroft
The most numerous immigrant groups reported in Cloudcroft came from England (9 | 1.0%), Europe (9 | 1.0%), and Northern Europe (9 | 1.0%), together accounting for 3.1% of all Cloudcroft residents.
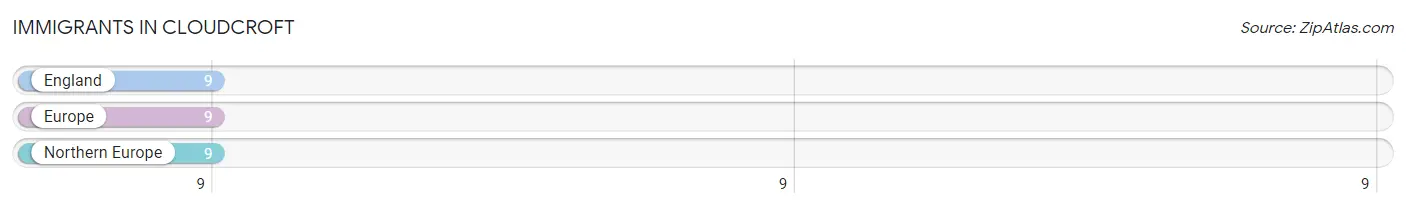
| Immigration Origin | # Population | % Population |
| England | 9 | 1.0% |
| Europe | 9 | 1.0% |
| Northern Europe | 9 | 1.0% | View All 3 Rows |
Sex and Age in Cloudcroft
Sex and Age in Cloudcroft
The most populous age groups in Cloudcroft are 10 to 14 Years (64 | 15.9%) for men and 60 to 64 Years (107 | 23.3%) for women.
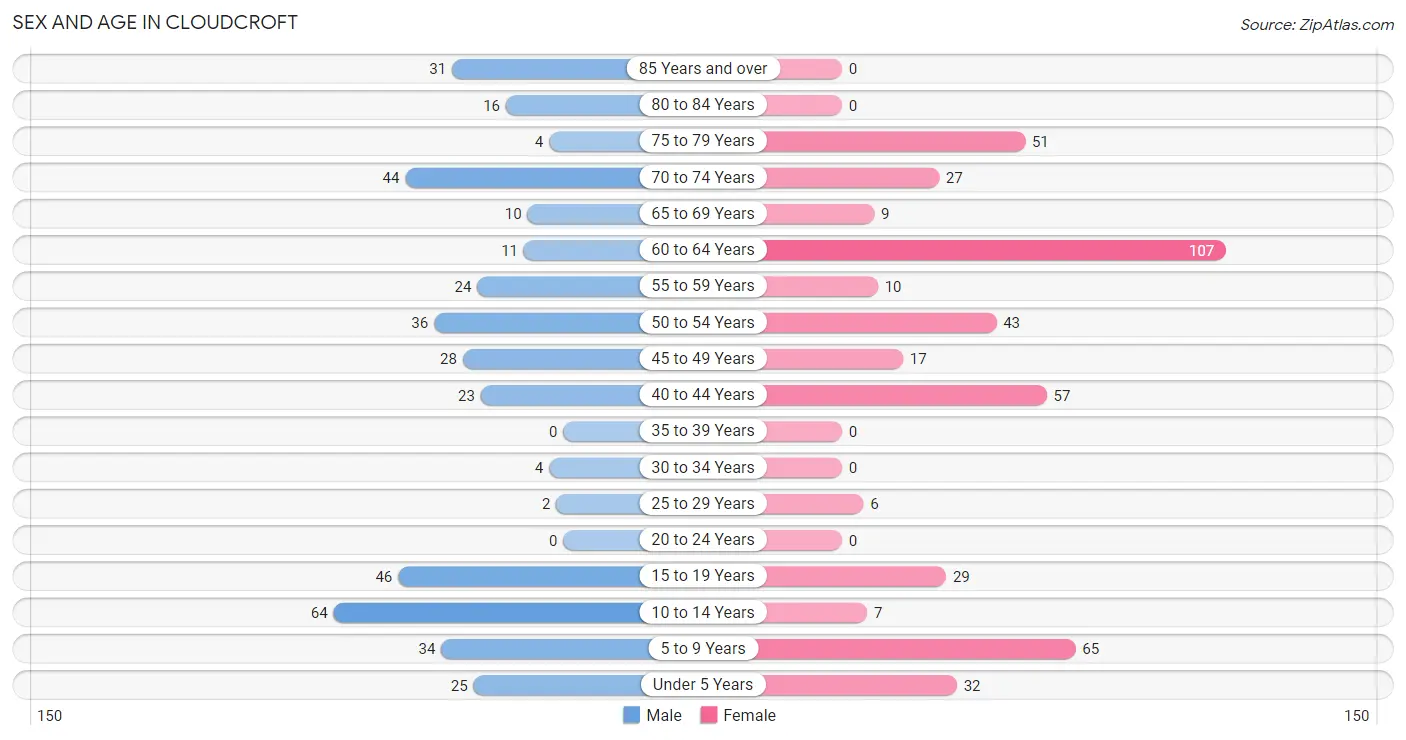
| Age Bracket | Male | Female |
| Under 5 Years | 25 (6.2%) | 32 (7.0%) |
| 5 to 9 Years | 34 (8.5%) | 65 (14.1%) |
| 10 to 14 Years | 64 (15.9%) | 7 (1.5%) |
| 15 to 19 Years | 46 (11.4%) | 29 (6.3%) |
| 20 to 24 Years | 0 (0.0%) | 0 (0.0%) |
| 25 to 29 Years | 2 (0.5%) | 6 (1.3%) |
| 30 to 34 Years | 4 (1.0%) | 0 (0.0%) |
| 35 to 39 Years | 0 (0.0%) | 0 (0.0%) |
| 40 to 44 Years | 23 (5.7%) | 57 (12.4%) |
| 45 to 49 Years | 28 (7.0%) | 17 (3.7%) |
| 50 to 54 Years | 36 (9.0%) | 43 (9.3%) |
| 55 to 59 Years | 24 (6.0%) | 10 (2.2%) |
| 60 to 64 Years | 11 (2.7%) | 107 (23.3%) |
| 65 to 69 Years | 10 (2.5%) | 9 (2.0%) |
| 70 to 74 Years | 44 (11.0%) | 27 (5.9%) |
| 75 to 79 Years | 4 (1.0%) | 51 (11.1%) |
| 80 to 84 Years | 16 (4.0%) | 0 (0.0%) |
| 85 Years and over | 31 (7.7%) | 0 (0.0%) |
| Total | 402 (100.0%) | 460 (100.0%) |
Families and Households in Cloudcroft
Median Family Size in Cloudcroft
The median family size in Cloudcroft is 4.39 persons per family, with single female/mother families (14 | 10.1%) accounting for the largest median family size of 5 persons per family. On the other hand, married-couple families (106 | 76.8%) represent the smallest median family size with 4.25 persons per family.
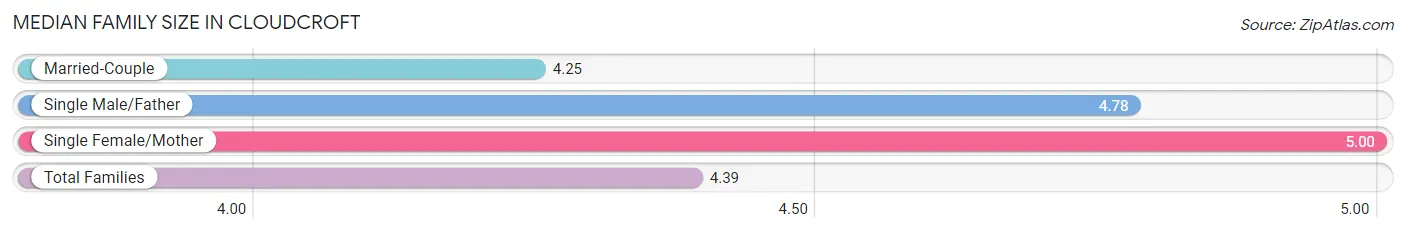
| Family Type | # Families | Family Size |
| Married-Couple | 106 (76.8%) | 4.25 |
| Single Male/Father | 18 (13.0%) | 4.78 |
| Single Female/Mother | 14 (10.1%) | 5.00 |
| Total Families | 138 (100.0%) | 4.39 |
Median Household Size in Cloudcroft
The median household size in Cloudcroft is 2.65 persons per household, with single female/mother households (14 | 4.3%) accounting for the largest median household size of 5 persons per household. non-family households (187 | 57.5%) represent the smallest median household size with 1.37 persons per household.
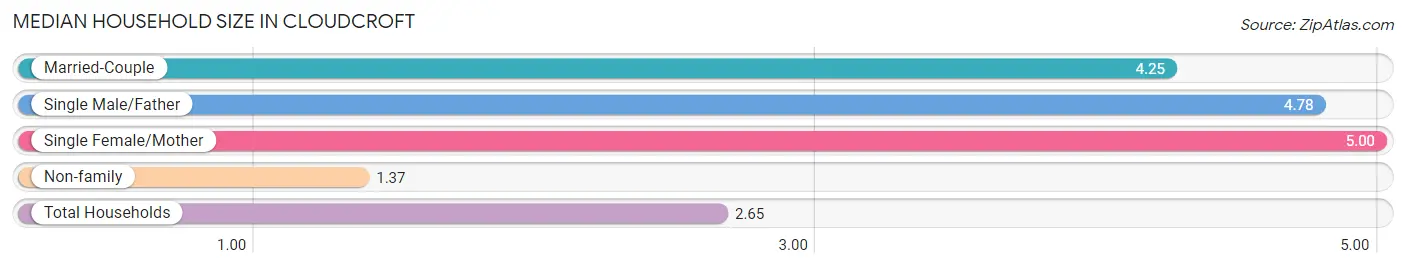
| Household Type | # Households | Household Size |
| Married-Couple | 106 (32.6%) | 4.25 |
| Single Male/Father | 18 (5.5%) | 4.78 |
| Single Female/Mother | 14 (4.3%) | 5.00 |
| Non-family | 187 (57.5%) | 1.37 |
| Total Households | 325 (100.0%) | 2.65 |
Household Size by Marriage Status in Cloudcroft
Out of a total of 325 households in Cloudcroft, 138 (42.5%) are family households, while 187 (57.5%) are nonfamily households. The most numerous type of family households are 2-person households, comprising 75, and the most common type of nonfamily households are 1-person households, comprising 111.
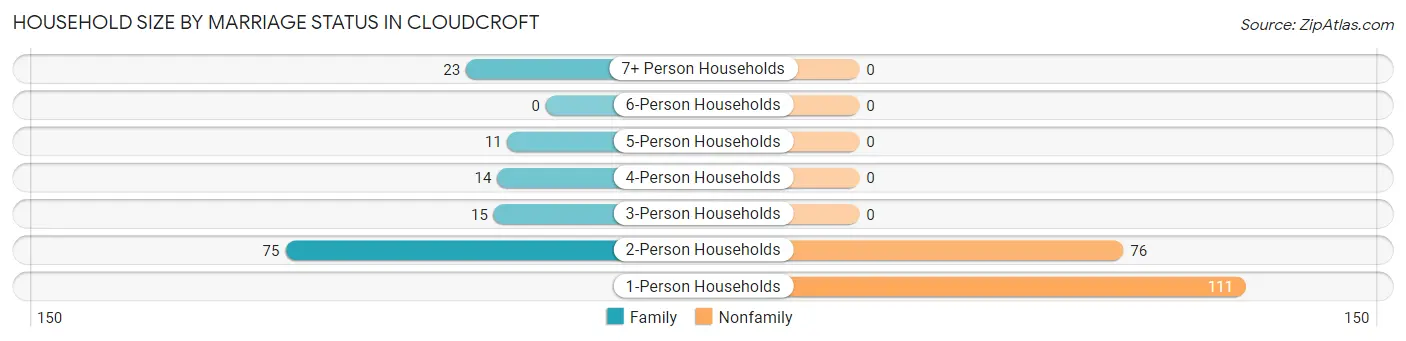
| Household Size | Family Households | Nonfamily Households |
| 1-Person Households | - | 111 (34.2%) |
| 2-Person Households | 75 (23.1%) | 76 (23.4%) |
| 3-Person Households | 15 (4.6%) | 0 (0.0%) |
| 4-Person Households | 14 (4.3%) | 0 (0.0%) |
| 5-Person Households | 11 (3.4%) | 0 (0.0%) |
| 6-Person Households | 0 (0.0%) | 0 (0.0%) |
| 7+ Person Households | 23 (7.1%) | 0 (0.0%) |
| Total | 138 (42.5%) | 187 (57.5%) |
Female Fertility in Cloudcroft
Fertility by Age in Cloudcroft

| Age Bracket | Women with Births | Births / 1,000 Women |
| 15 to 19 years | 0 (0.0%) | 0.0 |
| 20 to 34 years | 0 (0.0%) | 0.0 |
| 35 to 50 years | 0 (0.0%) | 0.0 |
| Total | 0 (0.0%) | 0.0 |
Fertility by Age by Marriage Status in Cloudcroft
| Age Bracket | Married | Unmarried |
| 15 to 19 years | 0 (0.0%) | 0 (0.0%) |
| 20 to 34 years | 0 (0.0%) | 0 (0.0%) |
| 35 to 50 years | 0 (0.0%) | 0 (0.0%) |
| Total | 0 (0.0%) | 0 (0.0%) |
Fertility by Education in Cloudcroft
| Educational Attainment | Women with Births | Births / 1,000 Women |
| Less than High School | 0 (0.0%) | 0.0 |
| High School Diploma | 0 (0.0%) | 0.0 |
| College or Associate's Degree | 0 (0.0%) | 0.0 |
| Bachelor's Degree | 0 (0.0%) | 0.0 |
| Graduate Degree | 0 (0.0%) | 0.0 |
| Total | 0 (0.0%) | 0.0 |
Fertility by Education by Marriage Status in Cloudcroft
| Educational Attainment | Married | Unmarried |
| Less than High School | 0 (0.0%) | 0 (0.0%) |
| High School Diploma | 0 (0.0%) | 0 (0.0%) |
| College or Associate's Degree | 0 (0.0%) | 0 (0.0%) |
| Bachelor's Degree | 0 (0.0%) | 0 (0.0%) |
| Graduate Degree | 0 (0.0%) | 0 (0.0%) |
| Total | 0 (0.0%) | 0 (0.0%) |
Employment Characteristics in Cloudcroft
Employment by Class of Employer in Cloudcroft
Among the 257 employed individuals in Cloudcroft, private company employees (115 | 44.8%), self-employed (not incorporated) (75 | 29.2%), and federal government employees (32 | 12.4%) make up the most common classes of employment.
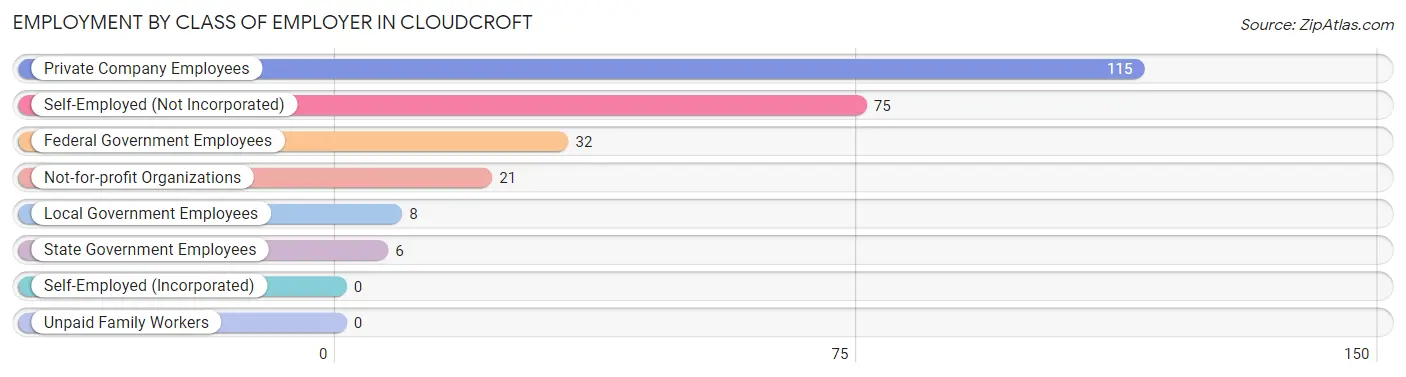
| Employer Class | # Employees | % Employees |
| Private Company Employees | 115 | 44.8% |
| Self-Employed (Incorporated) | 0 | 0.0% |
| Self-Employed (Not Incorporated) | 75 | 29.2% |
| Not-for-profit Organizations | 21 | 8.2% |
| Local Government Employees | 8 | 3.1% |
| State Government Employees | 6 | 2.3% |
| Federal Government Employees | 32 | 12.4% |
| Unpaid Family Workers | 0 | 0.0% |
| Total | 257 | 100.0% |
Employment Status by Age in Cloudcroft
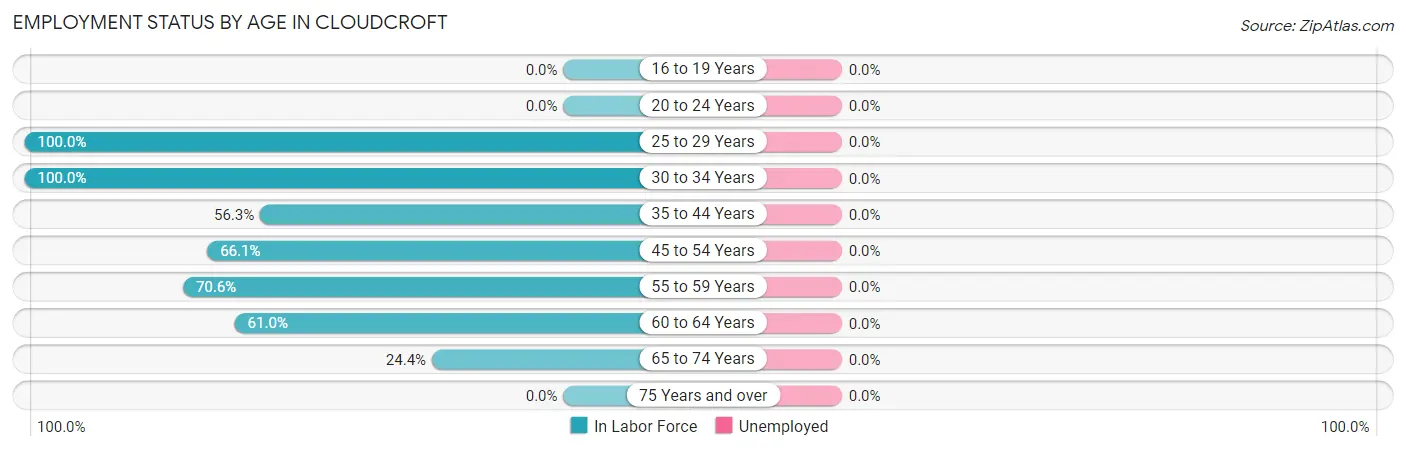
| Age Bracket | In Labor Force | Unemployed |
| 16 to 19 Years | 0 (0.0%) | 0 (0.0%) |
| 20 to 24 Years | 0 (0.0%) | 0 (0.0%) |
| 25 to 29 Years | 8 (100.0%) | 0 (0.0%) |
| 30 to 34 Years | 4 (100.0%) | 0 (0.0%) |
| 35 to 44 Years | 45 (56.3%) | 0 (0.0%) |
| 45 to 54 Years | 82 (66.1%) | 0 (0.0%) |
| 55 to 59 Years | 24 (70.6%) | 0 (0.0%) |
| 60 to 64 Years | 72 (61.0%) | 0 (0.0%) |
| 65 to 74 Years | 22 (24.4%) | 0 (0.0%) |
| 75 Years and over | 0 (0.0%) | 0 (0.0%) |
| Total | 257 (41.6%) | 0 (0.0%) |
Employment Status by Educational Attainment in Cloudcroft
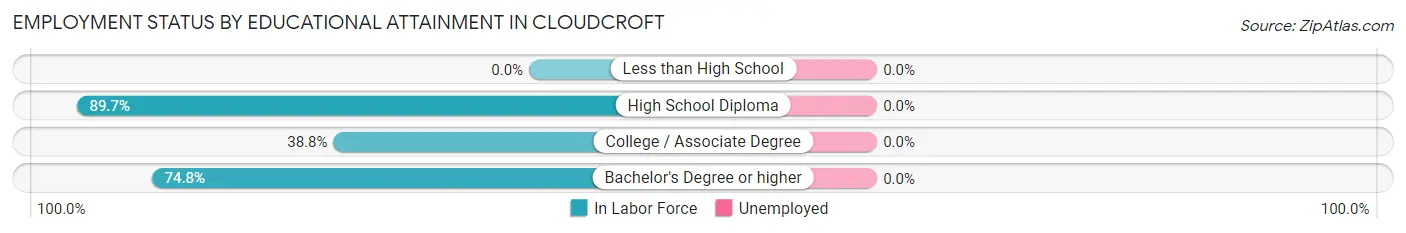
| Educational Attainment | In Labor Force | Unemployed |
| Less than High School | 0 (0.0%) | 0 (0.0%) |
| High School Diploma | 87 (89.7%) | 0 (0.0%) |
| College / Associate Degree | 59 (38.8%) | 0 (0.0%) |
| Bachelor's Degree or higher | 89 (74.8%) | 0 (0.0%) |
| Total | 235 (63.9%) | 0 (0.0%) |
Employment Occupations by Sex in Cloudcroft
Management, Business, Science and Arts Occupations
The most common Management, Business, Science and Arts occupations in Cloudcroft are Community & Social Service (35 | 13.6%), Computers, Engineering & Science (27 | 10.5%), Education Instruction & Library (26 | 10.1%), Management (21 | 8.2%), and Life, Physical & Social Science (20 | 7.8%).
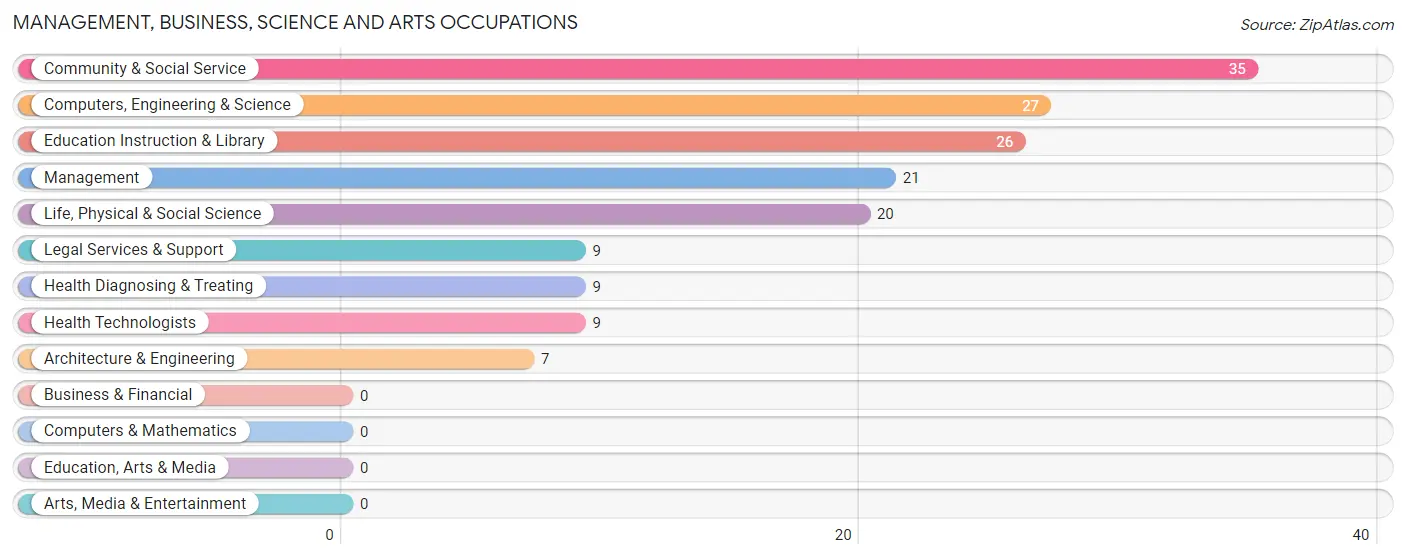
Management, Business, Science and Arts Occupations by Sex
Within the Management, Business, Science and Arts occupations in Cloudcroft, the most male-oriented occupations are Architecture & Engineering (100.0%), Legal Services & Support (100.0%), and Computers, Engineering & Science (81.5%), while the most female-oriented occupations are Health Diagnosing & Treating (100.0%), Health Technologists (100.0%), and Education Instruction & Library (65.4%).
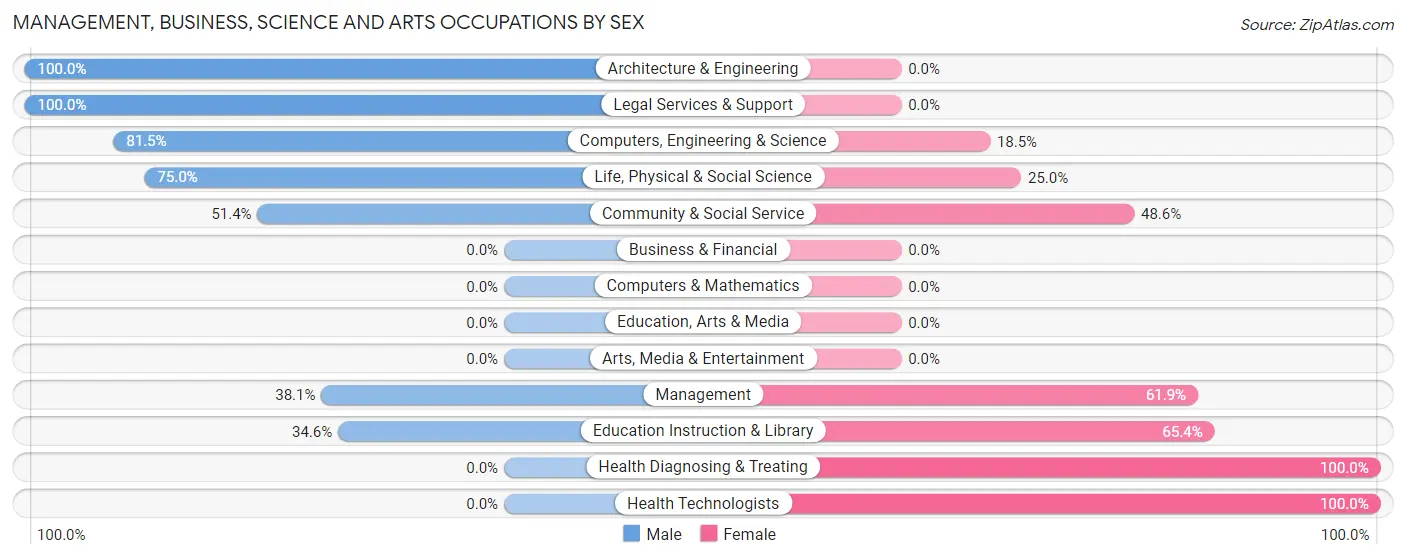
| Occupation | Male | Female |
| Management | 8 (38.1%) | 13 (61.9%) |
| Business & Financial | 0 (0.0%) | 0 (0.0%) |
| Computers, Engineering & Science | 22 (81.5%) | 5 (18.5%) |
| Computers & Mathematics | 0 (0.0%) | 0 (0.0%) |
| Architecture & Engineering | 7 (100.0%) | 0 (0.0%) |
| Life, Physical & Social Science | 15 (75.0%) | 5 (25.0%) |
| Community & Social Service | 18 (51.4%) | 17 (48.6%) |
| Education, Arts & Media | 0 (0.0%) | 0 (0.0%) |
| Legal Services & Support | 9 (100.0%) | 0 (0.0%) |
| Education Instruction & Library | 9 (34.6%) | 17 (65.4%) |
| Arts, Media & Entertainment | 0 (0.0%) | 0 (0.0%) |
| Health Diagnosing & Treating | 0 (0.0%) | 9 (100.0%) |
| Health Technologists | 0 (0.0%) | 9 (100.0%) |
| Total (Category) | 48 (52.2%) | 44 (47.8%) |
| Total (Overall) | 135 (52.5%) | 122 (47.5%) |
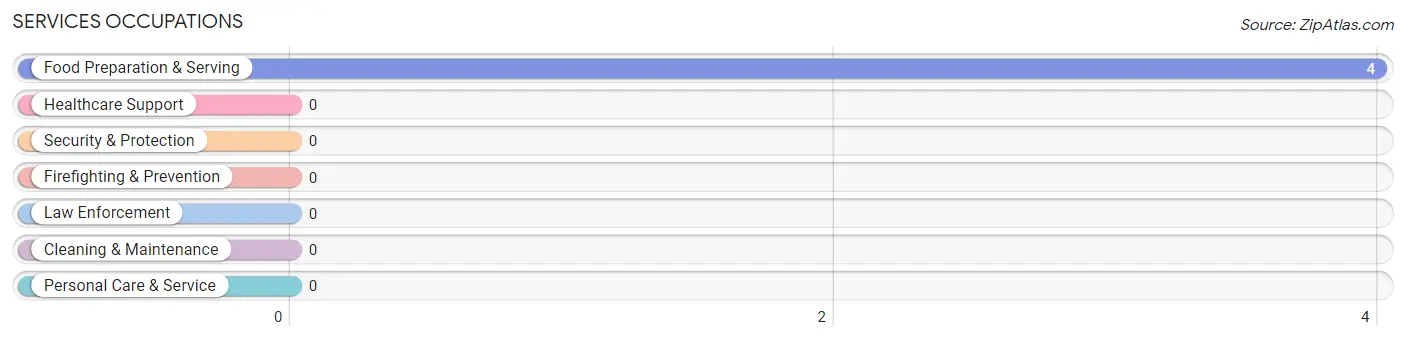
Services Occupations
The most common Services occupations in Cloudcroft are , and Food Preparation & Serving (4 | 1.6%).
Services Occupations by Sex
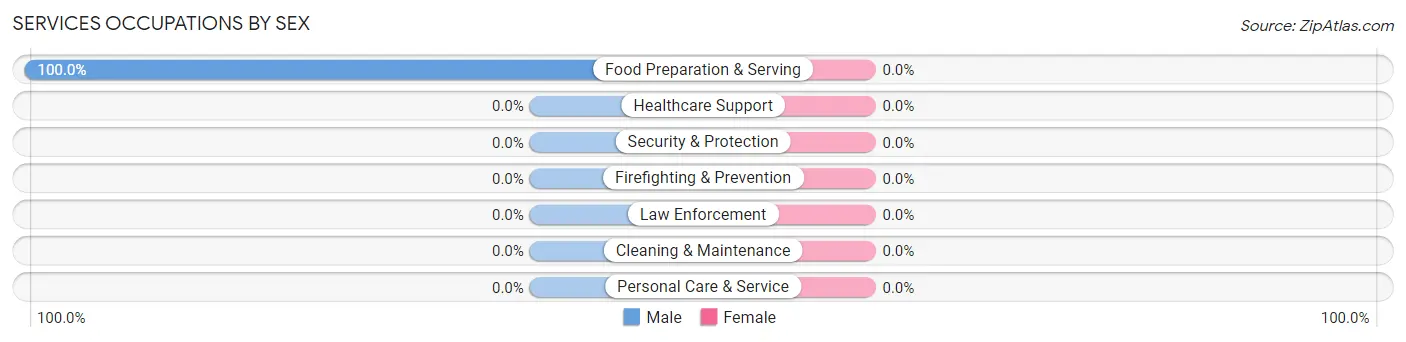
| Occupation | Male | Female |
| Healthcare Support | 0 (0.0%) | 0 (0.0%) |
| Security & Protection | 0 (0.0%) | 0 (0.0%) |
| Firefighting & Prevention | 0 (0.0%) | 0 (0.0%) |
| Law Enforcement | 0 (0.0%) | 0 (0.0%) |
| Food Preparation & Serving | 4 (100.0%) | 0 (0.0%) |
| Cleaning & Maintenance | 0 (0.0%) | 0 (0.0%) |
| Personal Care & Service | 0 (0.0%) | 0 (0.0%) |
| Total (Category) | 4 (100.0%) | 0 (0.0%) |
| Total (Overall) | 135 (52.5%) | 122 (47.5%) |
Sales and Office Occupations
The most common Sales and Office occupations in Cloudcroft are Office & Administration (21 | 8.2%), and Sales & Related (9 | 3.5%).
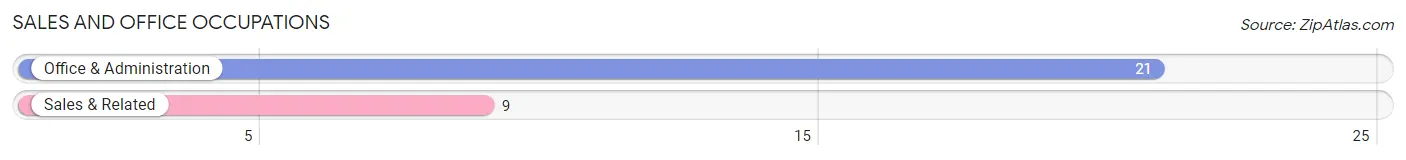
Sales and Office Occupations by Sex
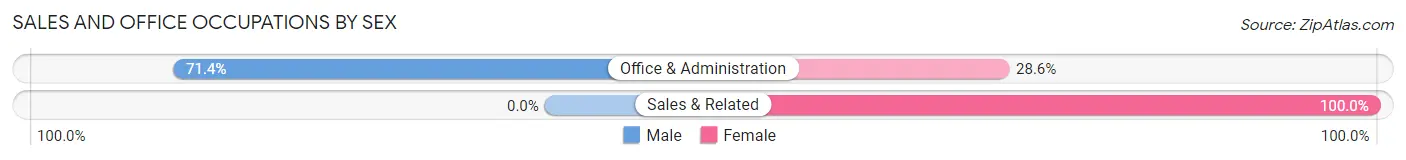
| Occupation | Male | Female |
| Sales & Related | 0 (0.0%) | 9 (100.0%) |
| Office & Administration | 15 (71.4%) | 6 (28.6%) |
| Total (Category) | 15 (50.0%) | 15 (50.0%) |
| Total (Overall) | 135 (52.5%) | 122 (47.5%) |
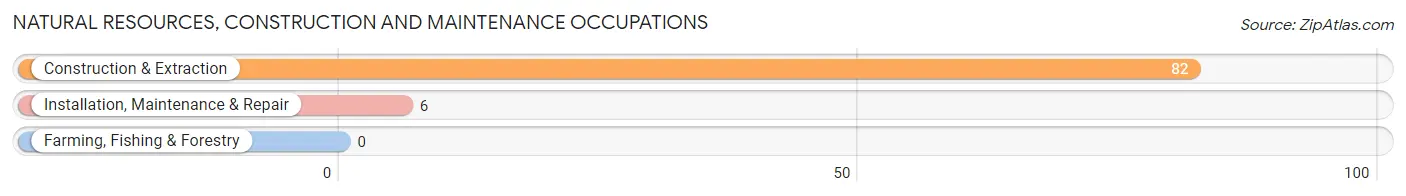
Natural Resources, Construction and Maintenance Occupations
The most common Natural Resources, Construction and Maintenance occupations in Cloudcroft are Construction & Extraction (82 | 31.9%), and Installation, Maintenance & Repair (6 | 2.3%).
Natural Resources, Construction and Maintenance Occupations by Sex
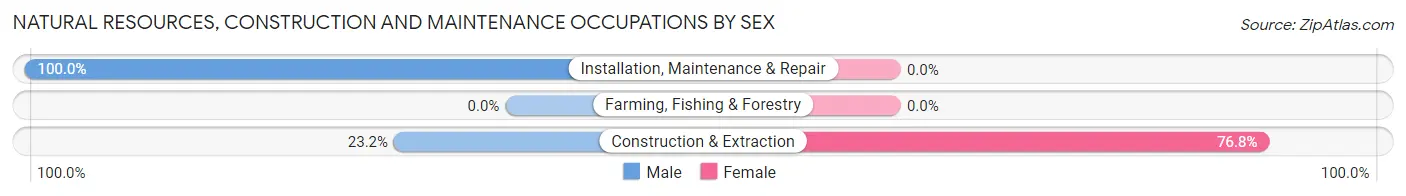
| Occupation | Male | Female |
| Farming, Fishing & Forestry | 0 (0.0%) | 0 (0.0%) |
| Construction & Extraction | 19 (23.2%) | 63 (76.8%) |
| Installation, Maintenance & Repair | 6 (100.0%) | 0 (0.0%) |
| Total (Category) | 25 (28.4%) | 63 (71.6%) |
| Total (Overall) | 135 (52.5%) | 122 (47.5%) |
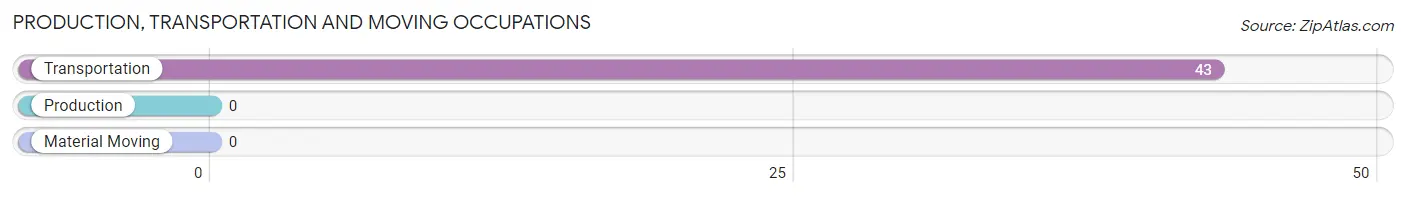
Production, Transportation and Moving Occupations
The most common Production, Transportation and Moving occupations in Cloudcroft are , and Transportation (43 | 16.7%).
Production, Transportation and Moving Occupations by Sex
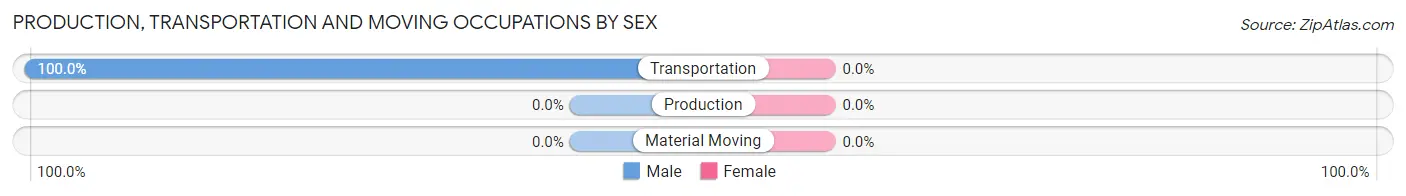
| Occupation | Male | Female |
| Production | 0 (0.0%) | 0 (0.0%) |
| Transportation | 43 (100.0%) | 0 (0.0%) |
| Material Moving | 0 (0.0%) | 0 (0.0%) |
| Total (Category) | 43 (100.0%) | 0 (0.0%) |
| Total (Overall) | 135 (52.5%) | 122 (47.5%) |
Employment Industries by Sex in Cloudcroft
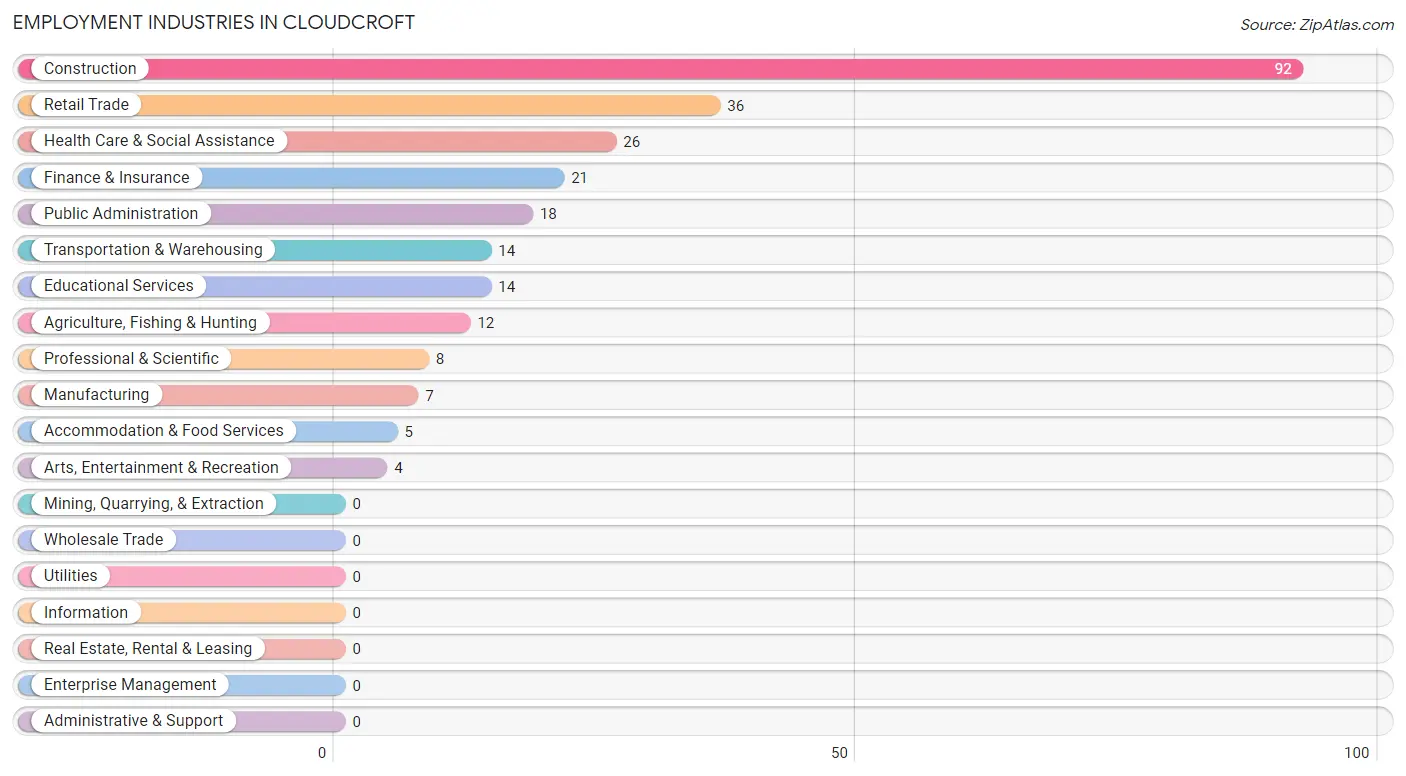
Employment Industries in Cloudcroft
The major employment industries in Cloudcroft include Construction (92 | 35.8%), Retail Trade (36 | 14.0%), Health Care & Social Assistance (26 | 10.1%), Finance & Insurance (21 | 8.2%), and Public Administration (18 | 7.0%).
Employment Industries by Sex in Cloudcroft
The Cloudcroft industries that see more men than women are Manufacturing (100.0%), Transportation & Warehousing (100.0%), and Professional & Scientific (100.0%), whereas the industries that tend to have a higher number of women are Health Care & Social Assistance (100.0%), Accommodation & Food Services (100.0%), and Construction (68.5%).
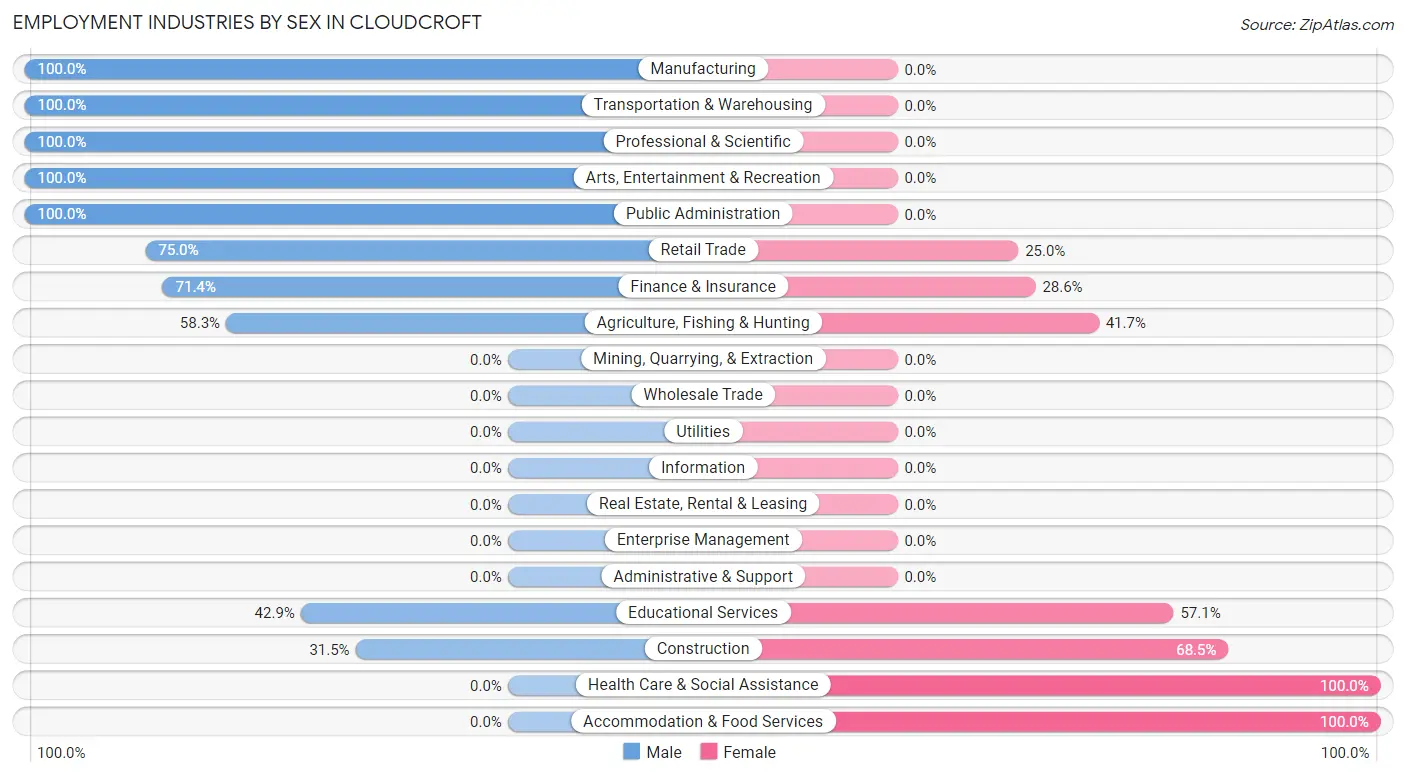
| Industry | Male | Female |
| Agriculture, Fishing & Hunting | 7 (58.3%) | 5 (41.7%) |
| Mining, Quarrying, & Extraction | 0 (0.0%) | 0 (0.0%) |
| Construction | 29 (31.5%) | 63 (68.5%) |
| Manufacturing | 7 (100.0%) | 0 (0.0%) |
| Wholesale Trade | 0 (0.0%) | 0 (0.0%) |
| Retail Trade | 27 (75.0%) | 9 (25.0%) |
| Transportation & Warehousing | 14 (100.0%) | 0 (0.0%) |
| Utilities | 0 (0.0%) | 0 (0.0%) |
| Information | 0 (0.0%) | 0 (0.0%) |
| Finance & Insurance | 15 (71.4%) | 6 (28.6%) |
| Real Estate, Rental & Leasing | 0 (0.0%) | 0 (0.0%) |
| Professional & Scientific | 8 (100.0%) | 0 (0.0%) |
| Enterprise Management | 0 (0.0%) | 0 (0.0%) |
| Administrative & Support | 0 (0.0%) | 0 (0.0%) |
| Educational Services | 6 (42.9%) | 8 (57.1%) |
| Health Care & Social Assistance | 0 (0.0%) | 26 (100.0%) |
| Arts, Entertainment & Recreation | 4 (100.0%) | 0 (0.0%) |
| Accommodation & Food Services | 0 (0.0%) | 5 (100.0%) |
| Public Administration | 18 (100.0%) | 0 (0.0%) |
| Total | 135 (52.5%) | 122 (47.5%) |
Education in Cloudcroft
School Enrollment in Cloudcroft
The most common levels of schooling among the 221 students in Cloudcroft are elementary school (61 | 27.6%), middle school (57 | 25.8%), and high school (57 | 25.8%).
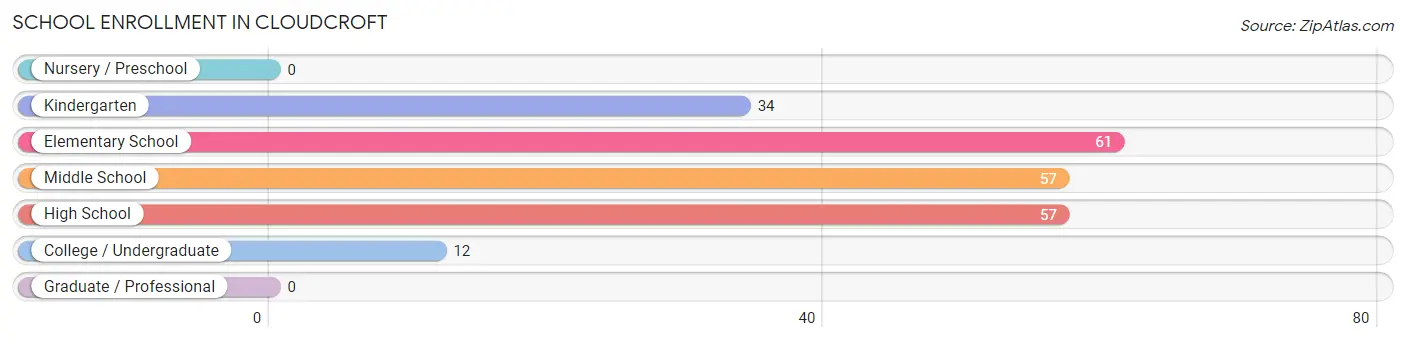
| School Level | # Students | % Students |
| Nursery / Preschool | 0 | 0.0% |
| Kindergarten | 34 | 15.4% |
| Elementary School | 61 | 27.6% |
| Middle School | 57 | 25.8% |
| High School | 57 | 25.8% |
| College / Undergraduate | 12 | 5.4% |
| Graduate / Professional | 0 | 0.0% |
| Total | 221 | 100.0% |
School Enrollment by Age by Funding Source in Cloudcroft
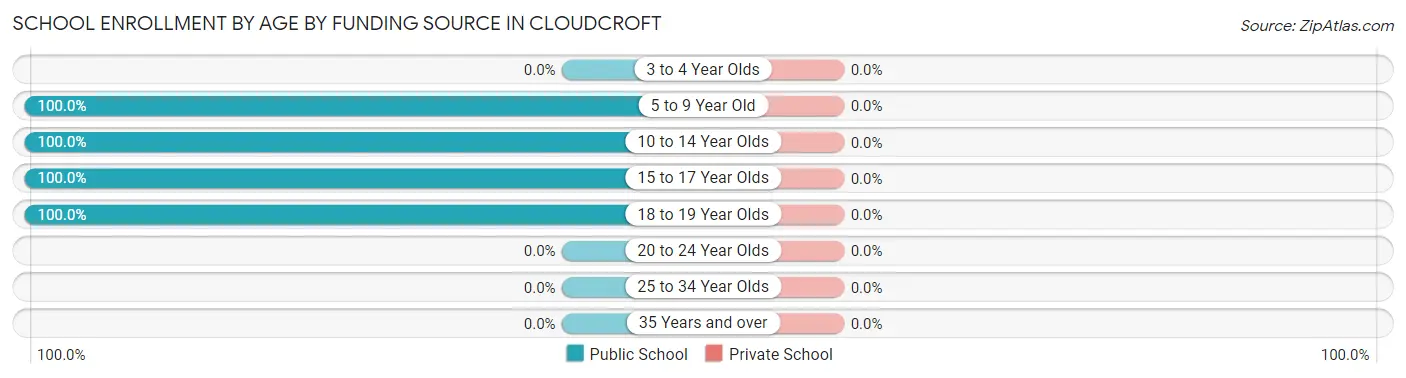
| Age Bracket | Public School | Private School |
| 3 to 4 Year Olds | 0 (0.0%) | 0 (0.0%) |
| 5 to 9 Year Old | 95 (100.0%) | 0 (0.0%) |
| 10 to 14 Year Olds | 64 (100.0%) | 0 (0.0%) |
| 15 to 17 Year Olds | 50 (100.0%) | 0 (0.0%) |
| 18 to 19 Year Olds | 12 (100.0%) | 0 (0.0%) |
| 20 to 24 Year Olds | 0 (0.0%) | 0 (0.0%) |
| 25 to 34 Year Olds | 0 (0.0%) | 0 (0.0%) |
| 35 Years and over | 0 (0.0%) | 0 (0.0%) |
| Total | 221 (100.0%) | 0 (0.0%) |
Educational Attainment by Field of Study in Cloudcroft
Business (38 | 17.6%), engineering (28 | 13.0%), education (27 | 12.5%), science & technology (22 | 10.2%), and arts & humanities (21 | 9.7%) are the most common fields of study among 216 individuals in Cloudcroft who have obtained a bachelor's degree or higher.
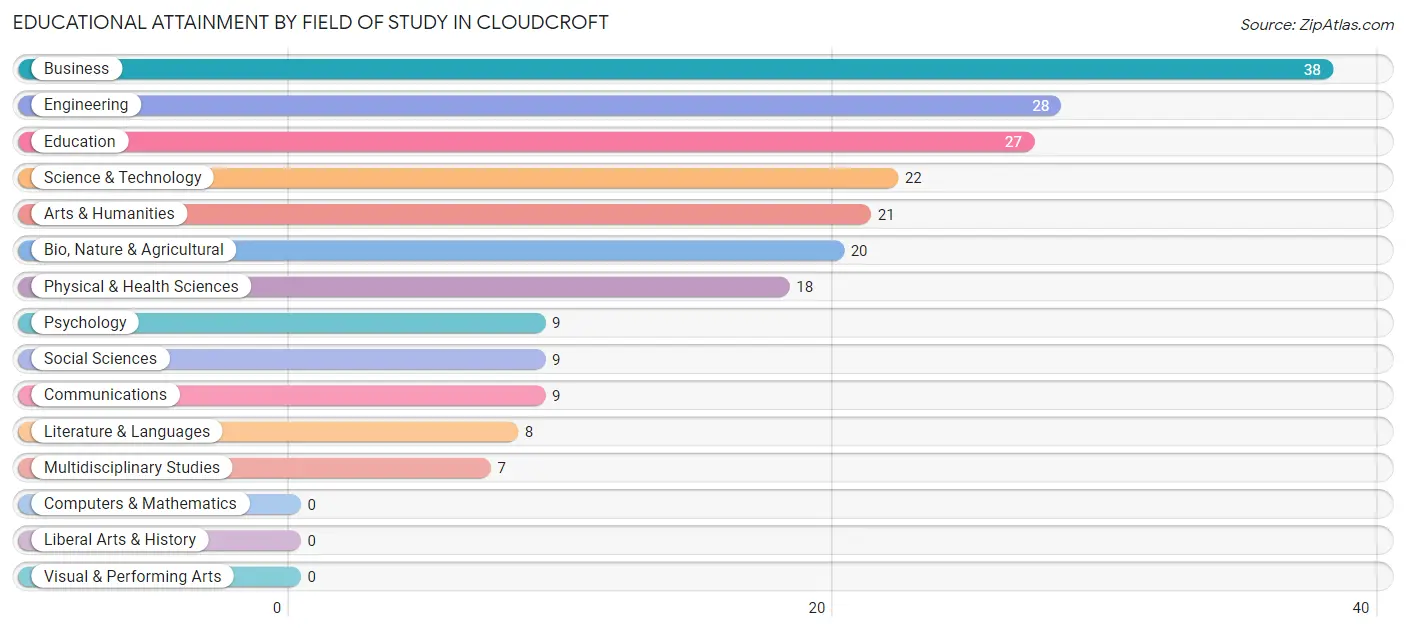
| Field of Study | # Graduates | % Graduates |
| Computers & Mathematics | 0 | 0.0% |
| Bio, Nature & Agricultural | 20 | 9.3% |
| Physical & Health Sciences | 18 | 8.3% |
| Psychology | 9 | 4.2% |
| Social Sciences | 9 | 4.2% |
| Engineering | 28 | 13.0% |
| Multidisciplinary Studies | 7 | 3.2% |
| Science & Technology | 22 | 10.2% |
| Business | 38 | 17.6% |
| Education | 27 | 12.5% |
| Literature & Languages | 8 | 3.7% |
| Liberal Arts & History | 0 | 0.0% |
| Visual & Performing Arts | 0 | 0.0% |
| Communications | 9 | 4.2% |
| Arts & Humanities | 21 | 9.7% |
| Total | 216 | 100.0% |
Transportation & Commute in Cloudcroft
Vehicle Availability by Sex in Cloudcroft
The most prevalent vehicle ownership categories in Cloudcroft are males with 2 vehicles (86, accounting for 63.7%) and females with 2 vehicles (86, making up 70.5%).
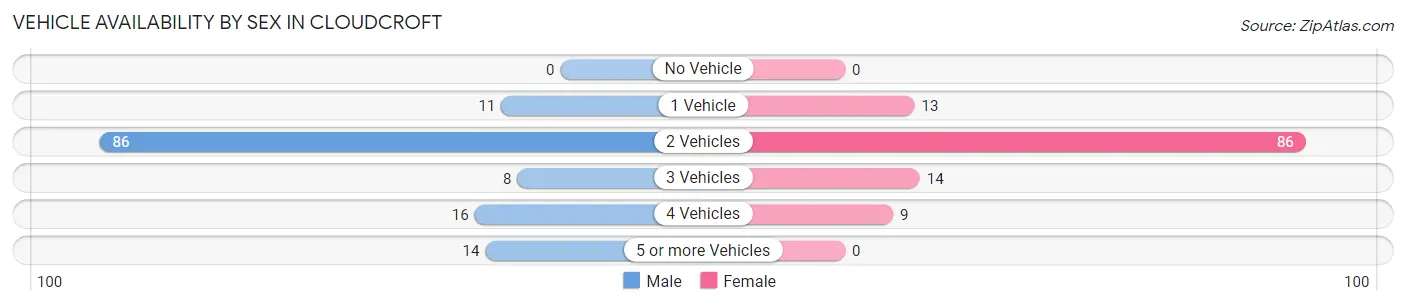
| Vehicles Available | Male | Female |
| No Vehicle | 0 (0.0%) | 0 (0.0%) |
| 1 Vehicle | 11 (8.2%) | 13 (10.7%) |
| 2 Vehicles | 86 (63.7%) | 86 (70.5%) |
| 3 Vehicles | 8 (5.9%) | 14 (11.5%) |
| 4 Vehicles | 16 (11.8%) | 9 (7.4%) |
| 5 or more Vehicles | 14 (10.4%) | 0 (0.0%) |
| Total | 135 (100.0%) | 122 (100.0%) |
Commute Time in Cloudcroft
The most frequently occuring commute durations in Cloudcroft are less than 5 minutes (72 commuters, 30.8%), 45 to 59 minutes (43 commuters, 18.4%), and 5 to 9 minutes (36 commuters, 15.4%).
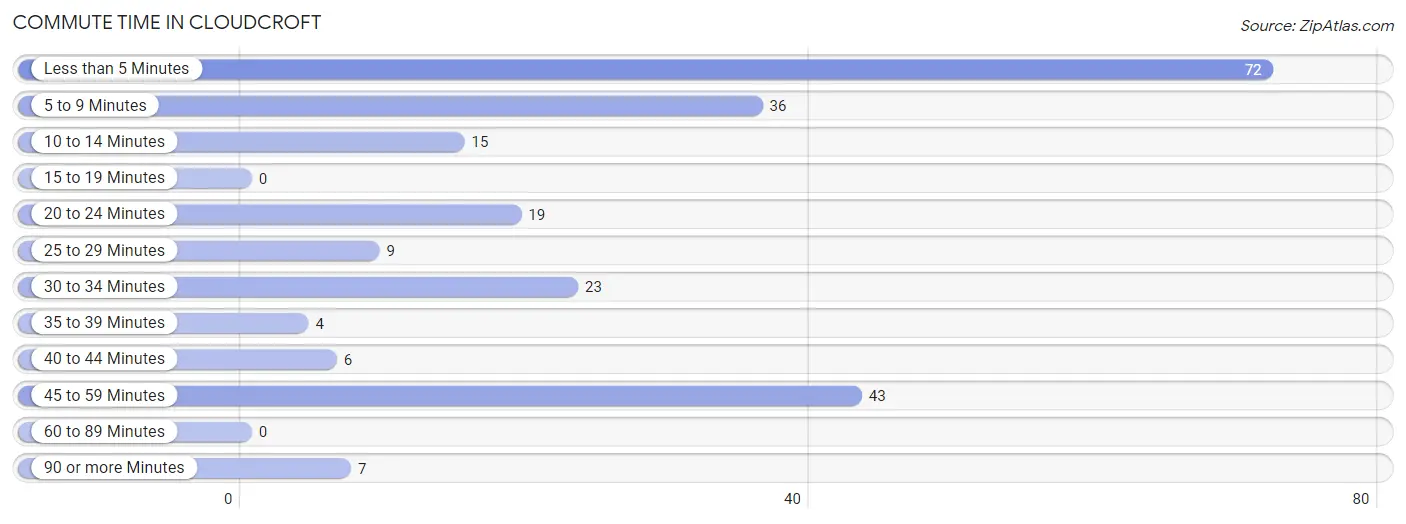
| Commute Time | # Commuters | % Commuters |
| Less than 5 Minutes | 72 | 30.8% |
| 5 to 9 Minutes | 36 | 15.4% |
| 10 to 14 Minutes | 15 | 6.4% |
| 15 to 19 Minutes | 0 | 0.0% |
| 20 to 24 Minutes | 19 | 8.1% |
| 25 to 29 Minutes | 9 | 3.8% |
| 30 to 34 Minutes | 23 | 9.8% |
| 35 to 39 Minutes | 4 | 1.7% |
| 40 to 44 Minutes | 6 | 2.6% |
| 45 to 59 Minutes | 43 | 18.4% |
| 60 to 89 Minutes | 0 | 0.0% |
| 90 or more Minutes | 7 | 3.0% |
Commute Time by Sex in Cloudcroft
The most common commute times in Cloudcroft are 45 to 59 minutes (25 commuters, 19.8%) for males and less than 5 minutes (68 commuters, 63.0%) for females.
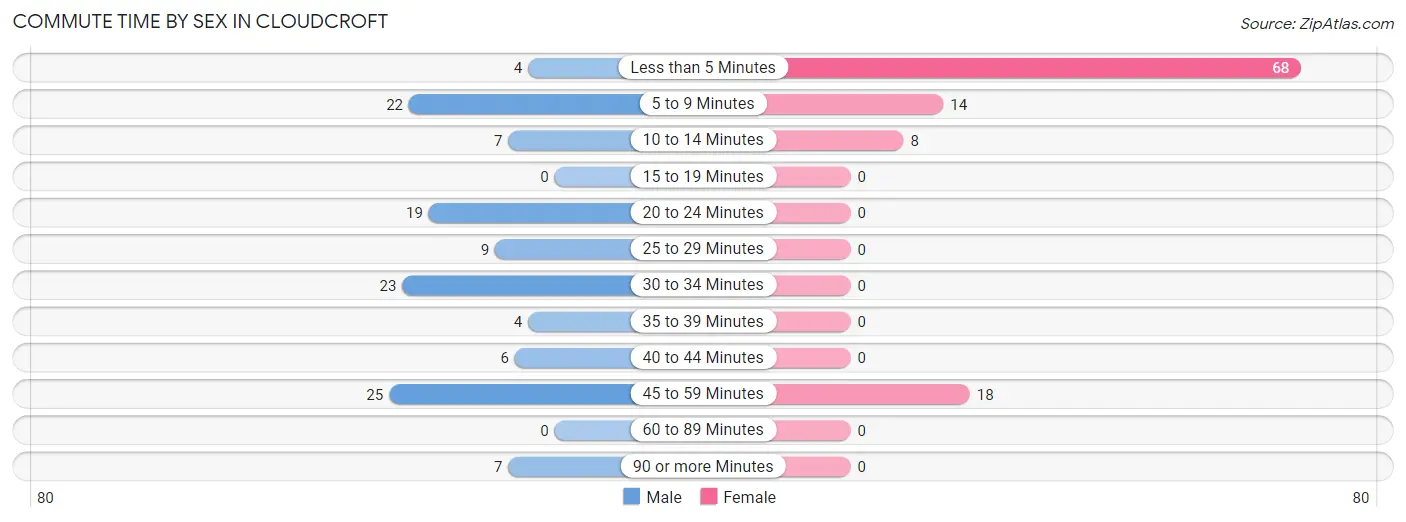
| Commute Time | Male | Female |
| Less than 5 Minutes | 4 (3.2%) | 68 (63.0%) |
| 5 to 9 Minutes | 22 (17.5%) | 14 (13.0%) |
| 10 to 14 Minutes | 7 (5.6%) | 8 (7.4%) |
| 15 to 19 Minutes | 0 (0.0%) | 0 (0.0%) |
| 20 to 24 Minutes | 19 (15.1%) | 0 (0.0%) |
| 25 to 29 Minutes | 9 (7.1%) | 0 (0.0%) |
| 30 to 34 Minutes | 23 (18.2%) | 0 (0.0%) |
| 35 to 39 Minutes | 4 (3.2%) | 0 (0.0%) |
| 40 to 44 Minutes | 6 (4.8%) | 0 (0.0%) |
| 45 to 59 Minutes | 25 (19.8%) | 18 (16.7%) |
| 60 to 89 Minutes | 0 (0.0%) | 0 (0.0%) |
| 90 or more Minutes | 7 (5.6%) | 0 (0.0%) |
Time of Departure to Work by Sex in Cloudcroft
The most frequent times of departure to work in Cloudcroft are 7:30 AM to 7:59 AM (40, 31.8%) for males and 9:00 AM to 9:59 AM (63, 58.3%) for females.
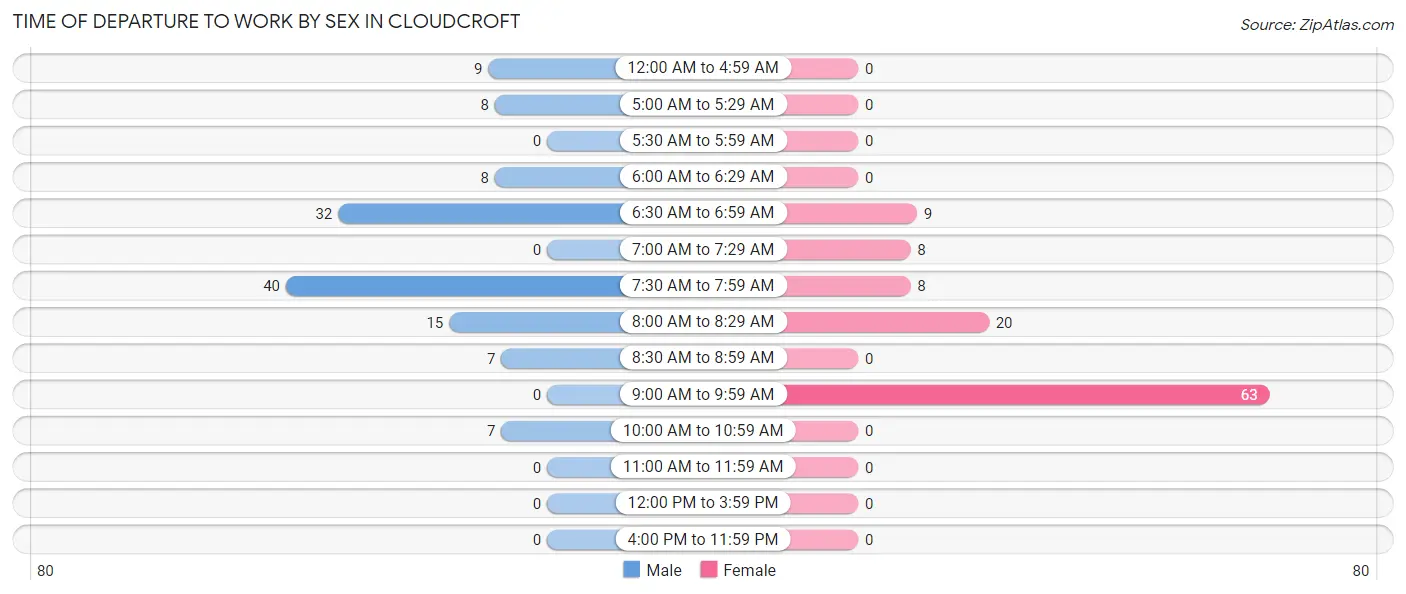
| Time of Departure | Male | Female |
| 12:00 AM to 4:59 AM | 9 (7.1%) | 0 (0.0%) |
| 5:00 AM to 5:29 AM | 8 (6.4%) | 0 (0.0%) |
| 5:30 AM to 5:59 AM | 0 (0.0%) | 0 (0.0%) |
| 6:00 AM to 6:29 AM | 8 (6.4%) | 0 (0.0%) |
| 6:30 AM to 6:59 AM | 32 (25.4%) | 9 (8.3%) |
| 7:00 AM to 7:29 AM | 0 (0.0%) | 8 (7.4%) |
| 7:30 AM to 7:59 AM | 40 (31.8%) | 8 (7.4%) |
| 8:00 AM to 8:29 AM | 15 (11.9%) | 20 (18.5%) |
| 8:30 AM to 8:59 AM | 7 (5.6%) | 0 (0.0%) |
| 9:00 AM to 9:59 AM | 0 (0.0%) | 63 (58.3%) |
| 10:00 AM to 10:59 AM | 7 (5.6%) | 0 (0.0%) |
| 11:00 AM to 11:59 AM | 0 (0.0%) | 0 (0.0%) |
| 12:00 PM to 3:59 PM | 0 (0.0%) | 0 (0.0%) |
| 4:00 PM to 11:59 PM | 0 (0.0%) | 0 (0.0%) |
| Total | 126 (100.0%) | 108 (100.0%) |
Housing Occupancy in Cloudcroft
Occupancy by Ownership in Cloudcroft
Of the total 325 dwellings in Cloudcroft, owner-occupied units account for 251 (77.2%), while renter-occupied units make up 74 (22.8%).
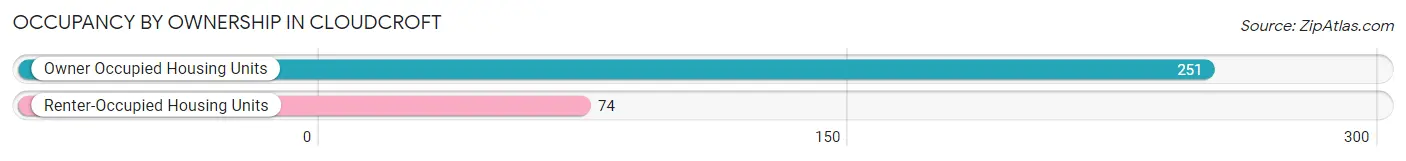
| Occupancy | # Housing Units | % Housing Units |
| Owner Occupied Housing Units | 251 | 77.2% |
| Renter-Occupied Housing Units | 74 | 22.8% |
| Total Occupied Housing Units | 325 | 100.0% |
Occupancy by Household Size in Cloudcroft
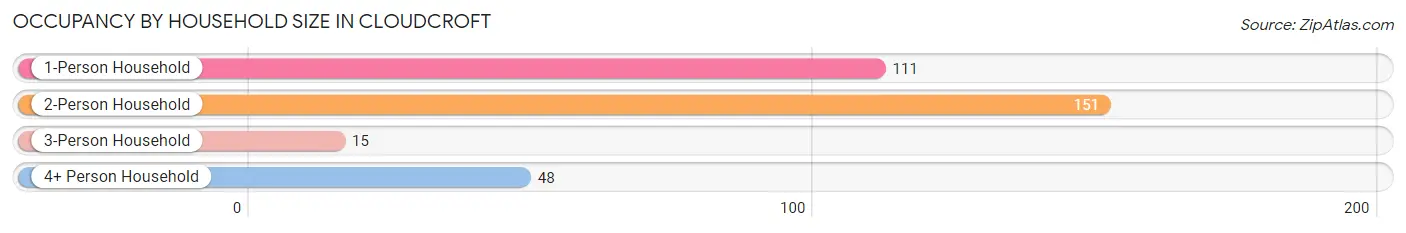
| Household Size | # Housing Units | % Housing Units |
| 1-Person Household | 111 | 34.2% |
| 2-Person Household | 151 | 46.5% |
| 3-Person Household | 15 | 4.6% |
| 4+ Person Household | 48 | 14.8% |
| Total Housing Units | 325 | 100.0% |
Occupancy by Ownership by Household Size in Cloudcroft
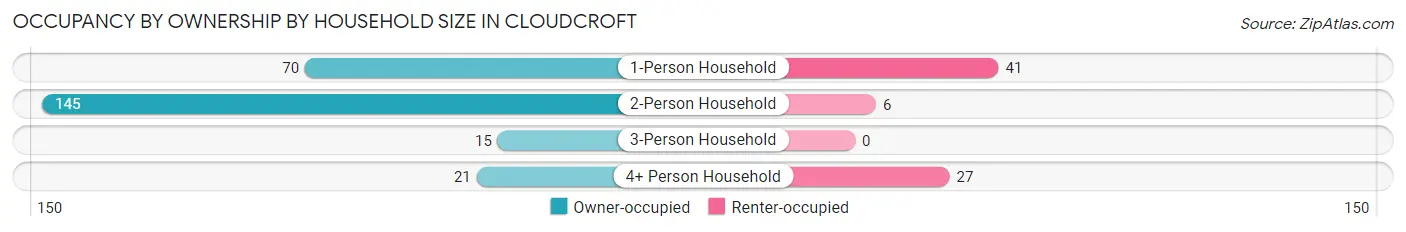
| Household Size | Owner-occupied | Renter-occupied |
| 1-Person Household | 70 (63.1%) | 41 (36.9%) |
| 2-Person Household | 145 (96.0%) | 6 (4.0%) |
| 3-Person Household | 15 (100.0%) | 0 (0.0%) |
| 4+ Person Household | 21 (43.8%) | 27 (56.2%) |
| Total Housing Units | 251 (77.2%) | 74 (22.8%) |
Occupancy by Educational Attainment in Cloudcroft
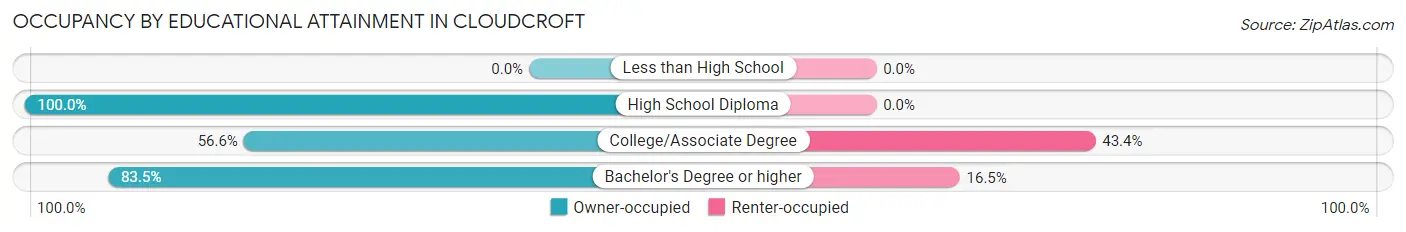
| Household Size | Owner-occupied | Renter-occupied |
| Less than High School | 0 (0.0%) | 0 (0.0%) |
| High School Diploma | 76 (100.0%) | 0 (0.0%) |
| College/Associate Degree | 69 (56.6%) | 53 (43.4%) |
| Bachelor's Degree or higher | 106 (83.5%) | 21 (16.5%) |
Occupancy by Age of Householder in Cloudcroft
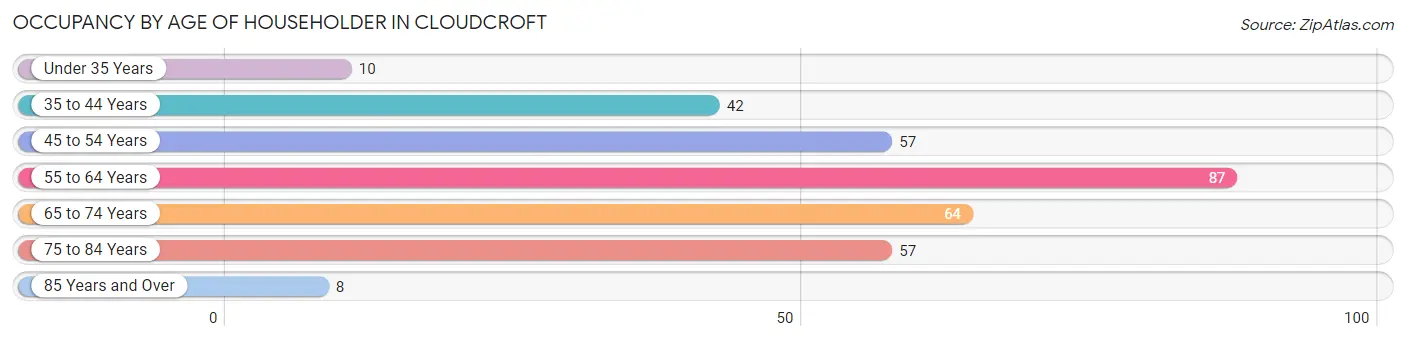
| Age Bracket | # Households | % Households |
| Under 35 Years | 10 | 3.1% |
| 35 to 44 Years | 42 | 12.9% |
| 45 to 54 Years | 57 | 17.5% |
| 55 to 64 Years | 87 | 26.8% |
| 65 to 74 Years | 64 | 19.7% |
| 75 to 84 Years | 57 | 17.5% |
| 85 Years and Over | 8 | 2.5% |
| Total | 325 | 100.0% |
Housing Finances in Cloudcroft
Median Income by Occupancy in Cloudcroft
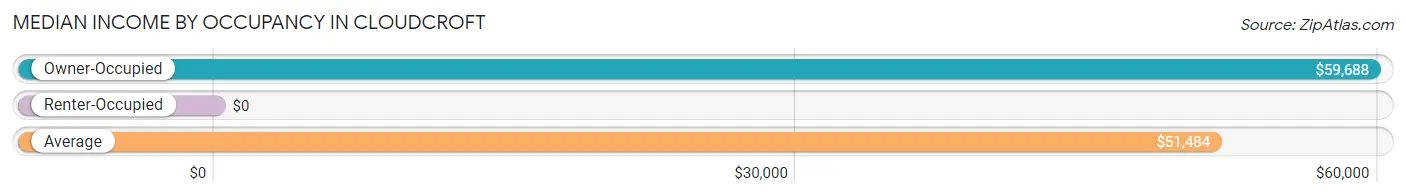
| Occupancy Type | # Households | Median Income |
| Owner-Occupied | 251 (77.2%) | $59,688 |
| Renter-Occupied | 74 (22.8%) | $0 |
| Average | 325 (100.0%) | $51,484 |
Occupancy by Householder Income Bracket in Cloudcroft
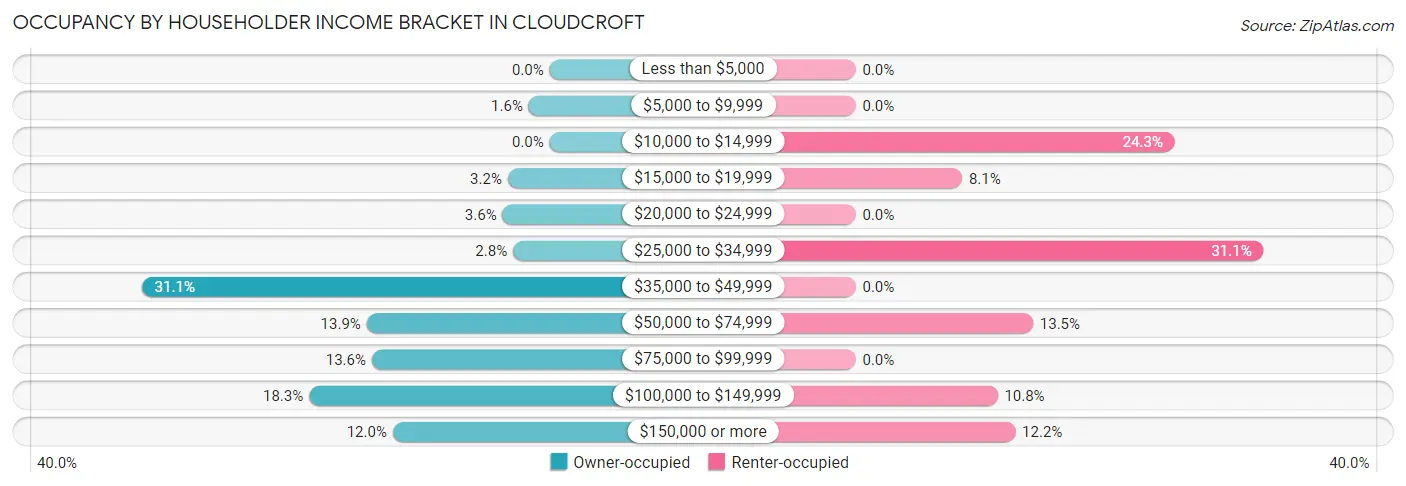
| Income Bracket | Owner-occupied | Renter-occupied |
| Less than $5,000 | 0 (0.0%) | 0 (0.0%) |
| $5,000 to $9,999 | 4 (1.6%) | 0 (0.0%) |
| $10,000 to $14,999 | 0 (0.0%) | 18 (24.3%) |
| $15,000 to $19,999 | 8 (3.2%) | 6 (8.1%) |
| $20,000 to $24,999 | 9 (3.6%) | 0 (0.0%) |
| $25,000 to $34,999 | 7 (2.8%) | 23 (31.1%) |
| $35,000 to $49,999 | 78 (31.1%) | 0 (0.0%) |
| $50,000 to $74,999 | 35 (13.9%) | 10 (13.5%) |
| $75,000 to $99,999 | 34 (13.6%) | 0 (0.0%) |
| $100,000 to $149,999 | 46 (18.3%) | 8 (10.8%) |
| $150,000 or more | 30 (11.9%) | 9 (12.2%) |
| Total | 251 (100.0%) | 74 (100.0%) |
Monthly Housing Cost Tiers in Cloudcroft
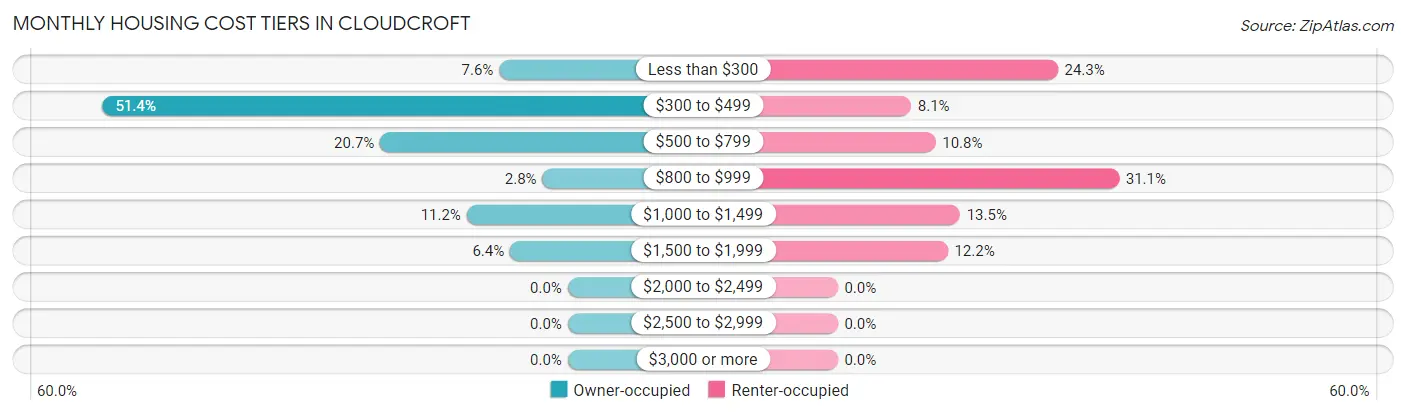
| Monthly Cost | Owner-occupied | Renter-occupied |
| Less than $300 | 19 (7.6%) | 18 (24.3%) |
| $300 to $499 | 129 (51.4%) | 6 (8.1%) |
| $500 to $799 | 52 (20.7%) | 8 (10.8%) |
| $800 to $999 | 7 (2.8%) | 23 (31.1%) |
| $1,000 to $1,499 | 28 (11.2%) | 10 (13.5%) |
| $1,500 to $1,999 | 16 (6.4%) | 9 (12.2%) |
| $2,000 to $2,499 | 0 (0.0%) | 0 (0.0%) |
| $2,500 to $2,999 | 0 (0.0%) | 0 (0.0%) |
| $3,000 or more | 0 (0.0%) | 0 (0.0%) |
| Total | 251 (100.0%) | 74 (100.0%) |
Physical Housing Characteristics in Cloudcroft
Housing Structures in Cloudcroft
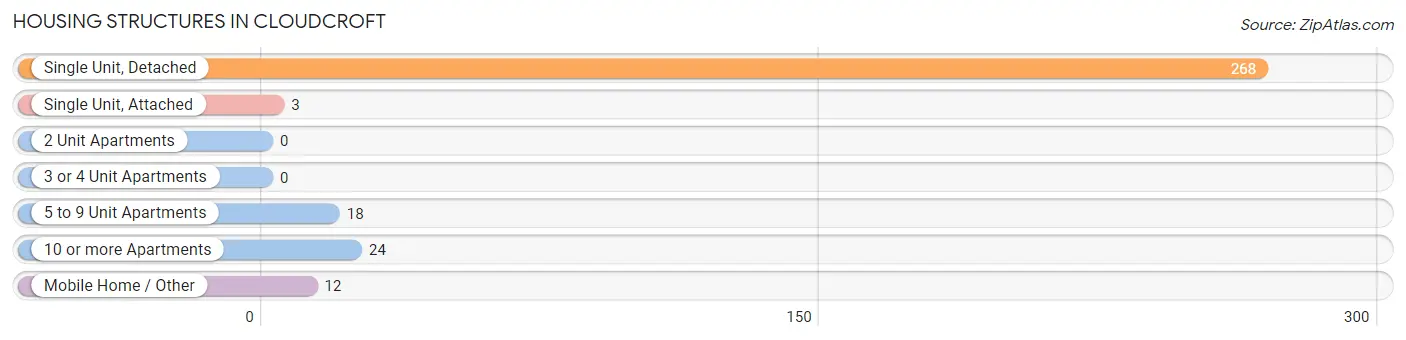
| Structure Type | # Housing Units | % Housing Units |
| Single Unit, Detached | 268 | 82.5% |
| Single Unit, Attached | 3 | 0.9% |
| 2 Unit Apartments | 0 | 0.0% |
| 3 or 4 Unit Apartments | 0 | 0.0% |
| 5 to 9 Unit Apartments | 18 | 5.5% |
| 10 or more Apartments | 24 | 7.4% |
| Mobile Home / Other | 12 | 3.7% |
| Total | 325 | 100.0% |
Housing Structures by Occupancy in Cloudcroft
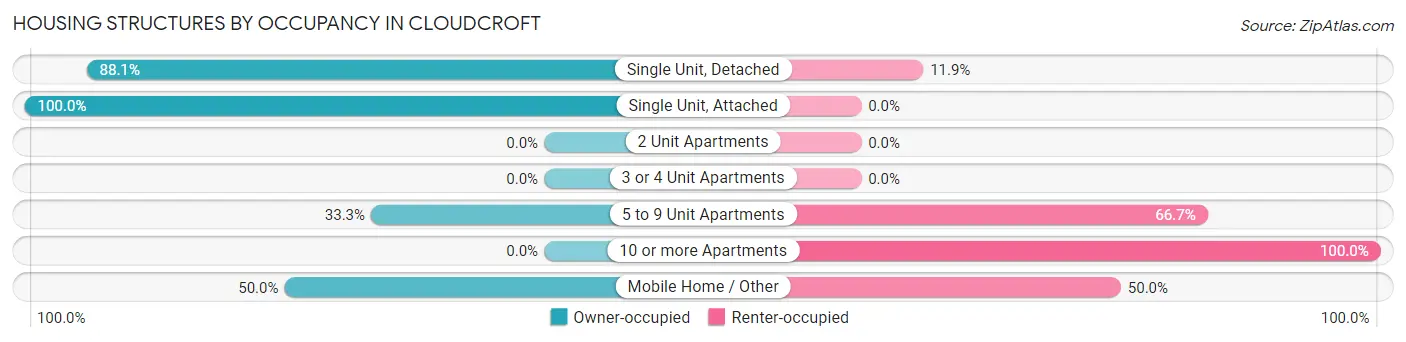
| Structure Type | Owner-occupied | Renter-occupied |
| Single Unit, Detached | 236 (88.1%) | 32 (11.9%) |
| Single Unit, Attached | 3 (100.0%) | 0 (0.0%) |
| 2 Unit Apartments | 0 (0.0%) | 0 (0.0%) |
| 3 or 4 Unit Apartments | 0 (0.0%) | 0 (0.0%) |
| 5 to 9 Unit Apartments | 6 (33.3%) | 12 (66.7%) |
| 10 or more Apartments | 0 (0.0%) | 24 (100.0%) |
| Mobile Home / Other | 6 (50.0%) | 6 (50.0%) |
| Total | 251 (77.2%) | 74 (22.8%) |
Housing Structures by Number of Rooms in Cloudcroft
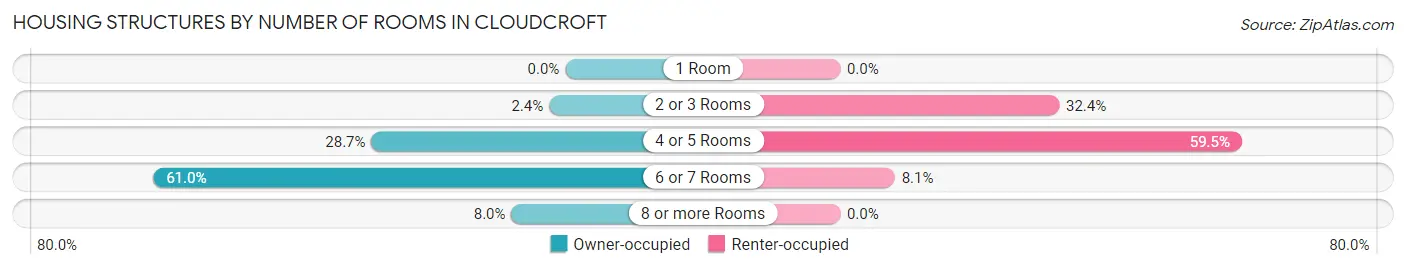
| Number of Rooms | Owner-occupied | Renter-occupied |
| 1 Room | 0 (0.0%) | 0 (0.0%) |
| 2 or 3 Rooms | 6 (2.4%) | 24 (32.4%) |
| 4 or 5 Rooms | 72 (28.7%) | 44 (59.5%) |
| 6 or 7 Rooms | 153 (61.0%) | 6 (8.1%) |
| 8 or more Rooms | 20 (8.0%) | 0 (0.0%) |
| Total | 251 (100.0%) | 74 (100.0%) |
Housing Structure by Heating Type in Cloudcroft
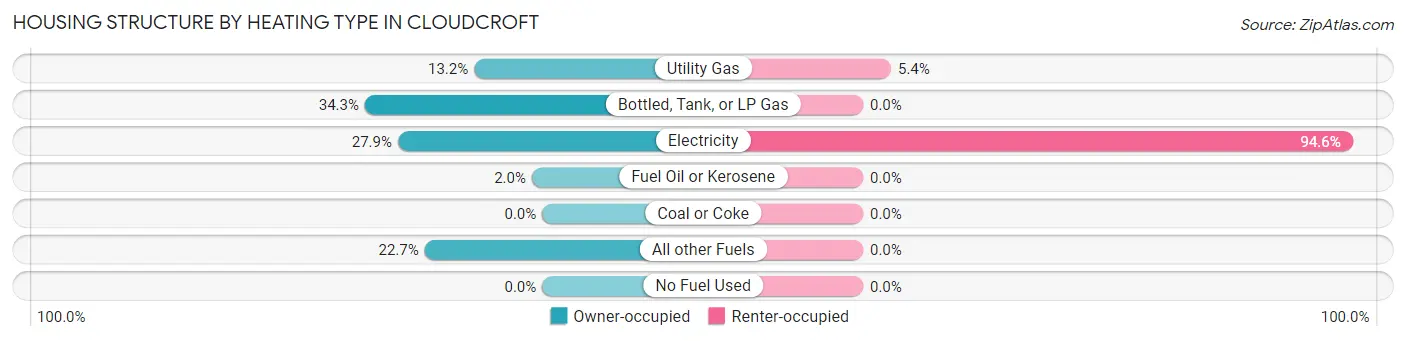
| Heating Type | Owner-occupied | Renter-occupied |
| Utility Gas | 33 (13.2%) | 4 (5.4%) |
| Bottled, Tank, or LP Gas | 86 (34.3%) | 0 (0.0%) |
| Electricity | 70 (27.9%) | 70 (94.6%) |
| Fuel Oil or Kerosene | 5 (2.0%) | 0 (0.0%) |
| Coal or Coke | 0 (0.0%) | 0 (0.0%) |
| All other Fuels | 57 (22.7%) | 0 (0.0%) |
| No Fuel Used | 0 (0.0%) | 0 (0.0%) |
| Total | 251 (100.0%) | 74 (100.0%) |
Household Vehicle Usage in Cloudcroft
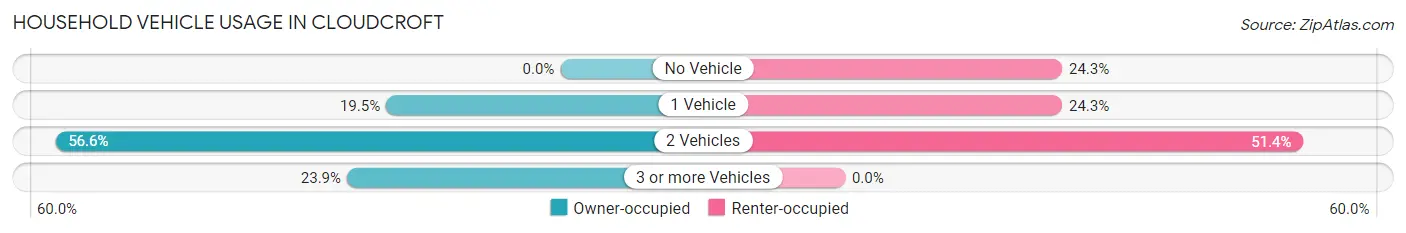
| Vehicles per Household | Owner-occupied | Renter-occupied |
| No Vehicle | 0 (0.0%) | 18 (24.3%) |
| 1 Vehicle | 49 (19.5%) | 18 (24.3%) |
| 2 Vehicles | 142 (56.6%) | 38 (51.3%) |
| 3 or more Vehicles | 60 (23.9%) | 0 (0.0%) |
| Total | 251 (100.0%) | 74 (100.0%) |
Real Estate & Mortgages in Cloudcroft
Real Estate and Mortgage Overview in Cloudcroft
| Characteristic | Without Mortgage | With Mortgage |
| Housing Units | 187 | 64 |
| Median Property Value | $166,500 | $235,200 |
| Median Household Income | - | - |
| Monthly Housing Costs | $383 | $0 |
| Real Estate Taxes | $735 | $0 |
Property Value by Mortgage Status in Cloudcroft
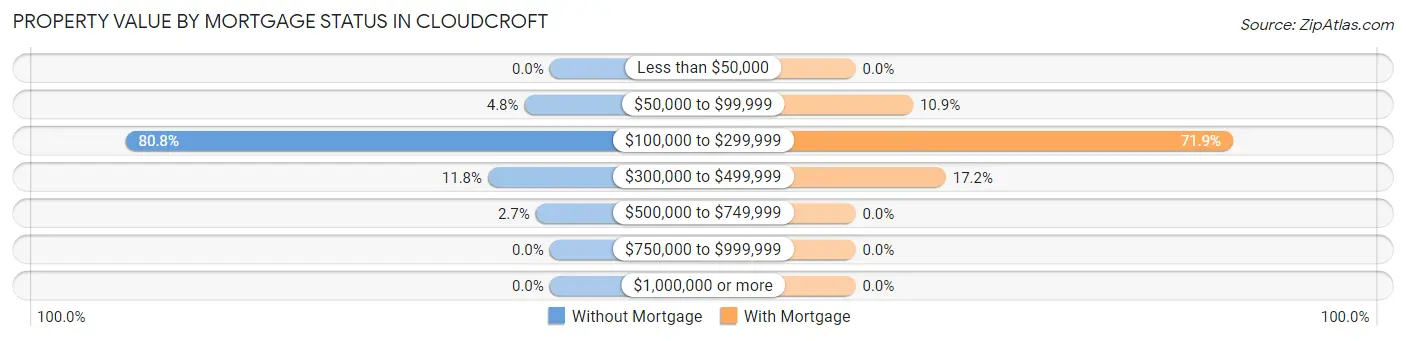
| Property Value | Without Mortgage | With Mortgage |
| Less than $50,000 | 0 (0.0%) | 0 (0.0%) |
| $50,000 to $99,999 | 9 (4.8%) | 7 (10.9%) |
| $100,000 to $299,999 | 151 (80.7%) | 46 (71.9%) |
| $300,000 to $499,999 | 22 (11.8%) | 11 (17.2%) |
| $500,000 to $749,999 | 5 (2.7%) | 0 (0.0%) |
| $750,000 to $999,999 | 0 (0.0%) | 0 (0.0%) |
| $1,000,000 or more | 0 (0.0%) | 0 (0.0%) |
| Total | 187 (100.0%) | 64 (100.0%) |
Household Income by Mortgage Status in Cloudcroft
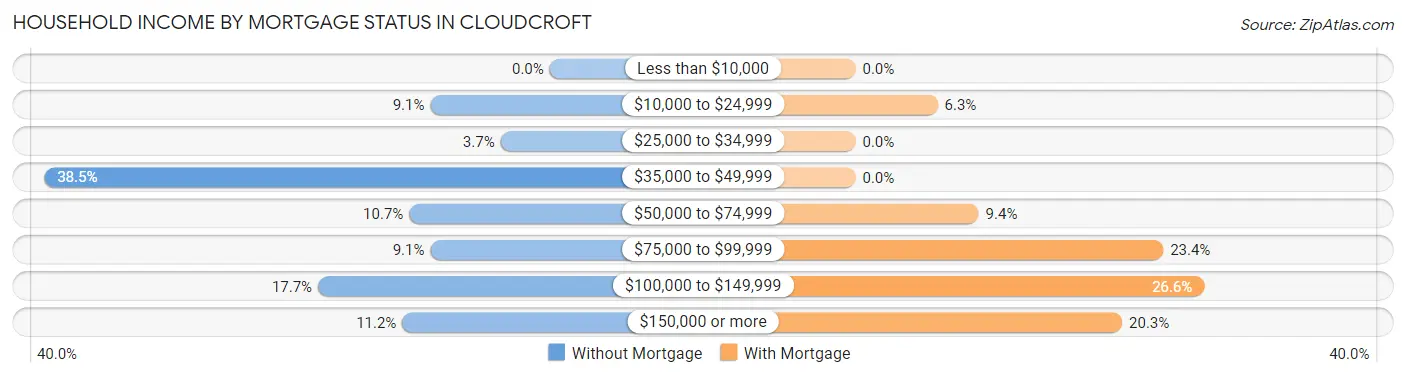
| Household Income | Without Mortgage | With Mortgage |
| Less than $10,000 | 0 (0.0%) | 0 (0.0%) |
| $10,000 to $24,999 | 17 (9.1%) | 4 (6.2%) |
| $25,000 to $34,999 | 7 (3.7%) | 0 (0.0%) |
| $35,000 to $49,999 | 72 (38.5%) | 0 (0.0%) |
| $50,000 to $74,999 | 20 (10.7%) | 6 (9.4%) |
| $75,000 to $99,999 | 17 (9.1%) | 15 (23.4%) |
| $100,000 to $149,999 | 33 (17.6%) | 17 (26.6%) |
| $150,000 or more | 21 (11.2%) | 13 (20.3%) |
| Total | 187 (100.0%) | 64 (100.0%) |
Property Value to Household Income Ratio in Cloudcroft
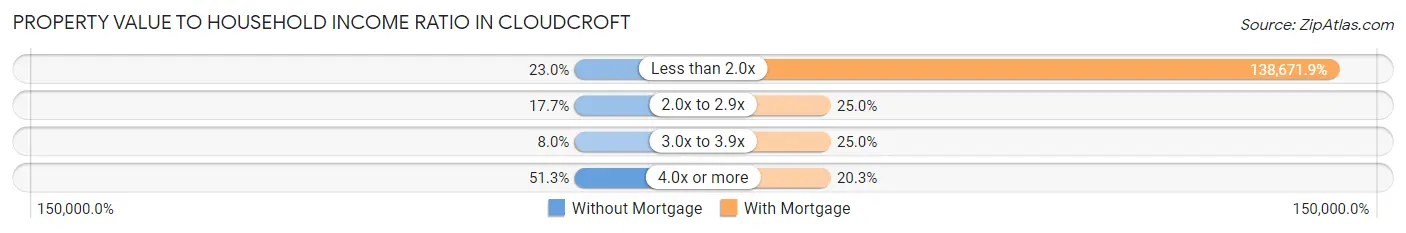
| Value-to-Income Ratio | Without Mortgage | With Mortgage |
| Less than 2.0x | 43 (23.0%) | 88,750 (138,671.9%) |
| 2.0x to 2.9x | 33 (17.6%) | 16 (25.0%) |
| 3.0x to 3.9x | 15 (8.0%) | 16 (25.0%) |
| 4.0x or more | 96 (51.3%) | 13 (20.3%) |
| Total | 187 (100.0%) | 64 (100.0%) |
Real Estate Taxes by Mortgage Status in Cloudcroft
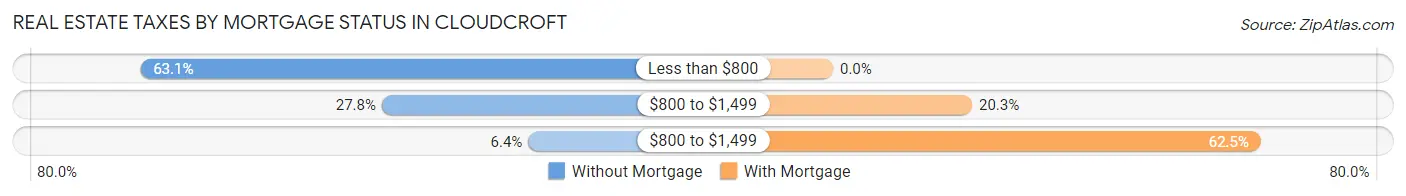
| Property Taxes | Without Mortgage | With Mortgage |
| Less than $800 | 118 (63.1%) | 0 (0.0%) |
| $800 to $1,499 | 52 (27.8%) | 13 (20.3%) |
| $800 to $1,499 | 12 (6.4%) | 40 (62.5%) |
| Total | 187 (100.0%) | 64 (100.0%) |
Health & Disability in Cloudcroft
Health Insurance Coverage by Age in Cloudcroft
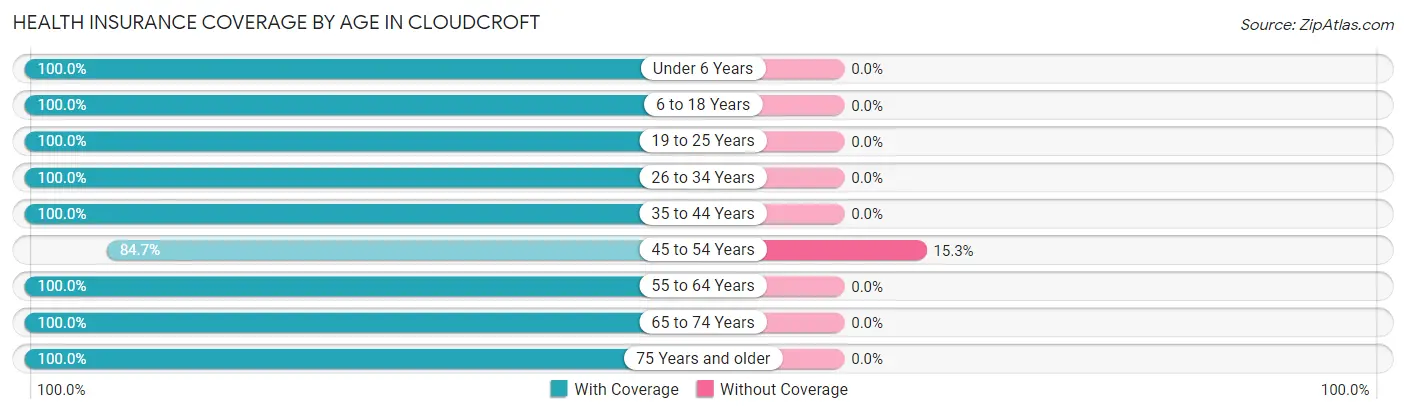
| Age Bracket | With Coverage | Without Coverage |
| Under 6 Years | 91 (100.0%) | 0 (0.0%) |
| 6 to 18 Years | 211 (100.0%) | 0 (0.0%) |
| 19 to 25 Years | 6 (100.0%) | 0 (0.0%) |
| 26 to 34 Years | 6 (100.0%) | 0 (0.0%) |
| 35 to 44 Years | 80 (100.0%) | 0 (0.0%) |
| 45 to 54 Years | 105 (84.7%) | 19 (15.3%) |
| 55 to 64 Years | 152 (100.0%) | 0 (0.0%) |
| 65 to 74 Years | 90 (100.0%) | 0 (0.0%) |
| 75 Years and older | 102 (100.0%) | 0 (0.0%) |
| Total | 843 (97.8%) | 19 (2.2%) |
Health Insurance Coverage by Citizenship Status in Cloudcroft
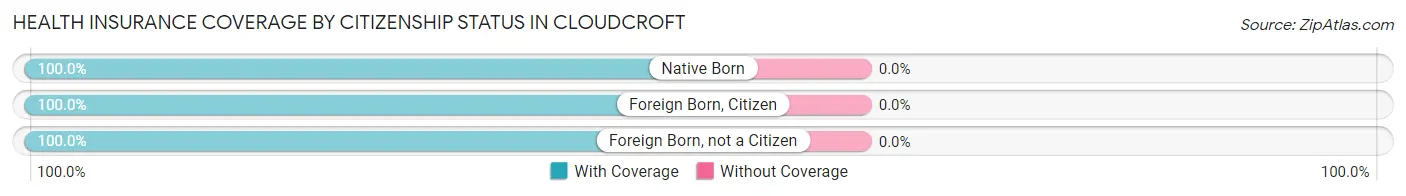
| Citizenship Status | With Coverage | Without Coverage |
| Native Born | 91 (100.0%) | 0 (0.0%) |
| Foreign Born, Citizen | 211 (100.0%) | 0 (0.0%) |
| Foreign Born, not a Citizen | 6 (100.0%) | 0 (0.0%) |
Health Insurance Coverage by Household Income in Cloudcroft
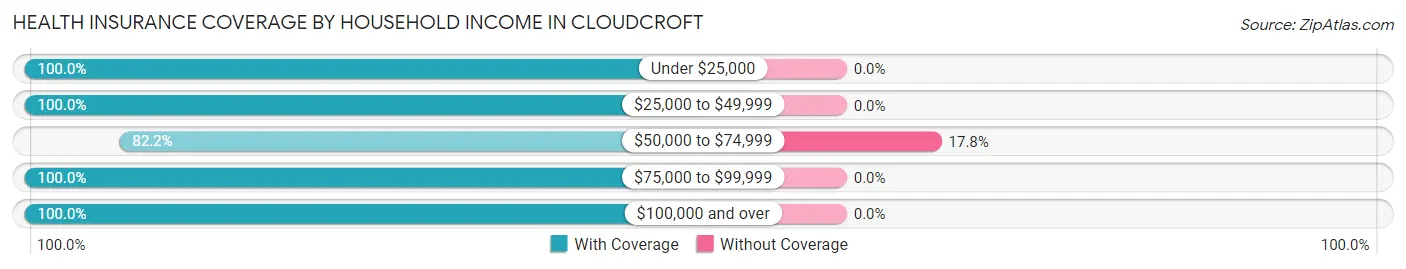
| Household Income | With Coverage | Without Coverage |
| Under $25,000 | 45 (100.0%) | 0 (0.0%) |
| $25,000 to $49,999 | 394 (100.0%) | 0 (0.0%) |
| $50,000 to $74,999 | 88 (82.2%) | 19 (17.8%) |
| $75,000 to $99,999 | 124 (100.0%) | 0 (0.0%) |
| $100,000 and over | 192 (100.0%) | 0 (0.0%) |
Public vs Private Health Insurance Coverage by Age in Cloudcroft
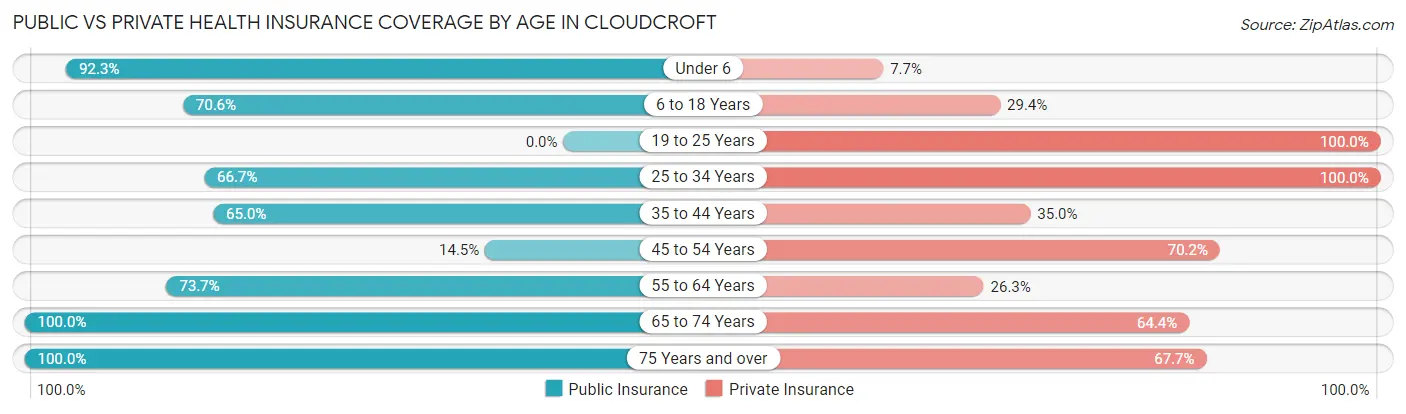
| Age Bracket | Public Insurance | Private Insurance |
| Under 6 | 84 (92.3%) | 7 (7.7%) |
| 6 to 18 Years | 149 (70.6%) | 62 (29.4%) |
| 19 to 25 Years | 0 (0.0%) | 6 (100.0%) |
| 25 to 34 Years | 4 (66.7%) | 6 (100.0%) |
| 35 to 44 Years | 52 (65.0%) | 28 (35.0%) |
| 45 to 54 Years | 18 (14.5%) | 87 (70.2%) |
| 55 to 64 Years | 112 (73.7%) | 40 (26.3%) |
| 65 to 74 Years | 90 (100.0%) | 58 (64.4%) |
| 75 Years and over | 102 (100.0%) | 69 (67.6%) |
| Total | 611 (70.9%) | 363 (42.1%) |
Disability Status by Sex by Age in Cloudcroft
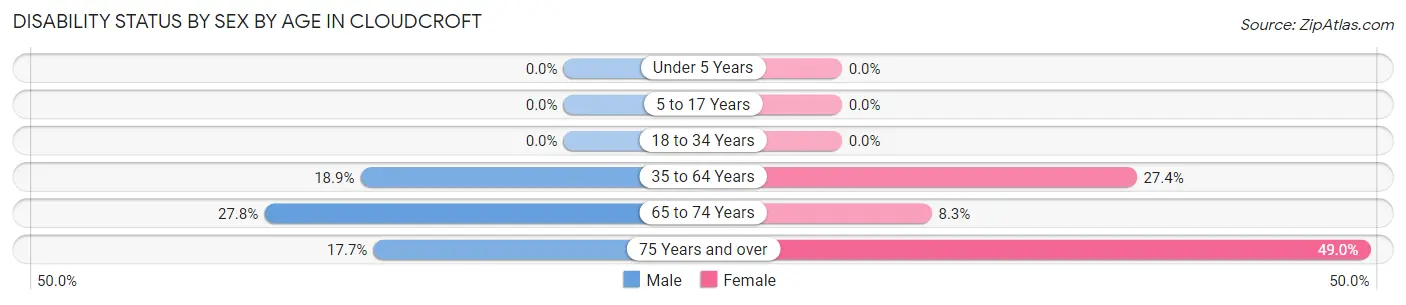
| Age Bracket | Male | Female |
| Under 5 Years | 0 (0.0%) | 0 (0.0%) |
| 5 to 17 Years | 0 (0.0%) | 0 (0.0%) |
| 18 to 34 Years | 0 (0.0%) | 0 (0.0%) |
| 35 to 64 Years | 23 (18.9%) | 64 (27.4%) |
| 65 to 74 Years | 15 (27.8%) | 3 (8.3%) |
| 75 Years and over | 9 (17.6%) | 25 (49.0%) |
Disability Class by Sex by Age in Cloudcroft
Disability Class: Hearing Difficulty
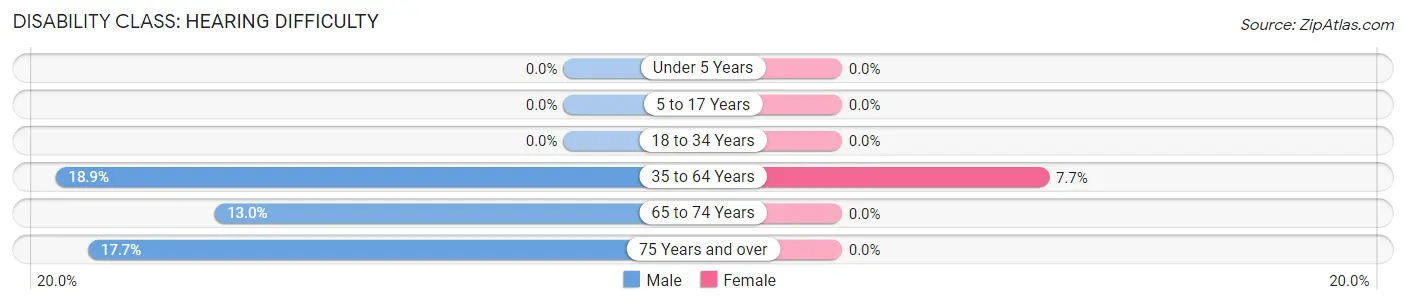
| Age Bracket | Male | Female |
| Under 5 Years | 0 (0.0%) | 0 (0.0%) |
| 5 to 17 Years | 0 (0.0%) | 0 (0.0%) |
| 18 to 34 Years | 0 (0.0%) | 0 (0.0%) |
| 35 to 64 Years | 23 (18.9%) | 18 (7.7%) |
| 65 to 74 Years | 7 (13.0%) | 0 (0.0%) |
| 75 Years and over | 9 (17.6%) | 0 (0.0%) |
Disability Class: Vision Difficulty
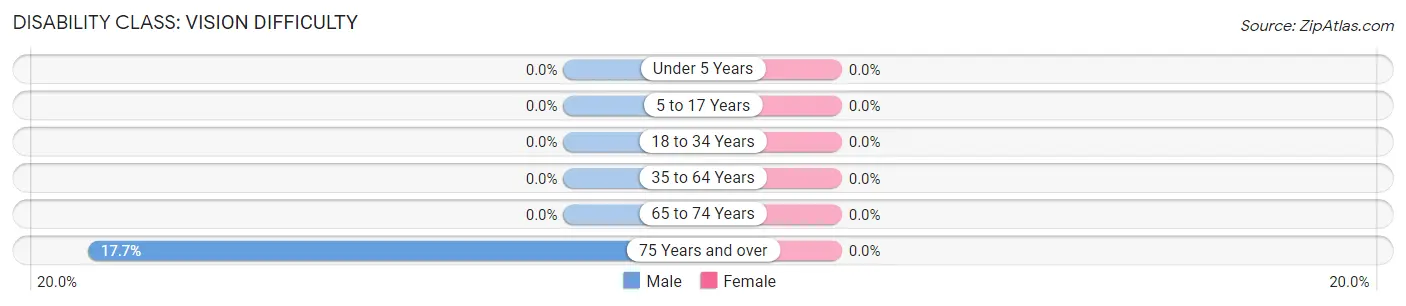
| Age Bracket | Male | Female |
| Under 5 Years | 0 (0.0%) | 0 (0.0%) |
| 5 to 17 Years | 0 (0.0%) | 0 (0.0%) |
| 18 to 34 Years | 0 (0.0%) | 0 (0.0%) |
| 35 to 64 Years | 0 (0.0%) | 0 (0.0%) |
| 65 to 74 Years | 0 (0.0%) | 0 (0.0%) |
| 75 Years and over | 9 (17.6%) | 0 (0.0%) |
Disability Class: Cognitive Difficulty
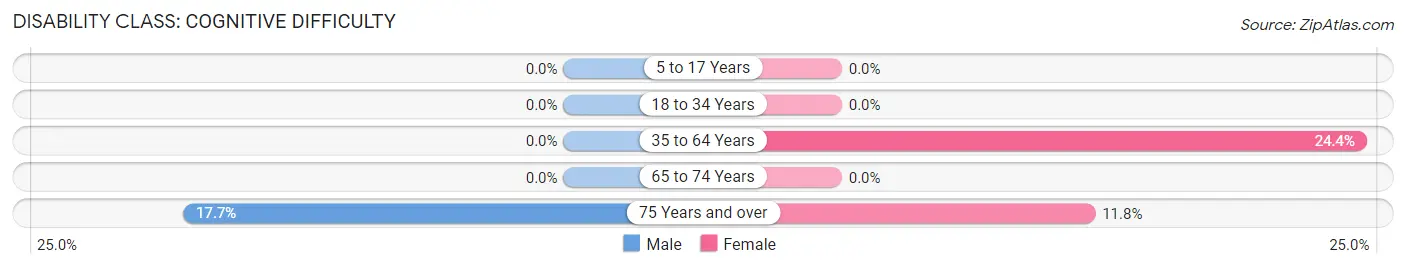
| Age Bracket | Male | Female |
| 5 to 17 Years | 0 (0.0%) | 0 (0.0%) |
| 18 to 34 Years | 0 (0.0%) | 0 (0.0%) |
| 35 to 64 Years | 0 (0.0%) | 57 (24.4%) |
| 65 to 74 Years | 0 (0.0%) | 0 (0.0%) |
| 75 Years and over | 9 (17.6%) | 6 (11.8%) |
Disability Class: Ambulatory Difficulty
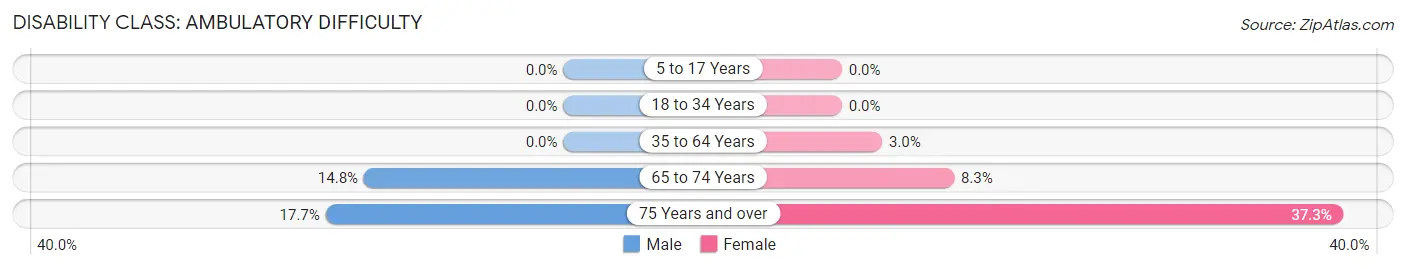
| Age Bracket | Male | Female |
| 5 to 17 Years | 0 (0.0%) | 0 (0.0%) |
| 18 to 34 Years | 0 (0.0%) | 0 (0.0%) |
| 35 to 64 Years | 0 (0.0%) | 7 (3.0%) |
| 65 to 74 Years | 8 (14.8%) | 3 (8.3%) |
| 75 Years and over | 9 (17.6%) | 19 (37.2%) |
Disability Class: Self-Care Difficulty
| Age Bracket | Male | Female |
| 5 to 17 Years | 0 (0.0%) | 0 (0.0%) |
| 18 to 34 Years | 0 (0.0%) | 0 (0.0%) |
| 35 to 64 Years | 0 (0.0%) | 0 (0.0%) |
| 65 to 74 Years | 0 (0.0%) | 0 (0.0%) |
| 75 Years and over | 0 (0.0%) | 0 (0.0%) |
Technology Access in Cloudcroft
Computing Device Access in Cloudcroft
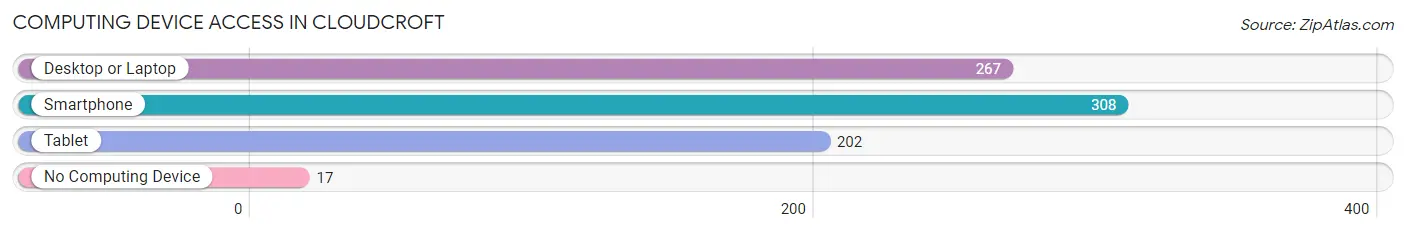
| Device Type | # Households | % Households |
| Desktop or Laptop | 267 | 82.2% |
| Smartphone | 308 | 94.8% |
| Tablet | 202 | 62.2% |
| No Computing Device | 17 | 5.2% |
| Total | 325 | 100.0% |
Internet Access in Cloudcroft
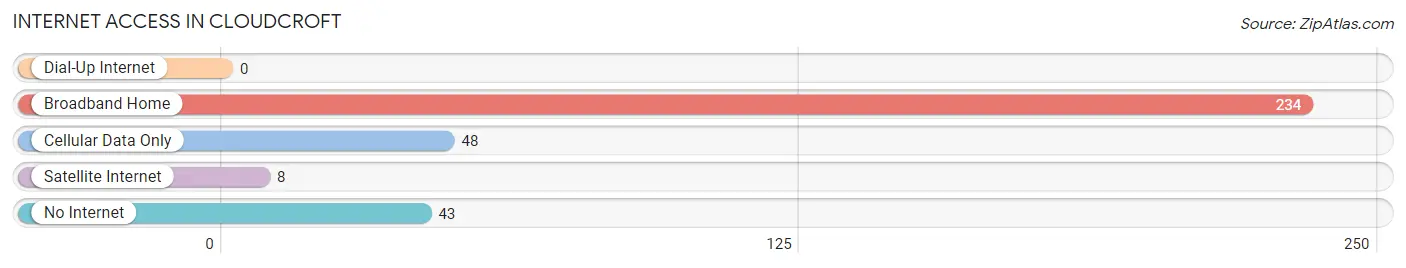
| Internet Type | # Households | % Households |
| Dial-Up Internet | 0 | 0.0% |
| Broadband Home | 234 | 72.0% |
| Cellular Data Only | 48 | 14.8% |
| Satellite Internet | 8 | 2.5% |
| No Internet | 43 | 13.2% |
| Total | 325 | 100.0% |
Cloudcroft Summary
History
Cloudcroft, New Mexico is a small village located in the Sacramento Mountains of Otero County. It is situated at an elevation of 8,600 feet, making it one of the highest towns in the United States. The area was first inhabited by the Mescalero Apache, who used the area for hunting and gathering. The first non-Native American settlers arrived in the late 1800s, and the town was officially founded in 1898.
The town was originally called Cloudcroft because of the clouds that often hung over the area. The name was chosen by the first postmaster, who was inspired by the clouds that often hung over the area. The town quickly grew in popularity as a summer resort destination, and by the early 1900s, it had become a popular destination for tourists from all over the country.
The town was incorporated in 1912, and the first mayor was elected in 1913. The town quickly grew in popularity as a summer resort destination, and by the early 1900s, it had become a popular destination for tourists from all over the country.
The town was also home to a number of businesses, including a hotel, a general store, a bank, and a sawmill. The town also had a school, a library, and a newspaper.
In the 1920s, the town began to decline in popularity as a tourist destination, and the population began to decline. The town was hit hard by the Great Depression, and many of the businesses closed. The population continued to decline until the 1950s, when the town began to experience a resurgence in popularity as a summer resort destination.
Geography
Cloudcroft is located in the Sacramento Mountains of Otero County, New Mexico. It is situated at an elevation of 8,600 feet, making it one of the highest towns in the United States. The town is surrounded by the Lincoln National Forest, which provides a variety of outdoor activities, including hiking, camping, fishing, and hunting.
The town is located in a semi-arid climate, with hot summers and cold winters. The average annual temperature is around 50 degrees Fahrenheit, and the average annual precipitation is around 18 inches.
Economy
The economy of Cloudcroft is largely based on tourism. The town is a popular summer resort destination, and it is home to a number of hotels, restaurants, and other businesses that cater to tourists. The town also has a number of shops and galleries that sell local arts and crafts.
The town is also home to a number of businesses that provide services to the local community, including a bank, a post office, and a library. The town also has a number of small businesses, including a sawmill, a general store, and a gas station.
Demographics
As of the 2010 census, the population of Cloudcroft was 1,744. The population is largely white (94.3%), with a small Hispanic population (3.3%). The median household income is $37,500, and the median age is 44.
The town is home to a number of churches, including the First United Methodist Church, the First Baptist Church, and the Church of the Nazarene. The town also has a number of schools, including Cloudcroft Elementary School, Cloudcroft Middle School, and Cloudcroft High School.
Common Questions
What is Per Capita Income in Cloudcroft?
Per Capita income in Cloudcroft is $36,182.
What is the Median Family Income in Cloudcroft?
Median Family Income in Cloudcroft is $94,643.
What is the Median Household income in Cloudcroft?
Median Household Income in Cloudcroft is $51,484.
What is Inequality or Gini Index in Cloudcroft?
Inequality or Gini Index in Cloudcroft is 0.49.
What is the Total Population of Cloudcroft?
Total Population of Cloudcroft is 862.
What is the Total Male Population of Cloudcroft?
Total Male Population of Cloudcroft is 402.
What is the Total Female Population of Cloudcroft?
Total Female Population of Cloudcroft is 460.
What is the Ratio of Males per 100 Females in Cloudcroft?
There are 87.39 Males per 100 Females in Cloudcroft.
What is the Ratio of Females per 100 Males in Cloudcroft?
There are 114.43 Females per 100 Males in Cloudcroft.
What is the Median Population Age in Cloudcroft?
Median Population Age in Cloudcroft is 49.1 Years.
What is the Average Family Size in Cloudcroft
Average Family Size in Cloudcroft is 4.4 People.
What is the Average Household Size in Cloudcroft
Average Household Size in Cloudcroft is 2.6 People.
How Large is the Labor Force in Cloudcroft?
There are 257 People in the Labor Forcein in Cloudcroft.
What is the Percentage of People in the Labor Force in Cloudcroft?
41.6% of People are in the Labor Force in Cloudcroft.