Cedar Crest, NM Map & Demographics
Cedar Crest Map
Cedar Crest Overview
$60,849
PER CAPITA INCOME
$215,027
AVG FAMILY INCOME
$106,550
AVG HOUSEHOLD INCOME
5.3%
WAGE / INCOME GAP [ % ]
94.7¢/ $1
WAGE / INCOME GAP [ $ ]
0.35
INEQUALITY / GINI INDEX
919
TOTAL POPULATION
398
MALE POPULATION
521
FEMALE POPULATION
76.39
MALES / 100 FEMALES
130.90
FEMALES / 100 MALES
58.5
MEDIAN AGE
2.1
AVG FAMILY SIZE
1.6
AVG HOUSEHOLD SIZE
452
LABOR FORCE [ PEOPLE ]
50.7%
PERCENT IN LABOR FORCE
6.6%
UNEMPLOYMENT RATE
Cedar Crest Zip Codes
Cedar Crest Area Codes
Income in Cedar Crest
Income Overview in Cedar Crest
Per Capita Income in Cedar Crest is $60,849, while median incomes of families and households are $215,027 and $106,550 respectively.
| Characteristic | Number | Measure |
| Per Capita Income | 919 | $60,849 |
| Median Family Income | 301 | $215,027 |
| Mean Family Income | 301 | $150,625 |
| Median Household Income | 557 | $106,550 |
| Mean Household Income | 557 | $120,310 |
| Income Deficit | 301 | $0 |
| Wage / Income Gap (%) | 919 | 5.31% |
| Wage / Income Gap ($) | 919 | 94.69¢ per $1 |
| Gini / Inequality Index | 919 | 0.35 |
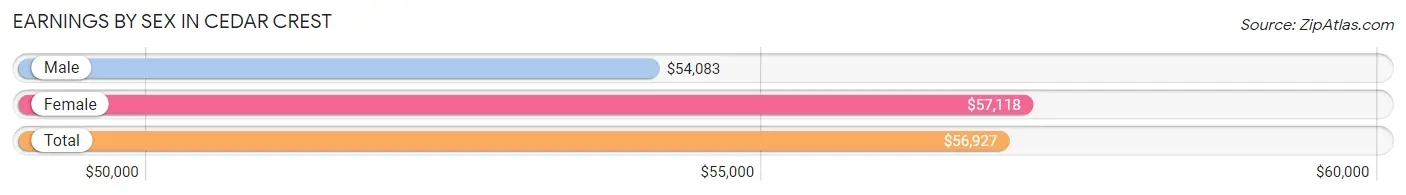
Earnings by Sex in Cedar Crest
Average Earnings in Cedar Crest are $56,927, $54,083 for men and $57,118 for women, a difference of 5.3%.
| Sex | Number | Average Earnings |
| Male | 241 (39.3%) | $54,083 |
| Female | 372 (60.7%) | $57,118 |
| Total | 613 (100.0%) | $56,927 |
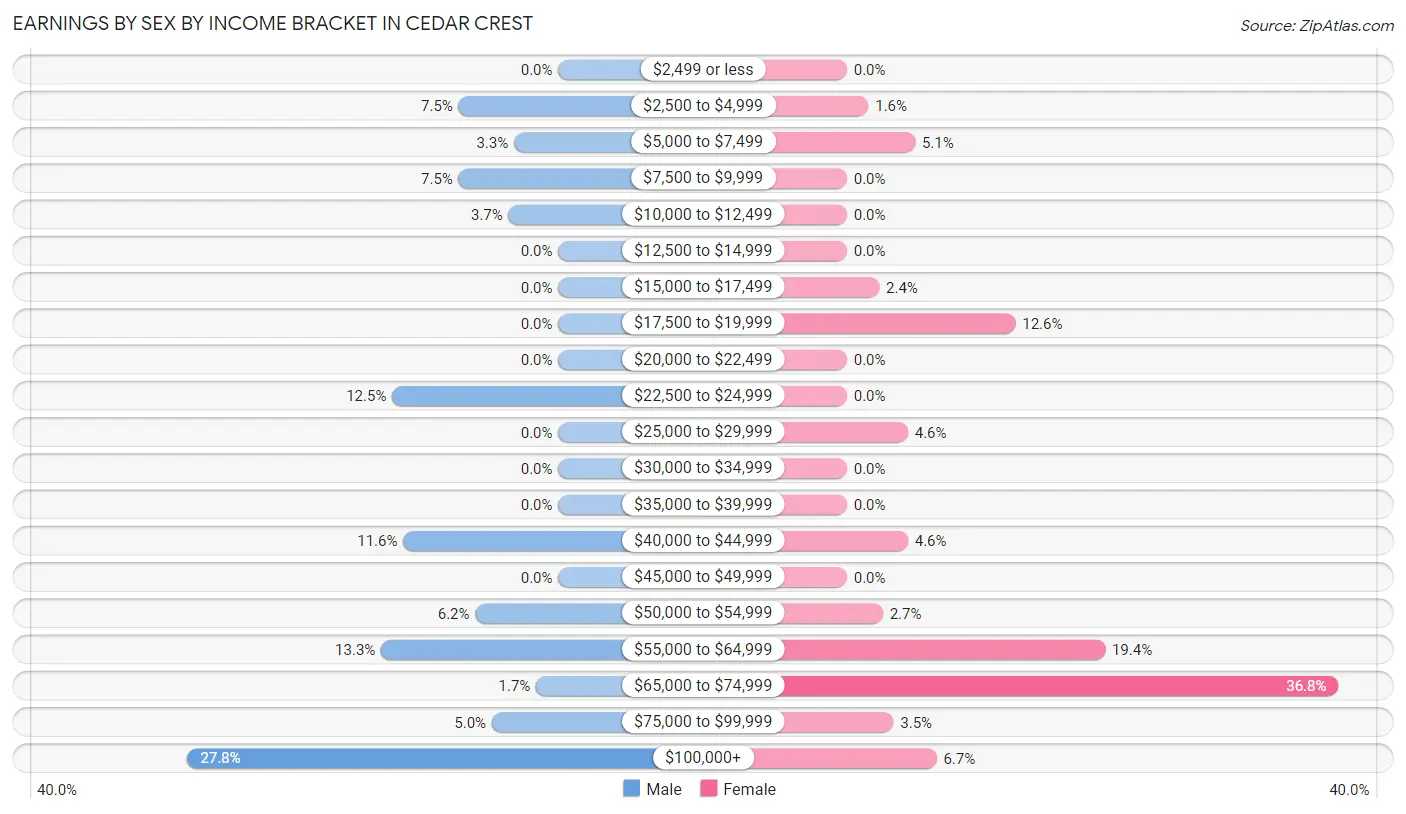
Earnings by Sex by Income Bracket in Cedar Crest
The most common earnings brackets in Cedar Crest are $100,000+ for men (67 | 27.8%) and $65,000 to $74,999 for women (137 | 36.8%).
| Income | Male | Female |
| $2,499 or less | 0 (0.0%) | 0 (0.0%) |
| $2,500 to $4,999 | 18 (7.5%) | 6 (1.6%) |
| $5,000 to $7,499 | 8 (3.3%) | 19 (5.1%) |
| $7,500 to $9,999 | 18 (7.5%) | 0 (0.0%) |
| $10,000 to $12,499 | 9 (3.7%) | 0 (0.0%) |
| $12,500 to $14,999 | 0 (0.0%) | 0 (0.0%) |
| $15,000 to $17,499 | 0 (0.0%) | 9 (2.4%) |
| $17,500 to $19,999 | 0 (0.0%) | 47 (12.6%) |
| $20,000 to $22,499 | 0 (0.0%) | 0 (0.0%) |
| $22,500 to $24,999 | 30 (12.4%) | 0 (0.0%) |
| $25,000 to $29,999 | 0 (0.0%) | 17 (4.6%) |
| $30,000 to $34,999 | 0 (0.0%) | 0 (0.0%) |
| $35,000 to $39,999 | 0 (0.0%) | 0 (0.0%) |
| $40,000 to $44,999 | 28 (11.6%) | 17 (4.6%) |
| $45,000 to $49,999 | 0 (0.0%) | 0 (0.0%) |
| $50,000 to $54,999 | 15 (6.2%) | 10 (2.7%) |
| $55,000 to $64,999 | 32 (13.3%) | 72 (19.4%) |
| $65,000 to $74,999 | 4 (1.7%) | 137 (36.8%) |
| $75,000 to $99,999 | 12 (5.0%) | 13 (3.5%) |
| $100,000+ | 67 (27.8%) | 25 (6.7%) |
| Total | 241 (100.0%) | 372 (100.0%) |
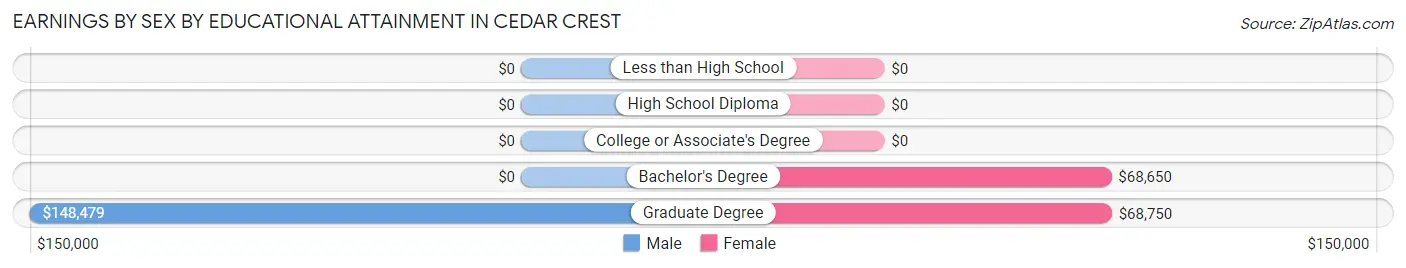
Earnings by Sex by Educational Attainment in Cedar Crest
Average earnings in Cedar Crest are $58,229 for men and $67,573 for women, a difference of 13.8%. Men with an educational attainment of graduate degree enjoy the highest average annual earnings of $148,479, while those with graduate degree education earn the least with $148,479. Women with an educational attainment of graduate degree earn the most with the average annual earnings of $68,750, while those with bachelor's degree education have the smallest earnings of $68,650.
| Educational Attainment | Male Income | Female Income |
| Less than High School | - | - |
| High School Diploma | - | - |
| College or Associate's Degree | - | - |
| Bachelor's Degree | - | - |
| Graduate Degree | $148,479 | $68,750 |
| Total | $58,229 | $67,573 |
Family Income in Cedar Crest
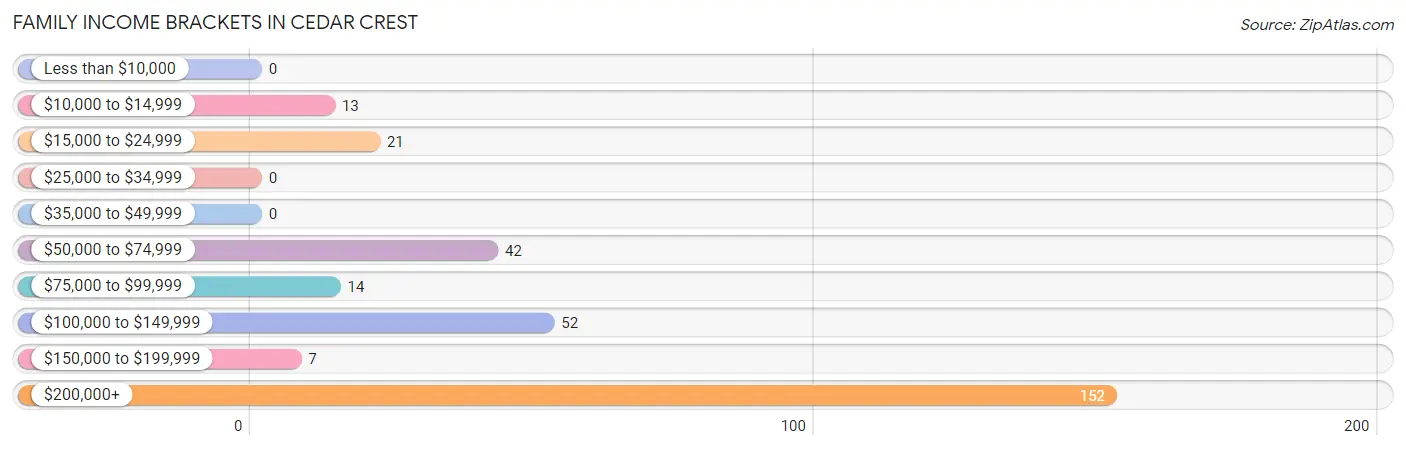
Family Income Brackets in Cedar Crest
According to the Cedar Crest family income data, there are 152 families falling into the $200,000+ income range, which is the most common income bracket and makes up 50.5% of all families.
| Income Bracket | # Families | % Families |
| Less than $10,000 | 0 | 0.0% |
| $10,000 to $14,999 | 13 | 4.3% |
| $15,000 to $24,999 | 21 | 7.0% |
| $25,000 to $34,999 | 0 | 0.0% |
| $35,000 to $49,999 | 0 | 0.0% |
| $50,000 to $74,999 | 42 | 14.0% |
| $75,000 to $99,999 | 14 | 4.7% |
| $100,000 to $149,999 | 52 | 17.3% |
| $150,000 to $199,999 | 7 | 2.3% |
| $200,000+ | 152 | 50.5% |
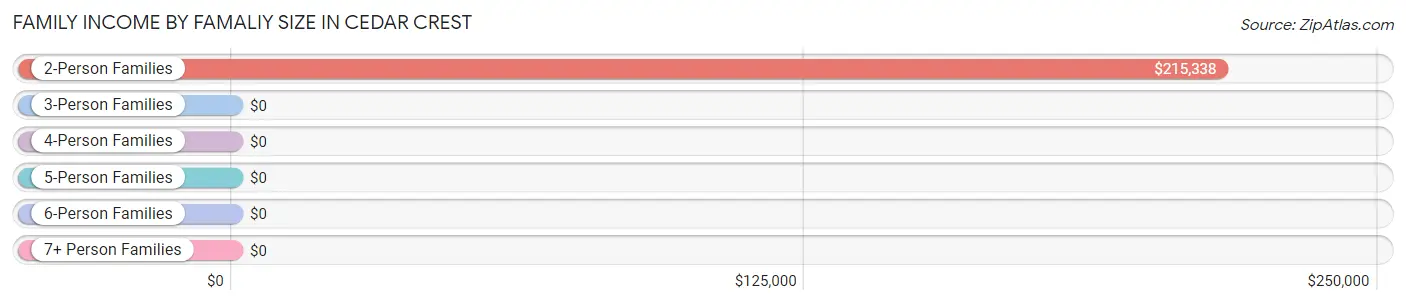
Family Income by Famaliy Size in Cedar Crest
2-person families (267 | 88.7%) account for the highest median family income in Cedar Crest with $215,338 per family, while 2-person families (267 | 88.7%) have the highest median income of $107,669 per family member.
| Income Bracket | # Families | Median Income |
| 2-Person Families | 267 (88.7%) | $215,338 |
| 3-Person Families | 13 (4.3%) | $0 |
| 4-Person Families | 4 (1.3%) | $0 |
| 5-Person Families | 0 (0.0%) | $0 |
| 6-Person Families | 17 (5.7%) | $0 |
| 7+ Person Families | 0 (0.0%) | $0 |
| Total | 301 (100.0%) | $215,027 |
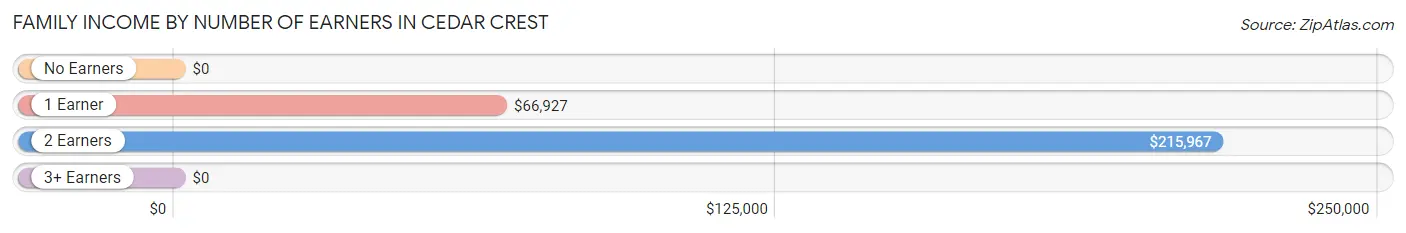
Family Income by Number of Earners in Cedar Crest
| Number of Earners | # Families | Median Income |
| No Earners | 35 (11.6%) | $0 |
| 1 Earner | 81 (26.9%) | $66,927 |
| 2 Earners | 168 (55.8%) | $215,967 |
| 3+ Earners | 17 (5.7%) | $0 |
| Total | 301 (100.0%) | $215,027 |
Household Income in Cedar Crest
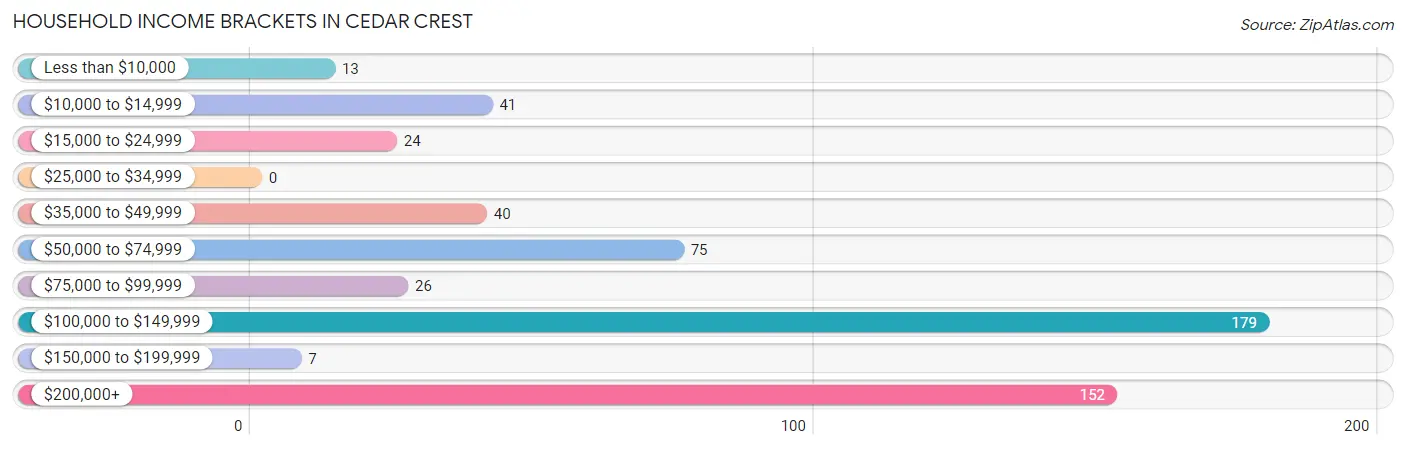
Household Income Brackets in Cedar Crest
With 179 households falling in the category, the $100,000 to $149,999 income range is the most frequent in Cedar Crest, accounting for 32.1% of all households.
| Income Bracket | # Households | % Households |
| Less than $10,000 | 13 | 2.3% |
| $10,000 to $14,999 | 41 | 7.4% |
| $15,000 to $24,999 | 24 | 4.3% |
| $25,000 to $34,999 | 0 | 0.0% |
| $35,000 to $49,999 | 40 | 7.2% |
| $50,000 to $74,999 | 75 | 13.5% |
| $75,000 to $99,999 | 26 | 4.7% |
| $100,000 to $149,999 | 179 | 32.1% |
| $150,000 to $199,999 | 7 | 1.3% |
| $200,000+ | 152 | 27.3% |
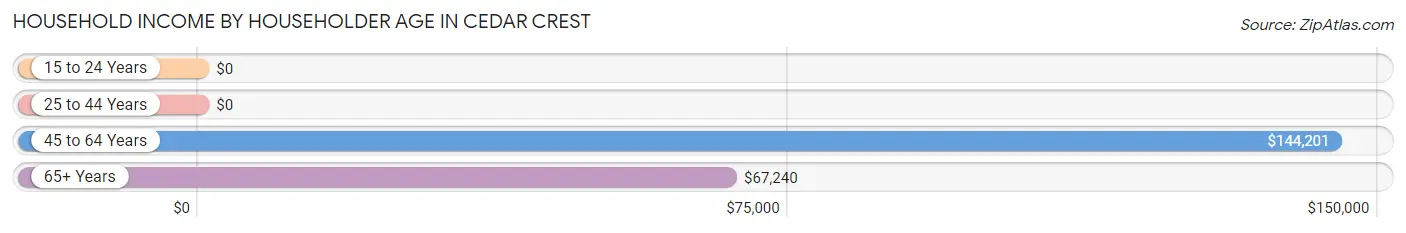
Household Income by Householder Age in Cedar Crest
The median household income in Cedar Crest is $106,550, with the highest median household income of $144,201 found in the 45 to 64 years age bracket for the primary householder. A total of 358 households (64.3%) fall into this category.
| Income Bracket | # Households | Median Income |
| 15 to 24 Years | 0 (0.0%) | $0 |
| 25 to 44 Years | 38 (6.8%) | $0 |
| 45 to 64 Years | 358 (64.3%) | $144,201 |
| 65+ Years | 161 (28.9%) | $67,240 |
| Total | 557 (100.0%) | $106,550 |
Poverty in Cedar Crest
Income Below Poverty by Sex and Age in Cedar Crest
With 9.5% poverty level for males and 12.9% for females among the residents of Cedar Crest, 65 to 74 year old males and 15 year old females are the most vulnerable to poverty, with 19 males (25.3%) and 18 females (100.0%) in their respective age groups living below the poverty level.
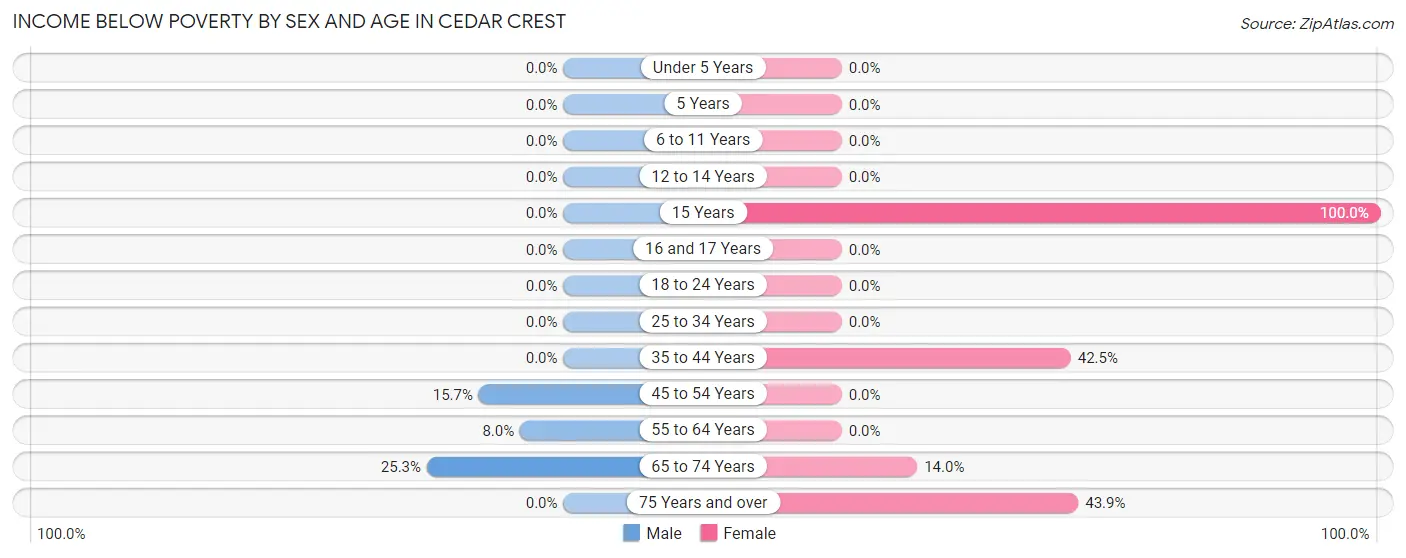
| Age Bracket | Male | Female |
| Under 5 Years | 0 (0.0%) | 0 (0.0%) |
| 5 Years | 0 (0.0%) | 0 (0.0%) |
| 6 to 11 Years | 0 (0.0%) | 0 (0.0%) |
| 12 to 14 Years | 0 (0.0%) | 0 (0.0%) |
| 15 Years | 0 (0.0%) | 18 (100.0%) |
| 16 and 17 Years | 0 (0.0%) | 0 (0.0%) |
| 18 to 24 Years | 0 (0.0%) | 0 (0.0%) |
| 25 to 34 Years | 0 (0.0%) | 0 (0.0%) |
| 35 to 44 Years | 0 (0.0%) | 17 (42.5%) |
| 45 to 54 Years | 8 (15.7%) | 0 (0.0%) |
| 55 to 64 Years | 9 (8.0%) | 0 (0.0%) |
| 65 to 74 Years | 19 (25.3%) | 14 (14.0%) |
| 75 Years and over | 0 (0.0%) | 18 (43.9%) |
| Total | 36 (9.5%) | 67 (12.9%) |
Income Above Poverty by Sex and Age in Cedar Crest
According to the poverty statistics in Cedar Crest, males aged 6 to 11 years and females aged 16 and 17 years are the age groups that are most secure financially, with 100.0% of males and 100.0% of females in these age groups living above the poverty line.
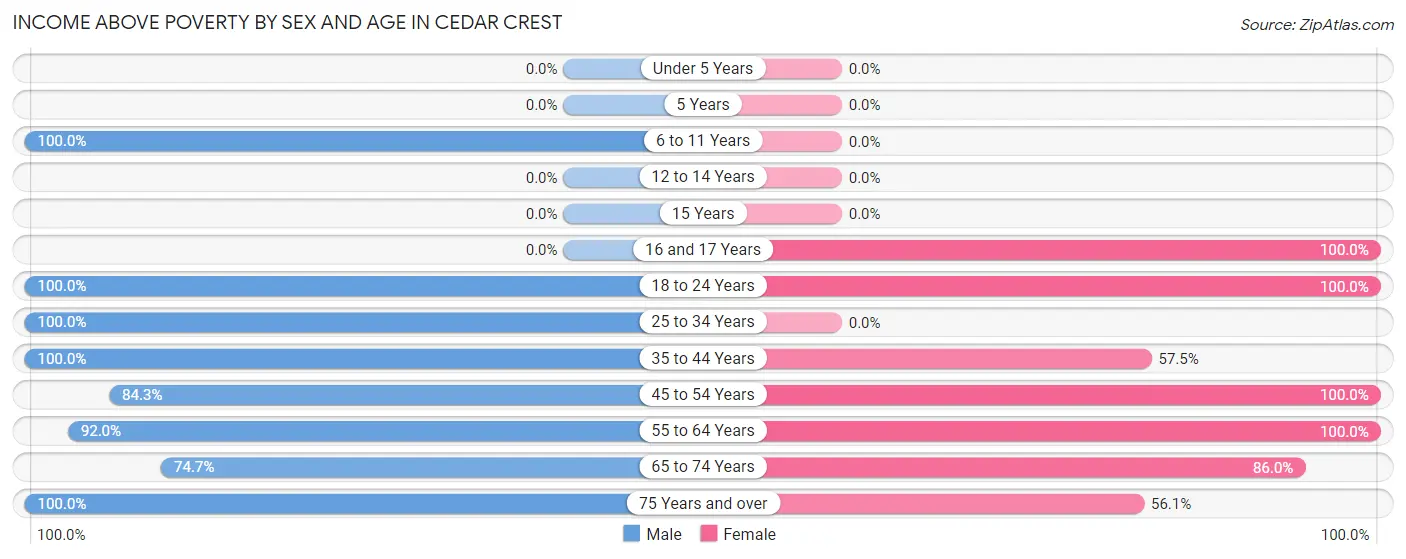
| Age Bracket | Male | Female |
| Under 5 Years | 0 (0.0%) | 0 (0.0%) |
| 5 Years | 0 (0.0%) | 0 (0.0%) |
| 6 to 11 Years | 9 (100.0%) | 0 (0.0%) |
| 12 to 14 Years | 0 (0.0%) | 0 (0.0%) |
| 15 Years | 0 (0.0%) | 0 (0.0%) |
| 16 and 17 Years | 0 (0.0%) | 16 (100.0%) |
| 18 to 24 Years | 18 (100.0%) | 30 (100.0%) |
| 25 to 34 Years | 30 (100.0%) | 0 (0.0%) |
| 35 to 44 Years | 4 (100.0%) | 23 (57.5%) |
| 45 to 54 Years | 43 (84.3%) | 72 (100.0%) |
| 55 to 64 Years | 103 (92.0%) | 204 (100.0%) |
| 65 to 74 Years | 56 (74.7%) | 86 (86.0%) |
| 75 Years and over | 81 (100.0%) | 23 (56.1%) |
| Total | 344 (90.5%) | 454 (87.1%) |
Income Below Poverty Among Married-Couple Families in Cedar Crest
The poverty statistics for married-couple families in Cedar Crest show that 5.0% or 13 of the total 260 families live below the poverty line. Families with no children have the highest poverty rate of 5.4%, comprising of 13 families. On the other hand, families with 1 or 2 children have the lowest poverty rate of 0.0%, which includes 0 families.
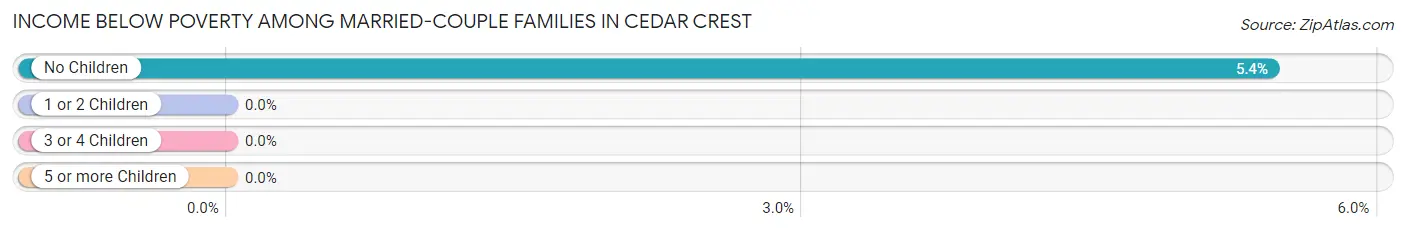
| Children | Above Poverty | Below Poverty |
| No Children | 226 (94.6%) | 13 (5.4%) |
| 1 or 2 Children | 21 (100.0%) | 0 (0.0%) |
| 3 or 4 Children | 0 (0.0%) | 0 (0.0%) |
| 5 or more Children | 0 (0.0%) | 0 (0.0%) |
| Total | 247 (95.0%) | 13 (5.0%) |
Income Below Poverty Among Single-Parent Households in Cedar Crest
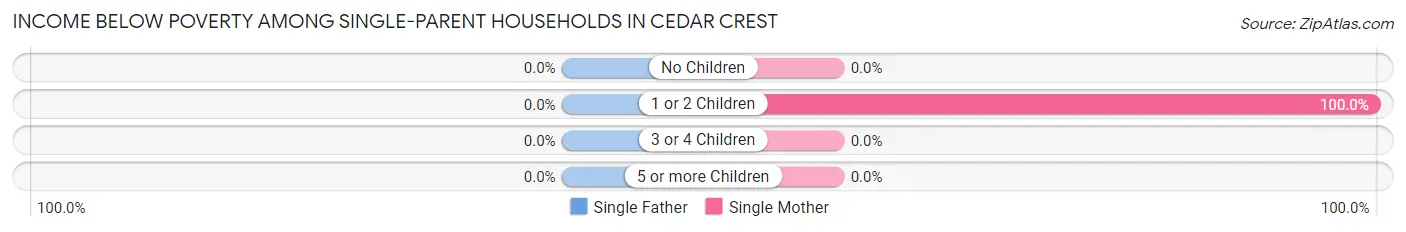
| Children | Single Father | Single Mother |
| No Children | 0 (0.0%) | 0 (0.0%) |
| 1 or 2 Children | 0 (0.0%) | 17 (100.0%) |
| 3 or 4 Children | 0 (0.0%) | 0 (0.0%) |
| 5 or more Children | 0 (0.0%) | 0 (0.0%) |
| Total | 0 (0.0%) | 17 (100.0%) |
Income Below Poverty Among Married-Couple vs Single-Parent Households in Cedar Crest
The poverty data for Cedar Crest shows that 13 of the married-couple family households (5.0%) and 17 of the single-parent households (41.5%) are living below the poverty level. Within the married-couple family households, those with no children have the highest poverty rate, with 13 households (5.4%) falling below the poverty line. Among the single-parent households, those with 1 or 2 children have the highest poverty rate, with 17 household (100.0%) living below poverty.
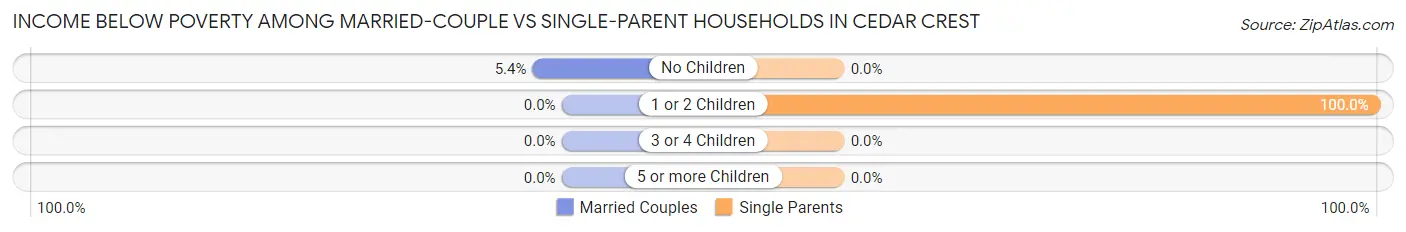
| Children | Married-Couple Families | Single-Parent Households |
| No Children | 13 (5.4%) | 0 (0.0%) |
| 1 or 2 Children | 0 (0.0%) | 17 (100.0%) |
| 3 or 4 Children | 0 (0.0%) | 0 (0.0%) |
| 5 or more Children | 0 (0.0%) | 0 (0.0%) |
| Total | 13 (5.0%) | 17 (41.5%) |
Race in Cedar Crest
The most populous races in Cedar Crest are White / Caucasian (800 | 87.1%), Hispanic or Latino (211 | 23.0%), and Two or more Races (68 | 7.4%).
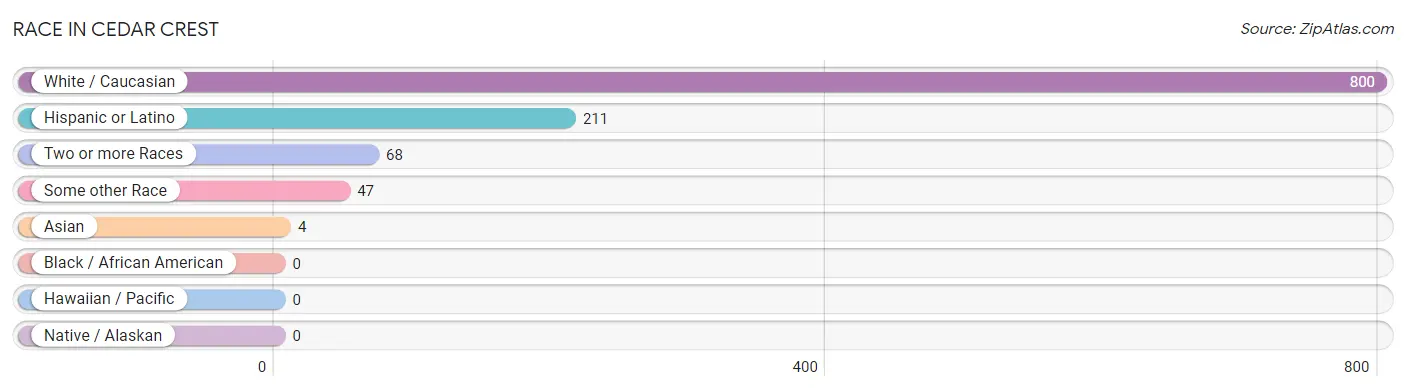
| Race | # Population | % Population |
| Asian | 4 | 0.4% |
| Black / African American | 0 | 0.0% |
| Hawaiian / Pacific | 0 | 0.0% |
| Hispanic or Latino | 211 | 23.0% |
| Native / Alaskan | 0 | 0.0% |
| White / Caucasian | 800 | 87.1% |
| Two or more Races | 68 | 7.4% |
| Some other Race | 47 | 5.1% |
| Total | 919 | 100.0% |
Ancestry in Cedar Crest
The most populous ancestries reported in Cedar Crest are English (218 | 23.7%), German (160 | 17.4%), Irish (138 | 15.0%), Spanish (73 | 7.9%), and Polish (59 | 6.4%), together accounting for 70.5% of all Cedar Crest residents.
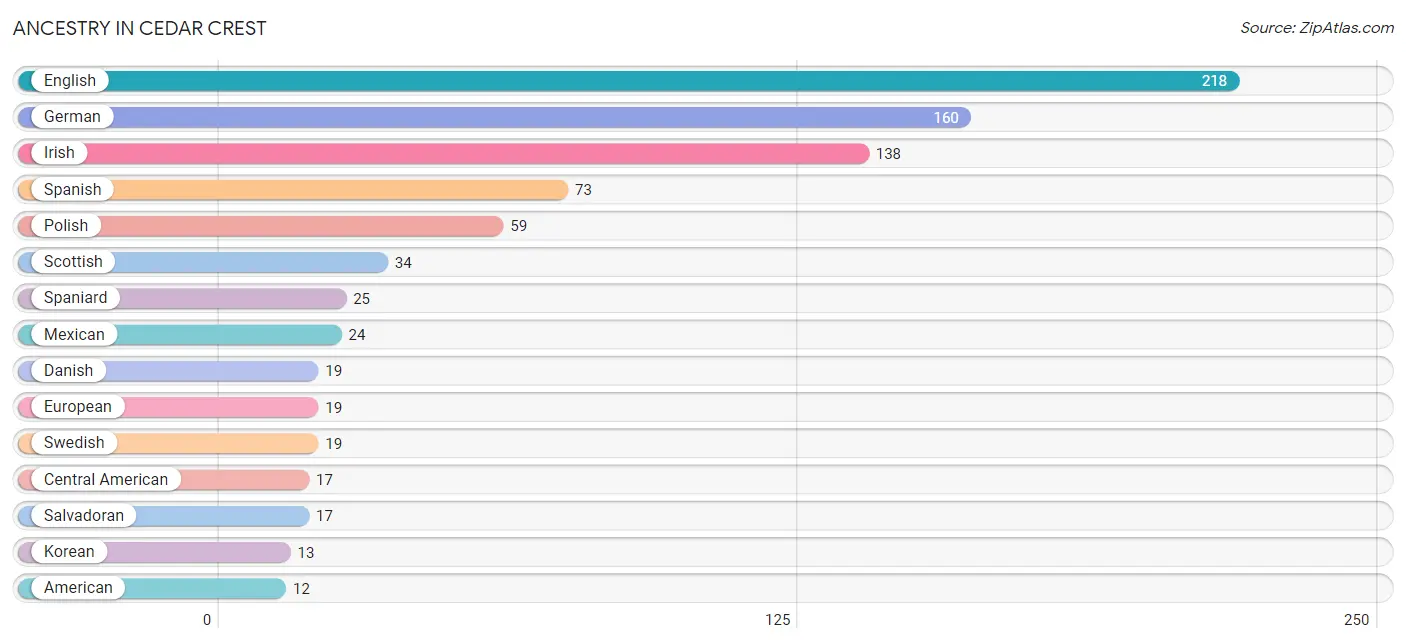
| Ancestry | # Population | % Population |
| American | 12 | 1.3% |
| Austrian | 3 | 0.3% |
| Central American | 17 | 1.8% |
| Danish | 19 | 2.1% |
| English | 218 | 23.7% |
| European | 19 | 2.1% |
| Finnish | 10 | 1.1% |
| German | 160 | 17.4% |
| Irish | 138 | 15.0% |
| Italian | 12 | 1.3% |
| Korean | 13 | 1.4% |
| Mexican | 24 | 2.6% |
| Norwegian | 5 | 0.5% |
| Polish | 59 | 6.4% |
| Russian | 9 | 1.0% |
| Salvadoran | 17 | 1.8% |
| Scotch-Irish | 6 | 0.6% |
| Scottish | 34 | 3.7% |
| Spaniard | 25 | 2.7% |
| Spanish | 73 | 7.9% |
| Swedish | 19 | 2.1% | View All 21 Rows |
Immigrants in Cedar Crest
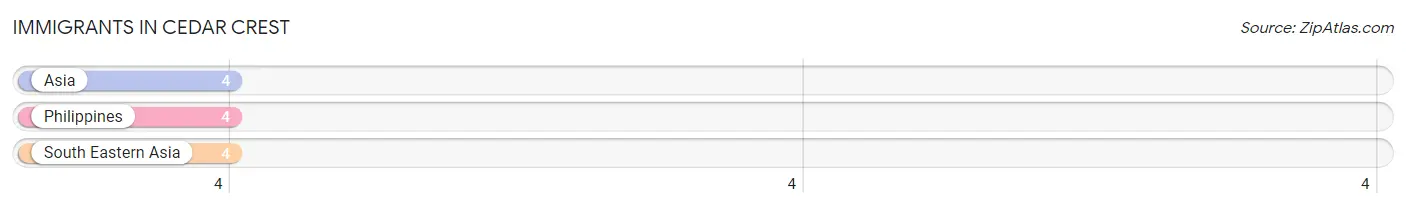
The most numerous immigrant groups reported in Cedar Crest came from Asia (4 | 0.4%), Philippines (4 | 0.4%), and South Eastern Asia (4 | 0.4%), together accounting for 1.3% of all Cedar Crest residents.
| Immigration Origin | # Population | % Population |
| Asia | 4 | 0.4% |
| Philippines | 4 | 0.4% |
| South Eastern Asia | 4 | 0.4% | View All 3 Rows |
Sex and Age in Cedar Crest
Sex and Age in Cedar Crest
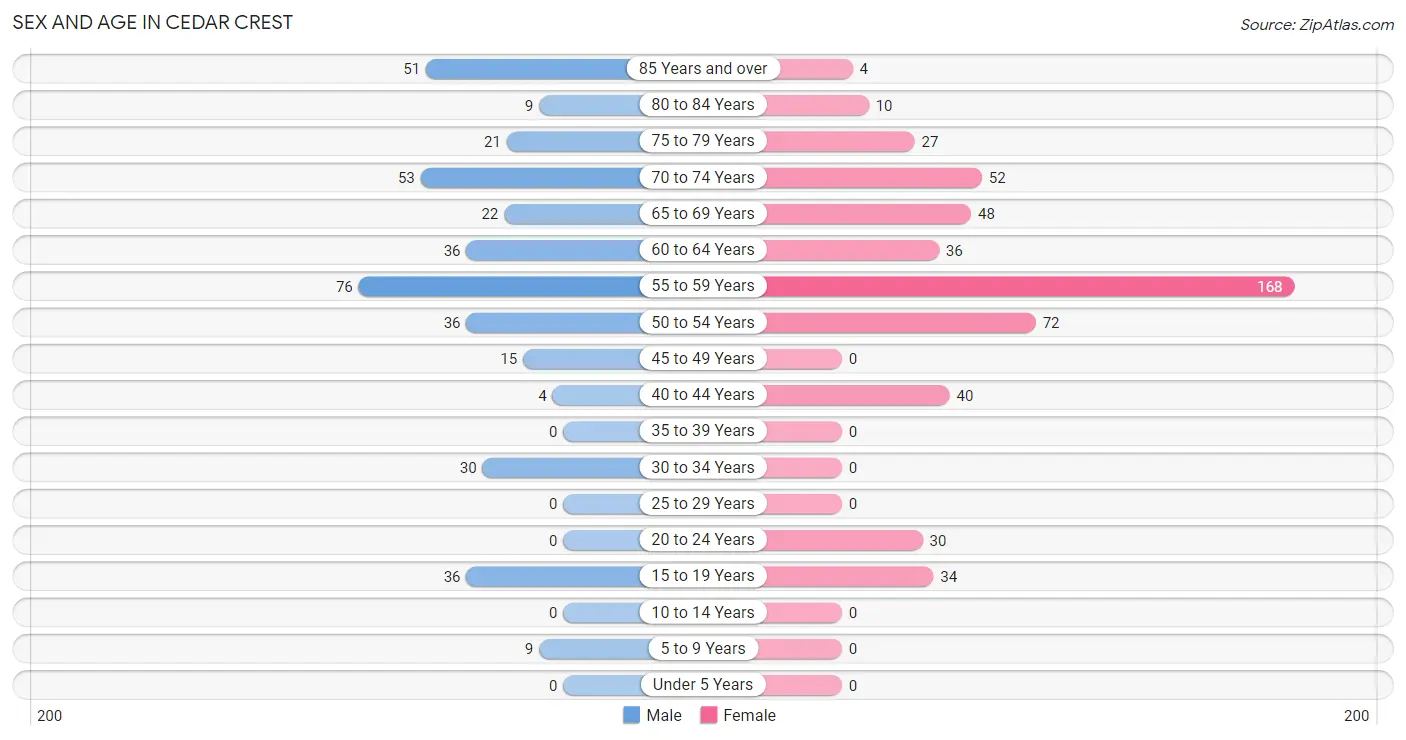
The most populous age groups in Cedar Crest are 55 to 59 Years (76 | 19.1%) for men and 55 to 59 Years (168 | 32.3%) for women.
| Age Bracket | Male | Female |
| Under 5 Years | 0 (0.0%) | 0 (0.0%) |
| 5 to 9 Years | 9 (2.3%) | 0 (0.0%) |
| 10 to 14 Years | 0 (0.0%) | 0 (0.0%) |
| 15 to 19 Years | 36 (9.0%) | 34 (6.5%) |
| 20 to 24 Years | 0 (0.0%) | 30 (5.8%) |
| 25 to 29 Years | 0 (0.0%) | 0 (0.0%) |
| 30 to 34 Years | 30 (7.5%) | 0 (0.0%) |
| 35 to 39 Years | 0 (0.0%) | 0 (0.0%) |
| 40 to 44 Years | 4 (1.0%) | 40 (7.7%) |
| 45 to 49 Years | 15 (3.8%) | 0 (0.0%) |
| 50 to 54 Years | 36 (9.0%) | 72 (13.8%) |
| 55 to 59 Years | 76 (19.1%) | 168 (32.3%) |
| 60 to 64 Years | 36 (9.0%) | 36 (6.9%) |
| 65 to 69 Years | 22 (5.5%) | 48 (9.2%) |
| 70 to 74 Years | 53 (13.3%) | 52 (10.0%) |
| 75 to 79 Years | 21 (5.3%) | 27 (5.2%) |
| 80 to 84 Years | 9 (2.3%) | 10 (1.9%) |
| 85 Years and over | 51 (12.8%) | 4 (0.8%) |
| Total | 398 (100.0%) | 521 (100.0%) |
Families and Households in Cedar Crest
Median Family Size in Cedar Crest
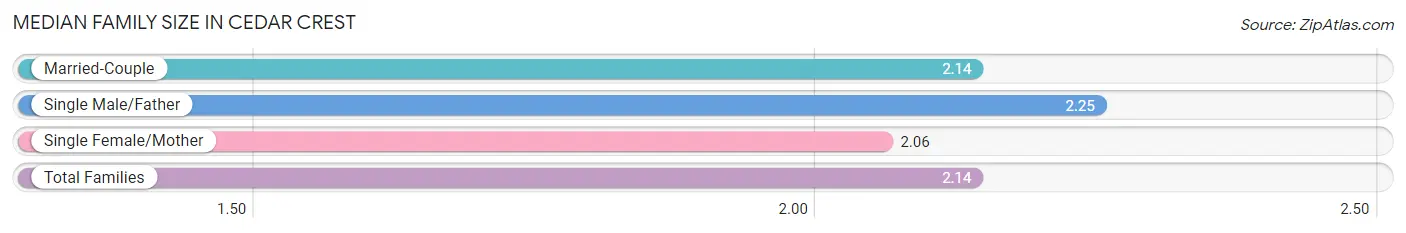
The median family size in Cedar Crest is 2.14 persons per family, with single male/father families (24 | 8.0%) accounting for the largest median family size of 2.25 persons per family. On the other hand, single female/mother families (17 | 5.7%) represent the smallest median family size with 2.06 persons per family.
| Family Type | # Families | Family Size |
| Married-Couple | 260 (86.4%) | 2.14 |
| Single Male/Father | 24 (8.0%) | 2.25 |
| Single Female/Mother | 17 (5.7%) | 2.06 |
| Total Families | 301 (100.0%) | 2.14 |
Median Household Size in Cedar Crest
| Household Type | # Households | Household Size |
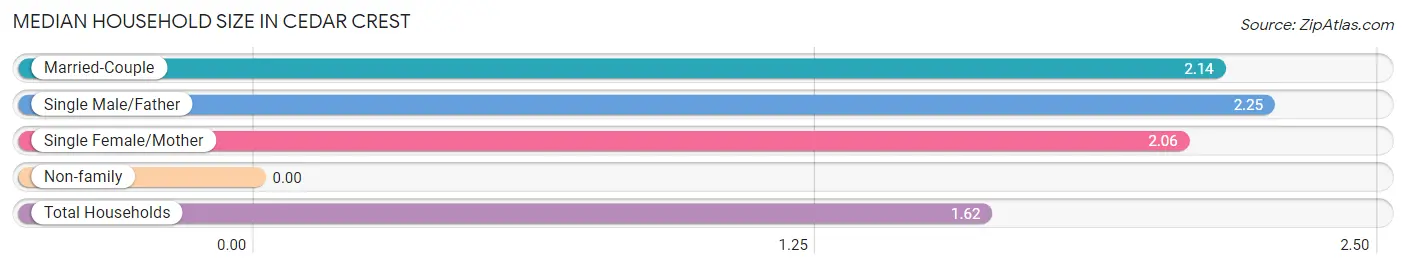
| Married-Couple | 260 (46.7%) | 2.14 |
| Single Male/Father | 24 (4.3%) | 2.25 |
| Single Female/Mother | 17 (3.0%) | 2.06 |
| Non-family | 256 (46.0%) | - |
| Total Households | 557 (100.0%) | 1.62 |
Household Size by Marriage Status in Cedar Crest
Out of a total of 557 households in Cedar Crest, 301 (54.0%) are family households, while 256 (46.0%) are nonfamily households. The most numerous type of family households are 2-person households, comprising 267, and the most common type of nonfamily households are 1-person households, comprising 256.
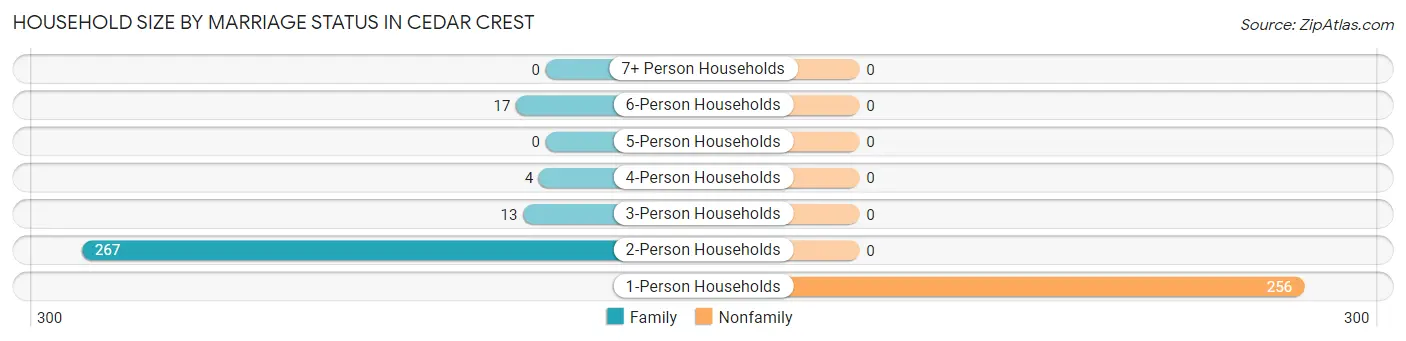
| Household Size | Family Households | Nonfamily Households |
| 1-Person Households | - | 256 (46.0%) |
| 2-Person Households | 267 (47.9%) | 0 (0.0%) |
| 3-Person Households | 13 (2.3%) | 0 (0.0%) |
| 4-Person Households | 4 (0.7%) | 0 (0.0%) |
| 5-Person Households | 0 (0.0%) | 0 (0.0%) |
| 6-Person Households | 17 (3.0%) | 0 (0.0%) |
| 7+ Person Households | 0 (0.0%) | 0 (0.0%) |
| Total | 301 (54.0%) | 256 (46.0%) |
Female Fertility in Cedar Crest
Fertility by Age in Cedar Crest
Average fertility rate in Cedar Crest is 58.0 births per 1,000 women. Women in the age bracket of 35 to 50 years have the highest fertility rate with 150.0 births per 1,000 women. Women in the age bracket of 35 to 50 years acount for 100.0% of all women with births.
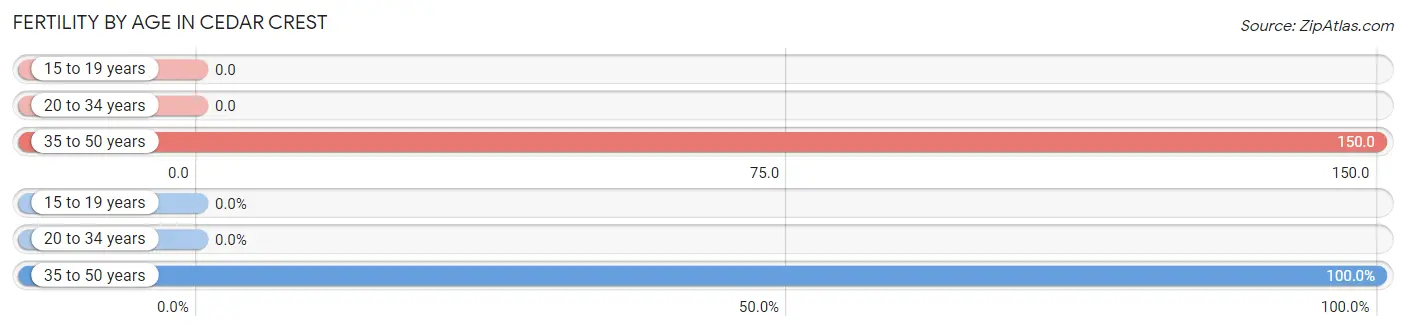
| Age Bracket | Women with Births | Births / 1,000 Women |
| 15 to 19 years | 0 (0.0%) | 0.0 |
| 20 to 34 years | 0 (0.0%) | 0.0 |
| 35 to 50 years | 6 (100.0%) | 150.0 |
| Total | 6 (100.0%) | 58.0 |
Fertility by Age by Marriage Status in Cedar Crest
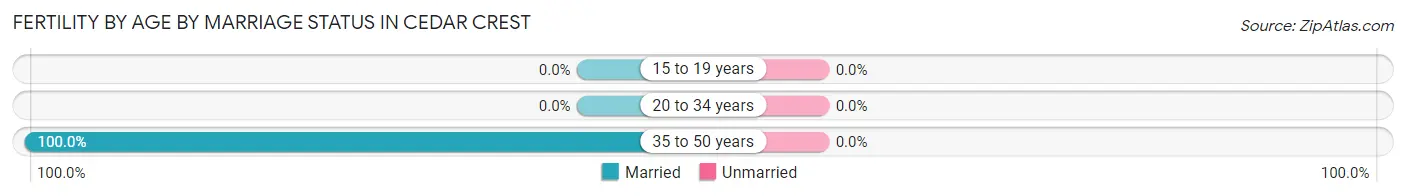
| Age Bracket | Married | Unmarried |
| 15 to 19 years | 0 (0.0%) | 0 (0.0%) |
| 20 to 34 years | 0 (0.0%) | 0 (0.0%) |
| 35 to 50 years | 6 (100.0%) | 0 (0.0%) |
| Total | 6 (100.0%) | 0 (0.0%) |
Fertility by Education in Cedar Crest
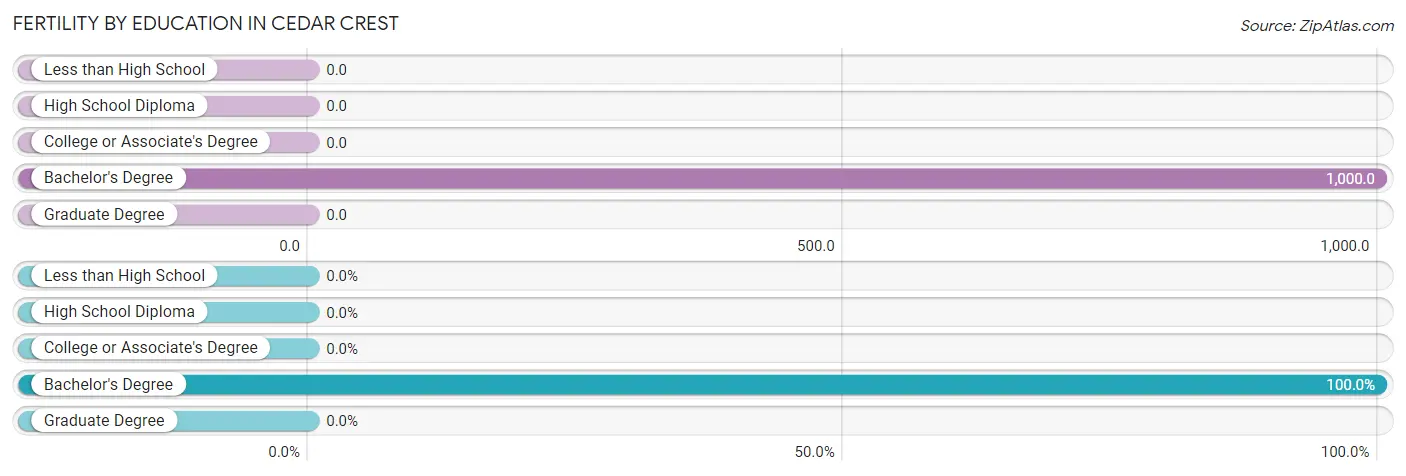
| Educational Attainment | Women with Births | Births / 1,000 Women |
| Less than High School | 0 (0.0%) | 0.0 |
| High School Diploma | 0 (0.0%) | 0.0 |
| College or Associate's Degree | 0 (0.0%) | 0.0 |
| Bachelor's Degree | 6 (100.0%) | 1,000.0 |
| Graduate Degree | 0 (0.0%) | 0.0 |
| Total | 6 (100.0%) | 58.0 |
Fertility by Education by Marriage Status in Cedar Crest
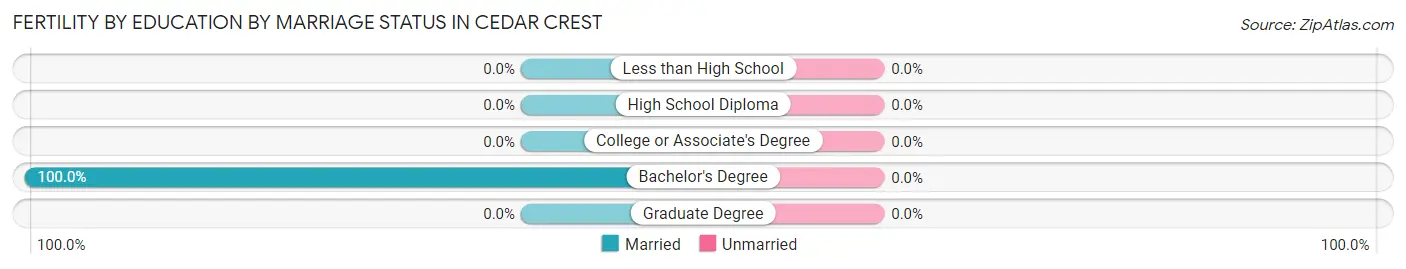
| Educational Attainment | Married | Unmarried |
| Less than High School | 0 (0.0%) | 0 (0.0%) |
| High School Diploma | 0 (0.0%) | 0 (0.0%) |
| College or Associate's Degree | 0 (0.0%) | 0 (0.0%) |
| Bachelor's Degree | 6 (100.0%) | 0 (0.0%) |
| Graduate Degree | 0 (0.0%) | 0 (0.0%) |
| Total | 6 (100.0%) | 0 (0.0%) |
Employment Characteristics in Cedar Crest
Employment by Class of Employer in Cedar Crest
Among the 422 employed individuals in Cedar Crest, private company employees (191 | 45.3%), self-employed (incorporated) (94 | 22.3%), and not-for-profit organizations (74 | 17.5%) make up the most common classes of employment.
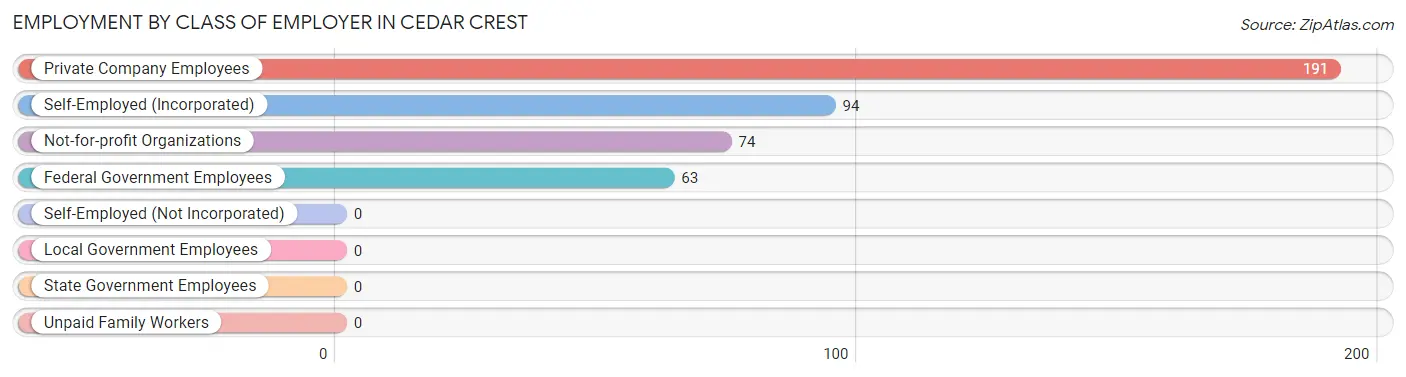
| Employer Class | # Employees | % Employees |
| Private Company Employees | 191 | 45.3% |
| Self-Employed (Incorporated) | 94 | 22.3% |
| Self-Employed (Not Incorporated) | 0 | 0.0% |
| Not-for-profit Organizations | 74 | 17.5% |
| Local Government Employees | 0 | 0.0% |
| State Government Employees | 0 | 0.0% |
| Federal Government Employees | 63 | 14.9% |
| Unpaid Family Workers | 0 | 0.0% |
| Total | 422 | 100.0% |
Employment Status by Age in Cedar Crest
According to the labor force statistics for Cedar Crest, out of the total population over 16 years of age (892), 50.7% or 452 individuals are in the labor force, with 6.6% or 30 of them unemployed. The age group with the highest labor force participation rate is 20 to 24 years, with 100.0% or 30 individuals in the labor force. Within the labor force, the 16 to 19 years age range has the highest percentage of unemployed individuals, with 47.1% or 16 of them being unemployed.
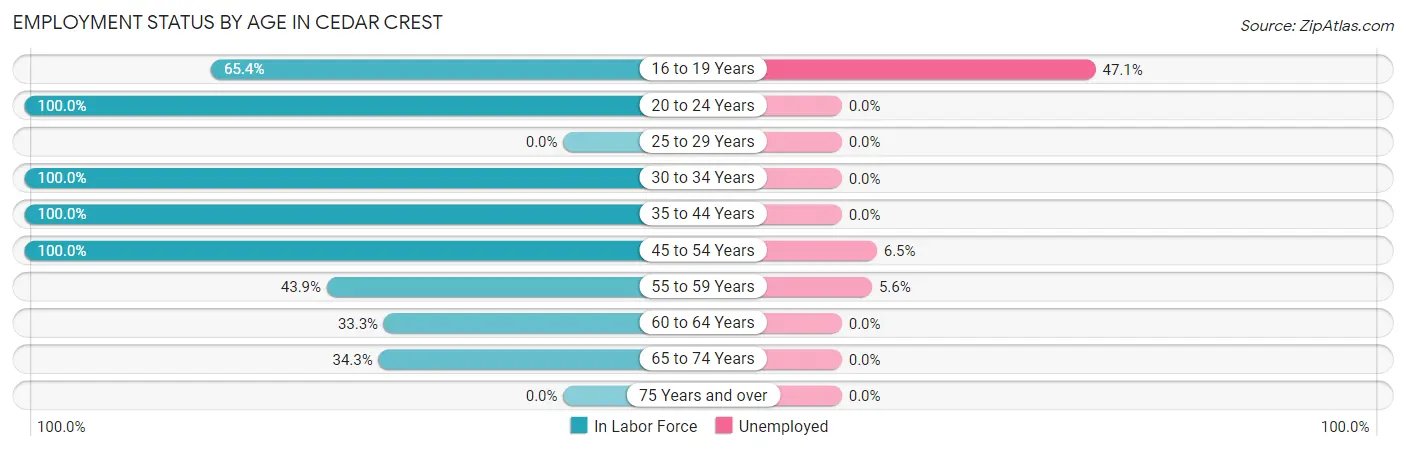
| Age Bracket | In Labor Force | Unemployed |
| 16 to 19 Years | 34 (65.4%) | 16 (47.1%) |
| 20 to 24 Years | 30 (100.0%) | 0 (0.0%) |
| 25 to 29 Years | 0 (0.0%) | 0 (0.0%) |
| 30 to 34 Years | 30 (100.0%) | 0 (0.0%) |
| 35 to 44 Years | 44 (100.0%) | 0 (0.0%) |
| 45 to 54 Years | 123 (100.0%) | 8 (6.5%) |
| 55 to 59 Years | 107 (43.9%) | 6 (5.6%) |
| 60 to 64 Years | 24 (33.3%) | 0 (0.0%) |
| 65 to 74 Years | 60 (34.3%) | 0 (0.0%) |
| 75 Years and over | 0 (0.0%) | 0 (0.0%) |
| Total | 452 (50.7%) | 30 (6.6%) |
Employment Status by Educational Attainment in Cedar Crest
According to labor force statistics for Cedar Crest, 63.9% of individuals (328) out of the total population between 25 and 64 years of age (513) are in the labor force, with 4.3% or 14 of them being unemployed. The group with the highest labor force participation rate are those with the educational attainment of college / associate degree, with 100.0% or 142 individuals in the labor force. Within the labor force, individuals with high school diploma education have the highest percentage of unemployment, with 11.9% or 8 of them being unemployed.
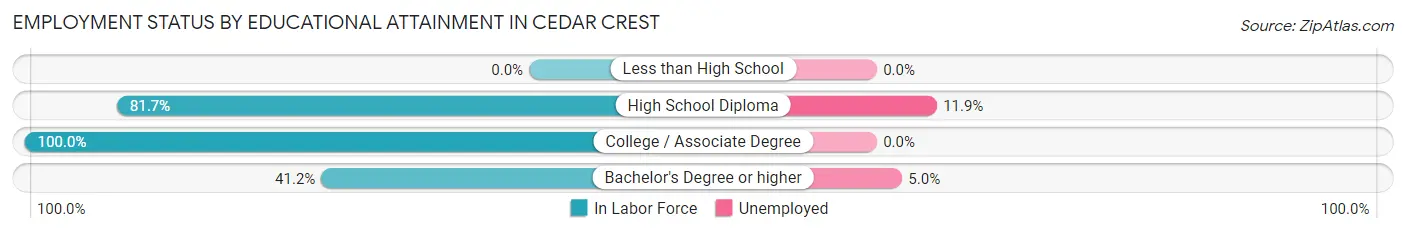
| Educational Attainment | In Labor Force | Unemployed |
| Less than High School | 0 (0.0%) | 0 (0.0%) |
| High School Diploma | 67 (81.7%) | 10 (11.9%) |
| College / Associate Degree | 142 (100.0%) | 0 (0.0%) |
| Bachelor's Degree or higher | 119 (41.2%) | 14 (5.0%) |
| Total | 328 (63.9%) | 22 (4.3%) |
Employment Occupations by Sex in Cedar Crest
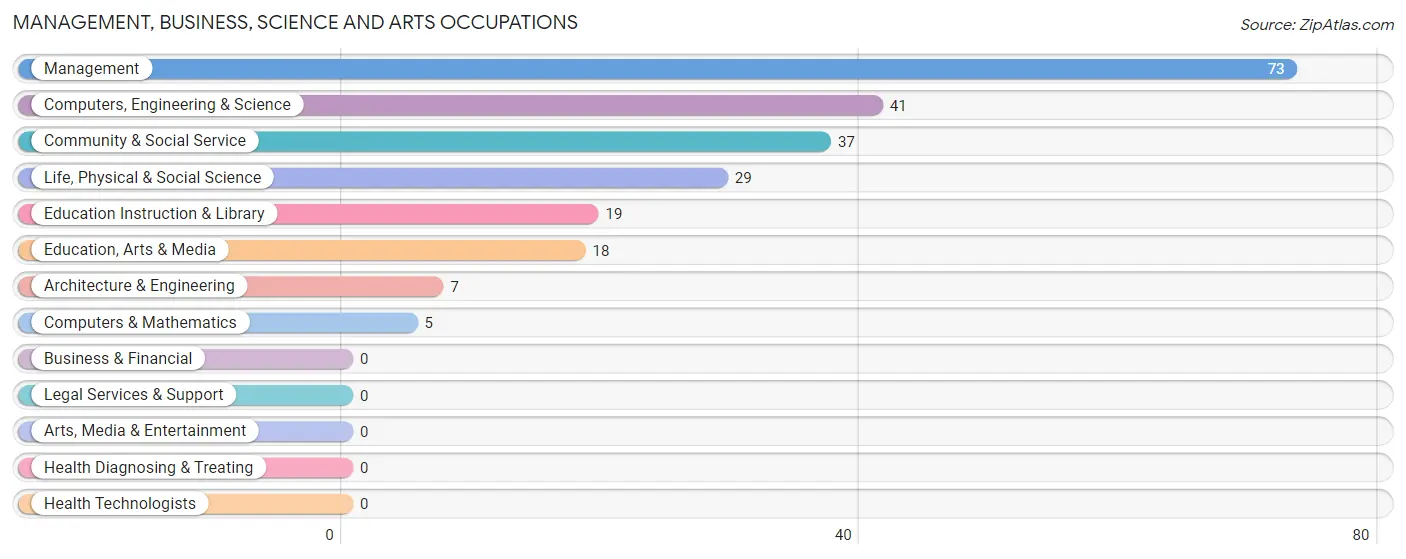
Management, Business, Science and Arts Occupations
The most common Management, Business, Science and Arts occupations in Cedar Crest are Management (73 | 17.3%), Computers, Engineering & Science (41 | 9.7%), Community & Social Service (37 | 8.8%), Life, Physical & Social Science (29 | 6.9%), and Education Instruction & Library (19 | 4.5%).
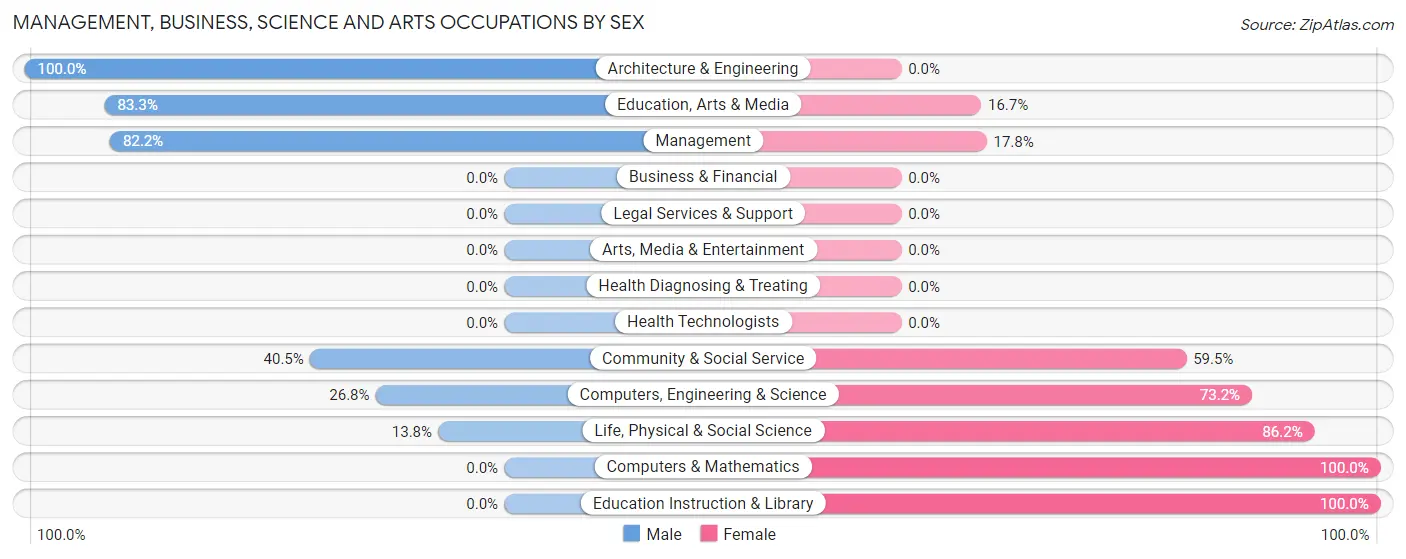
Management, Business, Science and Arts Occupations by Sex
Within the Management, Business, Science and Arts occupations in Cedar Crest, the most male-oriented occupations are Architecture & Engineering (100.0%), Education, Arts & Media (83.3%), and Management (82.2%), while the most female-oriented occupations are Computers & Mathematics (100.0%), Education Instruction & Library (100.0%), and Life, Physical & Social Science (86.2%).
| Occupation | Male | Female |
| Management | 60 (82.2%) | 13 (17.8%) |
| Business & Financial | 0 (0.0%) | 0 (0.0%) |
| Computers, Engineering & Science | 11 (26.8%) | 30 (73.2%) |
| Computers & Mathematics | 0 (0.0%) | 5 (100.0%) |
| Architecture & Engineering | 7 (100.0%) | 0 (0.0%) |
| Life, Physical & Social Science | 4 (13.8%) | 25 (86.2%) |
| Community & Social Service | 15 (40.5%) | 22 (59.5%) |
| Education, Arts & Media | 15 (83.3%) | 3 (16.7%) |
| Legal Services & Support | 0 (0.0%) | 0 (0.0%) |
| Education Instruction & Library | 0 (0.0%) | 19 (100.0%) |
| Arts, Media & Entertainment | 0 (0.0%) | 0 (0.0%) |
| Health Diagnosing & Treating | 0 (0.0%) | 0 (0.0%) |
| Health Technologists | 0 (0.0%) | 0 (0.0%) |
| Total (Category) | 86 (57.0%) | 65 (43.0%) |
| Total (Overall) | 215 (50.9%) | 207 (49.0%) |
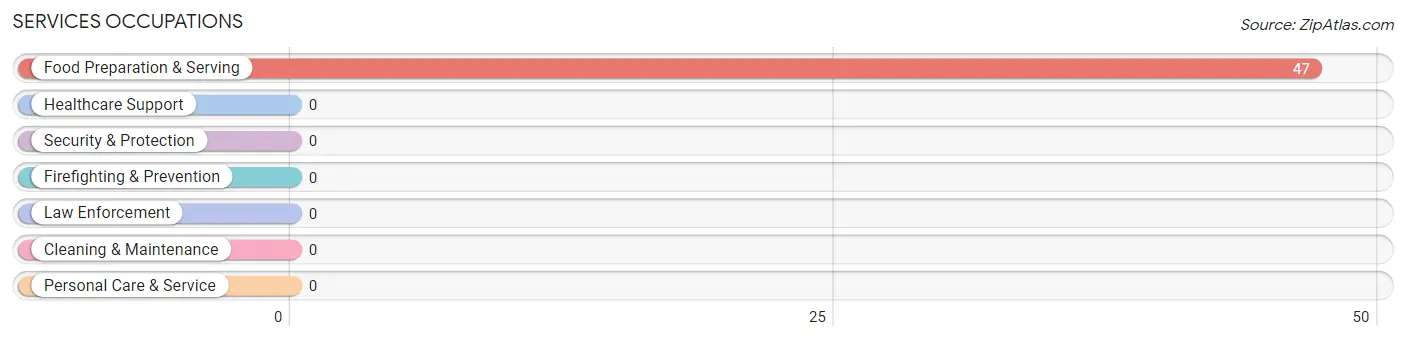
Services Occupations
The most common Services occupations in Cedar Crest are , and Food Preparation & Serving (47 | 11.1%).
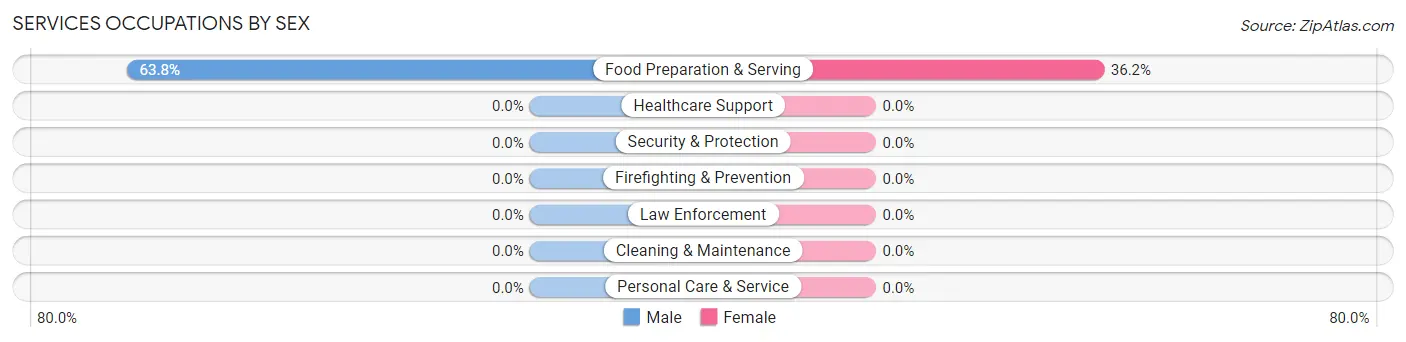
Services Occupations by Sex
| Occupation | Male | Female |
| Healthcare Support | 0 (0.0%) | 0 (0.0%) |
| Security & Protection | 0 (0.0%) | 0 (0.0%) |
| Firefighting & Prevention | 0 (0.0%) | 0 (0.0%) |
| Law Enforcement | 0 (0.0%) | 0 (0.0%) |
| Food Preparation & Serving | 30 (63.8%) | 17 (36.2%) |
| Cleaning & Maintenance | 0 (0.0%) | 0 (0.0%) |
| Personal Care & Service | 0 (0.0%) | 0 (0.0%) |
| Total (Category) | 30 (63.8%) | 17 (36.2%) |
| Total (Overall) | 215 (50.9%) | 207 (49.0%) |
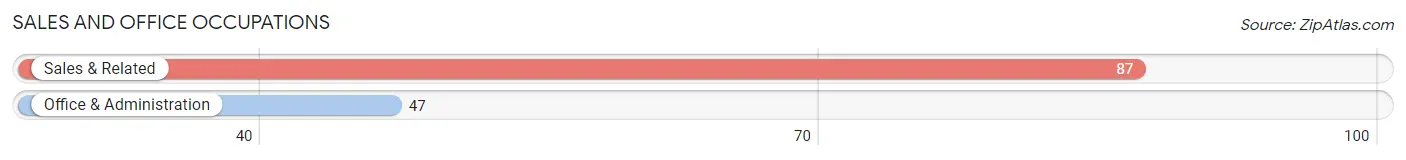
Sales and Office Occupations
The most common Sales and Office occupations in Cedar Crest are Sales & Related (87 | 20.6%), and Office & Administration (47 | 11.1%).
Sales and Office Occupations by Sex
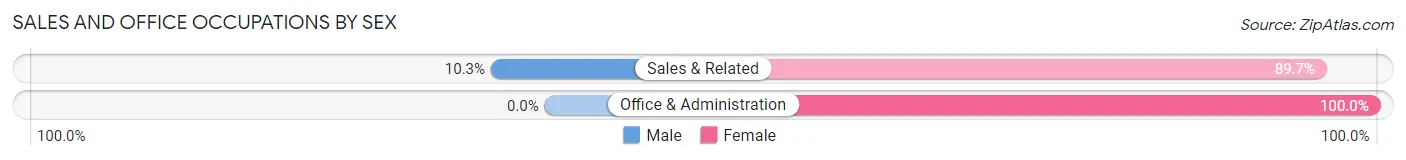
| Occupation | Male | Female |
| Sales & Related | 9 (10.3%) | 78 (89.7%) |
| Office & Administration | 0 (0.0%) | 47 (100.0%) |
| Total (Category) | 9 (6.7%) | 125 (93.3%) |
| Total (Overall) | 215 (50.9%) | 207 (49.0%) |
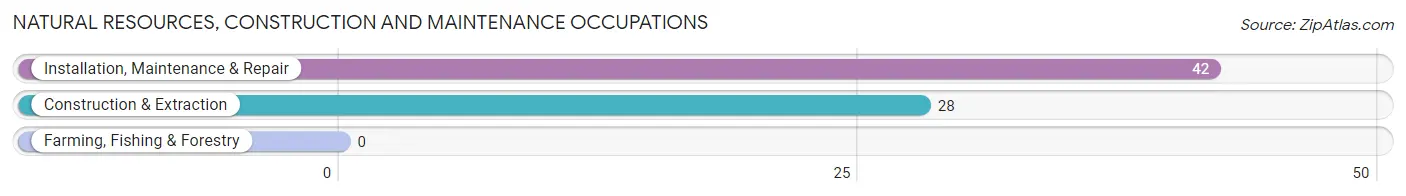
Natural Resources, Construction and Maintenance Occupations
The most common Natural Resources, Construction and Maintenance occupations in Cedar Crest are Installation, Maintenance & Repair (42 | 10.0%), and Construction & Extraction (28 | 6.6%).
Natural Resources, Construction and Maintenance Occupations by Sex
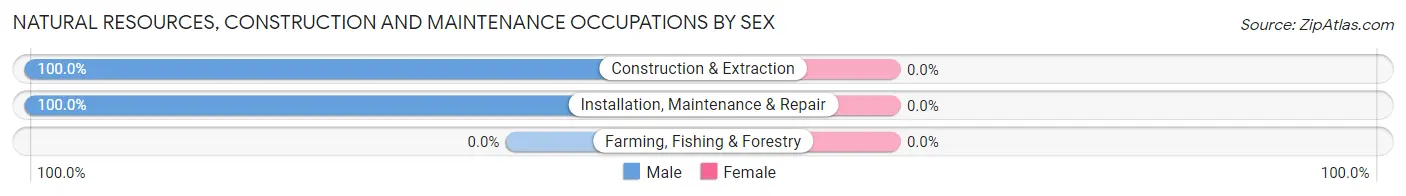
| Occupation | Male | Female |
| Farming, Fishing & Forestry | 0 (0.0%) | 0 (0.0%) |
| Construction & Extraction | 28 (100.0%) | 0 (0.0%) |
| Installation, Maintenance & Repair | 42 (100.0%) | 0 (0.0%) |
| Total (Category) | 70 (100.0%) | 0 (0.0%) |
| Total (Overall) | 215 (50.9%) | 207 (49.0%) |
Production, Transportation and Moving Occupations
The most common Production, Transportation and Moving occupations in Cedar Crest are , and Transportation (20 | 4.7%).
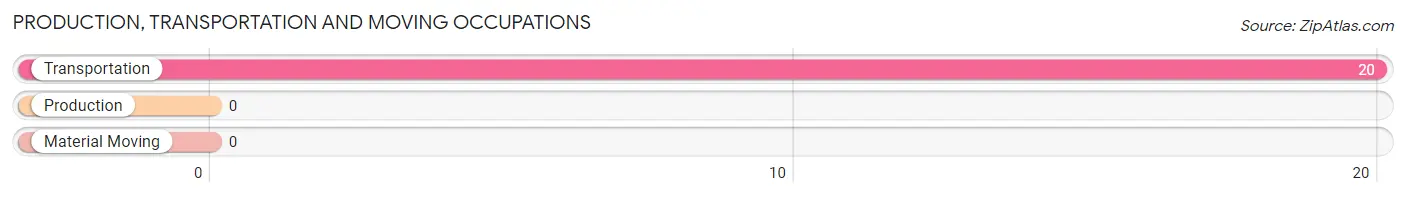
Production, Transportation and Moving Occupations by Sex
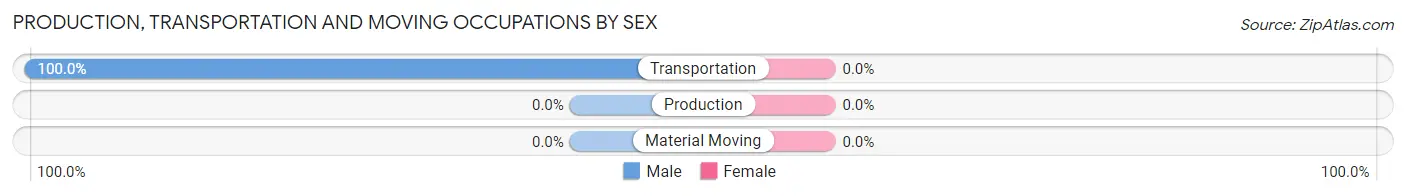
| Occupation | Male | Female |
| Production | 0 (0.0%) | 0 (0.0%) |
| Transportation | 20 (100.0%) | 0 (0.0%) |
| Material Moving | 0 (0.0%) | 0 (0.0%) |
| Total (Category) | 20 (100.0%) | 0 (0.0%) |
| Total (Overall) | 215 (50.9%) | 207 (49.0%) |
Employment Industries by Sex in Cedar Crest
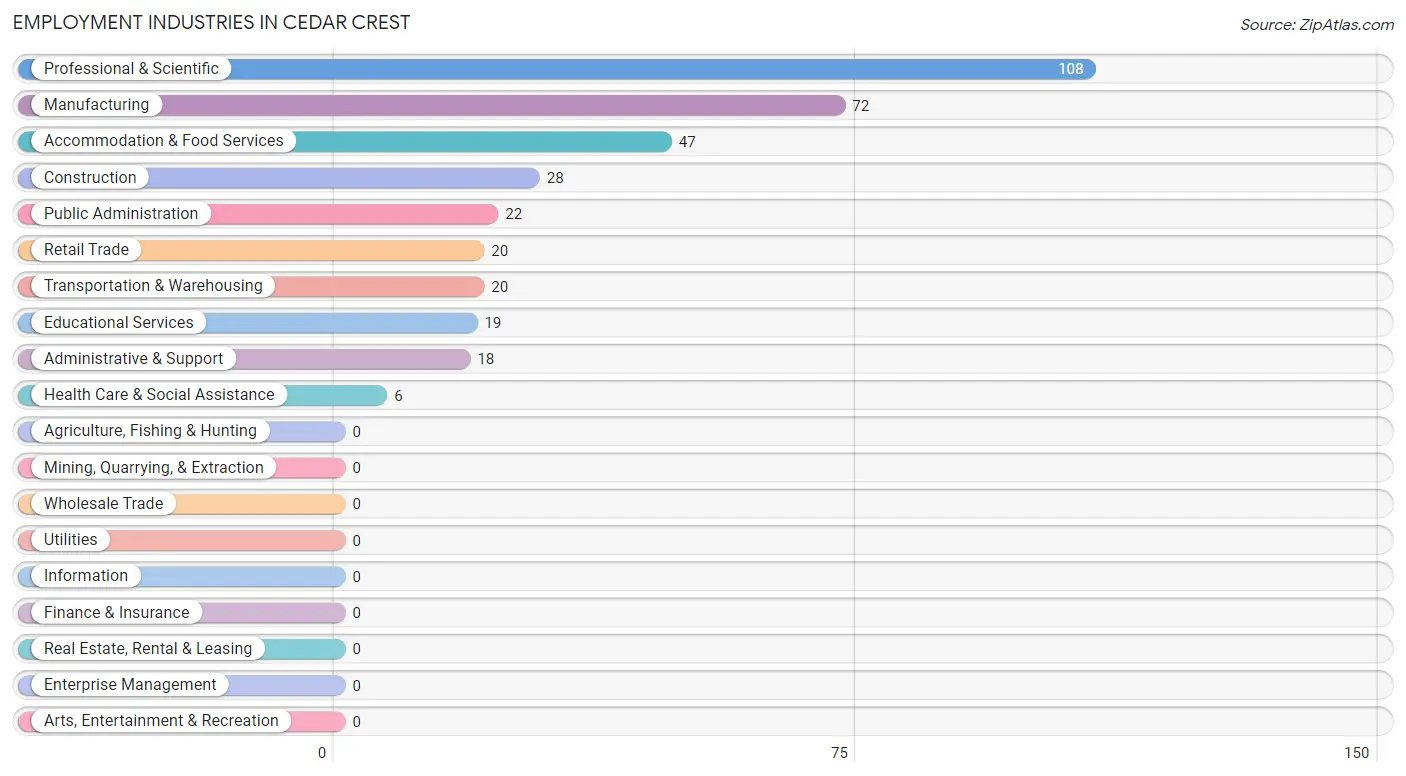
Employment Industries in Cedar Crest
The major employment industries in Cedar Crest include Professional & Scientific (108 | 25.6%), Manufacturing (72 | 17.1%), Accommodation & Food Services (47 | 11.1%), Construction (28 | 6.6%), and Public Administration (22 | 5.2%).
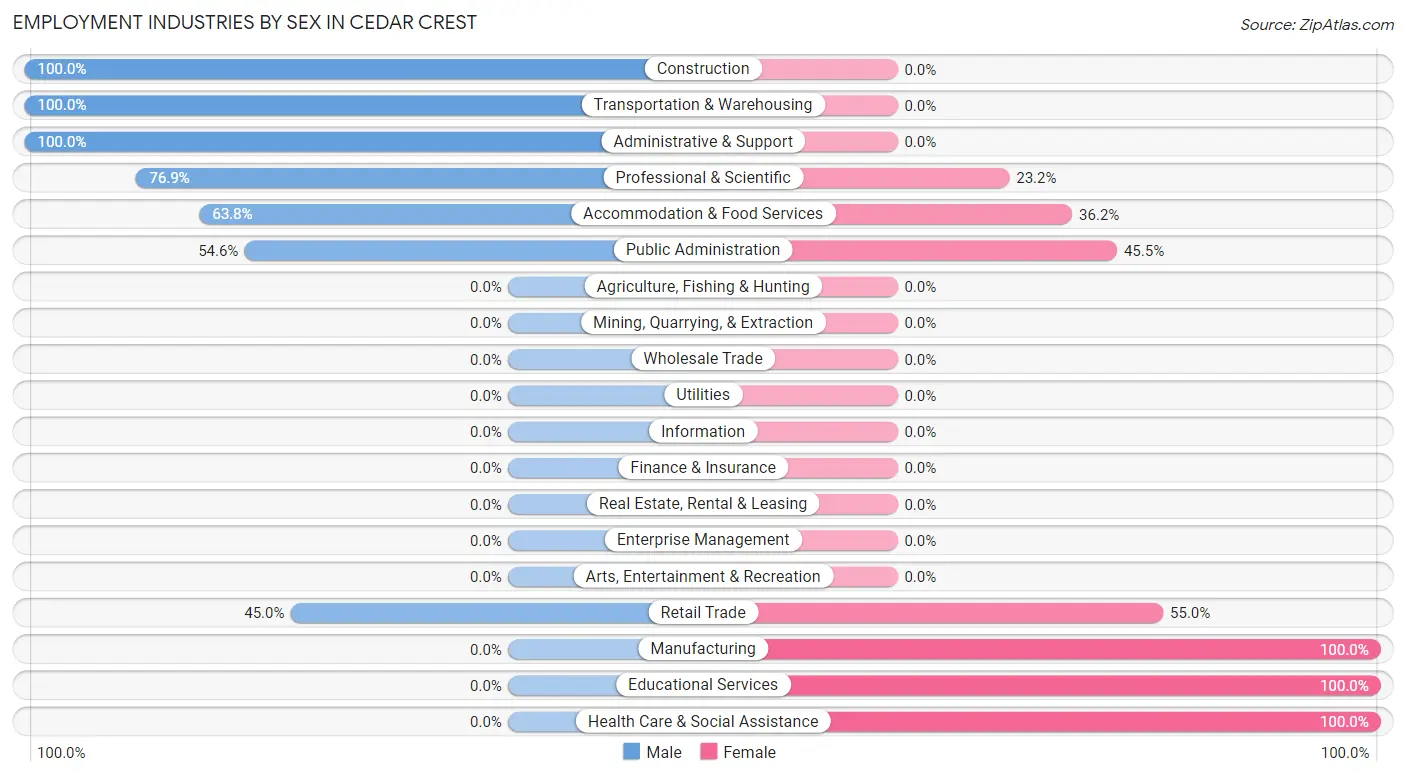
Employment Industries by Sex in Cedar Crest
The Cedar Crest industries that see more men than women are Construction (100.0%), Transportation & Warehousing (100.0%), and Administrative & Support (100.0%), whereas the industries that tend to have a higher number of women are Manufacturing (100.0%), Educational Services (100.0%), and Health Care & Social Assistance (100.0%).
| Industry | Male | Female |
| Agriculture, Fishing & Hunting | 0 (0.0%) | 0 (0.0%) |
| Mining, Quarrying, & Extraction | 0 (0.0%) | 0 (0.0%) |
| Construction | 28 (100.0%) | 0 (0.0%) |
| Manufacturing | 0 (0.0%) | 72 (100.0%) |
| Wholesale Trade | 0 (0.0%) | 0 (0.0%) |
| Retail Trade | 9 (45.0%) | 11 (55.0%) |
| Transportation & Warehousing | 20 (100.0%) | 0 (0.0%) |
| Utilities | 0 (0.0%) | 0 (0.0%) |
| Information | 0 (0.0%) | 0 (0.0%) |
| Finance & Insurance | 0 (0.0%) | 0 (0.0%) |
| Real Estate, Rental & Leasing | 0 (0.0%) | 0 (0.0%) |
| Professional & Scientific | 83 (76.8%) | 25 (23.2%) |
| Enterprise Management | 0 (0.0%) | 0 (0.0%) |
| Administrative & Support | 18 (100.0%) | 0 (0.0%) |
| Educational Services | 0 (0.0%) | 19 (100.0%) |
| Health Care & Social Assistance | 0 (0.0%) | 6 (100.0%) |
| Arts, Entertainment & Recreation | 0 (0.0%) | 0 (0.0%) |
| Accommodation & Food Services | 30 (63.8%) | 17 (36.2%) |
| Public Administration | 12 (54.5%) | 10 (45.5%) |
| Total | 215 (50.9%) | 207 (49.0%) |
Education in Cedar Crest
School Enrollment in Cedar Crest
The most common levels of schooling among the 124 students in Cedar Crest are high school (52 | 41.9%), college / undergraduate (48 | 38.7%), and graduate / professional (15 | 12.1%).
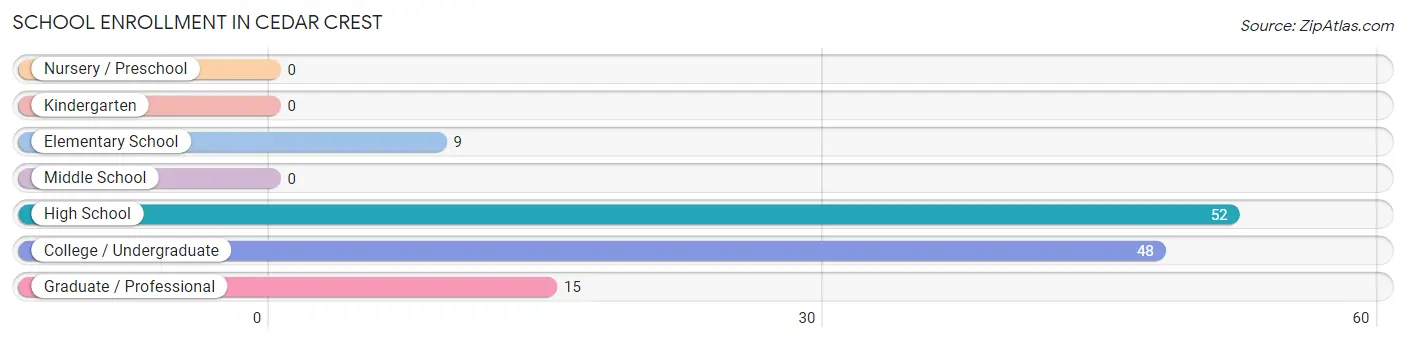
| School Level | # Students | % Students |
| Nursery / Preschool | 0 | 0.0% |
| Kindergarten | 0 | 0.0% |
| Elementary School | 9 | 7.3% |
| Middle School | 0 | 0.0% |
| High School | 52 | 41.9% |
| College / Undergraduate | 48 | 38.7% |
| Graduate / Professional | 15 | 12.1% |
| Total | 124 | 100.0% |
School Enrollment by Age by Funding Source in Cedar Crest
Out of a total of 124 students who are enrolled in schools in Cedar Crest, 42 (33.9%) attend a private institution, while the remaining 82 (66.1%) are enrolled in public schools. The age group of 5 to 9 year old has the highest likelihood of being enrolled in private schools, with 9 (100.0% in the age bracket) enrolled. Conversely, the age group of 18 to 19 year olds has the lowest likelihood of being enrolled in a private school, with 18 (100.0% in the age bracket) attending a public institution.
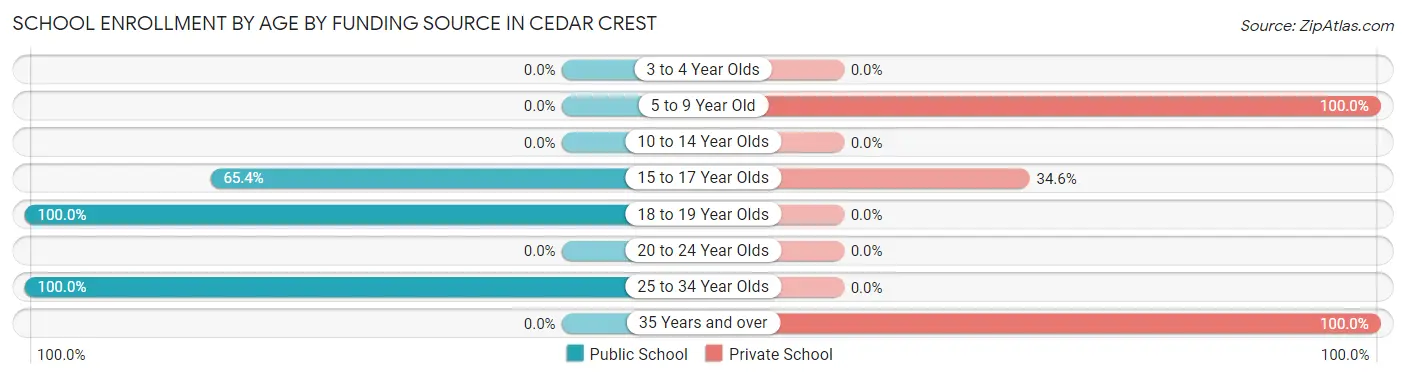
| Age Bracket | Public School | Private School |
| 3 to 4 Year Olds | 0 (0.0%) | 0 (0.0%) |
| 5 to 9 Year Old | 0 (0.0%) | 9 (100.0%) |
| 10 to 14 Year Olds | 0 (0.0%) | 0 (0.0%) |
| 15 to 17 Year Olds | 34 (65.4%) | 18 (34.6%) |
| 18 to 19 Year Olds | 18 (100.0%) | 0 (0.0%) |
| 20 to 24 Year Olds | 0 (0.0%) | 0 (0.0%) |
| 25 to 34 Year Olds | 30 (100.0%) | 0 (0.0%) |
| 35 Years and over | 0 (0.0%) | 15 (100.0%) |
| Total | 82 (66.1%) | 42 (33.9%) |
Educational Attainment by Field of Study in Cedar Crest
Business (145 | 33.8%), engineering (100 | 23.3%), bio, nature & agricultural (40 | 9.3%), social sciences (40 | 9.3%), and liberal arts & history (30 | 7.0%) are the most common fields of study among 429 individuals in Cedar Crest who have obtained a bachelor's degree or higher.
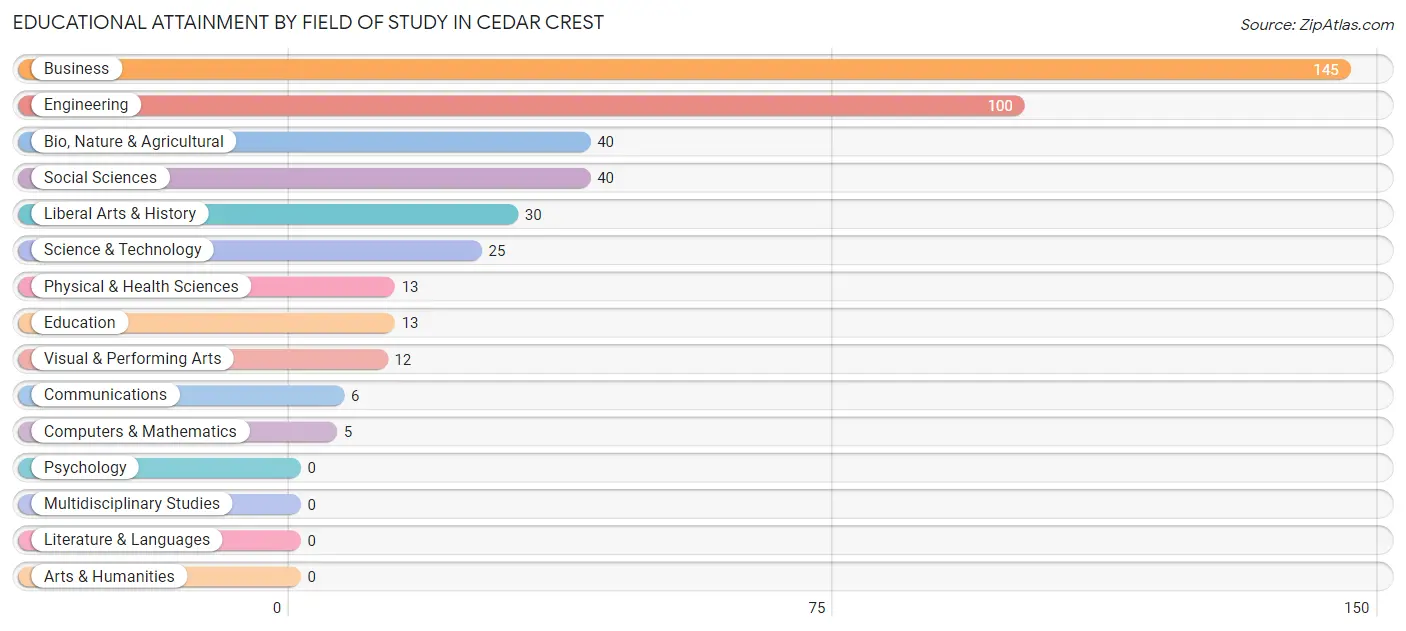
| Field of Study | # Graduates | % Graduates |
| Computers & Mathematics | 5 | 1.2% |
| Bio, Nature & Agricultural | 40 | 9.3% |
| Physical & Health Sciences | 13 | 3.0% |
| Psychology | 0 | 0.0% |
| Social Sciences | 40 | 9.3% |
| Engineering | 100 | 23.3% |
| Multidisciplinary Studies | 0 | 0.0% |
| Science & Technology | 25 | 5.8% |
| Business | 145 | 33.8% |
| Education | 13 | 3.0% |
| Literature & Languages | 0 | 0.0% |
| Liberal Arts & History | 30 | 7.0% |
| Visual & Performing Arts | 12 | 2.8% |
| Communications | 6 | 1.4% |
| Arts & Humanities | 0 | 0.0% |
| Total | 429 | 100.0% |
Transportation & Commute in Cedar Crest
Vehicle Availability by Sex in Cedar Crest
The most prevalent vehicle ownership categories in Cedar Crest are males with 1 vehicle (109, accounting for 50.7%) and females with 1 vehicle (45, making up 52.7%).
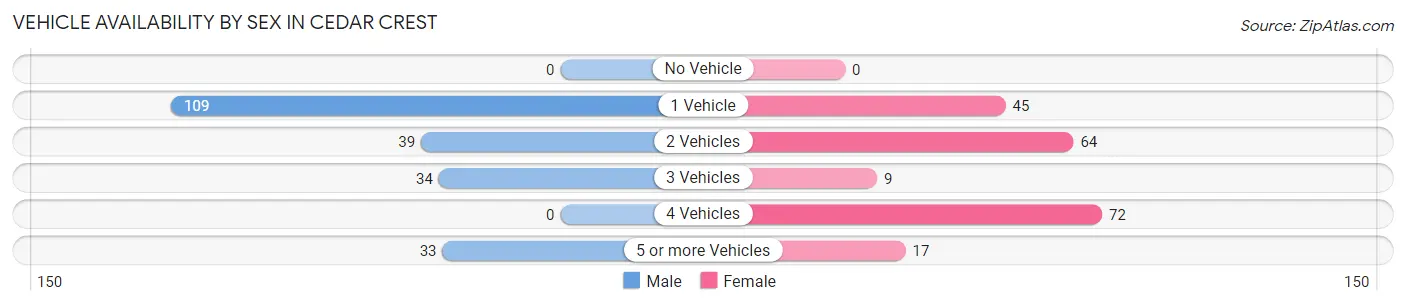
| Vehicles Available | Male | Female |
| No Vehicle | 0 (0.0%) | 0 (0.0%) |
| 1 Vehicle | 109 (50.7%) | 45 (21.7%) |
| 2 Vehicles | 39 (18.1%) | 64 (30.9%) |
| 3 Vehicles | 34 (15.8%) | 9 (4.3%) |
| 4 Vehicles | 0 (0.0%) | 72 (34.8%) |
| 5 or more Vehicles | 33 (15.3%) | 17 (8.2%) |
| Total | 215 (100.0%) | 207 (100.0%) |
Commute Time in Cedar Crest
The most frequently occuring commute durations in Cedar Crest are 20 to 24 minutes (136 commuters, 32.5%), 15 to 19 minutes (129 commuters, 30.8%), and 30 to 34 minutes (43 commuters, 10.3%).
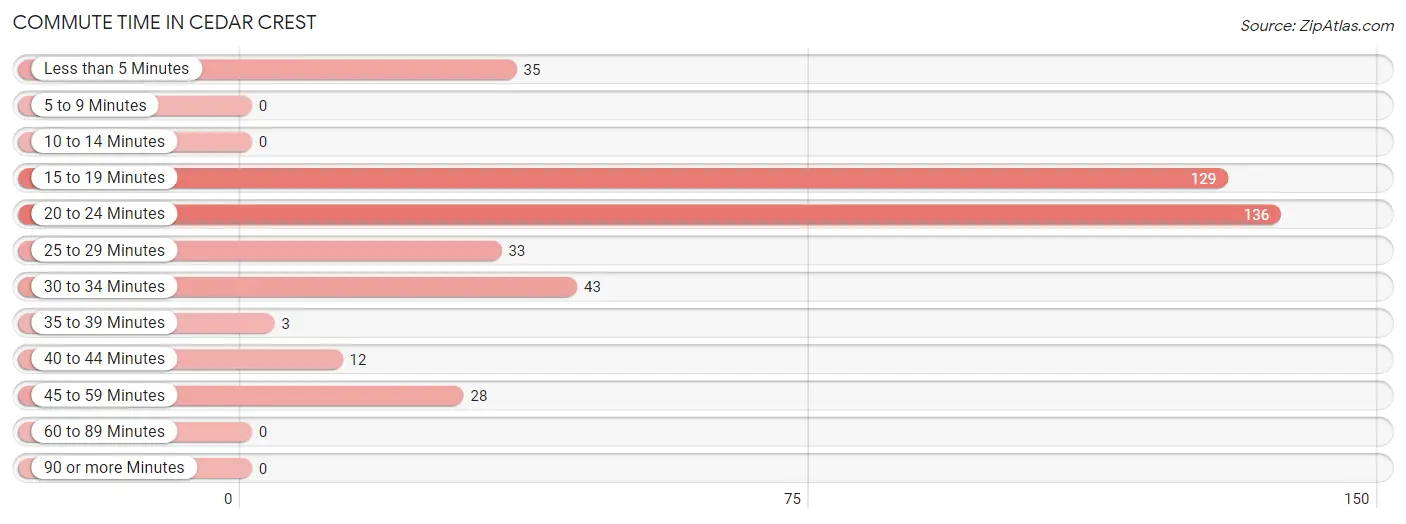
| Commute Time | # Commuters | % Commuters |
| Less than 5 Minutes | 35 | 8.4% |
| 5 to 9 Minutes | 0 | 0.0% |
| 10 to 14 Minutes | 0 | 0.0% |
| 15 to 19 Minutes | 129 | 30.8% |
| 20 to 24 Minutes | 136 | 32.5% |
| 25 to 29 Minutes | 33 | 7.9% |
| 30 to 34 Minutes | 43 | 10.3% |
| 35 to 39 Minutes | 3 | 0.7% |
| 40 to 44 Minutes | 12 | 2.9% |
| 45 to 59 Minutes | 28 | 6.7% |
| 60 to 89 Minutes | 0 | 0.0% |
| 90 or more Minutes | 0 | 0.0% |
Commute Time by Sex in Cedar Crest
The most common commute times in Cedar Crest are 15 to 19 minutes (95 commuters, 44.2%) for males and 20 to 24 minutes (97 commuters, 47.5%) for females.
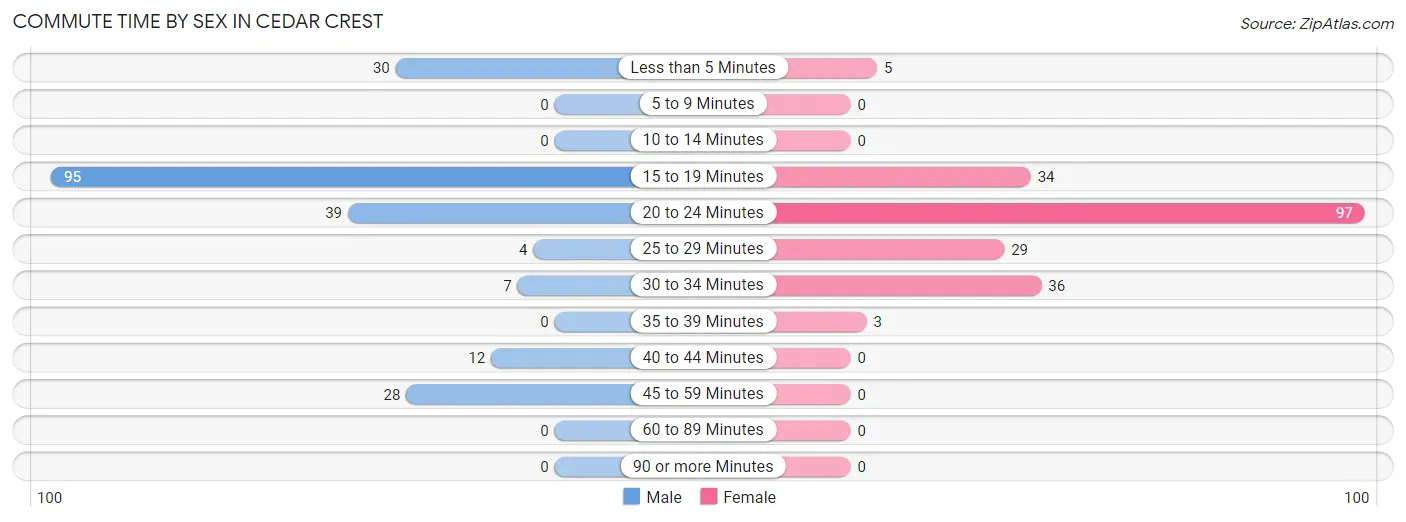
| Commute Time | Male | Female |
| Less than 5 Minutes | 30 (14.0%) | 5 (2.5%) |
| 5 to 9 Minutes | 0 (0.0%) | 0 (0.0%) |
| 10 to 14 Minutes | 0 (0.0%) | 0 (0.0%) |
| 15 to 19 Minutes | 95 (44.2%) | 34 (16.7%) |
| 20 to 24 Minutes | 39 (18.1%) | 97 (47.5%) |
| 25 to 29 Minutes | 4 (1.9%) | 29 (14.2%) |
| 30 to 34 Minutes | 7 (3.3%) | 36 (17.6%) |
| 35 to 39 Minutes | 0 (0.0%) | 3 (1.5%) |
| 40 to 44 Minutes | 12 (5.6%) | 0 (0.0%) |
| 45 to 59 Minutes | 28 (13.0%) | 0 (0.0%) |
| 60 to 89 Minutes | 0 (0.0%) | 0 (0.0%) |
| 90 or more Minutes | 0 (0.0%) | 0 (0.0%) |
Time of Departure to Work by Sex in Cedar Crest
The most frequent times of departure to work in Cedar Crest are 7:00 AM to 7:29 AM (90, 41.9%) for males and 6:00 AM to 6:29 AM (72, 35.3%) for females.
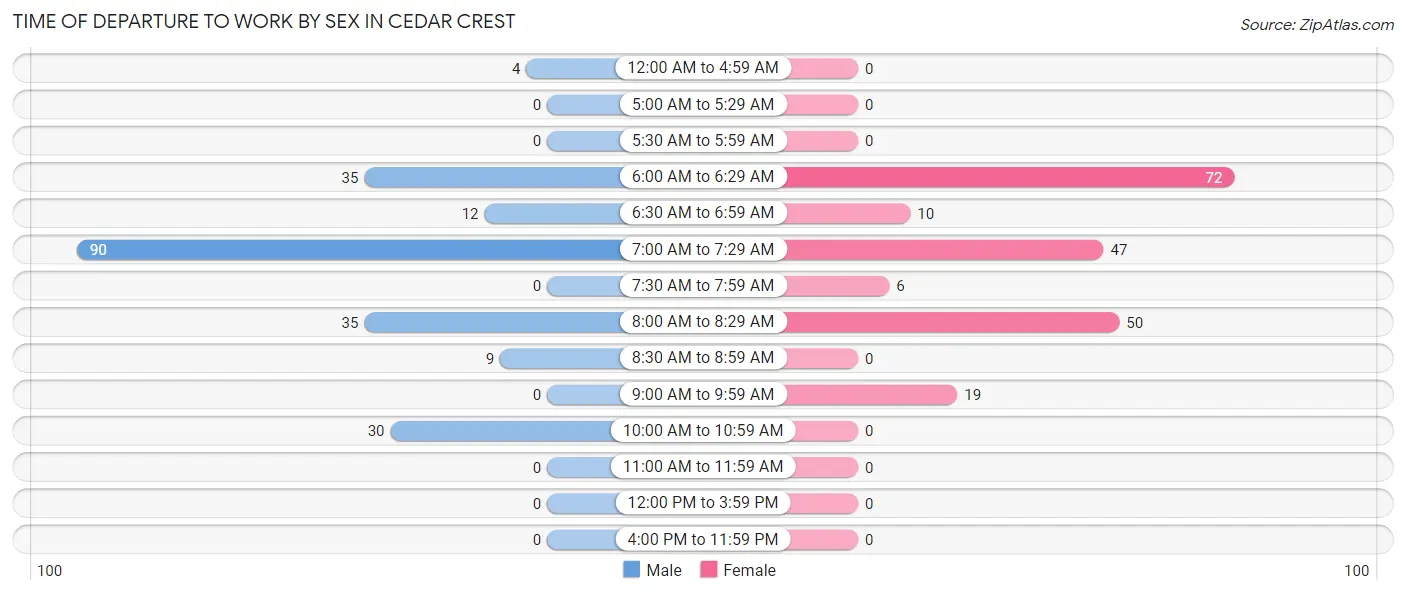
| Time of Departure | Male | Female |
| 12:00 AM to 4:59 AM | 4 (1.9%) | 0 (0.0%) |
| 5:00 AM to 5:29 AM | 0 (0.0%) | 0 (0.0%) |
| 5:30 AM to 5:59 AM | 0 (0.0%) | 0 (0.0%) |
| 6:00 AM to 6:29 AM | 35 (16.3%) | 72 (35.3%) |
| 6:30 AM to 6:59 AM | 12 (5.6%) | 10 (4.9%) |
| 7:00 AM to 7:29 AM | 90 (41.9%) | 47 (23.0%) |
| 7:30 AM to 7:59 AM | 0 (0.0%) | 6 (2.9%) |
| 8:00 AM to 8:29 AM | 35 (16.3%) | 50 (24.5%) |
| 8:30 AM to 8:59 AM | 9 (4.2%) | 0 (0.0%) |
| 9:00 AM to 9:59 AM | 0 (0.0%) | 19 (9.3%) |
| 10:00 AM to 10:59 AM | 30 (14.0%) | 0 (0.0%) |
| 11:00 AM to 11:59 AM | 0 (0.0%) | 0 (0.0%) |
| 12:00 PM to 3:59 PM | 0 (0.0%) | 0 (0.0%) |
| 4:00 PM to 11:59 PM | 0 (0.0%) | 0 (0.0%) |
| Total | 215 (100.0%) | 204 (100.0%) |
Housing Occupancy in Cedar Crest
Occupancy by Ownership in Cedar Crest
Of the total 557 dwellings in Cedar Crest, owner-occupied units account for 500 (89.8%), while renter-occupied units make up 57 (10.2%).
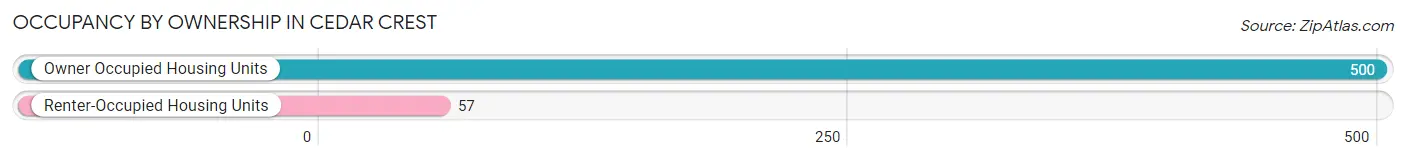
| Occupancy | # Housing Units | % Housing Units |
| Owner Occupied Housing Units | 500 | 89.8% |
| Renter-Occupied Housing Units | 57 | 10.2% |
| Total Occupied Housing Units | 557 | 100.0% |
Occupancy by Household Size in Cedar Crest
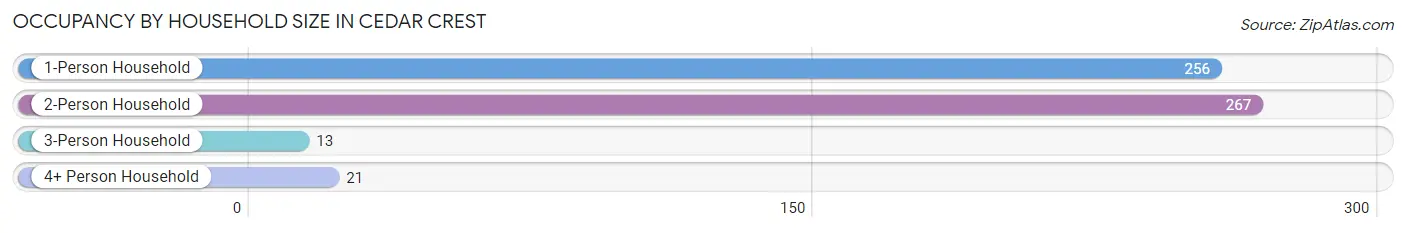
| Household Size | # Housing Units | % Housing Units |
| 1-Person Household | 256 | 46.0% |
| 2-Person Household | 267 | 47.9% |
| 3-Person Household | 13 | 2.3% |
| 4+ Person Household | 21 | 3.8% |
| Total Housing Units | 557 | 100.0% |
Occupancy by Ownership by Household Size in Cedar Crest
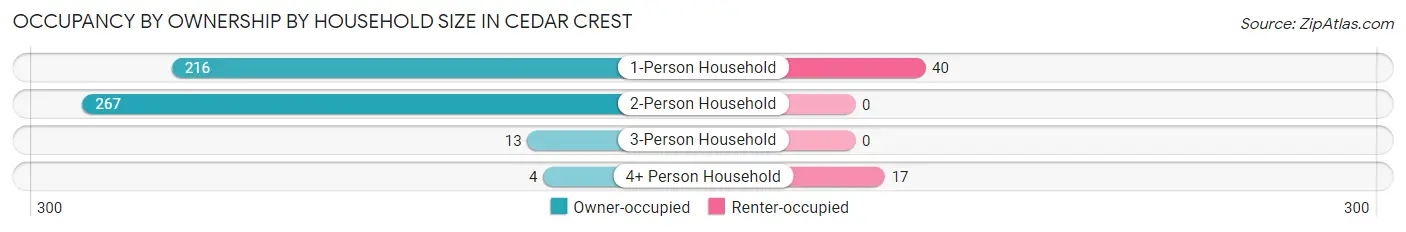
| Household Size | Owner-occupied | Renter-occupied |
| 1-Person Household | 216 (84.4%) | 40 (15.6%) |
| 2-Person Household | 267 (100.0%) | 0 (0.0%) |
| 3-Person Household | 13 (100.0%) | 0 (0.0%) |
| 4+ Person Household | 4 (19.1%) | 17 (80.9%) |
| Total Housing Units | 500 (89.8%) | 57 (10.2%) |
Occupancy by Educational Attainment in Cedar Crest
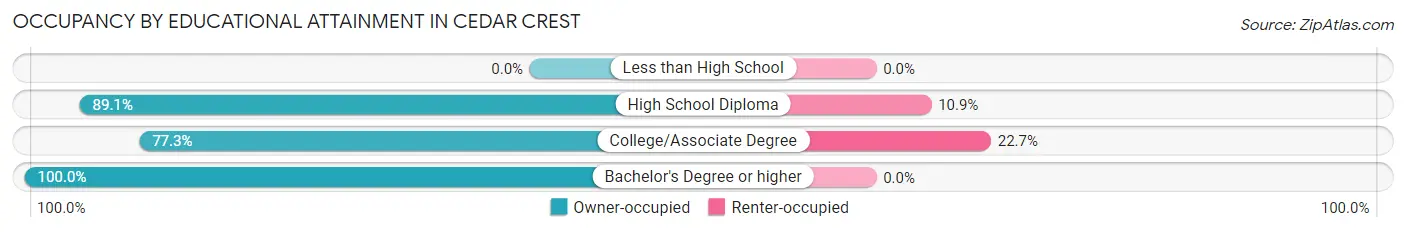
| Household Size | Owner-occupied | Renter-occupied |
| Less than High School | 0 (0.0%) | 0 (0.0%) |
| High School Diploma | 98 (89.1%) | 12 (10.9%) |
| College/Associate Degree | 153 (77.3%) | 45 (22.7%) |
| Bachelor's Degree or higher | 249 (100.0%) | 0 (0.0%) |
Occupancy by Age of Householder in Cedar Crest
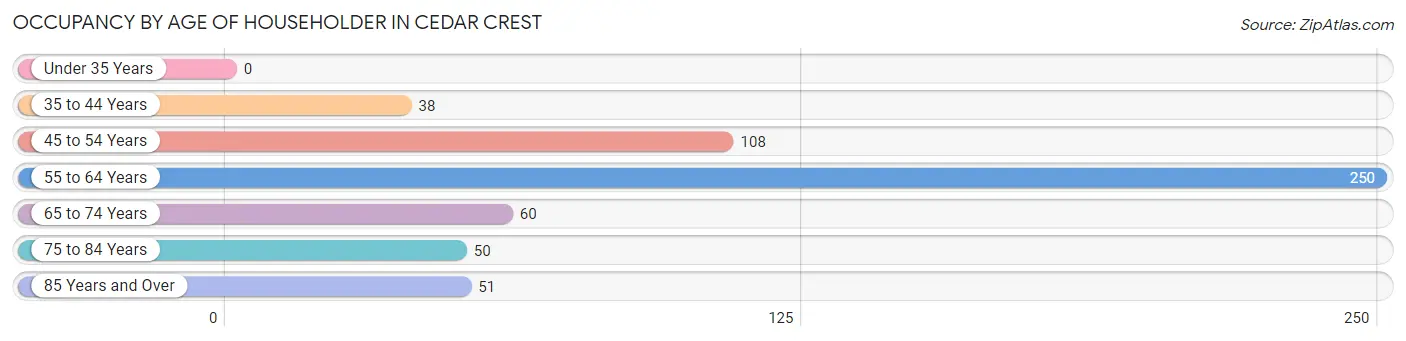
| Age Bracket | # Households | % Households |
| Under 35 Years | 0 | 0.0% |
| 35 to 44 Years | 38 | 6.8% |
| 45 to 54 Years | 108 | 19.4% |
| 55 to 64 Years | 250 | 44.9% |
| 65 to 74 Years | 60 | 10.8% |
| 75 to 84 Years | 50 | 9.0% |
| 85 Years and Over | 51 | 9.2% |
| Total | 557 | 100.0% |
Housing Finances in Cedar Crest
Median Income by Occupancy in Cedar Crest
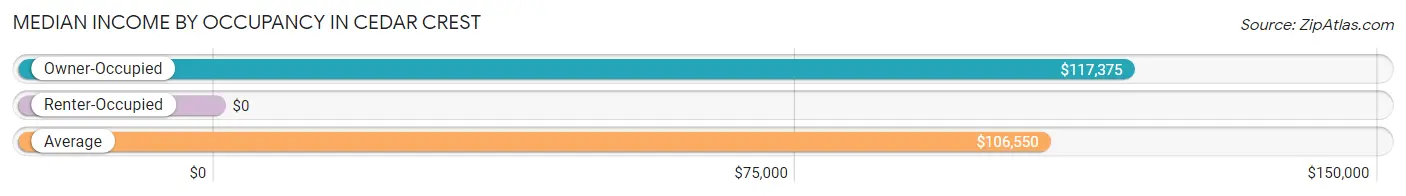
| Occupancy Type | # Households | Median Income |
| Owner-Occupied | 500 (89.8%) | $117,375 |
| Renter-Occupied | 57 (10.2%) | $0 |
| Average | 557 (100.0%) | $106,550 |
Occupancy by Householder Income Bracket in Cedar Crest
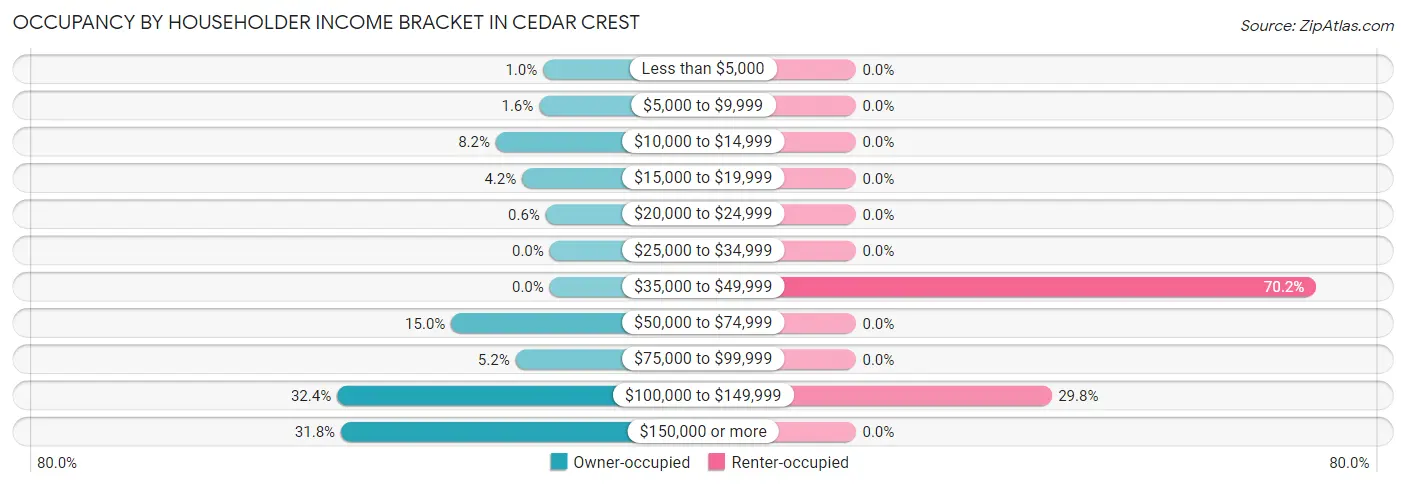
| Income Bracket | Owner-occupied | Renter-occupied |
| Less than $5,000 | 5 (1.0%) | 0 (0.0%) |
| $5,000 to $9,999 | 8 (1.6%) | 0 (0.0%) |
| $10,000 to $14,999 | 41 (8.2%) | 0 (0.0%) |
| $15,000 to $19,999 | 21 (4.2%) | 0 (0.0%) |
| $20,000 to $24,999 | 3 (0.6%) | 0 (0.0%) |
| $25,000 to $34,999 | 0 (0.0%) | 0 (0.0%) |
| $35,000 to $49,999 | 0 (0.0%) | 40 (70.2%) |
| $50,000 to $74,999 | 75 (15.0%) | 0 (0.0%) |
| $75,000 to $99,999 | 26 (5.2%) | 0 (0.0%) |
| $100,000 to $149,999 | 162 (32.4%) | 17 (29.8%) |
| $150,000 or more | 159 (31.8%) | 0 (0.0%) |
| Total | 500 (100.0%) | 57 (100.0%) |
Monthly Housing Cost Tiers in Cedar Crest
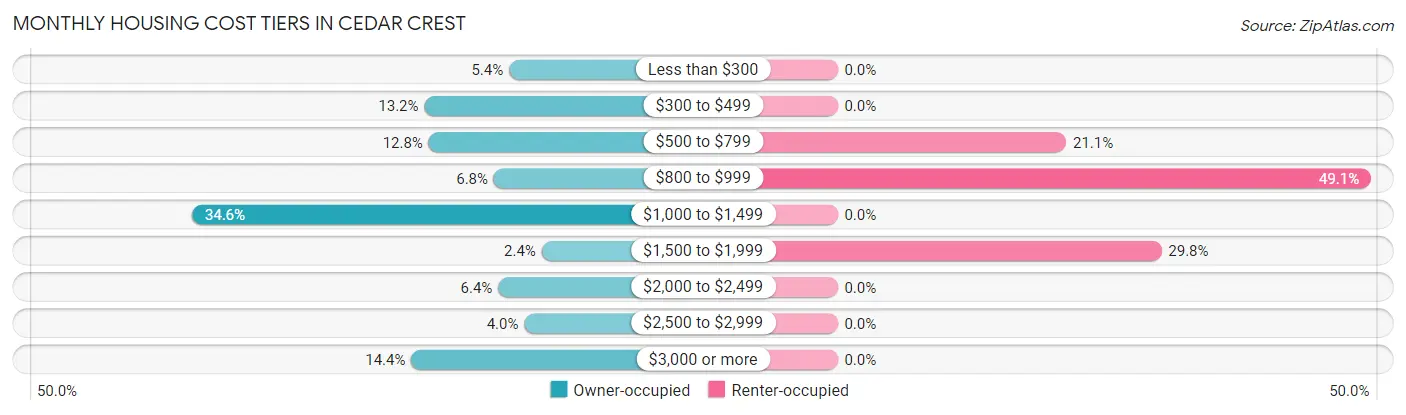
| Monthly Cost | Owner-occupied | Renter-occupied |
| Less than $300 | 27 (5.4%) | 0 (0.0%) |
| $300 to $499 | 66 (13.2%) | 0 (0.0%) |
| $500 to $799 | 64 (12.8%) | 12 (21.0%) |
| $800 to $999 | 34 (6.8%) | 28 (49.1%) |
| $1,000 to $1,499 | 173 (34.6%) | 0 (0.0%) |
| $1,500 to $1,999 | 12 (2.4%) | 17 (29.8%) |
| $2,000 to $2,499 | 32 (6.4%) | 0 (0.0%) |
| $2,500 to $2,999 | 20 (4.0%) | 0 (0.0%) |
| $3,000 or more | 72 (14.4%) | 0 (0.0%) |
| Total | 500 (100.0%) | 57 (100.0%) |
Physical Housing Characteristics in Cedar Crest
Housing Structures in Cedar Crest
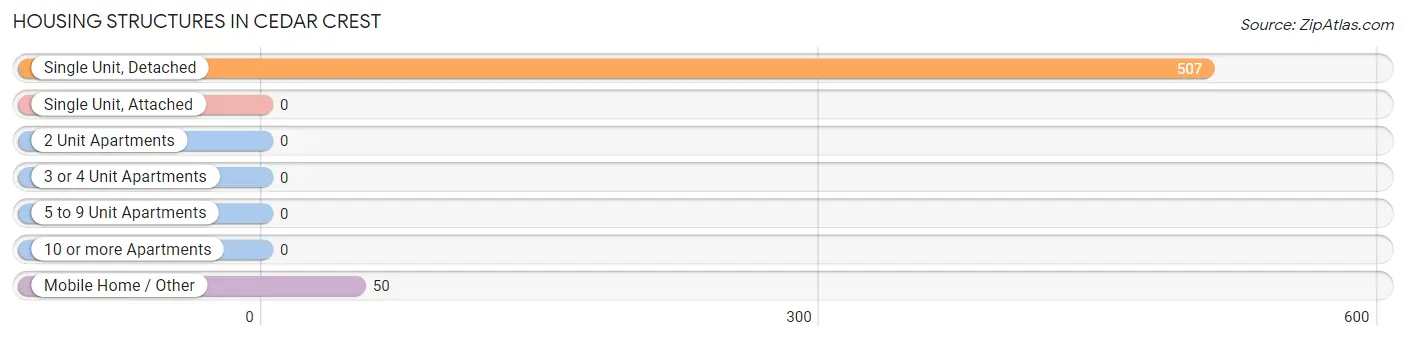
| Structure Type | # Housing Units | % Housing Units |
| Single Unit, Detached | 507 | 91.0% |
| Single Unit, Attached | 0 | 0.0% |
| 2 Unit Apartments | 0 | 0.0% |
| 3 or 4 Unit Apartments | 0 | 0.0% |
| 5 to 9 Unit Apartments | 0 | 0.0% |
| 10 or more Apartments | 0 | 0.0% |
| Mobile Home / Other | 50 | 9.0% |
| Total | 557 | 100.0% |
Housing Structures by Occupancy in Cedar Crest
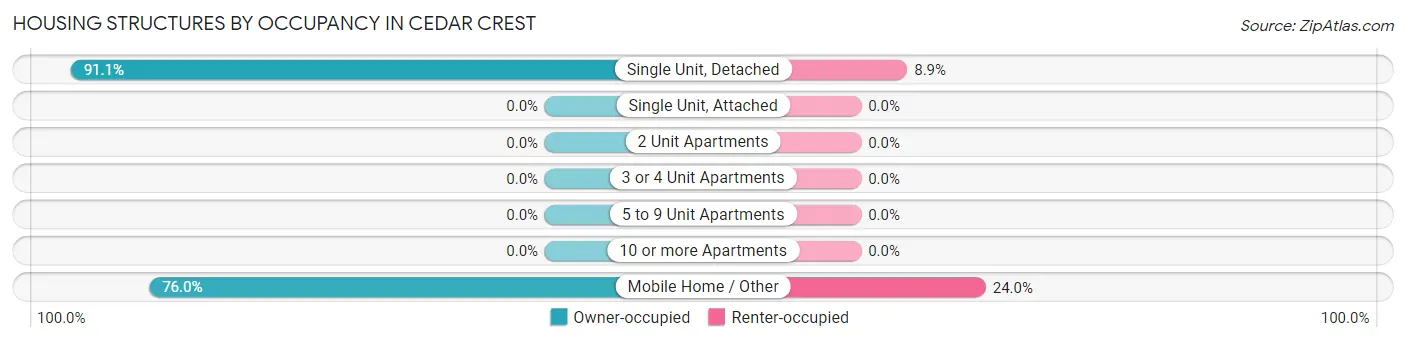
| Structure Type | Owner-occupied | Renter-occupied |
| Single Unit, Detached | 462 (91.1%) | 45 (8.9%) |
| Single Unit, Attached | 0 (0.0%) | 0 (0.0%) |
| 2 Unit Apartments | 0 (0.0%) | 0 (0.0%) |
| 3 or 4 Unit Apartments | 0 (0.0%) | 0 (0.0%) |
| 5 to 9 Unit Apartments | 0 (0.0%) | 0 (0.0%) |
| 10 or more Apartments | 0 (0.0%) | 0 (0.0%) |
| Mobile Home / Other | 38 (76.0%) | 12 (24.0%) |
| Total | 500 (89.8%) | 57 (10.2%) |
Housing Structures by Number of Rooms in Cedar Crest
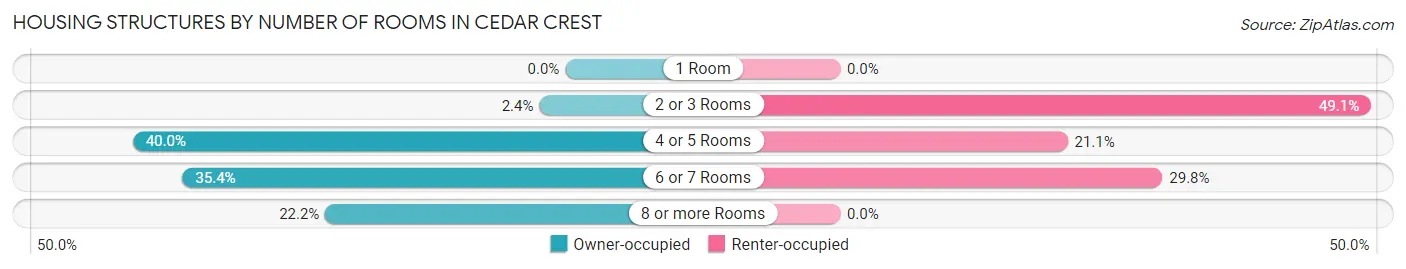
| Number of Rooms | Owner-occupied | Renter-occupied |
| 1 Room | 0 (0.0%) | 0 (0.0%) |
| 2 or 3 Rooms | 12 (2.4%) | 28 (49.1%) |
| 4 or 5 Rooms | 200 (40.0%) | 12 (21.0%) |
| 6 or 7 Rooms | 177 (35.4%) | 17 (29.8%) |
| 8 or more Rooms | 111 (22.2%) | 0 (0.0%) |
| Total | 500 (100.0%) | 57 (100.0%) |
Housing Structure by Heating Type in Cedar Crest
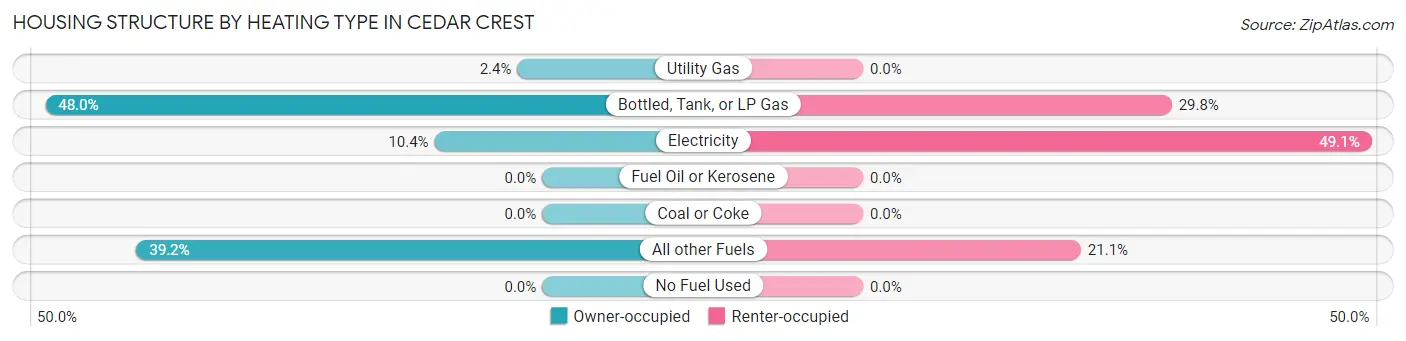
| Heating Type | Owner-occupied | Renter-occupied |
| Utility Gas | 12 (2.4%) | 0 (0.0%) |
| Bottled, Tank, or LP Gas | 240 (48.0%) | 17 (29.8%) |
| Electricity | 52 (10.4%) | 28 (49.1%) |
| Fuel Oil or Kerosene | 0 (0.0%) | 0 (0.0%) |
| Coal or Coke | 0 (0.0%) | 0 (0.0%) |
| All other Fuels | 196 (39.2%) | 12 (21.0%) |
| No Fuel Used | 0 (0.0%) | 0 (0.0%) |
| Total | 500 (100.0%) | 57 (100.0%) |
Household Vehicle Usage in Cedar Crest
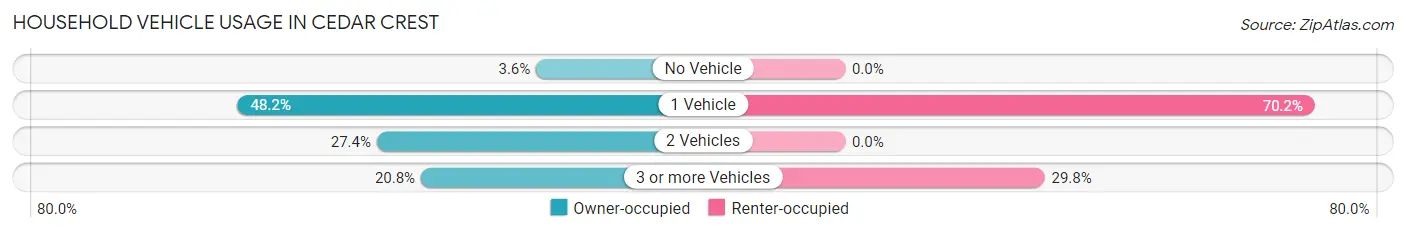
| Vehicles per Household | Owner-occupied | Renter-occupied |
| No Vehicle | 18 (3.6%) | 0 (0.0%) |
| 1 Vehicle | 241 (48.2%) | 40 (70.2%) |
| 2 Vehicles | 137 (27.4%) | 0 (0.0%) |
| 3 or more Vehicles | 104 (20.8%) | 17 (29.8%) |
| Total | 500 (100.0%) | 57 (100.0%) |
Real Estate & Mortgages in Cedar Crest
Real Estate and Mortgage Overview in Cedar Crest
| Characteristic | Without Mortgage | With Mortgage |
| Housing Units | 221 | 279 |
| Median Property Value | $325,500 | $0 |
| Median Household Income | $66,510 | $144 |
| Monthly Housing Costs | $556 | $72 |
| Real Estate Taxes | $2,378 | $0 |
Property Value by Mortgage Status in Cedar Crest
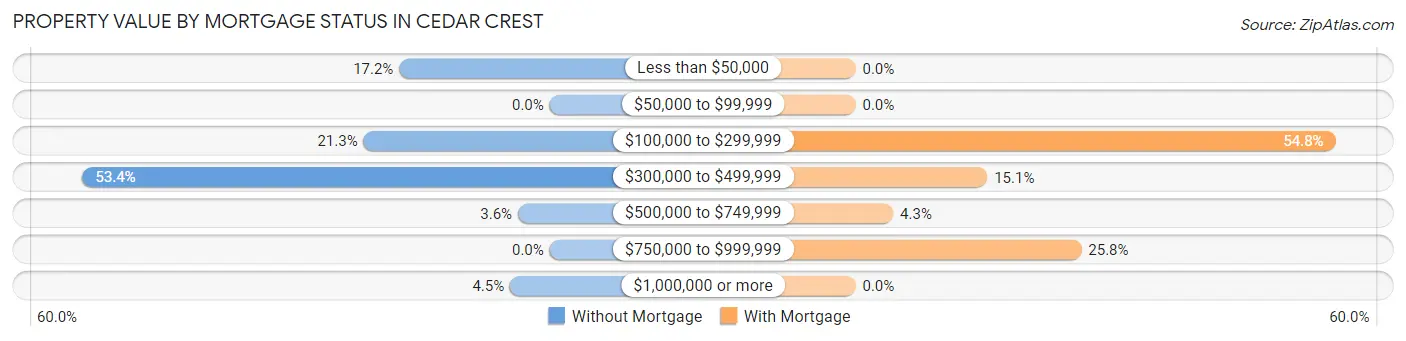
| Property Value | Without Mortgage | With Mortgage |
| Less than $50,000 | 38 (17.2%) | 0 (0.0%) |
| $50,000 to $99,999 | 0 (0.0%) | 0 (0.0%) |
| $100,000 to $299,999 | 47 (21.3%) | 153 (54.8%) |
| $300,000 to $499,999 | 118 (53.4%) | 42 (15.0%) |
| $500,000 to $749,999 | 8 (3.6%) | 12 (4.3%) |
| $750,000 to $999,999 | 0 (0.0%) | 72 (25.8%) |
| $1,000,000 or more | 10 (4.5%) | 0 (0.0%) |
| Total | 221 (100.0%) | 279 (100.0%) |
Household Income by Mortgage Status in Cedar Crest
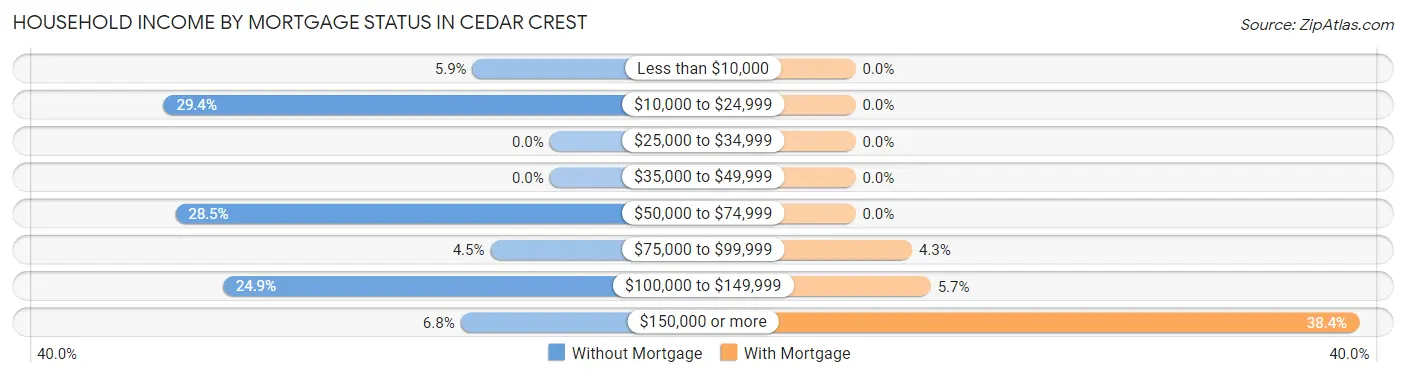
| Household Income | Without Mortgage | With Mortgage |
| Less than $10,000 | 13 (5.9%) | 0 (0.0%) |
| $10,000 to $24,999 | 65 (29.4%) | 0 (0.0%) |
| $25,000 to $34,999 | 0 (0.0%) | 0 (0.0%) |
| $35,000 to $49,999 | 0 (0.0%) | 0 (0.0%) |
| $50,000 to $74,999 | 63 (28.5%) | 0 (0.0%) |
| $75,000 to $99,999 | 10 (4.5%) | 12 (4.3%) |
| $100,000 to $149,999 | 55 (24.9%) | 16 (5.7%) |
| $150,000 or more | 15 (6.8%) | 107 (38.4%) |
| Total | 221 (100.0%) | 279 (100.0%) |
Property Value to Household Income Ratio in Cedar Crest
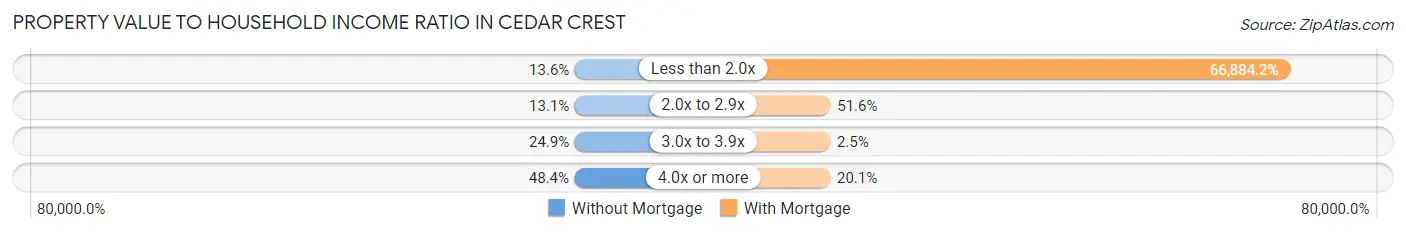
| Value-to-Income Ratio | Without Mortgage | With Mortgage |
| Less than 2.0x | 30 (13.6%) | 186,607 (66,884.2%) |
| 2.0x to 2.9x | 29 (13.1%) | 144 (51.6%) |
| 3.0x to 3.9x | 55 (24.9%) | 7 (2.5%) |
| 4.0x or more | 107 (48.4%) | 56 (20.1%) |
| Total | 221 (100.0%) | 279 (100.0%) |
Real Estate Taxes by Mortgage Status in Cedar Crest
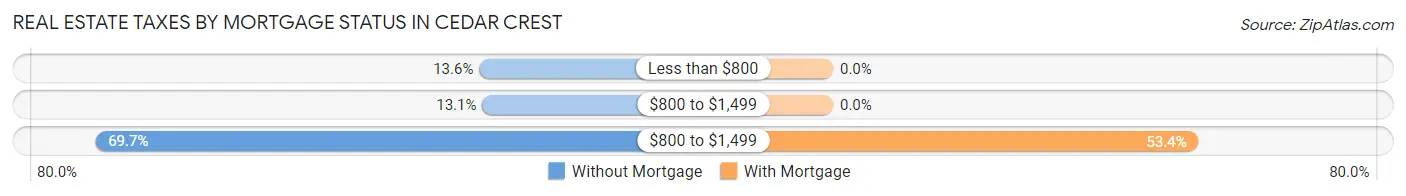
| Property Taxes | Without Mortgage | With Mortgage |
| Less than $800 | 30 (13.6%) | 0 (0.0%) |
| $800 to $1,499 | 29 (13.1%) | 0 (0.0%) |
| $800 to $1,499 | 154 (69.7%) | 149 (53.4%) |
| Total | 221 (100.0%) | 279 (100.0%) |
Health & Disability in Cedar Crest
Health Insurance Coverage by Age in Cedar Crest
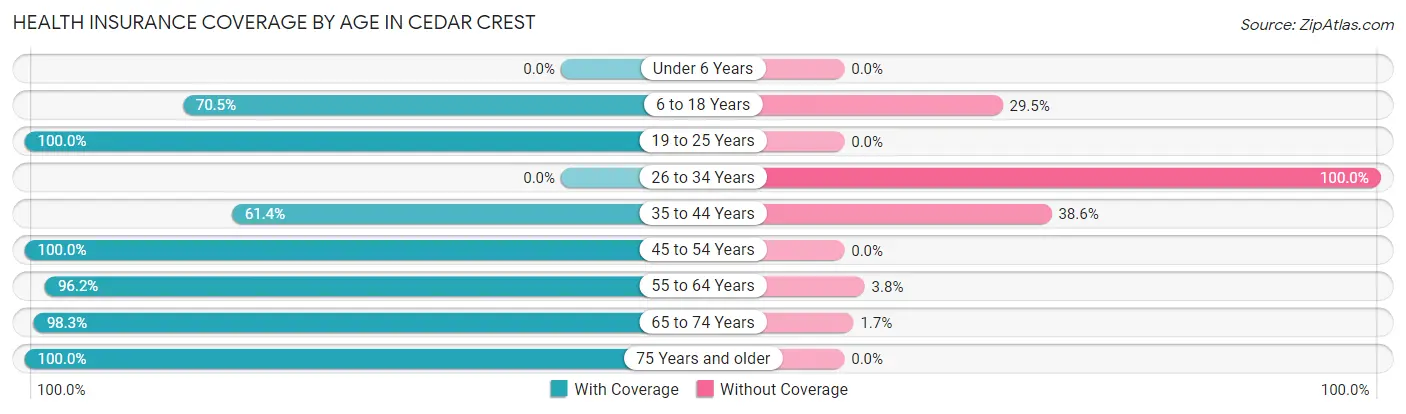
| Age Bracket | With Coverage | Without Coverage |
| Under 6 Years | 0 (0.0%) | 0 (0.0%) |
| 6 to 18 Years | 43 (70.5%) | 18 (29.5%) |
| 19 to 25 Years | 30 (100.0%) | 0 (0.0%) |
| 26 to 34 Years | 0 (0.0%) | 30 (100.0%) |
| 35 to 44 Years | 27 (61.4%) | 17 (38.6%) |
| 45 to 54 Years | 123 (100.0%) | 0 (0.0%) |
| 55 to 64 Years | 304 (96.2%) | 12 (3.8%) |
| 65 to 74 Years | 172 (98.3%) | 3 (1.7%) |
| 75 Years and older | 122 (100.0%) | 0 (0.0%) |
| Total | 821 (91.1%) | 80 (8.9%) |
Health Insurance Coverage by Citizenship Status in Cedar Crest
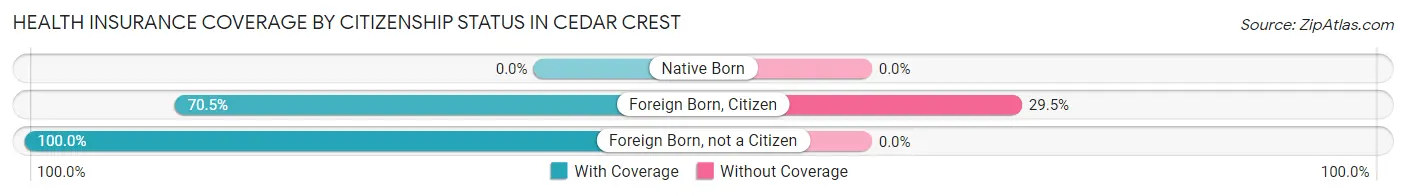
| Citizenship Status | With Coverage | Without Coverage |
| Native Born | 0 (0.0%) | 0 (0.0%) |
| Foreign Born, Citizen | 43 (70.5%) | 18 (29.5%) |
| Foreign Born, not a Citizen | 30 (100.0%) | 0 (0.0%) |
Health Insurance Coverage by Household Income in Cedar Crest
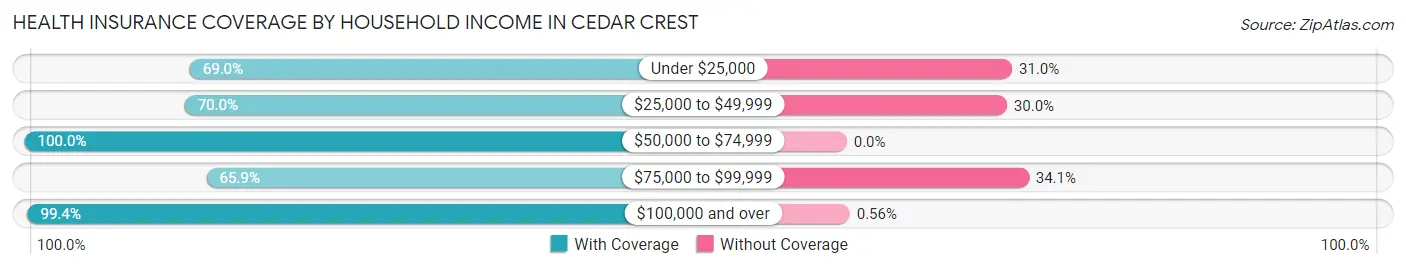
| Household Income | With Coverage | Without Coverage |
| Under $25,000 | 78 (69.0%) | 35 (31.0%) |
| $25,000 to $49,999 | 28 (70.0%) | 12 (30.0%) |
| $50,000 to $74,999 | 122 (100.0%) | 0 (0.0%) |
| $75,000 to $99,999 | 58 (65.9%) | 30 (34.1%) |
| $100,000 and over | 535 (99.4%) | 3 (0.6%) |
Public vs Private Health Insurance Coverage by Age in Cedar Crest
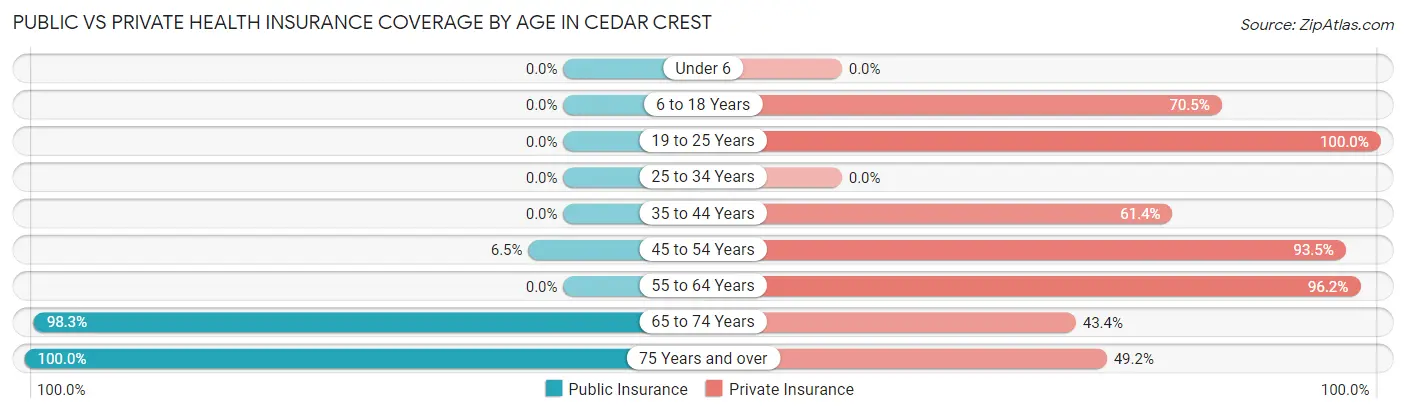
| Age Bracket | Public Insurance | Private Insurance |
| Under 6 | 0 (0.0%) | 0 (0.0%) |
| 6 to 18 Years | 0 (0.0%) | 43 (70.5%) |
| 19 to 25 Years | 0 (0.0%) | 30 (100.0%) |
| 25 to 34 Years | 0 (0.0%) | 0 (0.0%) |
| 35 to 44 Years | 0 (0.0%) | 27 (61.4%) |
| 45 to 54 Years | 8 (6.5%) | 115 (93.5%) |
| 55 to 64 Years | 0 (0.0%) | 304 (96.2%) |
| 65 to 74 Years | 172 (98.3%) | 76 (43.4%) |
| 75 Years and over | 122 (100.0%) | 60 (49.2%) |
| Total | 302 (33.5%) | 655 (72.7%) |
Disability Status by Sex by Age in Cedar Crest
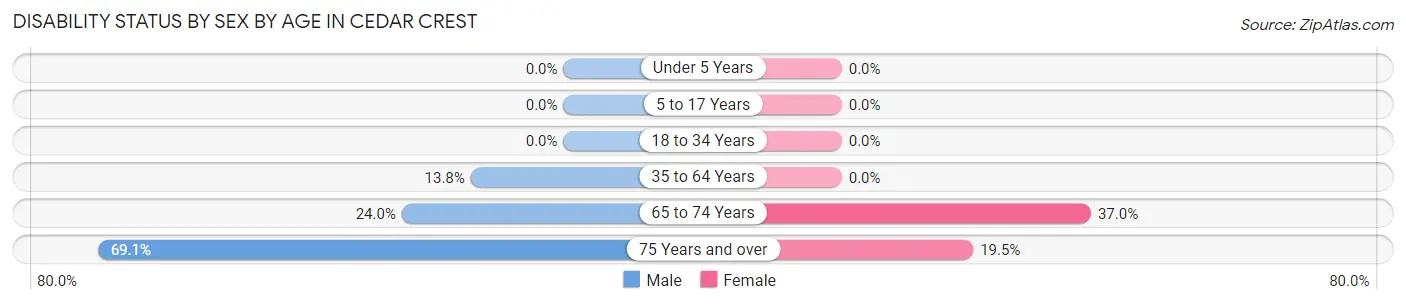
| Age Bracket | Male | Female |
| Under 5 Years | 0 (0.0%) | 0 (0.0%) |
| 5 to 17 Years | 0 (0.0%) | 0 (0.0%) |
| 18 to 34 Years | 0 (0.0%) | 0 (0.0%) |
| 35 to 64 Years | 23 (13.8%) | 0 (0.0%) |
| 65 to 74 Years | 18 (24.0%) | 37 (37.0%) |
| 75 Years and over | 56 (69.1%) | 8 (19.5%) |
Disability Class by Sex by Age in Cedar Crest
Disability Class: Hearing Difficulty
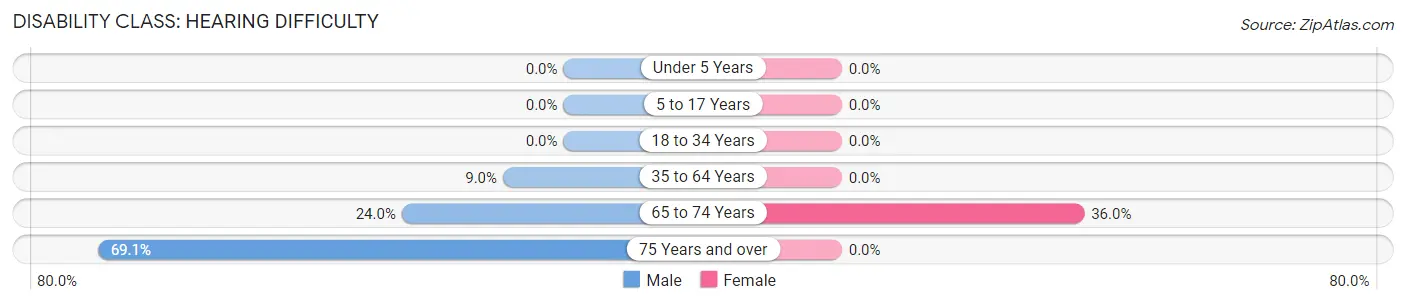
| Age Bracket | Male | Female |
| Under 5 Years | 0 (0.0%) | 0 (0.0%) |
| 5 to 17 Years | 0 (0.0%) | 0 (0.0%) |
| 18 to 34 Years | 0 (0.0%) | 0 (0.0%) |
| 35 to 64 Years | 15 (9.0%) | 0 (0.0%) |
| 65 to 74 Years | 18 (24.0%) | 36 (36.0%) |
| 75 Years and over | 56 (69.1%) | 0 (0.0%) |
Disability Class: Vision Difficulty
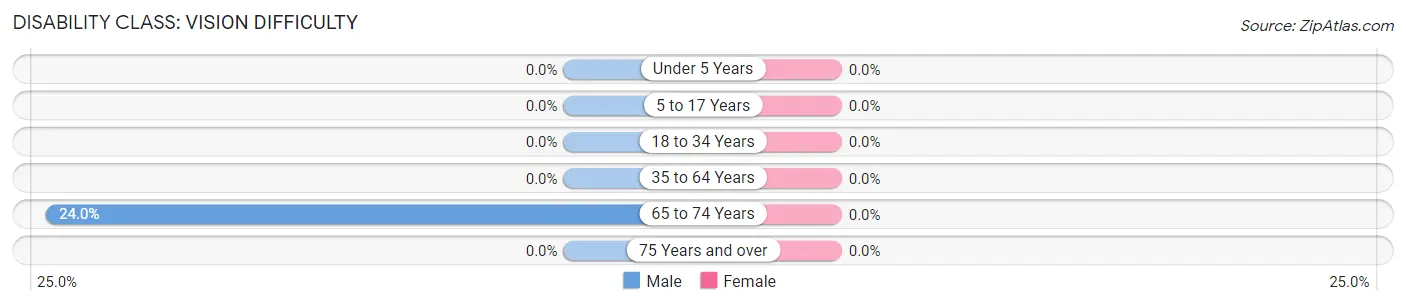
| Age Bracket | Male | Female |
| Under 5 Years | 0 (0.0%) | 0 (0.0%) |
| 5 to 17 Years | 0 (0.0%) | 0 (0.0%) |
| 18 to 34 Years | 0 (0.0%) | 0 (0.0%) |
| 35 to 64 Years | 0 (0.0%) | 0 (0.0%) |
| 65 to 74 Years | 18 (24.0%) | 0 (0.0%) |
| 75 Years and over | 0 (0.0%) | 0 (0.0%) |
Disability Class: Cognitive Difficulty
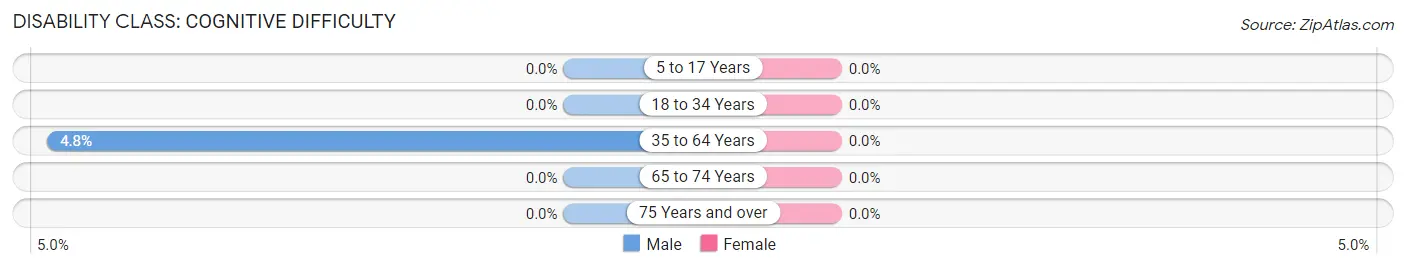
| Age Bracket | Male | Female |
| 5 to 17 Years | 0 (0.0%) | 0 (0.0%) |
| 18 to 34 Years | 0 (0.0%) | 0 (0.0%) |
| 35 to 64 Years | 8 (4.8%) | 0 (0.0%) |
| 65 to 74 Years | 0 (0.0%) | 0 (0.0%) |
| 75 Years and over | 0 (0.0%) | 0 (0.0%) |
Disability Class: Ambulatory Difficulty
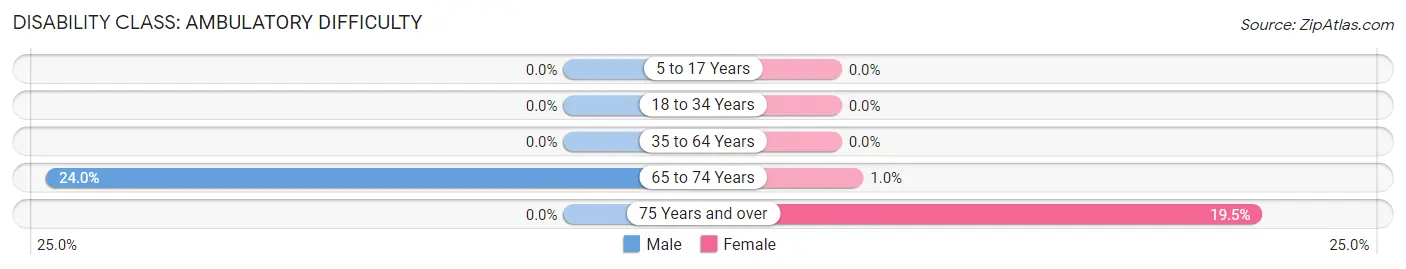
| Age Bracket | Male | Female |
| 5 to 17 Years | 0 (0.0%) | 0 (0.0%) |
| 18 to 34 Years | 0 (0.0%) | 0 (0.0%) |
| 35 to 64 Years | 0 (0.0%) | 0 (0.0%) |
| 65 to 74 Years | 18 (24.0%) | 1 (1.0%) |
| 75 Years and over | 0 (0.0%) | 8 (19.5%) |
Disability Class: Self-Care Difficulty
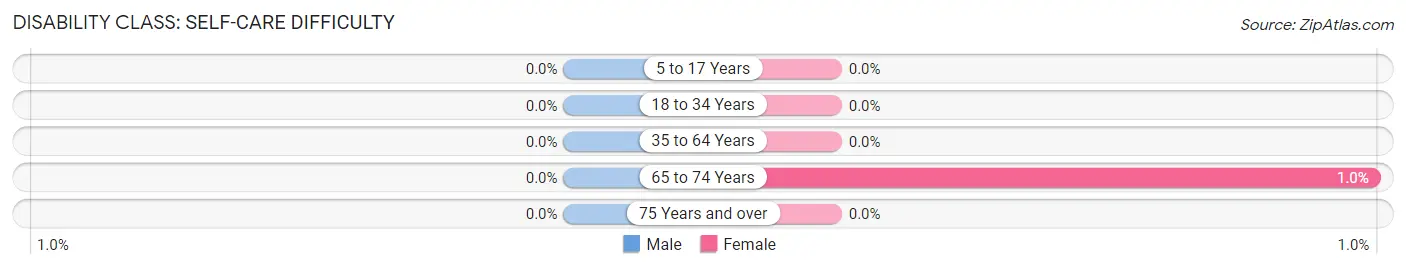
| Age Bracket | Male | Female |
| 5 to 17 Years | 0 (0.0%) | 0 (0.0%) |
| 18 to 34 Years | 0 (0.0%) | 0 (0.0%) |
| 35 to 64 Years | 0 (0.0%) | 0 (0.0%) |
| 65 to 74 Years | 0 (0.0%) | 1 (1.0%) |
| 75 Years and over | 0 (0.0%) | 0 (0.0%) |
Technology Access in Cedar Crest
Computing Device Access in Cedar Crest
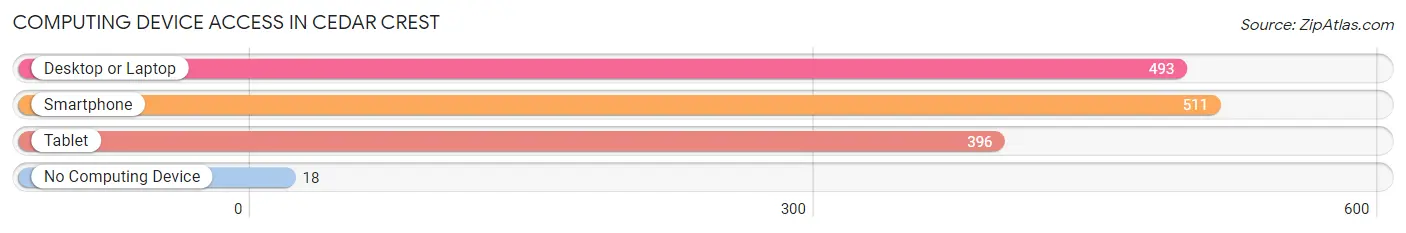
| Device Type | # Households | % Households |
| Desktop or Laptop | 493 | 88.5% |
| Smartphone | 511 | 91.7% |
| Tablet | 396 | 71.1% |
| No Computing Device | 18 | 3.2% |
| Total | 557 | 100.0% |
Internet Access in Cedar Crest
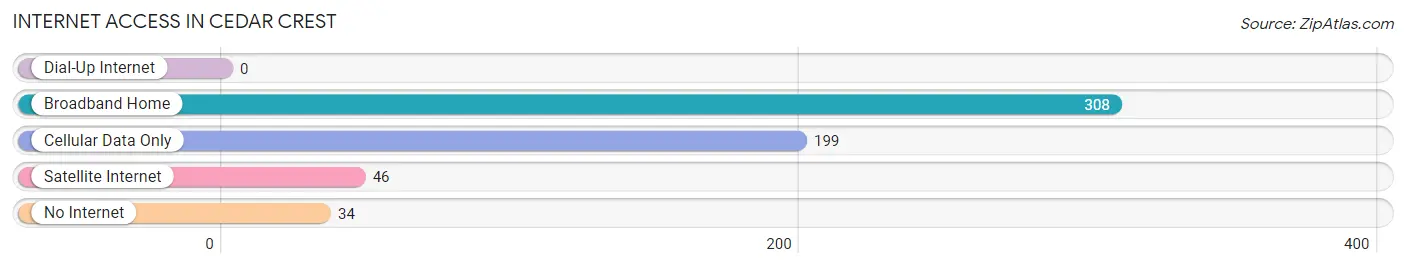
| Internet Type | # Households | % Households |
| Dial-Up Internet | 0 | 0.0% |
| Broadband Home | 308 | 55.3% |
| Cellular Data Only | 199 | 35.7% |
| Satellite Internet | 46 | 8.3% |
| No Internet | 34 | 6.1% |
| Total | 557 | 100.0% |
Cedar Crest Summary
Cedar Crest is a small unincorporated community located in the Sandia Mountains of Bernalillo County, New Mexico. It is situated at an elevation of 6,890 feet and is located approximately 15 miles northeast of Albuquerque. The community is home to a population of approximately 1,000 people and is known for its scenic beauty and outdoor recreational opportunities.
History
The area that is now Cedar Crest was originally inhabited by the Pueblo Indians. The first European settlers arrived in the area in the late 1800s and established a small farming community. The community was named Cedar Crest in the early 1900s after the abundance of cedar trees in the area.
In the early 1900s, the community began to grow and develop. The first post office was established in 1910 and the first school was built in 1912. The community also had a general store, a blacksmith shop, and a few other businesses.
In the 1950s, the community began to experience a population boom as people moved to the area to take advantage of the scenic beauty and outdoor recreational opportunities. The population of Cedar Crest peaked in the 1970s and has remained relatively stable since then.
Geography
Cedar Crest is located in the Sandia Mountains of Bernalillo County, New Mexico. The community is situated at an elevation of 6,890 feet and is located approximately 15 miles northeast of Albuquerque. The area is characterized by its mountainous terrain and is home to a variety of wildlife, including deer, elk, and bears.
The climate in Cedar Crest is semi-arid with hot summers and cold winters. The average annual temperature is approximately 55 degrees Fahrenheit and the average annual precipitation is approximately 12 inches.
Economy
The economy of Cedar Crest is largely based on tourism and outdoor recreation. The community is home to a variety of outdoor activities, including hiking, camping, fishing, and skiing. The nearby Sandia Mountains offer a variety of trails and scenic views.
The community is also home to a few small businesses, including a general store, a restaurant, and a few other shops. The community is also home to a few small manufacturing companies.
Demographics
As of the 2010 census, the population of Cedar Crest was 1,000. The racial makeup of the community was 94.2% White, 0.7% African American, 0.7% Native American, 0.7% Asian, 0.3% Pacific Islander, and 3.3% from other races. The median household income was $45,000 and the median family income was $50,000.
Conclusion
Cedar Crest is a small unincorporated community located in the Sandia Mountains of Bernalillo County, New Mexico. The community is home to a population of approximately 1,000 people and is known for its scenic beauty and outdoor recreational opportunities. The economy of Cedar Crest is largely based on tourism and outdoor recreation and the community is home to a variety of small businesses. The population of Cedar Crest is predominantly White and the median household income is approximately $45,000.
Common Questions
What is Per Capita Income in Cedar Crest?
Per Capita income in Cedar Crest is $60,849.
What is the Median Family Income in Cedar Crest?
Median Family Income in Cedar Crest is $215,027.
What is the Median Household income in Cedar Crest?
Median Household Income in Cedar Crest is $106,550.
What is Income or Wage Gap in Cedar Crest?
Income or Wage Gap in Cedar Crest is 5.3%.
Women in Cedar Crest earn 94.7 cents for every dollar earned by a man.
What is Inequality or Gini Index in Cedar Crest?
Inequality or Gini Index in Cedar Crest is 0.35.
What is the Total Population of Cedar Crest?
Total Population of Cedar Crest is 919.
What is the Total Male Population of Cedar Crest?
Total Male Population of Cedar Crest is 398.
What is the Total Female Population of Cedar Crest?
Total Female Population of Cedar Crest is 521.
What is the Ratio of Males per 100 Females in Cedar Crest?
There are 76.39 Males per 100 Females in Cedar Crest.
What is the Ratio of Females per 100 Males in Cedar Crest?
There are 130.90 Females per 100 Males in Cedar Crest.
What is the Median Population Age in Cedar Crest?
Median Population Age in Cedar Crest is 58.5 Years.
What is the Average Family Size in Cedar Crest
Average Family Size in Cedar Crest is 2.1 People.
What is the Average Household Size in Cedar Crest
Average Household Size in Cedar Crest is 1.6 People.
How Large is the Labor Force in Cedar Crest?
There are 452 People in the Labor Forcein in Cedar Crest.
What is the Percentage of People in the Labor Force in Cedar Crest?
50.7% of People are in the Labor Force in Cedar Crest.
What is the Unemployment Rate in Cedar Crest?
Unemployment Rate in Cedar Crest is 6.6%.