Carlsbad, NM Map & Demographics
Carlsbad Map
Carlsbad Overview
$36,262
PER CAPITA INCOME
$96,182
AVG FAMILY INCOME
$77,209
AVG HOUSEHOLD INCOME
48.0%
WAGE / INCOME GAP [ % ]
52.0¢/ $1
WAGE / INCOME GAP [ $ ]
$10,053
FAMILY INCOME DEFICIT
0.43
INEQUALITY / GINI INDEX
31,755
TOTAL POPULATION
16,051
MALE POPULATION
15,704
FEMALE POPULATION
102.21
MALES / 100 FEMALES
97.84
FEMALES / 100 MALES
35.0
MEDIAN AGE
3.2
AVG FAMILY SIZE
2.6
AVG HOUSEHOLD SIZE
14,788
LABOR FORCE [ PEOPLE ]
59.4%
PERCENT IN LABOR FORCE
3.0%
UNEMPLOYMENT RATE
Carlsbad Zip Codes
Income in Carlsbad
Income Overview in Carlsbad
Per Capita Income in Carlsbad is $36,262, while median incomes of families and households are $96,182 and $77,209 respectively.
| Characteristic | Number | Measure |
| Per Capita Income | 31,755 | $36,262 |
| Median Family Income | 7,907 | $96,182 |
| Mean Family Income | 7,907 | $112,227 |
| Median Household Income | 11,772 | $77,209 |
| Mean Household Income | 11,772 | $95,049 |
| Income Deficit | 7,907 | $10,053 |
| Wage / Income Gap (%) | 31,755 | 47.97% |
| Wage / Income Gap ($) | 31,755 | 52.03¢ per $1 |
| Gini / Inequality Index | 31,755 | 0.43 |
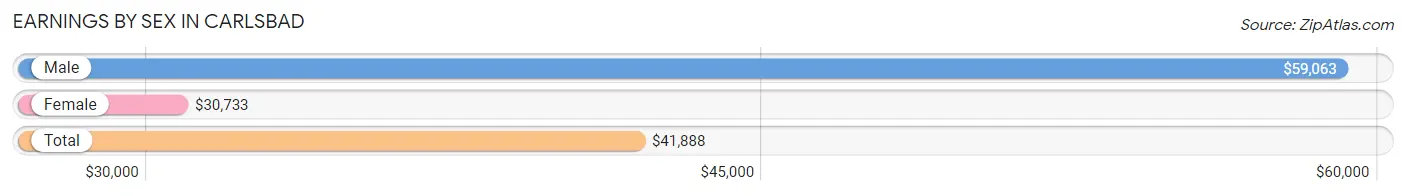
Earnings by Sex in Carlsbad
Average Earnings in Carlsbad are $41,888, $59,063 for men and $30,733 for women, a difference of 48.0%.
| Sex | Number | Average Earnings |
| Male | 9,489 (59.7%) | $59,063 |
| Female | 6,410 (40.3%) | $30,733 |
| Total | 15,899 (100.0%) | $41,888 |
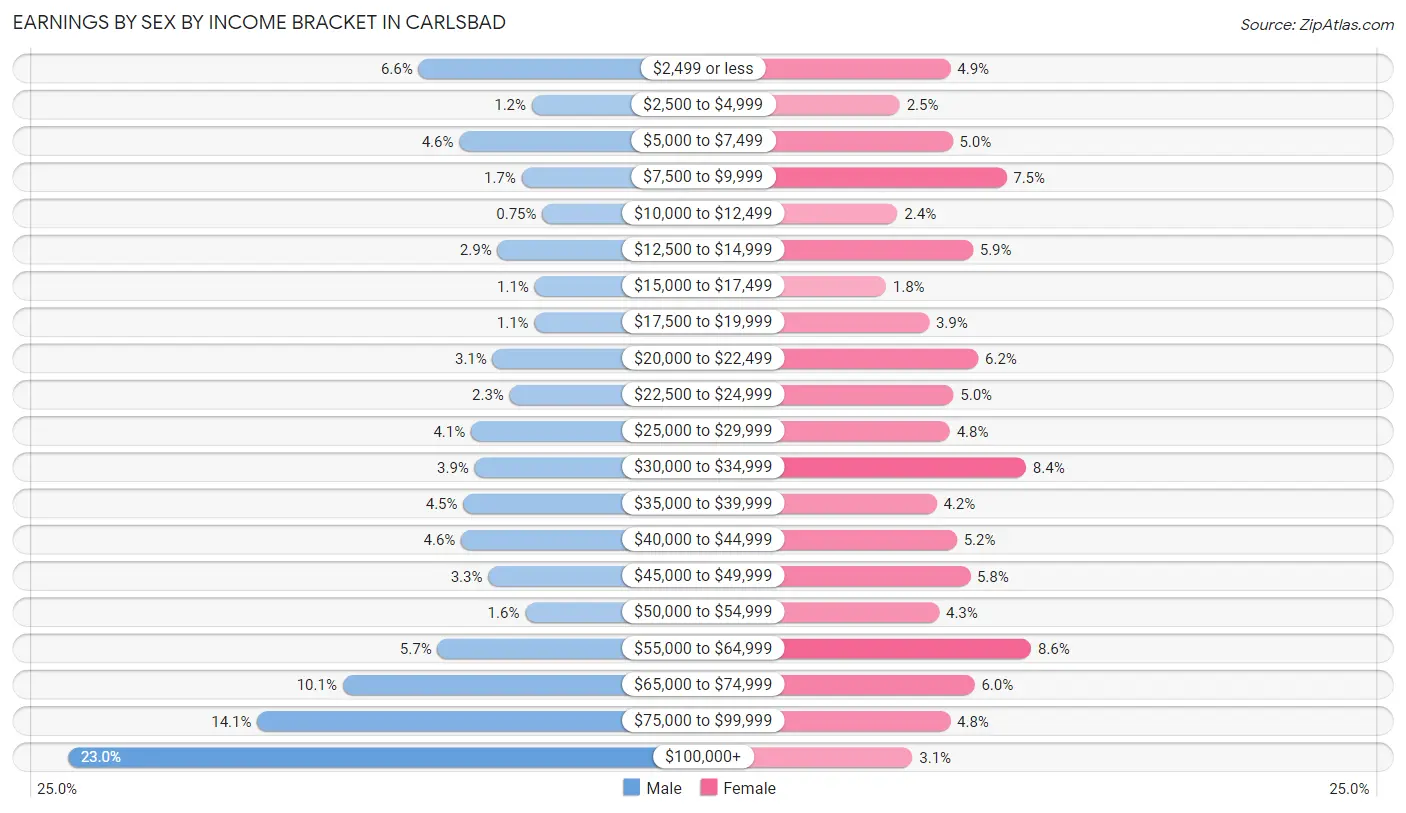
Earnings by Sex by Income Bracket in Carlsbad
The most common earnings brackets in Carlsbad are $100,000+ for men (2,181 | 23.0%) and $55,000 to $64,999 for women (553 | 8.6%).
| Income | Male | Female |
| $2,499 or less | 622 (6.6%) | 311 (4.9%) |
| $2,500 to $4,999 | 118 (1.2%) | 159 (2.5%) |
| $5,000 to $7,499 | 440 (4.6%) | 317 (5.0%) |
| $7,500 to $9,999 | 163 (1.7%) | 479 (7.5%) |
| $10,000 to $12,499 | 71 (0.7%) | 152 (2.4%) |
| $12,500 to $14,999 | 270 (2.9%) | 378 (5.9%) |
| $15,000 to $17,499 | 105 (1.1%) | 117 (1.8%) |
| $17,500 to $19,999 | 106 (1.1%) | 247 (3.8%) |
| $20,000 to $22,499 | 292 (3.1%) | 394 (6.1%) |
| $22,500 to $24,999 | 216 (2.3%) | 320 (5.0%) |
| $25,000 to $29,999 | 388 (4.1%) | 309 (4.8%) |
| $30,000 to $34,999 | 372 (3.9%) | 538 (8.4%) |
| $35,000 to $39,999 | 422 (4.4%) | 269 (4.2%) |
| $40,000 to $44,999 | 432 (4.5%) | 330 (5.1%) |
| $45,000 to $49,999 | 311 (3.3%) | 370 (5.8%) |
| $50,000 to $54,999 | 147 (1.5%) | 277 (4.3%) |
| $55,000 to $64,999 | 537 (5.7%) | 553 (8.6%) |
| $65,000 to $74,999 | 958 (10.1%) | 383 (6.0%) |
| $75,000 to $99,999 | 1,338 (14.1%) | 310 (4.8%) |
| $100,000+ | 2,181 (23.0%) | 197 (3.1%) |
| Total | 9,489 (100.0%) | 6,410 (100.0%) |
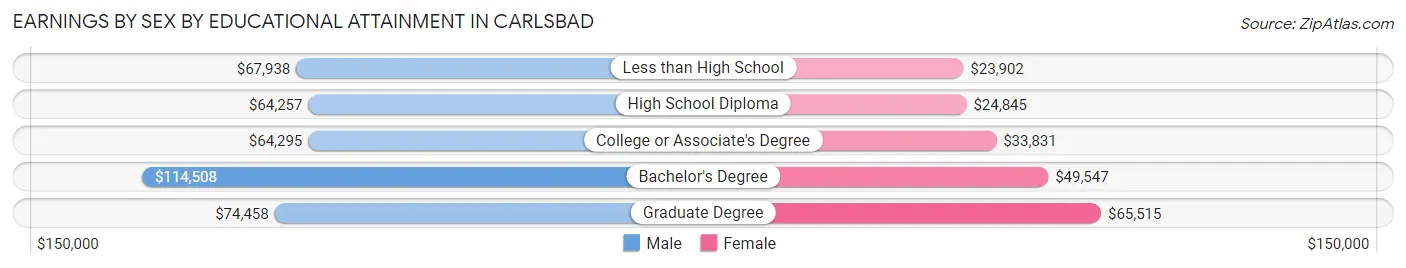
Earnings by Sex by Educational Attainment in Carlsbad
Average earnings in Carlsbad are $70,276 for men and $34,922 for women, a difference of 50.3%. Men with an educational attainment of bachelor's degree enjoy the highest average annual earnings of $114,508, while those with high school diploma education earn the least with $64,257. Women with an educational attainment of graduate degree earn the most with the average annual earnings of $65,515, while those with less than high school education have the smallest earnings of $23,902.
| Educational Attainment | Male Income | Female Income |
| Less than High School | $67,938 | $23,902 |
| High School Diploma | $64,257 | $24,845 |
| College or Associate's Degree | $64,295 | $33,831 |
| Bachelor's Degree | $114,508 | $49,547 |
| Graduate Degree | $74,458 | $65,515 |
| Total | $70,276 | $34,922 |
Family Income in Carlsbad
Family Income Brackets in Carlsbad
According to the Carlsbad family income data, there are 1,811 families falling into the $100,000 to $149,999 income range, which is the most common income bracket and makes up 22.9% of all families. Conversely, the $10,000 to $14,999 income bracket is the least frequent group with only 55 families (0.7%) belonging to this category.
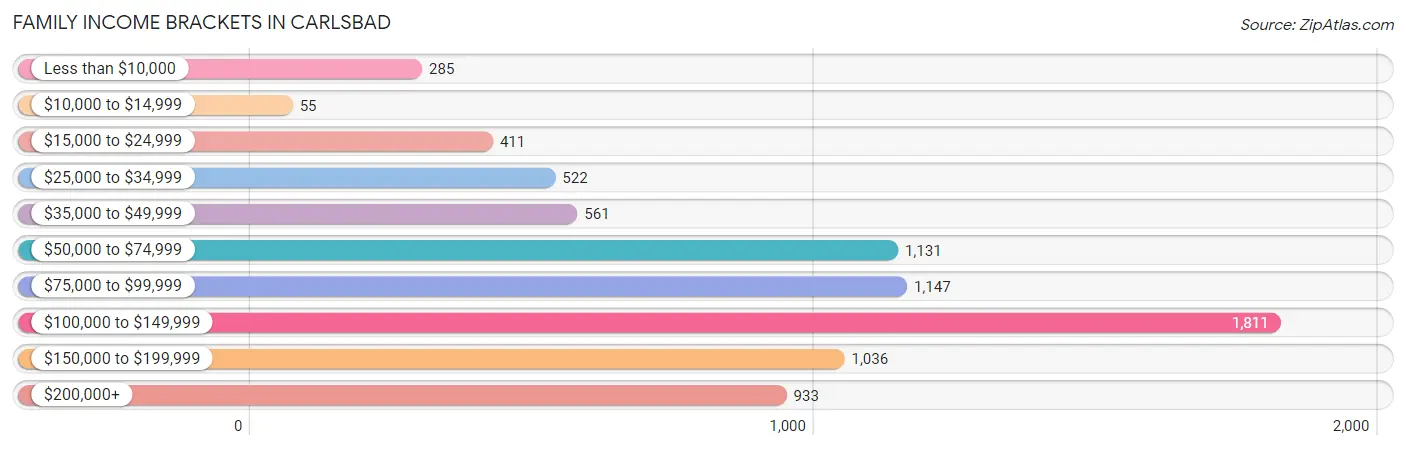
| Income Bracket | # Families | % Families |
| Less than $10,000 | 285 | 3.6% |
| $10,000 to $14,999 | 55 | 0.7% |
| $15,000 to $24,999 | 411 | 5.2% |
| $25,000 to $34,999 | 522 | 6.6% |
| $35,000 to $49,999 | 561 | 7.1% |
| $50,000 to $74,999 | 1,131 | 14.3% |
| $75,000 to $99,999 | 1,147 | 14.5% |
| $100,000 to $149,999 | 1,811 | 22.9% |
| $150,000 to $199,999 | 1,036 | 13.1% |
| $200,000+ | 933 | 11.8% |
Family Income by Famaliy Size in Carlsbad
6-person families (275 | 3.5%) account for the highest median family income in Carlsbad with $236,105 per family, while 2-person families (3,797 | 48.0%) have the highest median income of $41,444 per family member.
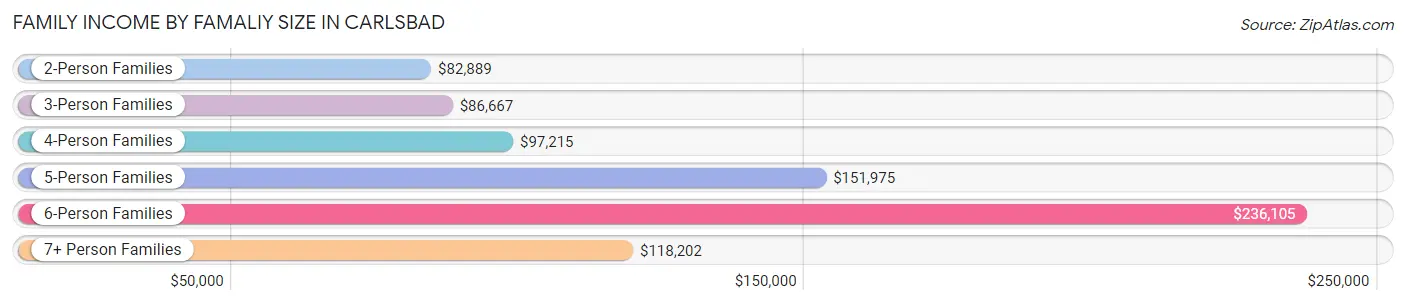
| Income Bracket | # Families | Median Income |
| 2-Person Families | 3,797 (48.0%) | $82,889 |
| 3-Person Families | 1,684 (21.3%) | $86,667 |
| 4-Person Families | 1,247 (15.8%) | $97,215 |
| 5-Person Families | 743 (9.4%) | $151,975 |
| 6-Person Families | 275 (3.5%) | $236,105 |
| 7+ Person Families | 161 (2.0%) | $118,202 |
| Total | 7,907 (100.0%) | $96,182 |
Family Income by Number of Earners in Carlsbad
The median family income in Carlsbad is $96,182, with families comprising 3+ earners (757) having the highest median family income of $151,730, while families with no earners (1,058) have the lowest median family income of $55,455, accounting for 9.6% and 13.4% of families, respectively.
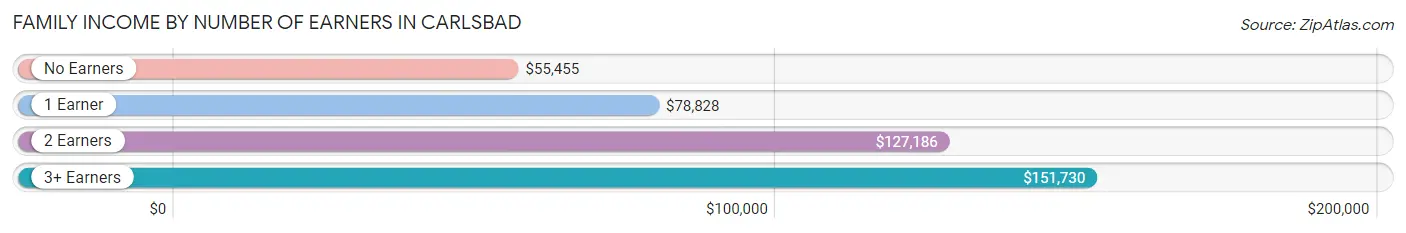
| Number of Earners | # Families | Median Income |
| No Earners | 1,058 (13.4%) | $55,455 |
| 1 Earner | 3,015 (38.1%) | $78,828 |
| 2 Earners | 3,077 (38.9%) | $127,186 |
| 3+ Earners | 757 (9.6%) | $151,730 |
| Total | 7,907 (100.0%) | $96,182 |
Household Income in Carlsbad
Household Income Brackets in Carlsbad
With 2,037 households falling in the category, the $100,000 to $149,999 income range is the most frequent in Carlsbad, accounting for 17.3% of all households. In contrast, only 530 households (4.5%) fall into the $10,000 to $14,999 income bracket, making it the least populous group.
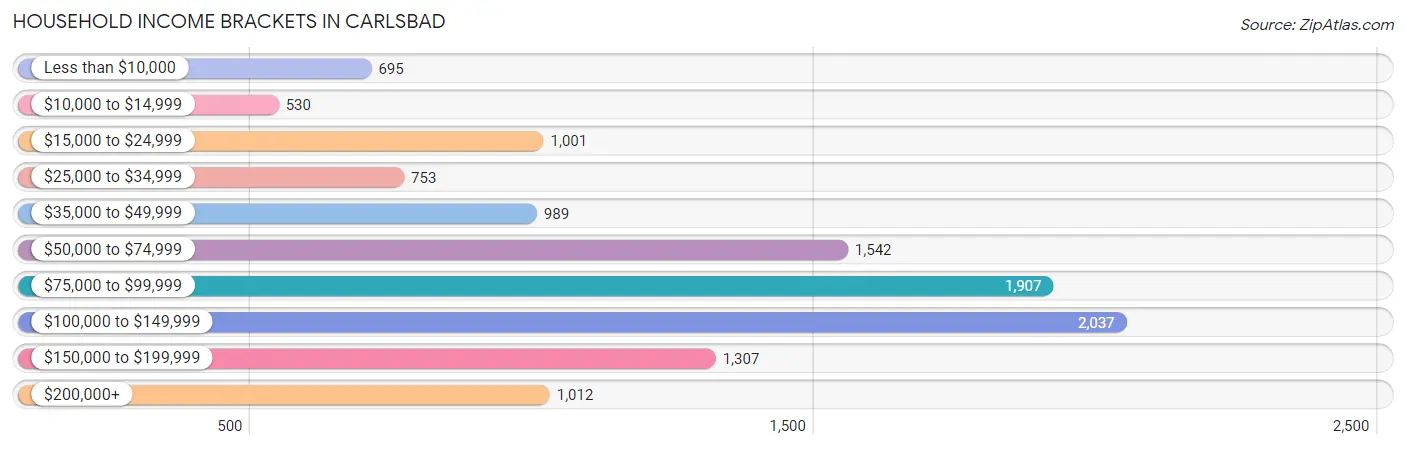
| Income Bracket | # Households | % Households |
| Less than $10,000 | 695 | 5.9% |
| $10,000 to $14,999 | 530 | 4.5% |
| $15,000 to $24,999 | 1,001 | 8.5% |
| $25,000 to $34,999 | 753 | 6.4% |
| $35,000 to $49,999 | 989 | 8.4% |
| $50,000 to $74,999 | 1,542 | 13.1% |
| $75,000 to $99,999 | 1,907 | 16.2% |
| $100,000 to $149,999 | 2,037 | 17.3% |
| $150,000 to $199,999 | 1,307 | 11.1% |
| $200,000+ | 1,012 | 8.6% |
Household Income by Householder Age in Carlsbad
The median household income in Carlsbad is $77,209, with the highest median household income of $91,883 found in the 25 to 44 years age bracket for the primary householder. A total of 4,133 households (35.1%) fall into this category. Meanwhile, the 15 to 24 years age bracket for the primary householder has the lowest median household income of $43,731, with 396 households (3.4%) in this group.
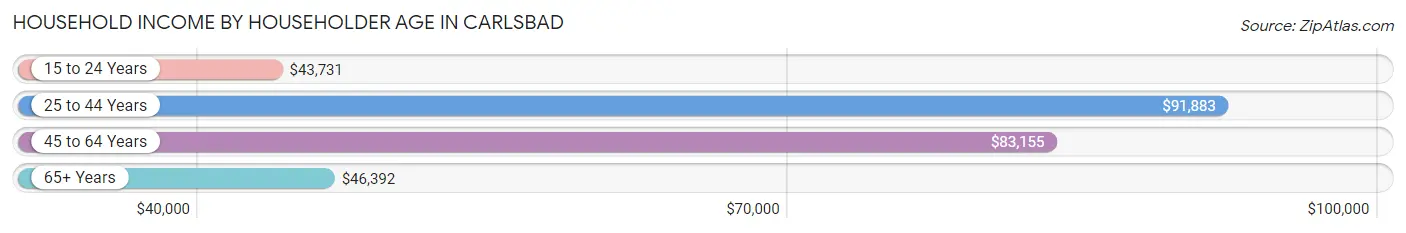
| Income Bracket | # Households | Median Income |
| 15 to 24 Years | 396 (3.4%) | $43,731 |
| 25 to 44 Years | 4,133 (35.1%) | $91,883 |
| 45 to 64 Years | 4,046 (34.4%) | $83,155 |
| 65+ Years | 3,197 (27.2%) | $46,392 |
| Total | 11,772 (100.0%) | $77,209 |
Poverty in Carlsbad
Income Below Poverty by Sex and Age in Carlsbad
With 10.4% poverty level for males and 16.1% for females among the residents of Carlsbad, 16 and 17 year old males and 15 year old females are the most vulnerable to poverty, with 176 males (31.6%) and 44 females (24.6%) in their respective age groups living below the poverty level.
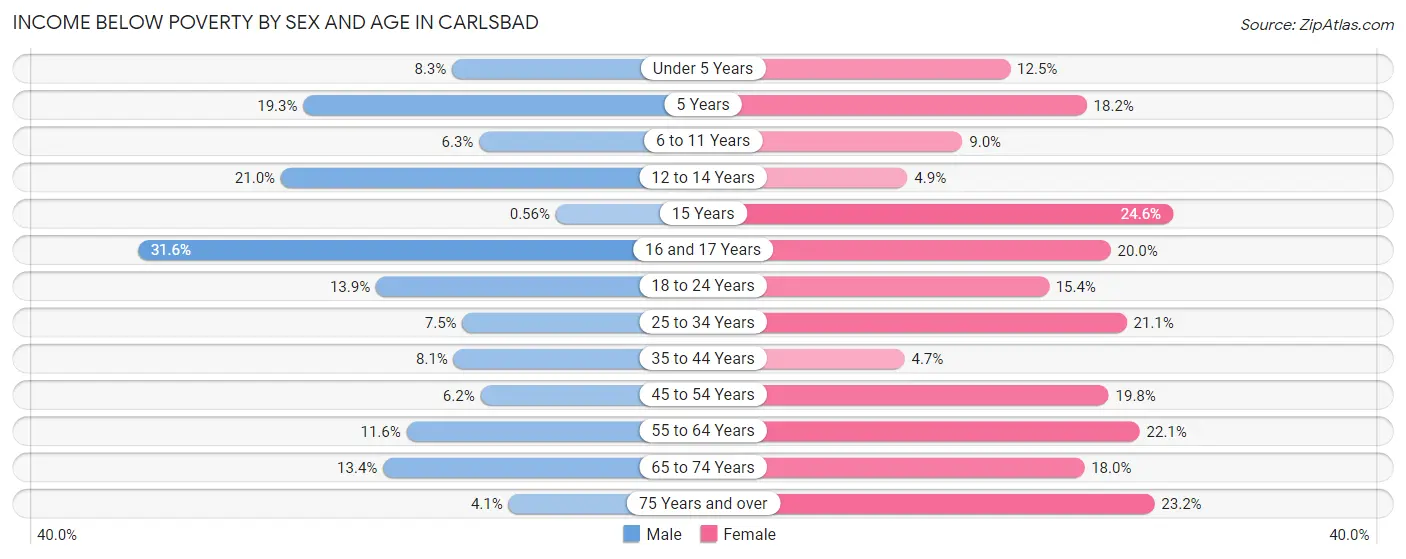
| Age Bracket | Male | Female |
| Under 5 Years | 99 (8.3%) | 155 (12.5%) |
| 5 Years | 28 (19.3%) | 28 (18.2%) |
| 6 to 11 Years | 67 (6.2%) | 128 (8.9%) |
| 12 to 14 Years | 126 (21.0%) | 28 (4.9%) |
| 15 Years | 1 (0.6%) | 44 (24.6%) |
| 16 and 17 Years | 176 (31.6%) | 109 (20.0%) |
| 18 to 24 Years | 235 (13.9%) | 223 (15.4%) |
| 25 to 34 Years | 180 (7.5%) | 459 (21.1%) |
| 35 to 44 Years | 177 (8.1%) | 85 (4.7%) |
| 45 to 54 Years | 104 (6.1%) | 267 (19.8%) |
| 55 to 64 Years | 217 (11.6%) | 446 (22.1%) |
| 65 to 74 Years | 206 (13.4%) | 255 (18.0%) |
| 75 Years and over | 25 (4.1%) | 269 (23.2%) |
| Total | 1,641 (10.4%) | 2,496 (16.1%) |
Income Above Poverty by Sex and Age in Carlsbad
According to the poverty statistics in Carlsbad, males aged 15 years and females aged 35 to 44 years are the age groups that are most secure financially, with 99.4% of males and 95.3% of females in these age groups living above the poverty line.
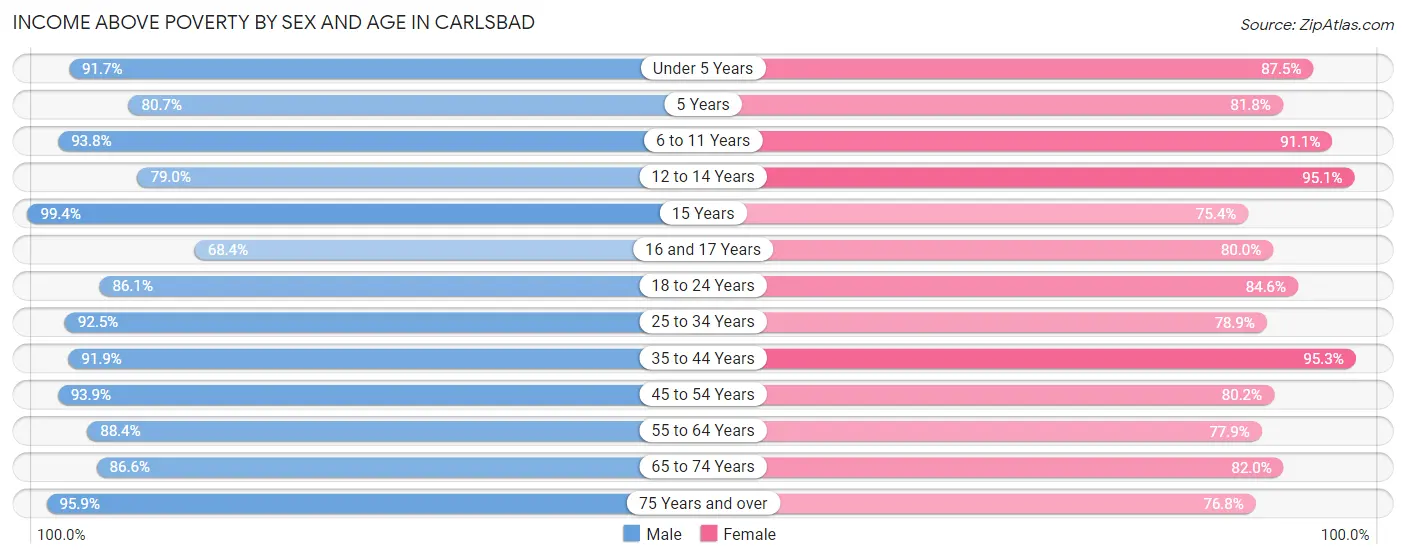
| Age Bracket | Male | Female |
| Under 5 Years | 1,099 (91.7%) | 1,085 (87.5%) |
| 5 Years | 117 (80.7%) | 126 (81.8%) |
| 6 to 11 Years | 1,005 (93.8%) | 1,302 (91.0%) |
| 12 to 14 Years | 475 (79.0%) | 547 (95.1%) |
| 15 Years | 176 (99.4%) | 135 (75.4%) |
| 16 and 17 Years | 381 (68.4%) | 437 (80.0%) |
| 18 to 24 Years | 1,454 (86.1%) | 1,229 (84.6%) |
| 25 to 34 Years | 2,222 (92.5%) | 1,712 (78.9%) |
| 35 to 44 Years | 1,998 (91.9%) | 1,739 (95.3%) |
| 45 to 54 Years | 1,586 (93.9%) | 1,081 (80.2%) |
| 55 to 64 Years | 1,647 (88.4%) | 1,571 (77.9%) |
| 65 to 74 Years | 1,334 (86.6%) | 1,162 (82.0%) |
| 75 Years and over | 589 (95.9%) | 890 (76.8%) |
| Total | 14,083 (89.6%) | 13,016 (83.9%) |
Income Below Poverty Among Married-Couple Families in Carlsbad
The poverty statistics for married-couple families in Carlsbad show that 2.3% or 126 of the total 5,447 families live below the poverty line. Families with 1 or 2 children have the highest poverty rate of 2.7%, comprising of 51 families. On the other hand, families with 3 or 4 children have the lowest poverty rate of 0.0%, which includes 0 families.
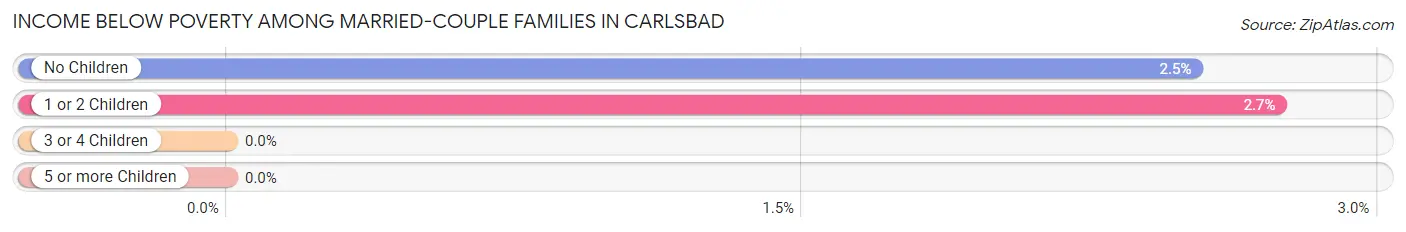
| Children | Above Poverty | Below Poverty |
| No Children | 2,903 (97.5%) | 75 (2.5%) |
| 1 or 2 Children | 1,809 (97.3%) | 51 (2.7%) |
| 3 or 4 Children | 508 (100.0%) | 0 (0.0%) |
| 5 or more Children | 101 (100.0%) | 0 (0.0%) |
| Total | 5,321 (97.7%) | 126 (2.3%) |
Income Below Poverty Among Single-Parent Households in Carlsbad
According to the poverty data in Carlsbad, 19.5% or 184 single-father households and 22.2% or 336 single-mother households are living below the poverty line. Among single-father households, those with 1 or 2 children have the highest poverty rate, with 184 households (34.5%) experiencing poverty. Likewise, among single-mother households, those with 5 or more children have the highest poverty rate, with 30 households (100.0%) falling below the poverty line.
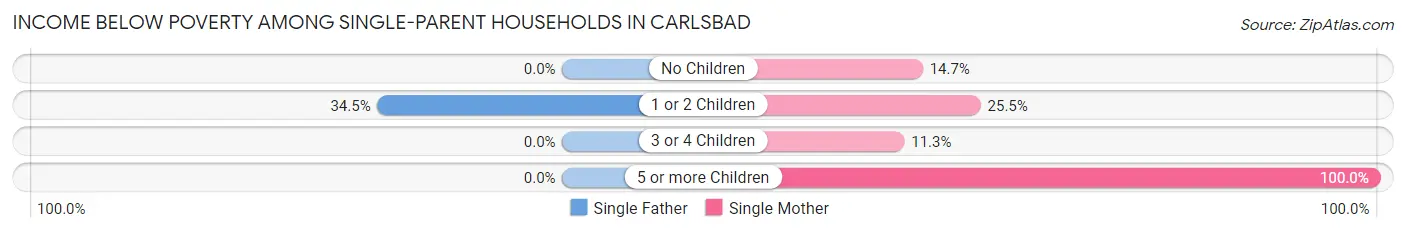
| Children | Single Father | Single Mother |
| No Children | 0 (0.0%) | 88 (14.7%) |
| 1 or 2 Children | 184 (34.5%) | 211 (25.5%) |
| 3 or 4 Children | 0 (0.0%) | 7 (11.3%) |
| 5 or more Children | 0 (0.0%) | 30 (100.0%) |
| Total | 184 (19.5%) | 336 (22.2%) |
Income Below Poverty Among Married-Couple vs Single-Parent Households in Carlsbad
The poverty data for Carlsbad shows that 126 of the married-couple family households (2.3%) and 520 of the single-parent households (21.1%) are living below the poverty level. Within the married-couple family households, those with 1 or 2 children have the highest poverty rate, with 51 households (2.7%) falling below the poverty line. Among the single-parent households, those with 5 or more children have the highest poverty rate, with 30 household (76.9%) living below poverty.
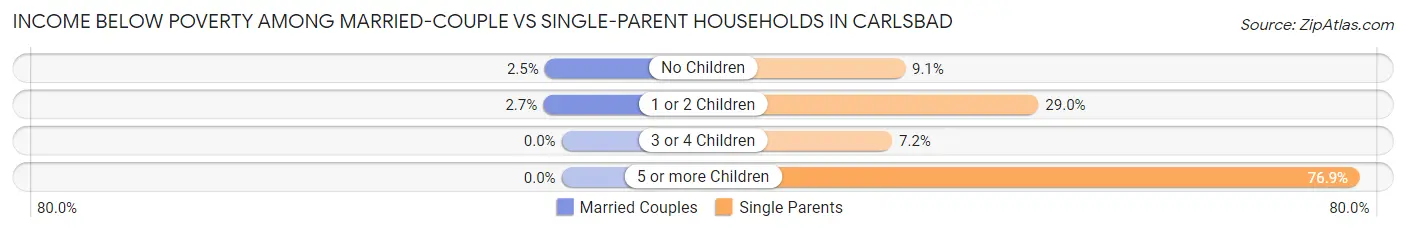
| Children | Married-Couple Families | Single-Parent Households |
| No Children | 75 (2.5%) | 88 (9.1%) |
| 1 or 2 Children | 51 (2.7%) | 395 (29.0%) |
| 3 or 4 Children | 0 (0.0%) | 7 (7.2%) |
| 5 or more Children | 0 (0.0%) | 30 (76.9%) |
| Total | 126 (2.3%) | 520 (21.1%) |
Race in Carlsbad
The most populous races in Carlsbad are White / Caucasian (21,042 | 66.3%), Hispanic or Latino (18,073 | 56.9%), and Two or more Races (6,025 | 19.0%).
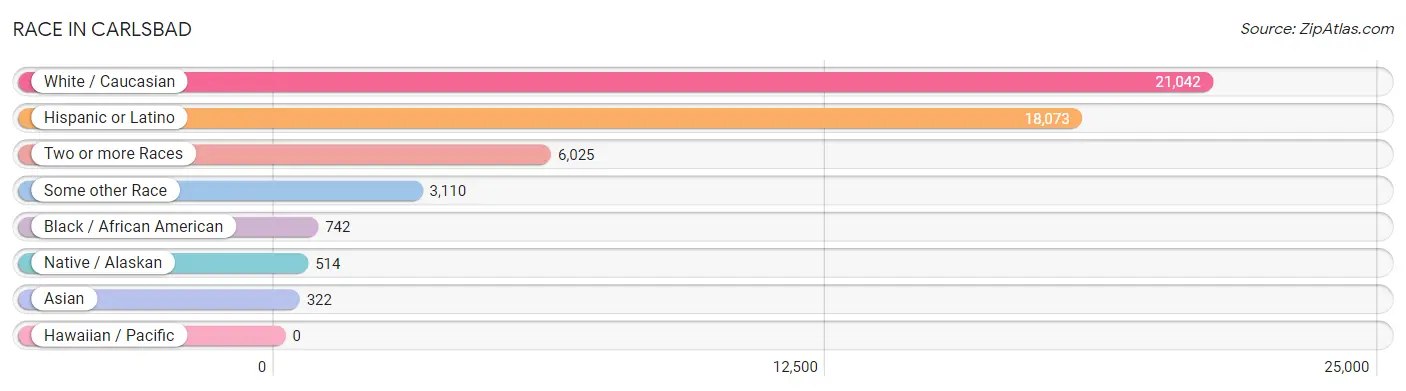
| Race | # Population | % Population |
| Asian | 322 | 1.0% |
| Black / African American | 742 | 2.3% |
| Hawaiian / Pacific | 0 | 0.0% |
| Hispanic or Latino | 18,073 | 56.9% |
| Native / Alaskan | 514 | 1.6% |
| White / Caucasian | 21,042 | 66.3% |
| Two or more Races | 6,025 | 19.0% |
| Some other Race | 3,110 | 9.8% |
| Total | 31,755 | 100.0% |
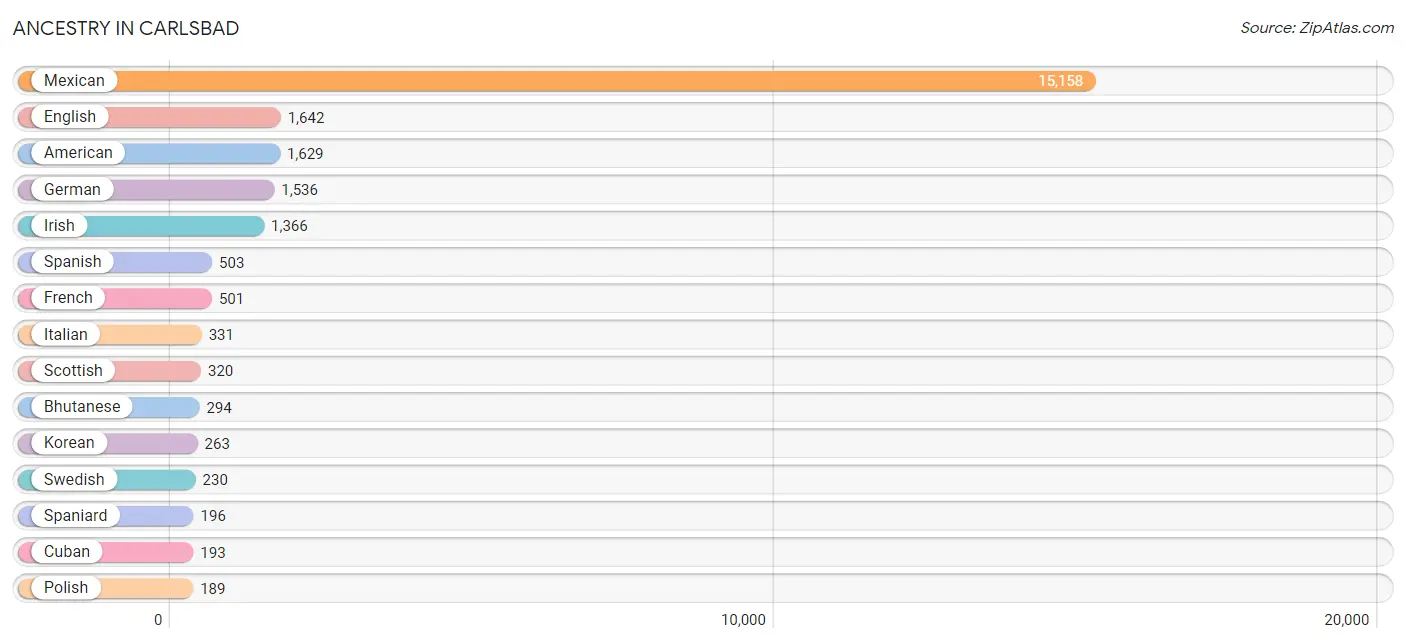
Ancestry in Carlsbad
The most populous ancestries reported in Carlsbad are Mexican (15,158 | 47.7%), English (1,642 | 5.2%), American (1,629 | 5.1%), German (1,536 | 4.8%), and Irish (1,366 | 4.3%), together accounting for 67.2% of all Carlsbad residents.
| Ancestry | # Population | % Population |
| African | 26 | 0.1% |
| Alaska Native | 10 | 0.0% |
| American | 1,629 | 5.1% |
| Apache | 7 | 0.0% |
| Austrian | 7 | 0.0% |
| Bhutanese | 294 | 0.9% |
| British | 43 | 0.1% |
| Central American | 79 | 0.3% |
| Cherokee | 132 | 0.4% |
| Choctaw | 5 | 0.0% |
| Colombian | 21 | 0.1% |
| Comanche | 5 | 0.0% |
| Creek | 8 | 0.0% |
| Cuban | 193 | 0.6% |
| Czech | 79 | 0.3% |
| Danish | 35 | 0.1% |
| Dominican | 64 | 0.2% |
| Dutch | 62 | 0.2% |
| Dutch West Indian | 10 | 0.0% |
| Eastern European | 24 | 0.1% |
| English | 1,642 | 5.2% |
| European | 131 | 0.4% |
| Finnish | 72 | 0.2% |
| French | 501 | 1.6% |
| French Canadian | 29 | 0.1% |
| German | 1,536 | 4.8% |
| Greek | 20 | 0.1% |
| Honduran | 79 | 0.3% |
| Hopi | 30 | 0.1% |
| Indian (Asian) | 45 | 0.1% |
| Indonesian | 10 | 0.0% |
| Irish | 1,366 | 4.3% |
| Italian | 331 | 1.0% |
| Korean | 263 | 0.8% |
| Lithuanian | 14 | 0.0% |
| Mexican | 15,158 | 47.7% |
| Navajo | 61 | 0.2% |
| Northern European | 4 | 0.0% |
| Norwegian | 87 | 0.3% |
| Polish | 189 | 0.6% |
| Portuguese | 5 | 0.0% |
| Pueblo | 177 | 0.6% |
| Puerto Rican | 53 | 0.2% |
| Russian | 29 | 0.1% |
| Scandinavian | 61 | 0.2% |
| Scotch-Irish | 123 | 0.4% |
| Scottish | 320 | 1.0% |
| Sioux | 1 | 0.0% |
| Slovene | 29 | 0.1% |
| South American | 42 | 0.1% |
| Spaniard | 196 | 0.6% |
| Spanish | 503 | 1.6% |
| Spanish American | 42 | 0.1% |
| Sri Lankan | 16 | 0.1% |
| Subsaharan African | 26 | 0.1% |
| Swedish | 230 | 0.7% |
| Swiss | 35 | 0.1% |
| Thai | 24 | 0.1% |
| Welsh | 73 | 0.2% |
| Yaqui | 113 | 0.4% | View All 60 Rows |
Immigrants in Carlsbad
The most numerous immigrant groups reported in Carlsbad came from Latin America (1,404 | 4.4%), Central America (1,307 | 4.1%), Mexico (1,228 | 3.9%), Asia (240 | 0.8%), and South Eastern Asia (192 | 0.6%), together accounting for 13.8% of all Carlsbad residents.
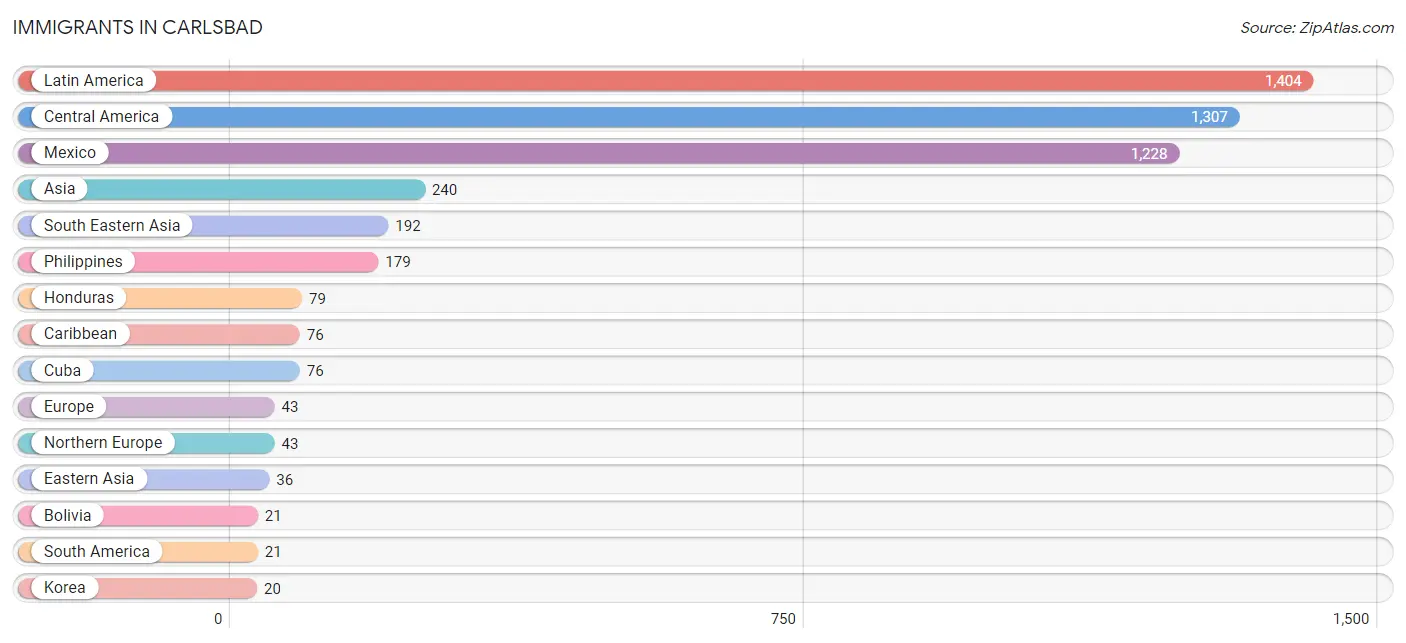
| Immigration Origin | # Population | % Population |
| Africa | 12 | 0.0% |
| Asia | 240 | 0.8% |
| Bolivia | 21 | 0.1% |
| Caribbean | 76 | 0.2% |
| Central America | 1,307 | 4.1% |
| Cuba | 76 | 0.2% |
| Eastern Asia | 36 | 0.1% |
| Europe | 43 | 0.1% |
| Honduras | 79 | 0.3% |
| India | 12 | 0.0% |
| Japan | 16 | 0.1% |
| Korea | 20 | 0.1% |
| Latin America | 1,404 | 4.4% |
| Mexico | 1,228 | 3.9% |
| Nigeria | 12 | 0.0% |
| Northern Europe | 43 | 0.1% |
| Philippines | 179 | 0.6% |
| South America | 21 | 0.1% |
| South Central Asia | 12 | 0.0% |
| South Eastern Asia | 192 | 0.6% |
| Vietnam | 3 | 0.0% |
| Western Africa | 12 | 0.0% | View All 22 Rows |
Sex and Age in Carlsbad
Sex and Age in Carlsbad
The most populous age groups in Carlsbad are 35 to 39 Years (1,493 | 9.3%) for men and 15 to 19 Years (1,292 | 8.2%) for women.
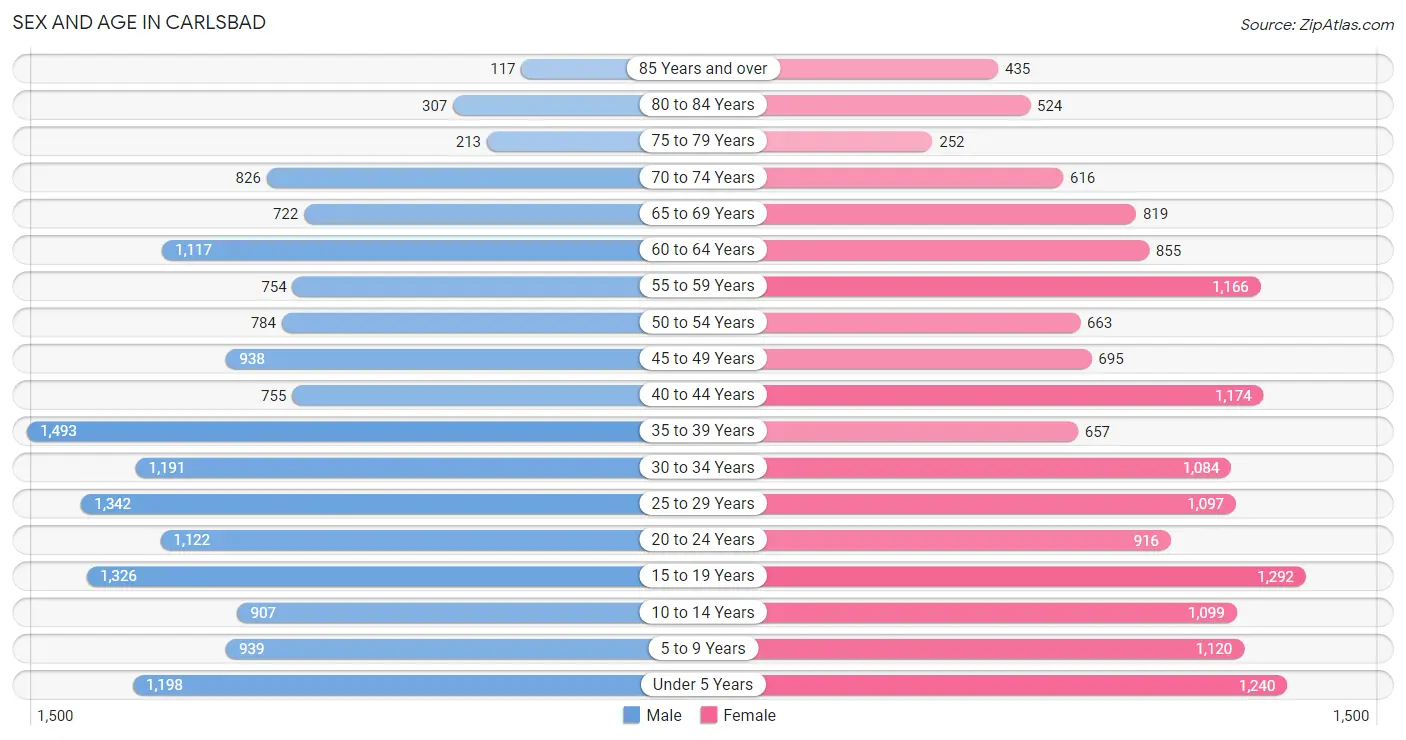
| Age Bracket | Male | Female |
| Under 5 Years | 1,198 (7.5%) | 1,240 (7.9%) |
| 5 to 9 Years | 939 (5.9%) | 1,120 (7.1%) |
| 10 to 14 Years | 907 (5.7%) | 1,099 (7.0%) |
| 15 to 19 Years | 1,326 (8.3%) | 1,292 (8.2%) |
| 20 to 24 Years | 1,122 (7.0%) | 916 (5.8%) |
| 25 to 29 Years | 1,342 (8.4%) | 1,097 (7.0%) |
| 30 to 34 Years | 1,191 (7.4%) | 1,084 (6.9%) |
| 35 to 39 Years | 1,493 (9.3%) | 657 (4.2%) |
| 40 to 44 Years | 755 (4.7%) | 1,174 (7.5%) |
| 45 to 49 Years | 938 (5.8%) | 695 (4.4%) |
| 50 to 54 Years | 784 (4.9%) | 663 (4.2%) |
| 55 to 59 Years | 754 (4.7%) | 1,166 (7.4%) |
| 60 to 64 Years | 1,117 (7.0%) | 855 (5.4%) |
| 65 to 69 Years | 722 (4.5%) | 819 (5.2%) |
| 70 to 74 Years | 826 (5.1%) | 616 (3.9%) |
| 75 to 79 Years | 213 (1.3%) | 252 (1.6%) |
| 80 to 84 Years | 307 (1.9%) | 524 (3.3%) |
| 85 Years and over | 117 (0.7%) | 435 (2.8%) |
| Total | 16,051 (100.0%) | 15,704 (100.0%) |
Families and Households in Carlsbad
Median Family Size in Carlsbad
The median family size in Carlsbad is 3.22 persons per family, with single male/father families (943 | 11.9%) accounting for the largest median family size of 3.35 persons per family. On the other hand, single female/mother families (1,517 | 19.2%) represent the smallest median family size with 3.04 persons per family.
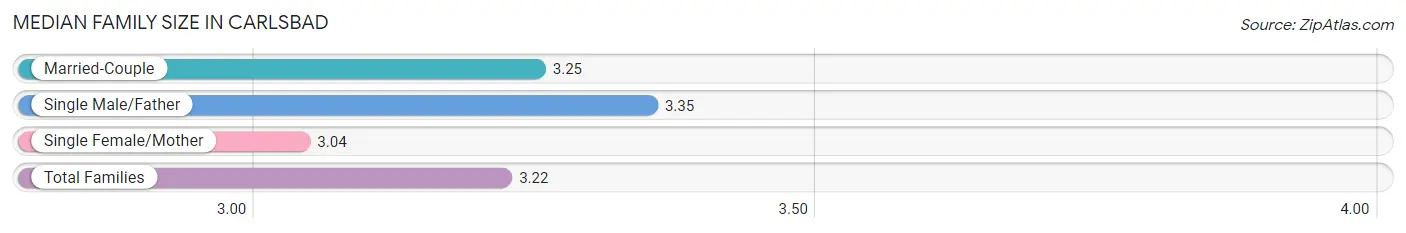
| Family Type | # Families | Family Size |
| Married-Couple | 5,447 (68.9%) | 3.25 |
| Single Male/Father | 943 (11.9%) | 3.35 |
| Single Female/Mother | 1,517 (19.2%) | 3.04 |
| Total Families | 7,907 (100.0%) | 3.22 |
Median Household Size in Carlsbad
The median household size in Carlsbad is 2.64 persons per household, with single male/father households (943 | 8.0%) accounting for the largest median household size of 4.12 persons per household. non-family households (3,865 | 32.8%) represent the smallest median household size with 1.10 persons per household.
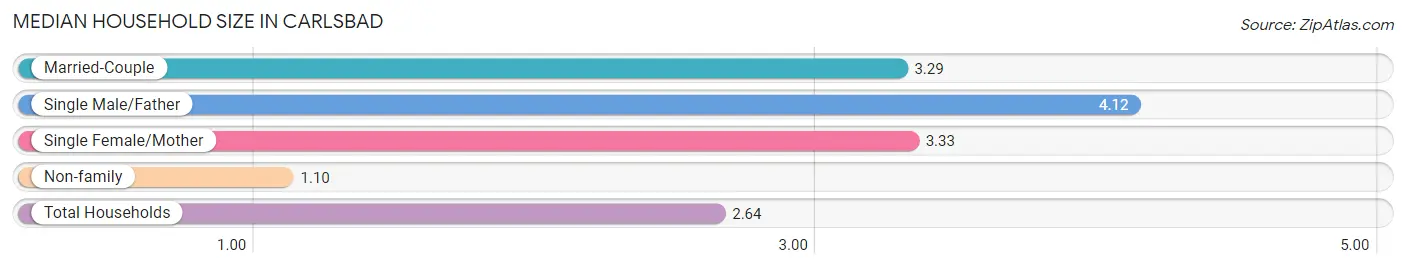
| Household Type | # Households | Household Size |
| Married-Couple | 5,447 (46.3%) | 3.29 |
| Single Male/Father | 943 (8.0%) | 4.12 |
| Single Female/Mother | 1,517 (12.9%) | 3.33 |
| Non-family | 3,865 (32.8%) | 1.10 |
| Total Households | 11,772 (100.0%) | 2.64 |
Household Size by Marriage Status in Carlsbad
Out of a total of 11,772 households in Carlsbad, 7,907 (67.2%) are family households, while 3,865 (32.8%) are nonfamily households. The most numerous type of family households are 2-person households, comprising 3,285, and the most common type of nonfamily households are 1-person households, comprising 3,551.
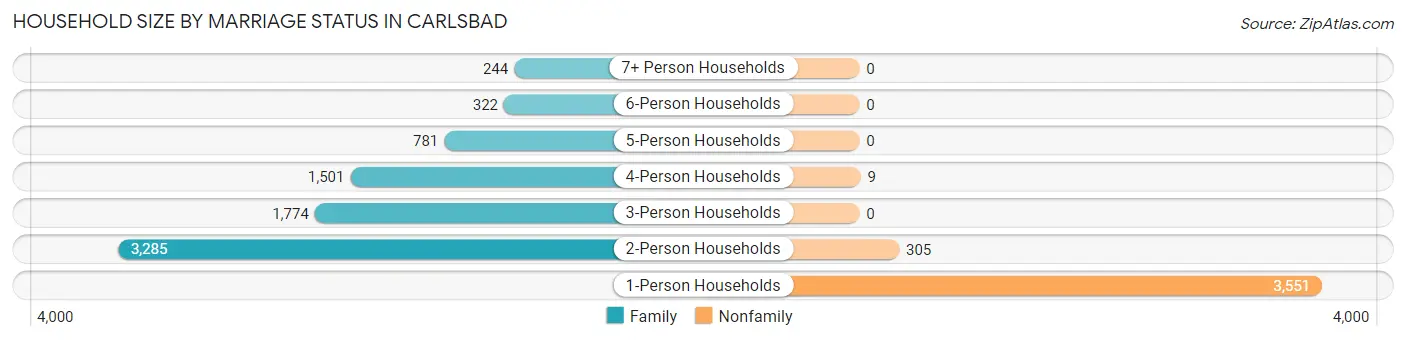
| Household Size | Family Households | Nonfamily Households |
| 1-Person Households | - | 3,551 (30.2%) |
| 2-Person Households | 3,285 (27.9%) | 305 (2.6%) |
| 3-Person Households | 1,774 (15.1%) | 0 (0.0%) |
| 4-Person Households | 1,501 (12.8%) | 9 (0.1%) |
| 5-Person Households | 781 (6.6%) | 0 (0.0%) |
| 6-Person Households | 322 (2.7%) | 0 (0.0%) |
| 7+ Person Households | 244 (2.1%) | 0 (0.0%) |
| Total | 7,907 (67.2%) | 3,865 (32.8%) |
Female Fertility in Carlsbad
Fertility by Age in Carlsbad
Average fertility rate in Carlsbad is 79.0 births per 1,000 women. Women in the age bracket of 20 to 34 years have the highest fertility rate with 107.0 births per 1,000 women. Women in the age bracket of 20 to 34 years acount for 60.8% of all women with births.
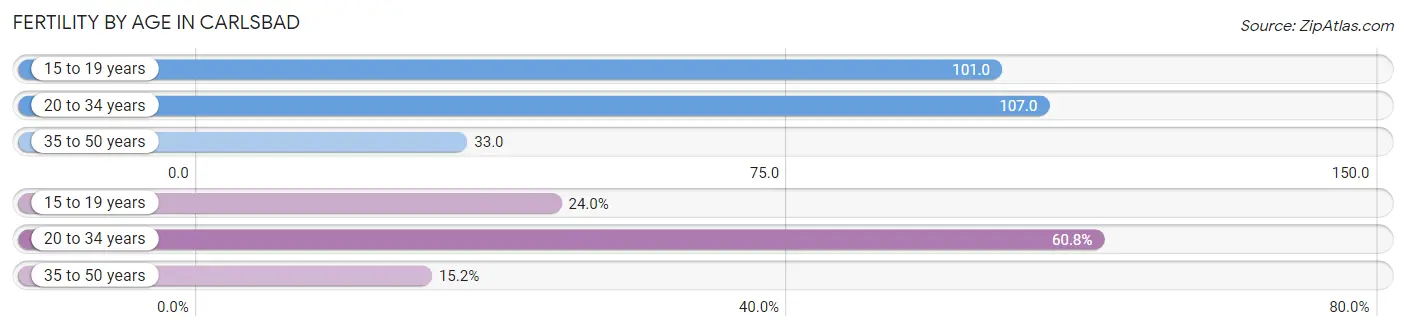
| Age Bracket | Women with Births | Births / 1,000 Women |
| 15 to 19 years | 131 (24.0%) | 101.0 |
| 20 to 34 years | 332 (60.8%) | 107.0 |
| 35 to 50 years | 83 (15.2%) | 33.0 |
| Total | 546 (100.0%) | 79.0 |
Fertility by Age by Marriage Status in Carlsbad
56.6% of women with births (546) in Carlsbad are married. The highest percentage of unmarried women with births falls into 15 to 19 years age bracket with 100.0% of them unmarried at the time of birth, while the lowest percentage of unmarried women with births belong to 35 to 50 years age bracket with 0.0% of them unmarried.
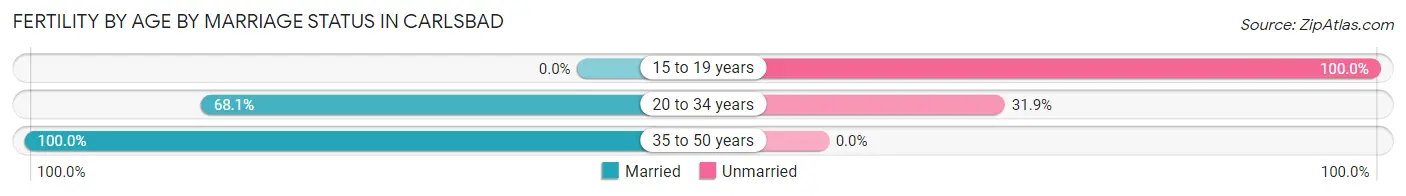
| Age Bracket | Married | Unmarried |
| 15 to 19 years | 0 (0.0%) | 131 (100.0%) |
| 20 to 34 years | 226 (68.1%) | 106 (31.9%) |
| 35 to 50 years | 83 (100.0%) | 0 (0.0%) |
| Total | 309 (56.6%) | 237 (43.4%) |
Fertility by Education in Carlsbad
Average fertility rate in Carlsbad is 79.0 births per 1,000 women. Women with the education attainment of graduate degree have the highest fertility rate of 134.0 births per 1,000 women, while women with the education attainment of college or associate's degree have the lowest fertility at 65.0 births per 1,000 women. Women with the education attainment of college or associate's degree represent 29.8% of all women with births.
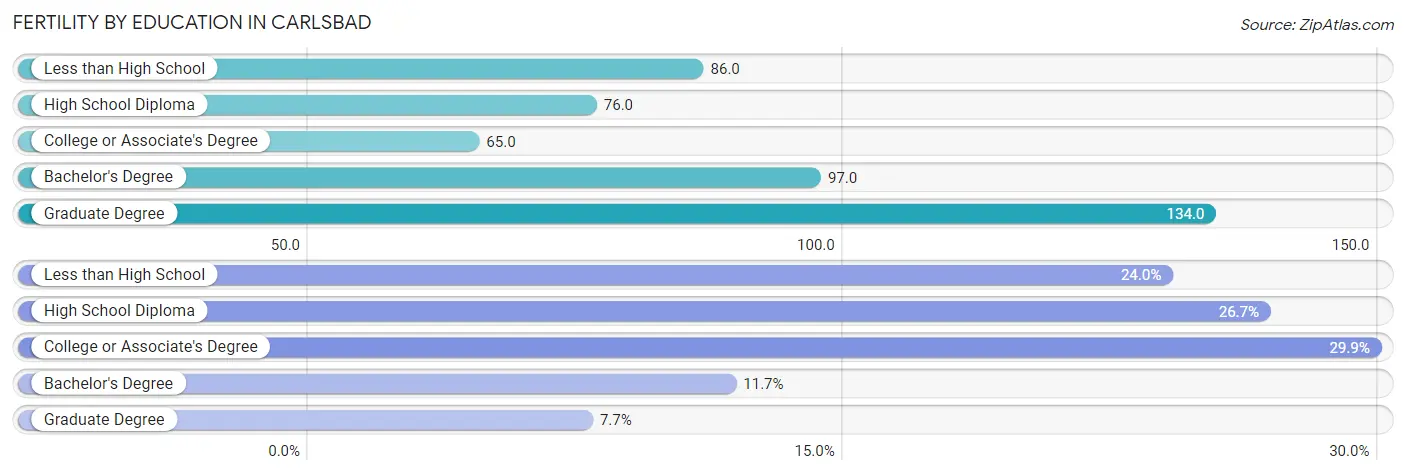
| Educational Attainment | Women with Births | Births / 1,000 Women |
| Less than High School | 131 (24.0%) | 86.0 |
| High School Diploma | 146 (26.7%) | 76.0 |
| College or Associate's Degree | 163 (29.8%) | 65.0 |
| Bachelor's Degree | 64 (11.7%) | 97.0 |
| Graduate Degree | 42 (7.7%) | 134.0 |
| Total | 546 (100.0%) | 79.0 |
Fertility by Education by Marriage Status in Carlsbad
43.4% of women with births in Carlsbad are unmarried. Women with the educational attainment of bachelor's degree are most likely to be married with 100.0% of them married at childbirth, while women with the educational attainment of less than high school are least likely to be married with 100.0% of them unmarried at childbirth.
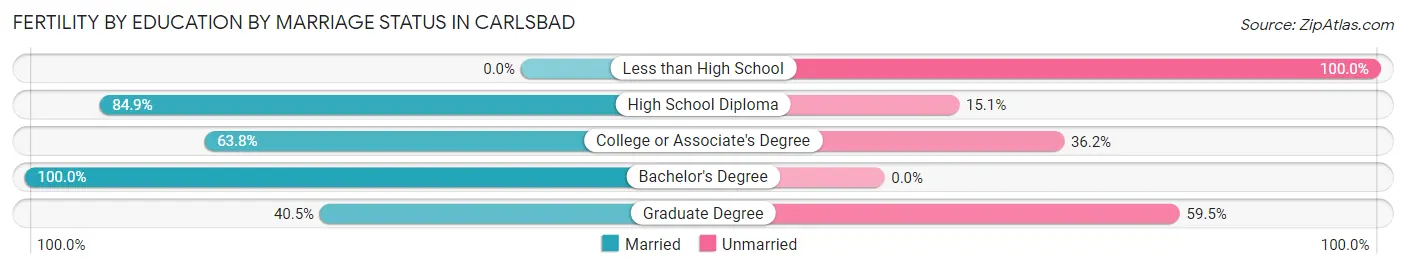
| Educational Attainment | Married | Unmarried |
| Less than High School | 0 (0.0%) | 131 (100.0%) |
| High School Diploma | 124 (84.9%) | 22 (15.1%) |
| College or Associate's Degree | 104 (63.8%) | 59 (36.2%) |
| Bachelor's Degree | 64 (100.0%) | 0 (0.0%) |
| Graduate Degree | 17 (40.5%) | 25 (59.5%) |
| Total | 309 (56.6%) | 237 (43.4%) |
Employment Characteristics in Carlsbad
Employment by Class of Employer in Carlsbad
Among the 14,063 employed individuals in Carlsbad, private company employees (10,202 | 72.5%), federal government employees (959 | 6.8%), and not-for-profit organizations (791 | 5.6%) make up the most common classes of employment.
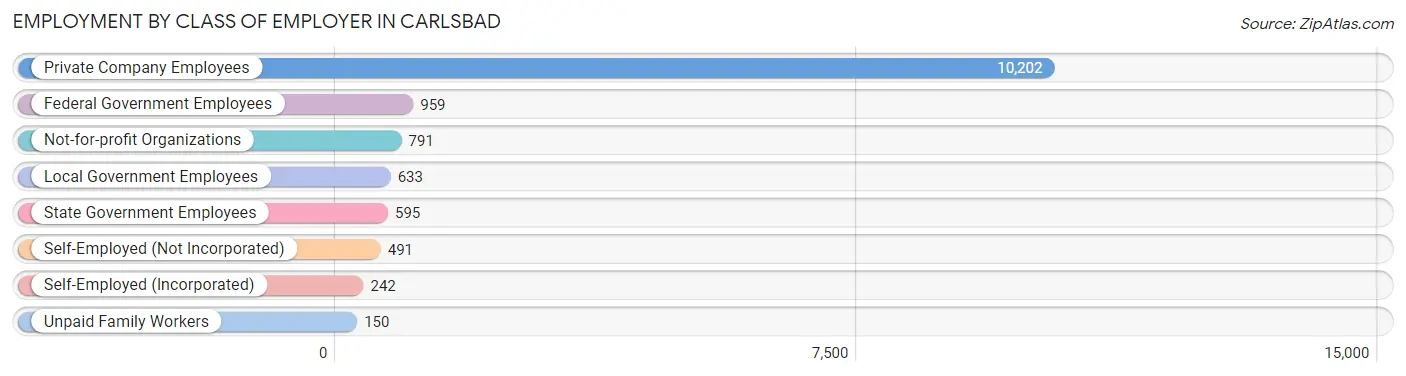
| Employer Class | # Employees | % Employees |
| Private Company Employees | 10,202 | 72.5% |
| Self-Employed (Incorporated) | 242 | 1.7% |
| Self-Employed (Not Incorporated) | 491 | 3.5% |
| Not-for-profit Organizations | 791 | 5.6% |
| Local Government Employees | 633 | 4.5% |
| State Government Employees | 595 | 4.2% |
| Federal Government Employees | 959 | 6.8% |
| Unpaid Family Workers | 150 | 1.1% |
| Total | 14,063 | 100.0% |
Employment Status by Age in Carlsbad
According to the labor force statistics for Carlsbad, out of the total population over 16 years of age (24,896), 59.4% or 14,788 individuals are in the labor force, with 3.0% or 444 of them unemployed. The age group with the highest labor force participation rate is 35 to 44 years, with 81.9% or 3,341 individuals in the labor force. Within the labor force, the 20 to 24 years age range has the highest percentage of unemployed individuals, with 5.6% or 87 of them being unemployed.
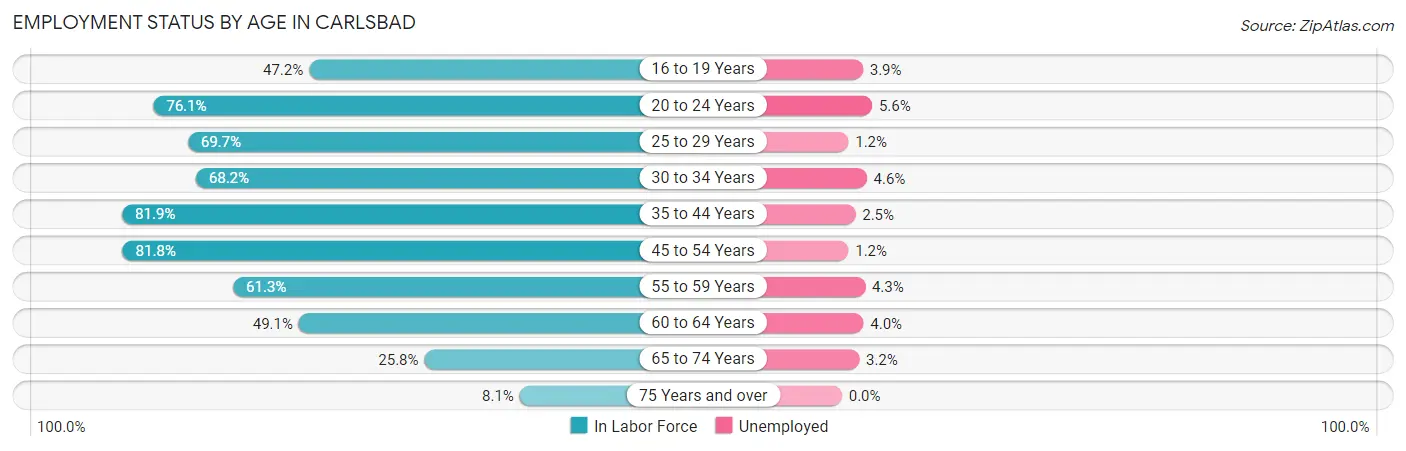
| Age Bracket | In Labor Force | Unemployed |
| 16 to 19 Years | 1,068 (47.2%) | 42 (3.9%) |
| 20 to 24 Years | 1,551 (76.1%) | 87 (5.6%) |
| 25 to 29 Years | 1,700 (69.7%) | 20 (1.2%) |
| 30 to 34 Years | 1,552 (68.2%) | 71 (4.6%) |
| 35 to 44 Years | 3,341 (81.9%) | 84 (2.5%) |
| 45 to 54 Years | 2,519 (81.8%) | 30 (1.2%) |
| 55 to 59 Years | 1,177 (61.3%) | 51 (4.3%) |
| 60 to 64 Years | 968 (49.1%) | 39 (4.0%) |
| 65 to 74 Years | 770 (25.8%) | 25 (3.2%) |
| 75 Years and over | 150 (8.1%) | 0 (0.0%) |
| Total | 14,788 (59.4%) | 444 (3.0%) |
Employment Status by Educational Attainment in Carlsbad
According to labor force statistics for Carlsbad, 71.4% of individuals (11,256) out of the total population between 25 and 64 years of age (15,765) are in the labor force, with 2.6% or 293 of them being unemployed. The group with the highest labor force participation rate are those with the educational attainment of bachelor's degree or higher, with 77.5% or 2,277 individuals in the labor force. Within the labor force, individuals with less than high school education have the highest percentage of unemployment, with 6.8% or 128 of them being unemployed.
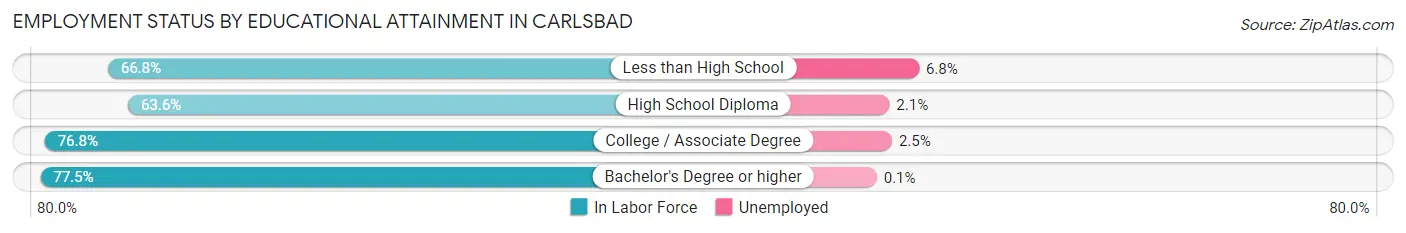
| Educational Attainment | In Labor Force | Unemployed |
| Less than High School | 1,883 (66.8%) | 192 (6.8%) |
| High School Diploma | 2,841 (63.6%) | 94 (2.1%) |
| College / Associate Degree | 4,255 (76.8%) | 139 (2.5%) |
| Bachelor's Degree or higher | 2,277 (77.5%) | 3 (0.1%) |
| Total | 11,256 (71.4%) | 410 (2.6%) |
Employment Occupations by Sex in Carlsbad
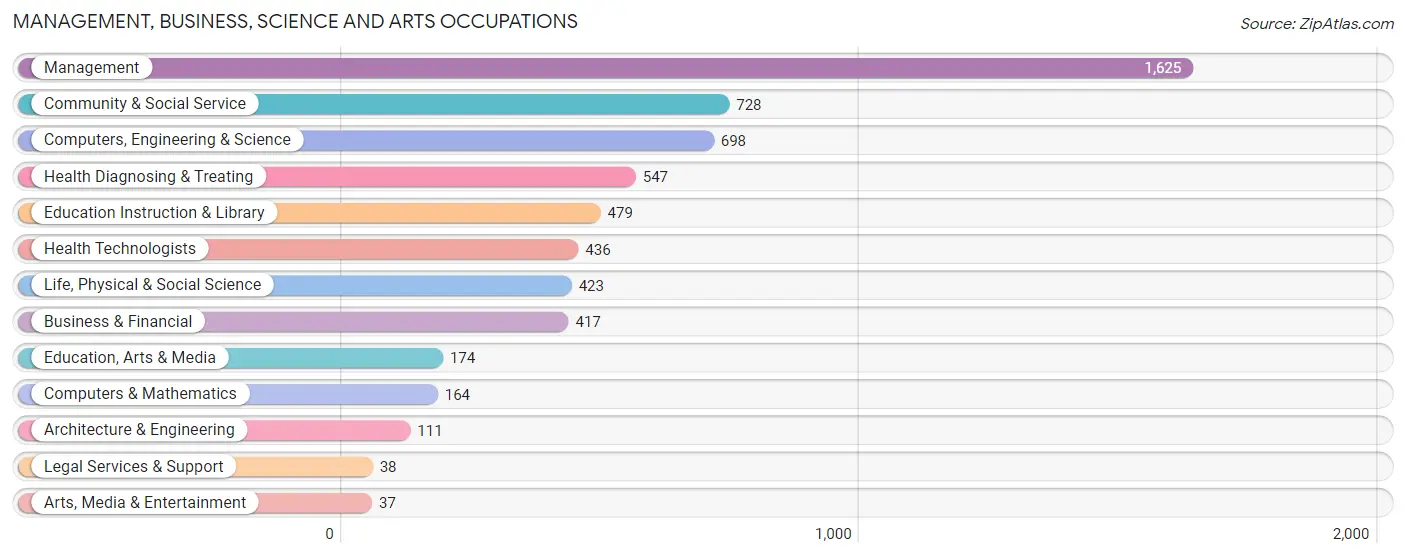
Management, Business, Science and Arts Occupations
The most common Management, Business, Science and Arts occupations in Carlsbad are Management (1,625 | 11.4%), Community & Social Service (728 | 5.1%), Computers, Engineering & Science (698 | 4.9%), Health Diagnosing & Treating (547 | 3.8%), and Education Instruction & Library (479 | 3.3%).
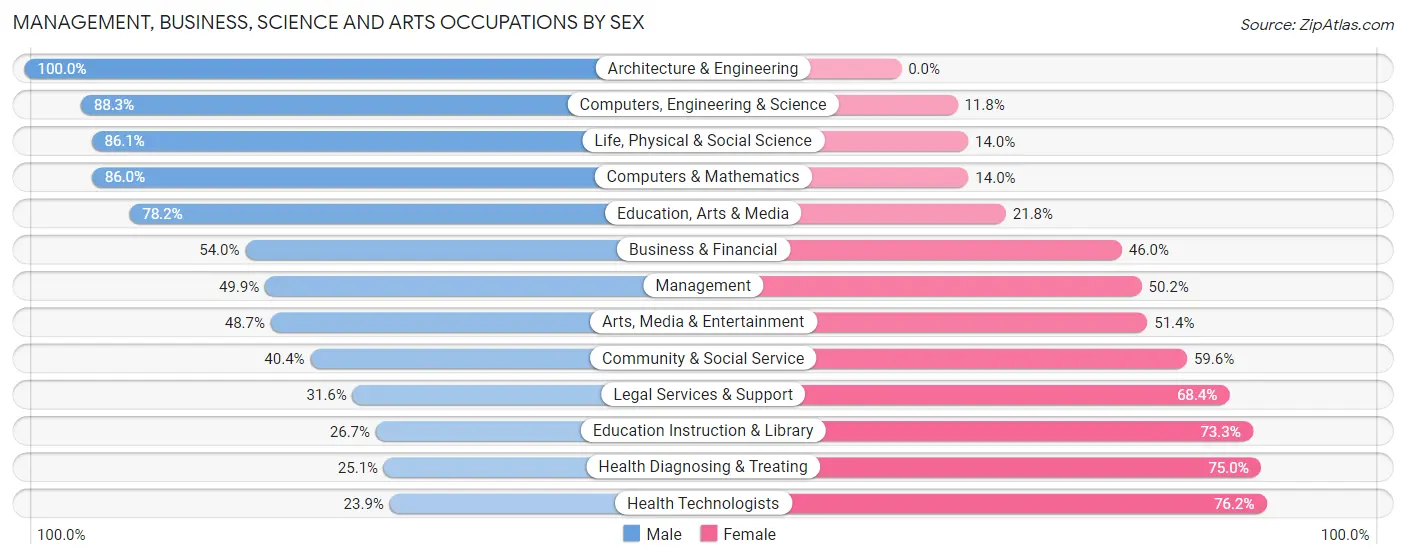
Management, Business, Science and Arts Occupations by Sex
Within the Management, Business, Science and Arts occupations in Carlsbad, the most male-oriented occupations are Architecture & Engineering (100.0%), Computers, Engineering & Science (88.2%), and Life, Physical & Social Science (86.1%), while the most female-oriented occupations are Health Technologists (76.1%), Health Diagnosing & Treating (75.0%), and Education Instruction & Library (73.3%).
| Occupation | Male | Female |
| Management | 810 (49.8%) | 815 (50.1%) |
| Business & Financial | 225 (54.0%) | 192 (46.0%) |
| Computers, Engineering & Science | 616 (88.2%) | 82 (11.7%) |
| Computers & Mathematics | 141 (86.0%) | 23 (14.0%) |
| Architecture & Engineering | 111 (100.0%) | 0 (0.0%) |
| Life, Physical & Social Science | 364 (86.1%) | 59 (14.0%) |
| Community & Social Service | 294 (40.4%) | 434 (59.6%) |
| Education, Arts & Media | 136 (78.2%) | 38 (21.8%) |
| Legal Services & Support | 12 (31.6%) | 26 (68.4%) |
| Education Instruction & Library | 128 (26.7%) | 351 (73.3%) |
| Arts, Media & Entertainment | 18 (48.6%) | 19 (51.3%) |
| Health Diagnosing & Treating | 137 (25.1%) | 410 (75.0%) |
| Health Technologists | 104 (23.8%) | 332 (76.1%) |
| Total (Category) | 2,082 (51.9%) | 1,933 (48.1%) |
| Total (Overall) | 8,587 (60.0%) | 5,735 (40.0%) |
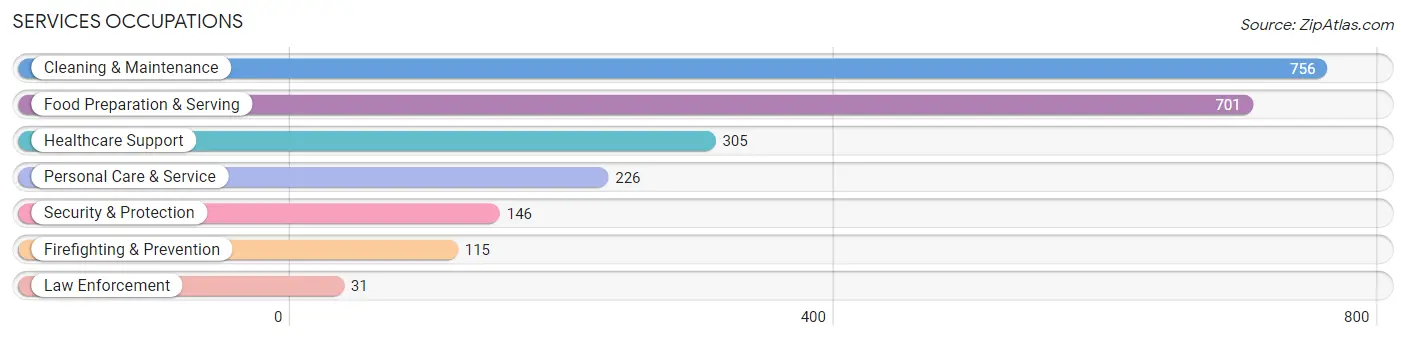
Services Occupations
The most common Services occupations in Carlsbad are Cleaning & Maintenance (756 | 5.3%), Food Preparation & Serving (701 | 4.9%), Healthcare Support (305 | 2.1%), Personal Care & Service (226 | 1.6%), and Security & Protection (146 | 1.0%).
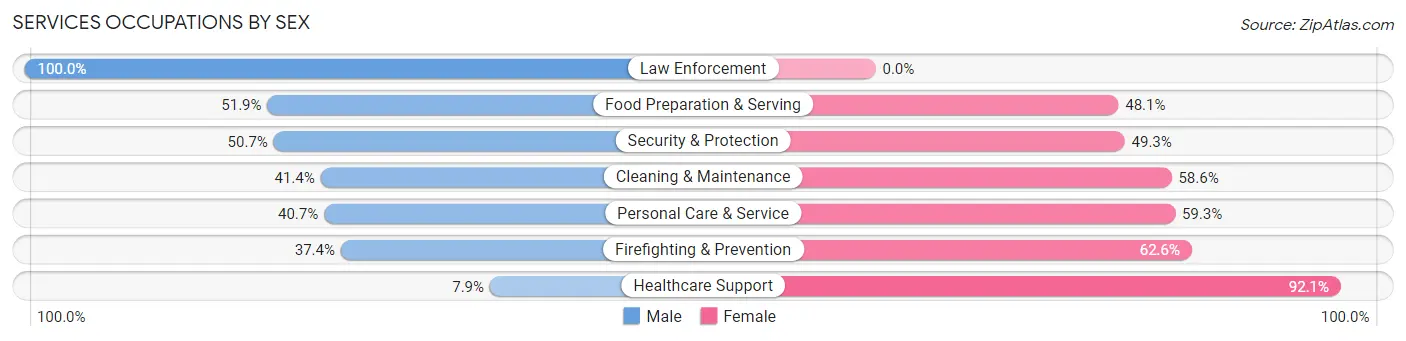
Services Occupations by Sex
Within the Services occupations in Carlsbad, the most male-oriented occupations are Law Enforcement (100.0%), Food Preparation & Serving (51.9%), and Security & Protection (50.7%), while the most female-oriented occupations are Healthcare Support (92.1%), Firefighting & Prevention (62.6%), and Personal Care & Service (59.3%).
| Occupation | Male | Female |
| Healthcare Support | 24 (7.9%) | 281 (92.1%) |
| Security & Protection | 74 (50.7%) | 72 (49.3%) |
| Firefighting & Prevention | 43 (37.4%) | 72 (62.6%) |
| Law Enforcement | 31 (100.0%) | 0 (0.0%) |
| Food Preparation & Serving | 364 (51.9%) | 337 (48.1%) |
| Cleaning & Maintenance | 313 (41.4%) | 443 (58.6%) |
| Personal Care & Service | 92 (40.7%) | 134 (59.3%) |
| Total (Category) | 867 (40.6%) | 1,267 (59.4%) |
| Total (Overall) | 8,587 (60.0%) | 5,735 (40.0%) |
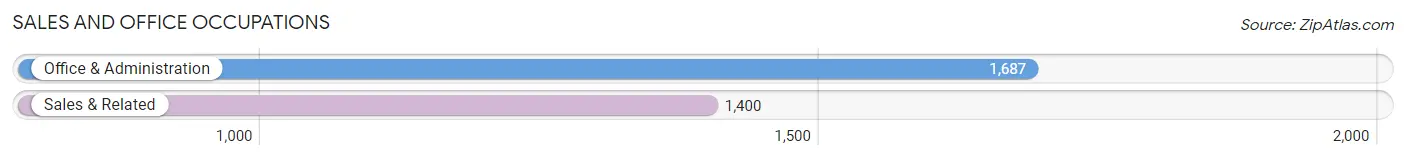
Sales and Office Occupations
The most common Sales and Office occupations in Carlsbad are Office & Administration (1,687 | 11.8%), and Sales & Related (1,400 | 9.8%).
Sales and Office Occupations by Sex
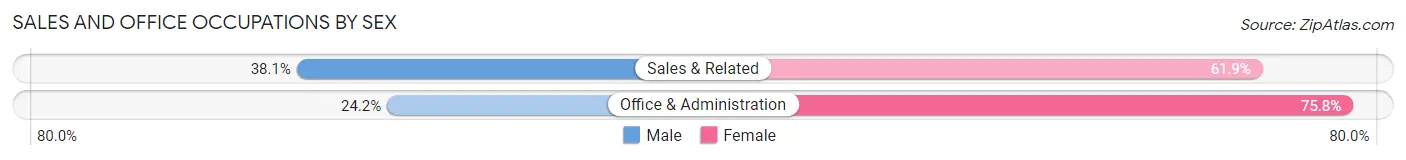
| Occupation | Male | Female |
| Sales & Related | 534 (38.1%) | 866 (61.9%) |
| Office & Administration | 409 (24.2%) | 1,278 (75.8%) |
| Total (Category) | 943 (30.5%) | 2,144 (69.5%) |
| Total (Overall) | 8,587 (60.0%) | 5,735 (40.0%) |
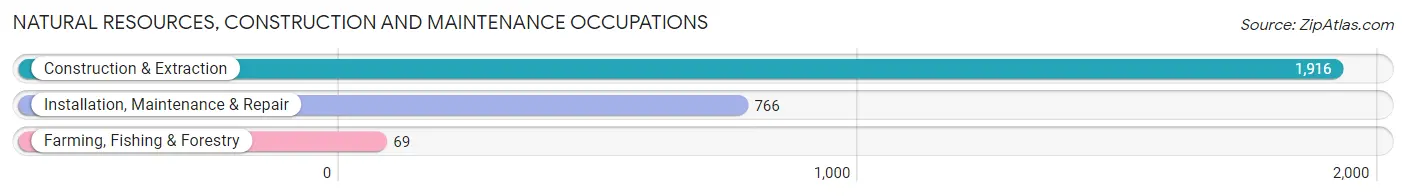
Natural Resources, Construction and Maintenance Occupations
The most common Natural Resources, Construction and Maintenance occupations in Carlsbad are Construction & Extraction (1,916 | 13.4%), Installation, Maintenance & Repair (766 | 5.3%), and Farming, Fishing & Forestry (69 | 0.5%).
Natural Resources, Construction and Maintenance Occupations by Sex
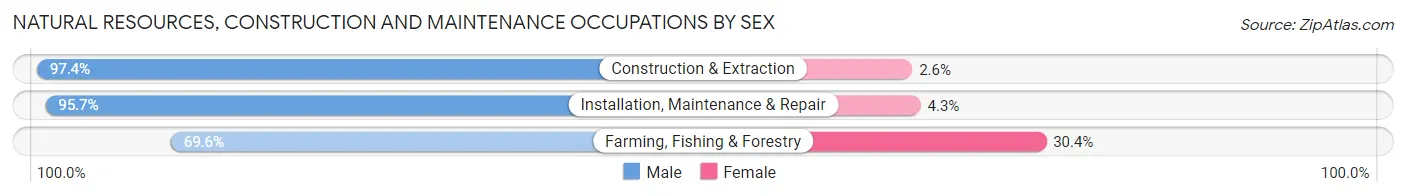
| Occupation | Male | Female |
| Farming, Fishing & Forestry | 48 (69.6%) | 21 (30.4%) |
| Construction & Extraction | 1,867 (97.4%) | 49 (2.6%) |
| Installation, Maintenance & Repair | 733 (95.7%) | 33 (4.3%) |
| Total (Category) | 2,648 (96.3%) | 103 (3.7%) |
| Total (Overall) | 8,587 (60.0%) | 5,735 (40.0%) |
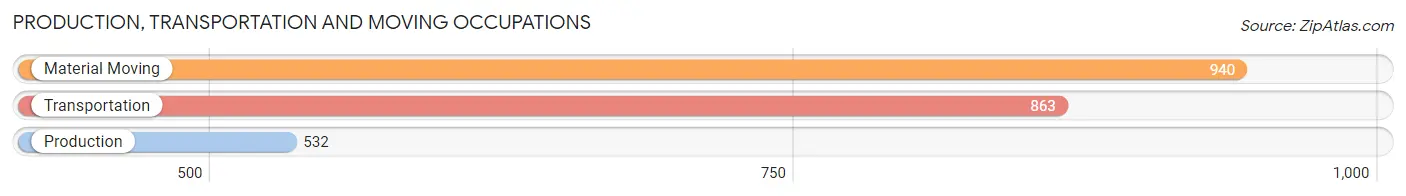
Production, Transportation and Moving Occupations
The most common Production, Transportation and Moving occupations in Carlsbad are Material Moving (940 | 6.6%), Transportation (863 | 6.0%), and Production (532 | 3.7%).
Production, Transportation and Moving Occupations by Sex
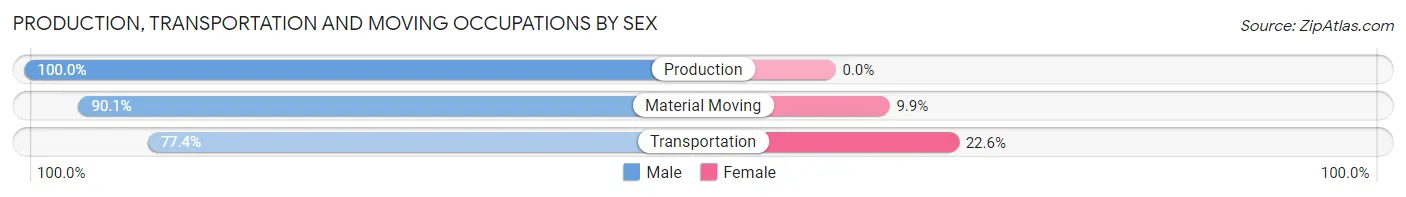
| Occupation | Male | Female |
| Production | 532 (100.0%) | 0 (0.0%) |
| Transportation | 668 (77.4%) | 195 (22.6%) |
| Material Moving | 847 (90.1%) | 93 (9.9%) |
| Total (Category) | 2,047 (87.7%) | 288 (12.3%) |
| Total (Overall) | 8,587 (60.0%) | 5,735 (40.0%) |
Employment Industries by Sex in Carlsbad
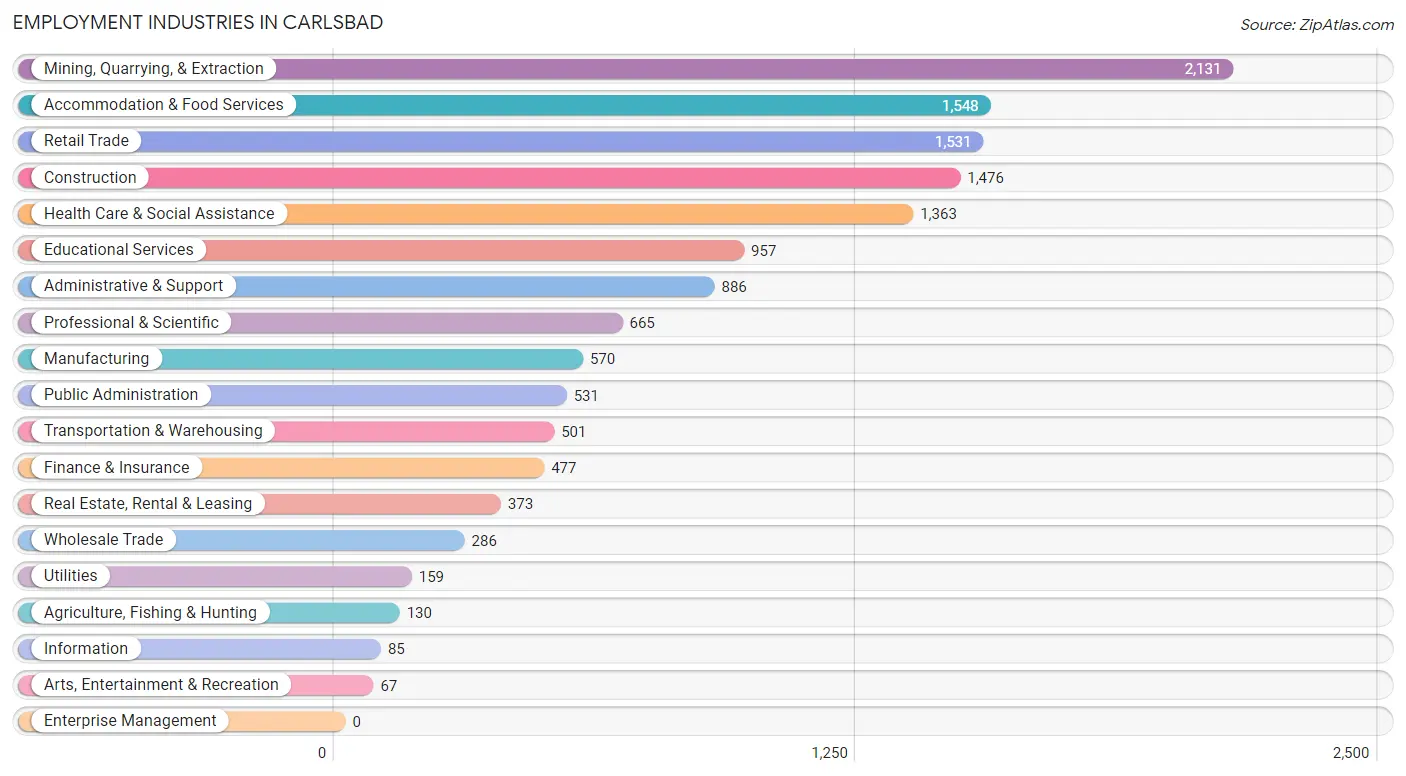
Employment Industries in Carlsbad
The major employment industries in Carlsbad include Mining, Quarrying, & Extraction (2,131 | 14.9%), Accommodation & Food Services (1,548 | 10.8%), Retail Trade (1,531 | 10.7%), Construction (1,476 | 10.3%), and Health Care & Social Assistance (1,363 | 9.5%).
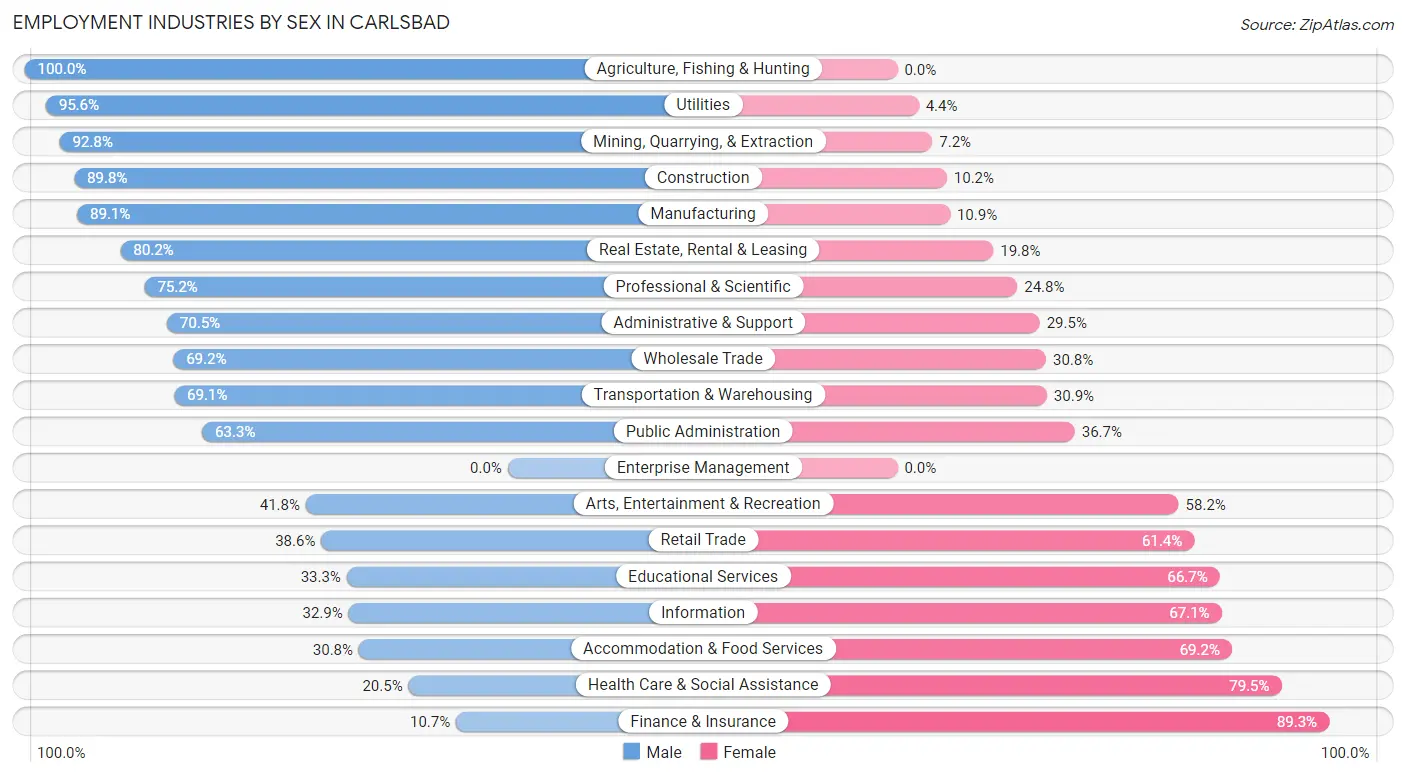
Employment Industries by Sex in Carlsbad
The Carlsbad industries that see more men than women are Agriculture, Fishing & Hunting (100.0%), Utilities (95.6%), and Mining, Quarrying, & Extraction (92.8%), whereas the industries that tend to have a higher number of women are Finance & Insurance (89.3%), Health Care & Social Assistance (79.5%), and Accommodation & Food Services (69.2%).
| Industry | Male | Female |
| Agriculture, Fishing & Hunting | 130 (100.0%) | 0 (0.0%) |
| Mining, Quarrying, & Extraction | 1,977 (92.8%) | 154 (7.2%) |
| Construction | 1,325 (89.8%) | 151 (10.2%) |
| Manufacturing | 508 (89.1%) | 62 (10.9%) |
| Wholesale Trade | 198 (69.2%) | 88 (30.8%) |
| Retail Trade | 591 (38.6%) | 940 (61.4%) |
| Transportation & Warehousing | 346 (69.1%) | 155 (30.9%) |
| Utilities | 152 (95.6%) | 7 (4.4%) |
| Information | 28 (32.9%) | 57 (67.1%) |
| Finance & Insurance | 51 (10.7%) | 426 (89.3%) |
| Real Estate, Rental & Leasing | 299 (80.2%) | 74 (19.8%) |
| Professional & Scientific | 500 (75.2%) | 165 (24.8%) |
| Enterprise Management | 0 (0.0%) | 0 (0.0%) |
| Administrative & Support | 625 (70.5%) | 261 (29.5%) |
| Educational Services | 319 (33.3%) | 638 (66.7%) |
| Health Care & Social Assistance | 280 (20.5%) | 1,083 (79.5%) |
| Arts, Entertainment & Recreation | 28 (41.8%) | 39 (58.2%) |
| Accommodation & Food Services | 477 (30.8%) | 1,071 (69.2%) |
| Public Administration | 336 (63.3%) | 195 (36.7%) |
| Total | 8,587 (60.0%) | 5,735 (40.0%) |
Education in Carlsbad
School Enrollment in Carlsbad
The most common levels of schooling among the 7,260 students in Carlsbad are high school (1,928 | 26.6%), middle school (1,809 | 24.9%), and elementary school (1,680 | 23.1%).
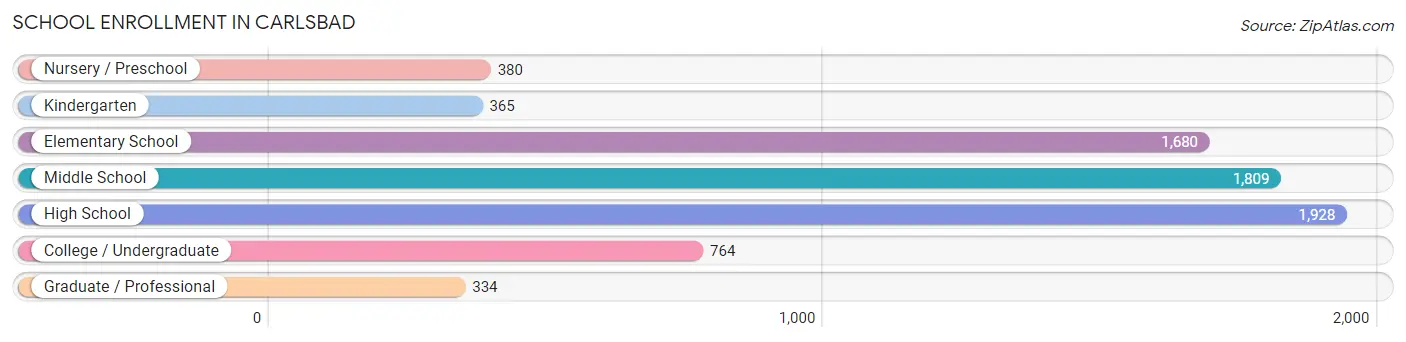
| School Level | # Students | % Students |
| Nursery / Preschool | 380 | 5.2% |
| Kindergarten | 365 | 5.0% |
| Elementary School | 1,680 | 23.1% |
| Middle School | 1,809 | 24.9% |
| High School | 1,928 | 26.6% |
| College / Undergraduate | 764 | 10.5% |
| Graduate / Professional | 334 | 4.6% |
| Total | 7,260 | 100.0% |
School Enrollment by Age by Funding Source in Carlsbad
Out of a total of 7,260 students who are enrolled in schools in Carlsbad, 581 (8.0%) attend a private institution, while the remaining 6,679 (92.0%) are enrolled in public schools. The age group of 3 to 4 year olds has the highest likelihood of being enrolled in private schools, with 128 (38.2% in the age bracket) enrolled. Conversely, the age group of 18 to 19 year olds has the lowest likelihood of being enrolled in a private school, with 487 (100.0% in the age bracket) attending a public institution.
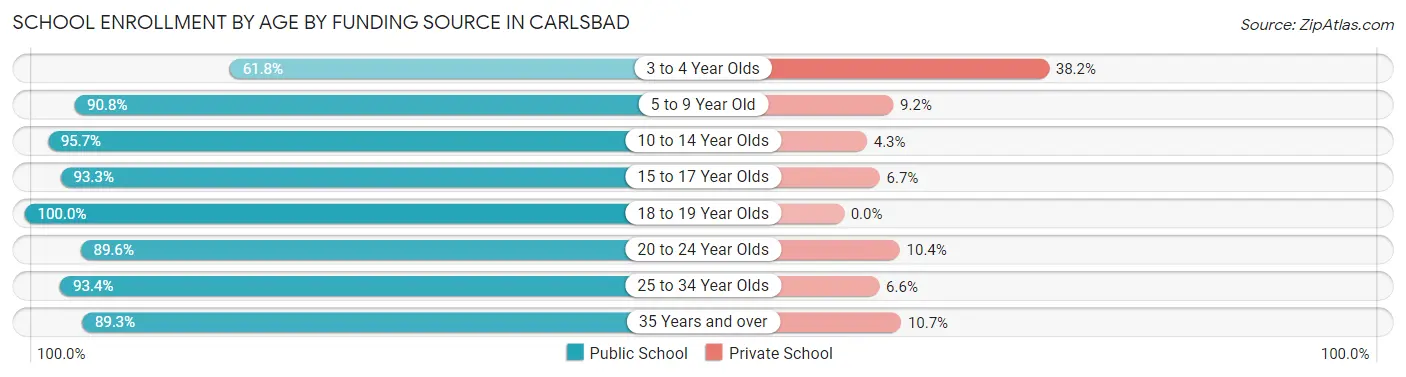
| Age Bracket | Public School | Private School |
| 3 to 4 Year Olds | 207 (61.8%) | 128 (38.2%) |
| 5 to 9 Year Old | 1,762 (90.8%) | 179 (9.2%) |
| 10 to 14 Year Olds | 1,885 (95.7%) | 85 (4.3%) |
| 15 to 17 Year Olds | 1,367 (93.3%) | 98 (6.7%) |
| 18 to 19 Year Olds | 487 (100.0%) | 0 (0.0%) |
| 20 to 24 Year Olds | 172 (89.6%) | 20 (10.4%) |
| 25 to 34 Year Olds | 480 (93.4%) | 34 (6.6%) |
| 35 Years and over | 318 (89.3%) | 38 (10.7%) |
| Total | 6,679 (92.0%) | 581 (8.0%) |
Educational Attainment by Field of Study in Carlsbad
Education (805 | 19.9%), business (566 | 14.0%), engineering (527 | 13.0%), science & technology (407 | 10.1%), and bio, nature & agricultural (381 | 9.4%) are the most common fields of study among 4,040 individuals in Carlsbad who have obtained a bachelor's degree or higher.
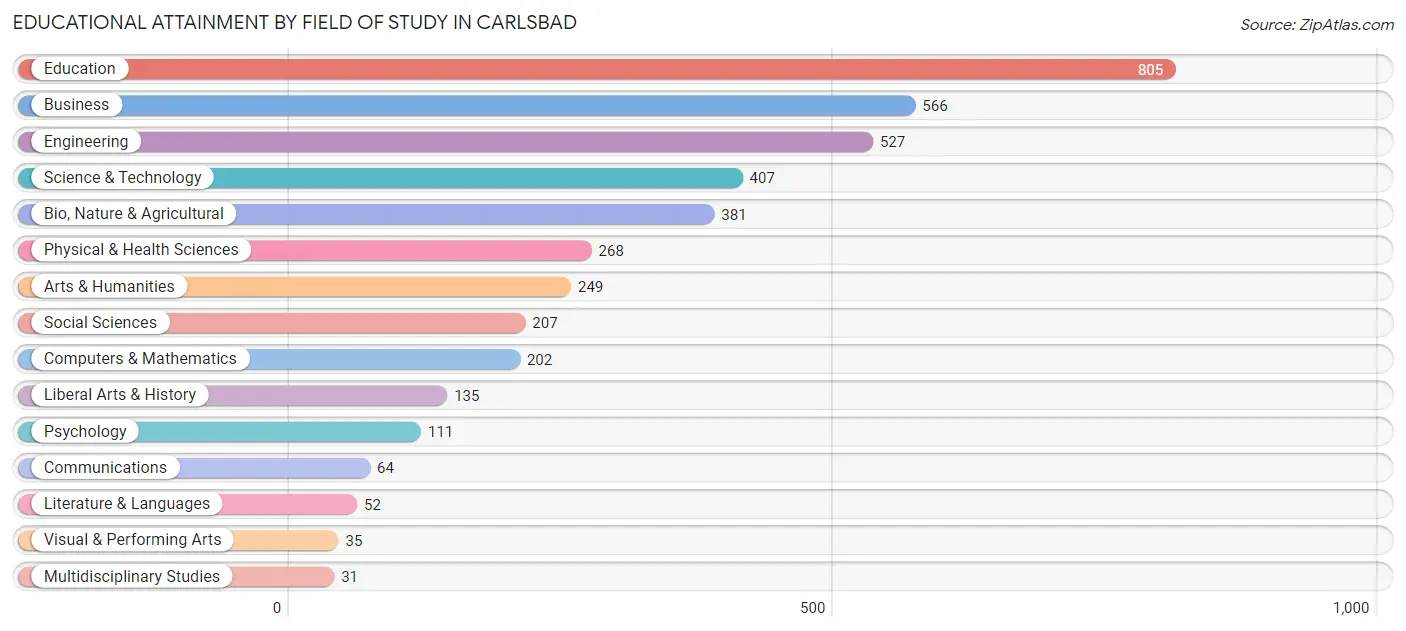
| Field of Study | # Graduates | % Graduates |
| Computers & Mathematics | 202 | 5.0% |
| Bio, Nature & Agricultural | 381 | 9.4% |
| Physical & Health Sciences | 268 | 6.6% |
| Psychology | 111 | 2.8% |
| Social Sciences | 207 | 5.1% |
| Engineering | 527 | 13.0% |
| Multidisciplinary Studies | 31 | 0.8% |
| Science & Technology | 407 | 10.1% |
| Business | 566 | 14.0% |
| Education | 805 | 19.9% |
| Literature & Languages | 52 | 1.3% |
| Liberal Arts & History | 135 | 3.3% |
| Visual & Performing Arts | 35 | 0.9% |
| Communications | 64 | 1.6% |
| Arts & Humanities | 249 | 6.2% |
| Total | 4,040 | 100.0% |
Transportation & Commute in Carlsbad
Vehicle Availability by Sex in Carlsbad
The most prevalent vehicle ownership categories in Carlsbad are males with 2 vehicles (3,453, accounting for 41.2%) and females with 2 vehicles (2,457, making up 61.8%).
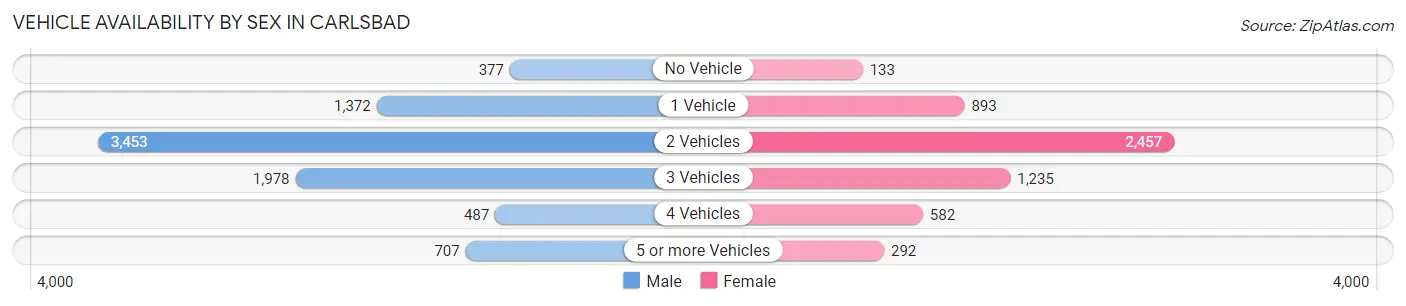
| Vehicles Available | Male | Female |
| No Vehicle | 377 (4.5%) | 133 (2.4%) |
| 1 Vehicle | 1,372 (16.4%) | 893 (16.0%) |
| 2 Vehicles | 3,453 (41.2%) | 2,457 (43.9%) |
| 3 Vehicles | 1,978 (23.6%) | 1,235 (22.1%) |
| 4 Vehicles | 487 (5.8%) | 582 (10.4%) |
| 5 or more Vehicles | 707 (8.4%) | 292 (5.2%) |
| Total | 8,374 (100.0%) | 5,592 (100.0%) |
Commute Time in Carlsbad
The most frequently occuring commute durations in Carlsbad are 10 to 14 minutes (3,328 commuters, 24.9%), 5 to 9 minutes (2,419 commuters, 18.1%), and 15 to 19 minutes (2,199 commuters, 16.5%).
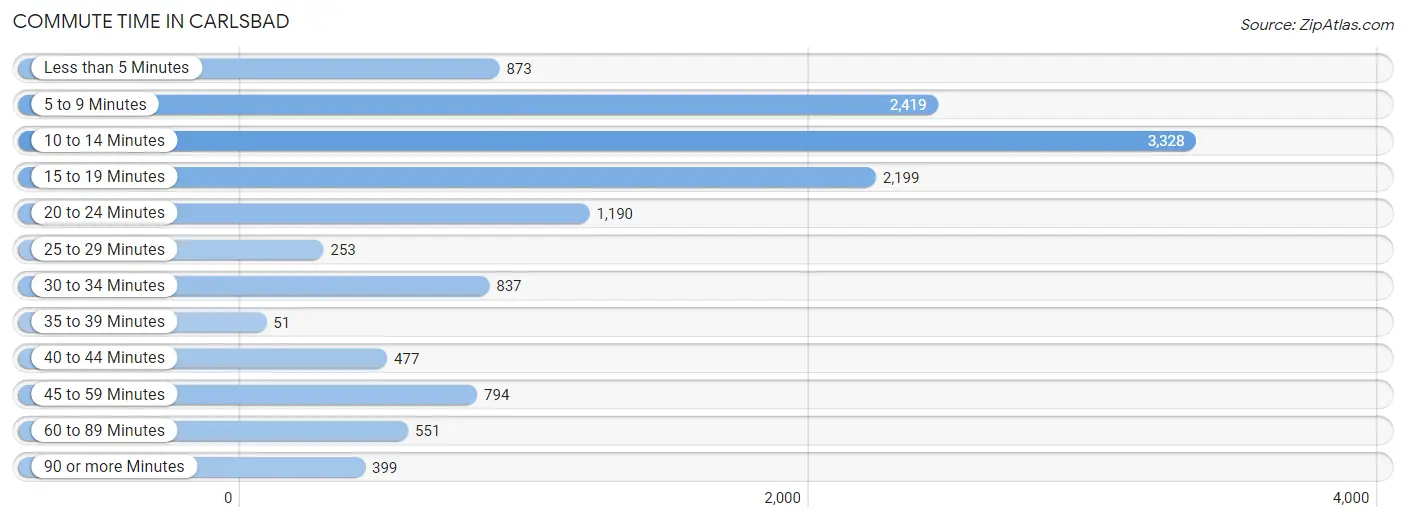
| Commute Time | # Commuters | % Commuters |
| Less than 5 Minutes | 873 | 6.5% |
| 5 to 9 Minutes | 2,419 | 18.1% |
| 10 to 14 Minutes | 3,328 | 24.9% |
| 15 to 19 Minutes | 2,199 | 16.5% |
| 20 to 24 Minutes | 1,190 | 8.9% |
| 25 to 29 Minutes | 253 | 1.9% |
| 30 to 34 Minutes | 837 | 6.3% |
| 35 to 39 Minutes | 51 | 0.4% |
| 40 to 44 Minutes | 477 | 3.6% |
| 45 to 59 Minutes | 794 | 5.9% |
| 60 to 89 Minutes | 551 | 4.1% |
| 90 or more Minutes | 399 | 3.0% |
Commute Time by Sex in Carlsbad
The most common commute times in Carlsbad are 10 to 14 minutes (1,543 commuters, 18.9%) for males and 10 to 14 minutes (1,785 commuters, 34.3%) for females.
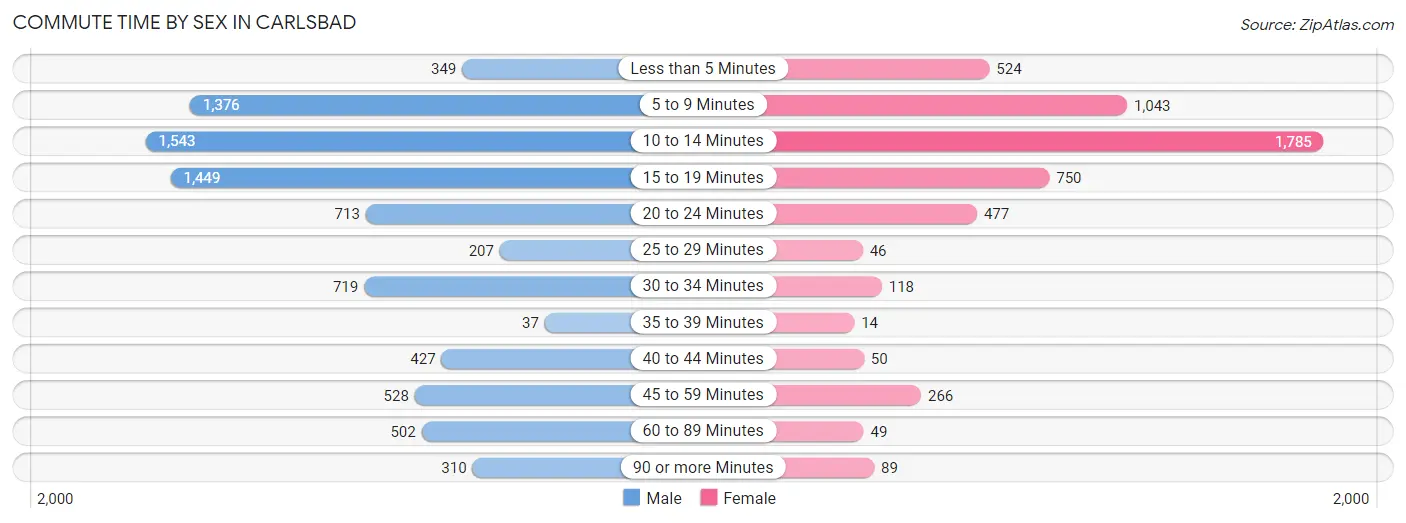
| Commute Time | Male | Female |
| Less than 5 Minutes | 349 (4.3%) | 524 (10.1%) |
| 5 to 9 Minutes | 1,376 (16.9%) | 1,043 (20.0%) |
| 10 to 14 Minutes | 1,543 (18.9%) | 1,785 (34.3%) |
| 15 to 19 Minutes | 1,449 (17.8%) | 750 (14.4%) |
| 20 to 24 Minutes | 713 (8.7%) | 477 (9.1%) |
| 25 to 29 Minutes | 207 (2.5%) | 46 (0.9%) |
| 30 to 34 Minutes | 719 (8.8%) | 118 (2.3%) |
| 35 to 39 Minutes | 37 (0.4%) | 14 (0.3%) |
| 40 to 44 Minutes | 427 (5.2%) | 50 (1.0%) |
| 45 to 59 Minutes | 528 (6.5%) | 266 (5.1%) |
| 60 to 89 Minutes | 502 (6.1%) | 49 (0.9%) |
| 90 or more Minutes | 310 (3.8%) | 89 (1.7%) |
Time of Departure to Work by Sex in Carlsbad
The most frequent times of departure to work in Carlsbad are 5:30 AM to 5:59 AM (1,301, 15.9%) for males and 7:30 AM to 7:59 AM (1,016, 19.5%) for females.
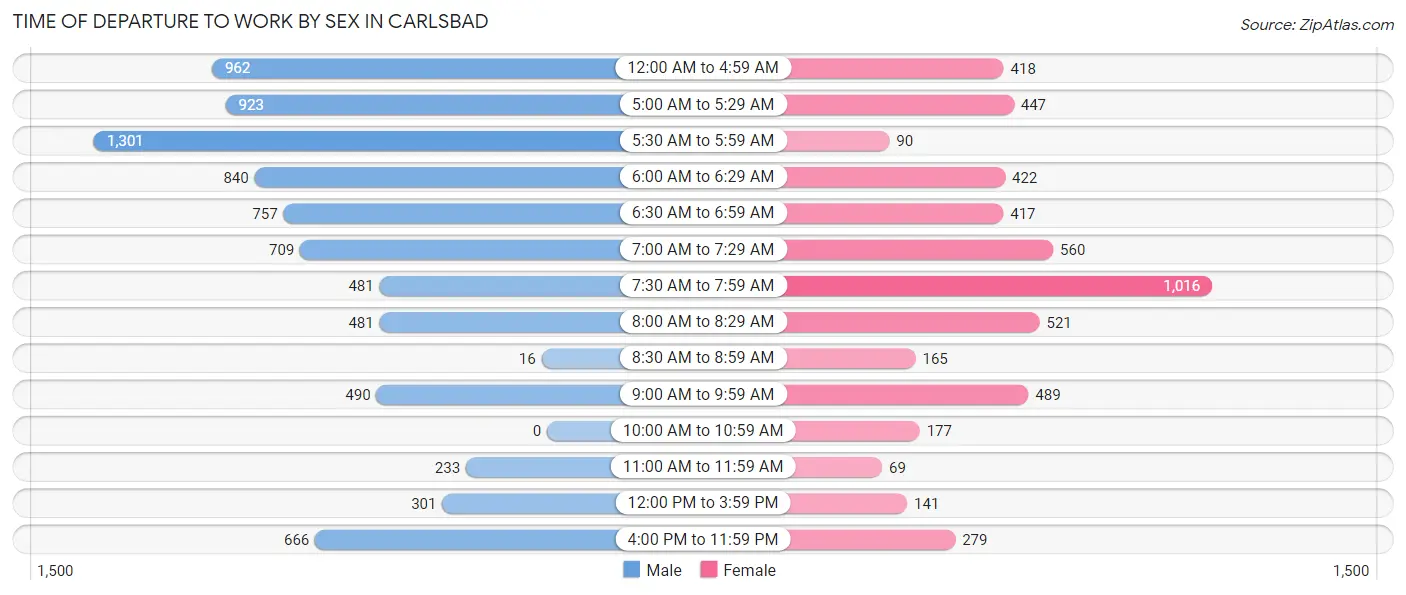
| Time of Departure | Male | Female |
| 12:00 AM to 4:59 AM | 962 (11.8%) | 418 (8.0%) |
| 5:00 AM to 5:29 AM | 923 (11.3%) | 447 (8.6%) |
| 5:30 AM to 5:59 AM | 1,301 (15.9%) | 90 (1.7%) |
| 6:00 AM to 6:29 AM | 840 (10.3%) | 422 (8.1%) |
| 6:30 AM to 6:59 AM | 757 (9.3%) | 417 (8.0%) |
| 7:00 AM to 7:29 AM | 709 (8.7%) | 560 (10.7%) |
| 7:30 AM to 7:59 AM | 481 (5.9%) | 1,016 (19.5%) |
| 8:00 AM to 8:29 AM | 481 (5.9%) | 521 (10.0%) |
| 8:30 AM to 8:59 AM | 16 (0.2%) | 165 (3.2%) |
| 9:00 AM to 9:59 AM | 490 (6.0%) | 489 (9.4%) |
| 10:00 AM to 10:59 AM | 0 (0.0%) | 177 (3.4%) |
| 11:00 AM to 11:59 AM | 233 (2.9%) | 69 (1.3%) |
| 12:00 PM to 3:59 PM | 301 (3.7%) | 141 (2.7%) |
| 4:00 PM to 11:59 PM | 666 (8.2%) | 279 (5.3%) |
| Total | 8,160 (100.0%) | 5,211 (100.0%) |
Housing Occupancy in Carlsbad
Occupancy by Ownership in Carlsbad
Of the total 11,772 dwellings in Carlsbad, owner-occupied units account for 8,353 (71.0%), while renter-occupied units make up 3,419 (29.0%).
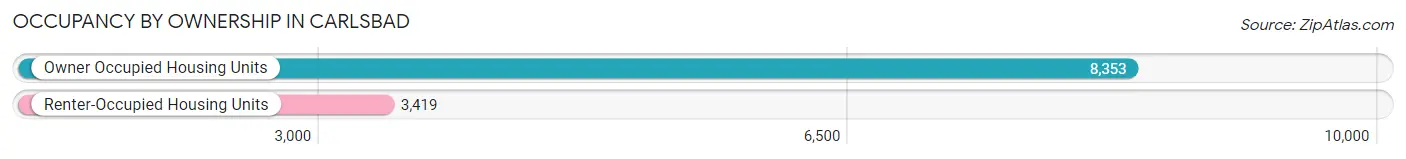
| Occupancy | # Housing Units | % Housing Units |
| Owner Occupied Housing Units | 8,353 | 71.0% |
| Renter-Occupied Housing Units | 3,419 | 29.0% |
| Total Occupied Housing Units | 11,772 | 100.0% |
Occupancy by Household Size in Carlsbad
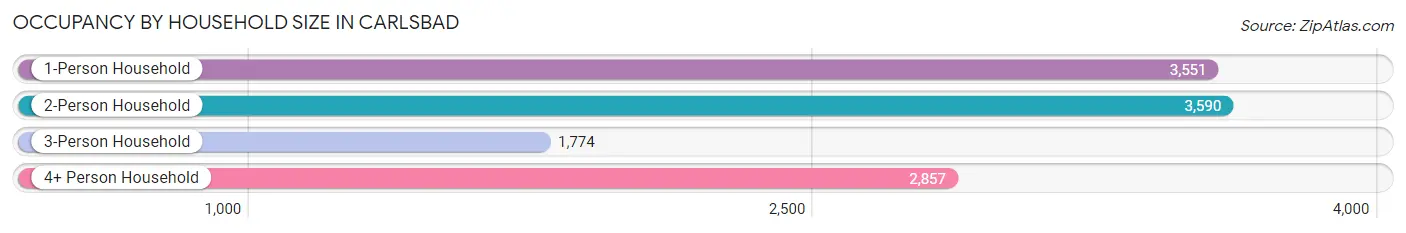
| Household Size | # Housing Units | % Housing Units |
| 1-Person Household | 3,551 | 30.2% |
| 2-Person Household | 3,590 | 30.5% |
| 3-Person Household | 1,774 | 15.1% |
| 4+ Person Household | 2,857 | 24.3% |
| Total Housing Units | 11,772 | 100.0% |
Occupancy by Ownership by Household Size in Carlsbad
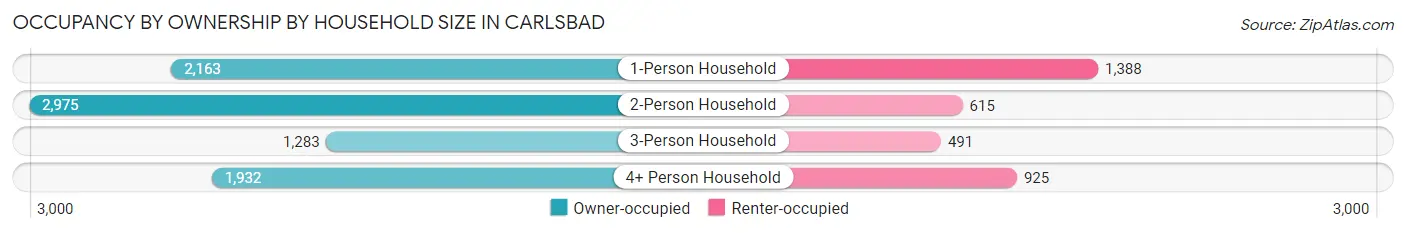
| Household Size | Owner-occupied | Renter-occupied |
| 1-Person Household | 2,163 (60.9%) | 1,388 (39.1%) |
| 2-Person Household | 2,975 (82.9%) | 615 (17.1%) |
| 3-Person Household | 1,283 (72.3%) | 491 (27.7%) |
| 4+ Person Household | 1,932 (67.6%) | 925 (32.4%) |
| Total Housing Units | 8,353 (71.0%) | 3,419 (29.0%) |
Occupancy by Educational Attainment in Carlsbad
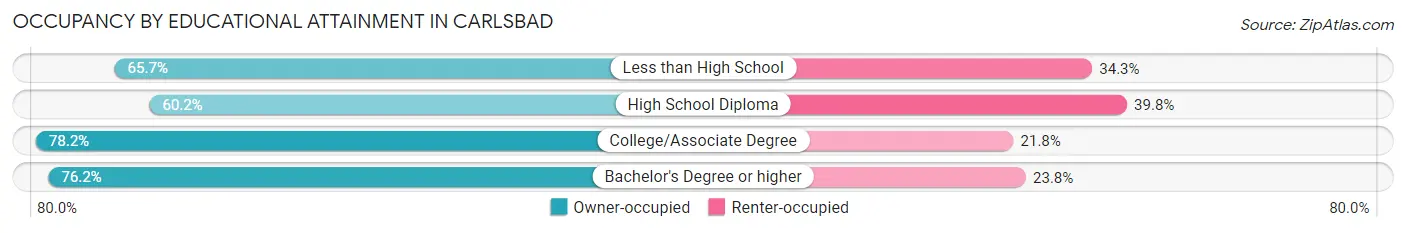
| Household Size | Owner-occupied | Renter-occupied |
| Less than High School | 1,397 (65.7%) | 729 (34.3%) |
| High School Diploma | 1,784 (60.2%) | 1,180 (39.8%) |
| College/Associate Degree | 3,117 (78.2%) | 869 (21.8%) |
| Bachelor's Degree or higher | 2,055 (76.2%) | 641 (23.8%) |
Occupancy by Age of Householder in Carlsbad
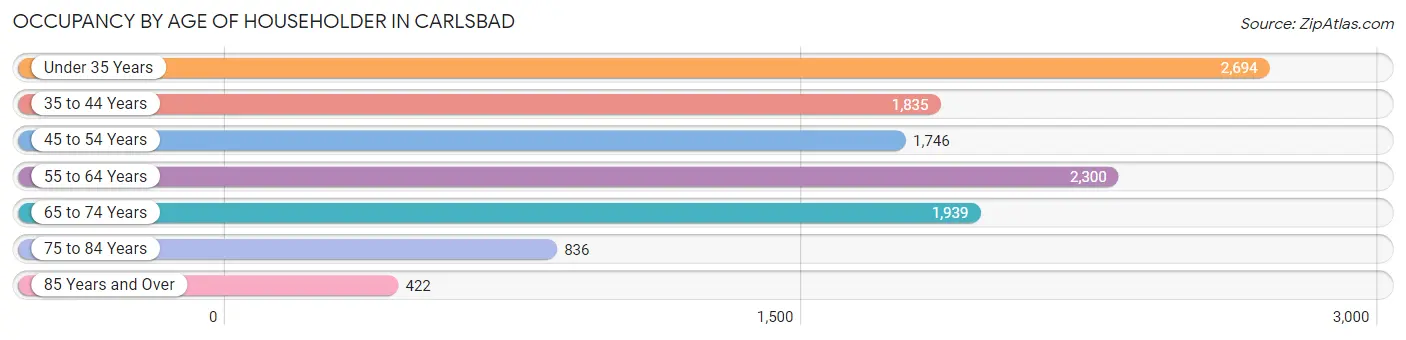
| Age Bracket | # Households | % Households |
| Under 35 Years | 2,694 | 22.9% |
| 35 to 44 Years | 1,835 | 15.6% |
| 45 to 54 Years | 1,746 | 14.8% |
| 55 to 64 Years | 2,300 | 19.5% |
| 65 to 74 Years | 1,939 | 16.5% |
| 75 to 84 Years | 836 | 7.1% |
| 85 Years and Over | 422 | 3.6% |
| Total | 11,772 | 100.0% |
Housing Finances in Carlsbad
Median Income by Occupancy in Carlsbad
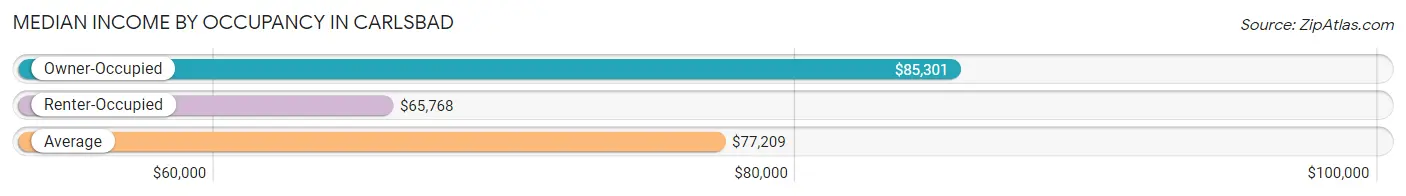
| Occupancy Type | # Households | Median Income |
| Owner-Occupied | 8,353 (71.0%) | $85,301 |
| Renter-Occupied | 3,419 (29.0%) | $65,768 |
| Average | 11,772 (100.0%) | $77,209 |
Occupancy by Householder Income Bracket in Carlsbad
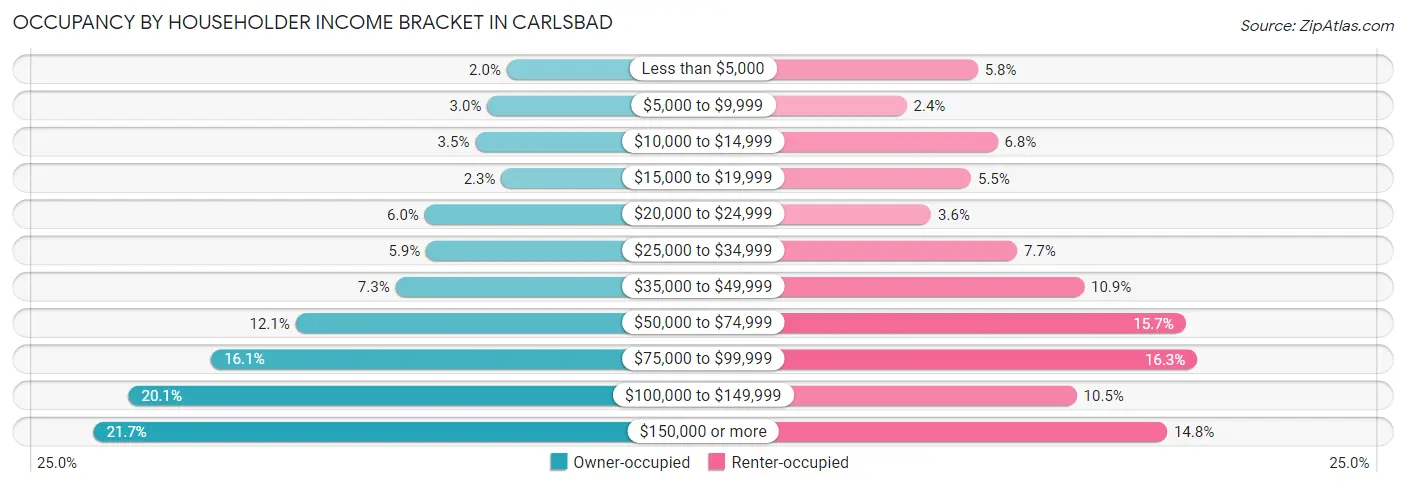
| Income Bracket | Owner-occupied | Renter-occupied |
| Less than $5,000 | 170 (2.0%) | 199 (5.8%) |
| $5,000 to $9,999 | 248 (3.0%) | 83 (2.4%) |
| $10,000 to $14,999 | 296 (3.5%) | 231 (6.8%) |
| $15,000 to $19,999 | 192 (2.3%) | 188 (5.5%) |
| $20,000 to $24,999 | 497 (5.9%) | 123 (3.6%) |
| $25,000 to $34,999 | 491 (5.9%) | 263 (7.7%) |
| $35,000 to $49,999 | 613 (7.3%) | 372 (10.9%) |
| $50,000 to $74,999 | 1,011 (12.1%) | 537 (15.7%) |
| $75,000 to $99,999 | 1,346 (16.1%) | 556 (16.3%) |
| $100,000 to $149,999 | 1,675 (20.1%) | 360 (10.5%) |
| $150,000 or more | 1,814 (21.7%) | 507 (14.8%) |
| Total | 8,353 (100.0%) | 3,419 (100.0%) |
Monthly Housing Cost Tiers in Carlsbad
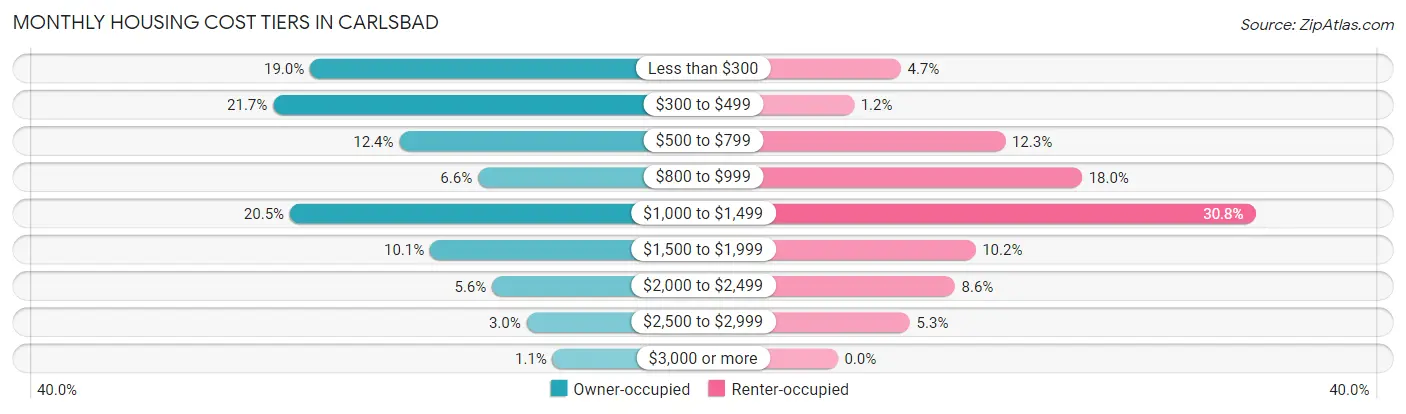
| Monthly Cost | Owner-occupied | Renter-occupied |
| Less than $300 | 1,585 (19.0%) | 159 (4.6%) |
| $300 to $499 | 1,813 (21.7%) | 41 (1.2%) |
| $500 to $799 | 1,036 (12.4%) | 422 (12.3%) |
| $800 to $999 | 552 (6.6%) | 615 (18.0%) |
| $1,000 to $1,499 | 1,709 (20.5%) | 1,052 (30.8%) |
| $1,500 to $1,999 | 847 (10.1%) | 347 (10.2%) |
| $2,000 to $2,499 | 465 (5.6%) | 295 (8.6%) |
| $2,500 to $2,999 | 253 (3.0%) | 182 (5.3%) |
| $3,000 or more | 93 (1.1%) | 0 (0.0%) |
| Total | 8,353 (100.0%) | 3,419 (100.0%) |
Physical Housing Characteristics in Carlsbad
Housing Structures in Carlsbad
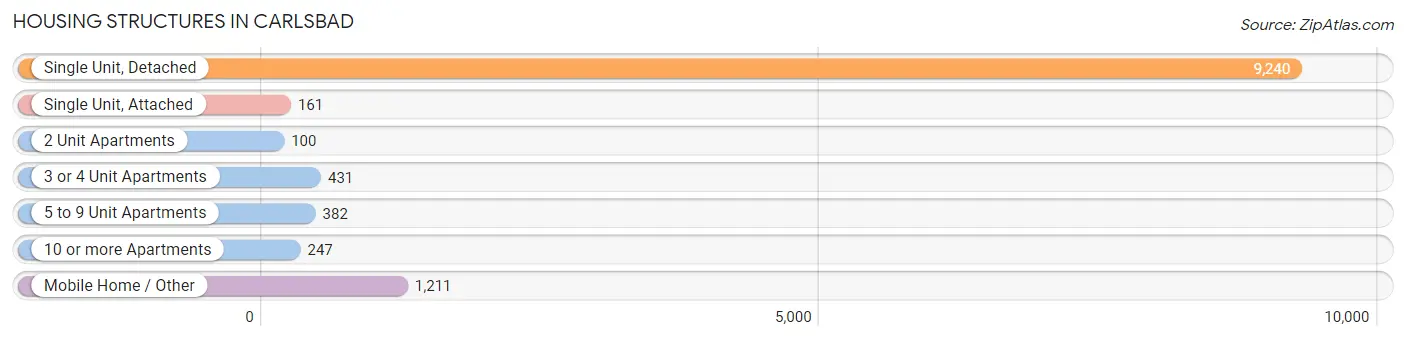
| Structure Type | # Housing Units | % Housing Units |
| Single Unit, Detached | 9,240 | 78.5% |
| Single Unit, Attached | 161 | 1.4% |
| 2 Unit Apartments | 100 | 0.9% |
| 3 or 4 Unit Apartments | 431 | 3.7% |
| 5 to 9 Unit Apartments | 382 | 3.2% |
| 10 or more Apartments | 247 | 2.1% |
| Mobile Home / Other | 1,211 | 10.3% |
| Total | 11,772 | 100.0% |
Housing Structures by Occupancy in Carlsbad
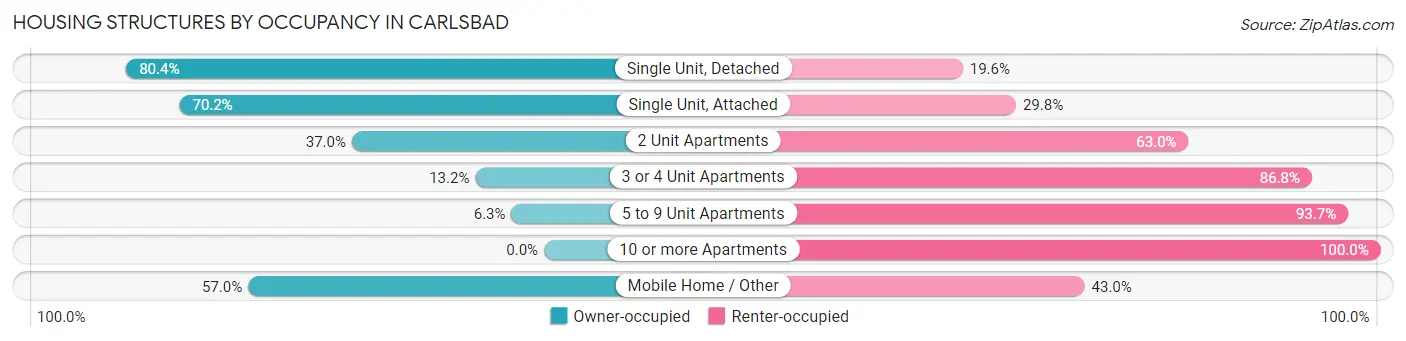
| Structure Type | Owner-occupied | Renter-occupied |
| Single Unit, Detached | 7,432 (80.4%) | 1,808 (19.6%) |
| Single Unit, Attached | 113 (70.2%) | 48 (29.8%) |
| 2 Unit Apartments | 37 (37.0%) | 63 (63.0%) |
| 3 or 4 Unit Apartments | 57 (13.2%) | 374 (86.8%) |
| 5 to 9 Unit Apartments | 24 (6.3%) | 358 (93.7%) |
| 10 or more Apartments | 0 (0.0%) | 247 (100.0%) |
| Mobile Home / Other | 690 (57.0%) | 521 (43.0%) |
| Total | 8,353 (71.0%) | 3,419 (29.0%) |
Housing Structures by Number of Rooms in Carlsbad
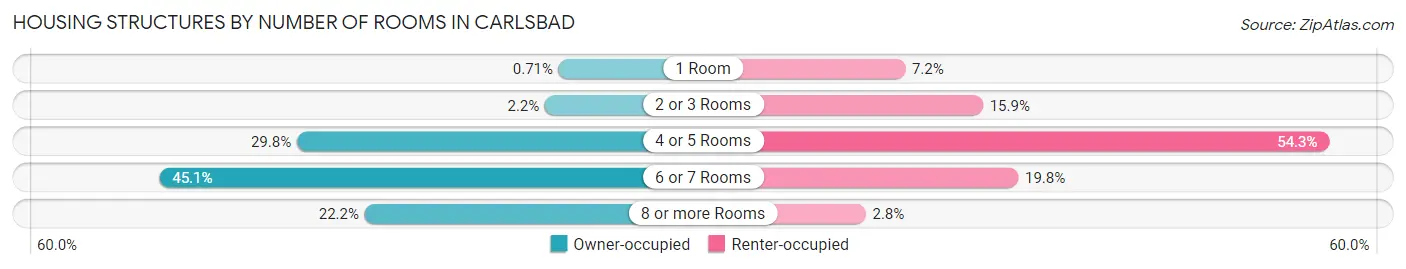
| Number of Rooms | Owner-occupied | Renter-occupied |
| 1 Room | 59 (0.7%) | 247 (7.2%) |
| 2 or 3 Rooms | 186 (2.2%) | 542 (15.9%) |
| 4 or 5 Rooms | 2,487 (29.8%) | 1,857 (54.3%) |
| 6 or 7 Rooms | 3,763 (45.1%) | 676 (19.8%) |
| 8 or more Rooms | 1,858 (22.2%) | 97 (2.8%) |
| Total | 8,353 (100.0%) | 3,419 (100.0%) |
Housing Structure by Heating Type in Carlsbad
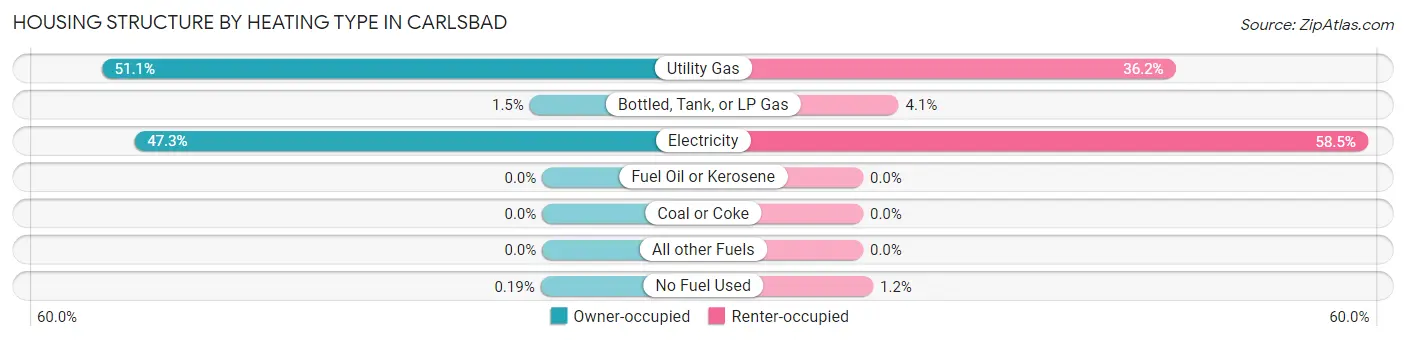
| Heating Type | Owner-occupied | Renter-occupied |
| Utility Gas | 4,266 (51.1%) | 1,238 (36.2%) |
| Bottled, Tank, or LP Gas | 121 (1.5%) | 141 (4.1%) |
| Electricity | 3,950 (47.3%) | 2,000 (58.5%) |
| Fuel Oil or Kerosene | 0 (0.0%) | 0 (0.0%) |
| Coal or Coke | 0 (0.0%) | 0 (0.0%) |
| All other Fuels | 0 (0.0%) | 0 (0.0%) |
| No Fuel Used | 16 (0.2%) | 40 (1.2%) |
| Total | 8,353 (100.0%) | 3,419 (100.0%) |
Household Vehicle Usage in Carlsbad
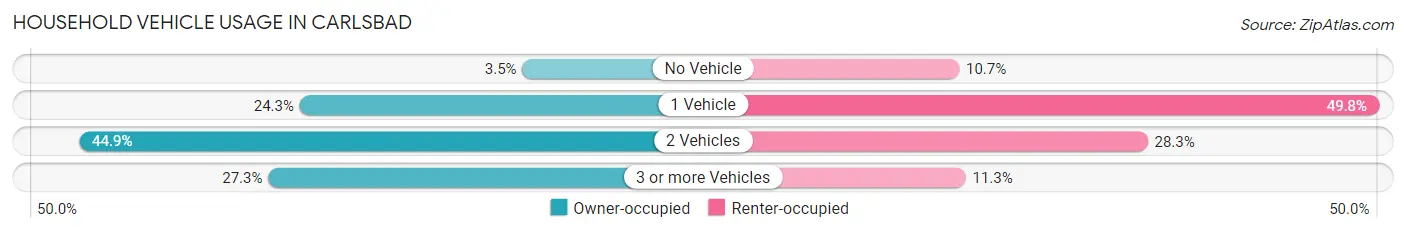
| Vehicles per Household | Owner-occupied | Renter-occupied |
| No Vehicle | 295 (3.5%) | 364 (10.6%) |
| 1 Vehicle | 2,031 (24.3%) | 1,704 (49.8%) |
| 2 Vehicles | 3,751 (44.9%) | 966 (28.2%) |
| 3 or more Vehicles | 2,276 (27.3%) | 385 (11.3%) |
| Total | 8,353 (100.0%) | 3,419 (100.0%) |
Real Estate & Mortgages in Carlsbad
Real Estate and Mortgage Overview in Carlsbad
| Characteristic | Without Mortgage | With Mortgage |
| Housing Units | 4,354 | 3,999 |
| Median Property Value | $159,100 | $217,100 |
| Median Household Income | $60,110 | $1,208 |
| Monthly Housing Costs | $374 | $66 |
| Real Estate Taxes | $712 | $280 |
Property Value by Mortgage Status in Carlsbad
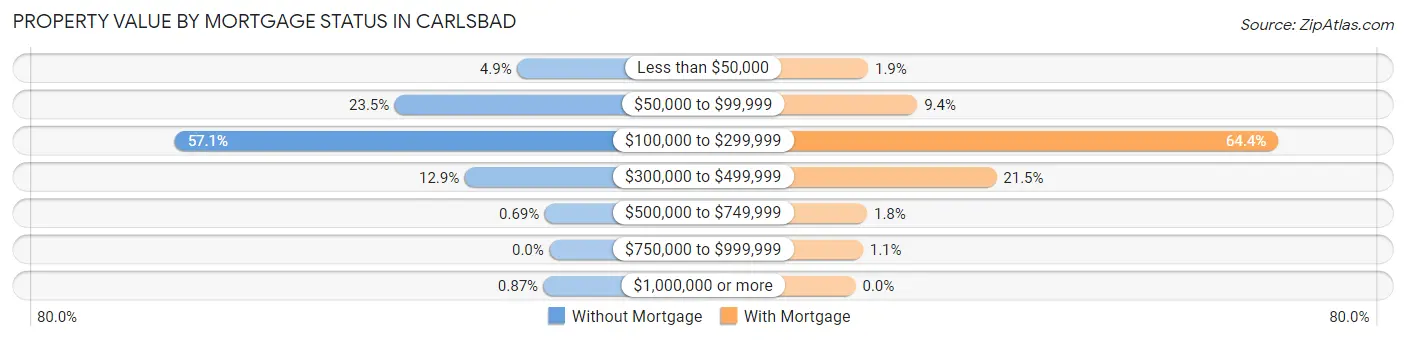
| Property Value | Without Mortgage | With Mortgage |
| Less than $50,000 | 213 (4.9%) | 76 (1.9%) |
| $50,000 to $99,999 | 1,025 (23.5%) | 376 (9.4%) |
| $100,000 to $299,999 | 2,487 (57.1%) | 2,575 (64.4%) |
| $300,000 to $499,999 | 561 (12.9%) | 858 (21.5%) |
| $500,000 to $749,999 | 30 (0.7%) | 70 (1.8%) |
| $750,000 to $999,999 | 0 (0.0%) | 44 (1.1%) |
| $1,000,000 or more | 38 (0.9%) | 0 (0.0%) |
| Total | 4,354 (100.0%) | 3,999 (100.0%) |
Household Income by Mortgage Status in Carlsbad
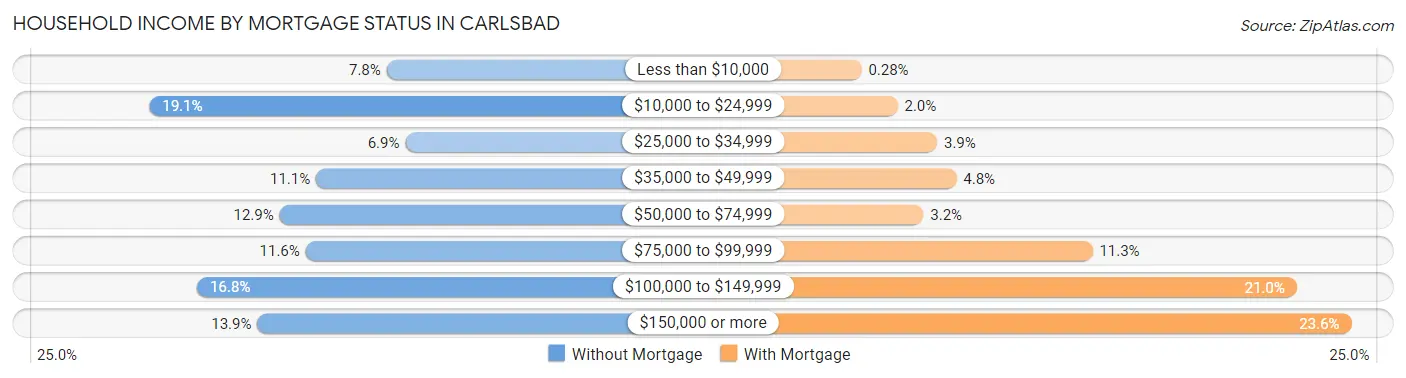
| Household Income | Without Mortgage | With Mortgage |
| Less than $10,000 | 338 (7.8%) | 11 (0.3%) |
| $10,000 to $24,999 | 830 (19.1%) | 80 (2.0%) |
| $25,000 to $34,999 | 299 (6.9%) | 155 (3.9%) |
| $35,000 to $49,999 | 484 (11.1%) | 192 (4.8%) |
| $50,000 to $74,999 | 560 (12.9%) | 129 (3.2%) |
| $75,000 to $99,999 | 506 (11.6%) | 451 (11.3%) |
| $100,000 to $149,999 | 731 (16.8%) | 840 (21.0%) |
| $150,000 or more | 606 (13.9%) | 944 (23.6%) |
| Total | 4,354 (100.0%) | 3,999 (100.0%) |
Property Value to Household Income Ratio in Carlsbad
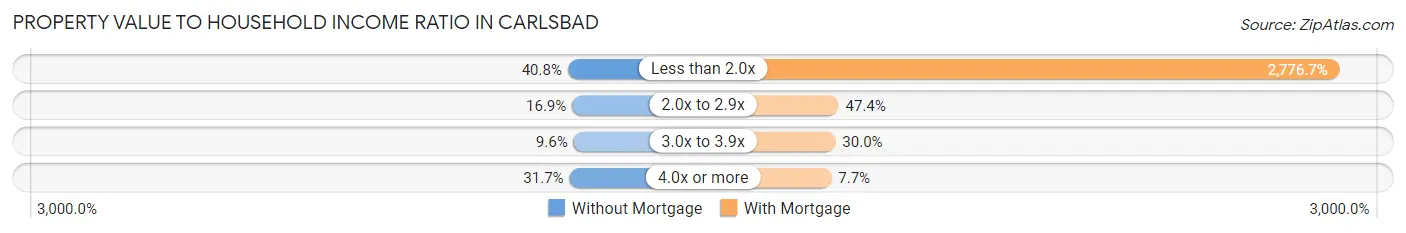
| Value-to-Income Ratio | Without Mortgage | With Mortgage |
| Less than 2.0x | 1,777 (40.8%) | 111,040 (2,776.7%) |
| 2.0x to 2.9x | 735 (16.9%) | 1,895 (47.4%) |
| 3.0x to 3.9x | 416 (9.6%) | 1,199 (30.0%) |
| 4.0x or more | 1,382 (31.7%) | 306 (7.6%) |
| Total | 4,354 (100.0%) | 3,999 (100.0%) |
Real Estate Taxes by Mortgage Status in Carlsbad
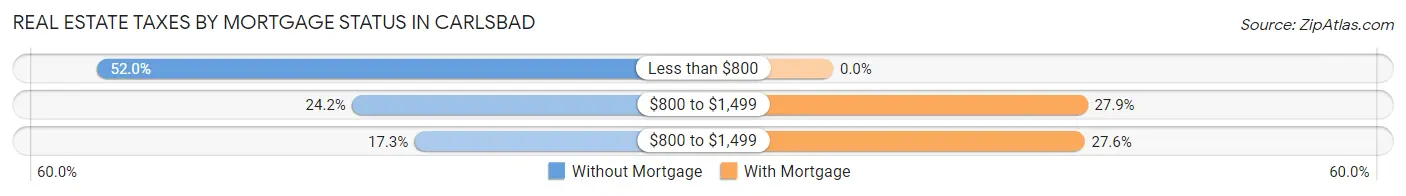
| Property Taxes | Without Mortgage | With Mortgage |
| Less than $800 | 2,264 (52.0%) | 0 (0.0%) |
| $800 to $1,499 | 1,052 (24.2%) | 1,115 (27.9%) |
| $800 to $1,499 | 754 (17.3%) | 1,102 (27.6%) |
| Total | 4,354 (100.0%) | 3,999 (100.0%) |
Health & Disability in Carlsbad
Health Insurance Coverage by Age in Carlsbad
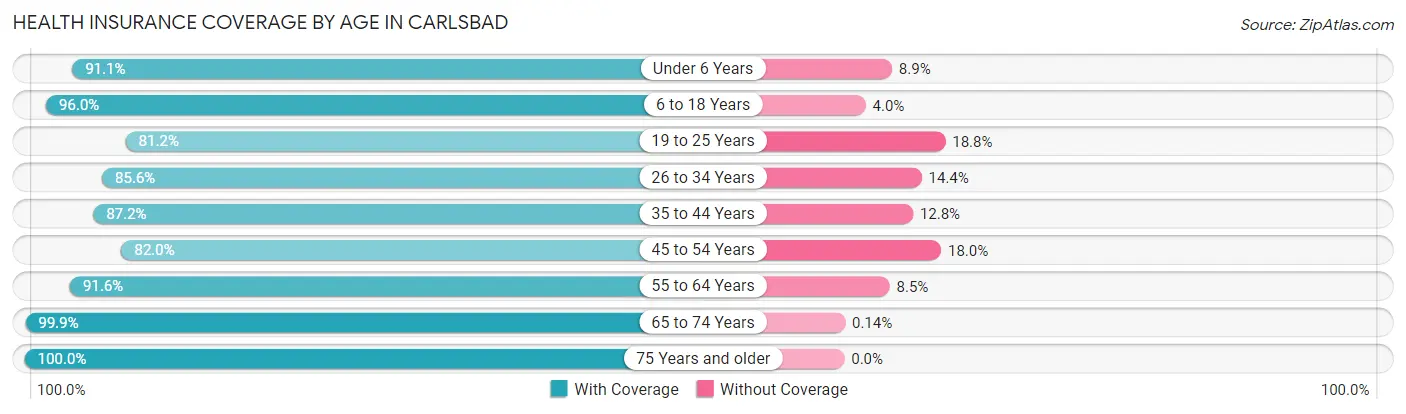
| Age Bracket | With Coverage | Without Coverage |
| Under 6 Years | 2,494 (91.1%) | 243 (8.9%) |
| 6 to 18 Years | 5,570 (96.0%) | 231 (4.0%) |
| 19 to 25 Years | 2,296 (81.2%) | 533 (18.8%) |
| 26 to 34 Years | 3,687 (85.6%) | 621 (14.4%) |
| 35 to 44 Years | 3,487 (87.2%) | 512 (12.8%) |
| 45 to 54 Years | 2,471 (82.0%) | 544 (18.0%) |
| 55 to 64 Years | 3,553 (91.5%) | 328 (8.5%) |
| 65 to 74 Years | 2,953 (99.9%) | 4 (0.1%) |
| 75 Years and older | 1,773 (100.0%) | 0 (0.0%) |
| Total | 28,284 (90.4%) | 3,016 (9.6%) |
Health Insurance Coverage by Citizenship Status in Carlsbad
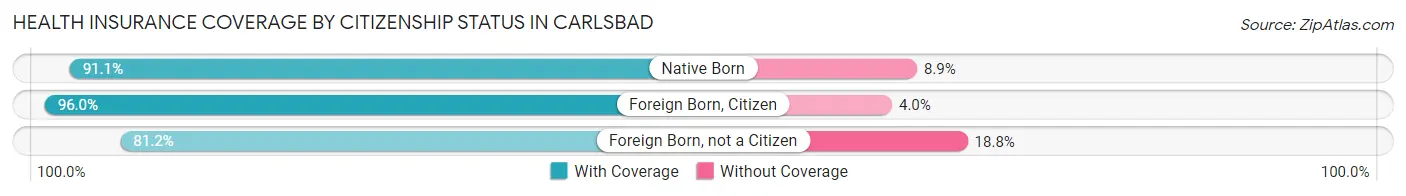
| Citizenship Status | With Coverage | Without Coverage |
| Native Born | 2,494 (91.1%) | 243 (8.9%) |
| Foreign Born, Citizen | 5,570 (96.0%) | 231 (4.0%) |
| Foreign Born, not a Citizen | 2,296 (81.2%) | 533 (18.8%) |
Health Insurance Coverage by Household Income in Carlsbad
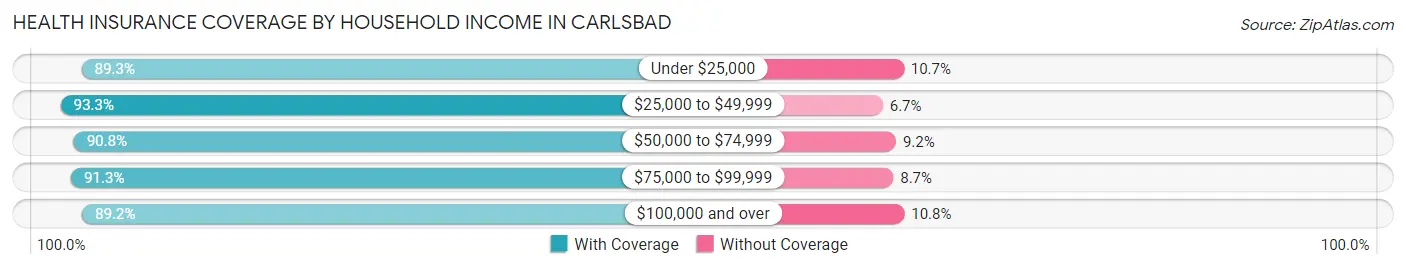
| Household Income | With Coverage | Without Coverage |
| Under $25,000 | 2,894 (89.3%) | 346 (10.7%) |
| $25,000 to $49,999 | 3,860 (93.3%) | 279 (6.7%) |
| $50,000 to $74,999 | 3,834 (90.8%) | 389 (9.2%) |
| $75,000 to $99,999 | 4,609 (91.3%) | 440 (8.7%) |
| $100,000 and over | 12,885 (89.2%) | 1,555 (10.8%) |
Public vs Private Health Insurance Coverage by Age in Carlsbad
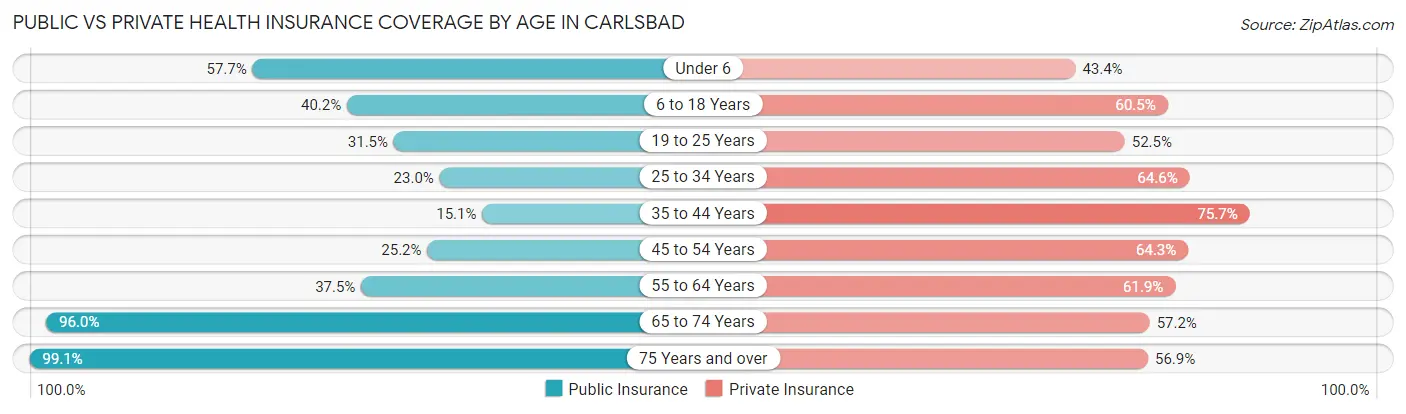
| Age Bracket | Public Insurance | Private Insurance |
| Under 6 | 1,579 (57.7%) | 1,187 (43.4%) |
| 6 to 18 Years | 2,329 (40.2%) | 3,507 (60.5%) |
| 19 to 25 Years | 890 (31.5%) | 1,486 (52.5%) |
| 25 to 34 Years | 989 (23.0%) | 2,781 (64.5%) |
| 35 to 44 Years | 602 (15.0%) | 3,027 (75.7%) |
| 45 to 54 Years | 761 (25.2%) | 1,938 (64.3%) |
| 55 to 64 Years | 1,456 (37.5%) | 2,401 (61.9%) |
| 65 to 74 Years | 2,839 (96.0%) | 1,690 (57.2%) |
| 75 Years and over | 1,757 (99.1%) | 1,008 (56.9%) |
| Total | 13,202 (42.2%) | 19,025 (60.8%) |
Disability Status by Sex by Age in Carlsbad
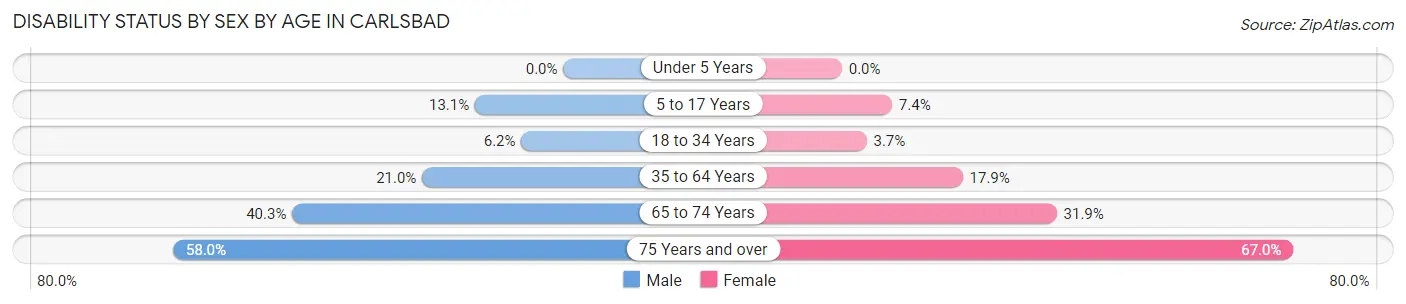
| Age Bracket | Male | Female |
| Under 5 Years | 0 (0.0%) | 0 (0.0%) |
| 5 to 17 Years | 338 (13.1%) | 219 (7.4%) |
| 18 to 34 Years | 255 (6.2%) | 133 (3.7%) |
| 35 to 64 Years | 1,196 (21.0%) | 931 (17.9%) |
| 65 to 74 Years | 620 (40.3%) | 452 (31.9%) |
| 75 Years and over | 356 (58.0%) | 777 (67.0%) |
Disability Class by Sex by Age in Carlsbad
Disability Class: Hearing Difficulty
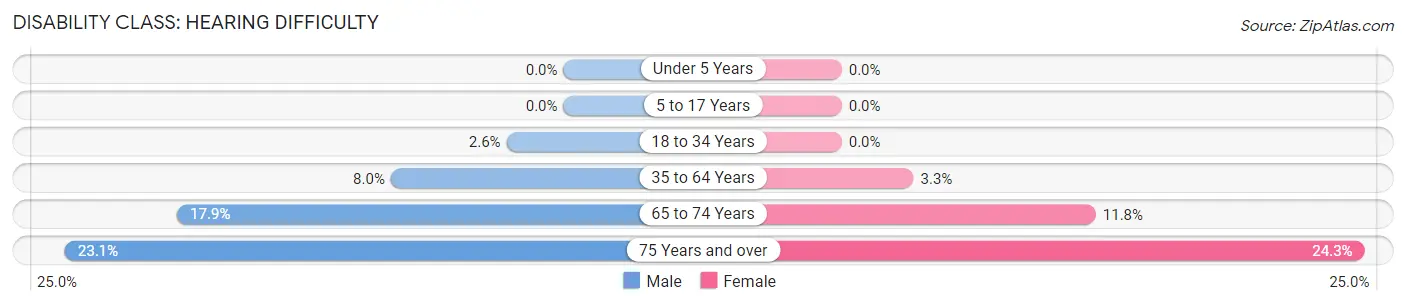
| Age Bracket | Male | Female |
| Under 5 Years | 0 (0.0%) | 0 (0.0%) |
| 5 to 17 Years | 0 (0.0%) | 0 (0.0%) |
| 18 to 34 Years | 108 (2.6%) | 0 (0.0%) |
| 35 to 64 Years | 457 (8.0%) | 173 (3.3%) |
| 65 to 74 Years | 276 (17.9%) | 167 (11.8%) |
| 75 Years and over | 142 (23.1%) | 281 (24.2%) |
Disability Class: Vision Difficulty
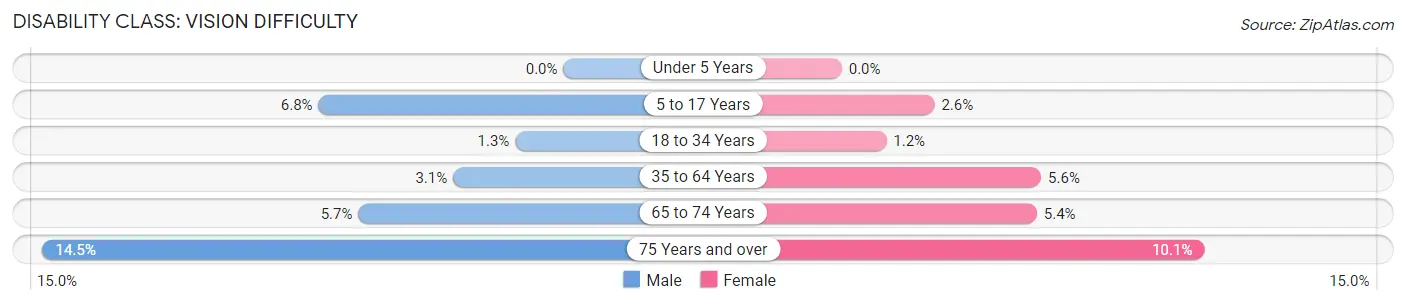
| Age Bracket | Male | Female |
| Under 5 Years | 0 (0.0%) | 0 (0.0%) |
| 5 to 17 Years | 176 (6.8%) | 76 (2.6%) |
| 18 to 34 Years | 55 (1.3%) | 45 (1.2%) |
| 35 to 64 Years | 175 (3.1%) | 288 (5.6%) |
| 65 to 74 Years | 88 (5.7%) | 77 (5.4%) |
| 75 Years and over | 89 (14.5%) | 117 (10.1%) |
Disability Class: Cognitive Difficulty
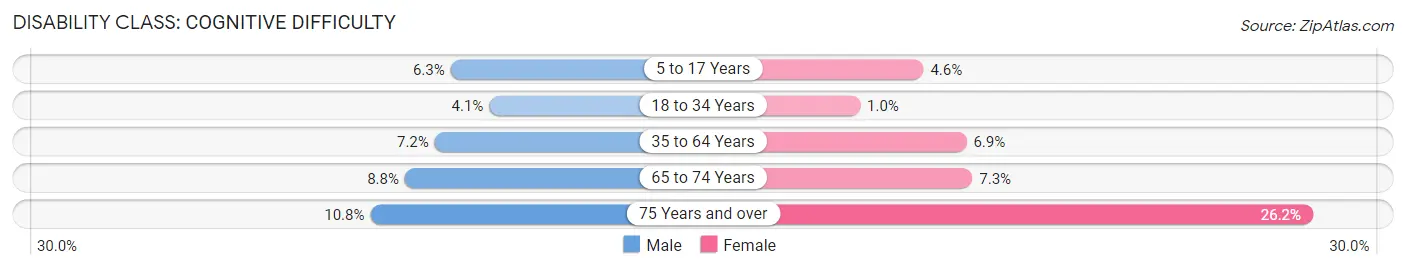
| Age Bracket | Male | Female |
| 5 to 17 Years | 162 (6.3%) | 134 (4.5%) |
| 18 to 34 Years | 169 (4.1%) | 37 (1.0%) |
| 35 to 64 Years | 409 (7.2%) | 360 (6.9%) |
| 65 to 74 Years | 136 (8.8%) | 103 (7.3%) |
| 75 Years and over | 66 (10.7%) | 304 (26.2%) |
Disability Class: Ambulatory Difficulty

| Age Bracket | Male | Female |
| 5 to 17 Years | 0 (0.0%) | 65 (2.2%) |
| 18 to 34 Years | 0 (0.0%) | 51 (1.4%) |
| 35 to 64 Years | 398 (7.0%) | 755 (14.5%) |
| 65 to 74 Years | 405 (26.3%) | 304 (21.4%) |
| 75 Years and over | 108 (17.6%) | 397 (34.3%) |
Disability Class: Self-Care Difficulty
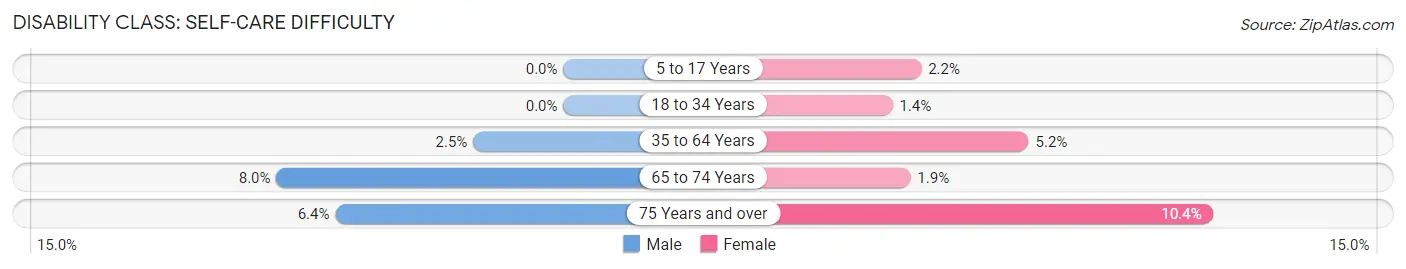
| Age Bracket | Male | Female |
| 5 to 17 Years | 0 (0.0%) | 65 (2.2%) |
| 18 to 34 Years | 0 (0.0%) | 51 (1.4%) |
| 35 to 64 Years | 143 (2.5%) | 270 (5.2%) |
| 65 to 74 Years | 123 (8.0%) | 27 (1.9%) |
| 75 Years and over | 39 (6.4%) | 120 (10.3%) |
Technology Access in Carlsbad
Computing Device Access in Carlsbad
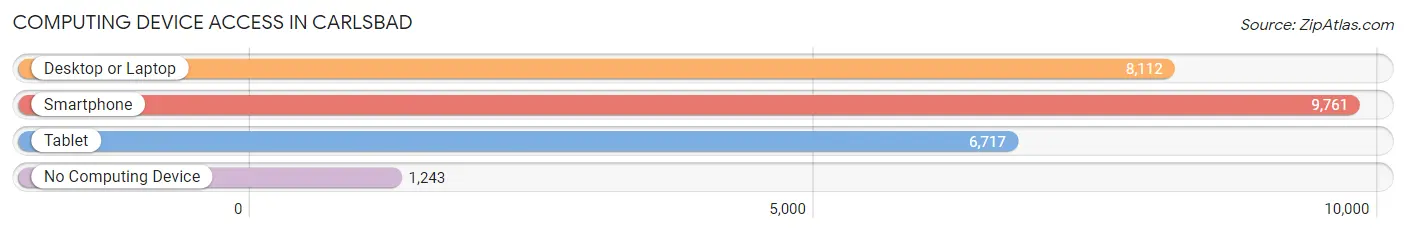
| Device Type | # Households | % Households |
| Desktop or Laptop | 8,112 | 68.9% |
| Smartphone | 9,761 | 82.9% |
| Tablet | 6,717 | 57.1% |
| No Computing Device | 1,243 | 10.6% |
| Total | 11,772 | 100.0% |
Internet Access in Carlsbad
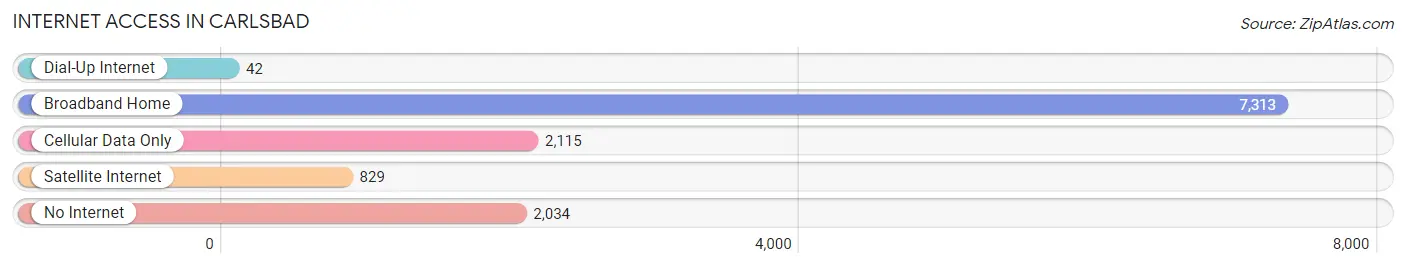
| Internet Type | # Households | % Households |
| Dial-Up Internet | 42 | 0.4% |
| Broadband Home | 7,313 | 62.1% |
| Cellular Data Only | 2,115 | 18.0% |
| Satellite Internet | 829 | 7.0% |
| No Internet | 2,034 | 17.3% |
| Total | 11,772 | 100.0% |
Carlsbad Summary
Carlsbad, New Mexico is a city located in the southeastern corner of the state, in Eddy County. It is the county seat and the largest city in the county. The city is situated along the Pecos River and is known for its many natural attractions, including Carlsbad Caverns National Park, Sitting Bull Falls, and the Living Desert Zoo and Gardens State Park. The city has a population of 28,843 as of the 2020 census, making it the sixth-largest city in New Mexico.
History
The area that is now Carlsbad was first inhabited by the Mescalero Apache and the Jumano tribes. The first European settlers arrived in the area in the late 1800s, and the town was officially founded in 1888. The town was named after the nearby Carlsbad Caverns, which were discovered in the late 1800s.
The town grew rapidly in the early 1900s, and by the 1920s, it had become a major center for oil and gas production. The city was also home to a large potash mining industry, which provided jobs for many of the city’s residents.
In the 1930s, the city was hit hard by the Great Depression, and many of the city’s businesses closed. However, the city was able to recover in the 1940s and 1950s, thanks to the development of the nearby White Sands Missile Range and the opening of the Carlsbad Caverns National Park.
Geography
Carlsbad is located in the southeastern corner of New Mexico, in Eddy County. The city is situated along the Pecos River, and is surrounded by the Guadalupe Mountains to the west and the Chihuahuan Desert to the east. The city has a total area of 24.3 square miles, and has an elevation of 3,619 feet.
The climate in Carlsbad is semi-arid, with hot summers and mild winters. The average annual temperature is 64°F, and the average annual precipitation is 12.5 inches.
Economy
The economy of Carlsbad is largely based on tourism, oil and gas production, and potash mining. The city is home to several major oil and gas companies, including Chevron, ConocoPhillips, and Occidental Petroleum. The city is also home to several potash mining companies, including Intrepid Potash and Mosaic.
The city is also home to several major tourist attractions, including Carlsbad Caverns National Park, Sitting Bull Falls, and the Living Desert Zoo and Gardens State Park. These attractions bring in millions of visitors each year, and provide a major boost to the local economy.
Demographics
As of the 2020 census, the population of Carlsbad was 28,843. The racial makeup of the city was 73.3% White, 1.3% African American, 1.2% Native American, 0.7% Asian, 0.1% Pacific Islander, 19.7% from other races, and 3.9% from two or more races. Hispanic or Latino of any race were 44.2% of the population.
The median household income in Carlsbad was $41,945, and the median family income was $48,945. The per capita income was $20,945. About 17.3% of the population was below the poverty line.
Conclusion
Carlsbad, New Mexico is a city located in the southeastern corner of the state, in Eddy County. It is the county seat and the largest city in the county. The city is situated along the Pecos River and is known for its many natural attractions, including Carlsbad Caverns National Park, Sitting Bull Falls, and the Living Desert Zoo and Gardens State Park. The city has a population of 28,843 as of the 2020 census, making it the sixth-largest city in New Mexico. The economy of Carlsbad is largely based on tourism, oil and gas production, and potash mining. The racial makeup of the city is 73.3% White, 1.3% African American, 1.2% Native American, 0.7% Asian, 0.1% Pacific Islander, 19.7% from other races, and 3.9% from two or more races. Hispanic or Latino of any race were 44.2% of the population. Carlsbad is a vibrant city with a rich history and a diverse economy.
Common Questions
What is Per Capita Income in Carlsbad?
Per Capita income in Carlsbad is $36,262.
What is the Median Family Income in Carlsbad?
Median Family Income in Carlsbad is $96,182.
What is the Median Household income in Carlsbad?
Median Household Income in Carlsbad is $77,209.
What is Income or Wage Gap in Carlsbad?
Income or Wage Gap in Carlsbad is 48.0%.
Women in Carlsbad earn 52.0 cents for every dollar earned by a man.
What is Family Income Deficit in Carlsbad?
Family Income Deficit in Carlsbad is $10,053.
Families that are below poverty line in Carlsbad earn $10,053 less on average than the poverty threshold level.
What is Inequality or Gini Index in Carlsbad?
Inequality or Gini Index in Carlsbad is 0.43.
What is the Total Population of Carlsbad?
Total Population of Carlsbad is 31,755.
What is the Total Male Population of Carlsbad?
Total Male Population of Carlsbad is 16,051.
What is the Total Female Population of Carlsbad?
Total Female Population of Carlsbad is 15,704.
What is the Ratio of Males per 100 Females in Carlsbad?
There are 102.21 Males per 100 Females in Carlsbad.
What is the Ratio of Females per 100 Males in Carlsbad?
There are 97.84 Females per 100 Males in Carlsbad.
What is the Median Population Age in Carlsbad?
Median Population Age in Carlsbad is 35.0 Years.
What is the Average Family Size in Carlsbad
Average Family Size in Carlsbad is 3.2 People.
What is the Average Household Size in Carlsbad
Average Household Size in Carlsbad is 2.6 People.
How Large is the Labor Force in Carlsbad?
There are 14,788 People in the Labor Forcein in Carlsbad.
What is the Percentage of People in the Labor Force in Carlsbad?
59.4% of People are in the Labor Force in Carlsbad.
What is the Unemployment Rate in Carlsbad?
Unemployment Rate in Carlsbad is 3.0%.