Capulin, NM Map & Demographics
Capulin Map
Capulin Overview
$23,369
PER CAPITA INCOME
$39,444
AVG FAMILY INCOME
$32,411
AVG HOUSEHOLD INCOME
0.33
INEQUALITY / GINI INDEX
74
TOTAL POPULATION
43
MALE POPULATION
31
FEMALE POPULATION
138.71
MALES / 100 FEMALES
72.09
FEMALES / 100 MALES
66.8
MEDIAN AGE
3.2
AVG FAMILY SIZE
2.1
AVG HOUSEHOLD SIZE
12
LABOR FORCE [ PEOPLE ]
16.7%
PERCENT IN LABOR FORCE
Capulin Zip Codes
Capulin Area Codes
Income in Capulin
Income Overview in Capulin
Per Capita Income in Capulin is $23,369, while median incomes of families and households are $39,444 and $32,411 respectively.
| Characteristic | Number | Measure |
| Per Capita Income | 74 | $23,369 |
| Median Family Income | 18 | $39,444 |
| Mean Family Income | 18 | $60,611 |
| Median Household Income | 35 | $32,411 |
| Mean Household Income | 35 | $45,003 |
| Income Deficit | 18 | $0 |
| Wage / Income Gap (%) | 74 | 0.00% |
| Wage / Income Gap ($) | 74 | 100.00¢ per $1 |
| Gini / Inequality Index | 74 | 0.33 |
Earnings by Sex in Capulin
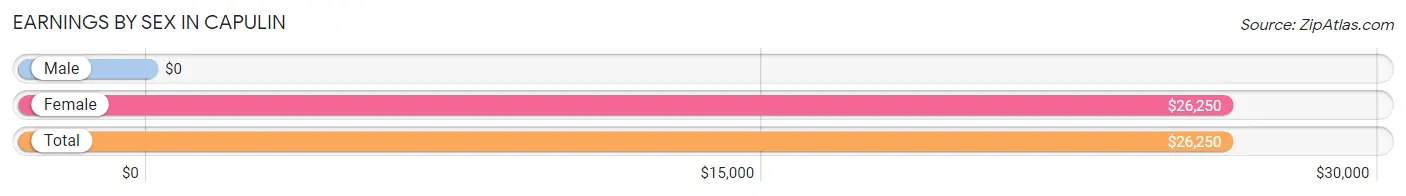
| Sex | Number | Average Earnings |
| Male | 9 (64.3%) | $0 |
| Female | 5 (35.7%) | $26,250 |
| Total | 14 (100.0%) | $26,250 |
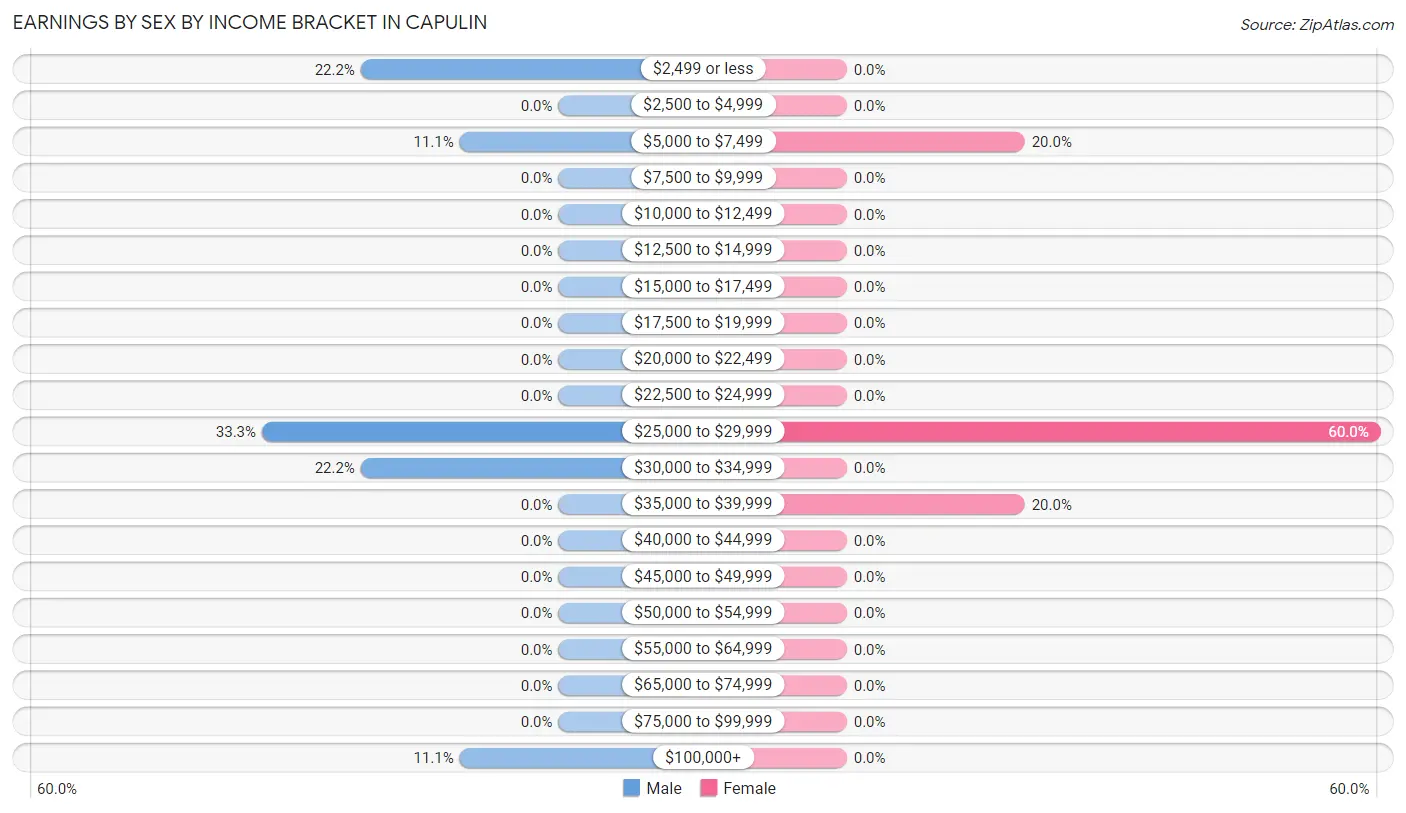
Earnings by Sex by Income Bracket in Capulin
The most common earnings brackets in Capulin are $25,000 to $29,999 for men (3 | 33.3%) and $25,000 to $29,999 for women (3 | 60.0%).
| Income | Male | Female |
| $2,499 or less | 2 (22.2%) | 0 (0.0%) |
| $2,500 to $4,999 | 0 (0.0%) | 0 (0.0%) |
| $5,000 to $7,499 | 1 (11.1%) | 1 (20.0%) |
| $7,500 to $9,999 | 0 (0.0%) | 0 (0.0%) |
| $10,000 to $12,499 | 0 (0.0%) | 0 (0.0%) |
| $12,500 to $14,999 | 0 (0.0%) | 0 (0.0%) |
| $15,000 to $17,499 | 0 (0.0%) | 0 (0.0%) |
| $17,500 to $19,999 | 0 (0.0%) | 0 (0.0%) |
| $20,000 to $22,499 | 0 (0.0%) | 0 (0.0%) |
| $22,500 to $24,999 | 0 (0.0%) | 0 (0.0%) |
| $25,000 to $29,999 | 3 (33.3%) | 3 (60.0%) |
| $30,000 to $34,999 | 2 (22.2%) | 0 (0.0%) |
| $35,000 to $39,999 | 0 (0.0%) | 1 (20.0%) |
| $40,000 to $44,999 | 0 (0.0%) | 0 (0.0%) |
| $45,000 to $49,999 | 0 (0.0%) | 0 (0.0%) |
| $50,000 to $54,999 | 0 (0.0%) | 0 (0.0%) |
| $55,000 to $64,999 | 0 (0.0%) | 0 (0.0%) |
| $65,000 to $74,999 | 0 (0.0%) | 0 (0.0%) |
| $75,000 to $99,999 | 0 (0.0%) | 0 (0.0%) |
| $100,000+ | 1 (11.1%) | 0 (0.0%) |
| Total | 9 (100.0%) | 5 (100.0%) |
Earnings by Sex by Educational Attainment in Capulin
| Educational Attainment | Male Income | Female Income |
| Less than High School | - | - |
| High School Diploma | - | - |
| College or Associate's Degree | - | - |
| Bachelor's Degree | - | - |
| Graduate Degree | - | - |
| Total | - | - |
Family Income in Capulin
Family Income Brackets in Capulin
According to the Capulin family income data, there are 9 families falling into the $35,000 to $49,999 income range, which is the most common income bracket and makes up 50.0% of all families.
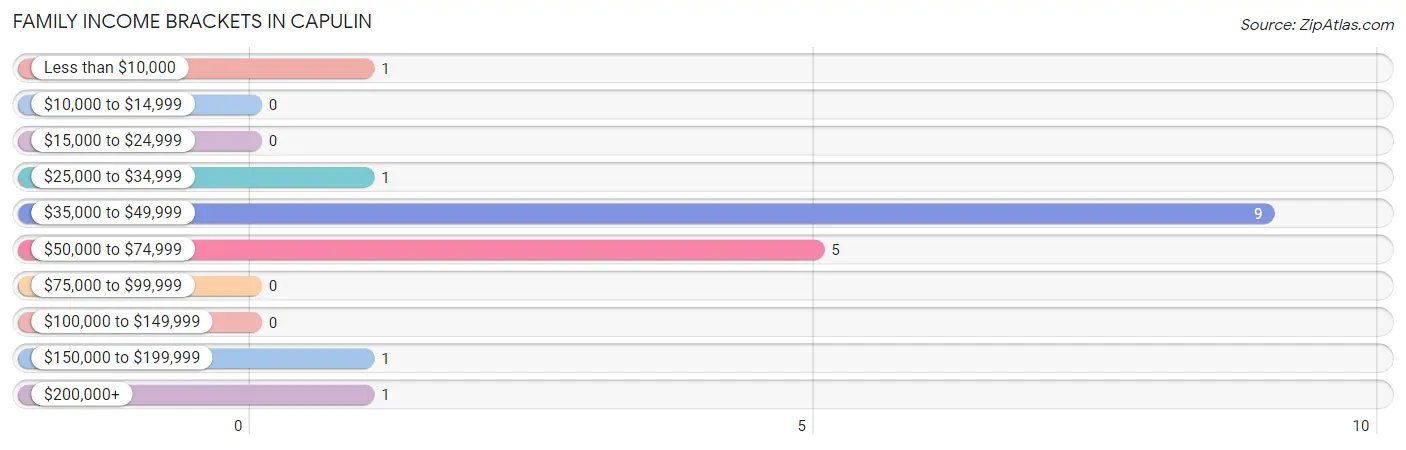
| Income Bracket | # Families | % Families |
| Less than $10,000 | 1 | 5.6% |
| $10,000 to $14,999 | 0 | 0.0% |
| $15,000 to $24,999 | 0 | 0.0% |
| $25,000 to $34,999 | 1 | 5.6% |
| $35,000 to $49,999 | 9 | 50.0% |
| $50,000 to $74,999 | 5 | 27.8% |
| $75,000 to $99,999 | 0 | 0.0% |
| $100,000 to $149,999 | 0 | 0.0% |
| $150,000 to $199,999 | 1 | 5.6% |
| $200,000+ | 1 | 5.6% |
Family Income by Famaliy Size in Capulin
2-person families (14 | 77.8%) account for the highest median family income in Capulin with $38,889 per family, while 2-person families (14 | 77.8%) have the highest median income of $19,444 per family member.
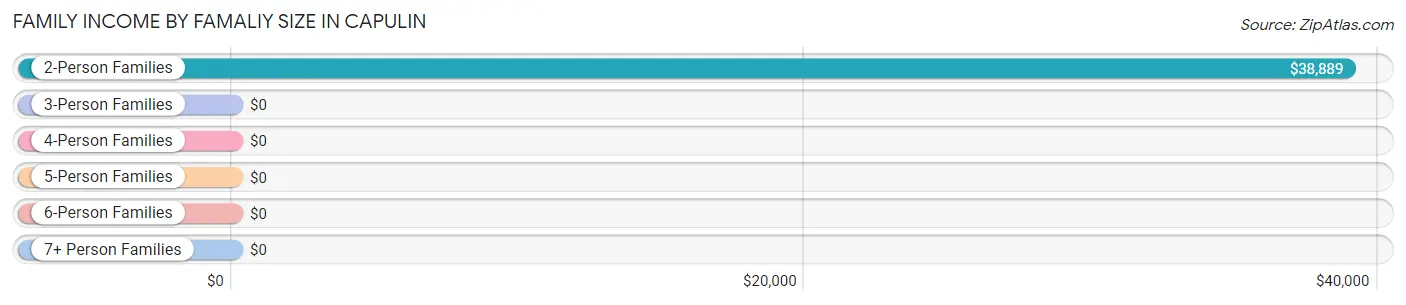
| Income Bracket | # Families | Median Income |
| 2-Person Families | 14 (77.8%) | $38,889 |
| 3-Person Families | 3 (16.7%) | $0 |
| 4-Person Families | 0 (0.0%) | $0 |
| 5-Person Families | 1 (5.6%) | $0 |
| 6-Person Families | 0 (0.0%) | $0 |
| 7+ Person Families | 0 (0.0%) | $0 |
| Total | 18 (100.0%) | $39,444 |
Family Income by Number of Earners in Capulin
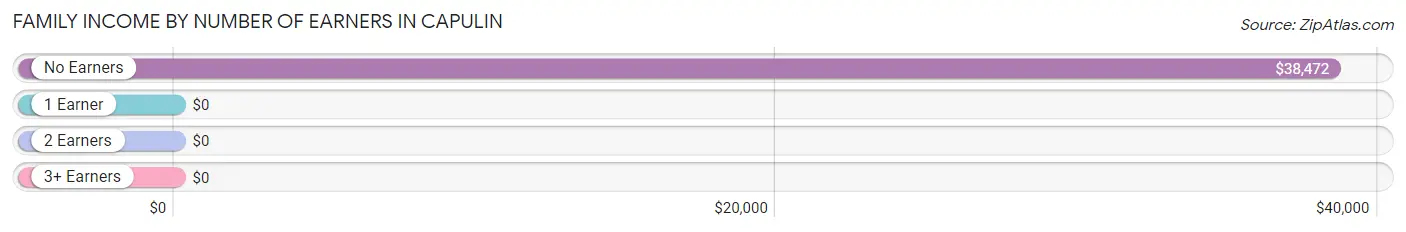
| Number of Earners | # Families | Median Income |
| No Earners | 11 (61.1%) | $38,472 |
| 1 Earner | 2 (11.1%) | $0 |
| 2 Earners | 4 (22.2%) | $0 |
| 3+ Earners | 1 (5.6%) | $0 |
| Total | 18 (100.0%) | $39,444 |
Household Income in Capulin
Household Income Brackets in Capulin
With 15 households falling in the category, the $25,000 to $34,999 income range is the most frequent in Capulin, accounting for 42.9% of all households.
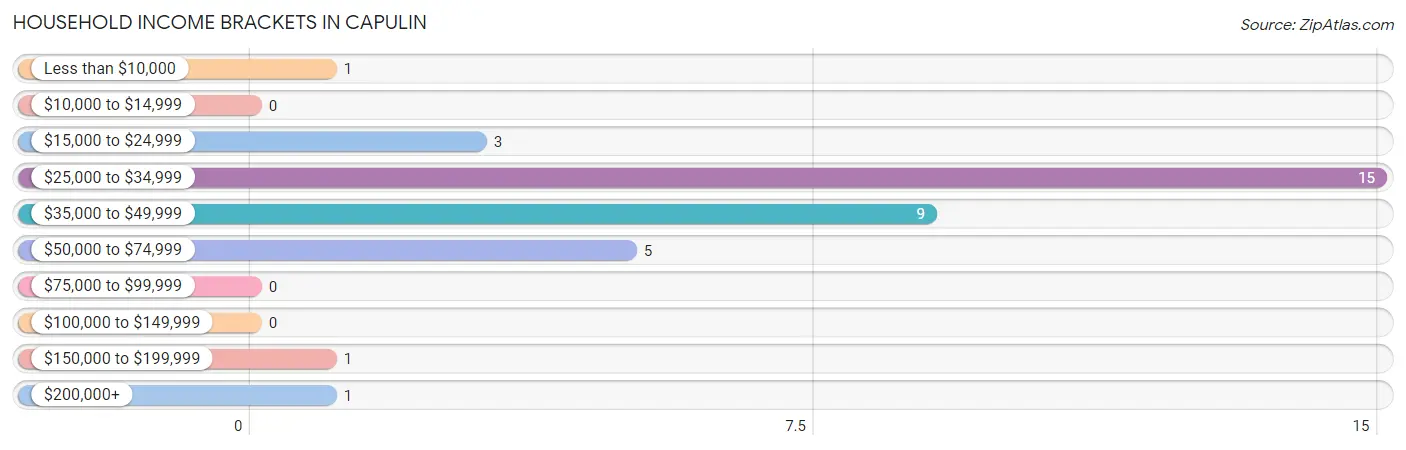
| Income Bracket | # Households | % Households |
| Less than $10,000 | 1 | 2.9% |
| $10,000 to $14,999 | 0 | 0.0% |
| $15,000 to $24,999 | 3 | 8.6% |
| $25,000 to $34,999 | 15 | 42.9% |
| $35,000 to $49,999 | 9 | 25.7% |
| $50,000 to $74,999 | 5 | 14.3% |
| $75,000 to $99,999 | 0 | 0.0% |
| $100,000 to $149,999 | 0 | 0.0% |
| $150,000 to $199,999 | 1 | 2.9% |
| $200,000+ | 1 | 2.9% |
Household Income by Householder Age in Capulin
The median household income in Capulin is $32,411, with the highest median household income of $31,964 found in the 65+ years age bracket for the primary householder. A total of 30 households (85.7%) fall into this category.
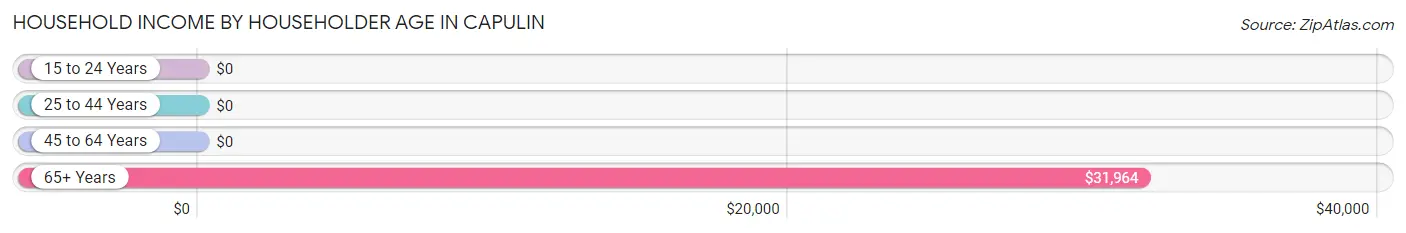
| Income Bracket | # Households | Median Income |
| 15 to 24 Years | 0 (0.0%) | $0 |
| 25 to 44 Years | 1 (2.9%) | $0 |
| 45 to 64 Years | 4 (11.4%) | $0 |
| 65+ Years | 30 (85.7%) | $31,964 |
| Total | 35 (100.0%) | $32,411 |
Poverty in Capulin
Income Below Poverty by Sex and Age in Capulin
With 2.3% poverty level for males and 3.2% for females among the residents of Capulin, 65 to 74 year old males and 65 to 74 year old females are the most vulnerable to poverty, with 1 males (4.5%) and 1 females (20.0%) in their respective age groups living below the poverty level.
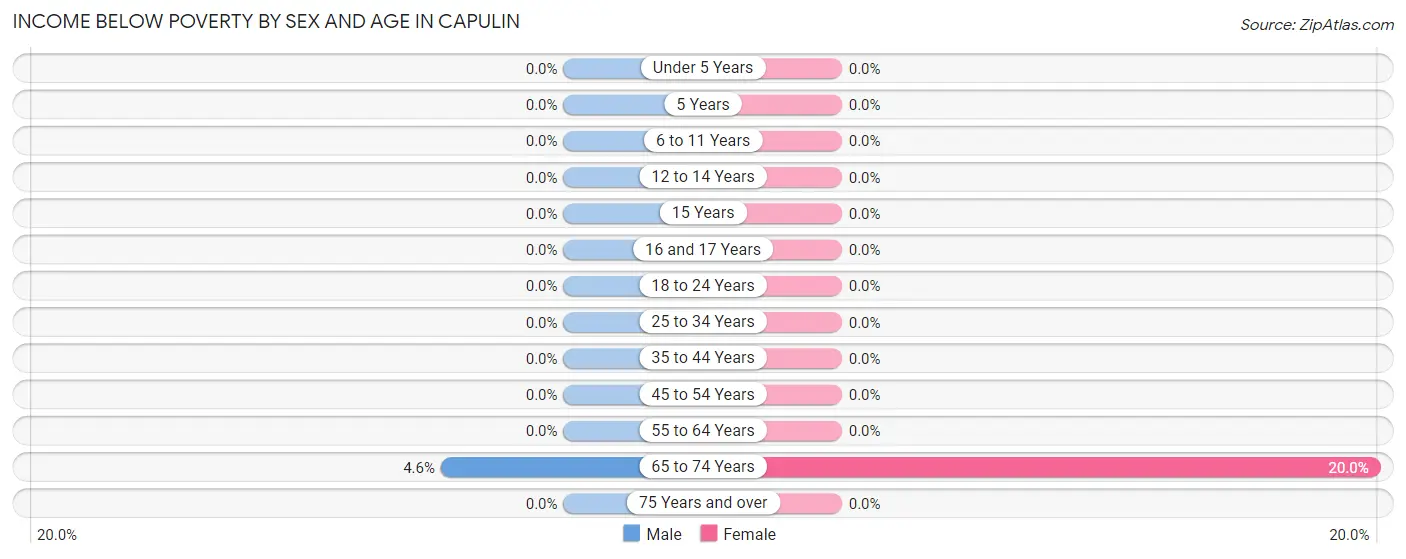
| Age Bracket | Male | Female |
| Under 5 Years | 0 (0.0%) | 0 (0.0%) |
| 5 Years | 0 (0.0%) | 0 (0.0%) |
| 6 to 11 Years | 0 (0.0%) | 0 (0.0%) |
| 12 to 14 Years | 0 (0.0%) | 0 (0.0%) |
| 15 Years | 0 (0.0%) | 0 (0.0%) |
| 16 and 17 Years | 0 (0.0%) | 0 (0.0%) |
| 18 to 24 Years | 0 (0.0%) | 0 (0.0%) |
| 25 to 34 Years | 0 (0.0%) | 0 (0.0%) |
| 35 to 44 Years | 0 (0.0%) | 0 (0.0%) |
| 45 to 54 Years | 0 (0.0%) | 0 (0.0%) |
| 55 to 64 Years | 0 (0.0%) | 0 (0.0%) |
| 65 to 74 Years | 1 (4.5%) | 1 (20.0%) |
| 75 Years and over | 0 (0.0%) | 0 (0.0%) |
| Total | 1 (2.3%) | 1 (3.2%) |
Income Above Poverty by Sex and Age in Capulin
According to the poverty statistics in Capulin, males aged 16 and 17 years and females aged 6 to 11 years are the age groups that are most secure financially, with 100.0% of males and 100.0% of females in these age groups living above the poverty line.
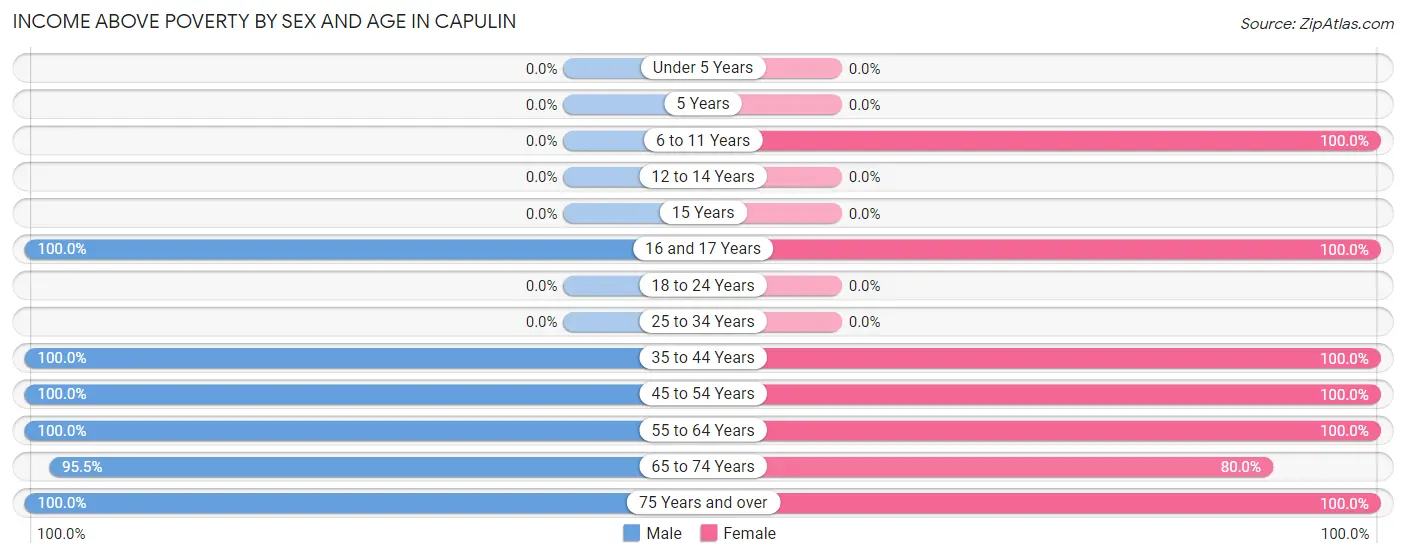
| Age Bracket | Male | Female |
| Under 5 Years | 0 (0.0%) | 0 (0.0%) |
| 5 Years | 0 (0.0%) | 0 (0.0%) |
| 6 to 11 Years | 0 (0.0%) | 2 (100.0%) |
| 12 to 14 Years | 0 (0.0%) | 0 (0.0%) |
| 15 Years | 0 (0.0%) | 0 (0.0%) |
| 16 and 17 Years | 2 (100.0%) | 6 (100.0%) |
| 18 to 24 Years | 0 (0.0%) | 0 (0.0%) |
| 25 to 34 Years | 0 (0.0%) | 0 (0.0%) |
| 35 to 44 Years | 1 (100.0%) | 1 (100.0%) |
| 45 to 54 Years | 3 (100.0%) | 3 (100.0%) |
| 55 to 64 Years | 1 (100.0%) | 1 (100.0%) |
| 65 to 74 Years | 21 (95.5%) | 4 (80.0%) |
| 75 Years and over | 14 (100.0%) | 13 (100.0%) |
| Total | 42 (97.7%) | 30 (96.8%) |
Income Below Poverty Among Married-Couple Families in Capulin
The poverty statistics for married-couple families in Capulin show that 12.5% or 1 of the total 8 families live below the poverty line. Families with no children have the highest poverty rate of 25.0%, comprising of 1 families. On the other hand, families with 1 or 2 children have the lowest poverty rate of 0.0%, which includes 0 families.
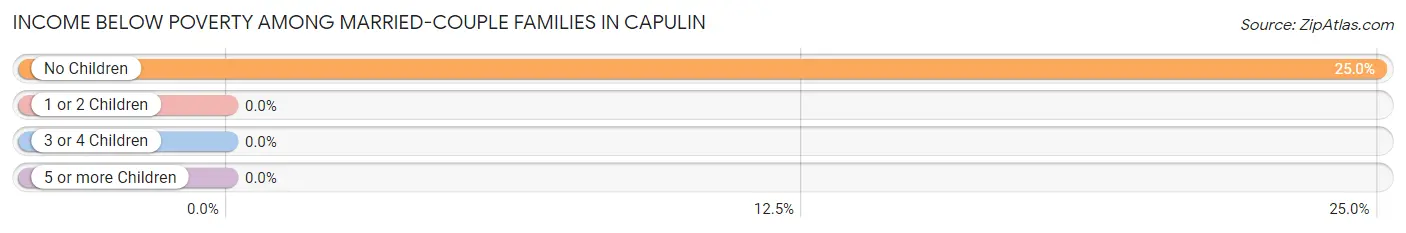
| Children | Above Poverty | Below Poverty |
| No Children | 3 (75.0%) | 1 (25.0%) |
| 1 or 2 Children | 4 (100.0%) | 0 (0.0%) |
| 3 or 4 Children | 0 (0.0%) | 0 (0.0%) |
| 5 or more Children | 0 (0.0%) | 0 (0.0%) |
| Total | 7 (87.5%) | 1 (12.5%) |
Income Below Poverty Among Single-Parent Households in Capulin
| Children | Single Father | Single Mother |
| No Children | 0 (0.0%) | 0 (0.0%) |
| 1 or 2 Children | 0 (0.0%) | 0 (0.0%) |
| 3 or 4 Children | 0 (0.0%) | 0 (0.0%) |
| 5 or more Children | 0 (0.0%) | 0 (0.0%) |
| Total | 0 (0.0%) | 0 (0.0%) |
Income Below Poverty Among Married-Couple vs Single-Parent Households in Capulin
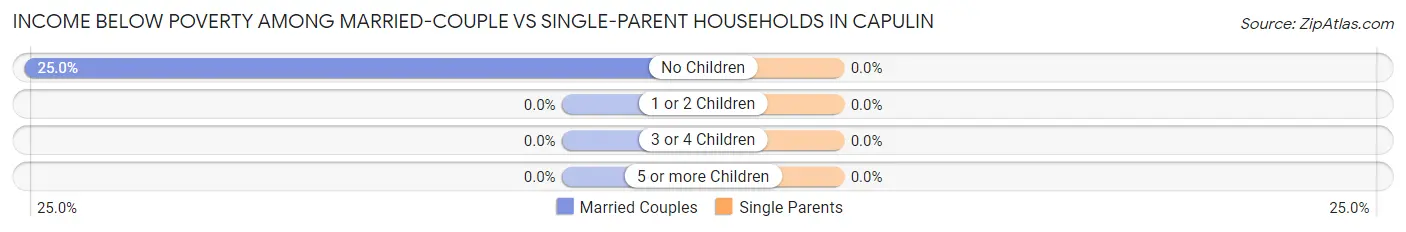
| Children | Married-Couple Families | Single-Parent Households |
| No Children | 1 (25.0%) | 0 (0.0%) |
| 1 or 2 Children | 0 (0.0%) | 0 (0.0%) |
| 3 or 4 Children | 0 (0.0%) | 0 (0.0%) |
| 5 or more Children | 0 (0.0%) | 0 (0.0%) |
| Total | 1 (12.5%) | 0 (0.0%) |
Race in Capulin
The most populous races in Capulin are White / Caucasian (44 | 59.5%), Hispanic or Latino (37 | 50.0%), and Two or more Races (26 | 35.1%).
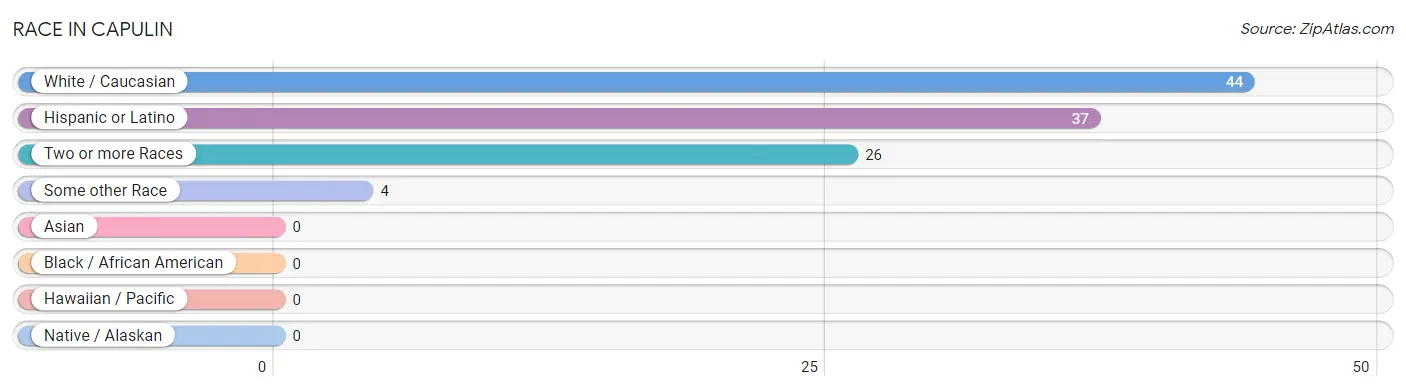
| Race | # Population | % Population |
| Asian | 0 | 0.0% |
| Black / African American | 0 | 0.0% |
| Hawaiian / Pacific | 0 | 0.0% |
| Hispanic or Latino | 37 | 50.0% |
| Native / Alaskan | 0 | 0.0% |
| White / Caucasian | 44 | 59.5% |
| Two or more Races | 26 | 35.1% |
| Some other Race | 4 | 5.4% |
| Total | 74 | 100.0% |
Ancestry in Capulin
The most populous ancestries reported in Capulin are Mexican (33 | 44.6%), French (26 | 35.1%), English (12 | 16.2%), Italian (9 | 12.2%), and German (3 | 4.1%), together accounting for 112.2% of all Capulin residents.
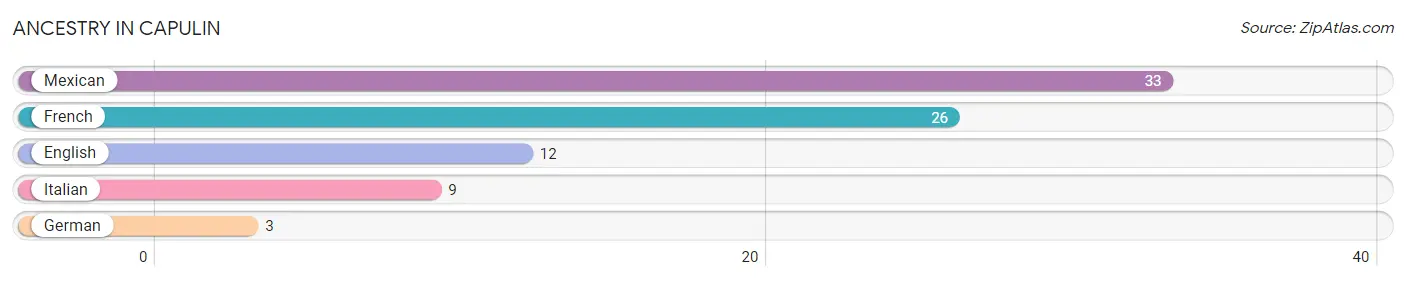
| Ancestry | # Population | % Population |
| English | 12 | 16.2% |
| French | 26 | 35.1% |
| German | 3 | 4.1% |
| Italian | 9 | 12.2% |
| Mexican | 33 | 44.6% | View All 5 Rows |
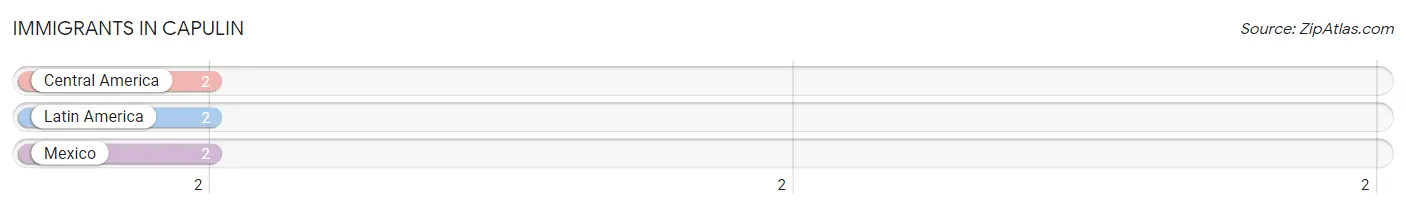
Immigrants in Capulin
The most numerous immigrant groups reported in Capulin came from Central America (2 | 2.7%), Latin America (2 | 2.7%), and Mexico (2 | 2.7%), together accounting for 8.1% of all Capulin residents.
| Immigration Origin | # Population | % Population |
| Central America | 2 | 2.7% |
| Latin America | 2 | 2.7% |
| Mexico | 2 | 2.7% | View All 3 Rows |
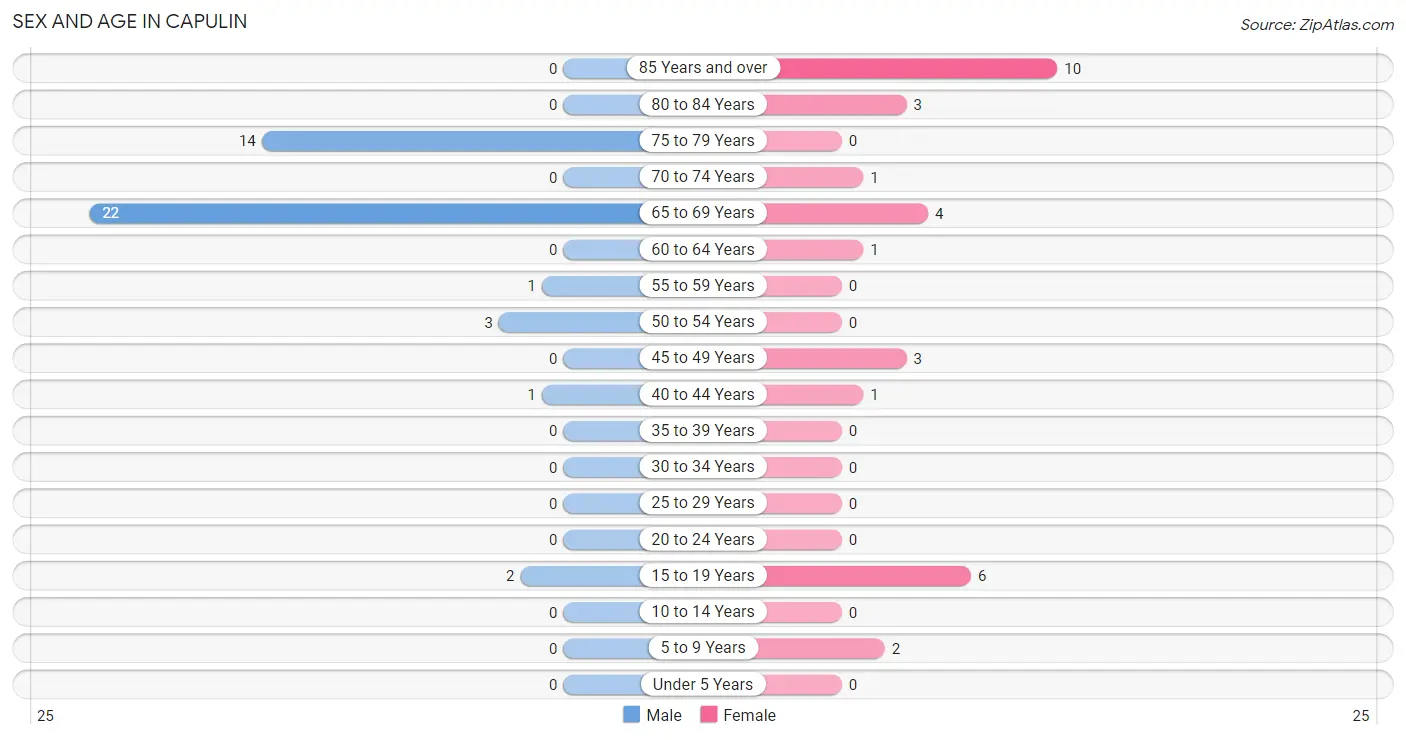
Sex and Age in Capulin
Sex and Age in Capulin
The most populous age groups in Capulin are 65 to 69 Years (22 | 51.2%) for men and 85 Years and over (10 | 32.3%) for women.
| Age Bracket | Male | Female |
| Under 5 Years | 0 (0.0%) | 0 (0.0%) |
| 5 to 9 Years | 0 (0.0%) | 2 (6.5%) |
| 10 to 14 Years | 0 (0.0%) | 0 (0.0%) |
| 15 to 19 Years | 2 (4.6%) | 6 (19.4%) |
| 20 to 24 Years | 0 (0.0%) | 0 (0.0%) |
| 25 to 29 Years | 0 (0.0%) | 0 (0.0%) |
| 30 to 34 Years | 0 (0.0%) | 0 (0.0%) |
| 35 to 39 Years | 0 (0.0%) | 0 (0.0%) |
| 40 to 44 Years | 1 (2.3%) | 1 (3.2%) |
| 45 to 49 Years | 0 (0.0%) | 3 (9.7%) |
| 50 to 54 Years | 3 (7.0%) | 0 (0.0%) |
| 55 to 59 Years | 1 (2.3%) | 0 (0.0%) |
| 60 to 64 Years | 0 (0.0%) | 1 (3.2%) |
| 65 to 69 Years | 22 (51.2%) | 4 (12.9%) |
| 70 to 74 Years | 0 (0.0%) | 1 (3.2%) |
| 75 to 79 Years | 14 (32.6%) | 0 (0.0%) |
| 80 to 84 Years | 0 (0.0%) | 3 (9.7%) |
| 85 Years and over | 0 (0.0%) | 10 (32.3%) |
| Total | 43 (100.0%) | 31 (100.0%) |
Families and Households in Capulin
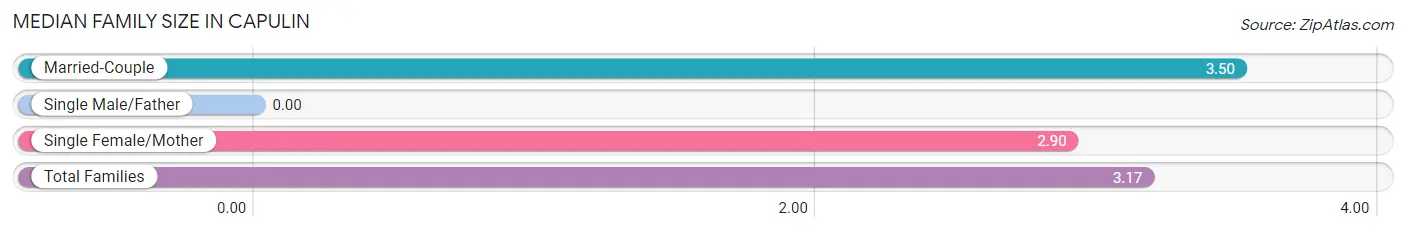
Median Family Size in Capulin
| Family Type | # Families | Family Size |
| Married-Couple | 8 (44.4%) | 3.50 |
| Single Male/Father | 0 (0.0%) | - |
| Single Female/Mother | 10 (55.6%) | 2.90 |
| Total Families | 18 (100.0%) | 3.17 |
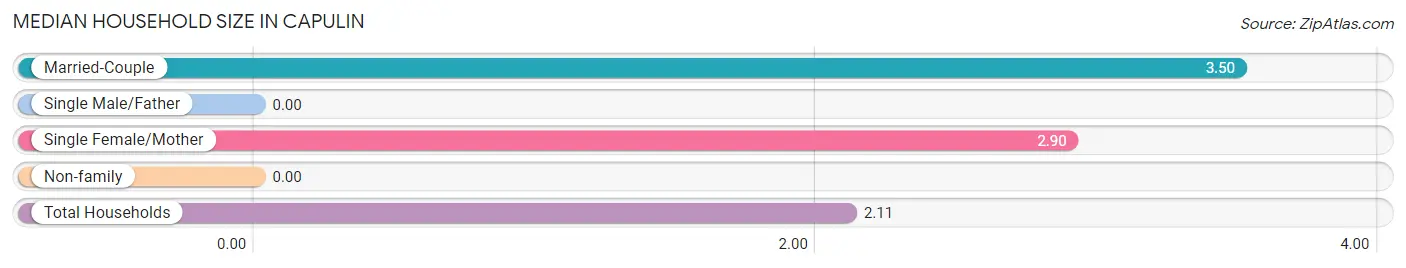
Median Household Size in Capulin
| Household Type | # Households | Household Size |
| Married-Couple | 8 (22.9%) | 3.50 |
| Single Male/Father | 0 (0.0%) | - |
| Single Female/Mother | 10 (28.6%) | 2.90 |
| Non-family | 17 (48.6%) | - |
| Total Households | 35 (100.0%) | 2.11 |
Household Size by Marriage Status in Capulin
Out of a total of 35 households in Capulin, 18 (51.4%) are family households, while 17 (48.6%) are nonfamily households. The most numerous type of family households are 2-person households, comprising 14, and the most common type of nonfamily households are 1-person households, comprising 17.
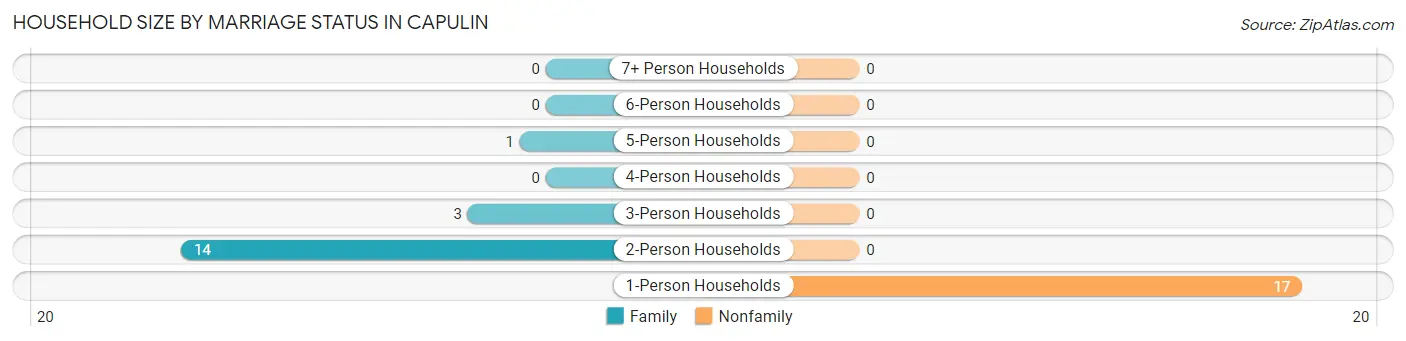
| Household Size | Family Households | Nonfamily Households |
| 1-Person Households | - | 17 (48.6%) |
| 2-Person Households | 14 (40.0%) | 0 (0.0%) |
| 3-Person Households | 3 (8.6%) | 0 (0.0%) |
| 4-Person Households | 0 (0.0%) | 0 (0.0%) |
| 5-Person Households | 1 (2.9%) | 0 (0.0%) |
| 6-Person Households | 0 (0.0%) | 0 (0.0%) |
| 7+ Person Households | 0 (0.0%) | 0 (0.0%) |
| Total | 18 (51.4%) | 17 (48.6%) |
Female Fertility in Capulin
Fertility by Age in Capulin
| Age Bracket | Women with Births | Births / 1,000 Women |
| 15 to 19 years | 0 (0.0%) | 0.0 |
| 20 to 34 years | 0 (0.0%) | 0.0 |
| 35 to 50 years | 0 (0.0%) | 0.0 |
| Total | 0 (0.0%) | 0.0 |
Fertility by Age by Marriage Status in Capulin
| Age Bracket | Married | Unmarried |
| 15 to 19 years | 0 (0.0%) | 0 (0.0%) |
| 20 to 34 years | 0 (0.0%) | 0 (0.0%) |
| 35 to 50 years | 0 (0.0%) | 0 (0.0%) |
| Total | 0 (0.0%) | 0 (0.0%) |
Fertility by Education in Capulin
| Educational Attainment | Women with Births | Births / 1,000 Women |
| Less than High School | 0 (0.0%) | 0.0 |
| High School Diploma | 0 (0.0%) | 0.0 |
| College or Associate's Degree | 0 (0.0%) | 0.0 |
| Bachelor's Degree | 0 (0.0%) | 0.0 |
| Graduate Degree | 0 (0.0%) | 0.0 |
| Total | 0 (0.0%) | 0.0 |
Fertility by Education by Marriage Status in Capulin
| Educational Attainment | Married | Unmarried |
| Less than High School | 0 (0.0%) | 0 (0.0%) |
| High School Diploma | 0 (0.0%) | 0 (0.0%) |
| College or Associate's Degree | 0 (0.0%) | 0 (0.0%) |
| Bachelor's Degree | 0 (0.0%) | 0 (0.0%) |
| Graduate Degree | 0 (0.0%) | 0 (0.0%) |
| Total | 0 (0.0%) | 0 (0.0%) |
Employment Characteristics in Capulin
Employment by Class of Employer in Capulin
Among the 12 employed individuals in Capulin, self-employed (not incorporated) (7 | 58.3%), private company employees (2 | 16.7%), and self-employed (incorporated) (1 | 8.3%) make up the most common classes of employment.
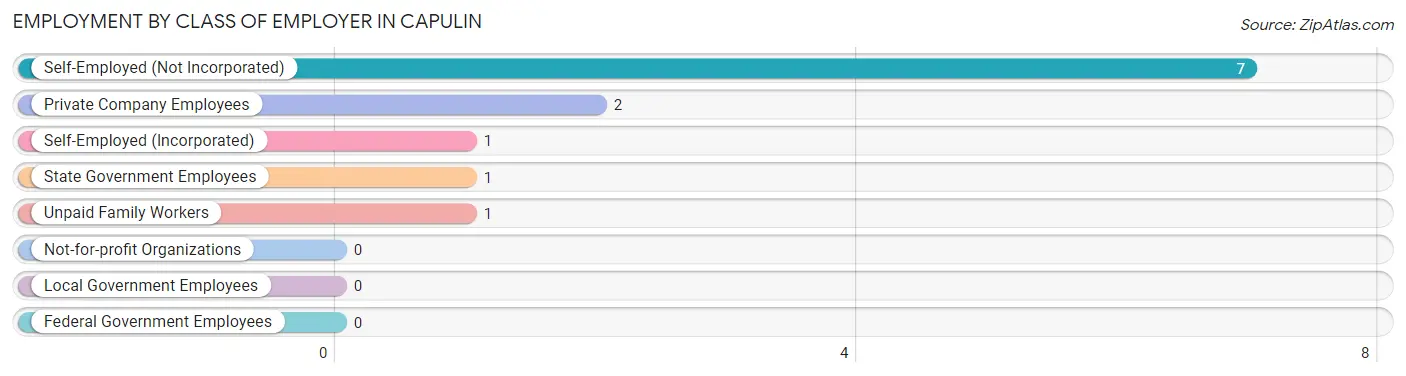
| Employer Class | # Employees | % Employees |
| Private Company Employees | 2 | 16.7% |
| Self-Employed (Incorporated) | 1 | 8.3% |
| Self-Employed (Not Incorporated) | 7 | 58.3% |
| Not-for-profit Organizations | 0 | 0.0% |
| Local Government Employees | 0 | 0.0% |
| State Government Employees | 1 | 8.3% |
| Federal Government Employees | 0 | 0.0% |
| Unpaid Family Workers | 1 | 8.3% |
| Total | 12 | 100.0% |
Employment Status by Age in Capulin
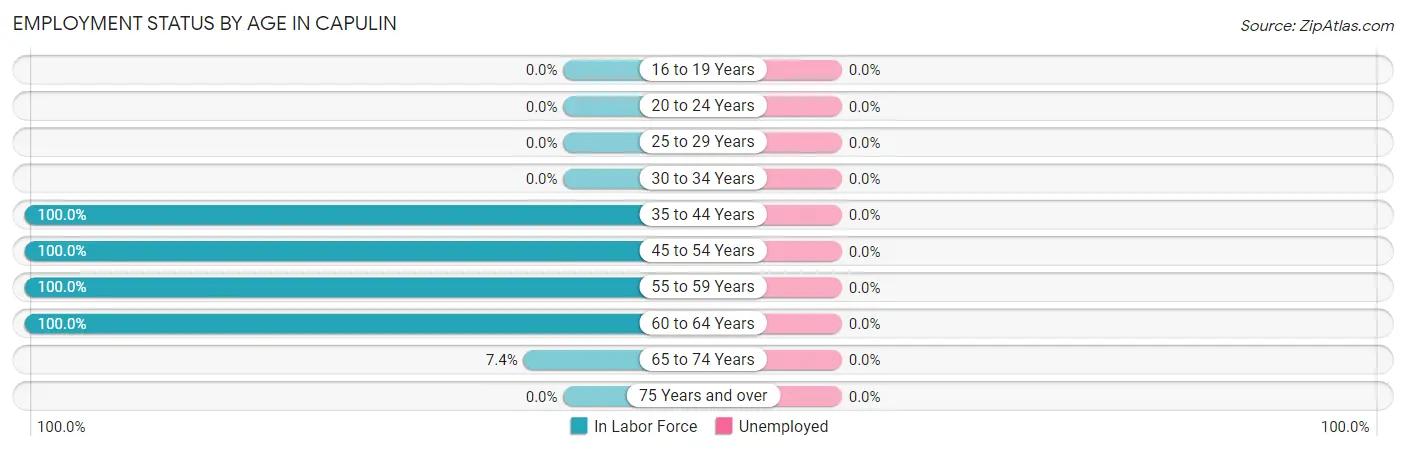
| Age Bracket | In Labor Force | Unemployed |
| 16 to 19 Years | 0 (0.0%) | 0 (0.0%) |
| 20 to 24 Years | 0 (0.0%) | 0 (0.0%) |
| 25 to 29 Years | 0 (0.0%) | 0 (0.0%) |
| 30 to 34 Years | 0 (0.0%) | 0 (0.0%) |
| 35 to 44 Years | 2 (100.0%) | 0 (0.0%) |
| 45 to 54 Years | 6 (100.0%) | 0 (0.0%) |
| 55 to 59 Years | 1 (100.0%) | 0 (0.0%) |
| 60 to 64 Years | 1 (100.0%) | 0 (0.0%) |
| 65 to 74 Years | 2 (7.4%) | 0 (0.0%) |
| 75 Years and over | 0 (0.0%) | 0 (0.0%) |
| Total | 12 (16.7%) | 0 (0.0%) |
Employment Status by Educational Attainment in Capulin
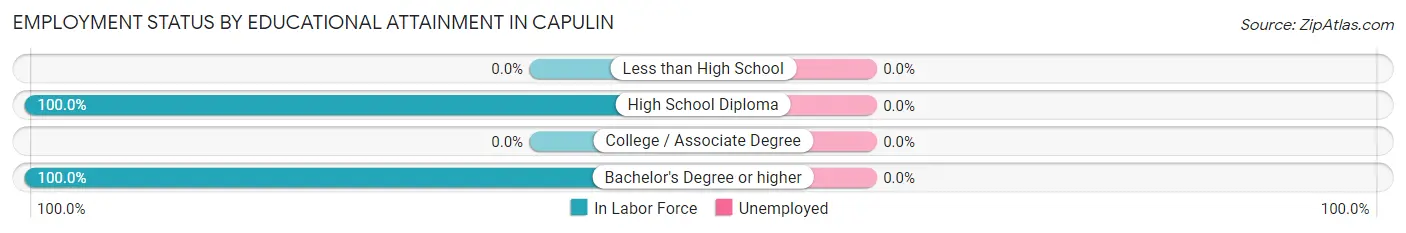
| Educational Attainment | In Labor Force | Unemployed |
| Less than High School | 0 (0.0%) | 0 (0.0%) |
| High School Diploma | 6 (100.0%) | 0 (0.0%) |
| College / Associate Degree | 0 (0.0%) | 0 (0.0%) |
| Bachelor's Degree or higher | 4 (100.0%) | 0 (0.0%) |
| Total | 10 (100.0%) | 0 (0.0%) |
Employment Occupations by Sex in Capulin
Management, Business, Science and Arts Occupations
The most common Management, Business, Science and Arts occupations in Capulin are Community & Social Service (3 | 25.0%), Arts, Media & Entertainment (3 | 25.0%), and Management (1 | 8.3%).
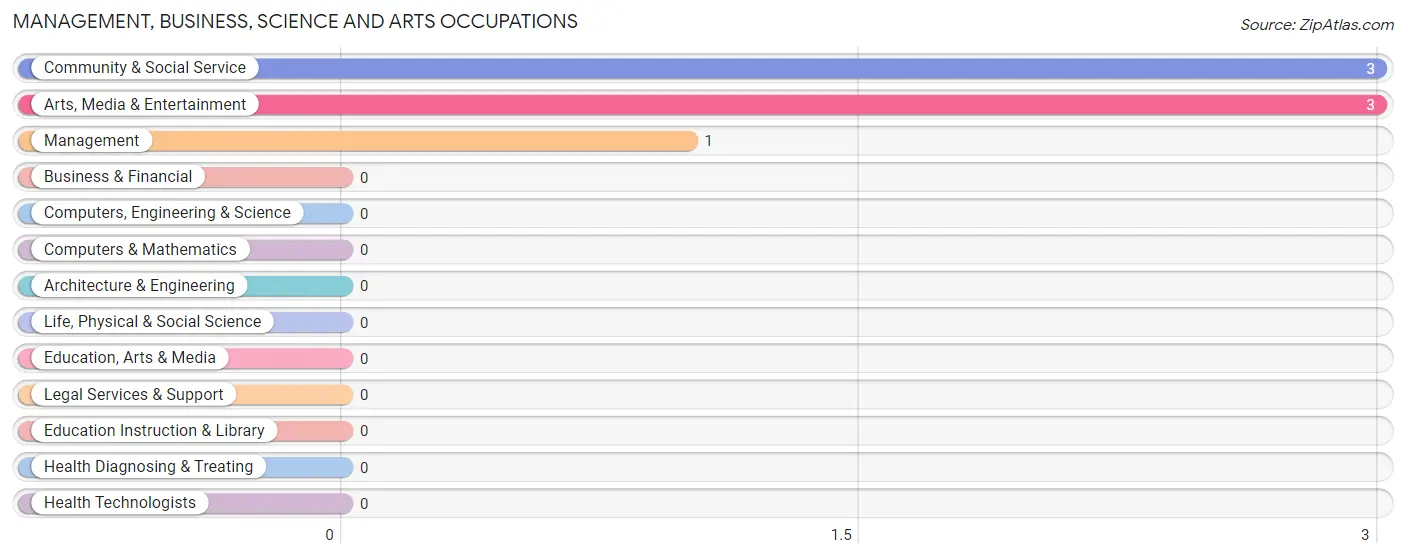
Management, Business, Science and Arts Occupations by Sex
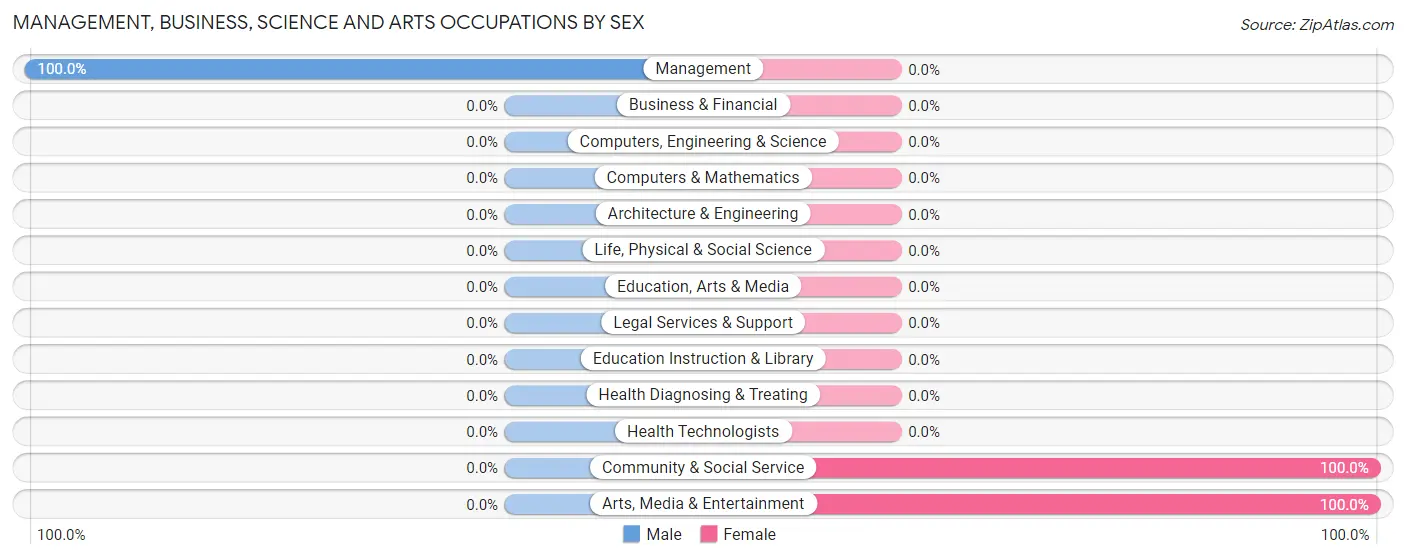
| Occupation | Male | Female |
| Management | 1 (100.0%) | 0 (0.0%) |
| Business & Financial | 0 (0.0%) | 0 (0.0%) |
| Computers, Engineering & Science | 0 (0.0%) | 0 (0.0%) |
| Computers & Mathematics | 0 (0.0%) | 0 (0.0%) |
| Architecture & Engineering | 0 (0.0%) | 0 (0.0%) |
| Life, Physical & Social Science | 0 (0.0%) | 0 (0.0%) |
| Community & Social Service | 0 (0.0%) | 3 (100.0%) |
| Education, Arts & Media | 0 (0.0%) | 0 (0.0%) |
| Legal Services & Support | 0 (0.0%) | 0 (0.0%) |
| Education Instruction & Library | 0 (0.0%) | 0 (0.0%) |
| Arts, Media & Entertainment | 0 (0.0%) | 3 (100.0%) |
| Health Diagnosing & Treating | 0 (0.0%) | 0 (0.0%) |
| Health Technologists | 0 (0.0%) | 0 (0.0%) |
| Total (Category) | 1 (25.0%) | 3 (75.0%) |
| Total (Overall) | 7 (58.3%) | 5 (41.7%) |
Services Occupations
Services Occupations by Sex
| Occupation | Male | Female |
| Healthcare Support | 0 (0.0%) | 0 (0.0%) |
| Security & Protection | 0 (0.0%) | 0 (0.0%) |
| Firefighting & Prevention | 0 (0.0%) | 0 (0.0%) |
| Law Enforcement | 0 (0.0%) | 0 (0.0%) |
| Food Preparation & Serving | 0 (0.0%) | 0 (0.0%) |
| Cleaning & Maintenance | 0 (0.0%) | 0 (0.0%) |
| Personal Care & Service | 0 (0.0%) | 0 (0.0%) |
| Total (Category) | 0 (0.0%) | 0 (0.0%) |
| Total (Overall) | 7 (58.3%) | 5 (41.7%) |
Sales and Office Occupations
The most common Sales and Office occupations in Capulin are Sales & Related (2 | 16.7%), and Office & Administration (2 | 16.7%).

Sales and Office Occupations by Sex

| Occupation | Male | Female |
| Sales & Related | 2 (100.0%) | 0 (0.0%) |
| Office & Administration | 0 (0.0%) | 2 (100.0%) |
| Total (Category) | 2 (50.0%) | 2 (50.0%) |
| Total (Overall) | 7 (58.3%) | 5 (41.7%) |
Natural Resources, Construction and Maintenance Occupations
Natural Resources, Construction and Maintenance Occupations by Sex
| Occupation | Male | Female |
| Farming, Fishing & Forestry | 0 (0.0%) | 0 (0.0%) |
| Construction & Extraction | 0 (0.0%) | 0 (0.0%) |
| Installation, Maintenance & Repair | 0 (0.0%) | 0 (0.0%) |
| Total (Category) | 0 (0.0%) | 0 (0.0%) |
| Total (Overall) | 7 (58.3%) | 5 (41.7%) |
Production, Transportation and Moving Occupations
The most common Production, Transportation and Moving occupations in Capulin are Production (3 | 25.0%), and Transportation (1 | 8.3%).
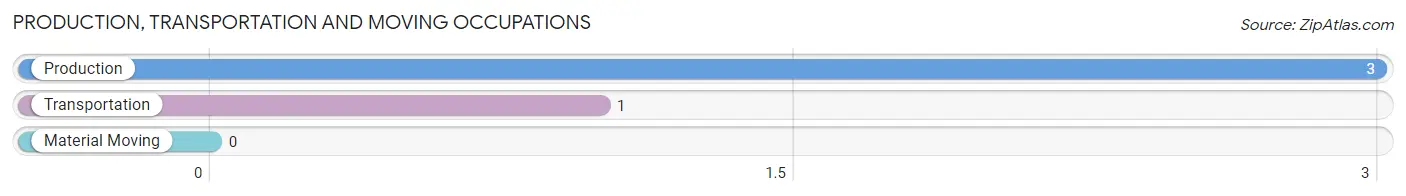
Production, Transportation and Moving Occupations by Sex
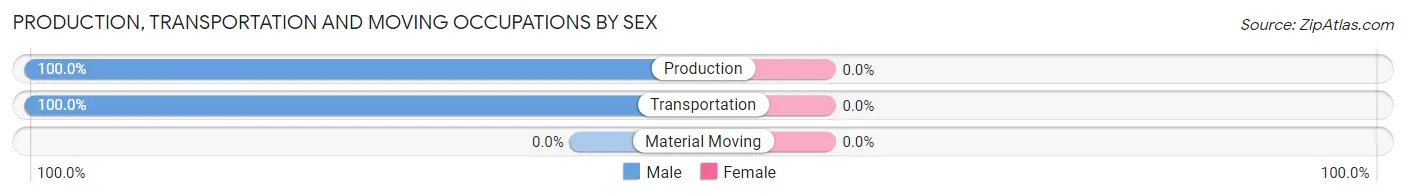
| Occupation | Male | Female |
| Production | 3 (100.0%) | 0 (0.0%) |
| Transportation | 1 (100.0%) | 0 (0.0%) |
| Material Moving | 0 (0.0%) | 0 (0.0%) |
| Total (Category) | 4 (100.0%) | 0 (0.0%) |
| Total (Overall) | 7 (58.3%) | 5 (41.7%) |
Employment Industries by Sex in Capulin
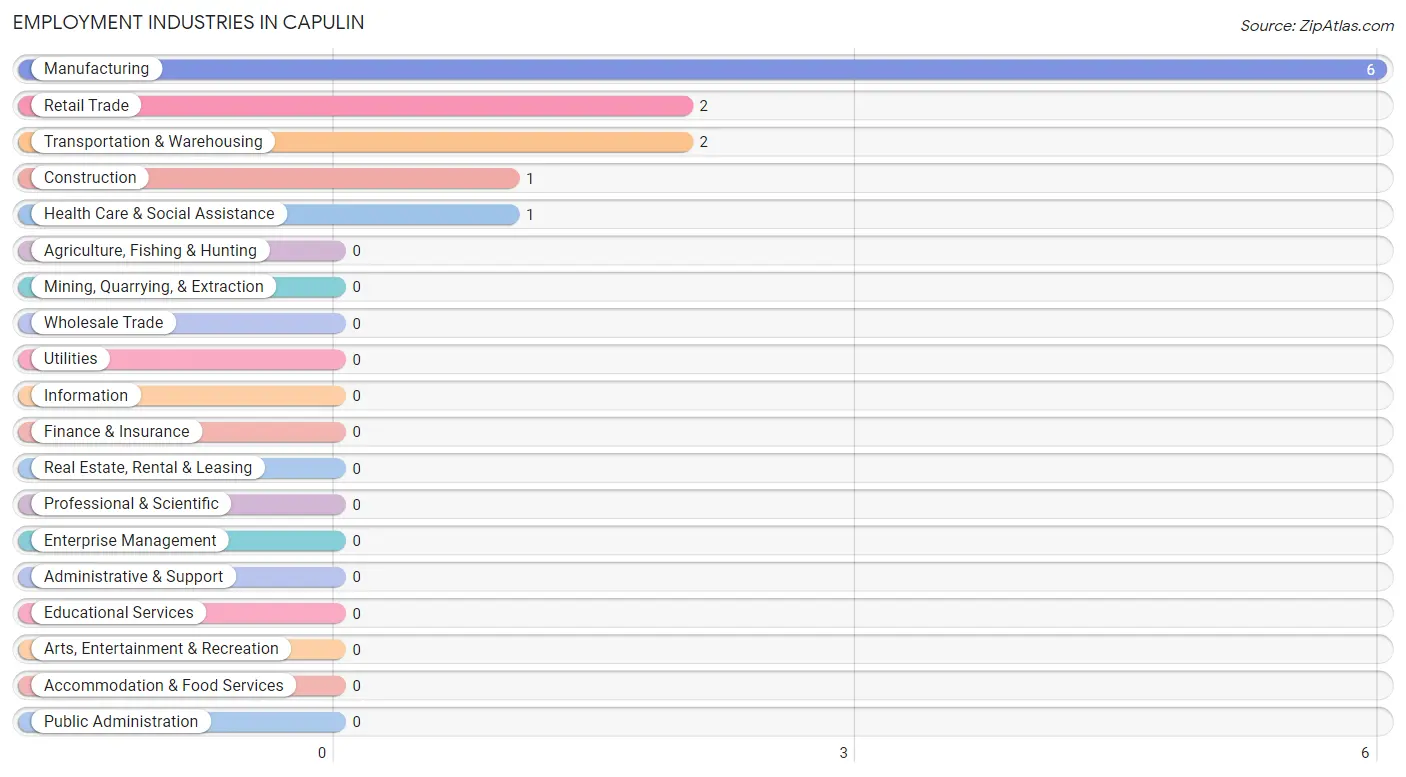
Employment Industries in Capulin
The major employment industries in Capulin include Manufacturing (6 | 50.0%), Retail Trade (2 | 16.7%), Transportation & Warehousing (2 | 16.7%), Construction (1 | 8.3%), and Health Care & Social Assistance (1 | 8.3%).
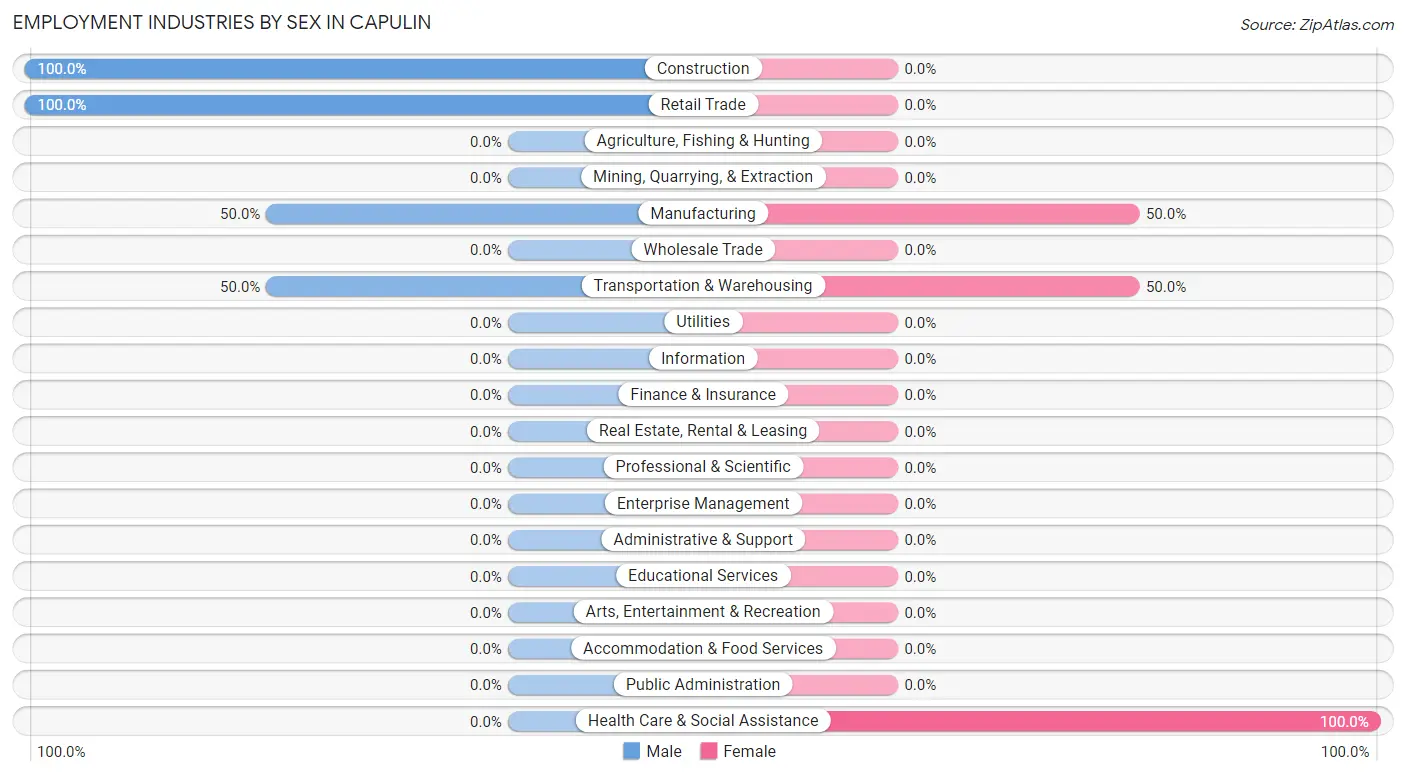
Employment Industries by Sex in Capulin
The Capulin industries that see more men than women are Construction (100.0%), Retail Trade (100.0%), and Manufacturing (50.0%), whereas the industries that tend to have a higher number of women are Health Care & Social Assistance (100.0%), Manufacturing (50.0%), and Transportation & Warehousing (50.0%).
| Industry | Male | Female |
| Agriculture, Fishing & Hunting | 0 (0.0%) | 0 (0.0%) |
| Mining, Quarrying, & Extraction | 0 (0.0%) | 0 (0.0%) |
| Construction | 1 (100.0%) | 0 (0.0%) |
| Manufacturing | 3 (50.0%) | 3 (50.0%) |
| Wholesale Trade | 0 (0.0%) | 0 (0.0%) |
| Retail Trade | 2 (100.0%) | 0 (0.0%) |
| Transportation & Warehousing | 1 (50.0%) | 1 (50.0%) |
| Utilities | 0 (0.0%) | 0 (0.0%) |
| Information | 0 (0.0%) | 0 (0.0%) |
| Finance & Insurance | 0 (0.0%) | 0 (0.0%) |
| Real Estate, Rental & Leasing | 0 (0.0%) | 0 (0.0%) |
| Professional & Scientific | 0 (0.0%) | 0 (0.0%) |
| Enterprise Management | 0 (0.0%) | 0 (0.0%) |
| Administrative & Support | 0 (0.0%) | 0 (0.0%) |
| Educational Services | 0 (0.0%) | 0 (0.0%) |
| Health Care & Social Assistance | 0 (0.0%) | 1 (100.0%) |
| Arts, Entertainment & Recreation | 0 (0.0%) | 0 (0.0%) |
| Accommodation & Food Services | 0 (0.0%) | 0 (0.0%) |
| Public Administration | 0 (0.0%) | 0 (0.0%) |
| Total | 7 (58.3%) | 5 (41.7%) |
Education in Capulin
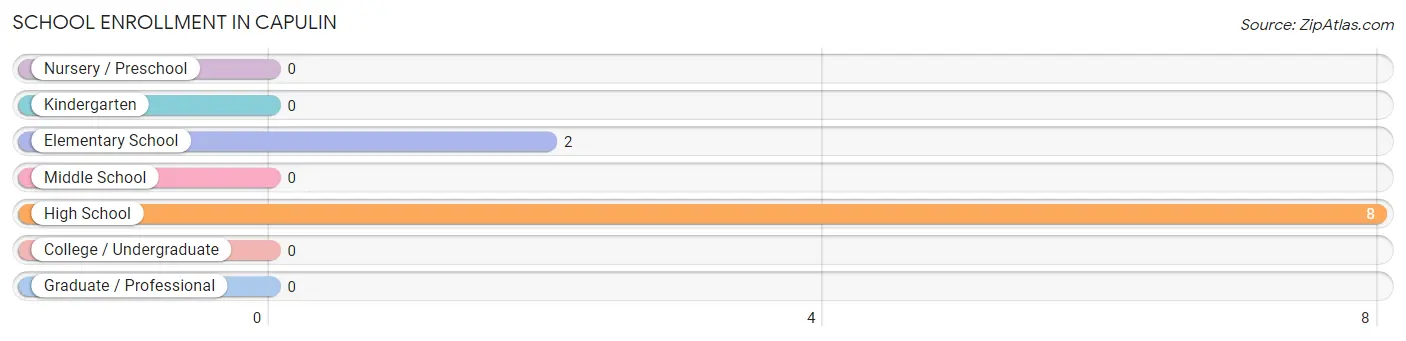
School Enrollment in Capulin
The most common levels of schooling among the 10 students in Capulin are high school (8 | 80.0%), and elementary school (2 | 20.0%).
| School Level | # Students | % Students |
| Nursery / Preschool | 0 | 0.0% |
| Kindergarten | 0 | 0.0% |
| Elementary School | 2 | 20.0% |
| Middle School | 0 | 0.0% |
| High School | 8 | 80.0% |
| College / Undergraduate | 0 | 0.0% |
| Graduate / Professional | 0 | 0.0% |
| Total | 10 | 100.0% |
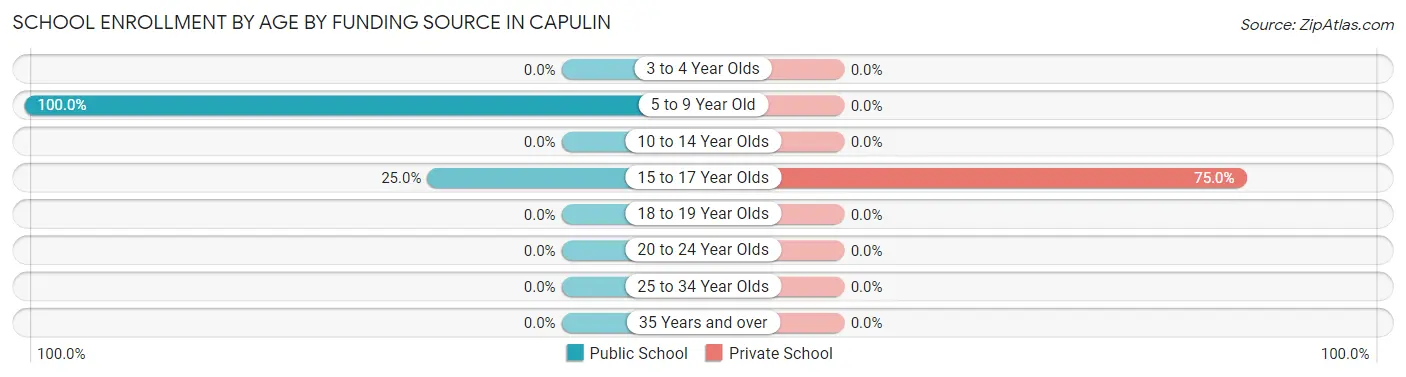
School Enrollment by Age by Funding Source in Capulin
Out of a total of 10 students who are enrolled in schools in Capulin, 6 (60.0%) attend a private institution, while the remaining 4 (40.0%) are enrolled in public schools. The age group of 15 to 17 year olds has the highest likelihood of being enrolled in private schools, with 6 (75.0% in the age bracket) enrolled. Conversely, the age group of 5 to 9 year old has the lowest likelihood of being enrolled in a private school, with 2 (100.0% in the age bracket) attending a public institution.
| Age Bracket | Public School | Private School |
| 3 to 4 Year Olds | 0 (0.0%) | 0 (0.0%) |
| 5 to 9 Year Old | 2 (100.0%) | 0 (0.0%) |
| 10 to 14 Year Olds | 0 (0.0%) | 0 (0.0%) |
| 15 to 17 Year Olds | 2 (25.0%) | 6 (75.0%) |
| 18 to 19 Year Olds | 0 (0.0%) | 0 (0.0%) |
| 20 to 24 Year Olds | 0 (0.0%) | 0 (0.0%) |
| 25 to 34 Year Olds | 0 (0.0%) | 0 (0.0%) |
| 35 Years and over | 0 (0.0%) | 0 (0.0%) |
| Total | 4 (40.0%) | 6 (60.0%) |
Educational Attainment by Field of Study in Capulin
Psychology (3 | 42.9%), visual & performing arts (3 | 42.9%), and science & technology (1 | 14.3%) are the most common fields of study among 7 individuals in Capulin who have obtained a bachelor's degree or higher.
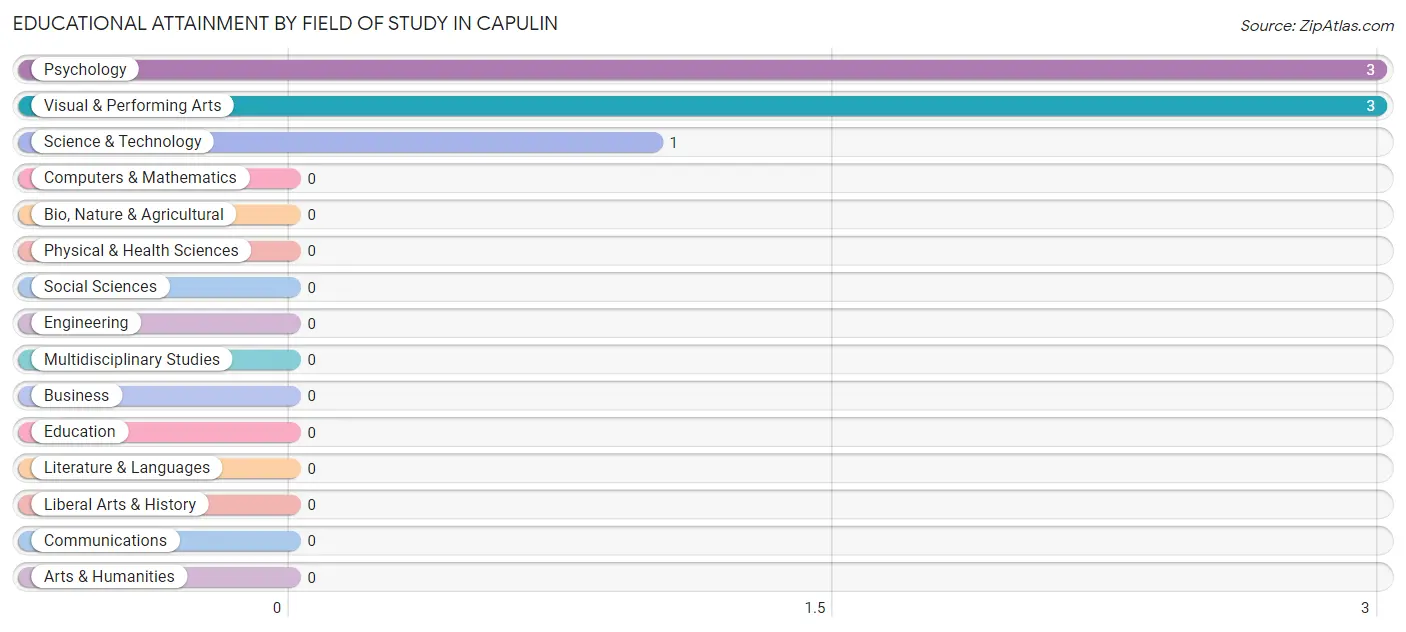
| Field of Study | # Graduates | % Graduates |
| Computers & Mathematics | 0 | 0.0% |
| Bio, Nature & Agricultural | 0 | 0.0% |
| Physical & Health Sciences | 0 | 0.0% |
| Psychology | 3 | 42.9% |
| Social Sciences | 0 | 0.0% |
| Engineering | 0 | 0.0% |
| Multidisciplinary Studies | 0 | 0.0% |
| Science & Technology | 1 | 14.3% |
| Business | 0 | 0.0% |
| Education | 0 | 0.0% |
| Literature & Languages | 0 | 0.0% |
| Liberal Arts & History | 0 | 0.0% |
| Visual & Performing Arts | 3 | 42.9% |
| Communications | 0 | 0.0% |
| Arts & Humanities | 0 | 0.0% |
| Total | 7 | 100.0% |
Transportation & Commute in Capulin
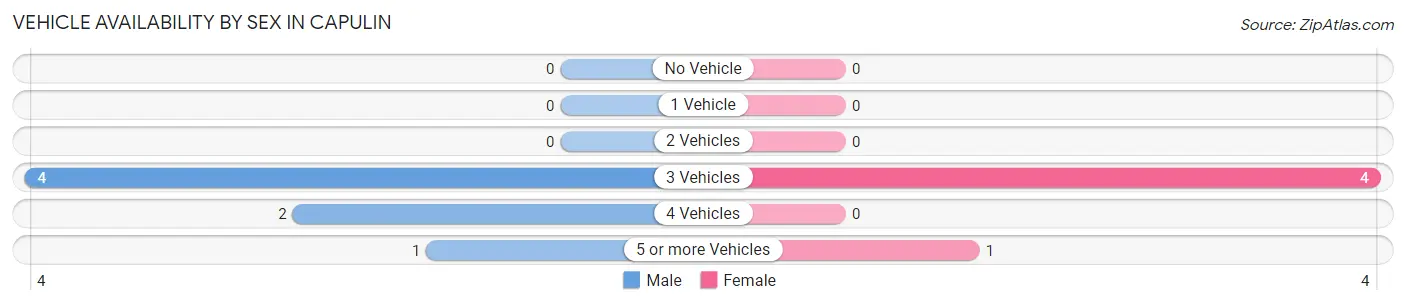
Vehicle Availability by Sex in Capulin
The most prevalent vehicle ownership categories in Capulin are males with 3 vehicles (4, accounting for 57.1%) and females with 3 vehicles (4, making up 80.0%).
| Vehicles Available | Male | Female |
| No Vehicle | 0 (0.0%) | 0 (0.0%) |
| 1 Vehicle | 0 (0.0%) | 0 (0.0%) |
| 2 Vehicles | 0 (0.0%) | 0 (0.0%) |
| 3 Vehicles | 4 (57.1%) | 4 (80.0%) |
| 4 Vehicles | 2 (28.6%) | 0 (0.0%) |
| 5 or more Vehicles | 1 (14.3%) | 1 (20.0%) |
| Total | 7 (100.0%) | 5 (100.0%) |
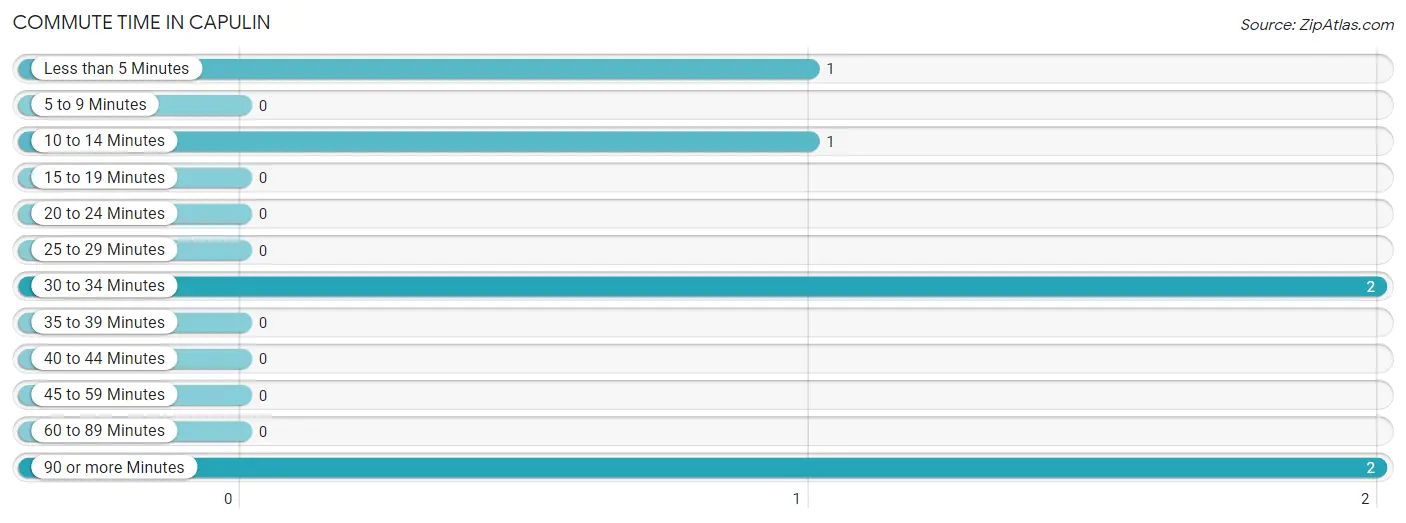
Commute Time in Capulin
The most frequently occuring commute durations in Capulin are 30 to 34 minutes (2 commuters, 33.3%), 90 or more minutes (2 commuters, 33.3%), and less than 5 minutes (1 commuters, 16.7%).
| Commute Time | # Commuters | % Commuters |
| Less than 5 Minutes | 1 | 16.7% |
| 5 to 9 Minutes | 0 | 0.0% |
| 10 to 14 Minutes | 1 | 16.7% |
| 15 to 19 Minutes | 0 | 0.0% |
| 20 to 24 Minutes | 0 | 0.0% |
| 25 to 29 Minutes | 0 | 0.0% |
| 30 to 34 Minutes | 2 | 33.3% |
| 35 to 39 Minutes | 0 | 0.0% |
| 40 to 44 Minutes | 0 | 0.0% |
| 45 to 59 Minutes | 0 | 0.0% |
| 60 to 89 Minutes | 0 | 0.0% |
| 90 or more Minutes | 2 | 33.3% |
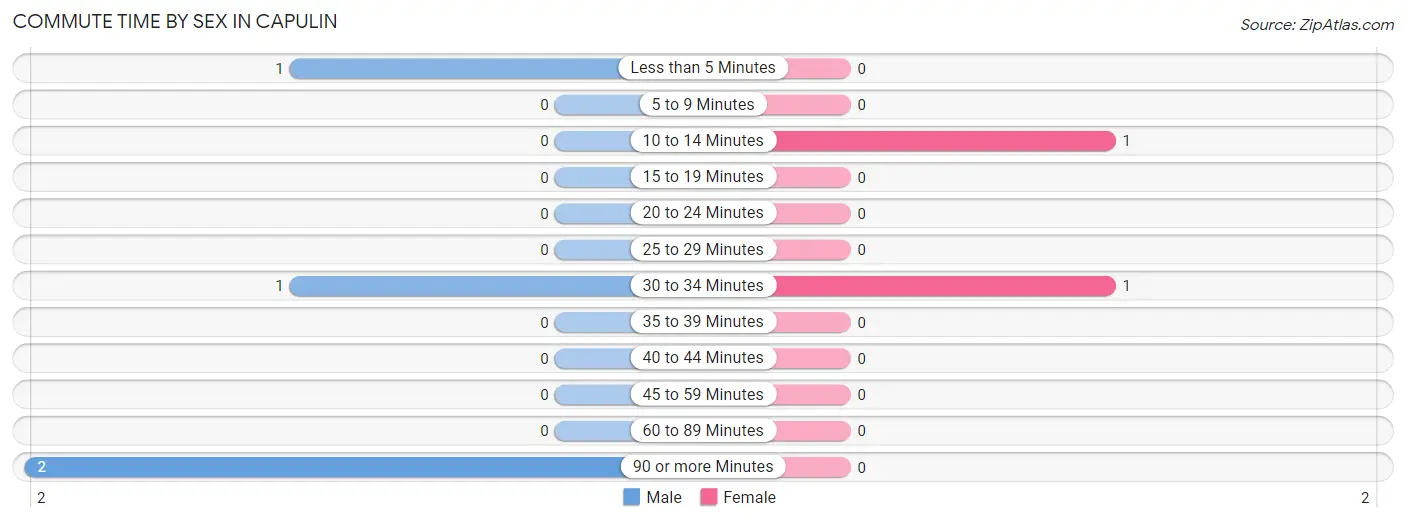
Commute Time by Sex in Capulin
The most common commute times in Capulin are 90 or more minutes (2 commuters, 50.0%) for males and 10 to 14 minutes (1 commuters, 50.0%) for females.
| Commute Time | Male | Female |
| Less than 5 Minutes | 1 (25.0%) | 0 (0.0%) |
| 5 to 9 Minutes | 0 (0.0%) | 0 (0.0%) |
| 10 to 14 Minutes | 0 (0.0%) | 1 (50.0%) |
| 15 to 19 Minutes | 0 (0.0%) | 0 (0.0%) |
| 20 to 24 Minutes | 0 (0.0%) | 0 (0.0%) |
| 25 to 29 Minutes | 0 (0.0%) | 0 (0.0%) |
| 30 to 34 Minutes | 1 (25.0%) | 1 (50.0%) |
| 35 to 39 Minutes | 0 (0.0%) | 0 (0.0%) |
| 40 to 44 Minutes | 0 (0.0%) | 0 (0.0%) |
| 45 to 59 Minutes | 0 (0.0%) | 0 (0.0%) |
| 60 to 89 Minutes | 0 (0.0%) | 0 (0.0%) |
| 90 or more Minutes | 2 (50.0%) | 0 (0.0%) |
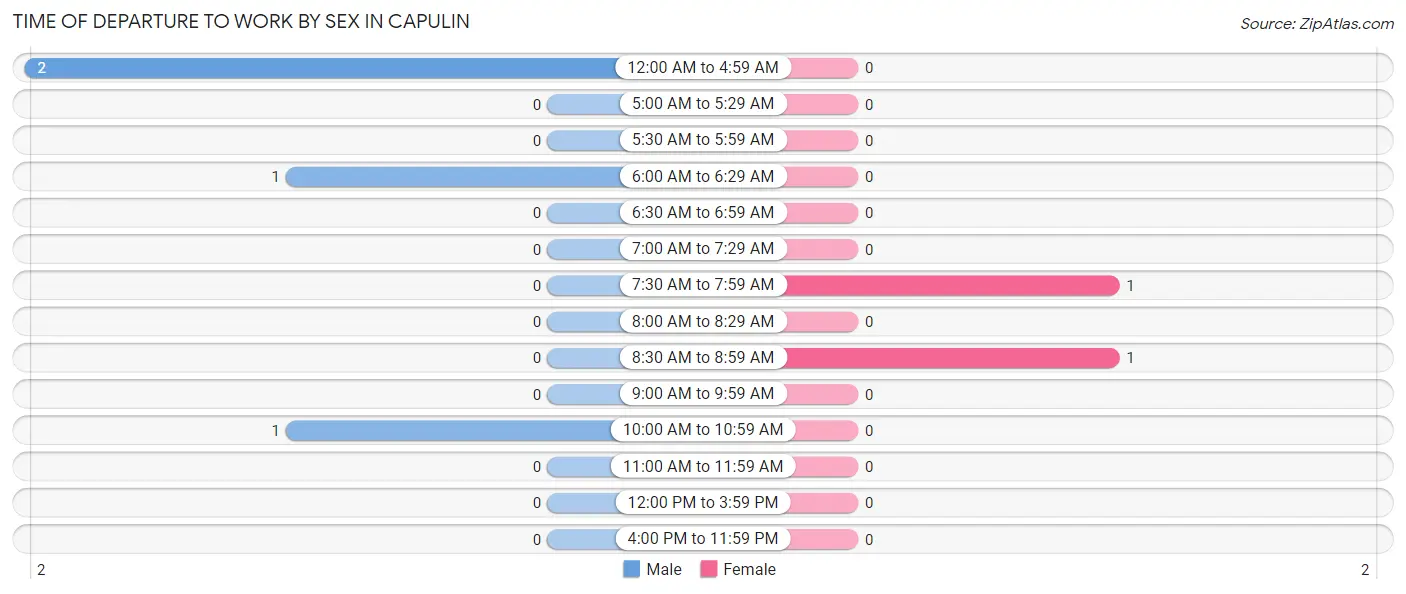
Time of Departure to Work by Sex in Capulin
The most frequent times of departure to work in Capulin are 12:00 AM to 4:59 AM (2, 50.0%) for males and 7:30 AM to 7:59 AM (1, 50.0%) for females.
| Time of Departure | Male | Female |
| 12:00 AM to 4:59 AM | 2 (50.0%) | 0 (0.0%) |
| 5:00 AM to 5:29 AM | 0 (0.0%) | 0 (0.0%) |
| 5:30 AM to 5:59 AM | 0 (0.0%) | 0 (0.0%) |
| 6:00 AM to 6:29 AM | 1 (25.0%) | 0 (0.0%) |
| 6:30 AM to 6:59 AM | 0 (0.0%) | 0 (0.0%) |
| 7:00 AM to 7:29 AM | 0 (0.0%) | 0 (0.0%) |
| 7:30 AM to 7:59 AM | 0 (0.0%) | 1 (50.0%) |
| 8:00 AM to 8:29 AM | 0 (0.0%) | 0 (0.0%) |
| 8:30 AM to 8:59 AM | 0 (0.0%) | 1 (50.0%) |
| 9:00 AM to 9:59 AM | 0 (0.0%) | 0 (0.0%) |
| 10:00 AM to 10:59 AM | 1 (25.0%) | 0 (0.0%) |
| 11:00 AM to 11:59 AM | 0 (0.0%) | 0 (0.0%) |
| 12:00 PM to 3:59 PM | 0 (0.0%) | 0 (0.0%) |
| 4:00 PM to 11:59 PM | 0 (0.0%) | 0 (0.0%) |
| Total | 4 (100.0%) | 2 (100.0%) |
Housing Occupancy in Capulin
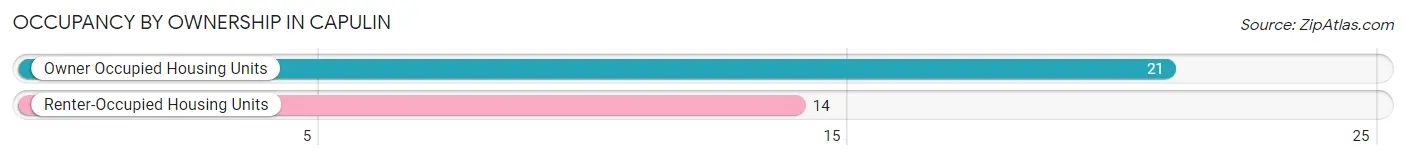
Occupancy by Ownership in Capulin
Of the total 35 dwellings in Capulin, owner-occupied units account for 21 (60.0%), while renter-occupied units make up 14 (40.0%).
| Occupancy | # Housing Units | % Housing Units |
| Owner Occupied Housing Units | 21 | 60.0% |
| Renter-Occupied Housing Units | 14 | 40.0% |
| Total Occupied Housing Units | 35 | 100.0% |
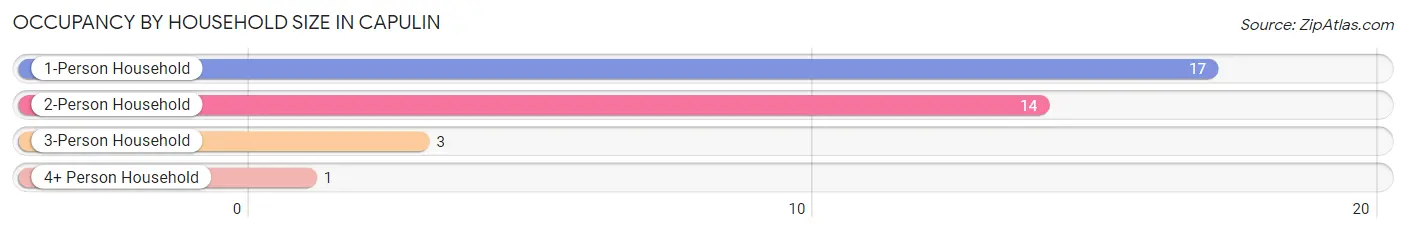
Occupancy by Household Size in Capulin
| Household Size | # Housing Units | % Housing Units |
| 1-Person Household | 17 | 48.6% |
| 2-Person Household | 14 | 40.0% |
| 3-Person Household | 3 | 8.6% |
| 4+ Person Household | 1 | 2.9% |
| Total Housing Units | 35 | 100.0% |
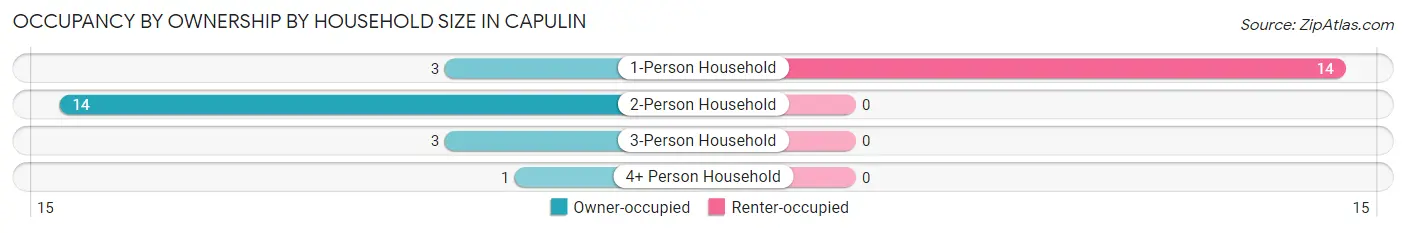
Occupancy by Ownership by Household Size in Capulin
| Household Size | Owner-occupied | Renter-occupied |
| 1-Person Household | 3 (17.6%) | 14 (82.4%) |
| 2-Person Household | 14 (100.0%) | 0 (0.0%) |
| 3-Person Household | 3 (100.0%) | 0 (0.0%) |
| 4+ Person Household | 1 (100.0%) | 0 (0.0%) |
| Total Housing Units | 21 (60.0%) | 14 (40.0%) |
Occupancy by Educational Attainment in Capulin
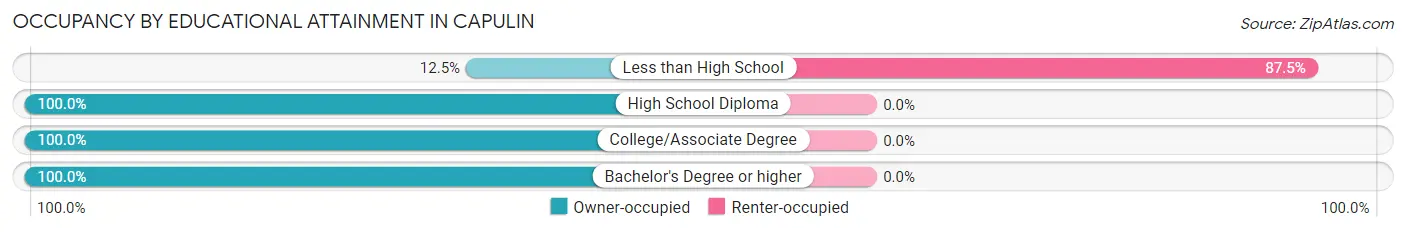
| Household Size | Owner-occupied | Renter-occupied |
| Less than High School | 2 (12.5%) | 14 (87.5%) |
| High School Diploma | 11 (100.0%) | 0 (0.0%) |
| College/Associate Degree | 4 (100.0%) | 0 (0.0%) |
| Bachelor's Degree or higher | 4 (100.0%) | 0 (0.0%) |
Occupancy by Age of Householder in Capulin
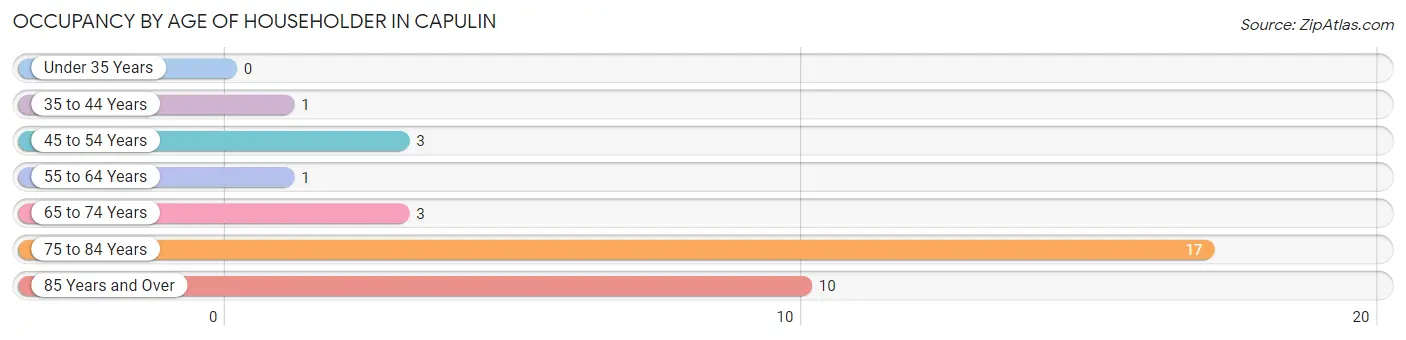
| Age Bracket | # Households | % Households |
| Under 35 Years | 0 | 0.0% |
| 35 to 44 Years | 1 | 2.9% |
| 45 to 54 Years | 3 | 8.6% |
| 55 to 64 Years | 1 | 2.9% |
| 65 to 74 Years | 3 | 8.6% |
| 75 to 84 Years | 17 | 48.6% |
| 85 Years and Over | 10 | 28.6% |
| Total | 35 | 100.0% |
Housing Finances in Capulin
Median Income by Occupancy in Capulin
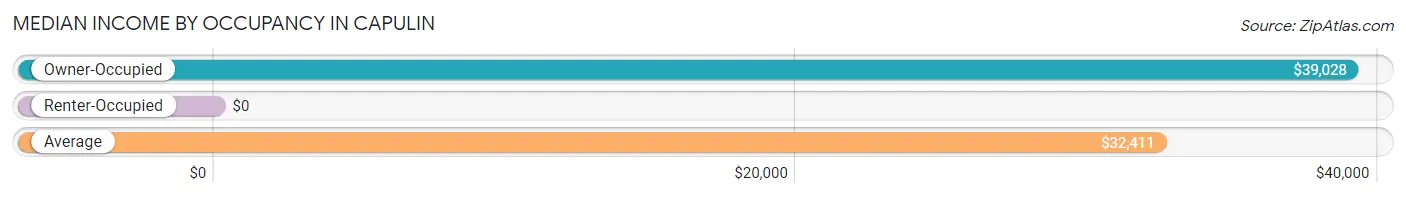
| Occupancy Type | # Households | Median Income |
| Owner-Occupied | 21 (60.0%) | $39,028 |
| Renter-Occupied | 14 (40.0%) | $0 |
| Average | 35 (100.0%) | $32,411 |
Occupancy by Householder Income Bracket in Capulin
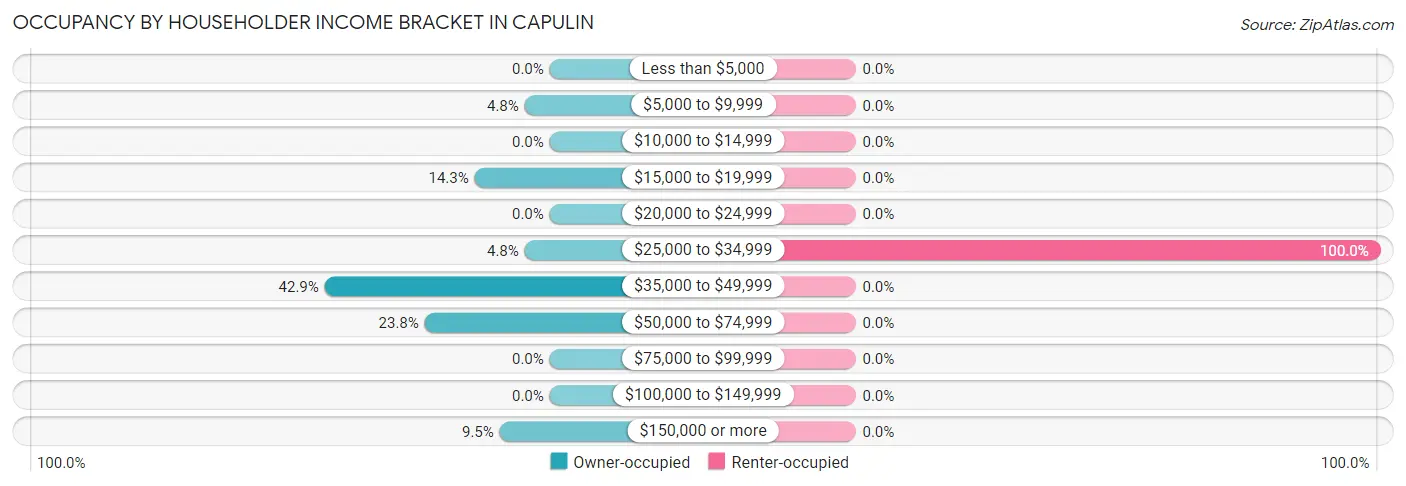
| Income Bracket | Owner-occupied | Renter-occupied |
| Less than $5,000 | 0 (0.0%) | 0 (0.0%) |
| $5,000 to $9,999 | 1 (4.8%) | 0 (0.0%) |
| $10,000 to $14,999 | 0 (0.0%) | 0 (0.0%) |
| $15,000 to $19,999 | 3 (14.3%) | 0 (0.0%) |
| $20,000 to $24,999 | 0 (0.0%) | 0 (0.0%) |
| $25,000 to $34,999 | 1 (4.8%) | 14 (100.0%) |
| $35,000 to $49,999 | 9 (42.9%) | 0 (0.0%) |
| $50,000 to $74,999 | 5 (23.8%) | 0 (0.0%) |
| $75,000 to $99,999 | 0 (0.0%) | 0 (0.0%) |
| $100,000 to $149,999 | 0 (0.0%) | 0 (0.0%) |
| $150,000 or more | 2 (9.5%) | 0 (0.0%) |
| Total | 21 (100.0%) | 14 (100.0%) |
Monthly Housing Cost Tiers in Capulin
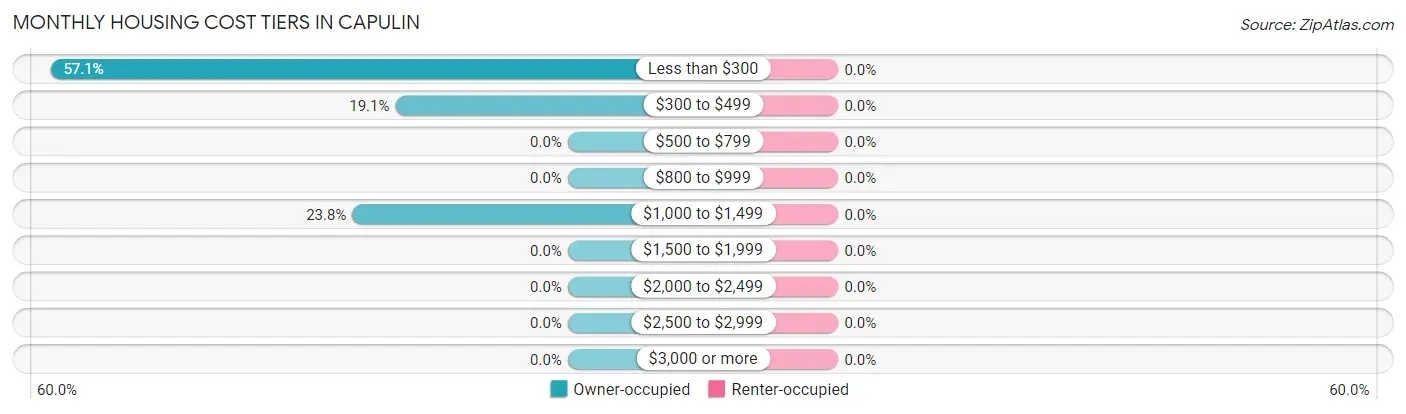
| Monthly Cost | Owner-occupied | Renter-occupied |
| Less than $300 | 12 (57.1%) | 0 (0.0%) |
| $300 to $499 | 4 (19.1%) | 0 (0.0%) |
| $500 to $799 | 0 (0.0%) | 0 (0.0%) |
| $800 to $999 | 0 (0.0%) | 0 (0.0%) |
| $1,000 to $1,499 | 5 (23.8%) | 0 (0.0%) |
| $1,500 to $1,999 | 0 (0.0%) | 0 (0.0%) |
| $2,000 to $2,499 | 0 (0.0%) | 0 (0.0%) |
| $2,500 to $2,999 | 0 (0.0%) | 0 (0.0%) |
| $3,000 or more | 0 (0.0%) | 0 (0.0%) |
| Total | 21 (100.0%) | 14 (100.0%) |
Physical Housing Characteristics in Capulin
Housing Structures in Capulin
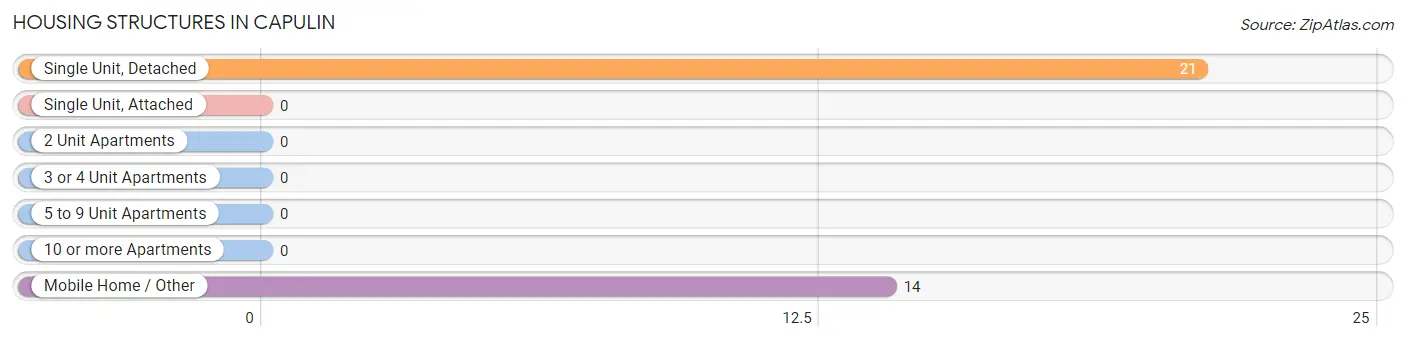
| Structure Type | # Housing Units | % Housing Units |
| Single Unit, Detached | 21 | 60.0% |
| Single Unit, Attached | 0 | 0.0% |
| 2 Unit Apartments | 0 | 0.0% |
| 3 or 4 Unit Apartments | 0 | 0.0% |
| 5 to 9 Unit Apartments | 0 | 0.0% |
| 10 or more Apartments | 0 | 0.0% |
| Mobile Home / Other | 14 | 40.0% |
| Total | 35 | 100.0% |
Housing Structures by Occupancy in Capulin
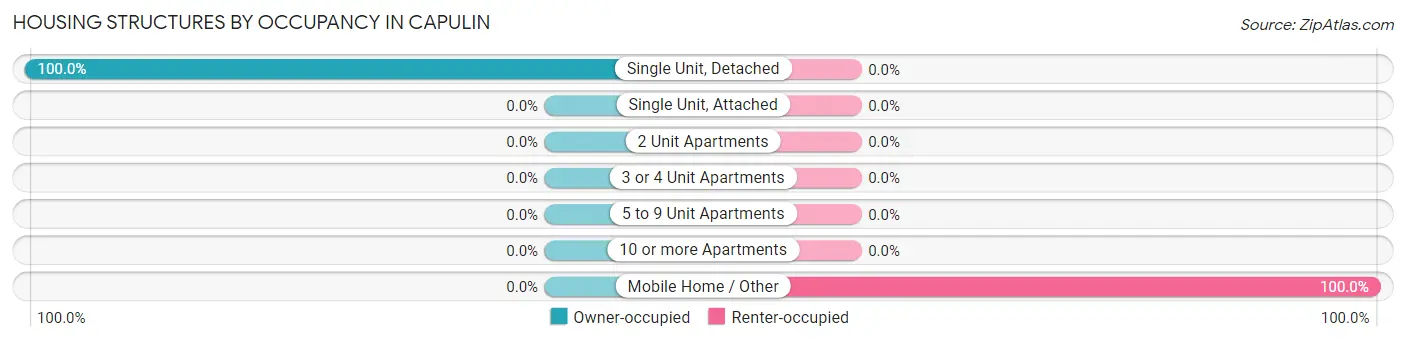
| Structure Type | Owner-occupied | Renter-occupied |
| Single Unit, Detached | 21 (100.0%) | 0 (0.0%) |
| Single Unit, Attached | 0 (0.0%) | 0 (0.0%) |
| 2 Unit Apartments | 0 (0.0%) | 0 (0.0%) |
| 3 or 4 Unit Apartments | 0 (0.0%) | 0 (0.0%) |
| 5 to 9 Unit Apartments | 0 (0.0%) | 0 (0.0%) |
| 10 or more Apartments | 0 (0.0%) | 0 (0.0%) |
| Mobile Home / Other | 0 (0.0%) | 14 (100.0%) |
| Total | 21 (60.0%) | 14 (40.0%) |
Housing Structures by Number of Rooms in Capulin
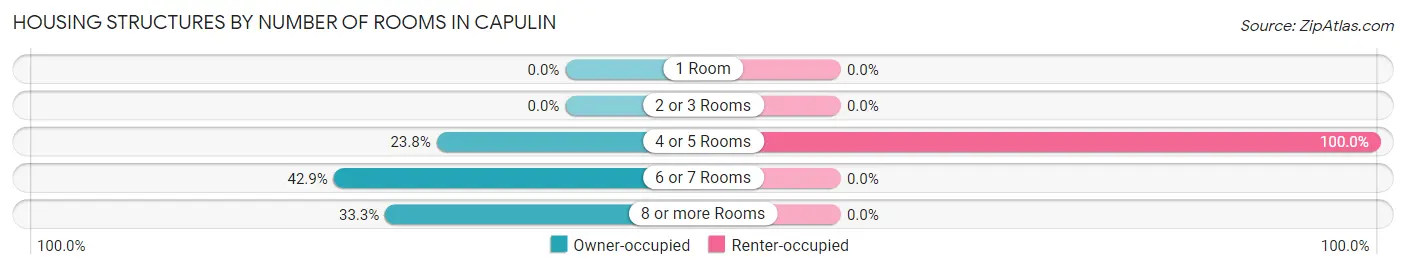
| Number of Rooms | Owner-occupied | Renter-occupied |
| 1 Room | 0 (0.0%) | 0 (0.0%) |
| 2 or 3 Rooms | 0 (0.0%) | 0 (0.0%) |
| 4 or 5 Rooms | 5 (23.8%) | 14 (100.0%) |
| 6 or 7 Rooms | 9 (42.9%) | 0 (0.0%) |
| 8 or more Rooms | 7 (33.3%) | 0 (0.0%) |
| Total | 21 (100.0%) | 14 (100.0%) |
Housing Structure by Heating Type in Capulin
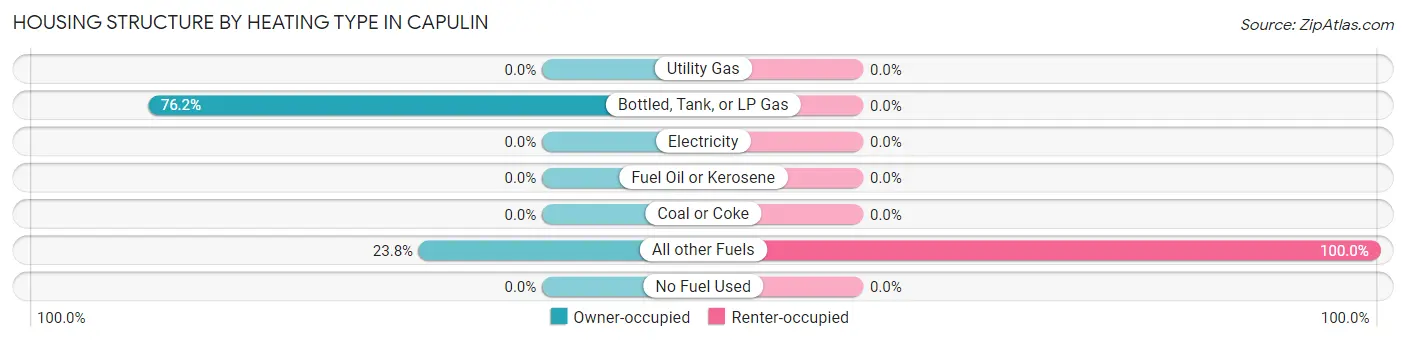
| Heating Type | Owner-occupied | Renter-occupied |
| Utility Gas | 0 (0.0%) | 0 (0.0%) |
| Bottled, Tank, or LP Gas | 16 (76.2%) | 0 (0.0%) |
| Electricity | 0 (0.0%) | 0 (0.0%) |
| Fuel Oil or Kerosene | 0 (0.0%) | 0 (0.0%) |
| Coal or Coke | 0 (0.0%) | 0 (0.0%) |
| All other Fuels | 5 (23.8%) | 14 (100.0%) |
| No Fuel Used | 0 (0.0%) | 0 (0.0%) |
| Total | 21 (100.0%) | 14 (100.0%) |
Household Vehicle Usage in Capulin
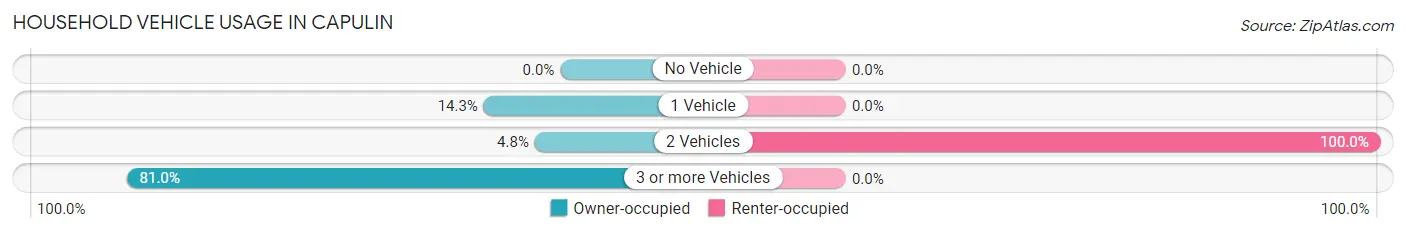
| Vehicles per Household | Owner-occupied | Renter-occupied |
| No Vehicle | 0 (0.0%) | 0 (0.0%) |
| 1 Vehicle | 3 (14.3%) | 0 (0.0%) |
| 2 Vehicles | 1 (4.8%) | 14 (100.0%) |
| 3 or more Vehicles | 17 (80.9%) | 0 (0.0%) |
| Total | 21 (100.0%) | 14 (100.0%) |
Real Estate & Mortgages in Capulin
Real Estate and Mortgage Overview in Capulin
| Characteristic | Without Mortgage | With Mortgage |
| Housing Units | 16 | 5 |
| Median Property Value | $39,400 | $0 |
| Median Household Income | $38,611 | $1 |
| Monthly Housing Costs | $278 | $0 |
| Real Estate Taxes | $199 | $0 |
Property Value by Mortgage Status in Capulin
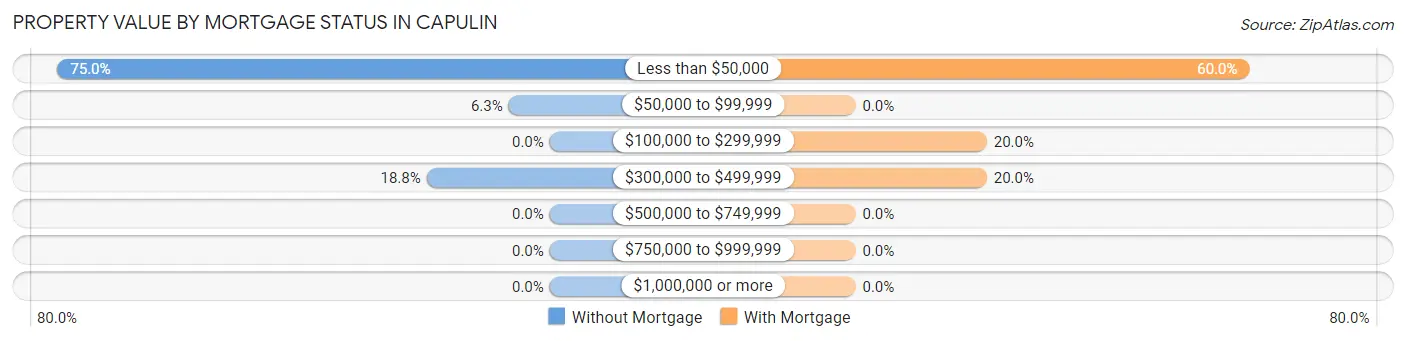
| Property Value | Without Mortgage | With Mortgage |
| Less than $50,000 | 12 (75.0%) | 3 (60.0%) |
| $50,000 to $99,999 | 1 (6.2%) | 0 (0.0%) |
| $100,000 to $299,999 | 0 (0.0%) | 1 (20.0%) |
| $300,000 to $499,999 | 3 (18.8%) | 1 (20.0%) |
| $500,000 to $749,999 | 0 (0.0%) | 0 (0.0%) |
| $750,000 to $999,999 | 0 (0.0%) | 0 (0.0%) |
| $1,000,000 or more | 0 (0.0%) | 0 (0.0%) |
| Total | 16 (100.0%) | 5 (100.0%) |
Household Income by Mortgage Status in Capulin
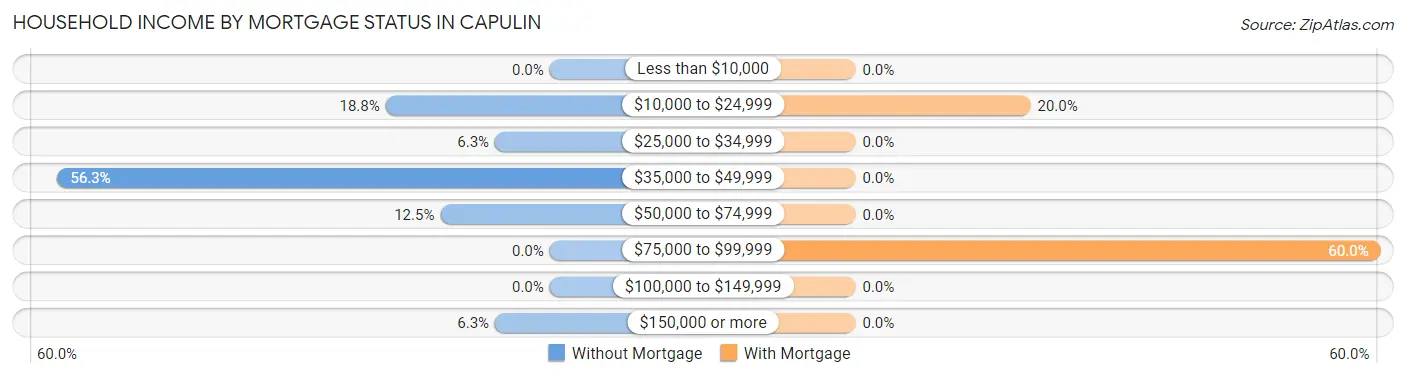
| Household Income | Without Mortgage | With Mortgage |
| Less than $10,000 | 0 (0.0%) | 0 (0.0%) |
| $10,000 to $24,999 | 3 (18.8%) | 1 (20.0%) |
| $25,000 to $34,999 | 1 (6.2%) | 0 (0.0%) |
| $35,000 to $49,999 | 9 (56.2%) | 0 (0.0%) |
| $50,000 to $74,999 | 2 (12.5%) | 0 (0.0%) |
| $75,000 to $99,999 | 0 (0.0%) | 3 (60.0%) |
| $100,000 to $149,999 | 0 (0.0%) | 0 (0.0%) |
| $150,000 or more | 1 (6.2%) | 0 (0.0%) |
| Total | 16 (100.0%) | 5 (100.0%) |
Property Value to Household Income Ratio in Capulin
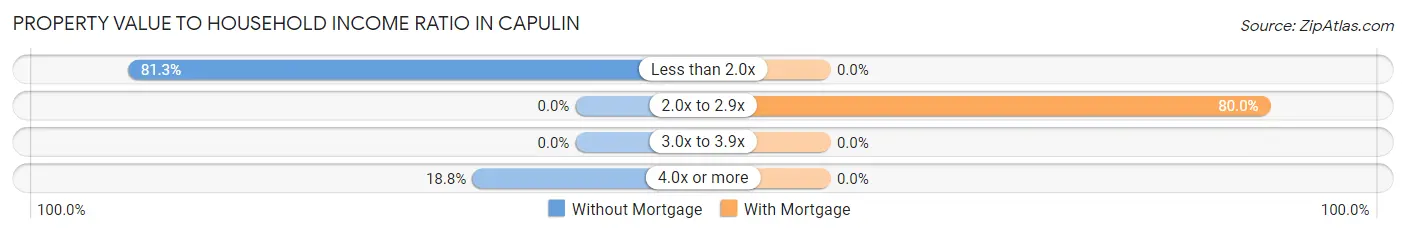
| Value-to-Income Ratio | Without Mortgage | With Mortgage |
| Less than 2.0x | 13 (81.2%) | 0 (0.0%) |
| 2.0x to 2.9x | 0 (0.0%) | 4 (80.0%) |
| 3.0x to 3.9x | 0 (0.0%) | 0 (0.0%) |
| 4.0x or more | 3 (18.8%) | 0 (0.0%) |
| Total | 16 (100.0%) | 5 (100.0%) |
Real Estate Taxes by Mortgage Status in Capulin
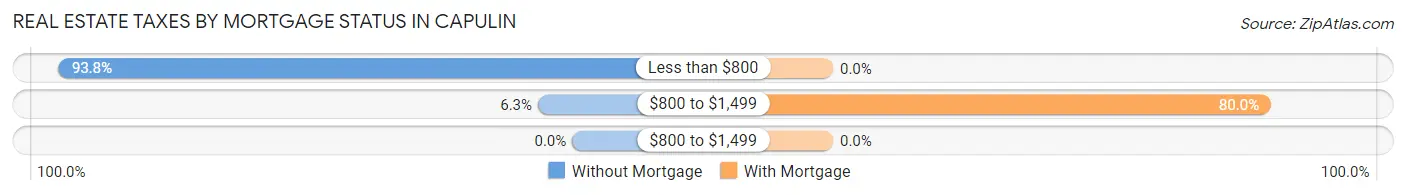
| Property Taxes | Without Mortgage | With Mortgage |
| Less than $800 | 15 (93.8%) | 0 (0.0%) |
| $800 to $1,499 | 1 (6.2%) | 4 (80.0%) |
| $800 to $1,499 | 0 (0.0%) | 0 (0.0%) |
| Total | 16 (100.0%) | 5 (100.0%) |
Health & Disability in Capulin
Health Insurance Coverage by Age in Capulin
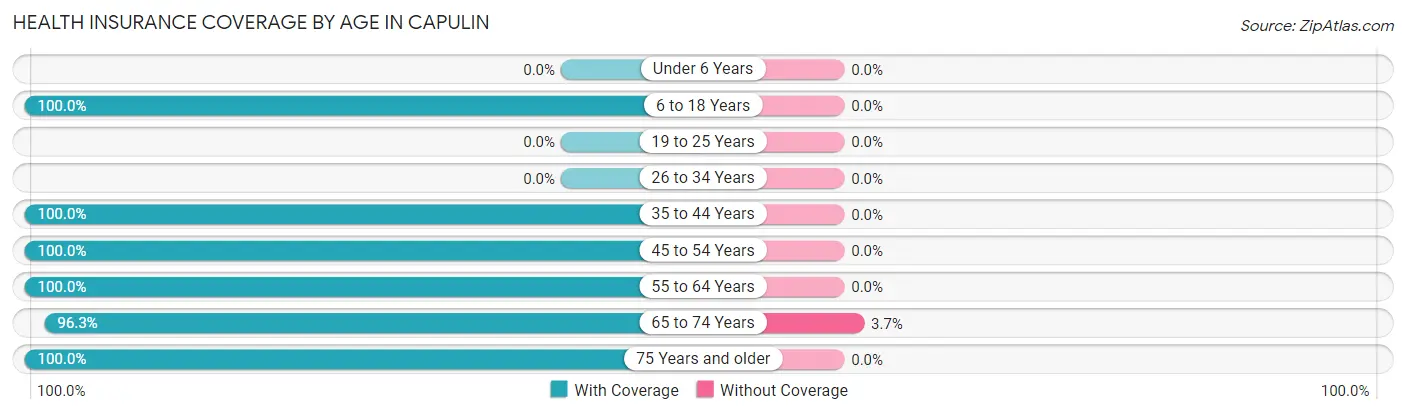
| Age Bracket | With Coverage | Without Coverage |
| Under 6 Years | 0 (0.0%) | 0 (0.0%) |
| 6 to 18 Years | 10 (100.0%) | 0 (0.0%) |
| 19 to 25 Years | 0 (0.0%) | 0 (0.0%) |
| 26 to 34 Years | 0 (0.0%) | 0 (0.0%) |
| 35 to 44 Years | 2 (100.0%) | 0 (0.0%) |
| 45 to 54 Years | 6 (100.0%) | 0 (0.0%) |
| 55 to 64 Years | 2 (100.0%) | 0 (0.0%) |
| 65 to 74 Years | 26 (96.3%) | 1 (3.7%) |
| 75 Years and older | 27 (100.0%) | 0 (0.0%) |
| Total | 73 (98.7%) | 1 (1.3%) |
Health Insurance Coverage by Citizenship Status in Capulin
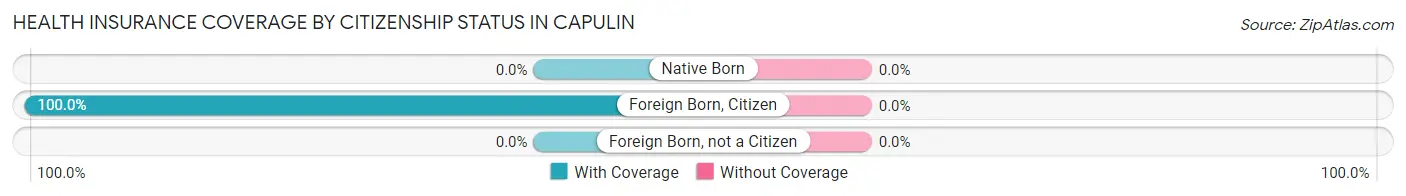
| Citizenship Status | With Coverage | Without Coverage |
| Native Born | 0 (0.0%) | 0 (0.0%) |
| Foreign Born, Citizen | 10 (100.0%) | 0 (0.0%) |
| Foreign Born, not a Citizen | 0 (0.0%) | 0 (0.0%) |
Health Insurance Coverage by Household Income in Capulin
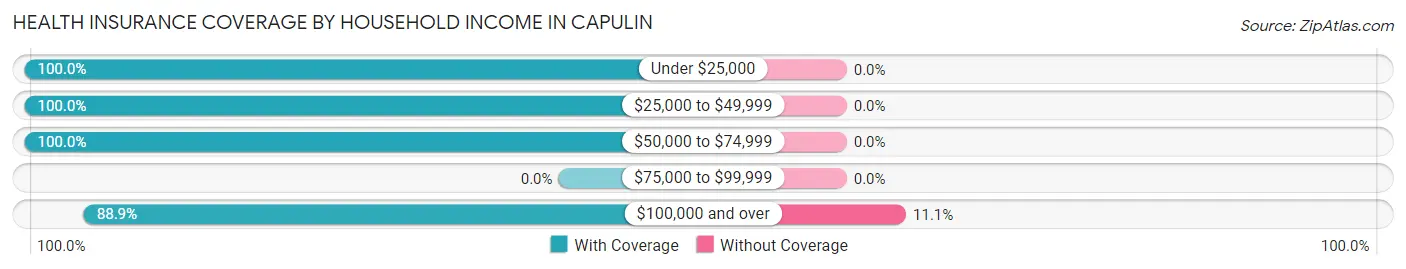
| Household Income | With Coverage | Without Coverage |
| Under $25,000 | 5 (100.0%) | 0 (0.0%) |
| $25,000 to $49,999 | 43 (100.0%) | 0 (0.0%) |
| $50,000 to $74,999 | 17 (100.0%) | 0 (0.0%) |
| $75,000 to $99,999 | 0 (0.0%) | 0 (0.0%) |
| $100,000 and over | 8 (88.9%) | 1 (11.1%) |
Public vs Private Health Insurance Coverage by Age in Capulin
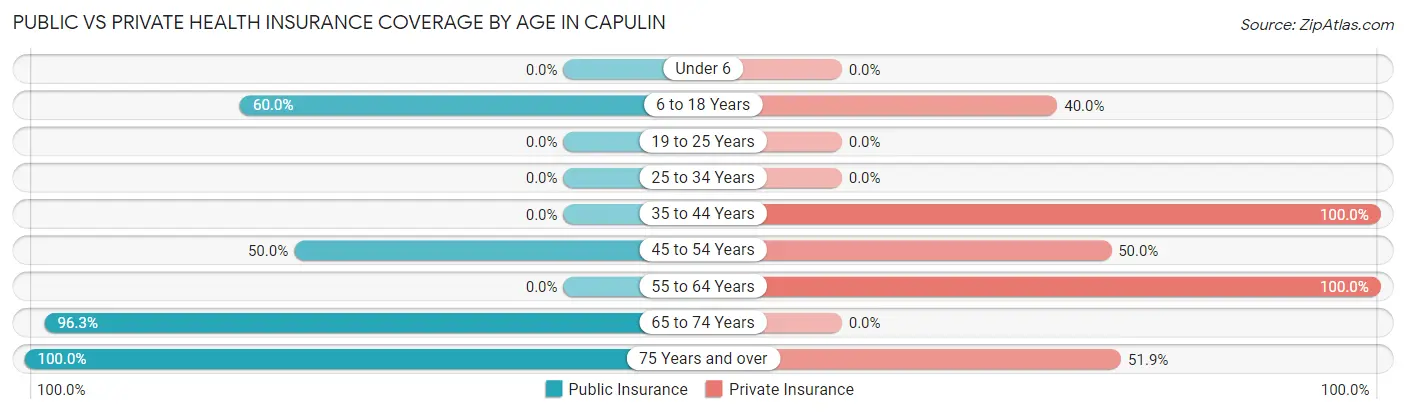
| Age Bracket | Public Insurance | Private Insurance |
| Under 6 | 0 (0.0%) | 0 (0.0%) |
| 6 to 18 Years | 6 (60.0%) | 4 (40.0%) |
| 19 to 25 Years | 0 (0.0%) | 0 (0.0%) |
| 25 to 34 Years | 0 (0.0%) | 0 (0.0%) |
| 35 to 44 Years | 0 (0.0%) | 2 (100.0%) |
| 45 to 54 Years | 3 (50.0%) | 3 (50.0%) |
| 55 to 64 Years | 0 (0.0%) | 2 (100.0%) |
| 65 to 74 Years | 26 (96.3%) | 0 (0.0%) |
| 75 Years and over | 27 (100.0%) | 14 (51.8%) |
| Total | 62 (83.8%) | 25 (33.8%) |
Disability Status by Sex by Age in Capulin
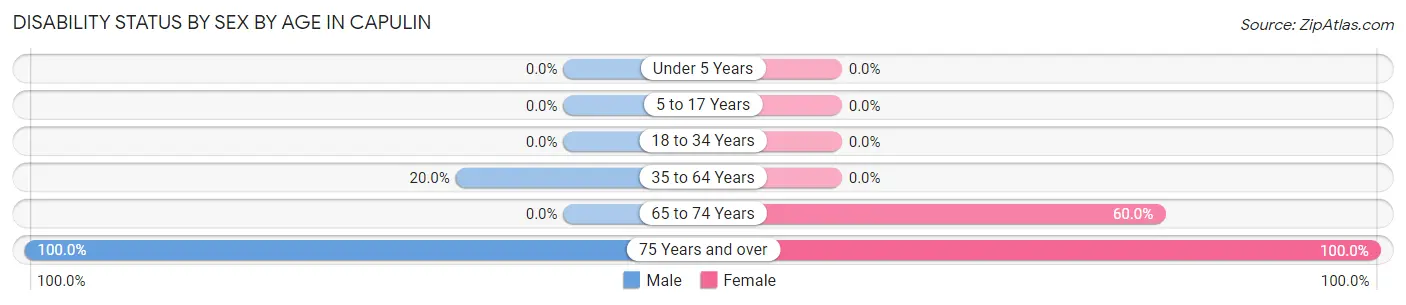
| Age Bracket | Male | Female |
| Under 5 Years | 0 (0.0%) | 0 (0.0%) |
| 5 to 17 Years | 0 (0.0%) | 0 (0.0%) |
| 18 to 34 Years | 0 (0.0%) | 0 (0.0%) |
| 35 to 64 Years | 1 (20.0%) | 0 (0.0%) |
| 65 to 74 Years | 0 (0.0%) | 3 (60.0%) |
| 75 Years and over | 14 (100.0%) | 13 (100.0%) |
Disability Class by Sex by Age in Capulin
Disability Class: Hearing Difficulty
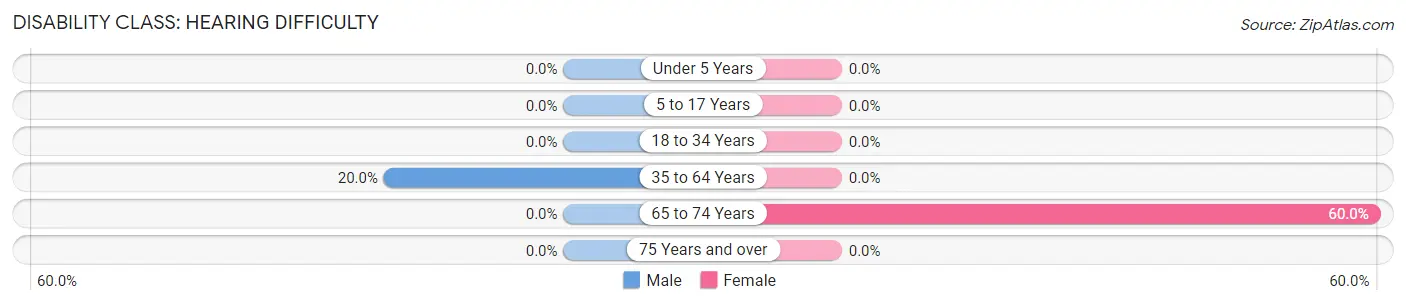
| Age Bracket | Male | Female |
| Under 5 Years | 0 (0.0%) | 0 (0.0%) |
| 5 to 17 Years | 0 (0.0%) | 0 (0.0%) |
| 18 to 34 Years | 0 (0.0%) | 0 (0.0%) |
| 35 to 64 Years | 1 (20.0%) | 0 (0.0%) |
| 65 to 74 Years | 0 (0.0%) | 3 (60.0%) |
| 75 Years and over | 0 (0.0%) | 0 (0.0%) |
Disability Class: Vision Difficulty
| Age Bracket | Male | Female |
| Under 5 Years | 0 (0.0%) | 0 (0.0%) |
| 5 to 17 Years | 0 (0.0%) | 0 (0.0%) |
| 18 to 34 Years | 0 (0.0%) | 0 (0.0%) |
| 35 to 64 Years | 0 (0.0%) | 0 (0.0%) |
| 65 to 74 Years | 0 (0.0%) | 0 (0.0%) |
| 75 Years and over | 0 (0.0%) | 0 (0.0%) |
Disability Class: Cognitive Difficulty
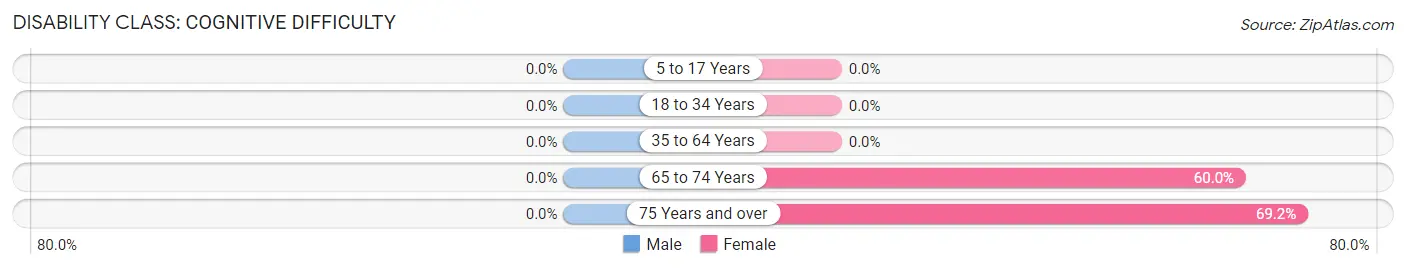
| Age Bracket | Male | Female |
| 5 to 17 Years | 0 (0.0%) | 0 (0.0%) |
| 18 to 34 Years | 0 (0.0%) | 0 (0.0%) |
| 35 to 64 Years | 0 (0.0%) | 0 (0.0%) |
| 65 to 74 Years | 0 (0.0%) | 3 (60.0%) |
| 75 Years and over | 0 (0.0%) | 9 (69.2%) |
Disability Class: Ambulatory Difficulty
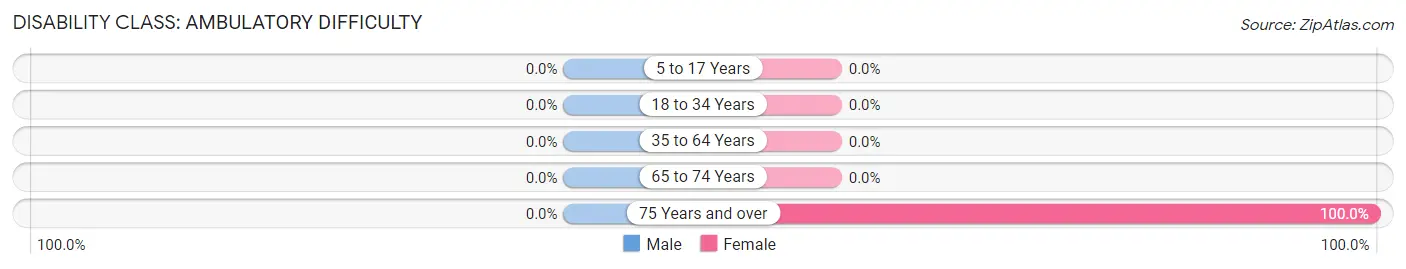
| Age Bracket | Male | Female |
| 5 to 17 Years | 0 (0.0%) | 0 (0.0%) |
| 18 to 34 Years | 0 (0.0%) | 0 (0.0%) |
| 35 to 64 Years | 0 (0.0%) | 0 (0.0%) |
| 65 to 74 Years | 0 (0.0%) | 0 (0.0%) |
| 75 Years and over | 0 (0.0%) | 13 (100.0%) |
Disability Class: Self-Care Difficulty
| Age Bracket | Male | Female |
| 5 to 17 Years | 0 (0.0%) | 0 (0.0%) |
| 18 to 34 Years | 0 (0.0%) | 0 (0.0%) |
| 35 to 64 Years | 0 (0.0%) | 0 (0.0%) |
| 65 to 74 Years | 0 (0.0%) | 0 (0.0%) |
| 75 Years and over | 0 (0.0%) | 0 (0.0%) |
Technology Access in Capulin
Computing Device Access in Capulin
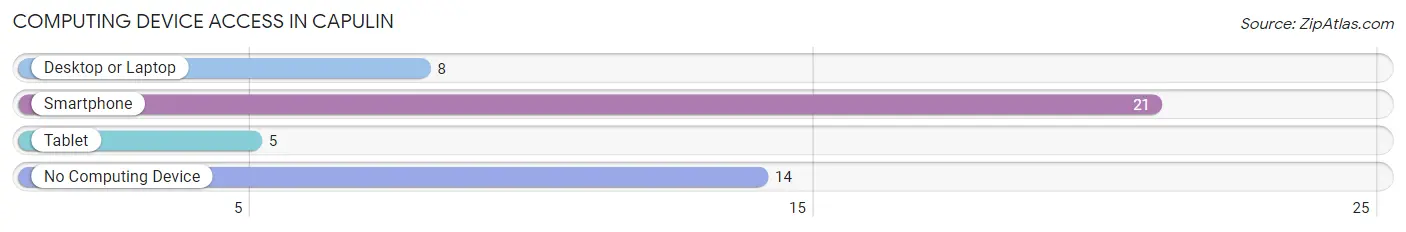
| Device Type | # Households | % Households |
| Desktop or Laptop | 8 | 22.9% |
| Smartphone | 21 | 60.0% |
| Tablet | 5 | 14.3% |
| No Computing Device | 14 | 40.0% |
| Total | 35 | 100.0% |
Internet Access in Capulin
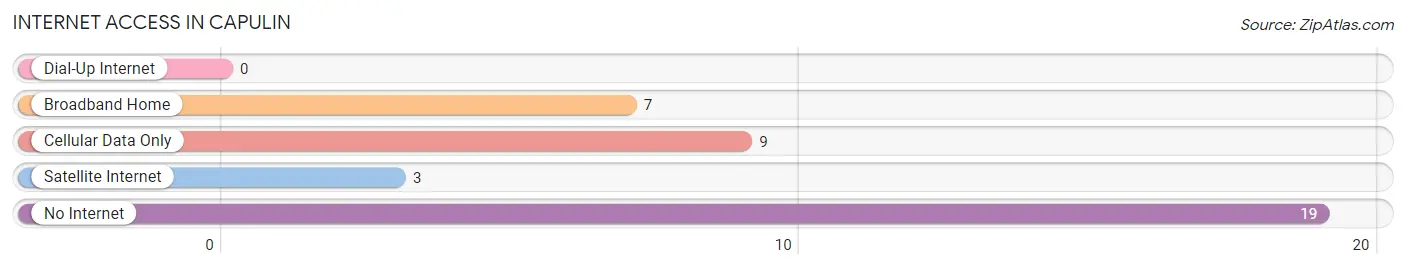
| Internet Type | # Households | % Households |
| Dial-Up Internet | 0 | 0.0% |
| Broadband Home | 7 | 20.0% |
| Cellular Data Only | 9 | 25.7% |
| Satellite Internet | 3 | 8.6% |
| No Internet | 19 | 54.3% |
| Total | 35 | 100.0% |
Capulin Summary
Capulin, New Mexico is a small town located in the northeastern corner of the state. It is situated in the foothills of the Sangre de Cristo Mountains, and is surrounded by rolling hills and grasslands. The town is located in Union County, and is part of the Raton-Clayton Metropolitan Statistical Area. The population of Capulin was 545 in the 2010 census, and the town has a total area of 0.6 square miles.
History
The area around Capulin was first settled by Native Americans, and the town was founded in 1881. The town was named after the nearby Capulin Volcano, which is a cinder cone volcano that was formed about 60,000 years ago. The volcano is now a National Monument, and is a popular tourist destination.
The town of Capulin was originally a farming and ranching community, and the local economy was based on the production of wool, cattle, and sheep. The town was also a stop on the Santa Fe Trail, and was a popular stop for travelers.
In the early 1900s, the town began to grow and develop, and the first school was built in 1910. The town also had a post office, a bank, a hotel, and several stores. The town continued to grow and develop throughout the 20th century, and in the 1950s, the town was connected to the nearby city of Raton by a paved road.
Geography
Capulin is located in the northeastern corner of New Mexico, in Union County. The town is situated in the foothills of the Sangre de Cristo Mountains, and is surrounded by rolling hills and grasslands. The town is located at an elevation of 6,845 feet, and has a total area of 0.6 square miles.
The climate in Capulin is semi-arid, with hot summers and cold winters. The average annual temperature is 54 degrees Fahrenheit, and the average annual precipitation is 13.5 inches.
Economy
The economy of Capulin is largely based on agriculture and tourism. The town is home to several farms and ranches, and the local economy is supported by the production of wool, cattle, and sheep. The town is also a popular tourist destination, and the nearby Capulin Volcano National Monument is a popular attraction.
The town also has several small businesses, including restaurants, stores, and a hotel. The town is also home to a post office, a bank, and a library.
Demographics
The population of Capulin was 545 in the 2010 census, and the town has a total area of 0.6 square miles. The population is largely Hispanic, with a majority of the population being of Mexican descent. The median household income in Capulin is $30,000, and the median age is 37. The town has a poverty rate of 22.3%, and the unemployment rate is 8.2%.
Common Questions
What is Per Capita Income in Capulin?
Per Capita income in Capulin is $23,369.
What is the Median Family Income in Capulin?
Median Family Income in Capulin is $39,444.
What is the Median Household income in Capulin?
Median Household Income in Capulin is $32,411.
What is Inequality or Gini Index in Capulin?
Inequality or Gini Index in Capulin is 0.33.
What is the Total Population of Capulin?
Total Population of Capulin is 74.
What is the Total Male Population of Capulin?
Total Male Population of Capulin is 43.
What is the Total Female Population of Capulin?
Total Female Population of Capulin is 31.
What is the Ratio of Males per 100 Females in Capulin?
There are 138.71 Males per 100 Females in Capulin.
What is the Ratio of Females per 100 Males in Capulin?
There are 72.09 Females per 100 Males in Capulin.
What is the Median Population Age in Capulin?
Median Population Age in Capulin is 66.8 Years.
What is the Average Family Size in Capulin
Average Family Size in Capulin is 3.2 People.
What is the Average Household Size in Capulin
Average Household Size in Capulin is 2.1 People.
How Large is the Labor Force in Capulin?
There are 12 People in the Labor Forcein in Capulin.
What is the Percentage of People in the Labor Force in Capulin?
16.7% of People are in the Labor Force in Capulin.