Taos County, NM Map & Demographics
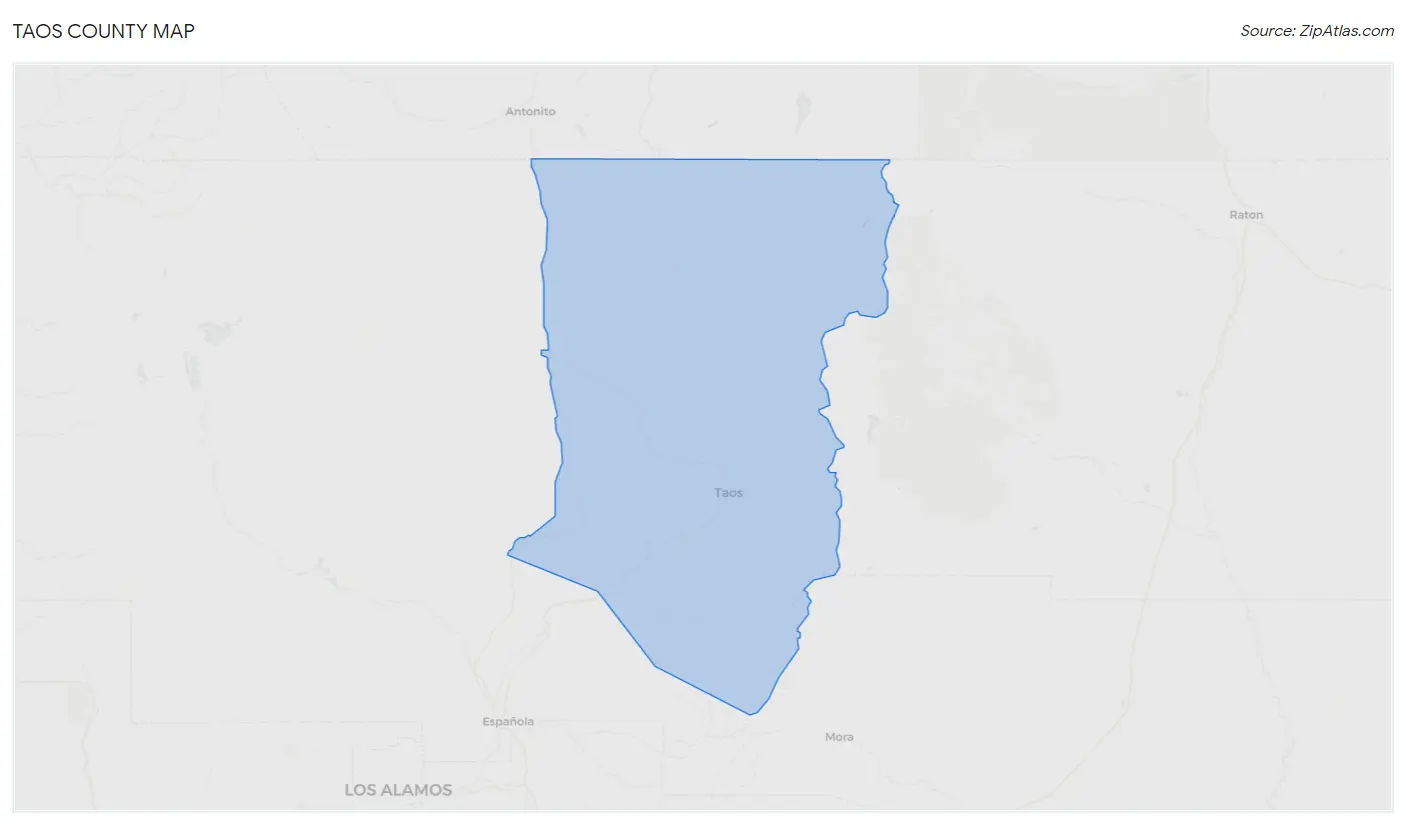
Taos County Map
Taos County Overview
$36,361
PER CAPITA INCOME
$69,965
AVG FAMILY INCOME
$55,145
AVG HOUSEHOLD INCOME
20.3%
WAGE / INCOME GAP [ % ]
79.7¢/ $1
WAGE / INCOME GAP [ $ ]
$9,565
FAMILY INCOME DEFICIT
0.51
INEQUALITY / GINI INDEX
34,475
TOTAL POPULATION
17,035
MALE POPULATION
17,440
FEMALE POPULATION
97.68
MALES / 100 FEMALES
102.38
FEMALES / 100 MALES
49.8
MEDIAN AGE
3.5
AVG FAMILY SIZE
2.5
AVG HOUSEHOLD SIZE
14,979
LABOR FORCE [ PEOPLE ]
50.9%
PERCENT IN LABOR FORCE
5.9%
UNEMPLOYMENT RATE
Income in Taos County
Income Overview in Taos County
Per Capita Income in Taos County is $36,361, while median incomes of families and households are $69,965 and $55,145 respectively.
| Characteristic | Number | Measure |
| Per Capita Income | 34,475 | $36,361 |
| Median Family Income | 7,367 | $69,965 |
| Mean Family Income | 7,367 | $100,396 |
| Median Household Income | 13,736 | $55,145 |
| Mean Household Income | 13,736 | $81,285 |
| Income Deficit | 7,367 | $9,565 |
| Wage / Income Gap (%) | 34,475 | 20.29% |
| Wage / Income Gap ($) | 34,475 | 79.71¢ per $1 |
| Gini / Inequality Index | 34,475 | 0.51 |
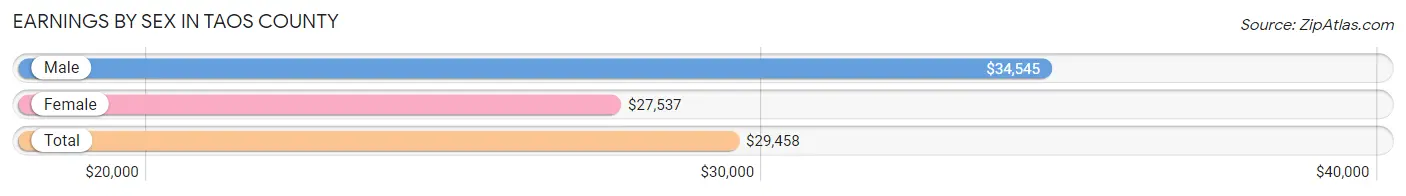
Earnings by Sex in Taos County
Average Earnings in Taos County are $29,458, $34,545 for men and $27,537 for women, a difference of 20.3%.
| Sex | Number | Average Earnings |
| Male | 7,912 (51.0%) | $34,545 |
| Female | 7,606 (49.0%) | $27,537 |
| Total | 15,518 (100.0%) | $29,458 |
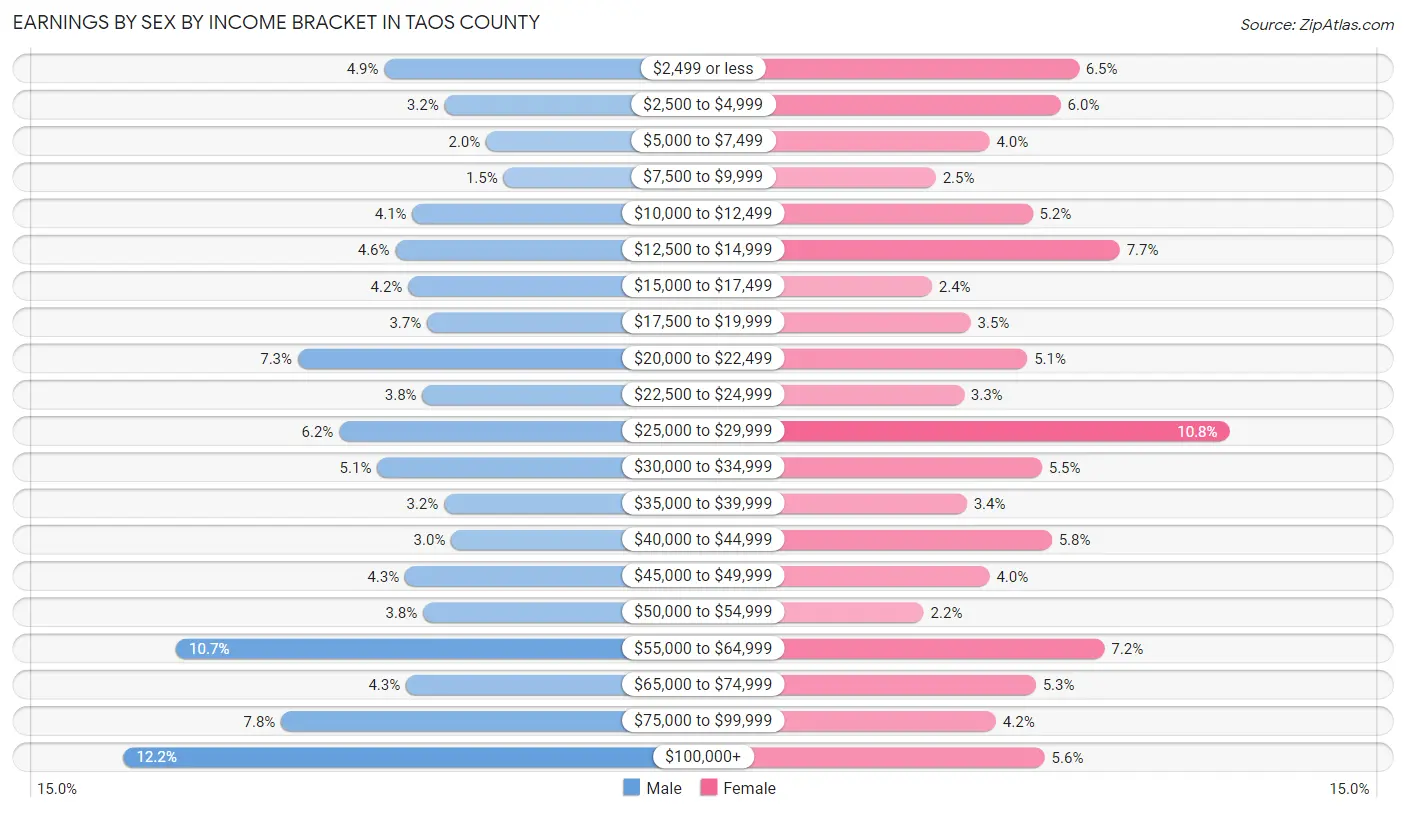
Earnings by Sex by Income Bracket in Taos County
The most common earnings brackets in Taos County are $100,000+ for men (967 | 12.2%) and $25,000 to $29,999 for women (818 | 10.7%).
| Income | Male | Female |
| $2,499 or less | 387 (4.9%) | 496 (6.5%) |
| $2,500 to $4,999 | 253 (3.2%) | 457 (6.0%) |
| $5,000 to $7,499 | 161 (2.0%) | 305 (4.0%) |
| $7,500 to $9,999 | 122 (1.5%) | 190 (2.5%) |
| $10,000 to $12,499 | 324 (4.1%) | 397 (5.2%) |
| $12,500 to $14,999 | 362 (4.6%) | 583 (7.7%) |
| $15,000 to $17,499 | 334 (4.2%) | 182 (2.4%) |
| $17,500 to $19,999 | 292 (3.7%) | 265 (3.5%) |
| $20,000 to $22,499 | 579 (7.3%) | 386 (5.1%) |
| $22,500 to $24,999 | 302 (3.8%) | 250 (3.3%) |
| $25,000 to $29,999 | 487 (6.2%) | 818 (10.7%) |
| $30,000 to $34,999 | 403 (5.1%) | 417 (5.5%) |
| $35,000 to $39,999 | 254 (3.2%) | 256 (3.4%) |
| $40,000 to $44,999 | 238 (3.0%) | 438 (5.8%) |
| $45,000 to $49,999 | 341 (4.3%) | 305 (4.0%) |
| $50,000 to $54,999 | 301 (3.8%) | 164 (2.2%) |
| $55,000 to $64,999 | 850 (10.7%) | 551 (7.2%) |
| $65,000 to $74,999 | 339 (4.3%) | 404 (5.3%) |
| $75,000 to $99,999 | 616 (7.8%) | 319 (4.2%) |
| $100,000+ | 967 (12.2%) | 423 (5.6%) |
| Total | 7,912 (100.0%) | 7,606 (100.0%) |
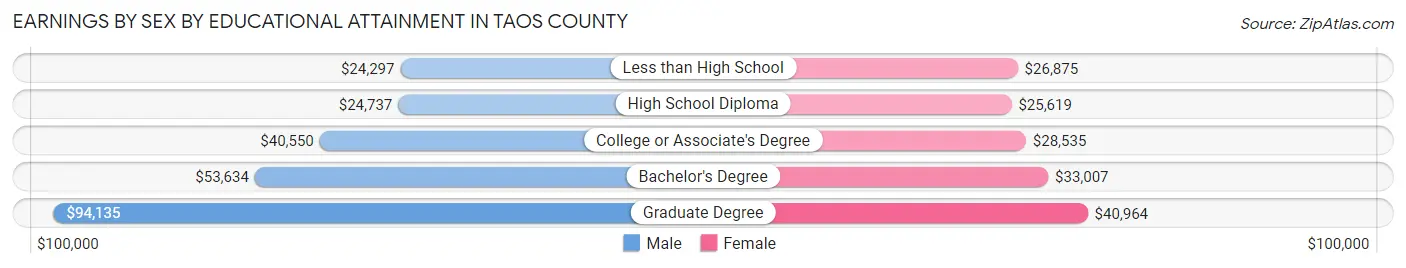
Earnings by Sex by Educational Attainment in Taos County
Average earnings in Taos County are $41,561 for men and $29,071 for women, a difference of 30.0%. Men with an educational attainment of graduate degree enjoy the highest average annual earnings of $94,135, while those with less than high school education earn the least with $24,297. Women with an educational attainment of graduate degree earn the most with the average annual earnings of $40,964, while those with high school diploma education have the smallest earnings of $25,619.
| Educational Attainment | Male Income | Female Income |
| Less than High School | $24,297 | $26,875 |
| High School Diploma | $24,737 | $25,619 |
| College or Associate's Degree | $40,550 | $28,535 |
| Bachelor's Degree | $53,634 | $33,007 |
| Graduate Degree | $94,135 | $40,964 |
| Total | $41,561 | $29,071 |
Family Income in Taos County
Family Income Brackets in Taos County
According to the Taos County family income data, there are 1,186 families falling into the $50,000 to $74,999 income range, which is the most common income bracket and makes up 16.1% of all families. Conversely, the $10,000 to $14,999 income bracket is the least frequent group with only 192 families (2.6%) belonging to this category.
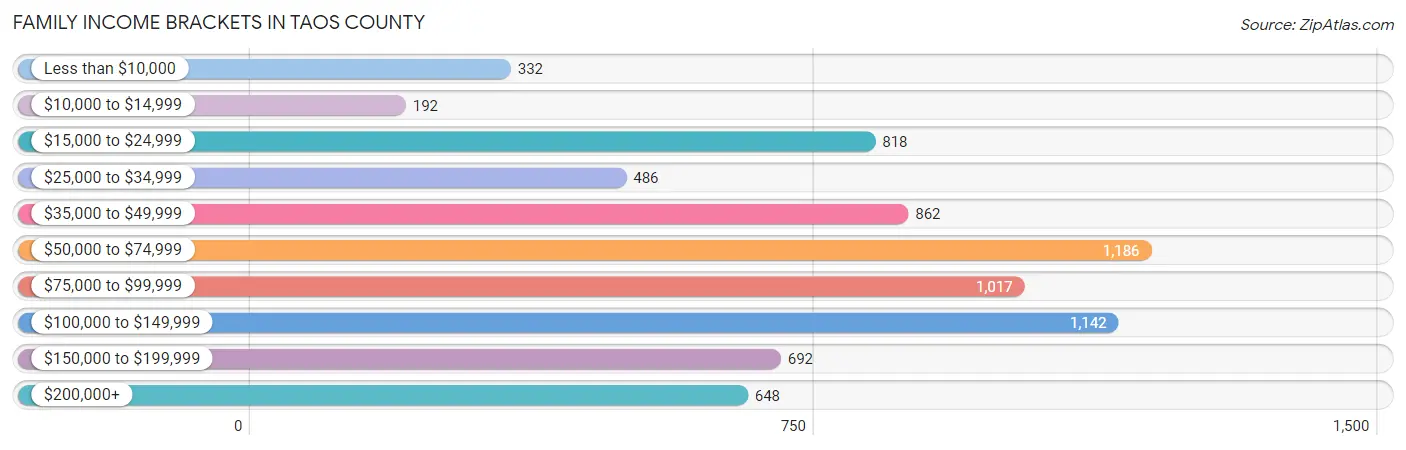
| Income Bracket | # Families | % Families |
| Less than $10,000 | 332 | 4.5% |
| $10,000 to $14,999 | 192 | 2.6% |
| $15,000 to $24,999 | 818 | 11.1% |
| $25,000 to $34,999 | 486 | 6.6% |
| $35,000 to $49,999 | 862 | 11.7% |
| $50,000 to $74,999 | 1,186 | 16.1% |
| $75,000 to $99,999 | 1,017 | 13.8% |
| $100,000 to $149,999 | 1,142 | 15.5% |
| $150,000 to $199,999 | 692 | 9.4% |
| $200,000+ | 648 | 8.8% |
Family Income by Famaliy Size in Taos County
7+ person families (66 | 0.9%) account for the highest median family income in Taos County with $118,269 per family, while 2-person families (4,525 | 61.4%) have the highest median income of $30,632 per family member.
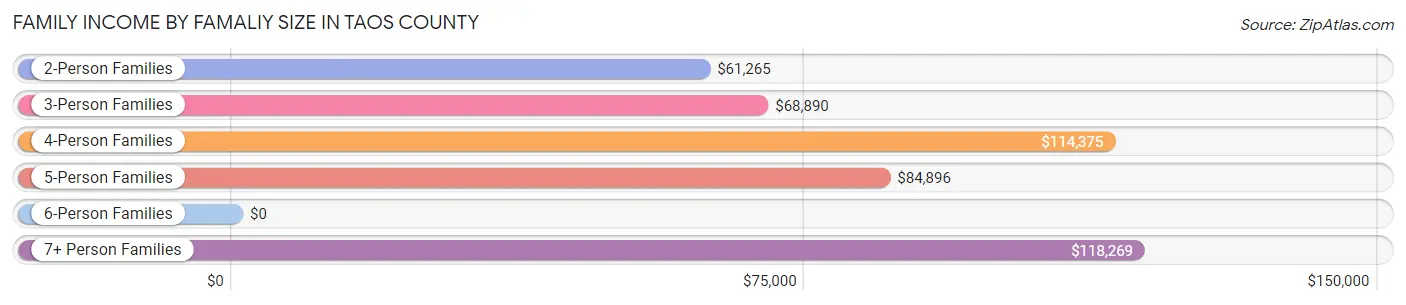
| Income Bracket | # Families | Median Income |
| 2-Person Families | 4,525 (61.4%) | $61,265 |
| 3-Person Families | 1,449 (19.7%) | $68,890 |
| 4-Person Families | 856 (11.6%) | $114,375 |
| 5-Person Families | 285 (3.9%) | $84,896 |
| 6-Person Families | 186 (2.5%) | $0 |
| 7+ Person Families | 66 (0.9%) | $118,269 |
| Total | 7,367 (100.0%) | $69,965 |
Family Income by Number of Earners in Taos County
The median family income in Taos County is $69,965, with families comprising 3+ earners (723) having the highest median family income of $132,023, while families with no earners (2,234) have the lowest median family income of $51,683, accounting for 9.8% and 30.3% of families, respectively.
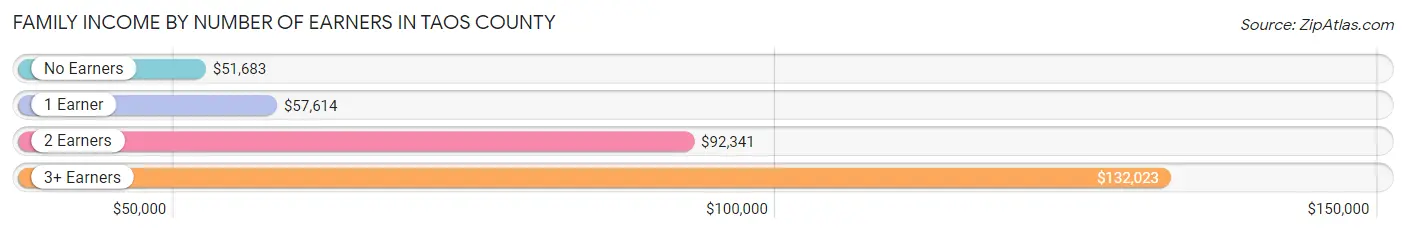
| Number of Earners | # Families | Median Income |
| No Earners | 2,234 (30.3%) | $51,683 |
| 1 Earner | 2,737 (37.1%) | $57,614 |
| 2 Earners | 1,673 (22.7%) | $92,341 |
| 3+ Earners | 723 (9.8%) | $132,023 |
| Total | 7,367 (100.0%) | $69,965 |
Household Income in Taos County
Household Income Brackets in Taos County
With 2,472 households falling in the category, the $50,000 to $74,999 income range is the most frequent in Taos County, accounting for 18.0% of all households. In contrast, only 810 households (5.9%) fall into the $150,000 to $199,999 income bracket, making it the least populous group.
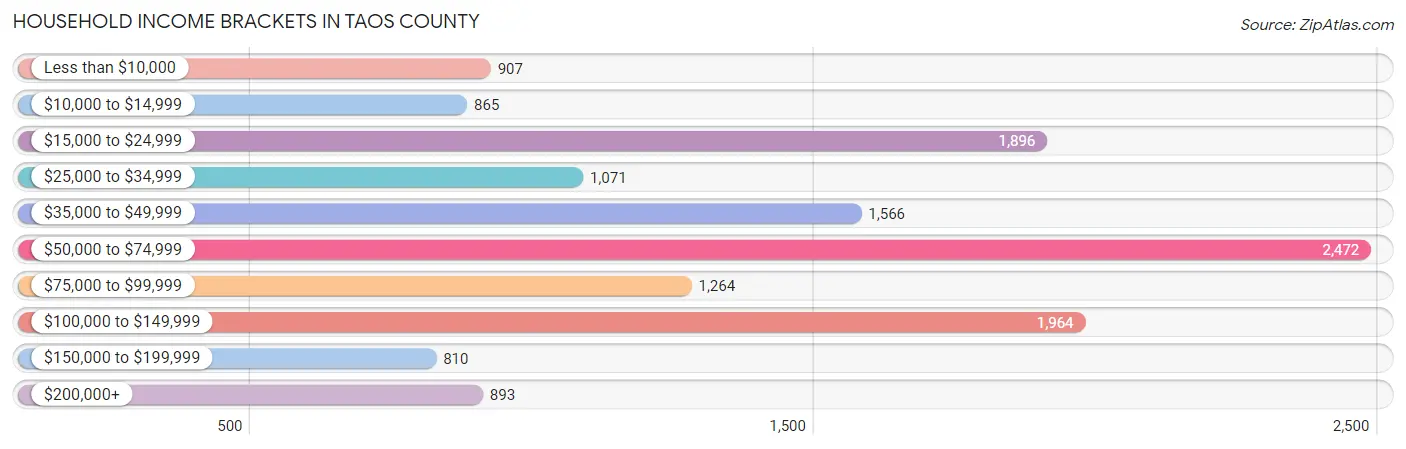
| Income Bracket | # Households | % Households |
| Less than $10,000 | 907 | 6.6% |
| $10,000 to $14,999 | 865 | 6.3% |
| $15,000 to $24,999 | 1,896 | 13.8% |
| $25,000 to $34,999 | 1,071 | 7.8% |
| $35,000 to $49,999 | 1,566 | 11.4% |
| $50,000 to $74,999 | 2,472 | 18.0% |
| $75,000 to $99,999 | 1,264 | 9.2% |
| $100,000 to $149,999 | 1,964 | 14.3% |
| $150,000 to $199,999 | 810 | 5.9% |
| $200,000+ | 893 | 6.5% |
Household Income by Householder Age in Taos County
The median household income in Taos County is $55,145, with the highest median household income of $65,257 found in the 45 to 64 years age bracket for the primary householder. A total of 5,418 households (39.4%) fall into this category. Meanwhile, the 15 to 24 years age bracket for the primary householder has the lowest median household income of $46,762, with 196 households (1.4%) in this group.
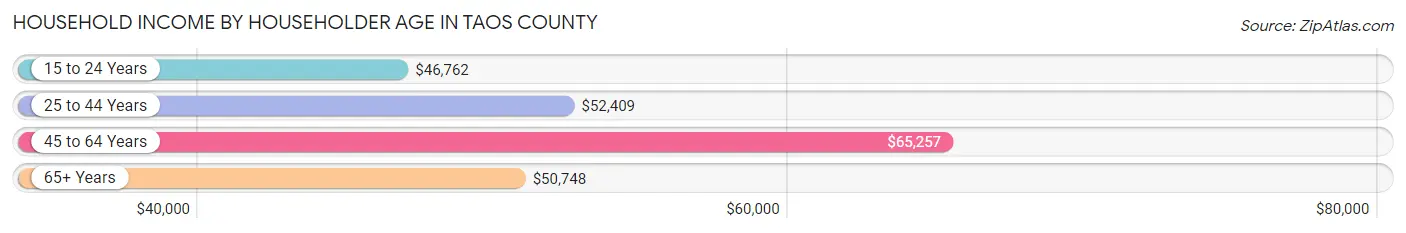
| Income Bracket | # Households | Median Income |
| 15 to 24 Years | 196 (1.4%) | $46,762 |
| 25 to 44 Years | 2,154 (15.7%) | $52,409 |
| 45 to 64 Years | 5,418 (39.4%) | $65,257 |
| 65+ Years | 5,968 (43.4%) | $50,748 |
| Total | 13,736 (100.0%) | $55,145 |
Poverty in Taos County
Income Below Poverty by Sex and Age in Taos County
With 14.0% poverty level for males and 15.7% for females among the residents of Taos County, 15 year old males and 16 and 17 year old females are the most vulnerable to poverty, with 84 males (46.7%) and 153 females (39.4%) in their respective age groups living below the poverty level.
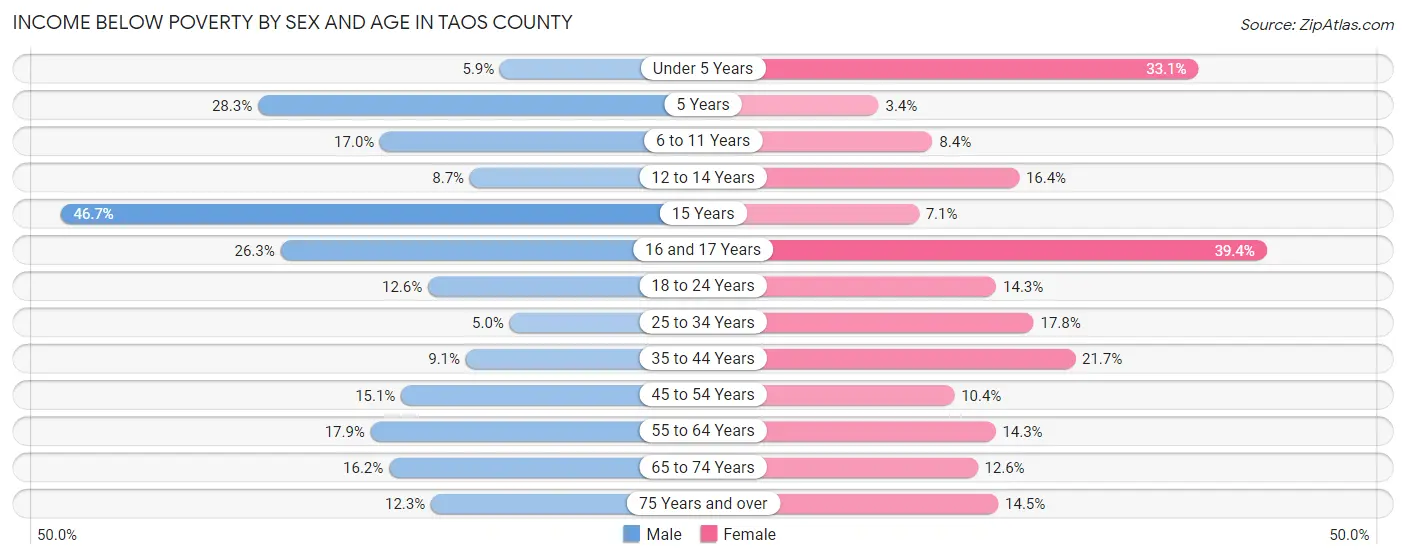
| Age Bracket | Male | Female |
| Under 5 Years | 33 (5.9%) | 224 (33.1%) |
| 5 Years | 89 (28.3%) | 3 (3.4%) |
| 6 to 11 Years | 162 (17.0%) | 84 (8.4%) |
| 12 to 14 Years | 51 (8.7%) | 86 (16.4%) |
| 15 Years | 84 (46.7%) | 10 (7.1%) |
| 16 and 17 Years | 105 (26.3%) | 153 (39.4%) |
| 18 to 24 Years | 162 (12.6%) | 125 (14.3%) |
| 25 to 34 Years | 77 (5.0%) | 320 (17.8%) |
| 35 to 44 Years | 186 (9.0%) | 432 (21.6%) |
| 45 to 54 Years | 308 (15.0%) | 208 (10.4%) |
| 55 to 64 Years | 463 (17.9%) | 398 (14.3%) |
| 65 to 74 Years | 448 (16.2%) | 381 (12.6%) |
| 75 Years and over | 200 (12.3%) | 295 (14.5%) |
| Total | 2,368 (14.0%) | 2,719 (15.7%) |
Income Above Poverty by Sex and Age in Taos County
According to the poverty statistics in Taos County, males aged 25 to 34 years and females aged 5 years are the age groups that are most secure financially, with 95.0% of males and 96.6% of females in these age groups living above the poverty line.
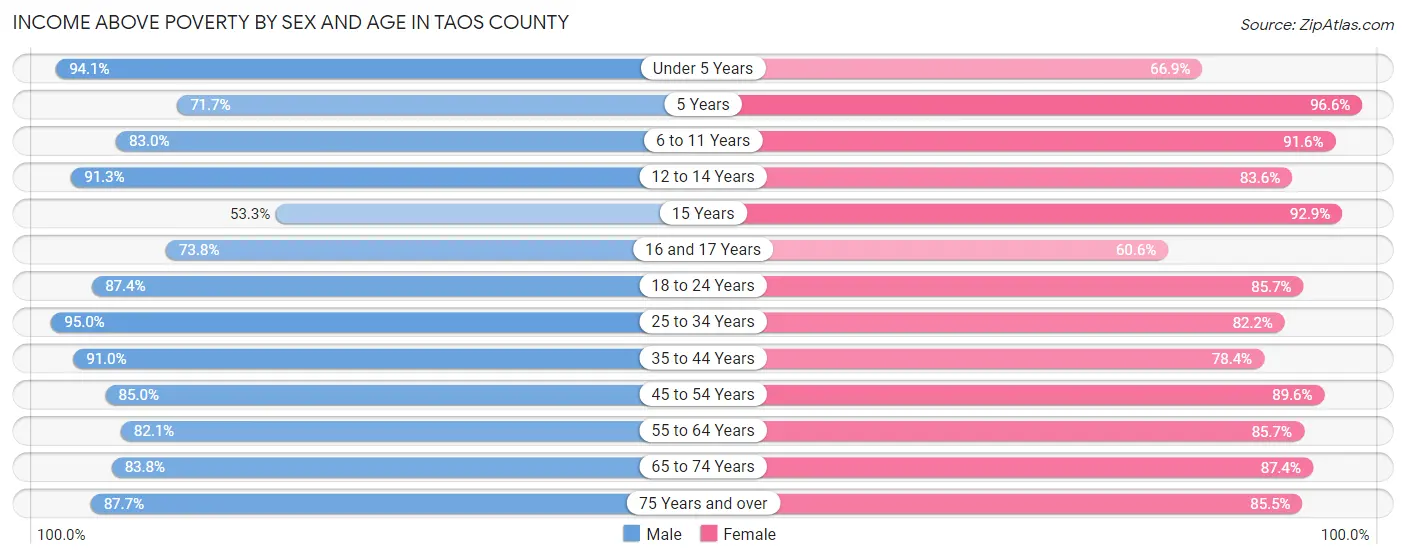
| Age Bracket | Male | Female |
| Under 5 Years | 529 (94.1%) | 453 (66.9%) |
| 5 Years | 225 (71.7%) | 85 (96.6%) |
| 6 to 11 Years | 791 (83.0%) | 915 (91.6%) |
| 12 to 14 Years | 537 (91.3%) | 437 (83.6%) |
| 15 Years | 96 (53.3%) | 130 (92.9%) |
| 16 and 17 Years | 295 (73.8%) | 235 (60.6%) |
| 18 to 24 Years | 1,128 (87.4%) | 748 (85.7%) |
| 25 to 34 Years | 1,469 (95.0%) | 1,478 (82.2%) |
| 35 to 44 Years | 1,870 (90.9%) | 1,563 (78.3%) |
| 45 to 54 Years | 1,739 (85.0%) | 1,786 (89.6%) |
| 55 to 64 Years | 2,127 (82.1%) | 2,394 (85.7%) |
| 65 to 74 Years | 2,323 (83.8%) | 2,646 (87.4%) |
| 75 Years and over | 1,429 (87.7%) | 1,738 (85.5%) |
| Total | 14,558 (86.0%) | 14,608 (84.3%) |
Income Below Poverty Among Married-Couple Families in Taos County
The poverty statistics for married-couple families in Taos County show that 7.8% or 387 of the total 4,955 families live below the poverty line. Families with no children have the highest poverty rate of 8.7%, comprising of 343 families. On the other hand, families with 5 or more children have the lowest poverty rate of 0.0%, which includes 0 families.
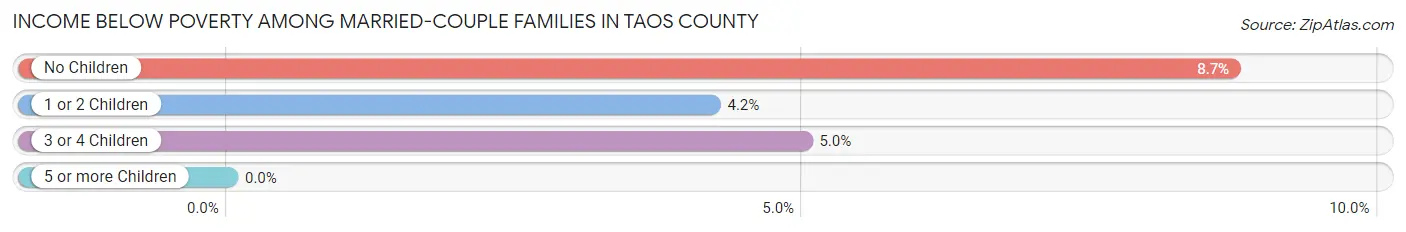
| Children | Above Poverty | Below Poverty |
| No Children | 3,584 (91.3%) | 343 (8.7%) |
| 1 or 2 Children | 866 (95.8%) | 38 (4.2%) |
| 3 or 4 Children | 114 (95.0%) | 6 (5.0%) |
| 5 or more Children | 4 (100.0%) | 0 (0.0%) |
| Total | 4,568 (92.2%) | 387 (7.8%) |
Income Below Poverty Among Single-Parent Households in Taos County
According to the poverty data in Taos County, 12.6% or 53 single-father households and 25.3% or 503 single-mother households are living below the poverty line. Among single-father households, those with 3 or 4 children have the highest poverty rate, with 6 households (46.2%) experiencing poverty. Likewise, among single-mother households, those with 3 or 4 children have the highest poverty rate, with 96 households (49.5%) falling below the poverty line.
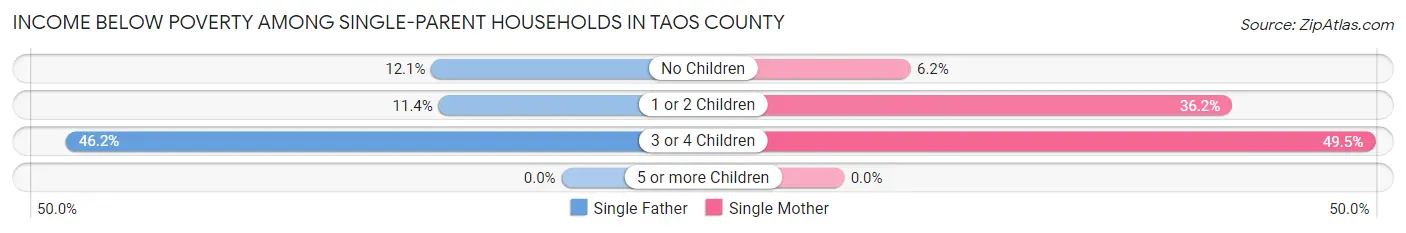
| Children | Single Father | Single Mother |
| No Children | 16 (12.1%) | 50 (6.2%) |
| 1 or 2 Children | 31 (11.4%) | 357 (36.2%) |
| 3 or 4 Children | 6 (46.2%) | 96 (49.5%) |
| 5 or more Children | 0 (0.0%) | 0 (0.0%) |
| Total | 53 (12.6%) | 503 (25.3%) |
Income Below Poverty Among Married-Couple vs Single-Parent Households in Taos County
The poverty data for Taos County shows that 387 of the married-couple family households (7.8%) and 556 of the single-parent households (23.1%) are living below the poverty level. Within the married-couple family households, those with no children have the highest poverty rate, with 343 households (8.7%) falling below the poverty line. Among the single-parent households, those with 3 or 4 children have the highest poverty rate, with 102 household (49.3%) living below poverty.
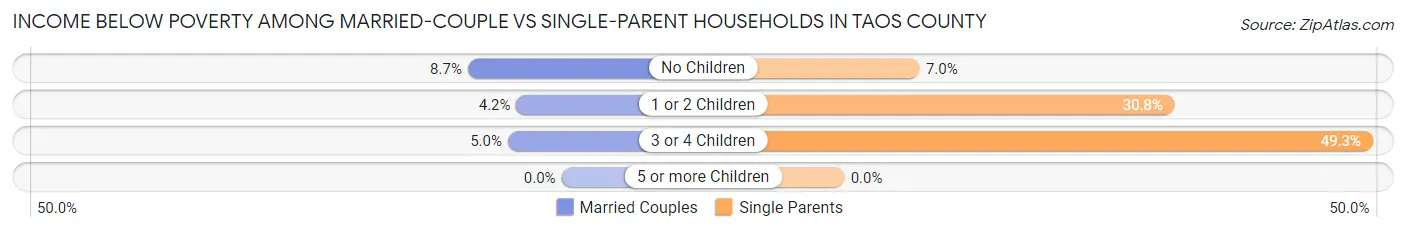
| Children | Married-Couple Families | Single-Parent Households |
| No Children | 343 (8.7%) | 66 (7.0%) |
| 1 or 2 Children | 38 (4.2%) | 388 (30.8%) |
| 3 or 4 Children | 6 (5.0%) | 102 (49.3%) |
| 5 or more Children | 0 (0.0%) | 0 (0.0%) |
| Total | 387 (7.8%) | 556 (23.1%) |
Race in Taos County
The most populous races in Taos County are White / Caucasian (22,387 | 64.9%), Hispanic or Latino (19,575 | 56.8%), and Two or more Races (6,356 | 18.4%).
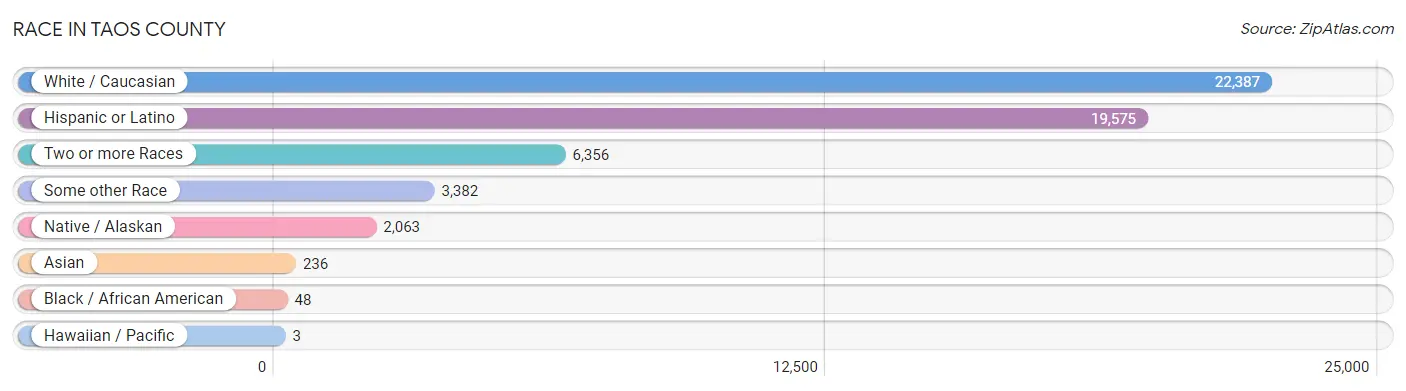
| Race | # Population | % Population |
| Asian | 236 | 0.7% |
| Black / African American | 48 | 0.1% |
| Hawaiian / Pacific | 3 | 0.0% |
| Hispanic or Latino | 19,575 | 56.8% |
| Native / Alaskan | 2,063 | 6.0% |
| White / Caucasian | 22,387 | 64.9% |
| Two or more Races | 6,356 | 18.4% |
| Some other Race | 3,382 | 9.8% |
| Total | 34,475 | 100.0% |
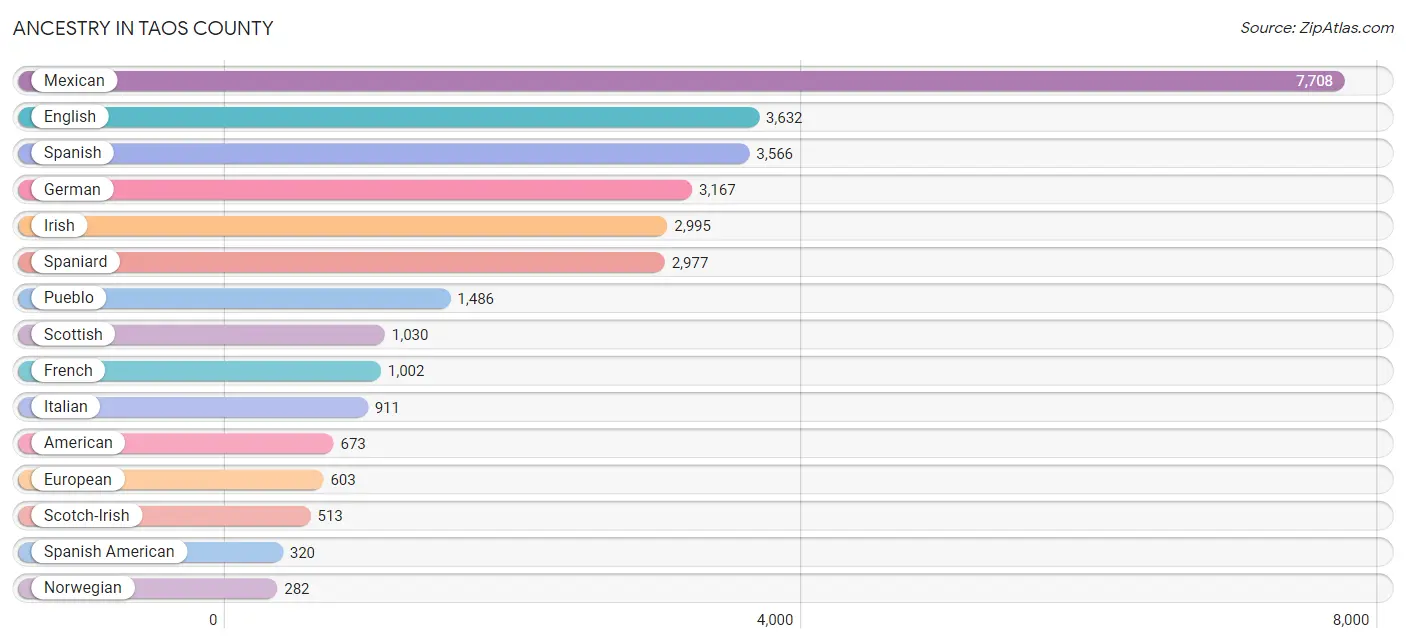
Ancestry in Taos County
The most populous ancestries reported in Taos County are Mexican (7,708 | 22.4%), English (3,632 | 10.5%), Spanish (3,566 | 10.3%), German (3,167 | 9.2%), and Irish (2,995 | 8.7%), together accounting for 61.1% of all Taos County residents.
| Ancestry | # Population | % Population |
| African | 3 | 0.0% |
| Alaskan Athabascan | 37 | 0.1% |
| Aleut | 1 | 0.0% |
| American | 673 | 1.9% |
| Apache | 140 | 0.4% |
| Arab | 4 | 0.0% |
| Armenian | 6 | 0.0% |
| Austrian | 69 | 0.2% |
| Basque | 6 | 0.0% |
| Belgian | 47 | 0.1% |
| Bhutanese | 77 | 0.2% |
| Blackfeet | 3 | 0.0% |
| British | 60 | 0.2% |
| Bulgarian | 1 | 0.0% |
| Burmese | 12 | 0.0% |
| Cajun | 26 | 0.1% |
| Canadian | 44 | 0.1% |
| Celtic | 3 | 0.0% |
| Central American | 48 | 0.1% |
| Central American Indian | 3 | 0.0% |
| Cherokee | 221 | 0.6% |
| Cheyenne | 15 | 0.0% |
| Choctaw | 1 | 0.0% |
| Colombian | 28 | 0.1% |
| Cree | 2 | 0.0% |
| Croatian | 4 | 0.0% |
| Cuban | 5 | 0.0% |
| Czech | 89 | 0.3% |
| Czechoslovakian | 8 | 0.0% |
| Danish | 62 | 0.2% |
| Dutch | 162 | 0.5% |
| Eastern European | 63 | 0.2% |
| English | 3,632 | 10.5% |
| European | 603 | 1.8% |
| Filipino | 8 | 0.0% |
| Finnish | 193 | 0.6% |
| French | 1,002 | 2.9% |
| French American Indian | 10 | 0.0% |
| French Canadian | 170 | 0.5% |
| German | 3,167 | 9.2% |
| Greek | 80 | 0.2% |
| Guamanian / Chamorro | 3 | 0.0% |
| Guatemalan | 34 | 0.1% |
| Honduran | 13 | 0.0% |
| Hopi | 8 | 0.0% |
| Hungarian | 83 | 0.2% |
| Irish | 2,995 | 8.7% |
| Iroquois | 3 | 0.0% |
| Italian | 911 | 2.6% |
| Kiowa | 3 | 0.0% |
| Korean | 164 | 0.5% |
| Latvian | 180 | 0.5% |
| Lebanese | 4 | 0.0% |
| Lithuanian | 57 | 0.2% |
| Luxembourger | 3 | 0.0% |
| Mexican | 7,708 | 22.4% |
| Native Hawaiian | 12 | 0.0% |
| Navajo | 178 | 0.5% |
| Nicaraguan | 1 | 0.0% |
| Northern European | 120 | 0.4% |
| Norwegian | 282 | 0.8% |
| Pima | 5 | 0.0% |
| Polish | 197 | 0.6% |
| Portuguese | 17 | 0.1% |
| Pueblo | 1,486 | 4.3% |
| Puerto Rican | 38 | 0.1% |
| Romanian | 21 | 0.1% |
| Russian | 119 | 0.4% |
| Samoan | 70 | 0.2% |
| Scandinavian | 60 | 0.2% |
| Scotch-Irish | 513 | 1.5% |
| Scottish | 1,030 | 3.0% |
| Serbian | 6 | 0.0% |
| Sioux | 16 | 0.1% |
| Slovak | 8 | 0.0% |
| Slovene | 4 | 0.0% |
| South American | 28 | 0.1% |
| Soviet Union | 2 | 0.0% |
| Spaniard | 2,977 | 8.6% |
| Spanish | 3,566 | 10.3% |
| Spanish American | 320 | 0.9% |
| Sri Lankan | 64 | 0.2% |
| Subsaharan African | 3 | 0.0% |
| Swedish | 265 | 0.8% |
| Swiss | 42 | 0.1% |
| Thai | 14 | 0.0% |
| Ukrainian | 9 | 0.0% |
| Ute | 4 | 0.0% |
| Welsh | 245 | 0.7% | View All 89 Rows |
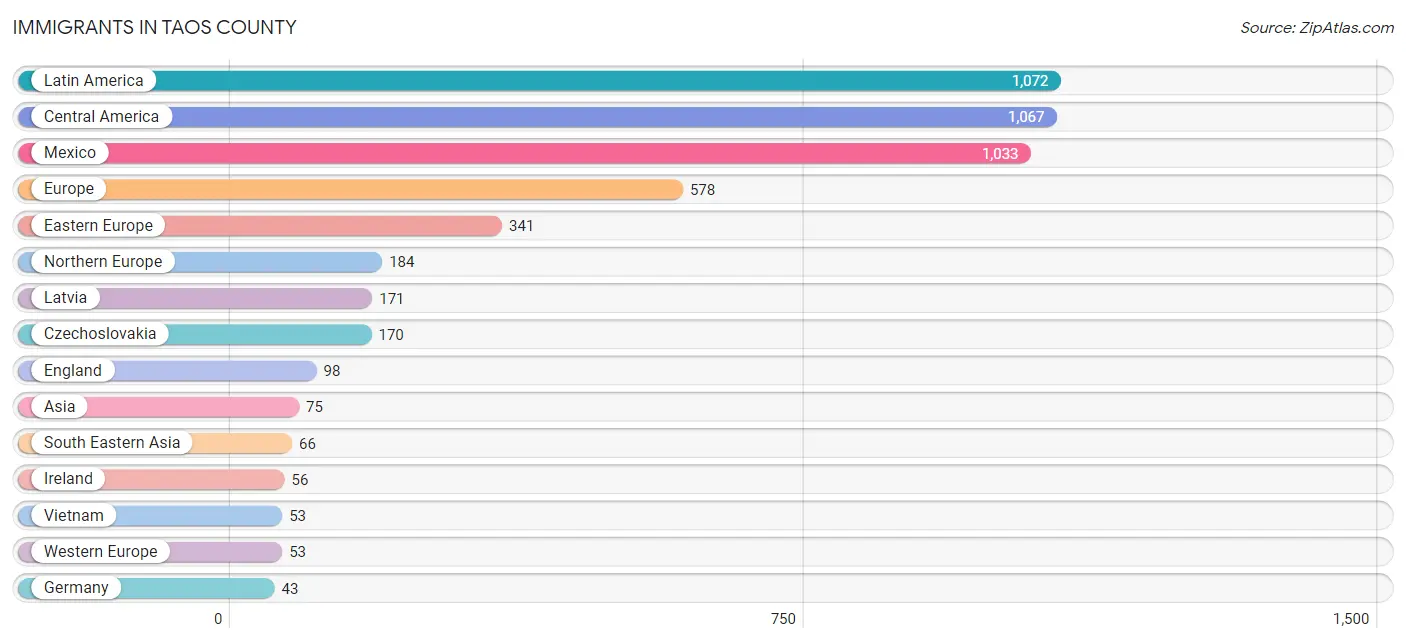
Immigrants in Taos County
The most numerous immigrant groups reported in Taos County came from Latin America (1,072 | 3.1%), Central America (1,067 | 3.1%), Mexico (1,033 | 3.0%), Europe (578 | 1.7%), and Eastern Europe (341 | 1.0%), together accounting for 11.9% of all Taos County residents.
| Immigration Origin | # Population | % Population |
| Africa | 17 | 0.1% |
| Asia | 75 | 0.2% |
| Australia | 8 | 0.0% |
| Canada | 41 | 0.1% |
| Central America | 1,067 | 3.1% |
| Colombia | 5 | 0.0% |
| Czechoslovakia | 170 | 0.5% |
| Eastern Africa | 17 | 0.1% |
| Eastern Asia | 9 | 0.0% |
| Eastern Europe | 341 | 1.0% |
| England | 98 | 0.3% |
| Europe | 578 | 1.7% |
| France | 10 | 0.0% |
| Germany | 43 | 0.1% |
| Guatemala | 34 | 0.1% |
| Ireland | 56 | 0.2% |
| Japan | 9 | 0.0% |
| Kenya | 14 | 0.0% |
| Latin America | 1,072 | 3.1% |
| Latvia | 171 | 0.5% |
| Mexico | 1,033 | 3.0% |
| Micronesia | 4 | 0.0% |
| Northern Europe | 184 | 0.5% |
| Oceania | 12 | 0.0% |
| Philippines | 13 | 0.0% |
| Scotland | 12 | 0.0% |
| South America | 5 | 0.0% |
| South Eastern Asia | 66 | 0.2% |
| Sweden | 3 | 0.0% |
| Vietnam | 53 | 0.2% |
| Western Europe | 53 | 0.2% | View All 31 Rows |
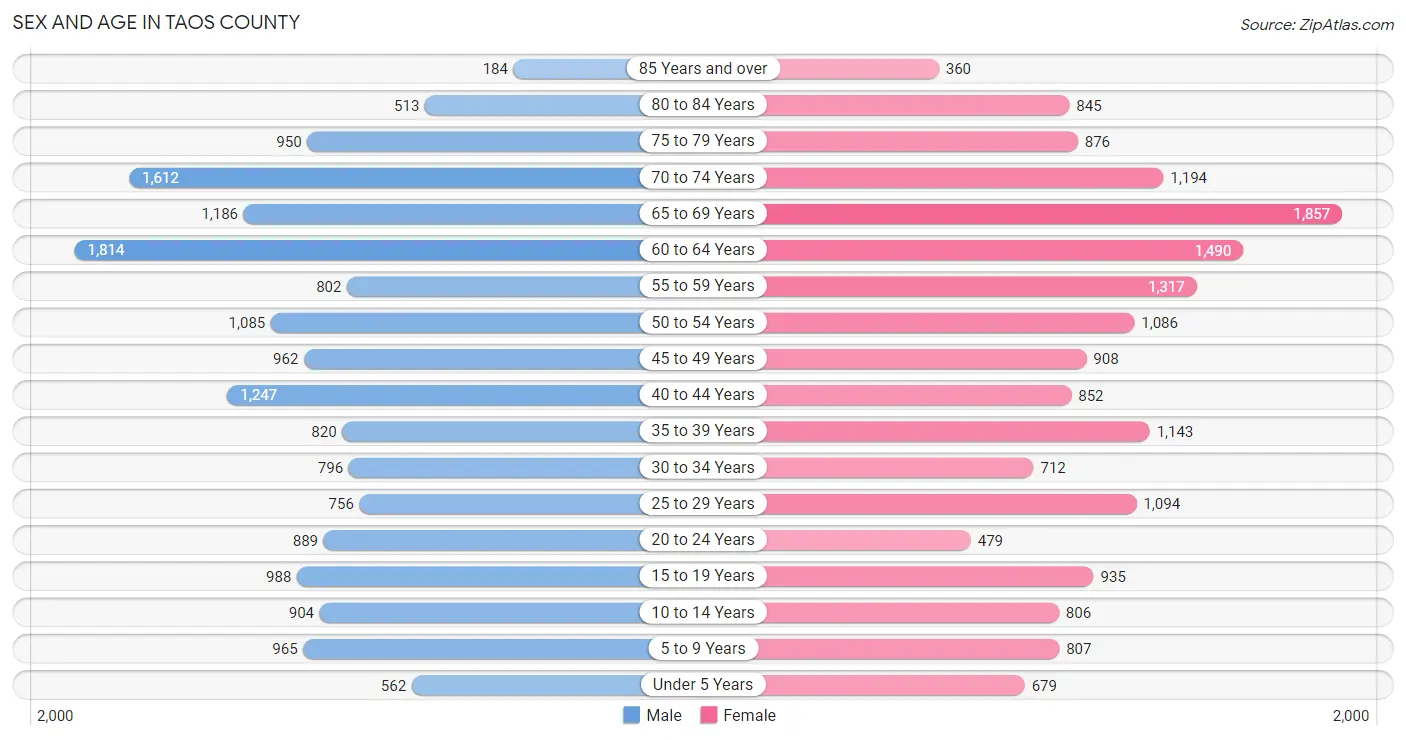
Sex and Age in Taos County
Sex and Age in Taos County
The most populous age groups in Taos County are 60 to 64 Years (1,814 | 10.6%) for men and 65 to 69 Years (1,857 | 10.6%) for women.
| Age Bracket | Male | Female |
| Under 5 Years | 562 (3.3%) | 679 (3.9%) |
| 5 to 9 Years | 965 (5.7%) | 807 (4.6%) |
| 10 to 14 Years | 904 (5.3%) | 806 (4.6%) |
| 15 to 19 Years | 988 (5.8%) | 935 (5.4%) |
| 20 to 24 Years | 889 (5.2%) | 479 (2.8%) |
| 25 to 29 Years | 756 (4.4%) | 1,094 (6.3%) |
| 30 to 34 Years | 796 (4.7%) | 712 (4.1%) |
| 35 to 39 Years | 820 (4.8%) | 1,143 (6.6%) |
| 40 to 44 Years | 1,247 (7.3%) | 852 (4.9%) |
| 45 to 49 Years | 962 (5.7%) | 908 (5.2%) |
| 50 to 54 Years | 1,085 (6.4%) | 1,086 (6.2%) |
| 55 to 59 Years | 802 (4.7%) | 1,317 (7.5%) |
| 60 to 64 Years | 1,814 (10.6%) | 1,490 (8.5%) |
| 65 to 69 Years | 1,186 (7.0%) | 1,857 (10.6%) |
| 70 to 74 Years | 1,612 (9.5%) | 1,194 (6.9%) |
| 75 to 79 Years | 950 (5.6%) | 876 (5.0%) |
| 80 to 84 Years | 513 (3.0%) | 845 (4.9%) |
| 85 Years and over | 184 (1.1%) | 360 (2.1%) |
| Total | 17,035 (100.0%) | 17,440 (100.0%) |
Families and Households in Taos County
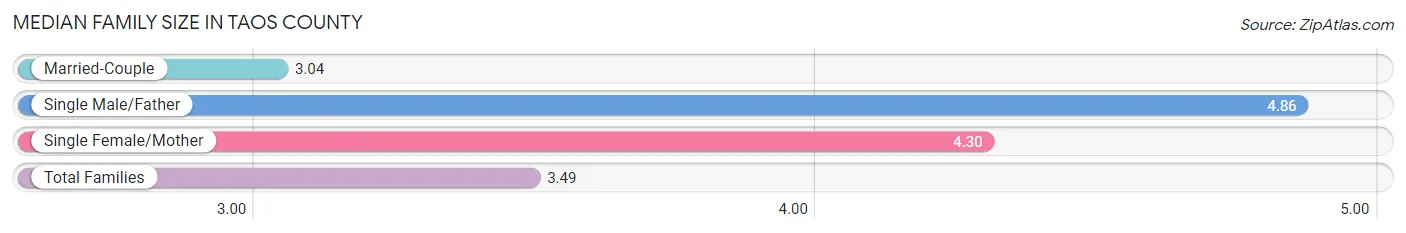
Median Family Size in Taos County
The median family size in Taos County is 3.49 persons per family, with single male/father families (422 | 5.7%) accounting for the largest median family size of 4.86 persons per family. On the other hand, married-couple families (4,955 | 67.3%) represent the smallest median family size with 3.04 persons per family.
| Family Type | # Families | Family Size |
| Married-Couple | 4,955 (67.3%) | 3.04 |
| Single Male/Father | 422 (5.7%) | 4.86 |
| Single Female/Mother | 1,990 (27.0%) | 4.30 |
| Total Families | 7,367 (100.0%) | 3.49 |
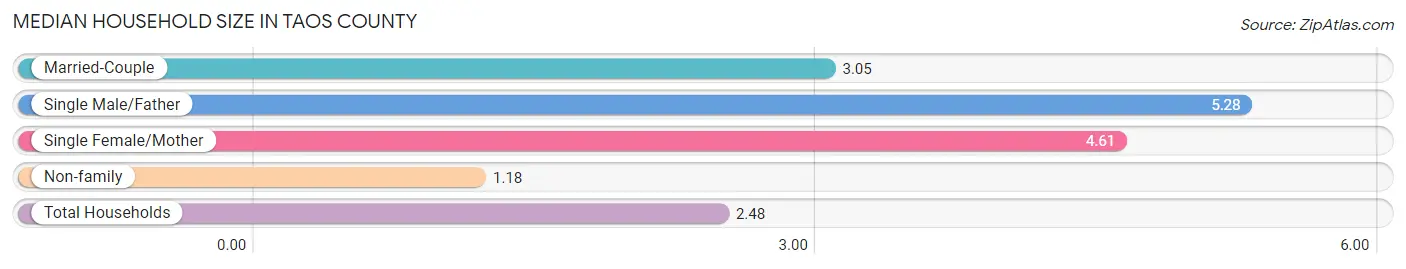
Median Household Size in Taos County
The median household size in Taos County is 2.48 persons per household, with single male/father households (422 | 3.1%) accounting for the largest median household size of 5.28 persons per household. non-family households (6,369 | 46.4%) represent the smallest median household size with 1.18 persons per household.
| Household Type | # Households | Household Size |
| Married-Couple | 4,955 (36.1%) | 3.05 |
| Single Male/Father | 422 (3.1%) | 5.28 |
| Single Female/Mother | 1,990 (14.5%) | 4.61 |
| Non-family | 6,369 (46.4%) | 1.18 |
| Total Households | 13,736 (100.0%) | 2.48 |
Household Size by Marriage Status in Taos County
Out of a total of 13,736 households in Taos County, 7,367 (53.6%) are family households, while 6,369 (46.4%) are nonfamily households. The most numerous type of family households are 2-person households, comprising 4,391, and the most common type of nonfamily households are 1-person households, comprising 5,430.
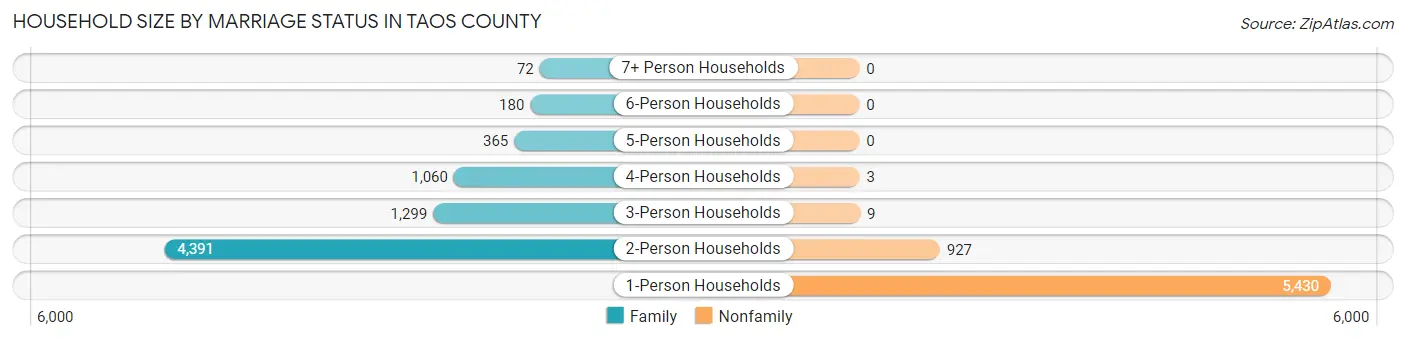
| Household Size | Family Households | Nonfamily Households |
| 1-Person Households | - | 5,430 (39.5%) |
| 2-Person Households | 4,391 (32.0%) | 927 (6.8%) |
| 3-Person Households | 1,299 (9.5%) | 9 (0.1%) |
| 4-Person Households | 1,060 (7.7%) | 3 (0.0%) |
| 5-Person Households | 365 (2.7%) | 0 (0.0%) |
| 6-Person Households | 180 (1.3%) | 0 (0.0%) |
| 7+ Person Households | 72 (0.5%) | 0 (0.0%) |
| Total | 7,367 (53.6%) | 6,369 (46.4%) |
Female Fertility in Taos County
Fertility by Age in Taos County
Average fertility rate in Taos County is 6.0 births per 1,000 women. Women in the age bracket of 20 to 34 years have the highest fertility rate with 14.0 births per 1,000 women. Women in the age bracket of 20 to 34 years acount for 88.9% of all women with births.
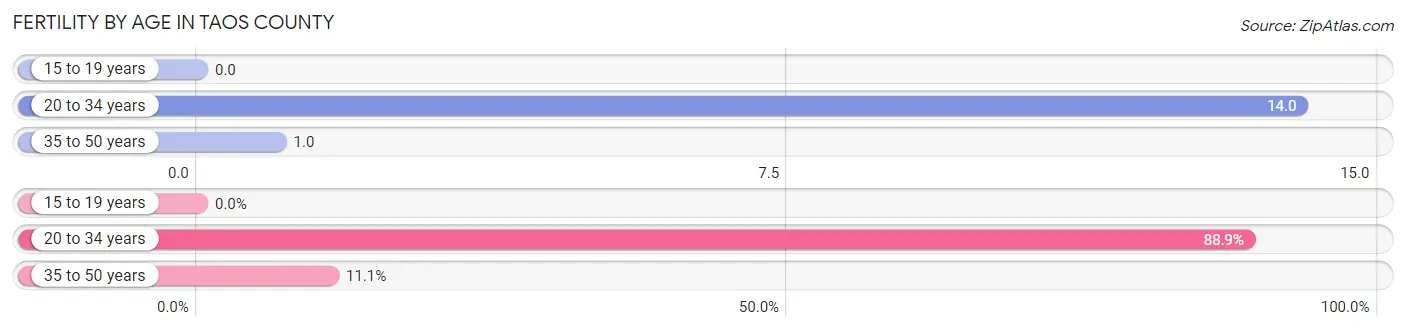
| Age Bracket | Women with Births | Births / 1,000 Women |
| 15 to 19 years | 0 (0.0%) | 0.0 |
| 20 to 34 years | 32 (88.9%) | 14.0 |
| 35 to 50 years | 4 (11.1%) | 1.0 |
| Total | 36 (100.0%) | 6.0 |
Fertility by Age by Marriage Status in Taos County
38.9% of women with births (36) in Taos County are married. The highest percentage of unmarried women with births falls into 20 to 34 years age bracket with 68.8% of them unmarried at the time of birth, while the lowest percentage of unmarried women with births belong to 35 to 50 years age bracket with 0.0% of them unmarried.
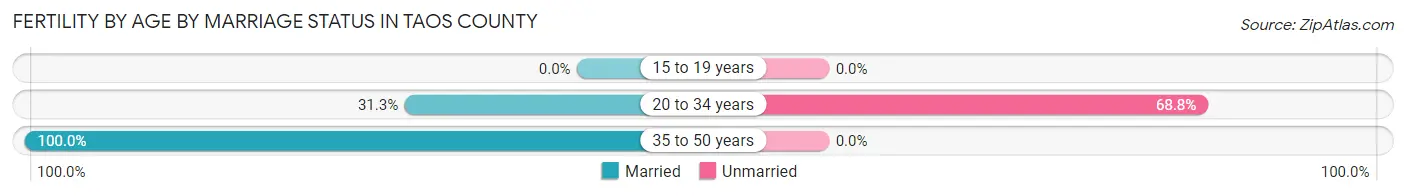
| Age Bracket | Married | Unmarried |
| 15 to 19 years | 0 (0.0%) | 0 (0.0%) |
| 20 to 34 years | 10 (31.2%) | 22 (68.8%) |
| 35 to 50 years | 4 (100.0%) | 0 (0.0%) |
| Total | 14 (38.9%) | 22 (61.1%) |
Fertility by Education in Taos County
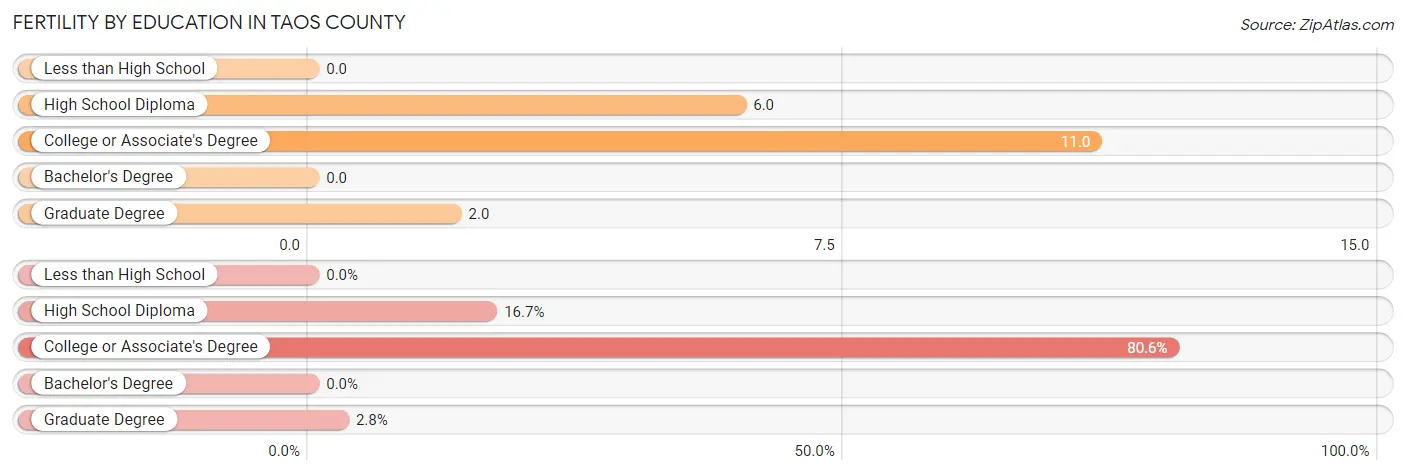
| Educational Attainment | Women with Births | Births / 1,000 Women |
| Less than High School | 0 (0.0%) | 0.0 |
| High School Diploma | 6 (16.7%) | 6.0 |
| College or Associate's Degree | 29 (80.6%) | 11.0 |
| Bachelor's Degree | 0 (0.0%) | 0.0 |
| Graduate Degree | 1 (2.8%) | 2.0 |
| Total | 36 (100.0%) | 6.0 |
Fertility by Education by Marriage Status in Taos County
61.1% of women with births in Taos County are unmarried. Women with the educational attainment of high school diploma are most likely to be married with 100.0% of them married at childbirth, while women with the educational attainment of graduate degree are least likely to be married with 100.0% of them unmarried at childbirth.
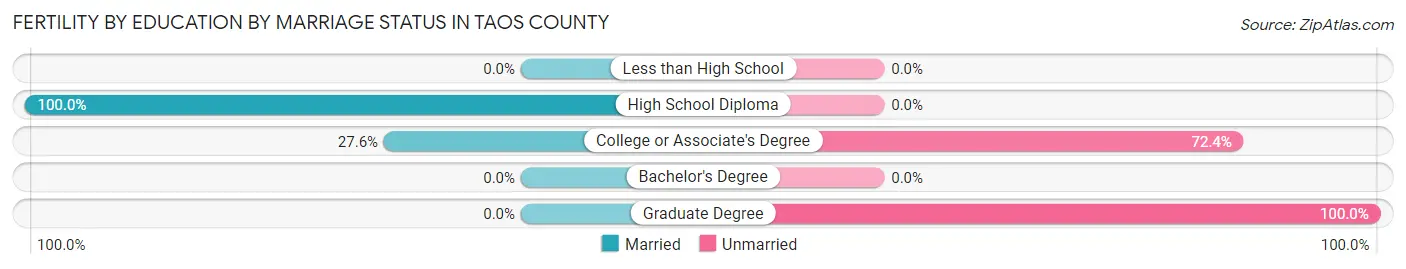
| Educational Attainment | Married | Unmarried |
| Less than High School | 0 (0.0%) | 0 (0.0%) |
| High School Diploma | 6 (100.0%) | 0 (0.0%) |
| College or Associate's Degree | 8 (27.6%) | 21 (72.4%) |
| Bachelor's Degree | 0 (0.0%) | 0 (0.0%) |
| Graduate Degree | 0 (0.0%) | 1 (100.0%) |
| Total | 14 (38.9%) | 22 (61.1%) |
Employment Characteristics in Taos County
Employment by Class of Employer in Taos County
Among the 13,876 employed individuals in Taos County, private company employees (6,959 | 50.1%), self-employed (not incorporated) (1,686 | 12.1%), and not-for-profit organizations (1,599 | 11.5%) make up the most common classes of employment.
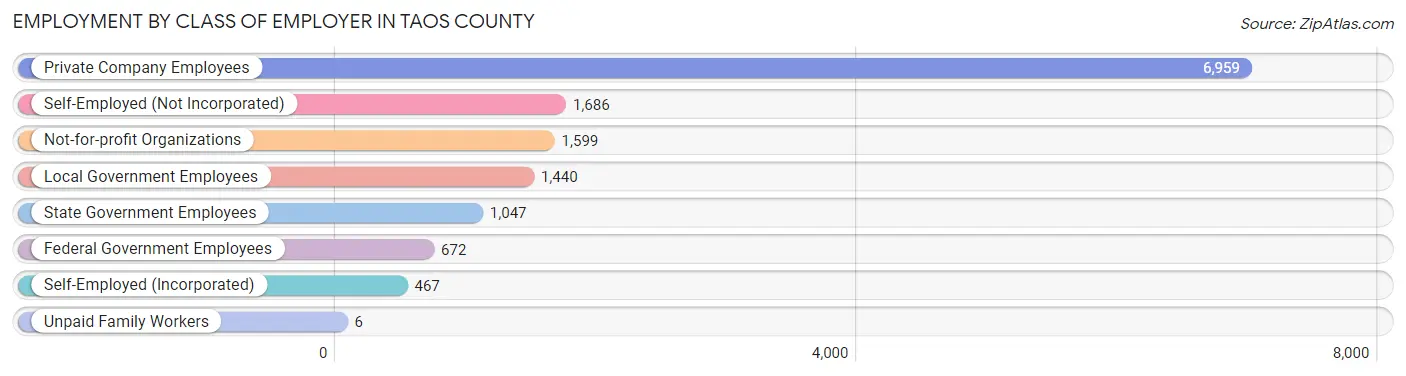
| Employer Class | # Employees | % Employees |
| Private Company Employees | 6,959 | 50.1% |
| Self-Employed (Incorporated) | 467 | 3.4% |
| Self-Employed (Not Incorporated) | 1,686 | 12.1% |
| Not-for-profit Organizations | 1,599 | 11.5% |
| Local Government Employees | 1,440 | 10.4% |
| State Government Employees | 1,047 | 7.5% |
| Federal Government Employees | 672 | 4.8% |
| Unpaid Family Workers | 6 | 0.0% |
| Total | 13,876 | 100.0% |
Employment Status by Age in Taos County
According to the labor force statistics for Taos County, out of the total population over 16 years of age (29,428), 50.9% or 14,979 individuals are in the labor force, with 5.9% or 884 of them unemployed. The age group with the highest labor force participation rate is 35 to 44 years, with 81.6% or 3,315 individuals in the labor force. Within the labor force, the 25 to 29 years age range has the highest percentage of unemployed individuals, with 20.6% or 280 of them being unemployed.
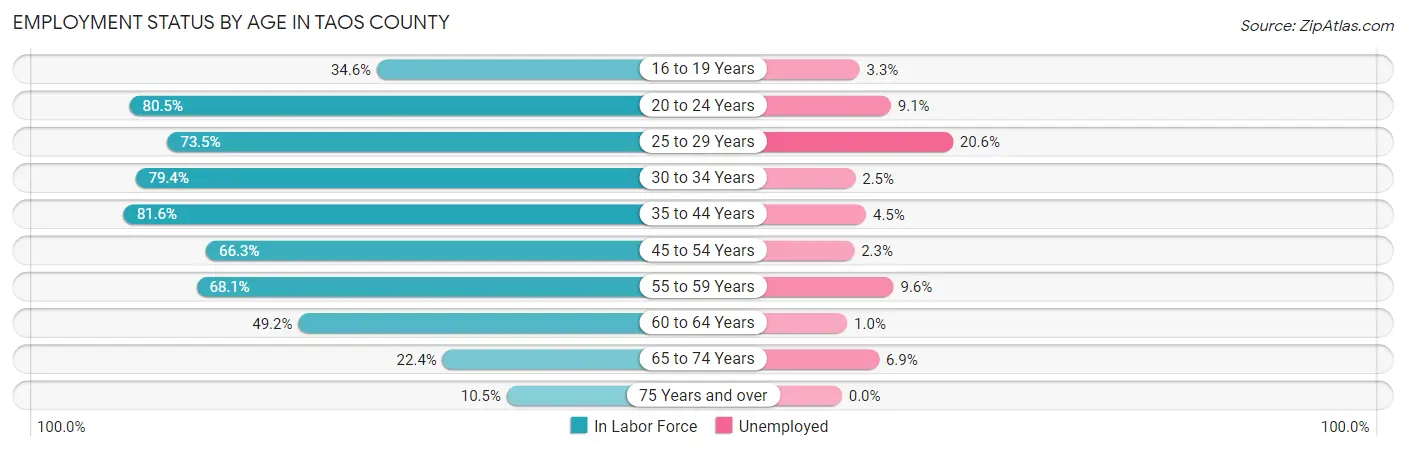
| Age Bracket | In Labor Force | Unemployed |
| 16 to 19 Years | 553 (34.6%) | 18 (3.3%) |
| 20 to 24 Years | 1,101 (80.5%) | 100 (9.1%) |
| 25 to 29 Years | 1,360 (73.5%) | 280 (20.6%) |
| 30 to 34 Years | 1,197 (79.4%) | 30 (2.5%) |
| 35 to 44 Years | 3,315 (81.6%) | 149 (4.5%) |
| 45 to 54 Years | 2,679 (66.3%) | 62 (2.3%) |
| 55 to 59 Years | 1,443 (68.1%) | 139 (9.6%) |
| 60 to 64 Years | 1,626 (49.2%) | 16 (1.0%) |
| 65 to 74 Years | 1,310 (22.4%) | 90 (6.9%) |
| 75 Years and over | 391 (10.5%) | 0 (0.0%) |
| Total | 14,979 (50.9%) | 884 (5.9%) |
Employment Status by Educational Attainment in Taos County
According to labor force statistics for Taos County, 68.8% of individuals (11,616) out of the total population between 25 and 64 years of age (16,884) are in the labor force, with 5.8% or 674 of them being unemployed. The group with the highest labor force participation rate are those with the educational attainment of bachelor's degree or higher, with 72.8% or 3,855 individuals in the labor force. Within the labor force, individuals with less than high school education have the highest percentage of unemployment, with 29.6% or 216 of them being unemployed.
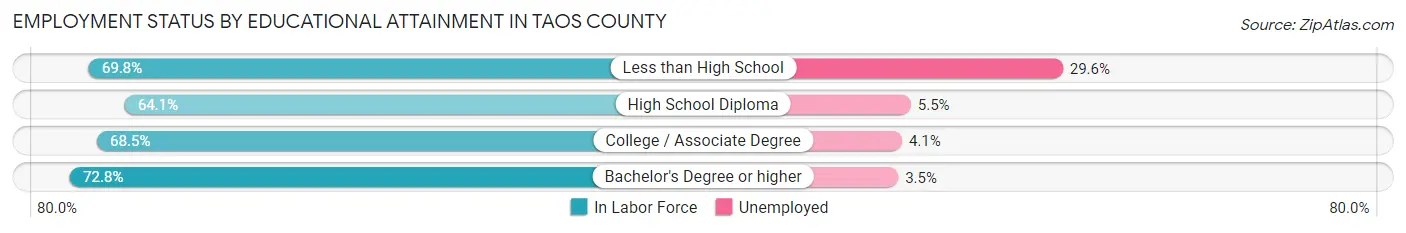
| Educational Attainment | In Labor Force | Unemployed |
| Less than High School | 730 (69.8%) | 310 (29.6%) |
| High School Diploma | 2,743 (64.1%) | 235 (5.5%) |
| College / Associate Degree | 4,289 (68.5%) | 257 (4.1%) |
| Bachelor's Degree or higher | 3,855 (72.8%) | 185 (3.5%) |
| Total | 11,616 (68.8%) | 979 (5.8%) |
Employment Occupations by Sex in Taos County
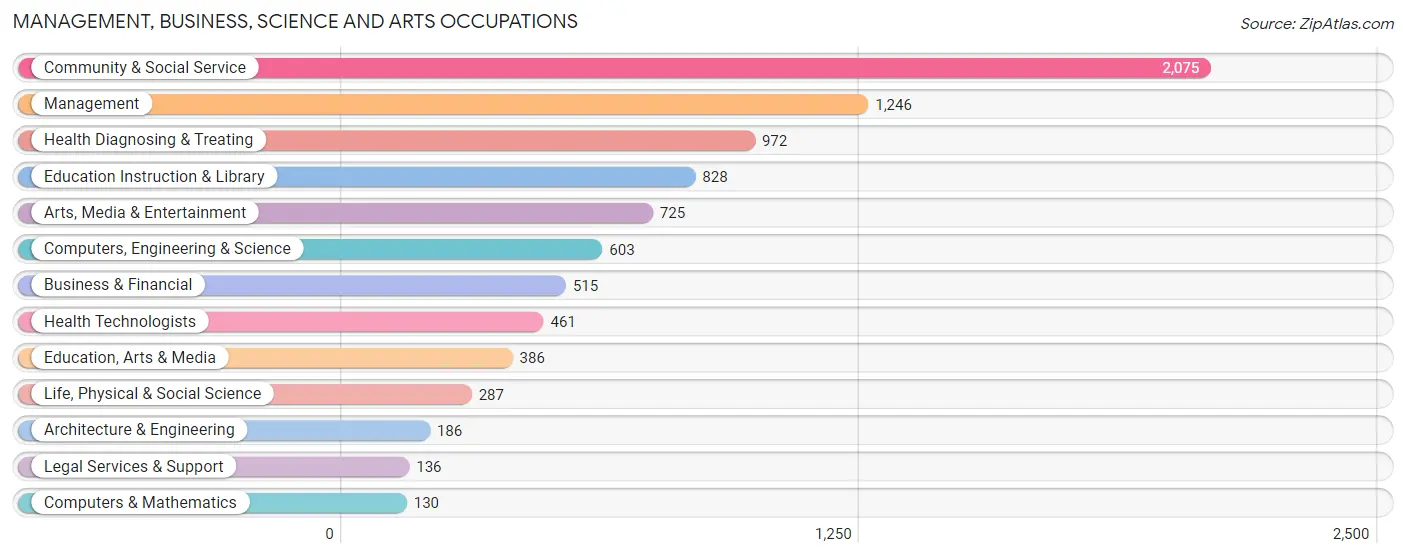
Management, Business, Science and Arts Occupations
The most common Management, Business, Science and Arts occupations in Taos County are Community & Social Service (2,075 | 14.7%), Management (1,246 | 8.8%), Health Diagnosing & Treating (972 | 6.9%), Education Instruction & Library (828 | 5.9%), and Arts, Media & Entertainment (725 | 5.1%).
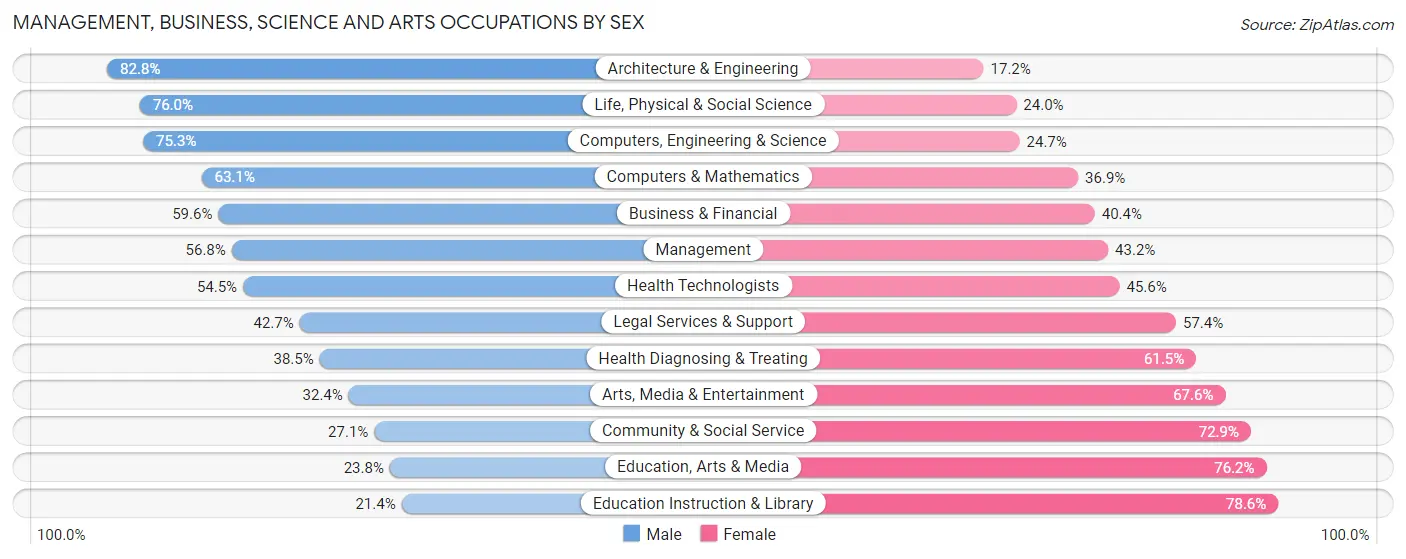
Management, Business, Science and Arts Occupations by Sex
Within the Management, Business, Science and Arts occupations in Taos County, the most male-oriented occupations are Architecture & Engineering (82.8%), Life, Physical & Social Science (76.0%), and Computers, Engineering & Science (75.3%), while the most female-oriented occupations are Education Instruction & Library (78.6%), Education, Arts & Media (76.2%), and Community & Social Service (72.9%).
| Occupation | Male | Female |
| Management | 708 (56.8%) | 538 (43.2%) |
| Business & Financial | 307 (59.6%) | 208 (40.4%) |
| Computers, Engineering & Science | 454 (75.3%) | 149 (24.7%) |
| Computers & Mathematics | 82 (63.1%) | 48 (36.9%) |
| Architecture & Engineering | 154 (82.8%) | 32 (17.2%) |
| Life, Physical & Social Science | 218 (76.0%) | 69 (24.0%) |
| Community & Social Service | 562 (27.1%) | 1,513 (72.9%) |
| Education, Arts & Media | 92 (23.8%) | 294 (76.2%) |
| Legal Services & Support | 58 (42.6%) | 78 (57.4%) |
| Education Instruction & Library | 177 (21.4%) | 651 (78.6%) |
| Arts, Media & Entertainment | 235 (32.4%) | 490 (67.6%) |
| Health Diagnosing & Treating | 374 (38.5%) | 598 (61.5%) |
| Health Technologists | 251 (54.4%) | 210 (45.6%) |
| Total (Category) | 2,405 (44.5%) | 3,006 (55.5%) |
| Total (Overall) | 7,360 (52.3%) | 6,723 (47.7%) |
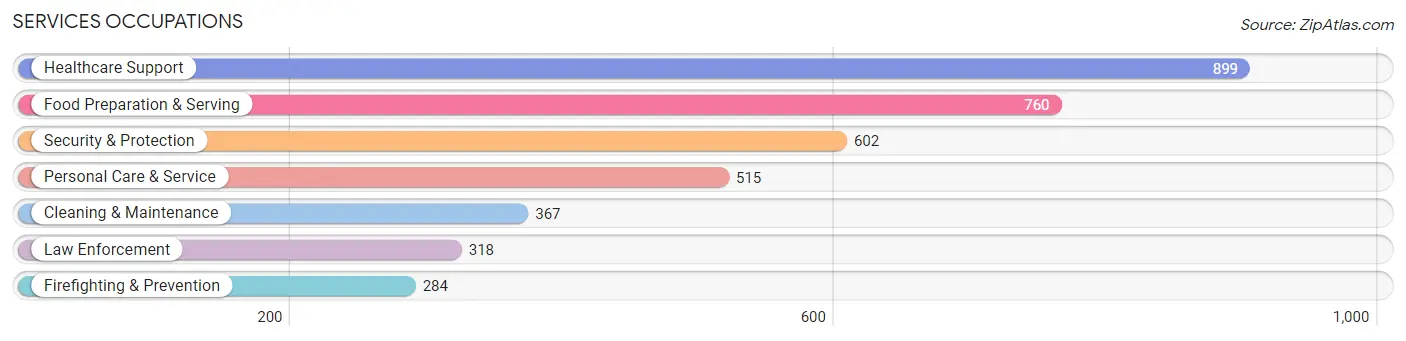
Services Occupations
The most common Services occupations in Taos County are Healthcare Support (899 | 6.4%), Food Preparation & Serving (760 | 5.4%), Security & Protection (602 | 4.3%), Personal Care & Service (515 | 3.7%), and Cleaning & Maintenance (367 | 2.6%).
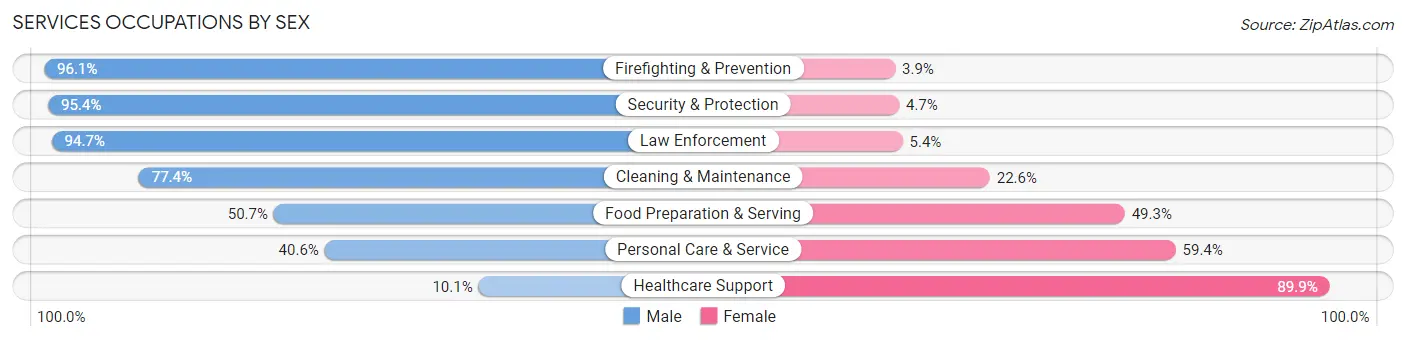
Services Occupations by Sex
Within the Services occupations in Taos County, the most male-oriented occupations are Firefighting & Prevention (96.1%), Security & Protection (95.4%), and Law Enforcement (94.7%), while the most female-oriented occupations are Healthcare Support (89.9%), Personal Care & Service (59.4%), and Food Preparation & Serving (49.3%).
| Occupation | Male | Female |
| Healthcare Support | 91 (10.1%) | 808 (89.9%) |
| Security & Protection | 574 (95.4%) | 28 (4.6%) |
| Firefighting & Prevention | 273 (96.1%) | 11 (3.9%) |
| Law Enforcement | 301 (94.7%) | 17 (5.3%) |
| Food Preparation & Serving | 385 (50.7%) | 375 (49.3%) |
| Cleaning & Maintenance | 284 (77.4%) | 83 (22.6%) |
| Personal Care & Service | 209 (40.6%) | 306 (59.4%) |
| Total (Category) | 1,543 (49.1%) | 1,600 (50.9%) |
| Total (Overall) | 7,360 (52.3%) | 6,723 (47.7%) |
Sales and Office Occupations
The most common Sales and Office occupations in Taos County are Office & Administration (1,578 | 11.2%), and Sales & Related (1,038 | 7.4%).

Sales and Office Occupations by Sex

| Occupation | Male | Female |
| Sales & Related | 467 (45.0%) | 571 (55.0%) |
| Office & Administration | 278 (17.6%) | 1,300 (82.4%) |
| Total (Category) | 745 (28.5%) | 1,871 (71.5%) |
| Total (Overall) | 7,360 (52.3%) | 6,723 (47.7%) |
Natural Resources, Construction and Maintenance Occupations
The most common Natural Resources, Construction and Maintenance occupations in Taos County are Construction & Extraction (1,782 | 12.7%), Installation, Maintenance & Repair (247 | 1.8%), and Farming, Fishing & Forestry (68 | 0.5%).
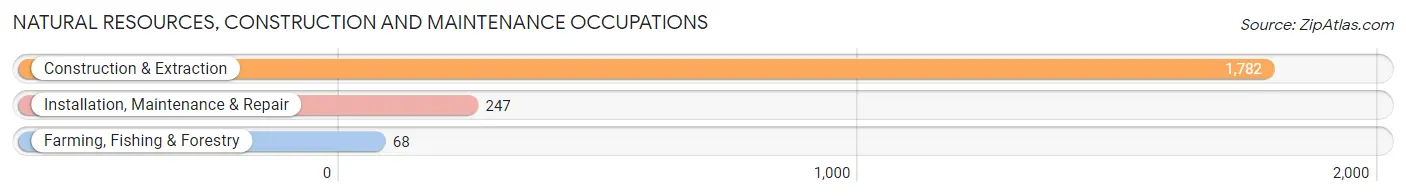
Natural Resources, Construction and Maintenance Occupations by Sex
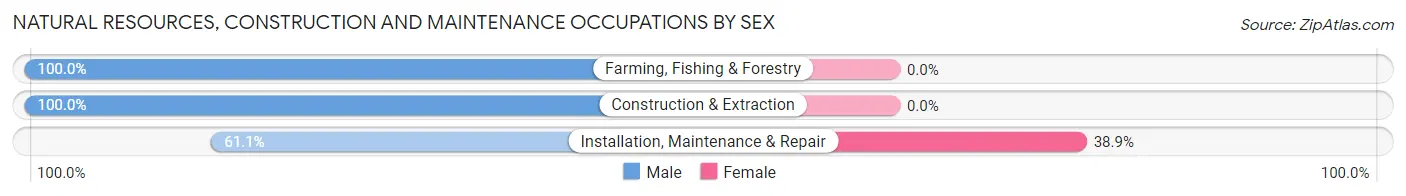
| Occupation | Male | Female |
| Farming, Fishing & Forestry | 68 (100.0%) | 0 (0.0%) |
| Construction & Extraction | 1,782 (100.0%) | 0 (0.0%) |
| Installation, Maintenance & Repair | 151 (61.1%) | 96 (38.9%) |
| Total (Category) | 2,001 (95.4%) | 96 (4.6%) |
| Total (Overall) | 7,360 (52.3%) | 6,723 (47.7%) |
Production, Transportation and Moving Occupations
The most common Production, Transportation and Moving occupations in Taos County are Production (336 | 2.4%), Material Moving (264 | 1.9%), and Transportation (216 | 1.5%).
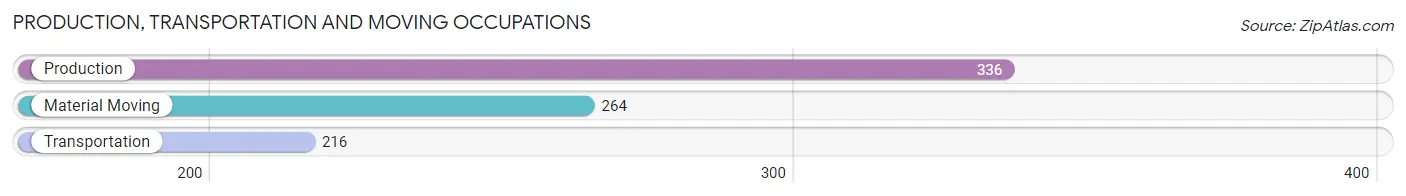
Production, Transportation and Moving Occupations by Sex
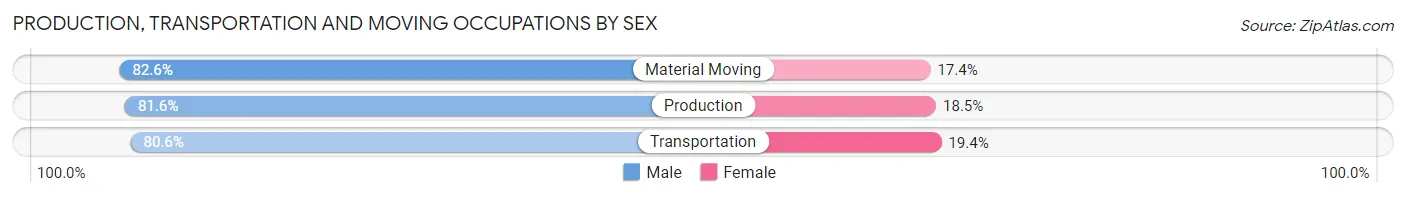
| Occupation | Male | Female |
| Production | 274 (81.6%) | 62 (18.4%) |
| Transportation | 174 (80.6%) | 42 (19.4%) |
| Material Moving | 218 (82.6%) | 46 (17.4%) |
| Total (Category) | 666 (81.6%) | 150 (18.4%) |
| Total (Overall) | 7,360 (52.3%) | 6,723 (47.7%) |
Employment Industries by Sex in Taos County
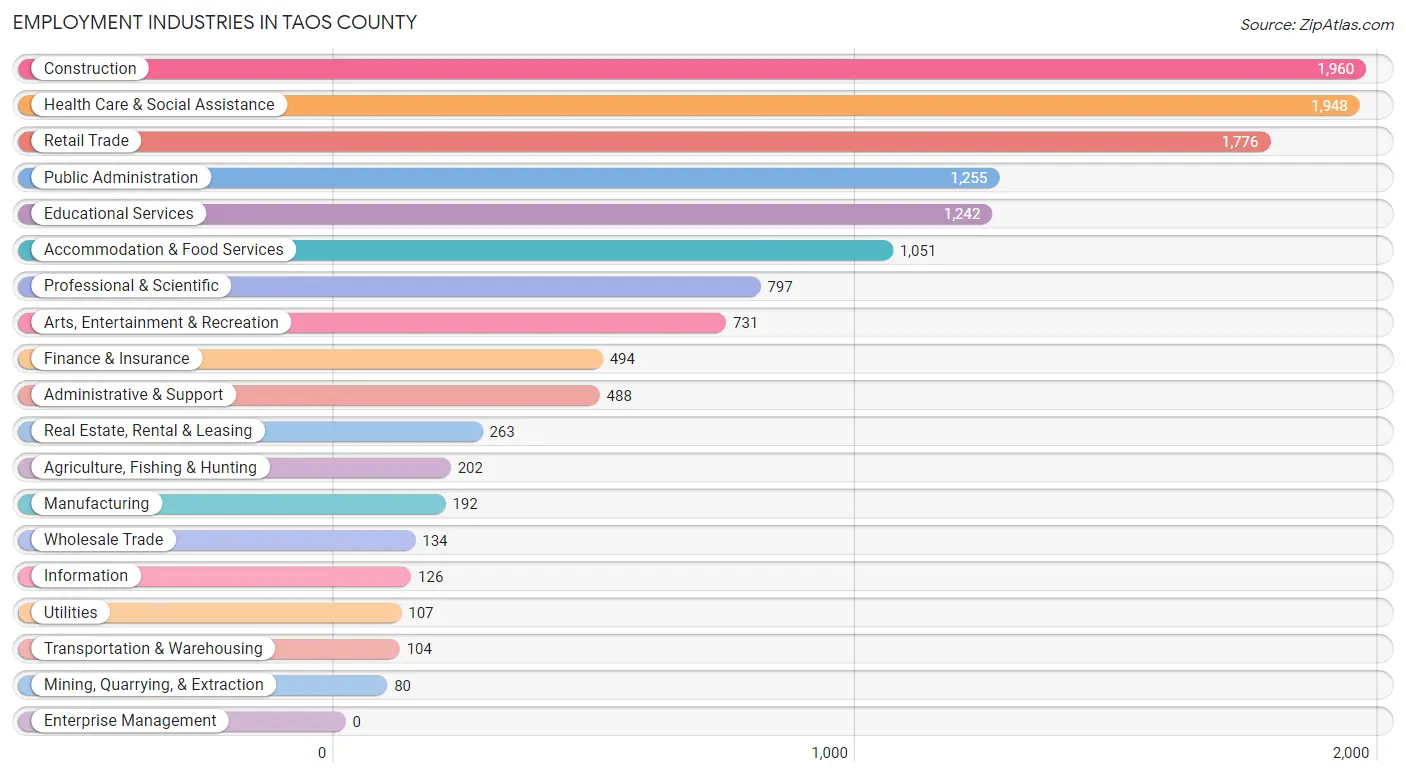
Employment Industries in Taos County
The major employment industries in Taos County include Construction (1,960 | 13.9%), Health Care & Social Assistance (1,948 | 13.8%), Retail Trade (1,776 | 12.6%), Public Administration (1,255 | 8.9%), and Educational Services (1,242 | 8.8%).
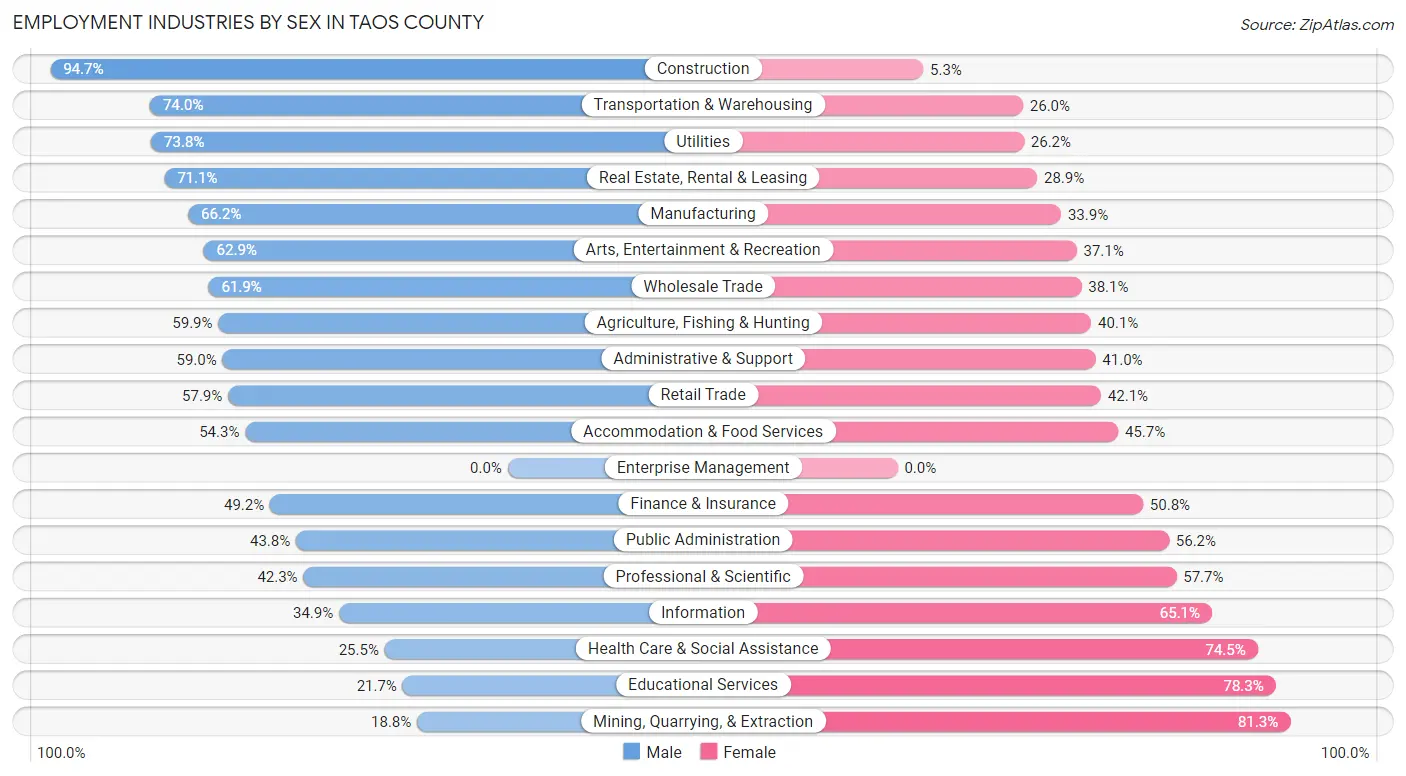
Employment Industries by Sex in Taos County
The Taos County industries that see more men than women are Construction (94.7%), Transportation & Warehousing (74.0%), and Utilities (73.8%), whereas the industries that tend to have a higher number of women are Mining, Quarrying, & Extraction (81.2%), Educational Services (78.3%), and Health Care & Social Assistance (74.5%).
| Industry | Male | Female |
| Agriculture, Fishing & Hunting | 121 (59.9%) | 81 (40.1%) |
| Mining, Quarrying, & Extraction | 15 (18.8%) | 65 (81.2%) |
| Construction | 1,856 (94.7%) | 104 (5.3%) |
| Manufacturing | 127 (66.1%) | 65 (33.9%) |
| Wholesale Trade | 83 (61.9%) | 51 (38.1%) |
| Retail Trade | 1,028 (57.9%) | 748 (42.1%) |
| Transportation & Warehousing | 77 (74.0%) | 27 (26.0%) |
| Utilities | 79 (73.8%) | 28 (26.2%) |
| Information | 44 (34.9%) | 82 (65.1%) |
| Finance & Insurance | 243 (49.2%) | 251 (50.8%) |
| Real Estate, Rental & Leasing | 187 (71.1%) | 76 (28.9%) |
| Professional & Scientific | 337 (42.3%) | 460 (57.7%) |
| Enterprise Management | 0 (0.0%) | 0 (0.0%) |
| Administrative & Support | 288 (59.0%) | 200 (41.0%) |
| Educational Services | 270 (21.7%) | 972 (78.3%) |
| Health Care & Social Assistance | 496 (25.5%) | 1,452 (74.5%) |
| Arts, Entertainment & Recreation | 460 (62.9%) | 271 (37.1%) |
| Accommodation & Food Services | 571 (54.3%) | 480 (45.7%) |
| Public Administration | 550 (43.8%) | 705 (56.2%) |
| Total | 7,360 (52.3%) | 6,723 (47.7%) |
Education in Taos County
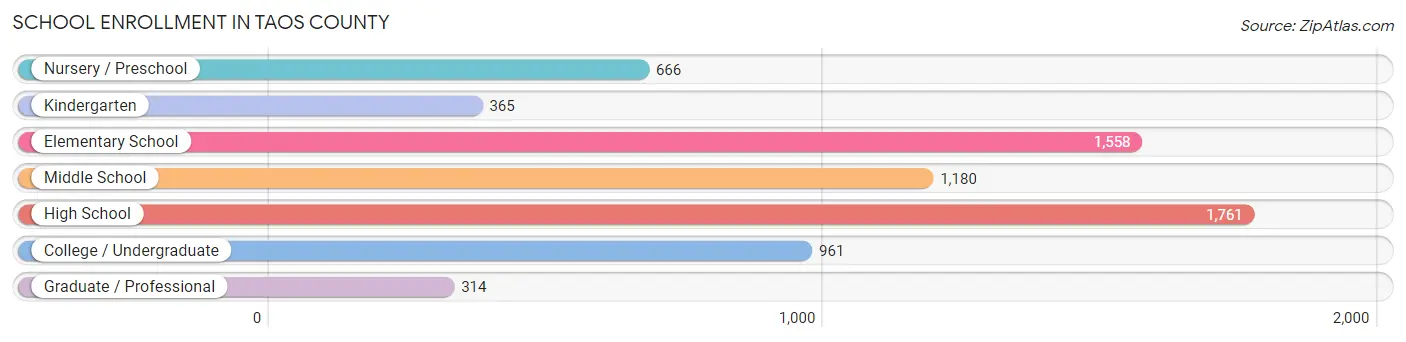
School Enrollment in Taos County
The most common levels of schooling among the 6,805 students in Taos County are high school (1,761 | 25.9%), elementary school (1,558 | 22.9%), and middle school (1,180 | 17.3%).
| School Level | # Students | % Students |
| Nursery / Preschool | 666 | 9.8% |
| Kindergarten | 365 | 5.4% |
| Elementary School | 1,558 | 22.9% |
| Middle School | 1,180 | 17.3% |
| High School | 1,761 | 25.9% |
| College / Undergraduate | 961 | 14.1% |
| Graduate / Professional | 314 | 4.6% |
| Total | 6,805 | 100.0% |
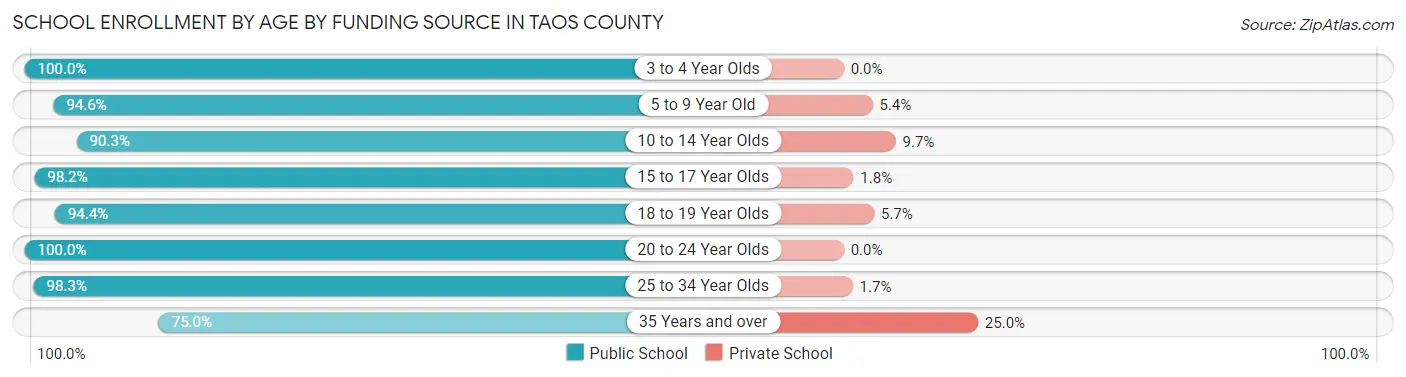
School Enrollment by Age by Funding Source in Taos County
Out of a total of 6,805 students who are enrolled in schools in Taos County, 470 (6.9%) attend a private institution, while the remaining 6,335 (93.1%) are enrolled in public schools. The age group of 35 years and over has the highest likelihood of being enrolled in private schools, with 160 (25.0% in the age bracket) enrolled. Conversely, the age group of 3 to 4 year olds has the lowest likelihood of being enrolled in a private school, with 561 (100.0% in the age bracket) attending a public institution.
| Age Bracket | Public School | Private School |
| 3 to 4 Year Olds | 561 (100.0%) | 0 (0.0%) |
| 5 to 9 Year Old | 1,672 (94.6%) | 95 (5.4%) |
| 10 to 14 Year Olds | 1,532 (90.3%) | 164 (9.7%) |
| 15 to 17 Year Olds | 1,083 (98.2%) | 20 (1.8%) |
| 18 to 19 Year Olds | 468 (94.4%) | 28 (5.7%) |
| 20 to 24 Year Olds | 362 (100.0%) | 0 (0.0%) |
| 25 to 34 Year Olds | 177 (98.3%) | 3 (1.7%) |
| 35 Years and over | 480 (75.0%) | 160 (25.0%) |
| Total | 6,335 (93.1%) | 470 (6.9%) |
Educational Attainment by Field of Study in Taos County
Education (2,012 | 19.6%), liberal arts & history (1,187 | 11.5%), business (1,057 | 10.3%), social sciences (939 | 9.1%), and visual & performing arts (926 | 9.0%) are the most common fields of study among 10,292 individuals in Taos County who have obtained a bachelor's degree or higher.
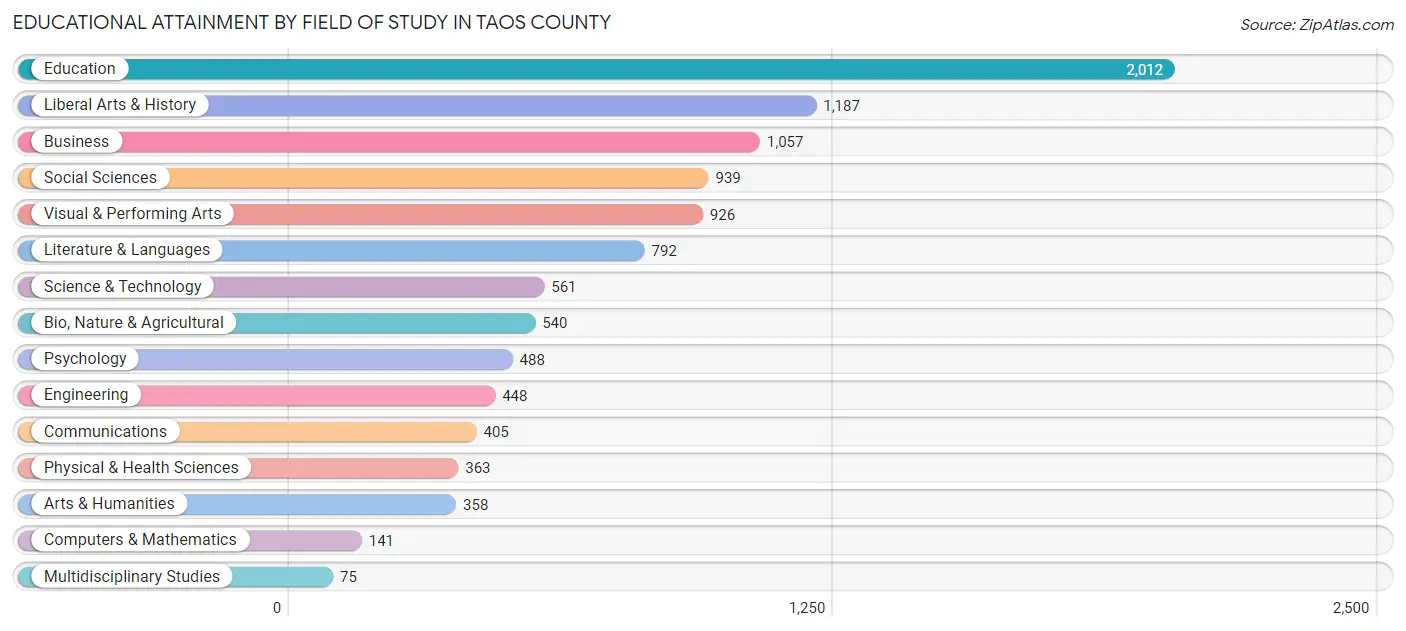
| Field of Study | # Graduates | % Graduates |
| Computers & Mathematics | 141 | 1.4% |
| Bio, Nature & Agricultural | 540 | 5.2% |
| Physical & Health Sciences | 363 | 3.5% |
| Psychology | 488 | 4.7% |
| Social Sciences | 939 | 9.1% |
| Engineering | 448 | 4.3% |
| Multidisciplinary Studies | 75 | 0.7% |
| Science & Technology | 561 | 5.4% |
| Business | 1,057 | 10.3% |
| Education | 2,012 | 19.6% |
| Literature & Languages | 792 | 7.7% |
| Liberal Arts & History | 1,187 | 11.5% |
| Visual & Performing Arts | 926 | 9.0% |
| Communications | 405 | 3.9% |
| Arts & Humanities | 358 | 3.5% |
| Total | 10,292 | 100.0% |
Transportation & Commute in Taos County
Vehicle Availability by Sex in Taos County
The most prevalent vehicle ownership categories in Taos County are males with 2 vehicles (2,610, accounting for 36.4%) and females with 2 vehicles (2,147, making up 39.6%).
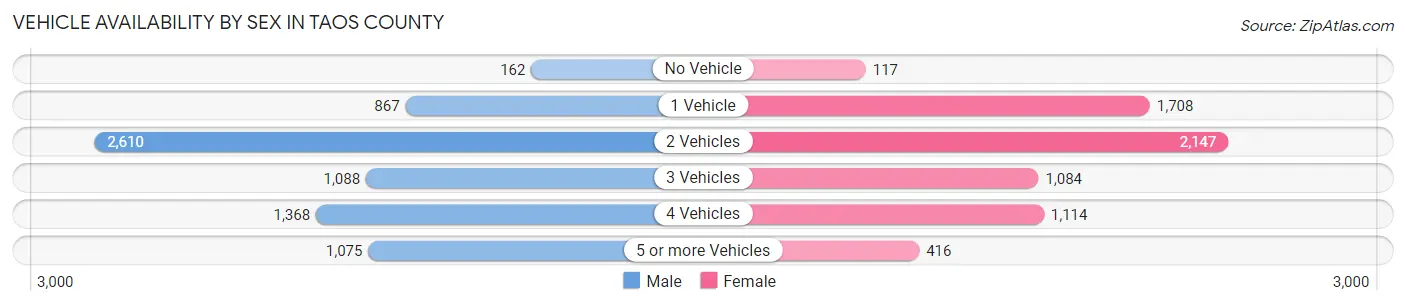
| Vehicles Available | Male | Female |
| No Vehicle | 162 (2.3%) | 117 (1.8%) |
| 1 Vehicle | 867 (12.1%) | 1,708 (25.9%) |
| 2 Vehicles | 2,610 (36.4%) | 2,147 (32.6%) |
| 3 Vehicles | 1,088 (15.2%) | 1,084 (16.5%) |
| 4 Vehicles | 1,368 (19.1%) | 1,114 (16.9%) |
| 5 or more Vehicles | 1,075 (15.0%) | 416 (6.3%) |
| Total | 7,170 (100.0%) | 6,586 (100.0%) |
Commute Time in Taos County
The most frequently occuring commute durations in Taos County are 10 to 14 minutes (2,288 commuters, 19.4%), 15 to 19 minutes (2,081 commuters, 17.6%), and 5 to 9 minutes (1,690 commuters, 14.3%).
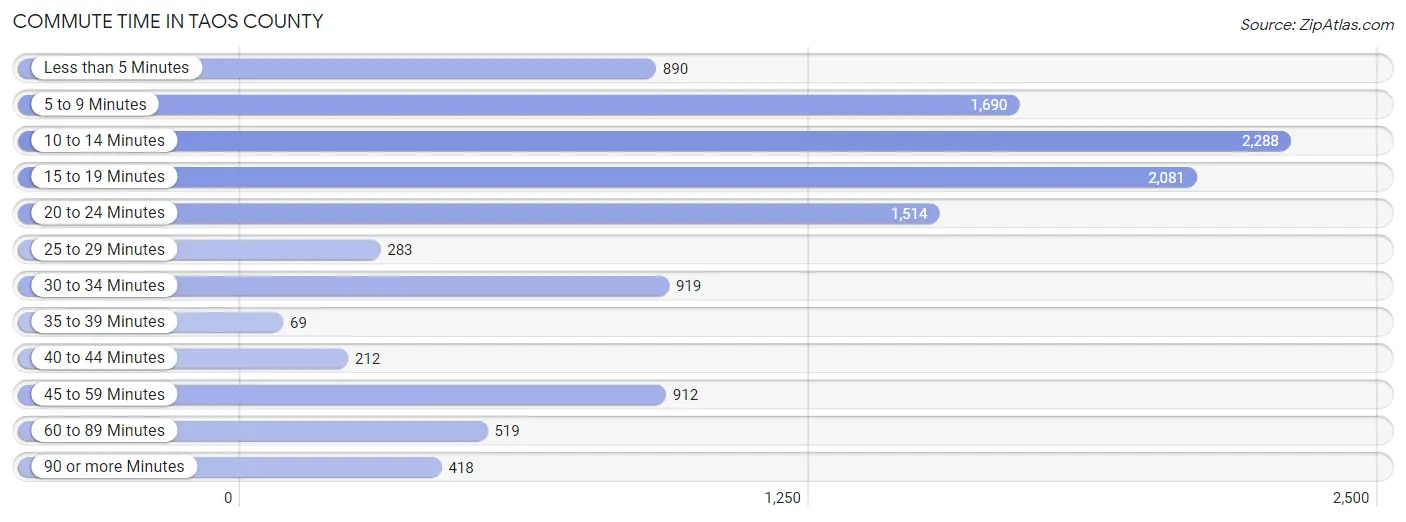
| Commute Time | # Commuters | % Commuters |
| Less than 5 Minutes | 890 | 7.5% |
| 5 to 9 Minutes | 1,690 | 14.3% |
| 10 to 14 Minutes | 2,288 | 19.4% |
| 15 to 19 Minutes | 2,081 | 17.6% |
| 20 to 24 Minutes | 1,514 | 12.8% |
| 25 to 29 Minutes | 283 | 2.4% |
| 30 to 34 Minutes | 919 | 7.8% |
| 35 to 39 Minutes | 69 | 0.6% |
| 40 to 44 Minutes | 212 | 1.8% |
| 45 to 59 Minutes | 912 | 7.7% |
| 60 to 89 Minutes | 519 | 4.4% |
| 90 or more Minutes | 418 | 3.5% |
Commute Time by Sex in Taos County
The most common commute times in Taos County are 15 to 19 minutes (1,221 commuters, 19.7%) for males and 10 to 14 minutes (1,238 commuters, 22.1%) for females.
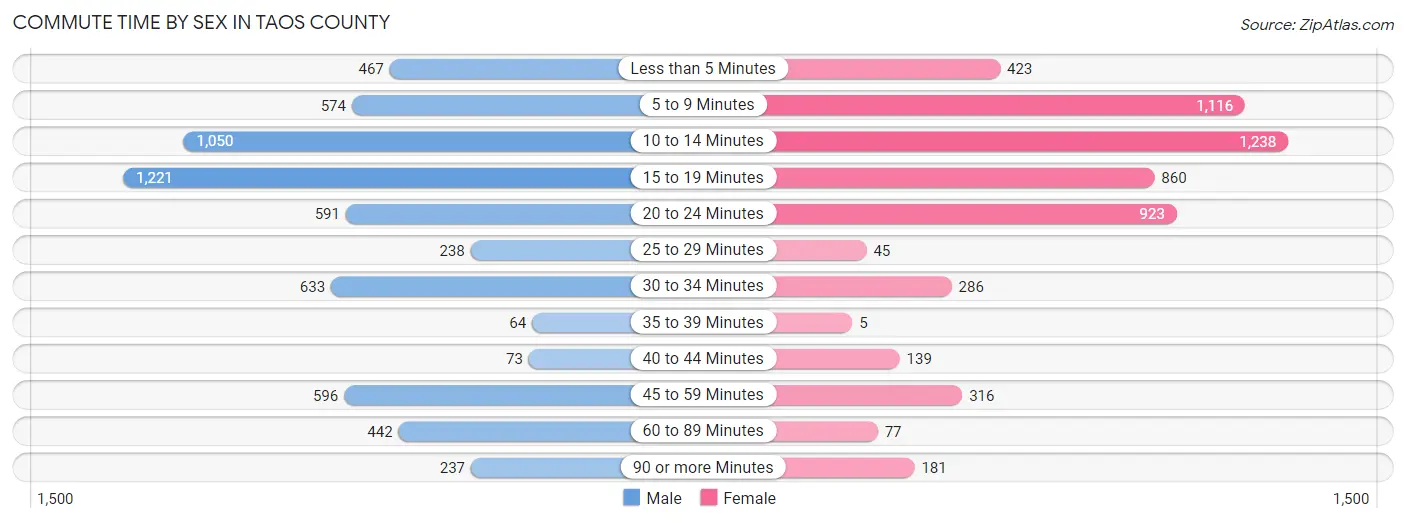
| Commute Time | Male | Female |
| Less than 5 Minutes | 467 (7.5%) | 423 (7.5%) |
| 5 to 9 Minutes | 574 (9.3%) | 1,116 (19.9%) |
| 10 to 14 Minutes | 1,050 (17.0%) | 1,238 (22.1%) |
| 15 to 19 Minutes | 1,221 (19.7%) | 860 (15.3%) |
| 20 to 24 Minutes | 591 (9.6%) | 923 (16.5%) |
| 25 to 29 Minutes | 238 (3.8%) | 45 (0.8%) |
| 30 to 34 Minutes | 633 (10.2%) | 286 (5.1%) |
| 35 to 39 Minutes | 64 (1.0%) | 5 (0.1%) |
| 40 to 44 Minutes | 73 (1.2%) | 139 (2.5%) |
| 45 to 59 Minutes | 596 (9.6%) | 316 (5.6%) |
| 60 to 89 Minutes | 442 (7.1%) | 77 (1.4%) |
| 90 or more Minutes | 237 (3.8%) | 181 (3.2%) |
Time of Departure to Work by Sex in Taos County
The most frequent times of departure to work in Taos County are 8:00 AM to 8:29 AM (1,342, 21.7%) for males and 7:30 AM to 7:59 AM (1,319, 23.5%) for females.
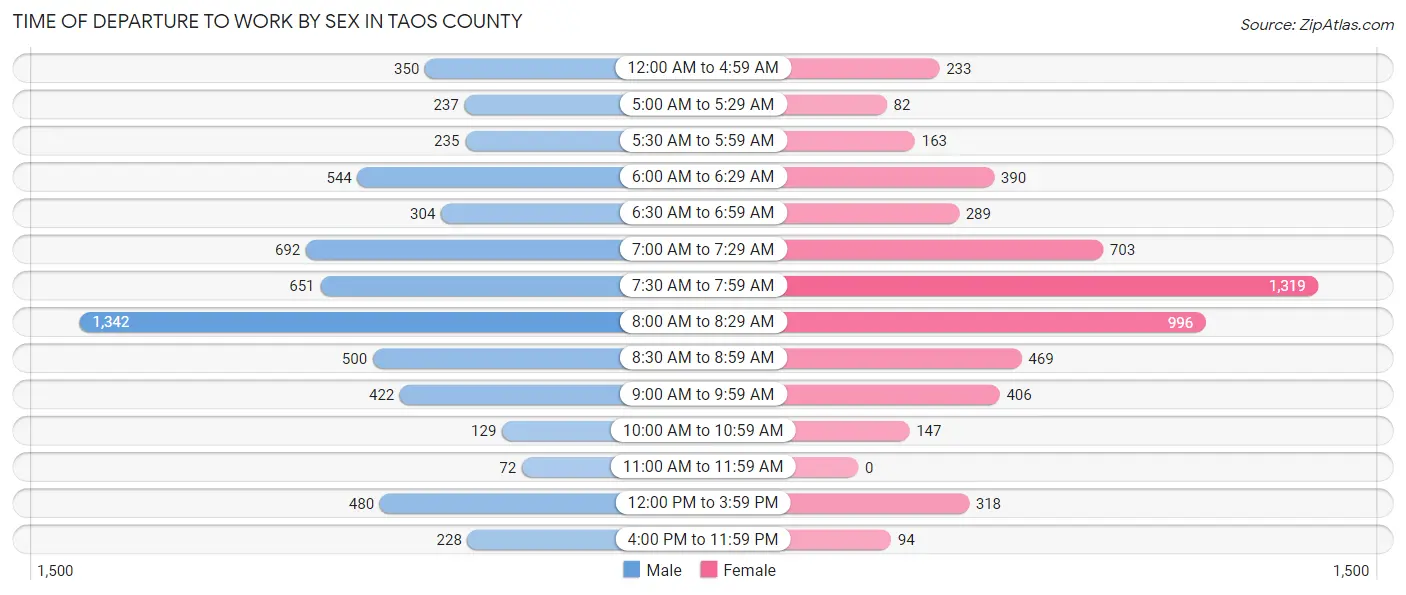
| Time of Departure | Male | Female |
| 12:00 AM to 4:59 AM | 350 (5.7%) | 233 (4.2%) |
| 5:00 AM to 5:29 AM | 237 (3.8%) | 82 (1.5%) |
| 5:30 AM to 5:59 AM | 235 (3.8%) | 163 (2.9%) |
| 6:00 AM to 6:29 AM | 544 (8.8%) | 390 (7.0%) |
| 6:30 AM to 6:59 AM | 304 (4.9%) | 289 (5.1%) |
| 7:00 AM to 7:29 AM | 692 (11.2%) | 703 (12.5%) |
| 7:30 AM to 7:59 AM | 651 (10.5%) | 1,319 (23.5%) |
| 8:00 AM to 8:29 AM | 1,342 (21.7%) | 996 (17.8%) |
| 8:30 AM to 8:59 AM | 500 (8.1%) | 469 (8.4%) |
| 9:00 AM to 9:59 AM | 422 (6.8%) | 406 (7.2%) |
| 10:00 AM to 10:59 AM | 129 (2.1%) | 147 (2.6%) |
| 11:00 AM to 11:59 AM | 72 (1.2%) | 0 (0.0%) |
| 12:00 PM to 3:59 PM | 480 (7.8%) | 318 (5.7%) |
| 4:00 PM to 11:59 PM | 228 (3.7%) | 94 (1.7%) |
| Total | 6,186 (100.0%) | 5,609 (100.0%) |
Housing Occupancy in Taos County
Occupancy by Ownership in Taos County
Of the total 13,736 dwellings in Taos County, owner-occupied units account for 11,060 (80.5%), while renter-occupied units make up 2,676 (19.5%).
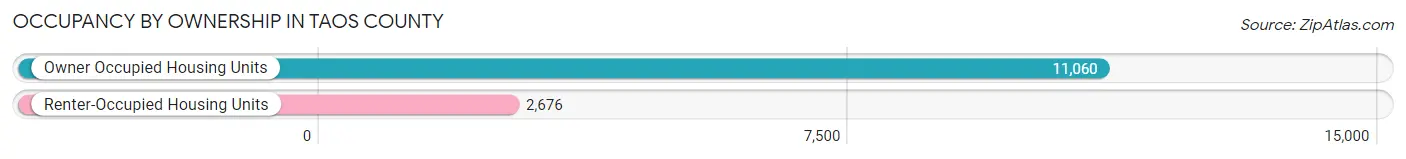
| Occupancy | # Housing Units | % Housing Units |
| Owner Occupied Housing Units | 11,060 | 80.5% |
| Renter-Occupied Housing Units | 2,676 | 19.5% |
| Total Occupied Housing Units | 13,736 | 100.0% |
Occupancy by Household Size in Taos County
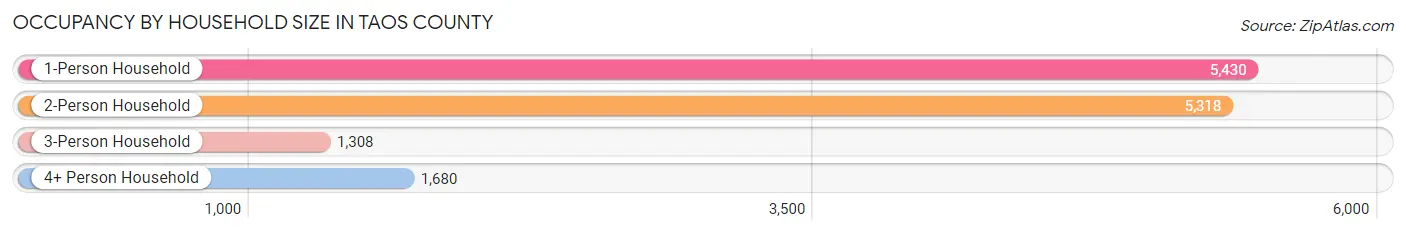
| Household Size | # Housing Units | % Housing Units |
| 1-Person Household | 5,430 | 39.5% |
| 2-Person Household | 5,318 | 38.7% |
| 3-Person Household | 1,308 | 9.5% |
| 4+ Person Household | 1,680 | 12.2% |
| Total Housing Units | 13,736 | 100.0% |
Occupancy by Ownership by Household Size in Taos County
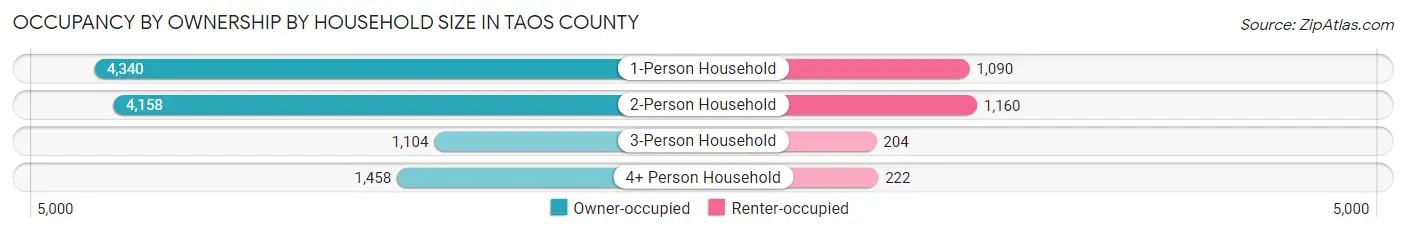
| Household Size | Owner-occupied | Renter-occupied |
| 1-Person Household | 4,340 (79.9%) | 1,090 (20.1%) |
| 2-Person Household | 4,158 (78.2%) | 1,160 (21.8%) |
| 3-Person Household | 1,104 (84.4%) | 204 (15.6%) |
| 4+ Person Household | 1,458 (86.8%) | 222 (13.2%) |
| Total Housing Units | 11,060 (80.5%) | 2,676 (19.5%) |
Occupancy by Educational Attainment in Taos County
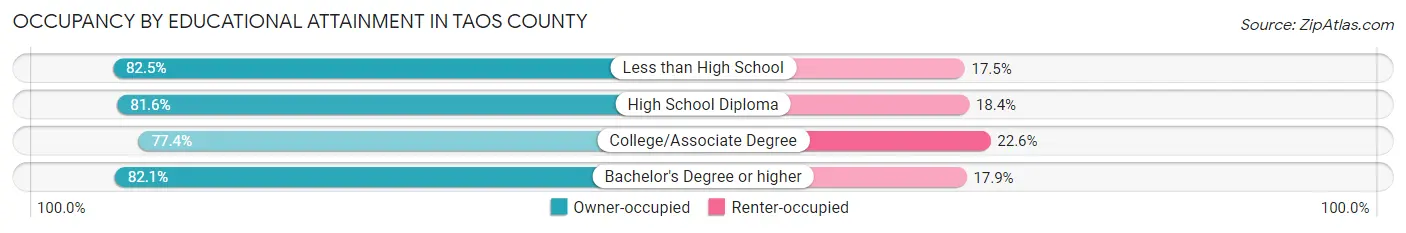
| Household Size | Owner-occupied | Renter-occupied |
| Less than High School | 560 (82.5%) | 119 (17.5%) |
| High School Diploma | 2,378 (81.6%) | 536 (18.4%) |
| College/Associate Degree | 3,352 (77.4%) | 981 (22.6%) |
| Bachelor's Degree or higher | 4,770 (82.1%) | 1,040 (17.9%) |
Occupancy by Age of Householder in Taos County
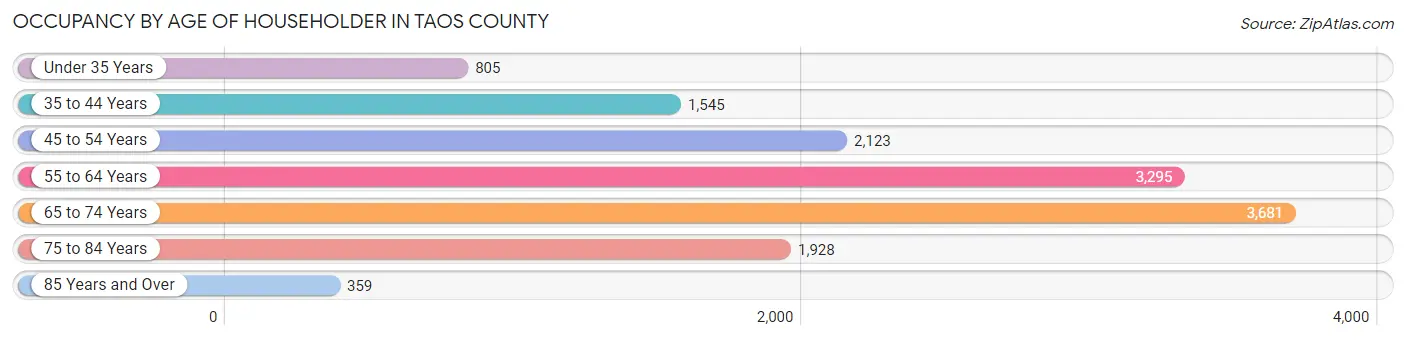
| Age Bracket | # Households | % Households |
| Under 35 Years | 805 | 5.9% |
| 35 to 44 Years | 1,545 | 11.3% |
| 45 to 54 Years | 2,123 | 15.5% |
| 55 to 64 Years | 3,295 | 24.0% |
| 65 to 74 Years | 3,681 | 26.8% |
| 75 to 84 Years | 1,928 | 14.0% |
| 85 Years and Over | 359 | 2.6% |
| Total | 13,736 | 100.0% |
Housing Finances in Taos County
Median Income by Occupancy in Taos County
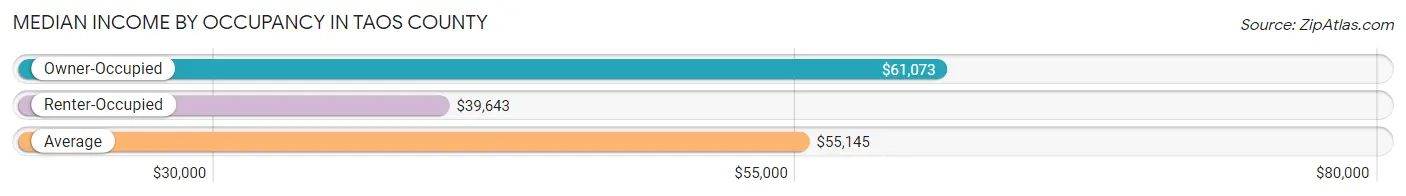
| Occupancy Type | # Households | Median Income |
| Owner-Occupied | 11,060 (80.5%) | $61,073 |
| Renter-Occupied | 2,676 (19.5%) | $39,643 |
| Average | 13,736 (100.0%) | $55,145 |
Occupancy by Householder Income Bracket in Taos County
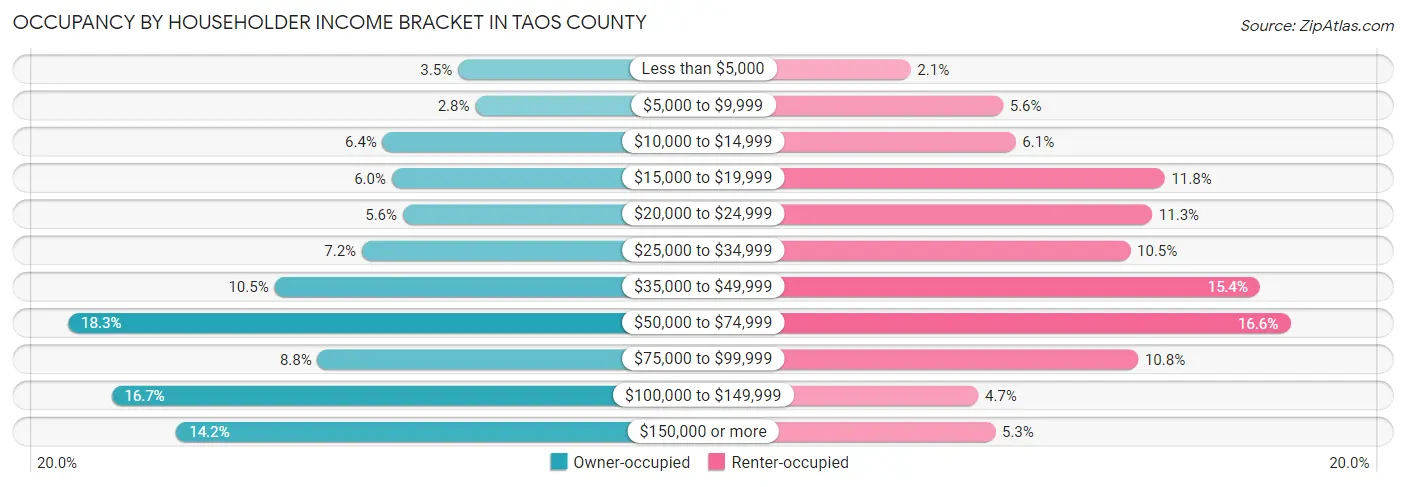
| Income Bracket | Owner-occupied | Renter-occupied |
| Less than $5,000 | 386 (3.5%) | 56 (2.1%) |
| $5,000 to $9,999 | 313 (2.8%) | 150 (5.6%) |
| $10,000 to $14,999 | 703 (6.4%) | 163 (6.1%) |
| $15,000 to $19,999 | 665 (6.0%) | 315 (11.8%) |
| $20,000 to $24,999 | 618 (5.6%) | 302 (11.3%) |
| $25,000 to $34,999 | 791 (7.1%) | 280 (10.5%) |
| $35,000 to $49,999 | 1,159 (10.5%) | 412 (15.4%) |
| $50,000 to $74,999 | 2,028 (18.3%) | 443 (16.6%) |
| $75,000 to $99,999 | 978 (8.8%) | 288 (10.8%) |
| $100,000 to $149,999 | 1,846 (16.7%) | 125 (4.7%) |
| $150,000 or more | 1,573 (14.2%) | 142 (5.3%) |
| Total | 11,060 (100.0%) | 2,676 (100.0%) |
Monthly Housing Cost Tiers in Taos County
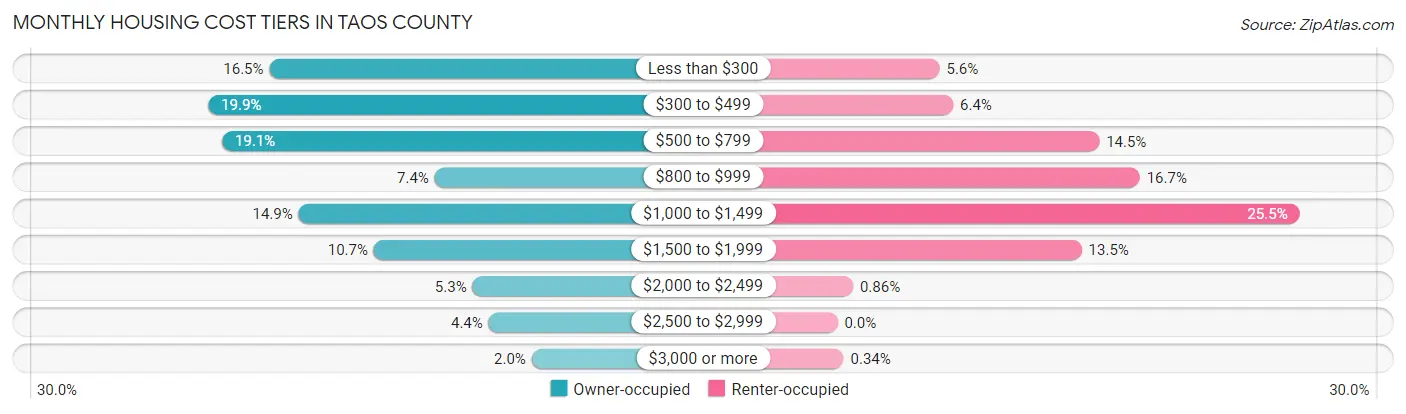
| Monthly Cost | Owner-occupied | Renter-occupied |
| Less than $300 | 1,823 (16.5%) | 151 (5.6%) |
| $300 to $499 | 2,197 (19.9%) | 171 (6.4%) |
| $500 to $799 | 2,112 (19.1%) | 387 (14.5%) |
| $800 to $999 | 813 (7.3%) | 447 (16.7%) |
| $1,000 to $1,499 | 1,645 (14.9%) | 683 (25.5%) |
| $1,500 to $1,999 | 1,185 (10.7%) | 361 (13.5%) |
| $2,000 to $2,499 | 582 (5.3%) | 23 (0.9%) |
| $2,500 to $2,999 | 483 (4.4%) | 0 (0.0%) |
| $3,000 or more | 220 (2.0%) | 9 (0.3%) |
| Total | 11,060 (100.0%) | 2,676 (100.0%) |
Physical Housing Characteristics in Taos County
Housing Structures in Taos County
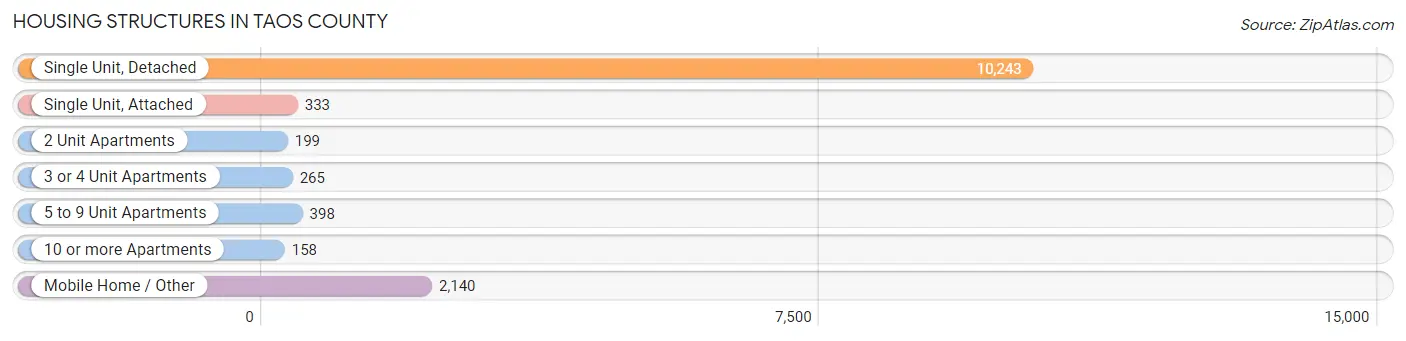
| Structure Type | # Housing Units | % Housing Units |
| Single Unit, Detached | 10,243 | 74.6% |
| Single Unit, Attached | 333 | 2.4% |
| 2 Unit Apartments | 199 | 1.5% |
| 3 or 4 Unit Apartments | 265 | 1.9% |
| 5 to 9 Unit Apartments | 398 | 2.9% |
| 10 or more Apartments | 158 | 1.1% |
| Mobile Home / Other | 2,140 | 15.6% |
| Total | 13,736 | 100.0% |
Housing Structures by Occupancy in Taos County
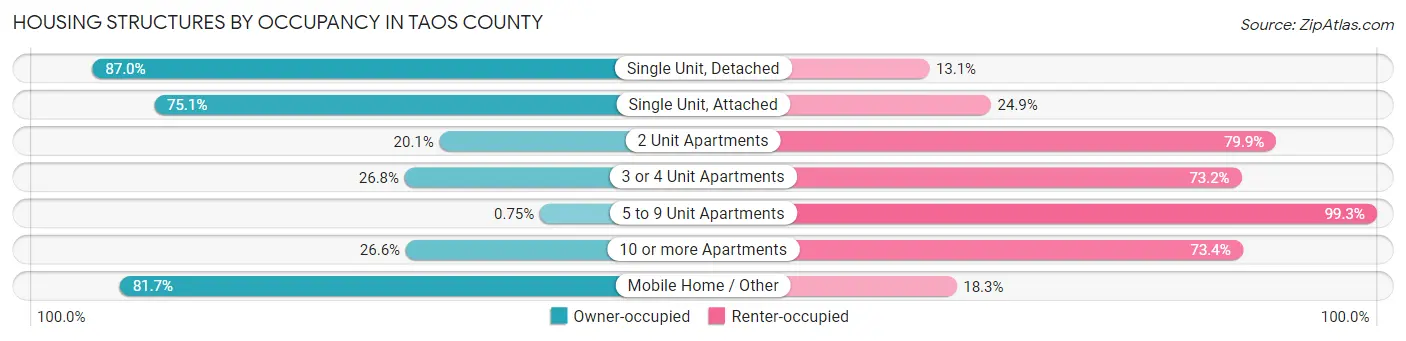
| Structure Type | Owner-occupied | Renter-occupied |
| Single Unit, Detached | 8,906 (87.0%) | 1,337 (13.1%) |
| Single Unit, Attached | 250 (75.1%) | 83 (24.9%) |
| 2 Unit Apartments | 40 (20.1%) | 159 (79.9%) |
| 3 or 4 Unit Apartments | 71 (26.8%) | 194 (73.2%) |
| 5 to 9 Unit Apartments | 3 (0.7%) | 395 (99.3%) |
| 10 or more Apartments | 42 (26.6%) | 116 (73.4%) |
| Mobile Home / Other | 1,748 (81.7%) | 392 (18.3%) |
| Total | 11,060 (80.5%) | 2,676 (19.5%) |
Housing Structures by Number of Rooms in Taos County
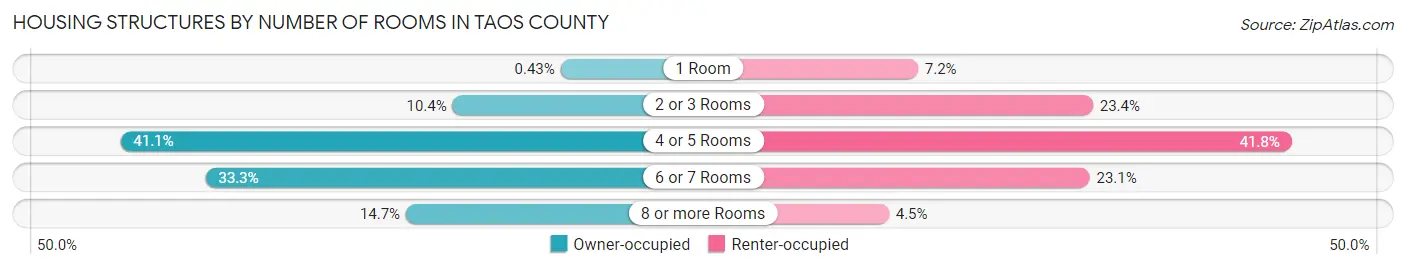
| Number of Rooms | Owner-occupied | Renter-occupied |
| 1 Room | 48 (0.4%) | 193 (7.2%) |
| 2 or 3 Rooms | 1,152 (10.4%) | 626 (23.4%) |
| 4 or 5 Rooms | 4,550 (41.1%) | 1,118 (41.8%) |
| 6 or 7 Rooms | 3,681 (33.3%) | 618 (23.1%) |
| 8 or more Rooms | 1,629 (14.7%) | 121 (4.5%) |
| Total | 11,060 (100.0%) | 2,676 (100.0%) |
Housing Structure by Heating Type in Taos County
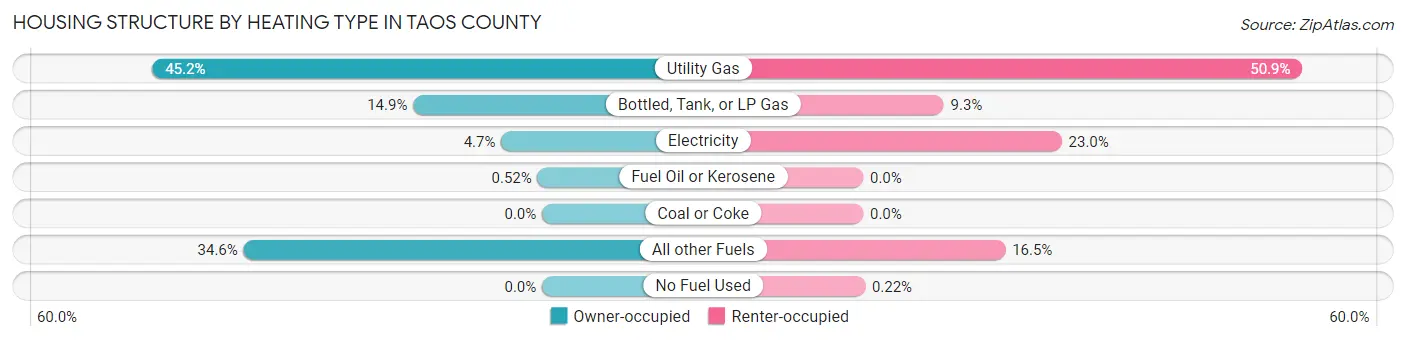
| Heating Type | Owner-occupied | Renter-occupied |
| Utility Gas | 4,999 (45.2%) | 1,363 (50.9%) |
| Bottled, Tank, or LP Gas | 1,652 (14.9%) | 250 (9.3%) |
| Electricity | 523 (4.7%) | 616 (23.0%) |
| Fuel Oil or Kerosene | 58 (0.5%) | 0 (0.0%) |
| Coal or Coke | 0 (0.0%) | 0 (0.0%) |
| All other Fuels | 3,828 (34.6%) | 441 (16.5%) |
| No Fuel Used | 0 (0.0%) | 6 (0.2%) |
| Total | 11,060 (100.0%) | 2,676 (100.0%) |
Household Vehicle Usage in Taos County
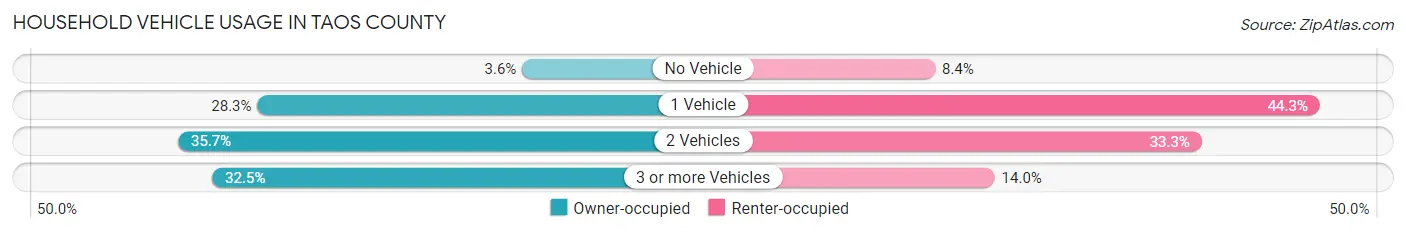
| Vehicles per Household | Owner-occupied | Renter-occupied |
| No Vehicle | 393 (3.5%) | 225 (8.4%) |
| 1 Vehicle | 3,127 (28.3%) | 1,186 (44.3%) |
| 2 Vehicles | 3,947 (35.7%) | 891 (33.3%) |
| 3 or more Vehicles | 3,593 (32.5%) | 374 (14.0%) |
| Total | 11,060 (100.0%) | 2,676 (100.0%) |
Real Estate & Mortgages in Taos County
Real Estate and Mortgage Overview in Taos County
| Characteristic | Without Mortgage | With Mortgage |
| Housing Units | 6,581 | 4,479 |
| Median Property Value | $296,600 | $332,700 |
| Median Household Income | $44,924 | $1,130 |
| Monthly Housing Costs | $432 | $216 |
| Real Estate Taxes | $1,035 | $63 |
Property Value by Mortgage Status in Taos County
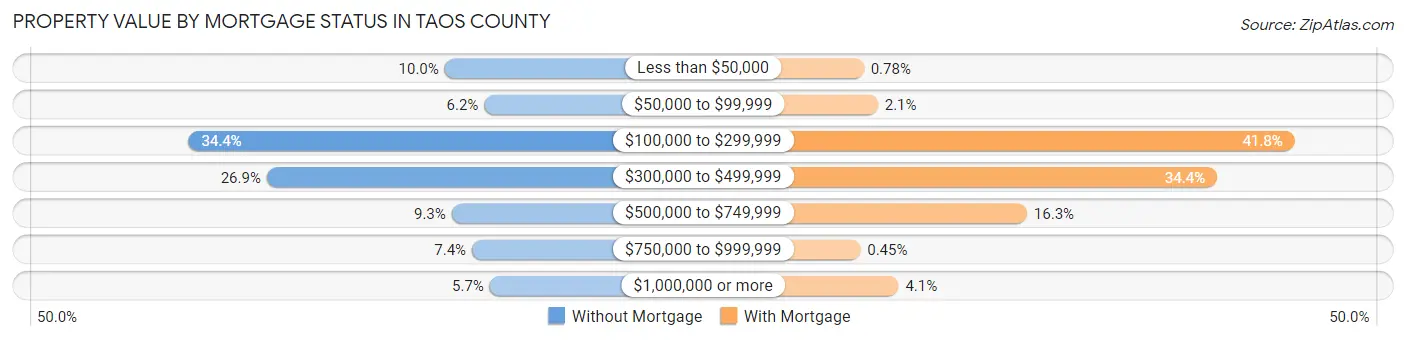
| Property Value | Without Mortgage | With Mortgage |
| Less than $50,000 | 658 (10.0%) | 35 (0.8%) |
| $50,000 to $99,999 | 410 (6.2%) | 95 (2.1%) |
| $100,000 to $299,999 | 2,263 (34.4%) | 1,873 (41.8%) |
| $300,000 to $499,999 | 1,773 (26.9%) | 1,542 (34.4%) |
| $500,000 to $749,999 | 614 (9.3%) | 731 (16.3%) |
| $750,000 to $999,999 | 487 (7.4%) | 20 (0.4%) |
| $1,000,000 or more | 376 (5.7%) | 183 (4.1%) |
| Total | 6,581 (100.0%) | 4,479 (100.0%) |
Household Income by Mortgage Status in Taos County
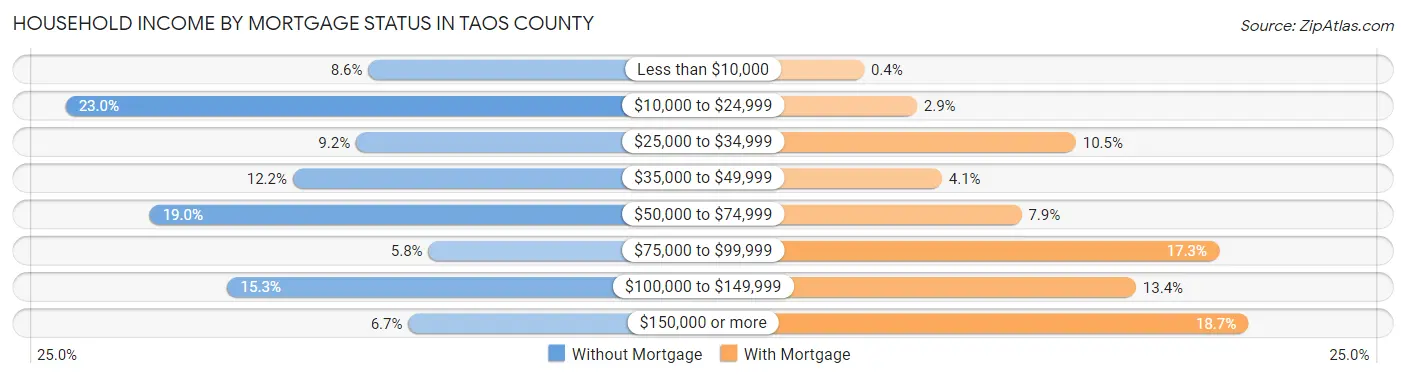
| Household Income | Without Mortgage | With Mortgage |
| Less than $10,000 | 568 (8.6%) | 18 (0.4%) |
| $10,000 to $24,999 | 1,516 (23.0%) | 131 (2.9%) |
| $25,000 to $34,999 | 607 (9.2%) | 470 (10.5%) |
| $35,000 to $49,999 | 805 (12.2%) | 184 (4.1%) |
| $50,000 to $74,999 | 1,253 (19.0%) | 354 (7.9%) |
| $75,000 to $99,999 | 380 (5.8%) | 775 (17.3%) |
| $100,000 to $149,999 | 1,009 (15.3%) | 598 (13.4%) |
| $150,000 or more | 443 (6.7%) | 837 (18.7%) |
| Total | 6,581 (100.0%) | 4,479 (100.0%) |
Property Value to Household Income Ratio in Taos County
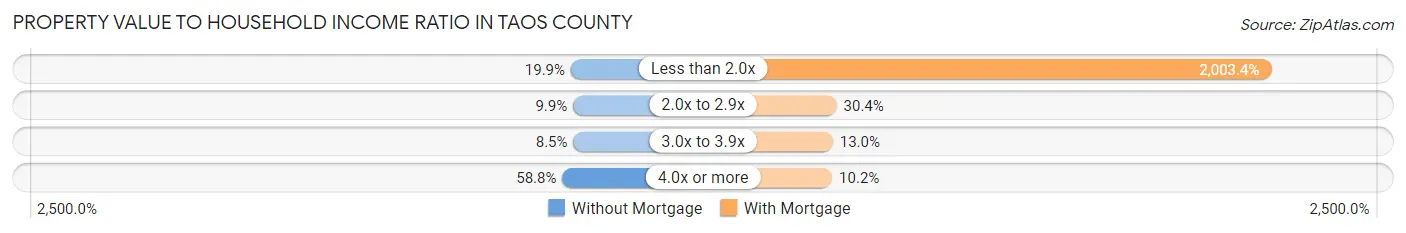
| Value-to-Income Ratio | Without Mortgage | With Mortgage |
| Less than 2.0x | 1,306 (19.9%) | 89,734 (2,003.4%) |
| 2.0x to 2.9x | 652 (9.9%) | 1,362 (30.4%) |
| 3.0x to 3.9x | 560 (8.5%) | 581 (13.0%) |
| 4.0x or more | 3,869 (58.8%) | 457 (10.2%) |
| Total | 6,581 (100.0%) | 4,479 (100.0%) |
Real Estate Taxes by Mortgage Status in Taos County
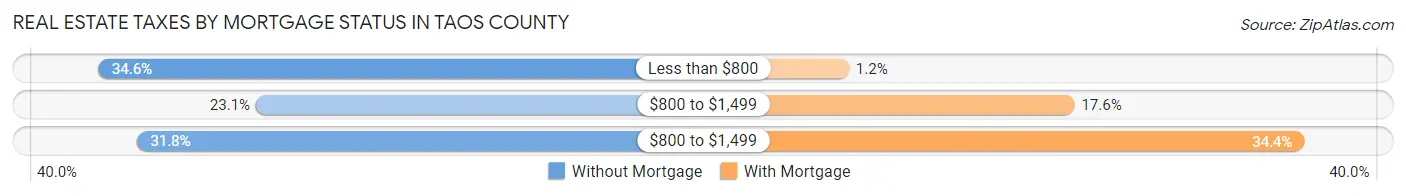
| Property Taxes | Without Mortgage | With Mortgage |
| Less than $800 | 2,275 (34.6%) | 52 (1.2%) |
| $800 to $1,499 | 1,520 (23.1%) | 790 (17.6%) |
| $800 to $1,499 | 2,090 (31.8%) | 1,542 (34.4%) |
| Total | 6,581 (100.0%) | 4,479 (100.0%) |
Health & Disability in Taos County
Health Insurance Coverage by Age in Taos County
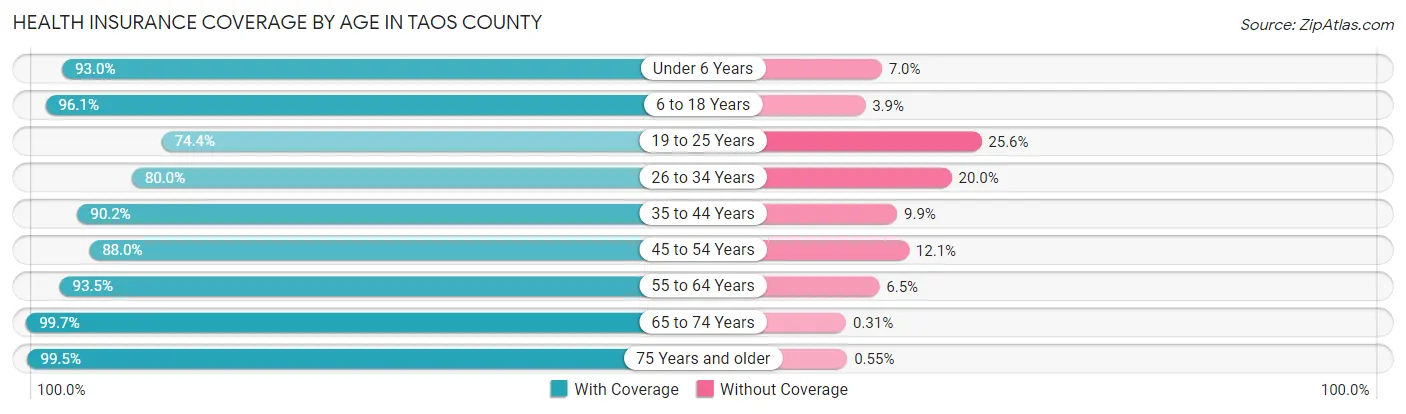
| Age Bracket | With Coverage | Without Coverage |
| Under 6 Years | 1,531 (93.0%) | 115 (7.0%) |
| 6 to 18 Years | 4,462 (96.1%) | 181 (3.9%) |
| 19 to 25 Years | 1,710 (74.4%) | 587 (25.6%) |
| 26 to 34 Years | 2,204 (80.0%) | 551 (20.0%) |
| 35 to 44 Years | 3,650 (90.1%) | 399 (9.9%) |
| 45 to 54 Years | 3,554 (87.9%) | 487 (12.0%) |
| 55 to 64 Years | 5,030 (93.5%) | 352 (6.5%) |
| 65 to 74 Years | 5,780 (99.7%) | 18 (0.3%) |
| 75 Years and older | 3,642 (99.5%) | 20 (0.5%) |
| Total | 31,563 (92.1%) | 2,710 (7.9%) |
Health Insurance Coverage by Citizenship Status in Taos County
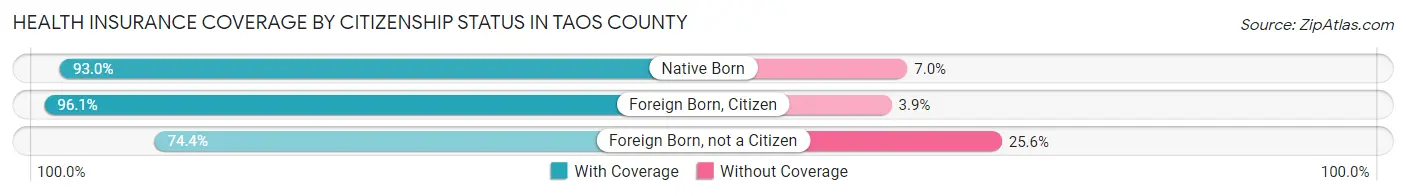
| Citizenship Status | With Coverage | Without Coverage |
| Native Born | 1,531 (93.0%) | 115 (7.0%) |
| Foreign Born, Citizen | 4,462 (96.1%) | 181 (3.9%) |
| Foreign Born, not a Citizen | 1,710 (74.4%) | 587 (25.6%) |
Health Insurance Coverage by Household Income in Taos County
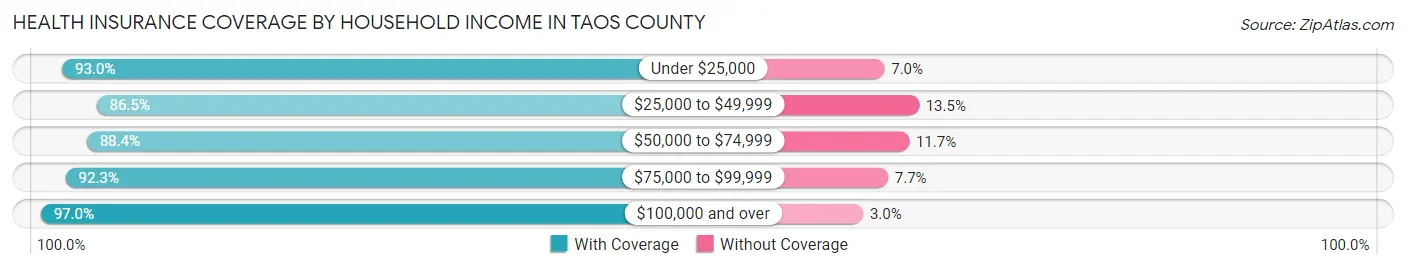
| Household Income | With Coverage | Without Coverage |
| Under $25,000 | 5,537 (93.0%) | 418 (7.0%) |
| $25,000 to $49,999 | 5,801 (86.5%) | 904 (13.5%) |
| $50,000 to $74,999 | 5,149 (88.3%) | 679 (11.7%) |
| $75,000 to $99,999 | 3,647 (92.3%) | 304 (7.7%) |
| $100,000 and over | 11,217 (97.0%) | 351 (3.0%) |
Public vs Private Health Insurance Coverage by Age in Taos County
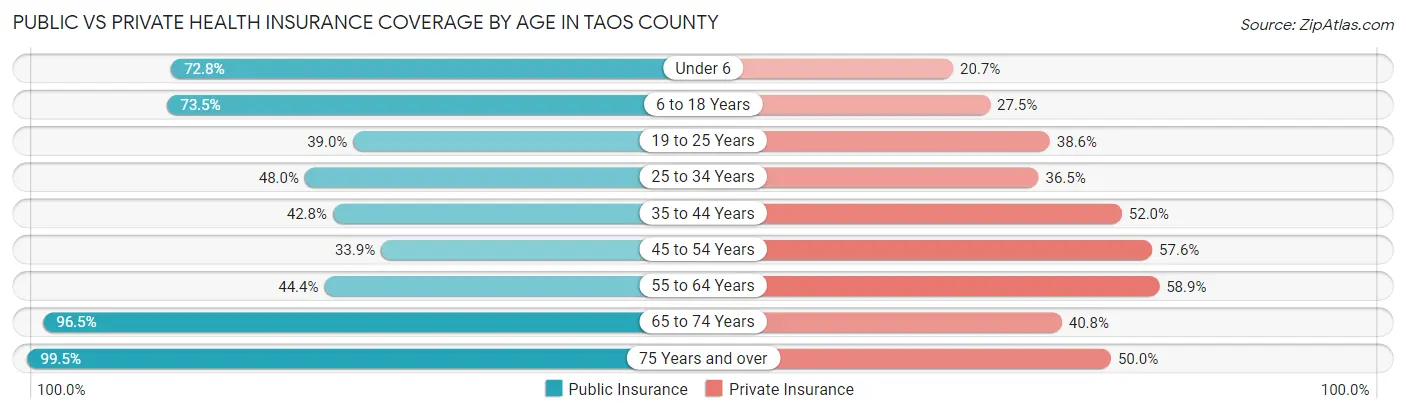
| Age Bracket | Public Insurance | Private Insurance |
| Under 6 | 1,198 (72.8%) | 340 (20.7%) |
| 6 to 18 Years | 3,413 (73.5%) | 1,278 (27.5%) |
| 19 to 25 Years | 896 (39.0%) | 887 (38.6%) |
| 25 to 34 Years | 1,322 (48.0%) | 1,006 (36.5%) |
| 35 to 44 Years | 1,733 (42.8%) | 2,105 (52.0%) |
| 45 to 54 Years | 1,368 (33.9%) | 2,328 (57.6%) |
| 55 to 64 Years | 2,388 (44.4%) | 3,171 (58.9%) |
| 65 to 74 Years | 5,596 (96.5%) | 2,368 (40.8%) |
| 75 Years and over | 3,642 (99.5%) | 1,830 (50.0%) |
| Total | 21,556 (62.9%) | 15,313 (44.7%) |
Disability Status by Sex by Age in Taos County
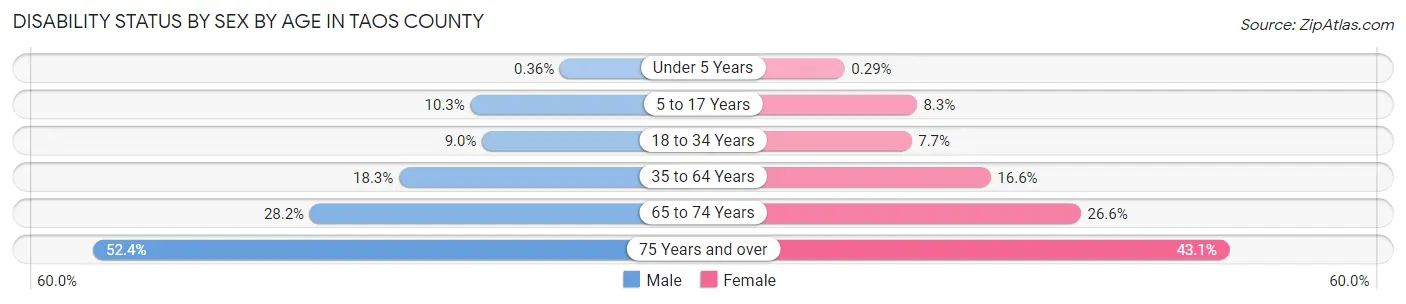
| Age Bracket | Male | Female |
| Under 5 Years | 2 (0.4%) | 2 (0.3%) |
| 5 to 17 Years | 253 (10.3%) | 178 (8.3%) |
| 18 to 34 Years | 256 (9.0%) | 207 (7.7%) |
| 35 to 64 Years | 1,224 (18.3%) | 1,122 (16.6%) |
| 65 to 74 Years | 782 (28.2%) | 805 (26.6%) |
| 75 Years and over | 853 (52.4%) | 876 (43.1%) |
Disability Class by Sex by Age in Taos County
Disability Class: Hearing Difficulty
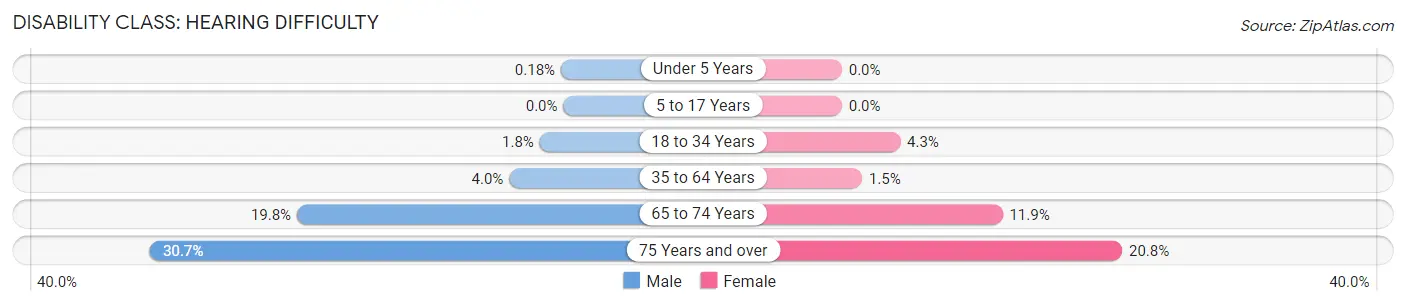
| Age Bracket | Male | Female |
| Under 5 Years | 1 (0.2%) | 0 (0.0%) |
| 5 to 17 Years | 0 (0.0%) | 0 (0.0%) |
| 18 to 34 Years | 50 (1.8%) | 116 (4.3%) |
| 35 to 64 Years | 269 (4.0%) | 102 (1.5%) |
| 65 to 74 Years | 548 (19.8%) | 361 (11.9%) |
| 75 Years and over | 500 (30.7%) | 423 (20.8%) |
Disability Class: Vision Difficulty
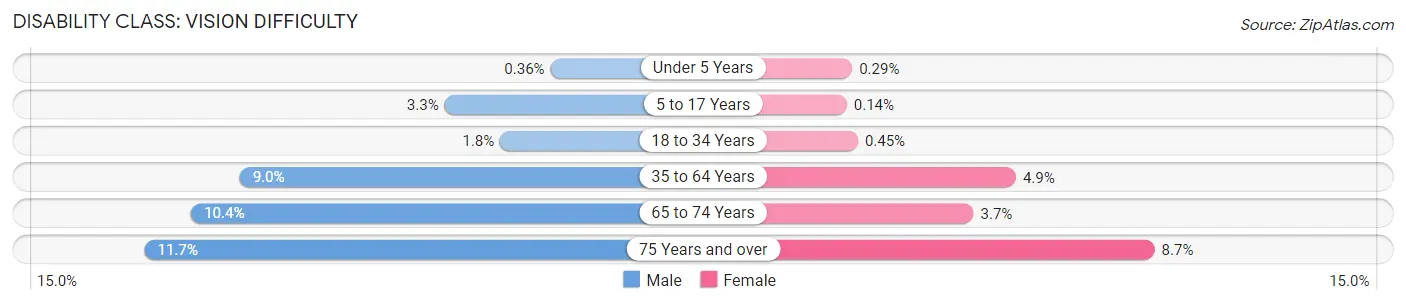
| Age Bracket | Male | Female |
| Under 5 Years | 2 (0.4%) | 2 (0.3%) |
| 5 to 17 Years | 81 (3.3%) | 3 (0.1%) |
| 18 to 34 Years | 50 (1.8%) | 12 (0.4%) |
| 35 to 64 Years | 603 (9.0%) | 329 (4.9%) |
| 65 to 74 Years | 287 (10.4%) | 111 (3.7%) |
| 75 Years and over | 190 (11.7%) | 177 (8.7%) |
Disability Class: Cognitive Difficulty
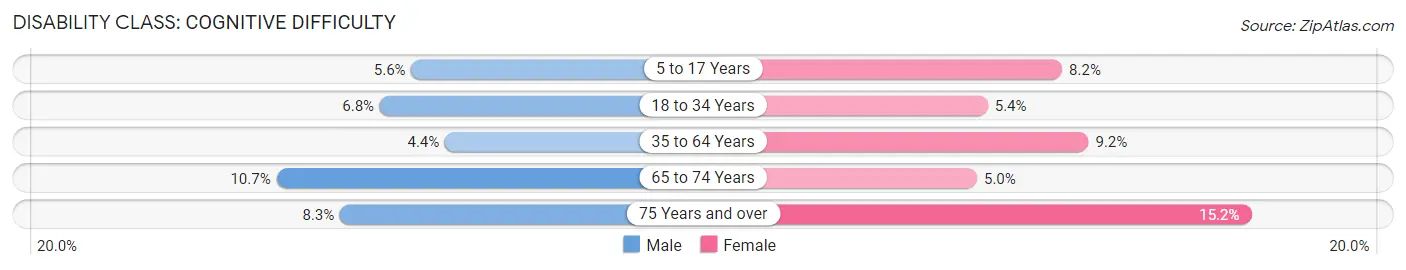
| Age Bracket | Male | Female |
| 5 to 17 Years | 138 (5.6%) | 175 (8.2%) |
| 18 to 34 Years | 193 (6.8%) | 145 (5.4%) |
| 35 to 64 Years | 294 (4.4%) | 621 (9.2%) |
| 65 to 74 Years | 295 (10.6%) | 152 (5.0%) |
| 75 Years and over | 135 (8.3%) | 309 (15.2%) |
Disability Class: Ambulatory Difficulty
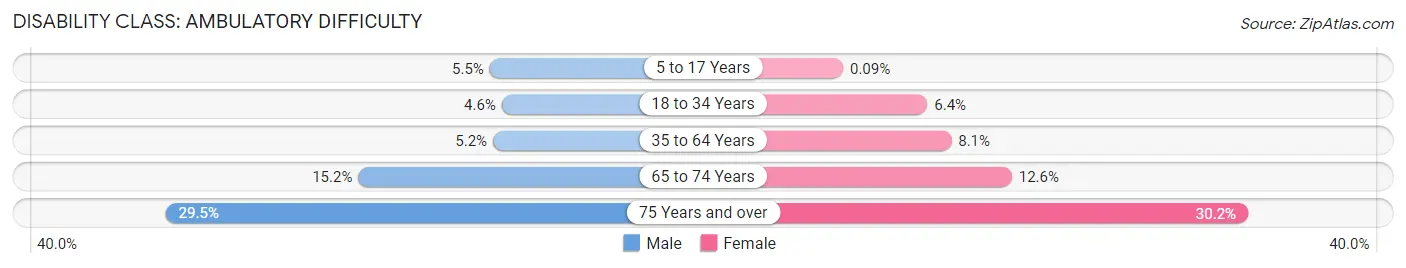
| Age Bracket | Male | Female |
| 5 to 17 Years | 134 (5.5%) | 2 (0.1%) |
| 18 to 34 Years | 130 (4.6%) | 170 (6.4%) |
| 35 to 64 Years | 350 (5.2%) | 551 (8.1%) |
| 65 to 74 Years | 422 (15.2%) | 382 (12.6%) |
| 75 Years and over | 481 (29.5%) | 613 (30.1%) |
Disability Class: Self-Care Difficulty
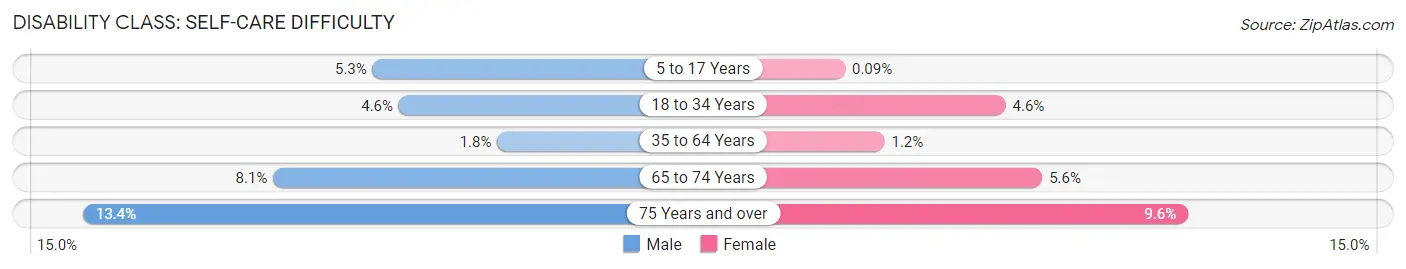
| Age Bracket | Male | Female |
| 5 to 17 Years | 130 (5.3%) | 2 (0.1%) |
| 18 to 34 Years | 130 (4.6%) | 122 (4.6%) |
| 35 to 64 Years | 123 (1.8%) | 81 (1.2%) |
| 65 to 74 Years | 224 (8.1%) | 169 (5.6%) |
| 75 Years and over | 218 (13.4%) | 196 (9.6%) |
Technology Access in Taos County
Computing Device Access in Taos County
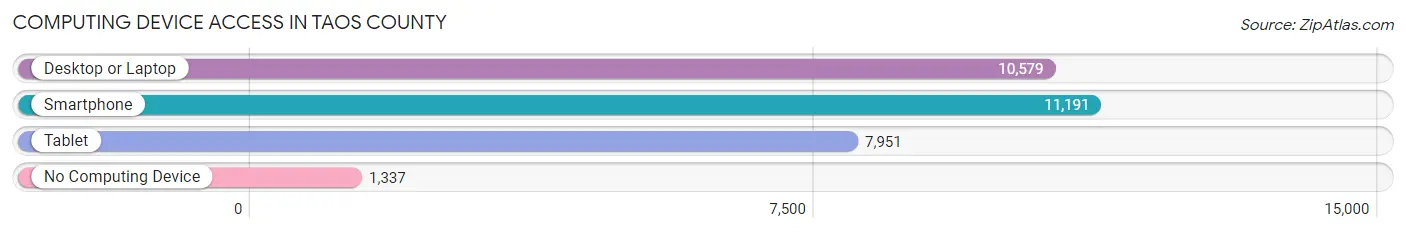
| Device Type | # Households | % Households |
| Desktop or Laptop | 10,579 | 77.0% |
| Smartphone | 11,191 | 81.5% |
| Tablet | 7,951 | 57.9% |
| No Computing Device | 1,337 | 9.7% |
| Total | 13,736 | 100.0% |
Internet Access in Taos County
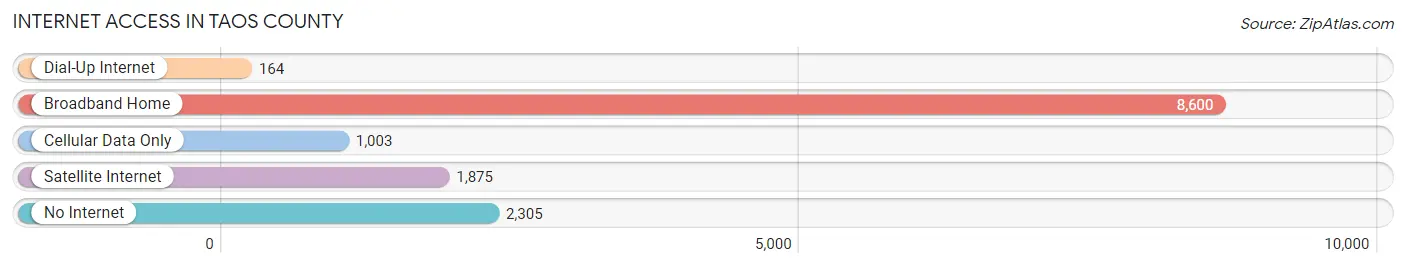
| Internet Type | # Households | % Households |
| Dial-Up Internet | 164 | 1.2% |
| Broadband Home | 8,600 | 62.6% |
| Cellular Data Only | 1,003 | 7.3% |
| Satellite Internet | 1,875 | 13.7% |
| No Internet | 2,305 | 16.8% |
| Total | 13,736 | 100.0% |
Taos County Summary
Taos County is a county located in the northern part of the state of New Mexico, in the United States. It is the fifth-largest county in the state, with a population of 32,937 as of the 2010 census. The county seat is Taos, which is also the county's largest city.
Geography
Taos County is located in the northern part of New Mexico, and is bordered by Rio Arriba County to the east, Colfax County to the south, Mora County to the west, and Colorado to the north. The county covers an area of 2,914 square miles, making it the fifth-largest county in the state. The county is located in the Sangre de Cristo Mountains, and is home to the Taos Ski Valley, the highest ski resort in the state. The county also contains the Rio Grande Gorge, a deep canyon that runs through the county.
The county is divided into two distinct regions: the high country and the low country. The high country is located in the northern part of the county, and is characterized by high elevations, rugged terrain, and sparsely populated areas. The low country is located in the southern part of the county, and is characterized by lower elevations, more fertile land, and more densely populated areas.
Climate
Taos County has a semi-arid climate, with hot summers and cold winters. The average annual temperature is 54°F, with an average high of 79°F in July and an average low of 28°F in January. The average annual precipitation is 12.5 inches, with most of the precipitation occurring in the summer months.
Demographics
As of the 2010 census, there were 32,937 people, 11,945 households, and 8,717 families residing in the county. The population density was 11.3 people per square mile. The racial makeup of the county was 68.3% White, 0.7% African American, 1.2% Native American, 0.4% Asian, 0.1% Pacific Islander, 25.7% from other races, and 3.6% from two or more races. Hispanic or Latino of any race were 57.2% of the population.
The median income for a household in the county was $31,945, and the median income for a family was $37,945. The per capita income for the county was $17,845. About 20.2% of families and 24.2% of the population were below the poverty line, including 33.2% of those under age 18 and 16.2% of those age 65 or over.
Economy
Taos County is largely rural, and the economy is largely based on agriculture and tourism. The county is home to several ski resorts, including the Taos Ski Valley, which is the highest ski resort in the state. The county is also home to several wineries, and is a popular destination for outdoor recreation.
The county is also home to several manufacturing companies, including a large furniture manufacturer, a large food processing plant, and a large electronics manufacturer. The county is also home to several government agencies, including the Bureau of Land Management, the U.S. Forest Service, and the U.S. Fish and Wildlife Service.
Conclusion
Taos County is a large, rural county located in the northern part of New Mexico. The county is home to several ski resorts, wineries, and outdoor recreation areas, and is a popular destination for tourists. The economy of the county is largely based on agriculture and tourism, but also includes several manufacturing companies and government agencies. The population of the county is largely Hispanic or Latino, and the median income for a household is slightly below the state average.
Common Questions
What is Per Capita Income in Taos County?
Per Capita income in Taos County is $36,361.
What is the Median Family Income in Taos County?
Median Family Income in Taos County is $69,965.
What is the Median Household income in Taos County?
Median Household Income in Taos County is $55,145.
What is Income or Wage Gap in Taos County?
Income or Wage Gap in Taos County is 20.3%.
Women in Taos County earn 79.7 cents for every dollar earned by a man.
What is Family Income Deficit in Taos County?
Family Income Deficit in Taos County is $9,565.
Families that are below poverty line in Taos County earn $9,565 less on average than the poverty threshold level.
What is Inequality or Gini Index in Taos County?
Inequality or Gini Index in Taos County is 0.51.
What is the Total Population of Taos County?
Total Population of Taos County is 34,475.
What is the Total Male Population of Taos County?
Total Male Population of Taos County is 17,035.
What is the Total Female Population of Taos County?
Total Female Population of Taos County is 17,440.
What is the Ratio of Males per 100 Females in Taos County?
There are 97.68 Males per 100 Females in Taos County.
What is the Ratio of Females per 100 Males in Taos County?
There are 102.38 Females per 100 Males in Taos County.
What is the Median Population Age in Taos County?
Median Population Age in Taos County is 49.8 Years.
What is the Average Family Size in Taos County
Average Family Size in Taos County is 3.5 People.
What is the Average Household Size in Taos County
Average Household Size in Taos County is 2.5 People.
How Large is the Labor Force in Taos County?
There are 14,979 People in the Labor Forcein in Taos County.
What is the Percentage of People in the Labor Force in Taos County?
50.9% of People are in the Labor Force in Taos County.
What is the Unemployment Rate in Taos County?
Unemployment Rate in Taos County is 5.9%.