Bosque Farms, NM Map & Demographics
Bosque Farms Map
Bosque Farms Overview
$35,091
PER CAPITA INCOME
$95,870
AVG FAMILY INCOME
$67,435
AVG HOUSEHOLD INCOME
26.5%
WAGE / INCOME GAP [ % ]
73.5¢/ $1
WAGE / INCOME GAP [ $ ]
0.43
INEQUALITY / GINI INDEX
4,001
TOTAL POPULATION
2,034
MALE POPULATION
1,967
FEMALE POPULATION
103.41
MALES / 100 FEMALES
96.71
FEMALES / 100 MALES
45.9
MEDIAN AGE
3.0
AVG FAMILY SIZE
2.5
AVG HOUSEHOLD SIZE
1,844
LABOR FORCE [ PEOPLE ]
55.8%
PERCENT IN LABOR FORCE
3.4%
UNEMPLOYMENT RATE
Bosque Farms Zip Codes
Bosque Farms Area Codes
Income in Bosque Farms
Income Overview in Bosque Farms
Per Capita Income in Bosque Farms is $35,091, while median incomes of families and households are $95,870 and $67,435 respectively.
| Characteristic | Number | Measure |
| Per Capita Income | 4,001 | $35,091 |
| Median Family Income | 1,110 | $95,870 |
| Mean Family Income | 1,110 | $102,564 |
| Median Household Income | 1,569 | $67,435 |
| Mean Household Income | 1,569 | $85,979 |
| Income Deficit | 1,110 | $0 |
| Wage / Income Gap (%) | 4,001 | 26.52% |
| Wage / Income Gap ($) | 4,001 | 73.48¢ per $1 |
| Gini / Inequality Index | 4,001 | 0.43 |
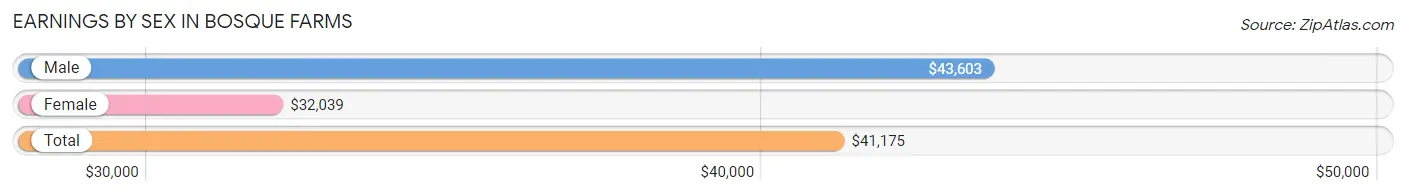
Earnings by Sex in Bosque Farms
Average Earnings in Bosque Farms are $41,175, $43,603 for men and $32,039 for women, a difference of 26.5%.
| Sex | Number | Average Earnings |
| Male | 1,171 (59.3%) | $43,603 |
| Female | 803 (40.7%) | $32,039 |
| Total | 1,974 (100.0%) | $41,175 |
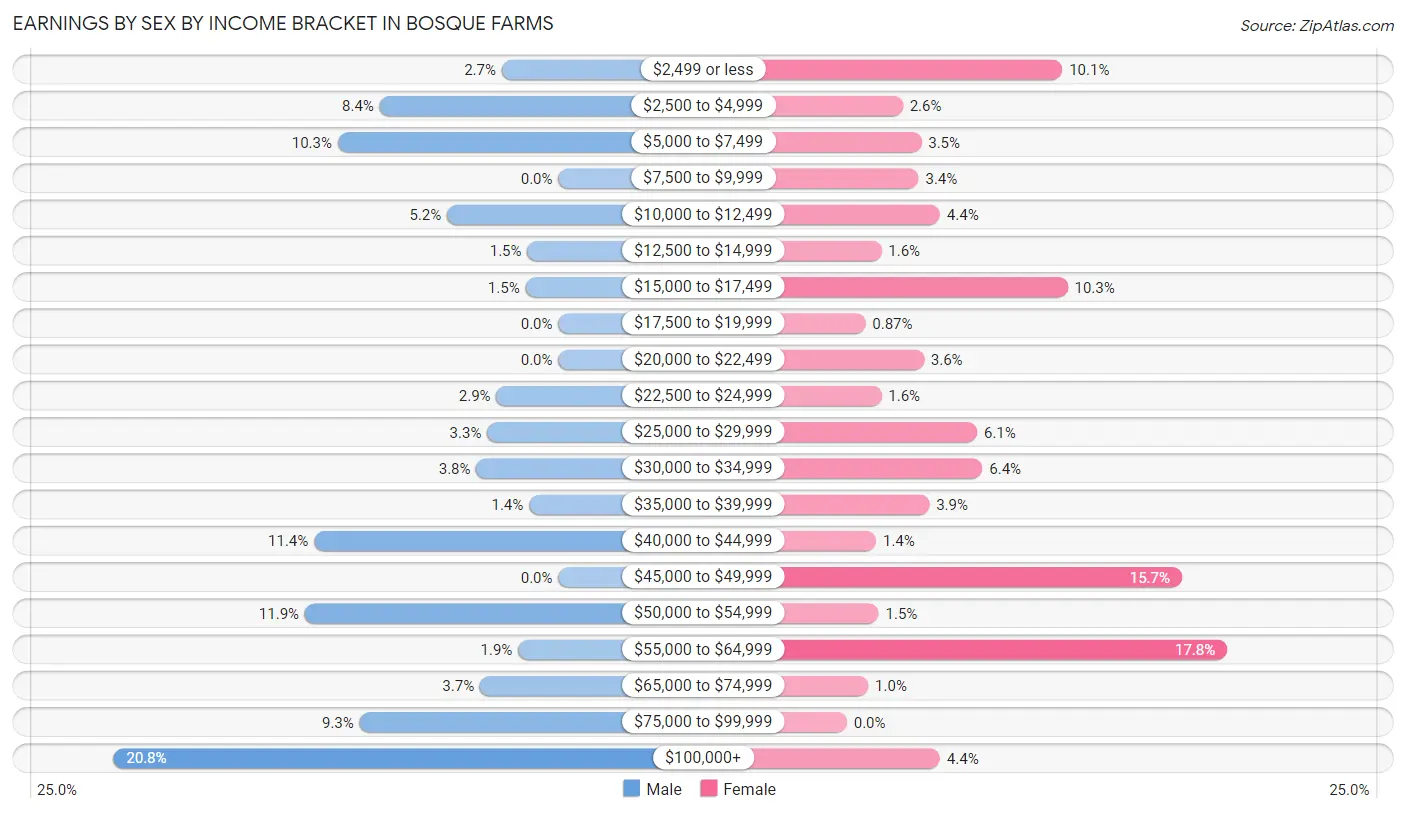
Earnings by Sex by Income Bracket in Bosque Farms
The most common earnings brackets in Bosque Farms are $100,000+ for men (244 | 20.8%) and $55,000 to $64,999 for women (143 | 17.8%).
| Income | Male | Female |
| $2,499 or less | 31 (2.6%) | 81 (10.1%) |
| $2,500 to $4,999 | 98 (8.4%) | 21 (2.6%) |
| $5,000 to $7,499 | 121 (10.3%) | 28 (3.5%) |
| $7,500 to $9,999 | 0 (0.0%) | 27 (3.4%) |
| $10,000 to $12,499 | 61 (5.2%) | 35 (4.4%) |
| $12,500 to $14,999 | 17 (1.5%) | 13 (1.6%) |
| $15,000 to $17,499 | 18 (1.5%) | 83 (10.3%) |
| $17,500 to $19,999 | 0 (0.0%) | 7 (0.9%) |
| $20,000 to $22,499 | 0 (0.0%) | 29 (3.6%) |
| $22,500 to $24,999 | 34 (2.9%) | 13 (1.6%) |
| $25,000 to $29,999 | 39 (3.3%) | 49 (6.1%) |
| $30,000 to $34,999 | 45 (3.8%) | 51 (6.4%) |
| $35,000 to $39,999 | 16 (1.4%) | 31 (3.9%) |
| $40,000 to $44,999 | 134 (11.4%) | 11 (1.4%) |
| $45,000 to $49,999 | 0 (0.0%) | 126 (15.7%) |
| $50,000 to $54,999 | 139 (11.9%) | 12 (1.5%) |
| $55,000 to $64,999 | 22 (1.9%) | 143 (17.8%) |
| $65,000 to $74,999 | 43 (3.7%) | 8 (1.0%) |
| $75,000 to $99,999 | 109 (9.3%) | 0 (0.0%) |
| $100,000+ | 244 (20.8%) | 35 (4.4%) |
| Total | 1,171 (100.0%) | 803 (100.0%) |
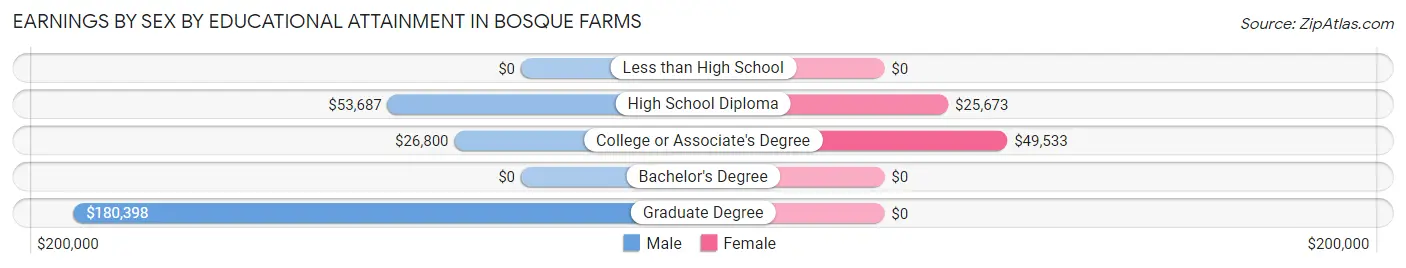
Earnings by Sex by Educational Attainment in Bosque Farms
Average earnings in Bosque Farms are $53,435 for men and $36,089 for women, a difference of 32.5%. Men with an educational attainment of graduate degree enjoy the highest average annual earnings of $180,398, while those with college or associate's degree education earn the least with $26,800. Women with an educational attainment of college or associate's degree earn the most with the average annual earnings of $49,533, while those with high school diploma education have the smallest earnings of $25,673.
| Educational Attainment | Male Income | Female Income |
| Less than High School | - | - |
| High School Diploma | $53,687 | $25,673 |
| College or Associate's Degree | $26,800 | $49,533 |
| Bachelor's Degree | - | - |
| Graduate Degree | $180,398 | $0 |
| Total | $53,435 | $36,089 |
Family Income in Bosque Farms
Family Income Brackets in Bosque Farms
According to the Bosque Farms family income data, there are 350 families falling into the $100,000 to $149,999 income range, which is the most common income bracket and makes up 31.5% of all families.
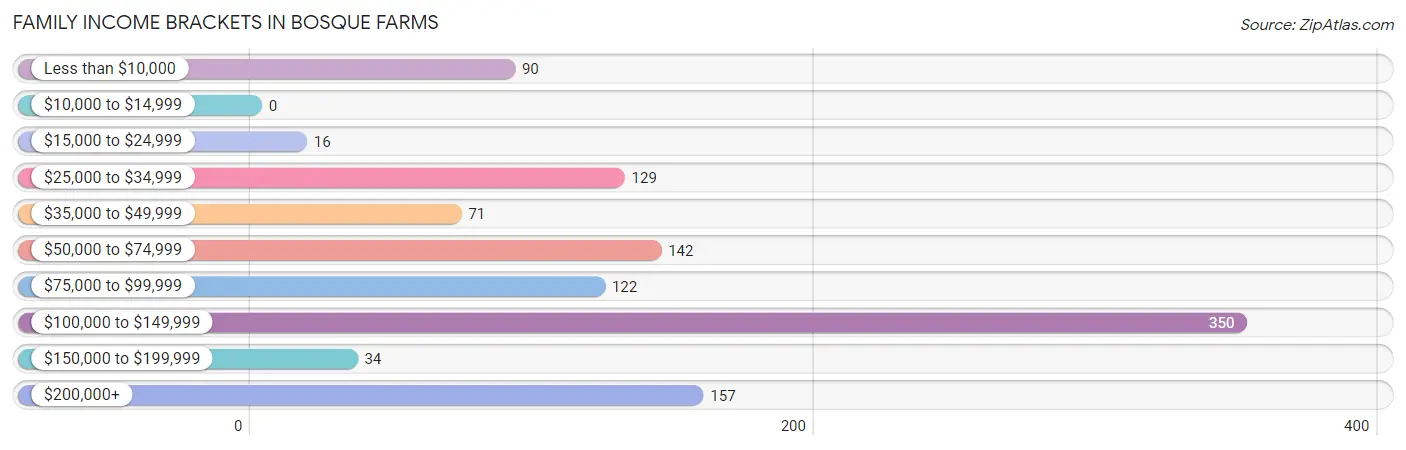
| Income Bracket | # Families | % Families |
| Less than $10,000 | 90 | 8.1% |
| $10,000 to $14,999 | 0 | 0.0% |
| $15,000 to $24,999 | 16 | 1.4% |
| $25,000 to $34,999 | 129 | 11.6% |
| $35,000 to $49,999 | 71 | 6.4% |
| $50,000 to $74,999 | 142 | 12.8% |
| $75,000 to $99,999 | 122 | 11.0% |
| $100,000 to $149,999 | 350 | 31.5% |
| $150,000 to $199,999 | 34 | 3.1% |
| $200,000+ | 157 | 14.1% |
Family Income by Famaliy Size in Bosque Farms
3-person families (341 | 30.7%) account for the highest median family income in Bosque Farms with $115,970 per family, while 2-person families (565 | 50.9%) have the highest median income of $39,460 per family member.
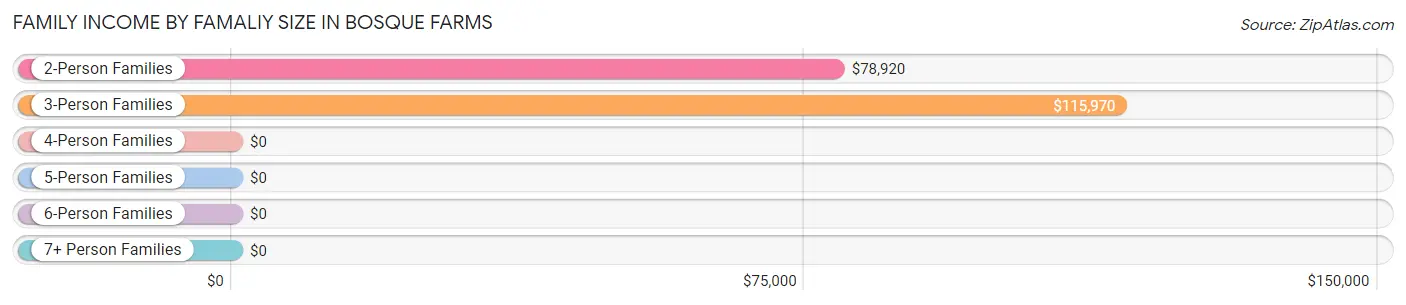
| Income Bracket | # Families | Median Income |
| 2-Person Families | 565 (50.9%) | $78,920 |
| 3-Person Families | 341 (30.7%) | $115,970 |
| 4-Person Families | 142 (12.8%) | $0 |
| 5-Person Families | 34 (3.1%) | $0 |
| 6-Person Families | 0 (0.0%) | $0 |
| 7+ Person Families | 28 (2.5%) | $0 |
| Total | 1,110 (100.0%) | $95,870 |
Family Income by Number of Earners in Bosque Farms
The median family income in Bosque Farms is $95,870, with families comprising 3+ earners (95) having the highest median family income of $250,001, while families with 1 earner (432) have the lowest median family income of $47,763, accounting for 8.6% and 38.9% of families, respectively.
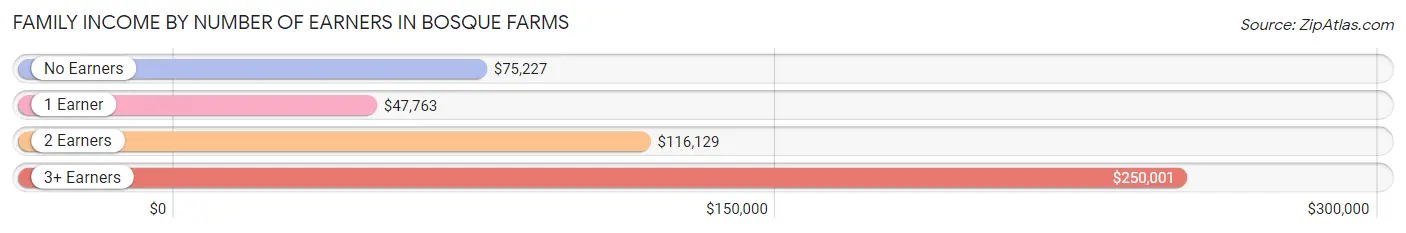
| Number of Earners | # Families | Median Income |
| No Earners | 212 (19.1%) | $75,227 |
| 1 Earner | 432 (38.9%) | $47,763 |
| 2 Earners | 371 (33.4%) | $116,129 |
| 3+ Earners | 95 (8.6%) | $250,001 |
| Total | 1,110 (100.0%) | $95,870 |
Household Income in Bosque Farms
Household Income Brackets in Bosque Farms
With 405 households falling in the category, the $100,000 to $149,999 income range is the most frequent in Bosque Farms, accounting for 25.8% of all households. In contrast, only 35 households (2.2%) fall into the $150,000 to $199,999 income bracket, making it the least populous group.
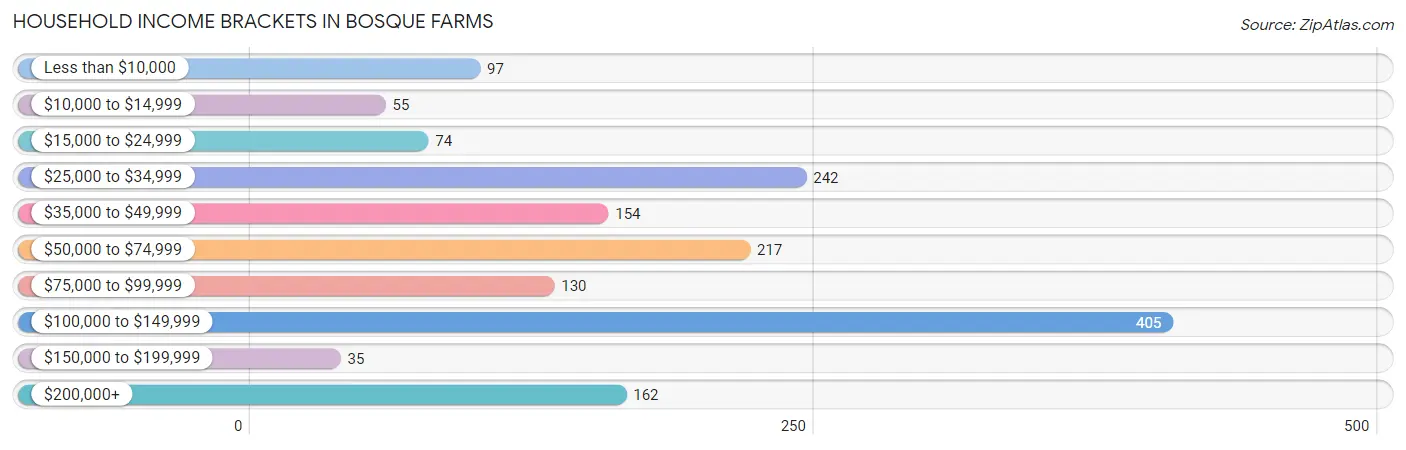
| Income Bracket | # Households | % Households |
| Less than $10,000 | 97 | 6.2% |
| $10,000 to $14,999 | 55 | 3.5% |
| $15,000 to $24,999 | 74 | 4.7% |
| $25,000 to $34,999 | 242 | 15.4% |
| $35,000 to $49,999 | 154 | 9.8% |
| $50,000 to $74,999 | 217 | 13.8% |
| $75,000 to $99,999 | 130 | 8.3% |
| $100,000 to $149,999 | 405 | 25.8% |
| $150,000 to $199,999 | 35 | 2.2% |
| $200,000+ | 162 | 10.3% |
Household Income by Householder Age in Bosque Farms
The median household income in Bosque Farms is $67,435, with the highest median household income of $116,066 found in the 45 to 64 years age bracket for the primary householder. A total of 586 households (37.3%) fall into this category. Meanwhile, the 15 to 24 years age bracket for the primary householder has the lowest median household income of $0, with 6 households (0.4%) in this group.
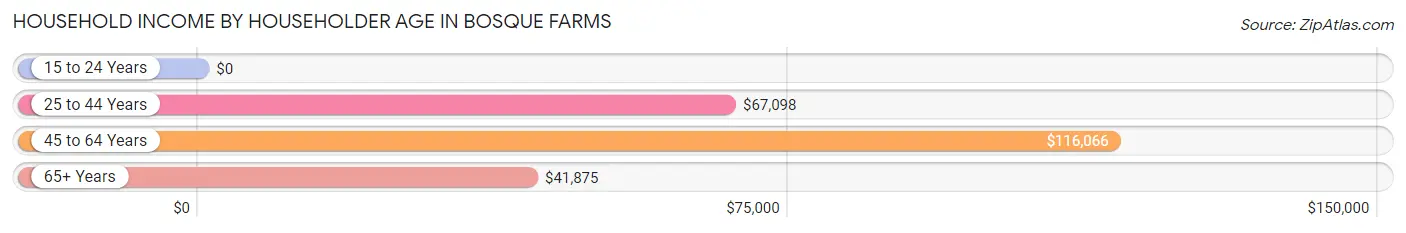
| Income Bracket | # Households | Median Income |
| 15 to 24 Years | 6 (0.4%) | $0 |
| 25 to 44 Years | 359 (22.9%) | $67,098 |
| 45 to 64 Years | 586 (37.3%) | $116,066 |
| 65+ Years | 618 (39.4%) | $41,875 |
| Total | 1,569 (100.0%) | $67,435 |
Poverty in Bosque Farms
Income Below Poverty by Sex and Age in Bosque Farms
With 19.5% poverty level for males and 14.6% for females among the residents of Bosque Farms, 15 year old males and 16 and 17 year old females are the most vulnerable to poverty, with 23 males (100.0%) and 81 females (62.3%) in their respective age groups living below the poverty level.
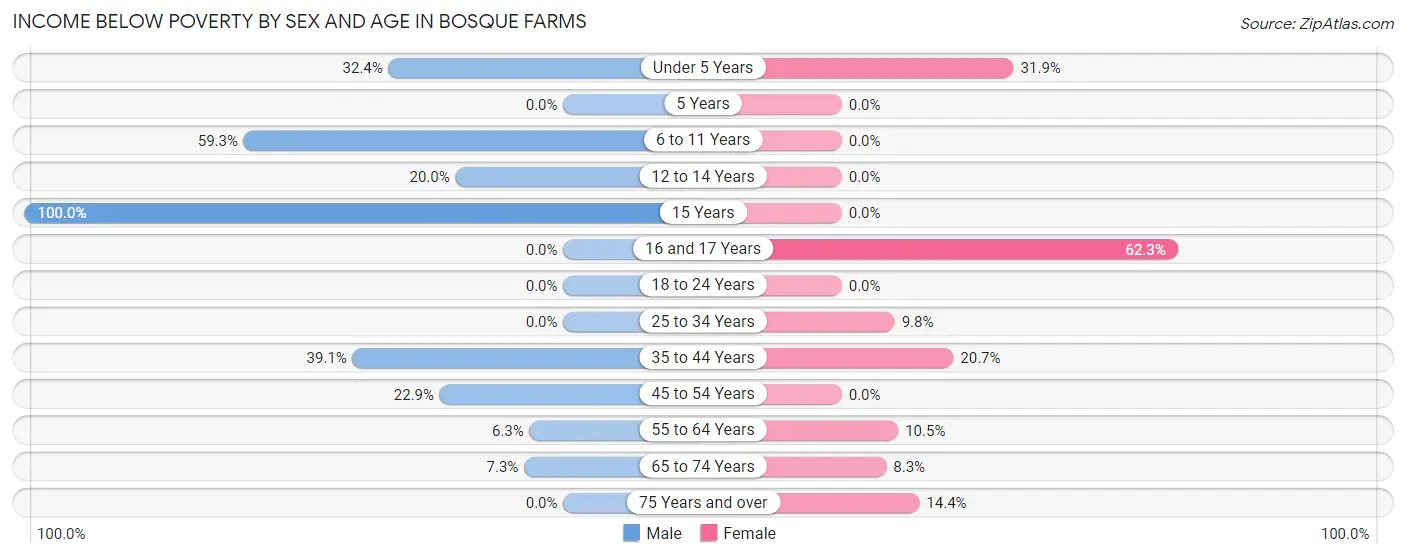
| Age Bracket | Male | Female |
| Under 5 Years | 60 (32.4%) | 52 (31.9%) |
| 5 Years | 0 (0.0%) | 0 (0.0%) |
| 6 to 11 Years | 35 (59.3%) | 0 (0.0%) |
| 12 to 14 Years | 12 (20.0%) | 0 (0.0%) |
| 15 Years | 23 (100.0%) | 0 (0.0%) |
| 16 and 17 Years | 0 (0.0%) | 81 (62.3%) |
| 18 to 24 Years | 0 (0.0%) | 0 (0.0%) |
| 25 to 34 Years | 0 (0.0%) | 28 (9.8%) |
| 35 to 44 Years | 149 (39.1%) | 35 (20.7%) |
| 45 to 54 Years | 80 (22.9%) | 0 (0.0%) |
| 55 to 64 Years | 15 (6.3%) | 37 (10.5%) |
| 65 to 74 Years | 21 (7.3%) | 23 (8.3%) |
| 75 Years and over | 0 (0.0%) | 32 (14.4%) |
| Total | 395 (19.5%) | 288 (14.6%) |
Income Above Poverty by Sex and Age in Bosque Farms
According to the poverty statistics in Bosque Farms, males aged 5 years and females aged 6 to 11 years are the age groups that are most secure financially, with 100.0% of males and 100.0% of females in these age groups living above the poverty line.
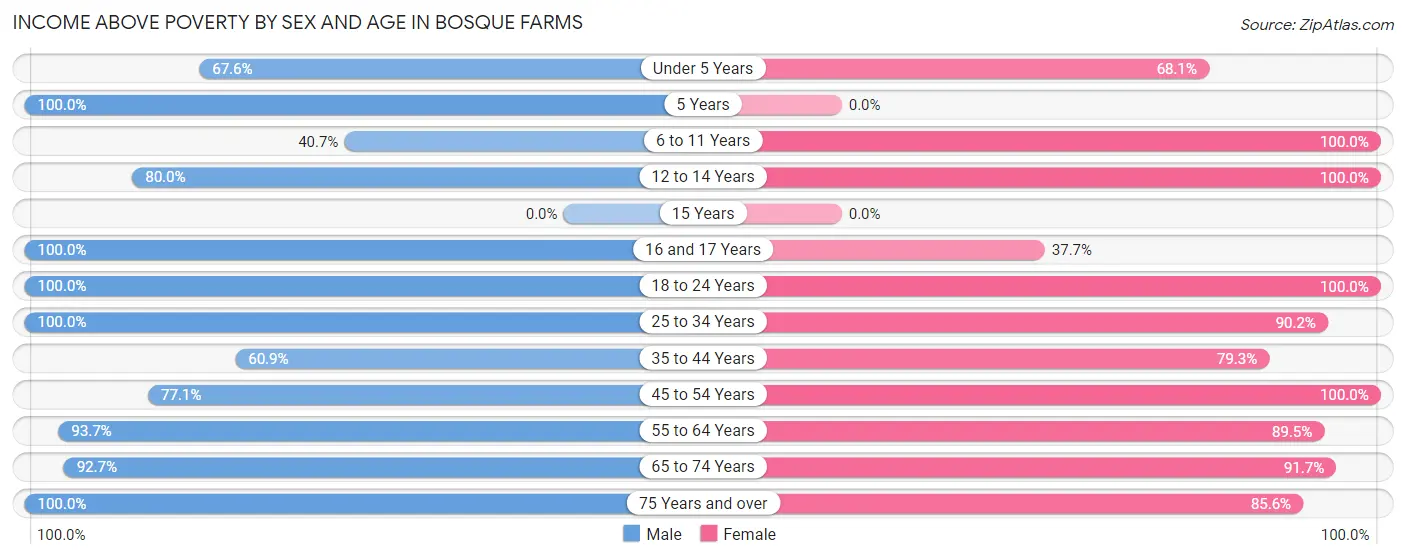
| Age Bracket | Male | Female |
| Under 5 Years | 125 (67.6%) | 111 (68.1%) |
| 5 Years | 15 (100.0%) | 0 (0.0%) |
| 6 to 11 Years | 24 (40.7%) | 163 (100.0%) |
| 12 to 14 Years | 48 (80.0%) | 23 (100.0%) |
| 15 Years | 0 (0.0%) | 0 (0.0%) |
| 16 and 17 Years | 21 (100.0%) | 49 (37.7%) |
| 18 to 24 Years | 159 (100.0%) | 52 (100.0%) |
| 25 to 34 Years | 73 (100.0%) | 257 (90.2%) |
| 35 to 44 Years | 232 (60.9%) | 134 (79.3%) |
| 45 to 54 Years | 269 (77.1%) | 129 (100.0%) |
| 55 to 64 Years | 224 (93.7%) | 316 (89.5%) |
| 65 to 74 Years | 268 (92.7%) | 255 (91.7%) |
| 75 Years and over | 176 (100.0%) | 190 (85.6%) |
| Total | 1,634 (80.5%) | 1,679 (85.4%) |
Income Below Poverty Among Married-Couple Families in Bosque Farms
The poverty statistics for married-couple families in Bosque Farms show that 2.2% or 20 of the total 918 families live below the poverty line. Families with 3 or 4 children have the highest poverty rate of 100.0%, comprising of 20 families. On the other hand, families with no children have the lowest poverty rate of 0.0%, which includes 0 families.
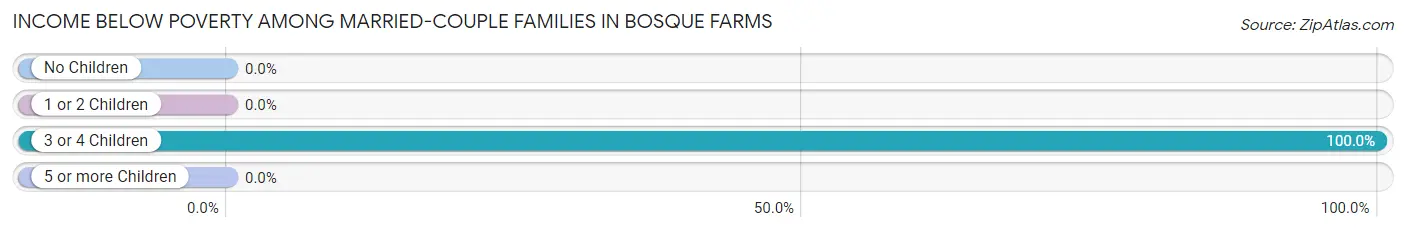
| Children | Above Poverty | Below Poverty |
| No Children | 683 (100.0%) | 0 (0.0%) |
| 1 or 2 Children | 187 (100.0%) | 0 (0.0%) |
| 3 or 4 Children | 0 (0.0%) | 20 (100.0%) |
| 5 or more Children | 28 (100.0%) | 0 (0.0%) |
| Total | 898 (97.8%) | 20 (2.2%) |
Income Below Poverty Among Single-Parent Households in Bosque Farms
According to the poverty data in Bosque Farms, 46.4% or 13 single-father households and 34.8% or 57 single-mother households are living below the poverty line. Among single-father households, those with 3 or 4 children have the highest poverty rate, with 13 households (100.0%) experiencing poverty. Likewise, among single-mother households, those with 3 or 4 children have the highest poverty rate, with 28 households (100.0%) falling below the poverty line.
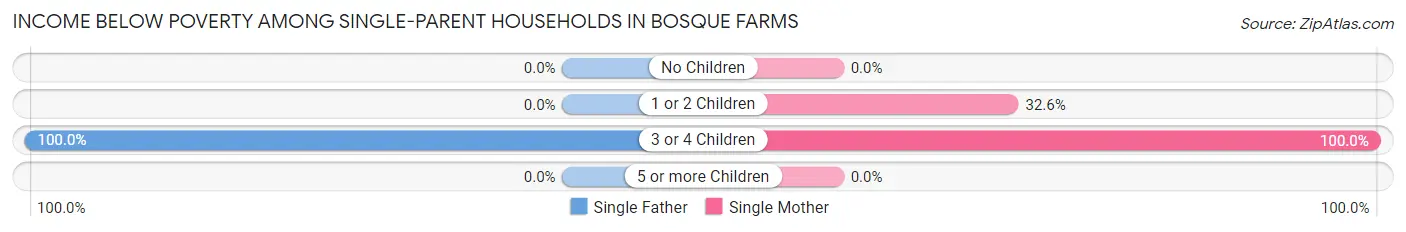
| Children | Single Father | Single Mother |
| No Children | 0 (0.0%) | 0 (0.0%) |
| 1 or 2 Children | 0 (0.0%) | 29 (32.6%) |
| 3 or 4 Children | 13 (100.0%) | 28 (100.0%) |
| 5 or more Children | 0 (0.0%) | 0 (0.0%) |
| Total | 13 (46.4%) | 57 (34.8%) |
Income Below Poverty Among Married-Couple vs Single-Parent Households in Bosque Farms
The poverty data for Bosque Farms shows that 20 of the married-couple family households (2.2%) and 70 of the single-parent households (36.5%) are living below the poverty level. Within the married-couple family households, those with 3 or 4 children have the highest poverty rate, with 20 households (100.0%) falling below the poverty line. Among the single-parent households, those with 3 or 4 children have the highest poverty rate, with 41 household (100.0%) living below poverty.
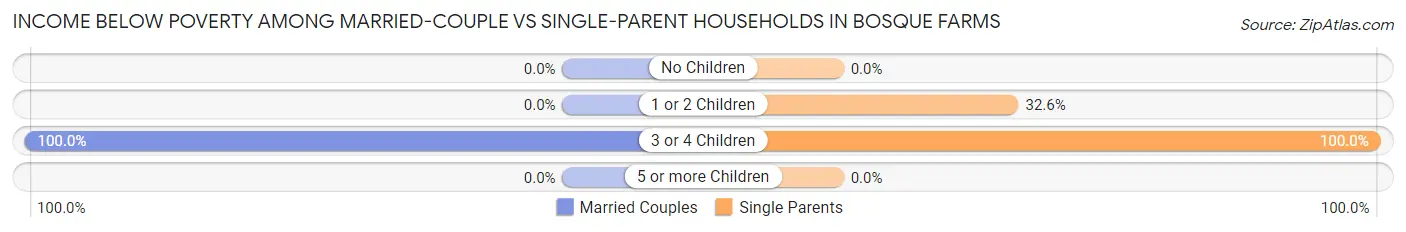
| Children | Married-Couple Families | Single-Parent Households |
| No Children | 0 (0.0%) | 0 (0.0%) |
| 1 or 2 Children | 0 (0.0%) | 29 (32.6%) |
| 3 or 4 Children | 20 (100.0%) | 41 (100.0%) |
| 5 or more Children | 0 (0.0%) | 0 (0.0%) |
| Total | 20 (2.2%) | 70 (36.5%) |
Race in Bosque Farms
The most populous races in Bosque Farms are White / Caucasian (2,922 | 73.0%), Hispanic or Latino (1,725 | 43.1%), and Two or more Races (495 | 12.4%).
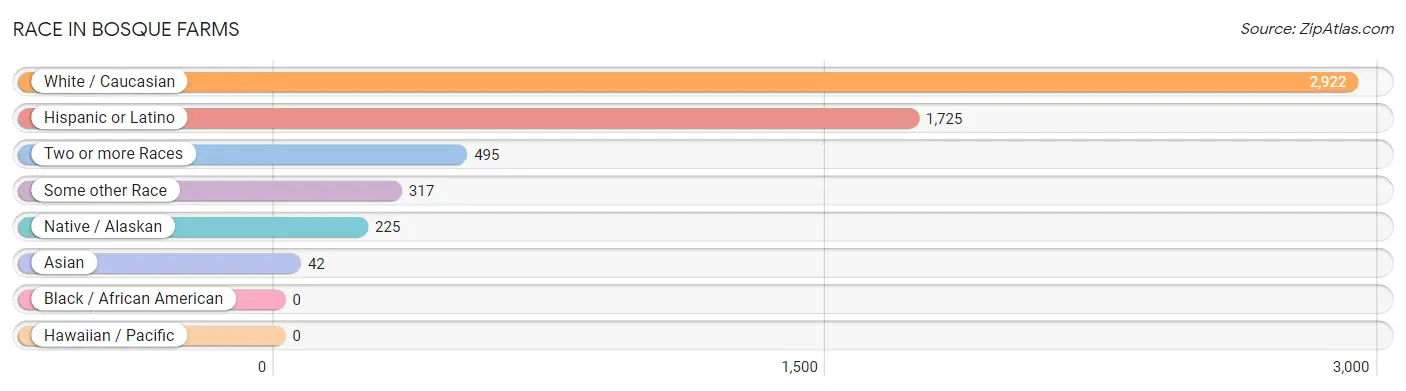
| Race | # Population | % Population |
| Asian | 42 | 1.1% |
| Black / African American | 0 | 0.0% |
| Hawaiian / Pacific | 0 | 0.0% |
| Hispanic or Latino | 1,725 | 43.1% |
| Native / Alaskan | 225 | 5.6% |
| White / Caucasian | 2,922 | 73.0% |
| Two or more Races | 495 | 12.4% |
| Some other Race | 317 | 7.9% |
| Total | 4,001 | 100.0% |
Ancestry in Bosque Farms
The most populous ancestries reported in Bosque Farms are Mexican (523 | 13.1%), Spaniard (432 | 10.8%), English (359 | 9.0%), German (341 | 8.5%), and Irish (259 | 6.5%), together accounting for 47.8% of all Bosque Farms residents.
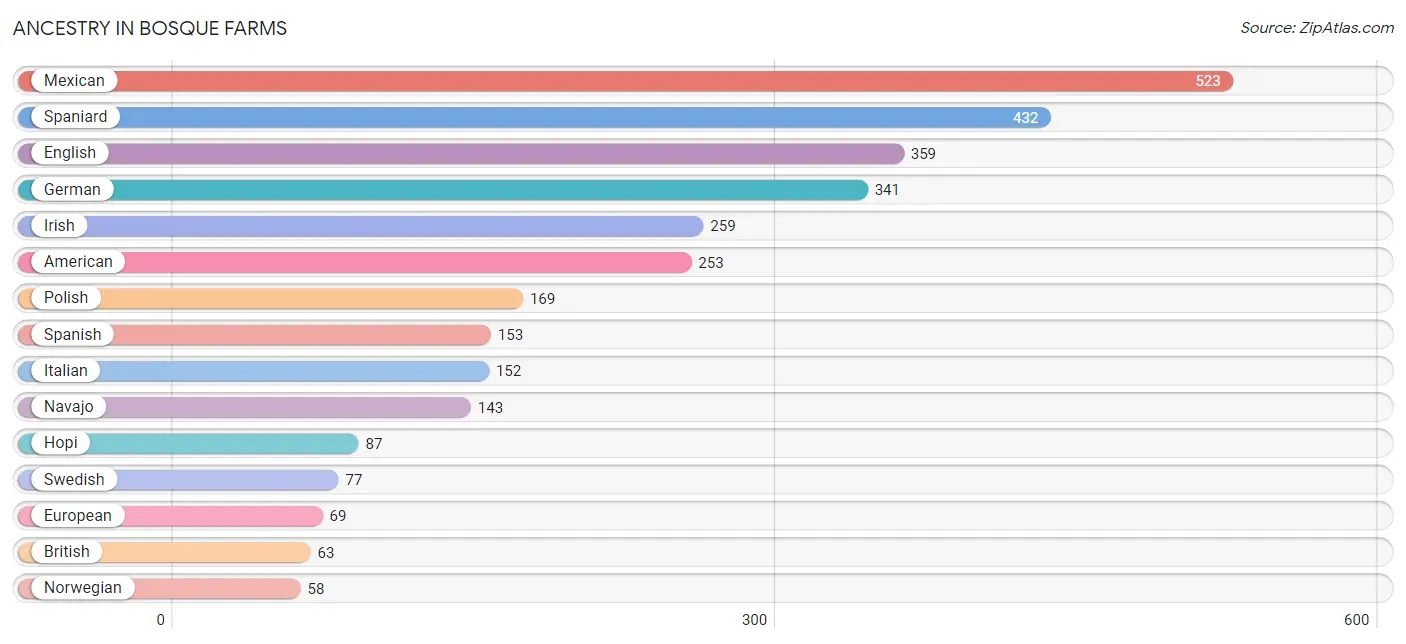
| Ancestry | # Population | % Population |
| American | 253 | 6.3% |
| Australian | 36 | 0.9% |
| Austrian | 16 | 0.4% |
| Belgian | 39 | 1.0% |
| British | 63 | 1.6% |
| Central American | 26 | 0.6% |
| Choctaw | 12 | 0.3% |
| Croatian | 8 | 0.2% |
| Cuban | 23 | 0.6% |
| Czech | 17 | 0.4% |
| Dutch | 20 | 0.5% |
| Eastern European | 5 | 0.1% |
| English | 359 | 9.0% |
| European | 69 | 1.7% |
| Finnish | 8 | 0.2% |
| French | 29 | 0.7% |
| French Canadian | 9 | 0.2% |
| German | 341 | 8.5% |
| Haitian | 18 | 0.4% |
| Hopi | 87 | 2.2% |
| Hungarian | 34 | 0.9% |
| Irish | 259 | 6.5% |
| Italian | 152 | 3.8% |
| Korean | 42 | 1.1% |
| Mexican | 523 | 13.1% |
| Navajo | 143 | 3.6% |
| Norwegian | 58 | 1.5% |
| Polish | 169 | 4.2% |
| Pueblo | 47 | 1.2% |
| Puerto Rican | 18 | 0.4% |
| Romanian | 56 | 1.4% |
| Russian | 51 | 1.3% |
| Salvadoran | 26 | 0.6% |
| Scandinavian | 36 | 0.9% |
| Scotch-Irish | 7 | 0.2% |
| Scottish | 49 | 1.2% |
| Spaniard | 432 | 10.8% |
| Spanish | 153 | 3.8% |
| Swedish | 77 | 1.9% |
| Swiss | 8 | 0.2% |
| Welsh | 14 | 0.4% | View All 41 Rows |
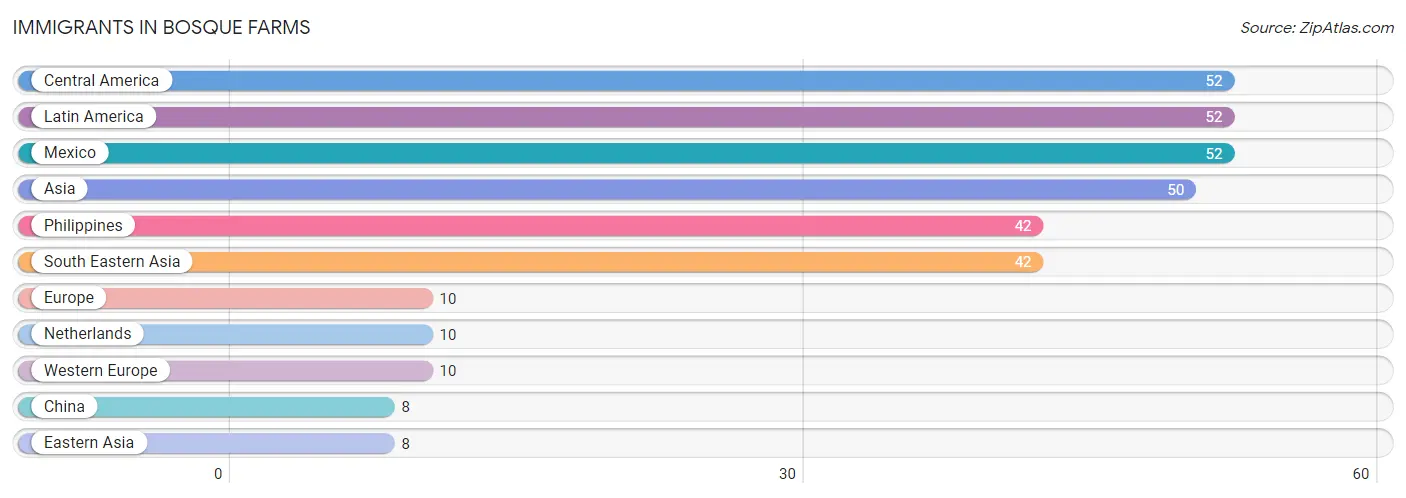
Immigrants in Bosque Farms
The most numerous immigrant groups reported in Bosque Farms came from Central America (52 | 1.3%), Latin America (52 | 1.3%), Mexico (52 | 1.3%), Asia (50 | 1.3%), and Philippines (42 | 1.1%), together accounting for 6.2% of all Bosque Farms residents.
| Immigration Origin | # Population | % Population |
| Asia | 50 | 1.3% |
| Central America | 52 | 1.3% |
| China | 8 | 0.2% |
| Eastern Asia | 8 | 0.2% |
| Europe | 10 | 0.3% |
| Latin America | 52 | 1.3% |
| Mexico | 52 | 1.3% |
| Netherlands | 10 | 0.3% |
| Philippines | 42 | 1.1% |
| South Eastern Asia | 42 | 1.1% |
| Western Europe | 10 | 0.3% | View All 11 Rows |
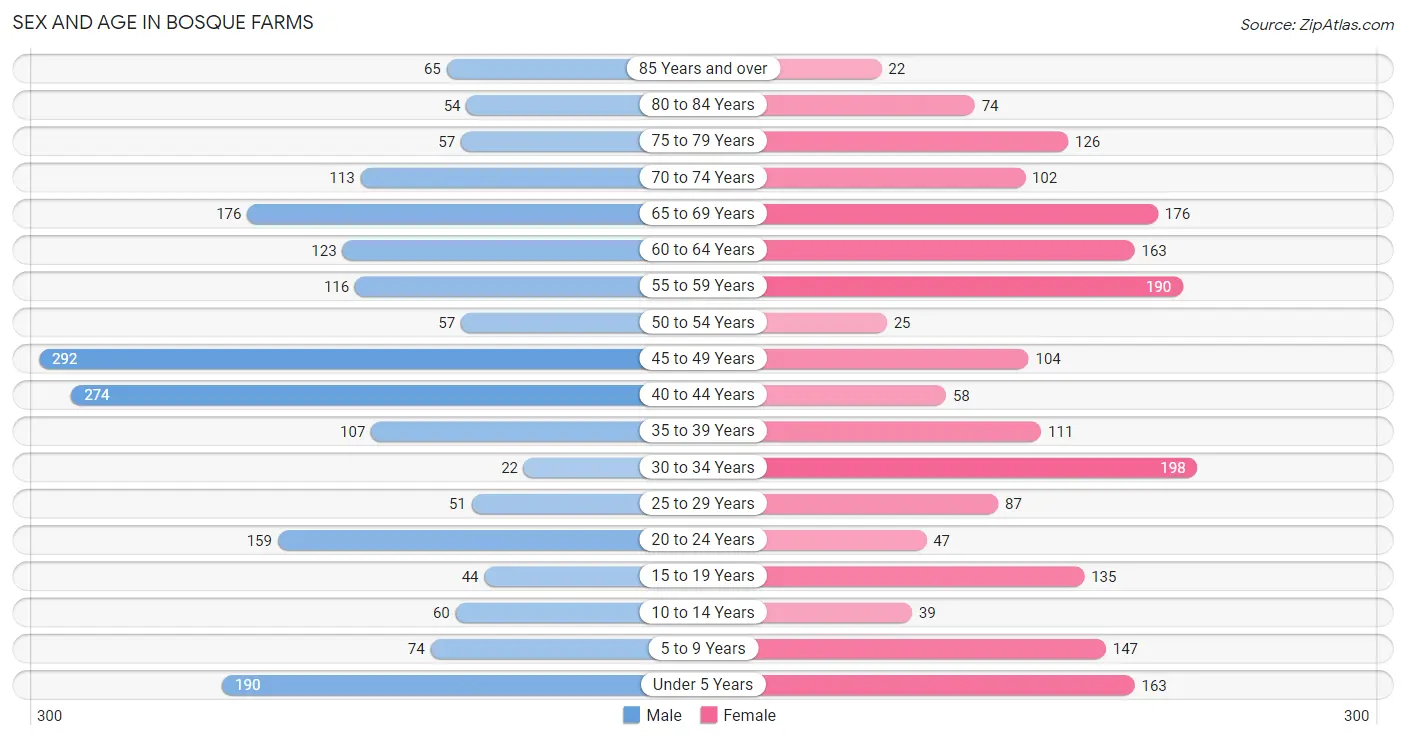
Sex and Age in Bosque Farms
Sex and Age in Bosque Farms
The most populous age groups in Bosque Farms are 45 to 49 Years (292 | 14.4%) for men and 30 to 34 Years (198 | 10.1%) for women.
| Age Bracket | Male | Female |
| Under 5 Years | 190 (9.3%) | 163 (8.3%) |
| 5 to 9 Years | 74 (3.6%) | 147 (7.5%) |
| 10 to 14 Years | 60 (2.9%) | 39 (2.0%) |
| 15 to 19 Years | 44 (2.2%) | 135 (6.9%) |
| 20 to 24 Years | 159 (7.8%) | 47 (2.4%) |
| 25 to 29 Years | 51 (2.5%) | 87 (4.4%) |
| 30 to 34 Years | 22 (1.1%) | 198 (10.1%) |
| 35 to 39 Years | 107 (5.3%) | 111 (5.6%) |
| 40 to 44 Years | 274 (13.5%) | 58 (2.9%) |
| 45 to 49 Years | 292 (14.4%) | 104 (5.3%) |
| 50 to 54 Years | 57 (2.8%) | 25 (1.3%) |
| 55 to 59 Years | 116 (5.7%) | 190 (9.7%) |
| 60 to 64 Years | 123 (6.0%) | 163 (8.3%) |
| 65 to 69 Years | 176 (8.6%) | 176 (8.9%) |
| 70 to 74 Years | 113 (5.6%) | 102 (5.2%) |
| 75 to 79 Years | 57 (2.8%) | 126 (6.4%) |
| 80 to 84 Years | 54 (2.6%) | 74 (3.8%) |
| 85 Years and over | 65 (3.2%) | 22 (1.1%) |
| Total | 2,034 (100.0%) | 1,967 (100.0%) |
Families and Households in Bosque Farms
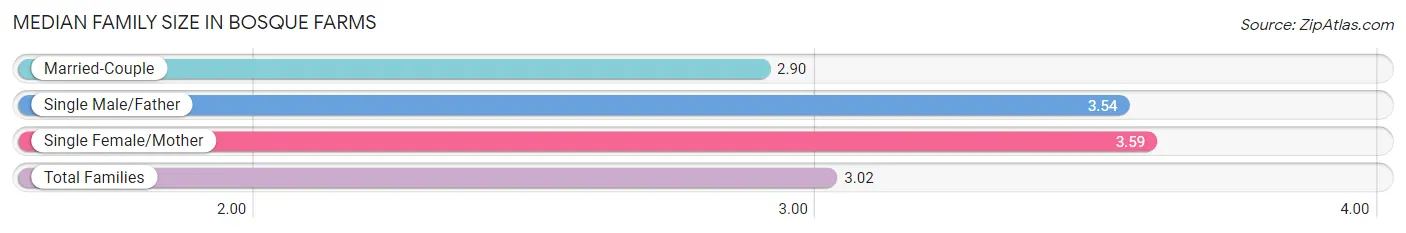
Median Family Size in Bosque Farms
The median family size in Bosque Farms is 3.02 persons per family, with single female/mother families (164 | 14.8%) accounting for the largest median family size of 3.59 persons per family. On the other hand, married-couple families (918 | 82.7%) represent the smallest median family size with 2.90 persons per family.
| Family Type | # Families | Family Size |
| Married-Couple | 918 (82.7%) | 2.90 |
| Single Male/Father | 28 (2.5%) | 3.54 |
| Single Female/Mother | 164 (14.8%) | 3.59 |
| Total Families | 1,110 (100.0%) | 3.02 |
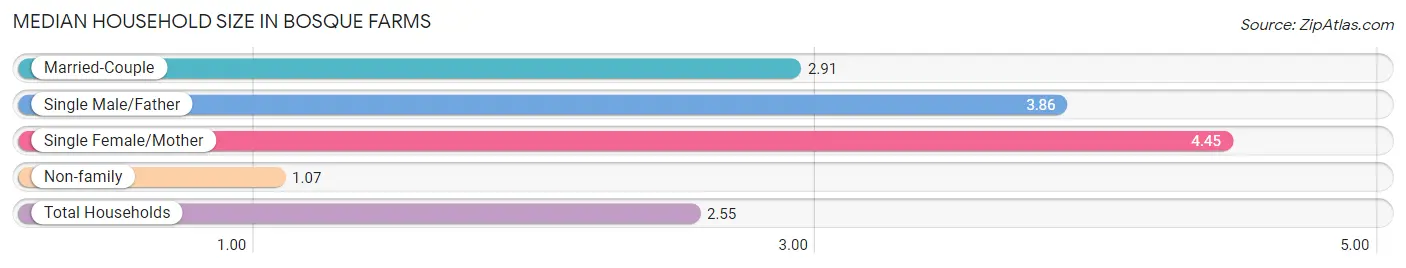
Median Household Size in Bosque Farms
The median household size in Bosque Farms is 2.55 persons per household, with single female/mother households (164 | 10.4%) accounting for the largest median household size of 4.45 persons per household. non-family households (459 | 29.2%) represent the smallest median household size with 1.07 persons per household.
| Household Type | # Households | Household Size |
| Married-Couple | 918 (58.5%) | 2.91 |
| Single Male/Father | 28 (1.8%) | 3.86 |
| Single Female/Mother | 164 (10.4%) | 4.45 |
| Non-family | 459 (29.2%) | 1.07 |
| Total Households | 1,569 (100.0%) | 2.55 |
Household Size by Marriage Status in Bosque Farms
Out of a total of 1,569 households in Bosque Farms, 1,110 (70.8%) are family households, while 459 (29.2%) are nonfamily households. The most numerous type of family households are 2-person households, comprising 540, and the most common type of nonfamily households are 1-person households, comprising 422.
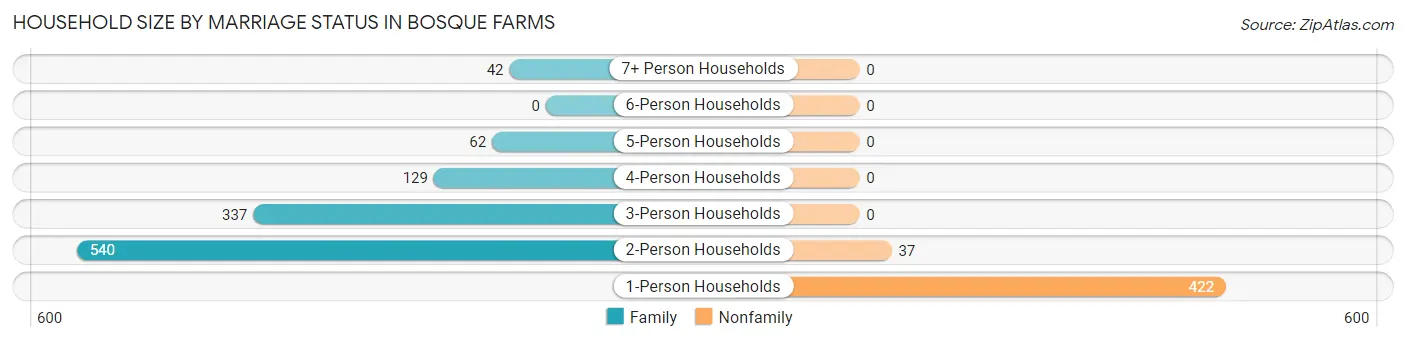
| Household Size | Family Households | Nonfamily Households |
| 1-Person Households | - | 422 (26.9%) |
| 2-Person Households | 540 (34.4%) | 37 (2.4%) |
| 3-Person Households | 337 (21.5%) | 0 (0.0%) |
| 4-Person Households | 129 (8.2%) | 0 (0.0%) |
| 5-Person Households | 62 (4.0%) | 0 (0.0%) |
| 6-Person Households | 0 (0.0%) | 0 (0.0%) |
| 7+ Person Households | 42 (2.7%) | 0 (0.0%) |
| Total | 1,110 (70.8%) | 459 (29.2%) |
Female Fertility in Bosque Farms
Fertility by Age in Bosque Farms
Average fertility rate in Bosque Farms is 73.0 births per 1,000 women. Women in the age bracket of 20 to 34 years have the highest fertility rate with 169.0 births per 1,000 women. Women in the age bracket of 20 to 34 years acount for 100.0% of all women with births.
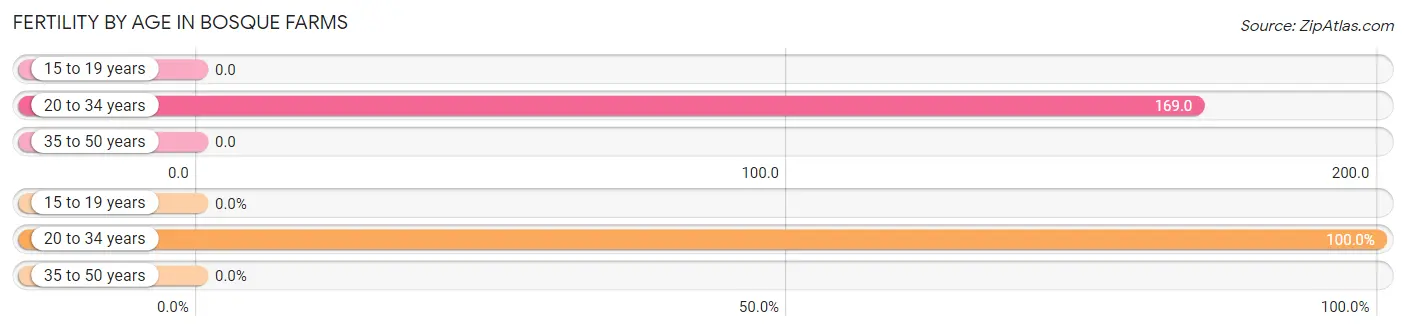
| Age Bracket | Women with Births | Births / 1,000 Women |
| 15 to 19 years | 0 (0.0%) | 0.0 |
| 20 to 34 years | 56 (100.0%) | 169.0 |
| 35 to 50 years | 0 (0.0%) | 0.0 |
| Total | 56 (100.0%) | 73.0 |
Fertility by Age by Marriage Status in Bosque Farms
50.0% of women with births (56) in Bosque Farms are married. The highest percentage of unmarried women with births falls into 20 to 34 years age bracket with 50.0% of them unmarried at the time of birth, while the lowest percentage of unmarried women with births belong to 20 to 34 years age bracket with 50.0% of them unmarried.
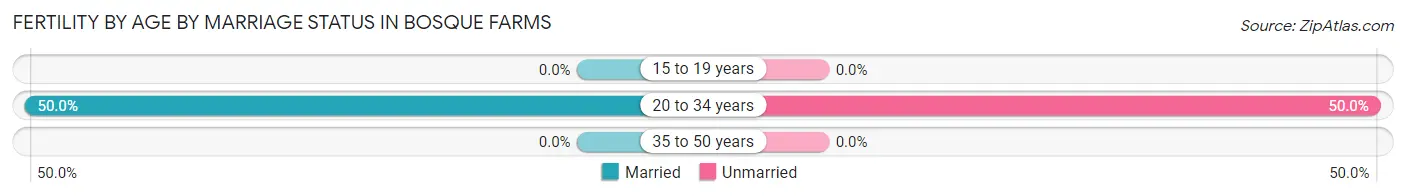
| Age Bracket | Married | Unmarried |
| 15 to 19 years | 0 (0.0%) | 0 (0.0%) |
| 20 to 34 years | 28 (50.0%) | 28 (50.0%) |
| 35 to 50 years | 0 (0.0%) | 0 (0.0%) |
| Total | 28 (50.0%) | 28 (50.0%) |
Fertility by Education in Bosque Farms
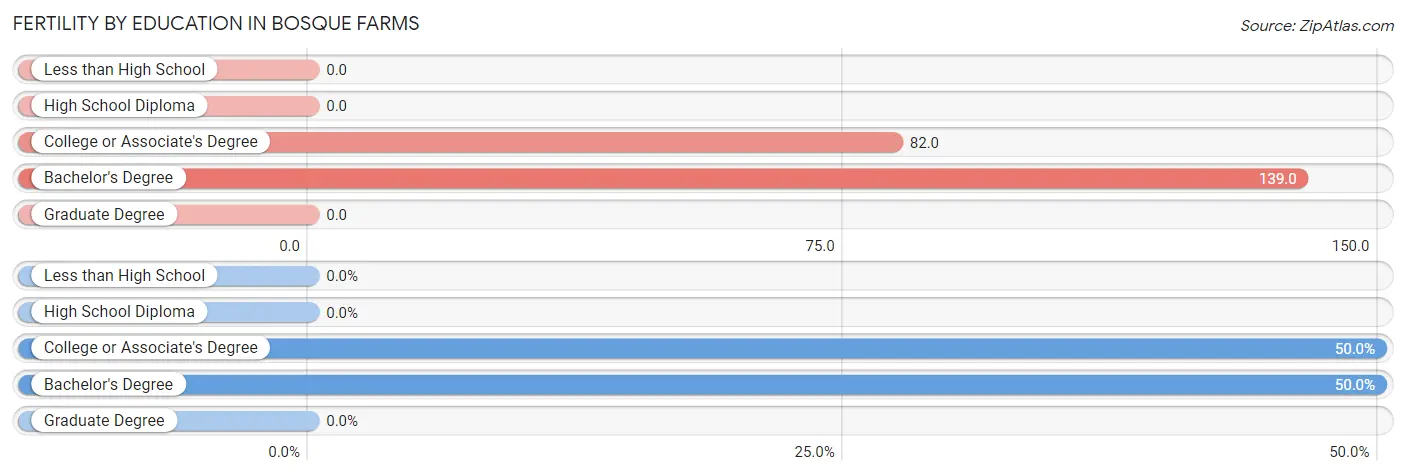
| Educational Attainment | Women with Births | Births / 1,000 Women |
| Less than High School | 0 (0.0%) | 0.0 |
| High School Diploma | 0 (0.0%) | 0.0 |
| College or Associate's Degree | 28 (50.0%) | 82.0 |
| Bachelor's Degree | 28 (50.0%) | 139.0 |
| Graduate Degree | 0 (0.0%) | 0.0 |
| Total | 56 (100.0%) | 73.0 |
Fertility by Education by Marriage Status in Bosque Farms
50.0% of women with births in Bosque Farms are unmarried. Women with the educational attainment of bachelor's degree are most likely to be married with 100.0% of them married at childbirth, while women with the educational attainment of college or associate's degree are least likely to be married with 100.0% of them unmarried at childbirth.
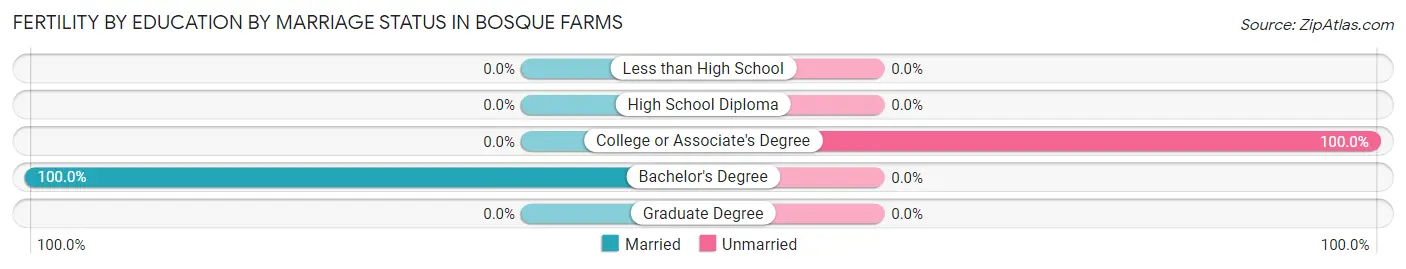
| Educational Attainment | Married | Unmarried |
| Less than High School | 0 (0.0%) | 0 (0.0%) |
| High School Diploma | 0 (0.0%) | 0 (0.0%) |
| College or Associate's Degree | 0 (0.0%) | 28 (100.0%) |
| Bachelor's Degree | 28 (100.0%) | 0 (0.0%) |
| Graduate Degree | 0 (0.0%) | 0 (0.0%) |
| Total | 28 (50.0%) | 28 (50.0%) |
Employment Characteristics in Bosque Farms
Employment by Class of Employer in Bosque Farms
Among the 1,741 employed individuals in Bosque Farms, private company employees (922 | 53.0%), federal government employees (281 | 16.1%), and local government employees (214 | 12.3%) make up the most common classes of employment.
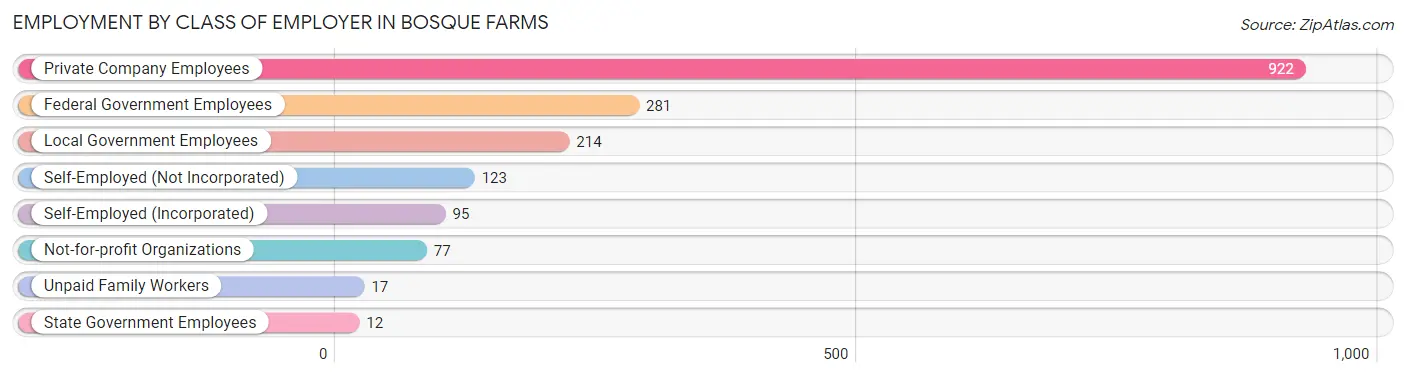
| Employer Class | # Employees | % Employees |
| Private Company Employees | 922 | 53.0% |
| Self-Employed (Incorporated) | 95 | 5.5% |
| Self-Employed (Not Incorporated) | 123 | 7.1% |
| Not-for-profit Organizations | 77 | 4.4% |
| Local Government Employees | 214 | 12.3% |
| State Government Employees | 12 | 0.7% |
| Federal Government Employees | 281 | 16.1% |
| Unpaid Family Workers | 17 | 1.0% |
| Total | 1,741 | 100.0% |
Employment Status by Age in Bosque Farms
According to the labor force statistics for Bosque Farms, out of the total population over 16 years of age (3,305), 55.8% or 1,844 individuals are in the labor force, with 3.4% or 63 of them unemployed. The age group with the highest labor force participation rate is 20 to 24 years, with 100.0% or 206 individuals in the labor force. Within the labor force, the 55 to 59 years age range has the highest percentage of unemployed individuals, with 13.8% or 38 of them being unemployed.
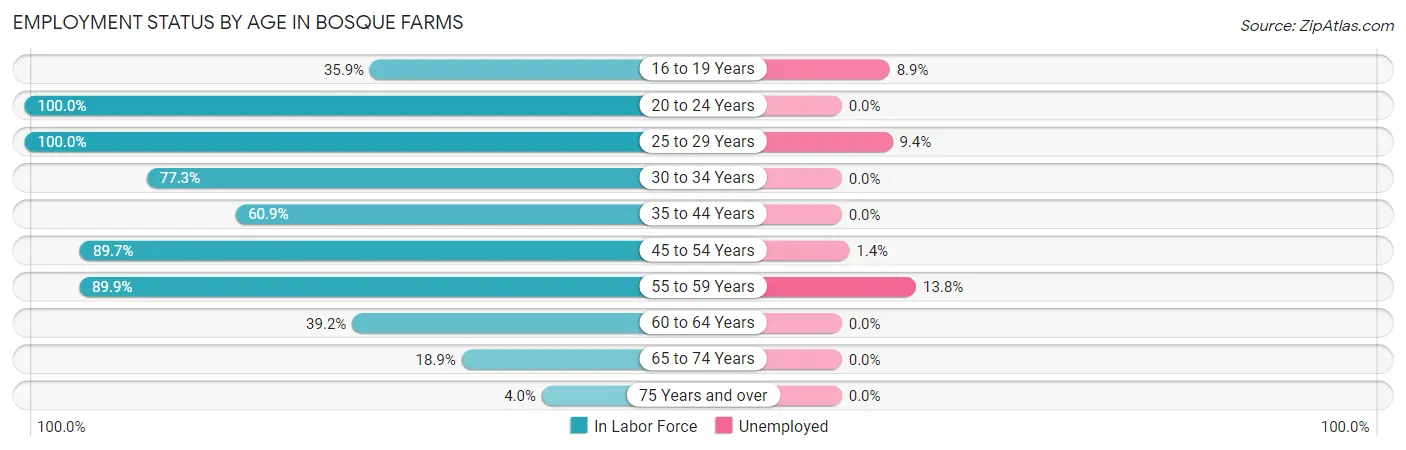
| Age Bracket | In Labor Force | Unemployed |
| 16 to 19 Years | 56 (35.9%) | 5 (8.9%) |
| 20 to 24 Years | 206 (100.0%) | 0 (0.0%) |
| 25 to 29 Years | 138 (100.0%) | 13 (9.4%) |
| 30 to 34 Years | 170 (77.3%) | 0 (0.0%) |
| 35 to 44 Years | 335 (60.9%) | 0 (0.0%) |
| 45 to 54 Years | 429 (89.7%) | 6 (1.4%) |
| 55 to 59 Years | 275 (89.9%) | 38 (13.8%) |
| 60 to 64 Years | 112 (39.2%) | 0 (0.0%) |
| 65 to 74 Years | 107 (18.9%) | 0 (0.0%) |
| 75 Years and over | 16 (4.0%) | 0 (0.0%) |
| Total | 1,844 (55.8%) | 63 (3.4%) |
Employment Status by Educational Attainment in Bosque Farms
According to labor force statistics for Bosque Farms, 73.8% of individuals (1,460) out of the total population between 25 and 64 years of age (1,978) are in the labor force, with 3.9% or 57 of them being unemployed. The group with the highest labor force participation rate are those with the educational attainment of bachelor's degree or higher, with 78.9% or 452 individuals in the labor force. Within the labor force, individuals with bachelor's degree or higher education have the highest percentage of unemployment, with 8.4% or 38 of them being unemployed.
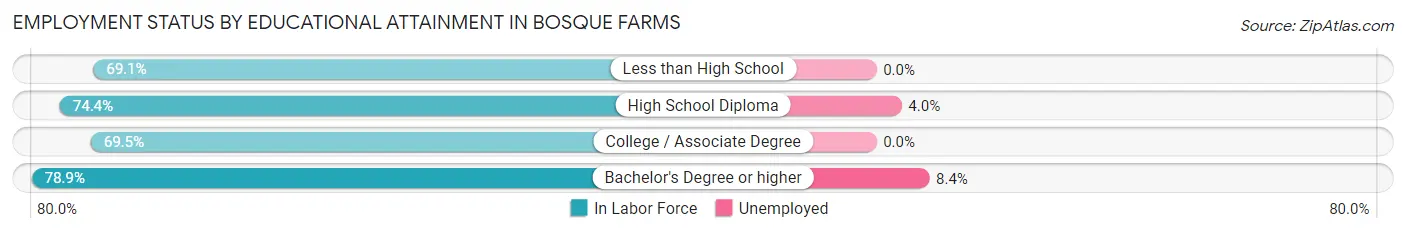
| Educational Attainment | In Labor Force | Unemployed |
| Less than High School | 67 (69.1%) | 0 (0.0%) |
| High School Diploma | 470 (74.4%) | 25 (4.0%) |
| College / Associate Degree | 470 (69.5%) | 0 (0.0%) |
| Bachelor's Degree or higher | 452 (78.9%) | 48 (8.4%) |
| Total | 1,460 (73.8%) | 77 (3.9%) |
Employment Occupations by Sex in Bosque Farms
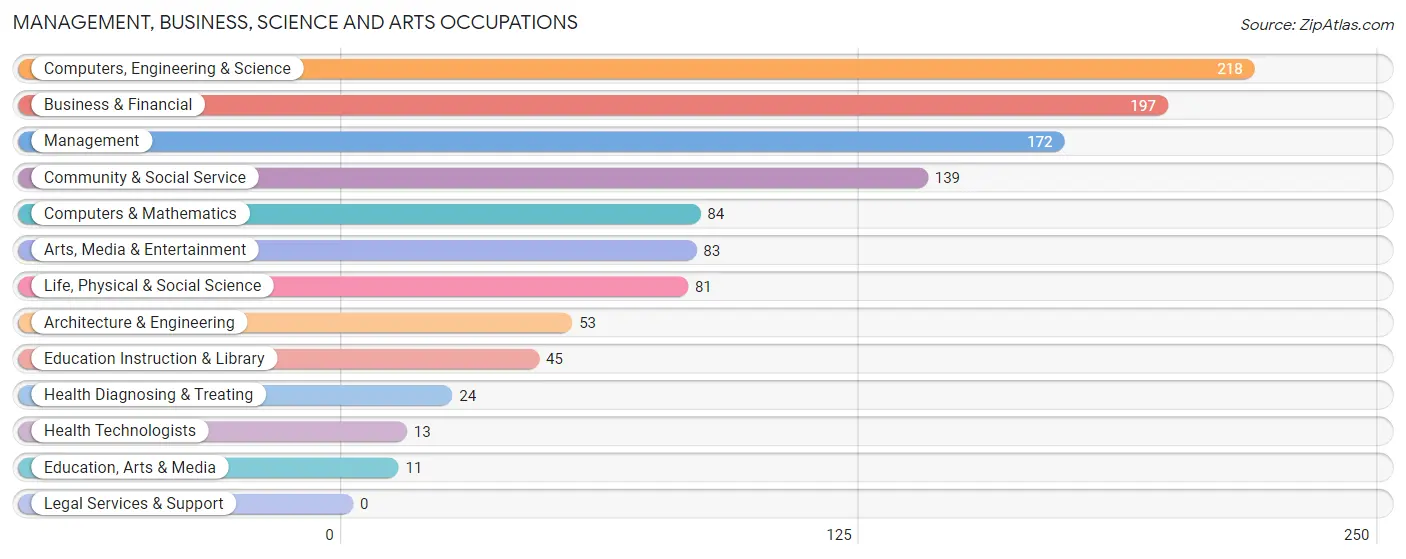
Management, Business, Science and Arts Occupations
The most common Management, Business, Science and Arts occupations in Bosque Farms are Computers, Engineering & Science (218 | 12.2%), Business & Financial (197 | 11.1%), Management (172 | 9.7%), Community & Social Service (139 | 7.8%), and Computers & Mathematics (84 | 4.7%).
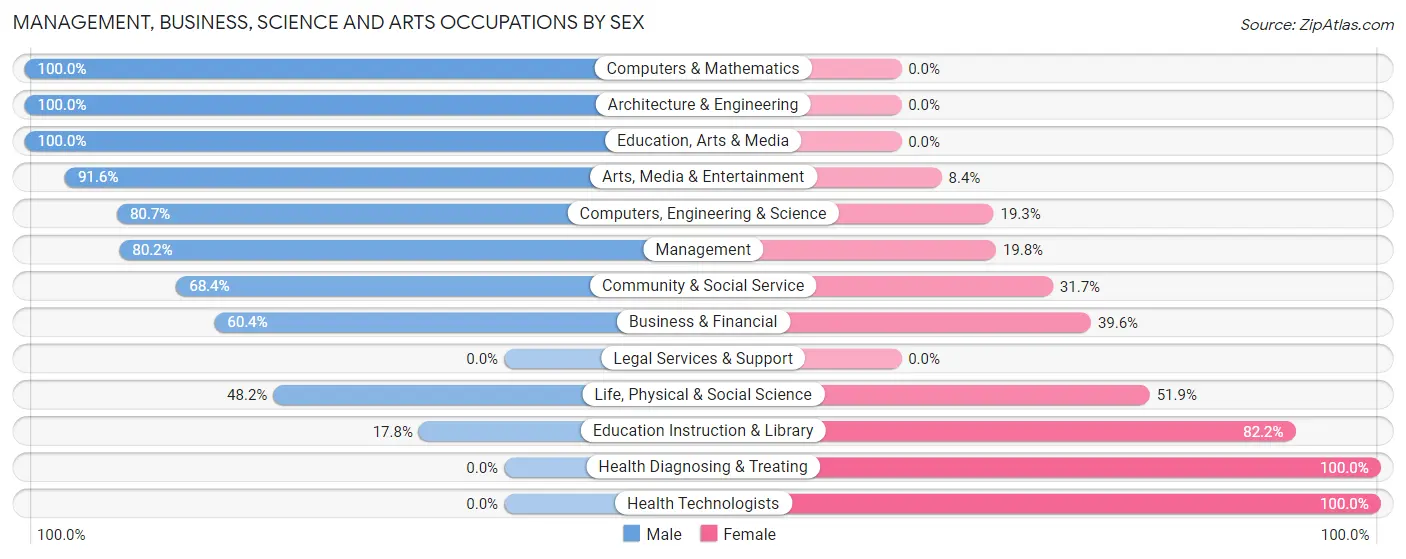
Management, Business, Science and Arts Occupations by Sex
Within the Management, Business, Science and Arts occupations in Bosque Farms, the most male-oriented occupations are Computers & Mathematics (100.0%), Architecture & Engineering (100.0%), and Education, Arts & Media (100.0%), while the most female-oriented occupations are Health Diagnosing & Treating (100.0%), Health Technologists (100.0%), and Education Instruction & Library (82.2%).
| Occupation | Male | Female |
| Management | 138 (80.2%) | 34 (19.8%) |
| Business & Financial | 119 (60.4%) | 78 (39.6%) |
| Computers, Engineering & Science | 176 (80.7%) | 42 (19.3%) |
| Computers & Mathematics | 84 (100.0%) | 0 (0.0%) |
| Architecture & Engineering | 53 (100.0%) | 0 (0.0%) |
| Life, Physical & Social Science | 39 (48.1%) | 42 (51.8%) |
| Community & Social Service | 95 (68.3%) | 44 (31.7%) |
| Education, Arts & Media | 11 (100.0%) | 0 (0.0%) |
| Legal Services & Support | 0 (0.0%) | 0 (0.0%) |
| Education Instruction & Library | 8 (17.8%) | 37 (82.2%) |
| Arts, Media & Entertainment | 76 (91.6%) | 7 (8.4%) |
| Health Diagnosing & Treating | 0 (0.0%) | 24 (100.0%) |
| Health Technologists | 0 (0.0%) | 13 (100.0%) |
| Total (Category) | 528 (70.4%) | 222 (29.6%) |
| Total (Overall) | 1,022 (57.4%) | 760 (42.6%) |
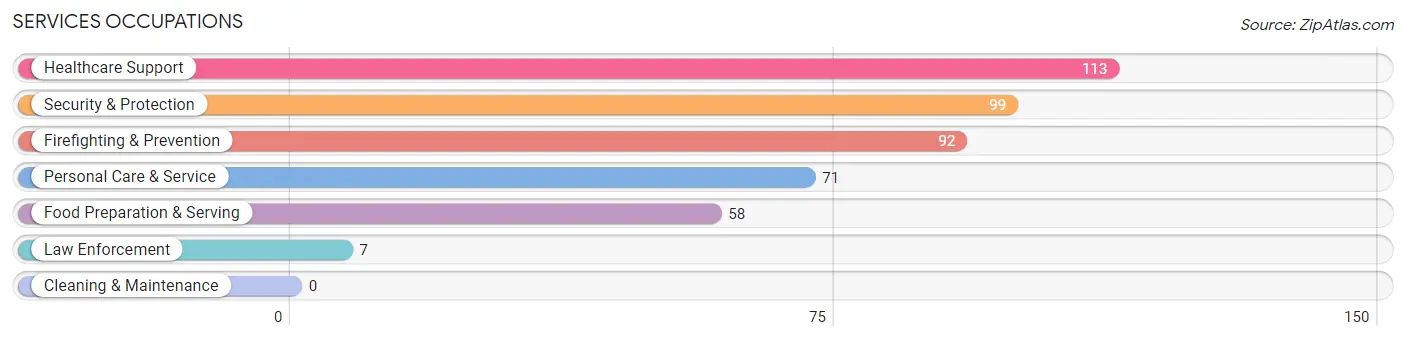
Services Occupations
The most common Services occupations in Bosque Farms are Healthcare Support (113 | 6.3%), Security & Protection (99 | 5.6%), Firefighting & Prevention (92 | 5.2%), Personal Care & Service (71 | 4.0%), and Food Preparation & Serving (58 | 3.3%).
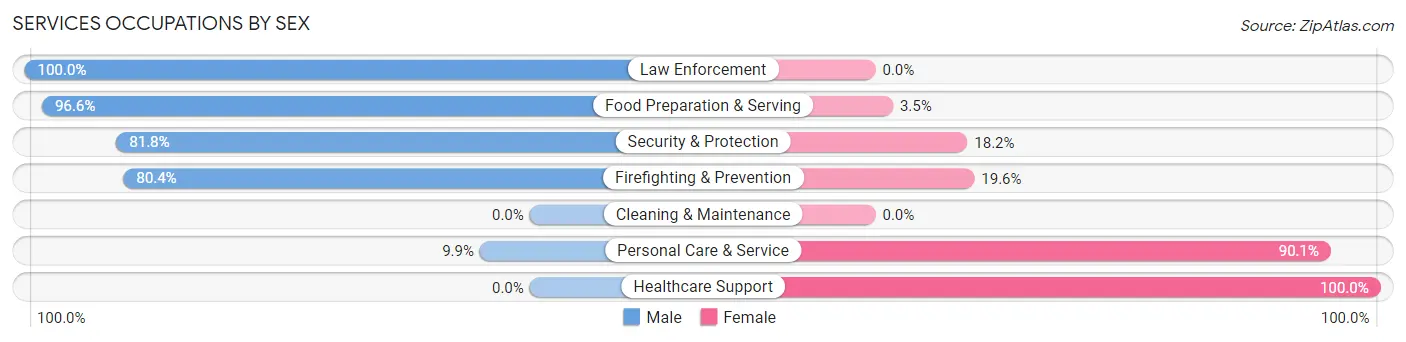
Services Occupations by Sex
Within the Services occupations in Bosque Farms, the most male-oriented occupations are Law Enforcement (100.0%), Food Preparation & Serving (96.6%), and Security & Protection (81.8%), while the most female-oriented occupations are Healthcare Support (100.0%), Personal Care & Service (90.1%), and Firefighting & Prevention (19.6%).
| Occupation | Male | Female |
| Healthcare Support | 0 (0.0%) | 113 (100.0%) |
| Security & Protection | 81 (81.8%) | 18 (18.2%) |
| Firefighting & Prevention | 74 (80.4%) | 18 (19.6%) |
| Law Enforcement | 7 (100.0%) | 0 (0.0%) |
| Food Preparation & Serving | 56 (96.6%) | 2 (3.5%) |
| Cleaning & Maintenance | 0 (0.0%) | 0 (0.0%) |
| Personal Care & Service | 7 (9.9%) | 64 (90.1%) |
| Total (Category) | 144 (42.2%) | 197 (57.8%) |
| Total (Overall) | 1,022 (57.4%) | 760 (42.6%) |
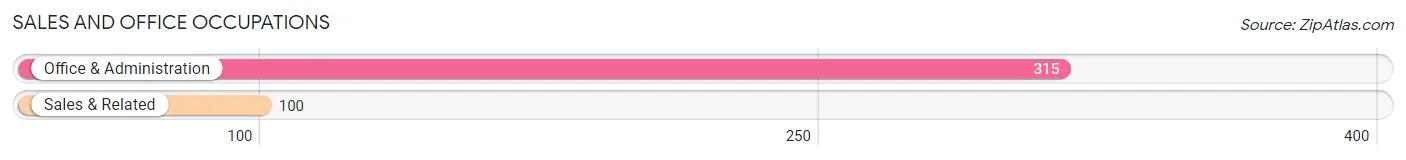
Sales and Office Occupations
The most common Sales and Office occupations in Bosque Farms are Office & Administration (315 | 17.7%), and Sales & Related (100 | 5.6%).
Sales and Office Occupations by Sex
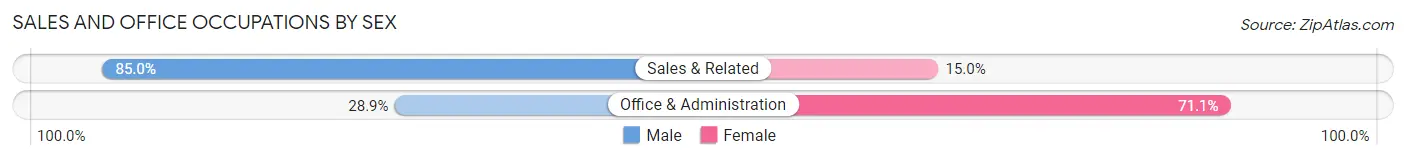
| Occupation | Male | Female |
| Sales & Related | 85 (85.0%) | 15 (15.0%) |
| Office & Administration | 91 (28.9%) | 224 (71.1%) |
| Total (Category) | 176 (42.4%) | 239 (57.6%) |
| Total (Overall) | 1,022 (57.4%) | 760 (42.6%) |
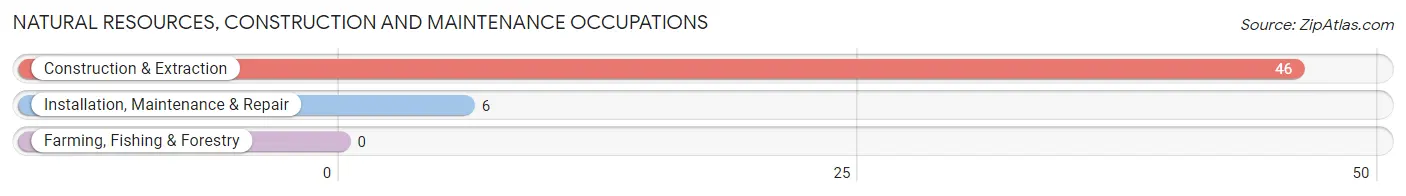
Natural Resources, Construction and Maintenance Occupations
The most common Natural Resources, Construction and Maintenance occupations in Bosque Farms are Construction & Extraction (46 | 2.6%), and Installation, Maintenance & Repair (6 | 0.3%).
Natural Resources, Construction and Maintenance Occupations by Sex
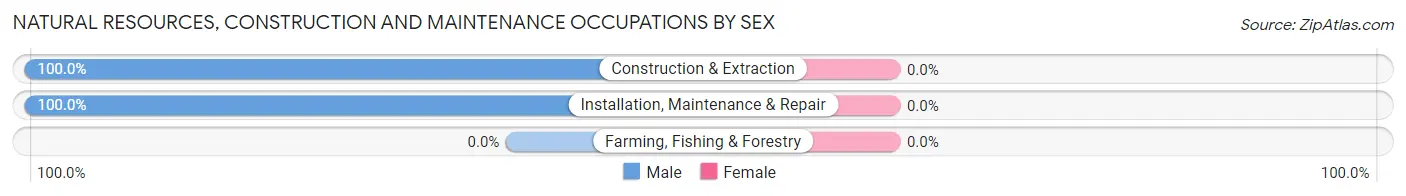
| Occupation | Male | Female |
| Farming, Fishing & Forestry | 0 (0.0%) | 0 (0.0%) |
| Construction & Extraction | 46 (100.0%) | 0 (0.0%) |
| Installation, Maintenance & Repair | 6 (100.0%) | 0 (0.0%) |
| Total (Category) | 52 (100.0%) | 0 (0.0%) |
| Total (Overall) | 1,022 (57.4%) | 760 (42.6%) |
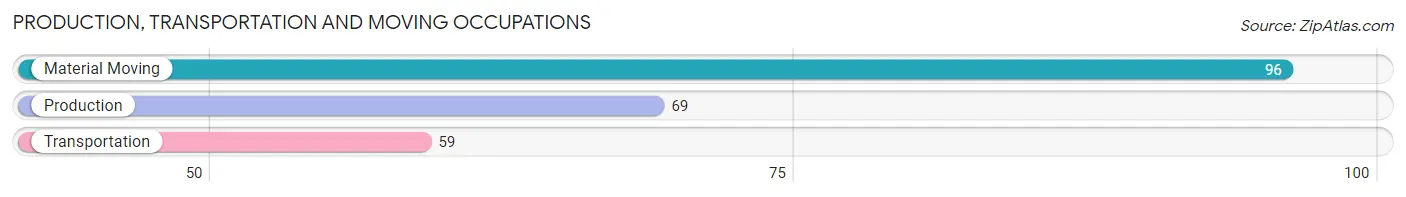
Production, Transportation and Moving Occupations
The most common Production, Transportation and Moving occupations in Bosque Farms are Material Moving (96 | 5.4%), Production (69 | 3.9%), and Transportation (59 | 3.3%).
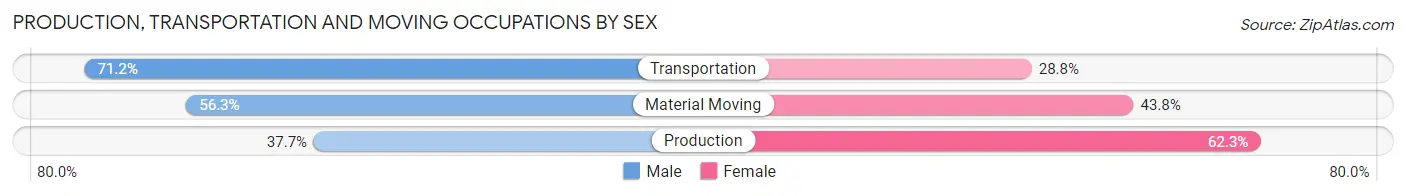
Production, Transportation and Moving Occupations by Sex
| Occupation | Male | Female |
| Production | 26 (37.7%) | 43 (62.3%) |
| Transportation | 42 (71.2%) | 17 (28.8%) |
| Material Moving | 54 (56.2%) | 42 (43.8%) |
| Total (Category) | 122 (54.5%) | 102 (45.5%) |
| Total (Overall) | 1,022 (57.4%) | 760 (42.6%) |
Employment Industries by Sex in Bosque Farms
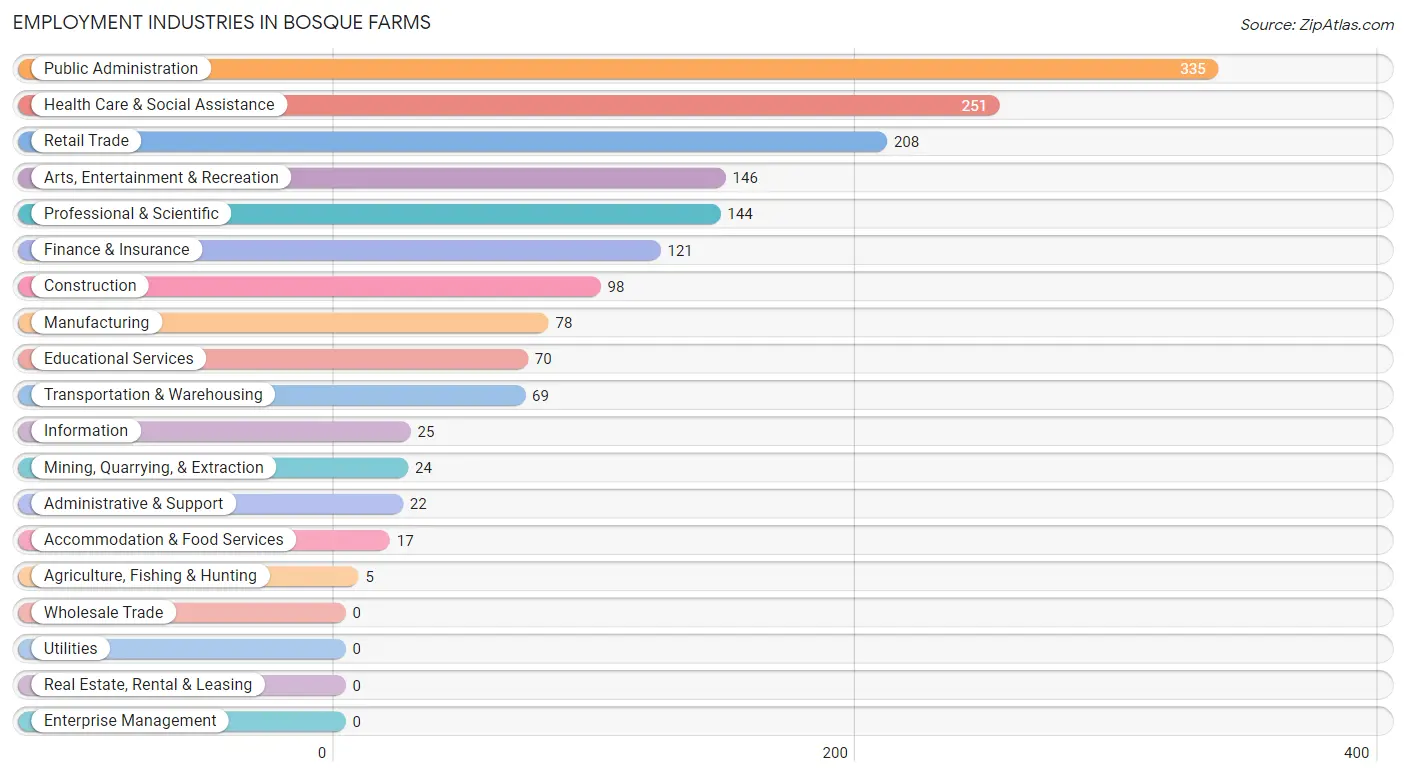
Employment Industries in Bosque Farms
The major employment industries in Bosque Farms include Public Administration (335 | 18.8%), Health Care & Social Assistance (251 | 14.1%), Retail Trade (208 | 11.7%), Arts, Entertainment & Recreation (146 | 8.2%), and Professional & Scientific (144 | 8.1%).
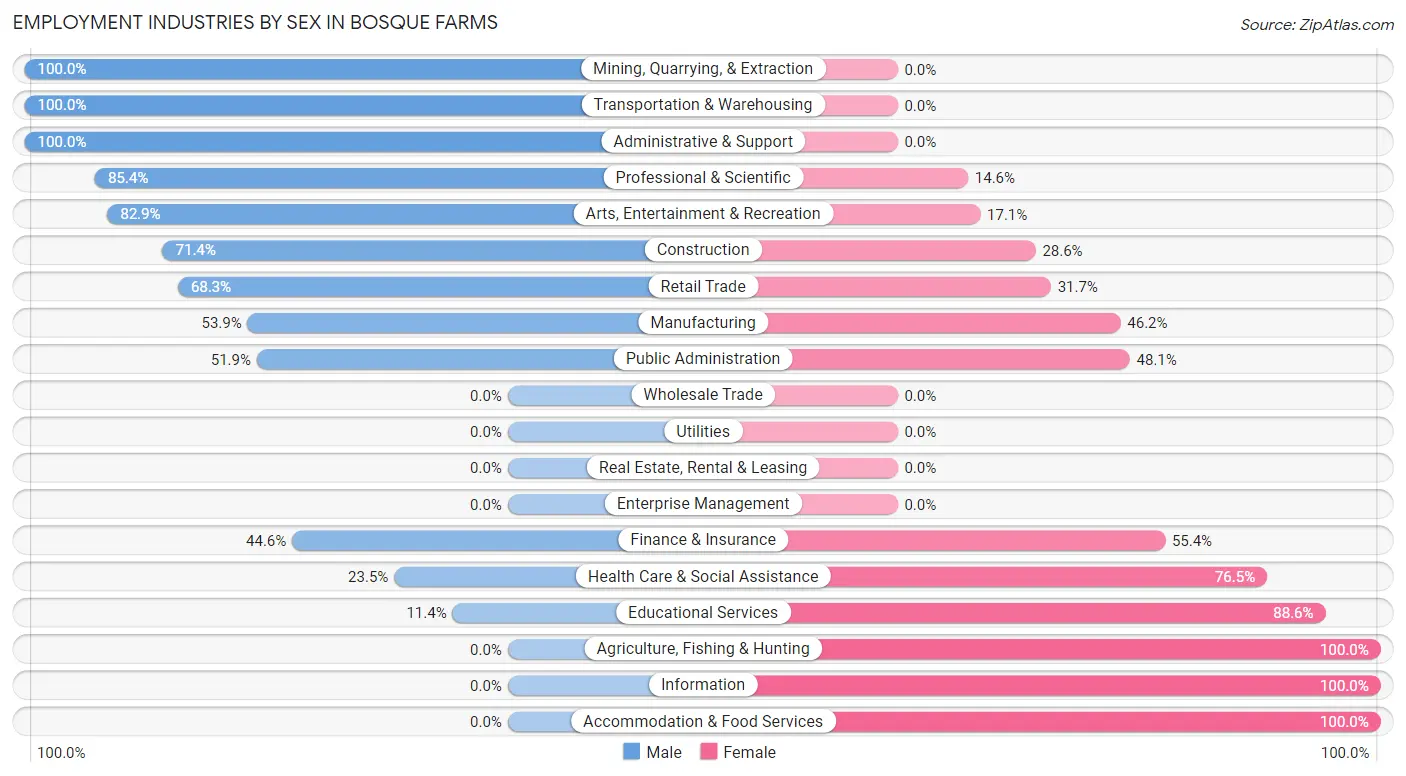
Employment Industries by Sex in Bosque Farms
The Bosque Farms industries that see more men than women are Mining, Quarrying, & Extraction (100.0%), Transportation & Warehousing (100.0%), and Administrative & Support (100.0%), whereas the industries that tend to have a higher number of women are Agriculture, Fishing & Hunting (100.0%), Information (100.0%), and Accommodation & Food Services (100.0%).
| Industry | Male | Female |
| Agriculture, Fishing & Hunting | 0 (0.0%) | 5 (100.0%) |
| Mining, Quarrying, & Extraction | 24 (100.0%) | 0 (0.0%) |
| Construction | 70 (71.4%) | 28 (28.6%) |
| Manufacturing | 42 (53.8%) | 36 (46.2%) |
| Wholesale Trade | 0 (0.0%) | 0 (0.0%) |
| Retail Trade | 142 (68.3%) | 66 (31.7%) |
| Transportation & Warehousing | 69 (100.0%) | 0 (0.0%) |
| Utilities | 0 (0.0%) | 0 (0.0%) |
| Information | 0 (0.0%) | 25 (100.0%) |
| Finance & Insurance | 54 (44.6%) | 67 (55.4%) |
| Real Estate, Rental & Leasing | 0 (0.0%) | 0 (0.0%) |
| Professional & Scientific | 123 (85.4%) | 21 (14.6%) |
| Enterprise Management | 0 (0.0%) | 0 (0.0%) |
| Administrative & Support | 22 (100.0%) | 0 (0.0%) |
| Educational Services | 8 (11.4%) | 62 (88.6%) |
| Health Care & Social Assistance | 59 (23.5%) | 192 (76.5%) |
| Arts, Entertainment & Recreation | 121 (82.9%) | 25 (17.1%) |
| Accommodation & Food Services | 0 (0.0%) | 17 (100.0%) |
| Public Administration | 174 (51.9%) | 161 (48.1%) |
| Total | 1,022 (57.4%) | 760 (42.6%) |
Education in Bosque Farms
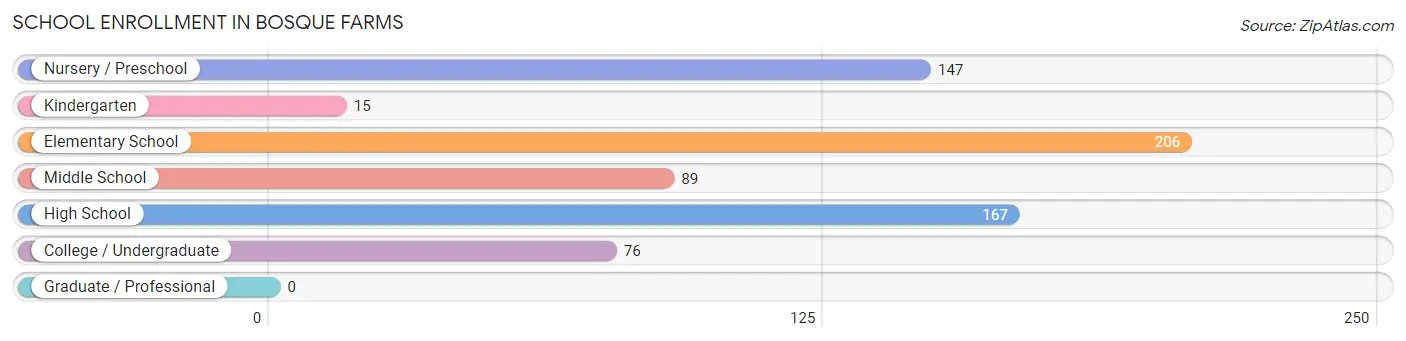
School Enrollment in Bosque Farms
The most common levels of schooling among the 700 students in Bosque Farms are elementary school (206 | 29.4%), high school (167 | 23.9%), and nursery / preschool (147 | 21.0%).
| School Level | # Students | % Students |
| Nursery / Preschool | 147 | 21.0% |
| Kindergarten | 15 | 2.1% |
| Elementary School | 206 | 29.4% |
| Middle School | 89 | 12.7% |
| High School | 167 | 23.9% |
| College / Undergraduate | 76 | 10.9% |
| Graduate / Professional | 0 | 0.0% |
| Total | 700 | 100.0% |
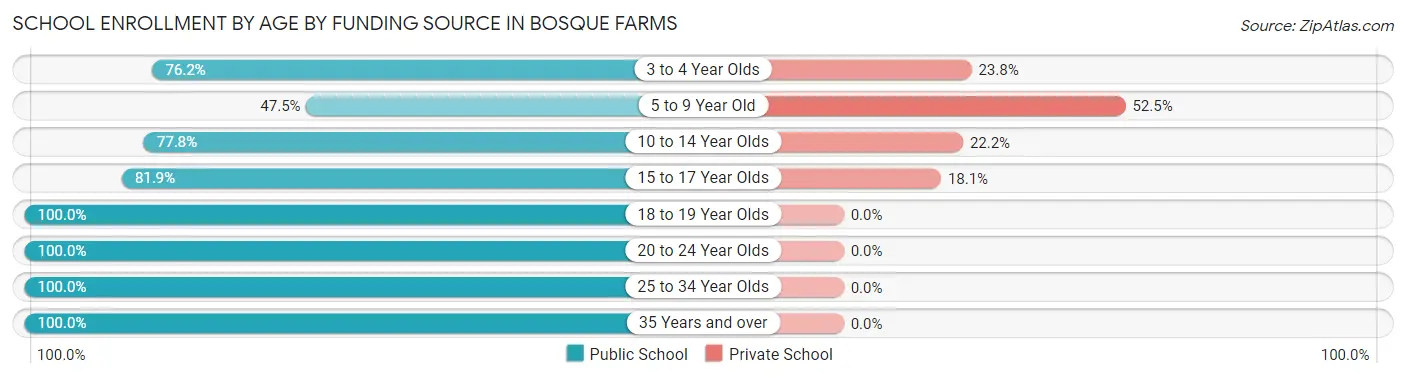
School Enrollment by Age by Funding Source in Bosque Farms
Out of a total of 700 students who are enrolled in schools in Bosque Farms, 198 (28.3%) attend a private institution, while the remaining 502 (71.7%) are enrolled in public schools. The age group of 5 to 9 year old has the highest likelihood of being enrolled in private schools, with 116 (52.5% in the age bracket) enrolled. Conversely, the age group of 18 to 19 year olds has the lowest likelihood of being enrolled in a private school, with 5 (100.0% in the age bracket) attending a public institution.
| Age Bracket | Public School | Private School |
| 3 to 4 Year Olds | 112 (76.2%) | 35 (23.8%) |
| 5 to 9 Year Old | 105 (47.5%) | 116 (52.5%) |
| 10 to 14 Year Olds | 77 (77.8%) | 22 (22.2%) |
| 15 to 17 Year Olds | 113 (81.9%) | 25 (18.1%) |
| 18 to 19 Year Olds | 5 (100.0%) | 0 (0.0%) |
| 20 to 24 Year Olds | 11 (100.0%) | 0 (0.0%) |
| 25 to 34 Year Olds | 32 (100.0%) | 0 (0.0%) |
| 35 Years and over | 47 (100.0%) | 0 (0.0%) |
| Total | 502 (71.7%) | 198 (28.3%) |
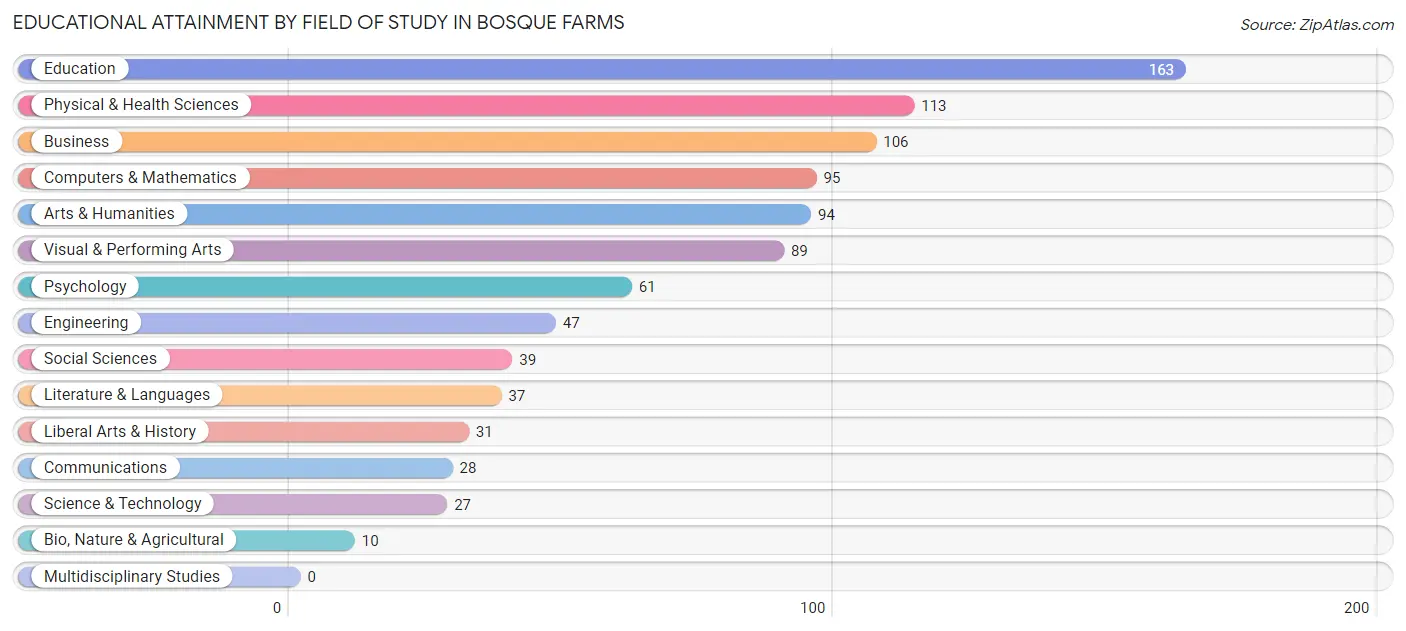
Educational Attainment by Field of Study in Bosque Farms
Education (163 | 17.3%), physical & health sciences (113 | 12.0%), business (106 | 11.3%), computers & mathematics (95 | 10.1%), and arts & humanities (94 | 10.0%) are the most common fields of study among 940 individuals in Bosque Farms who have obtained a bachelor's degree or higher.
| Field of Study | # Graduates | % Graduates |
| Computers & Mathematics | 95 | 10.1% |
| Bio, Nature & Agricultural | 10 | 1.1% |
| Physical & Health Sciences | 113 | 12.0% |
| Psychology | 61 | 6.5% |
| Social Sciences | 39 | 4.2% |
| Engineering | 47 | 5.0% |
| Multidisciplinary Studies | 0 | 0.0% |
| Science & Technology | 27 | 2.9% |
| Business | 106 | 11.3% |
| Education | 163 | 17.3% |
| Literature & Languages | 37 | 3.9% |
| Liberal Arts & History | 31 | 3.3% |
| Visual & Performing Arts | 89 | 9.5% |
| Communications | 28 | 3.0% |
| Arts & Humanities | 94 | 10.0% |
| Total | 940 | 100.0% |
Transportation & Commute in Bosque Farms
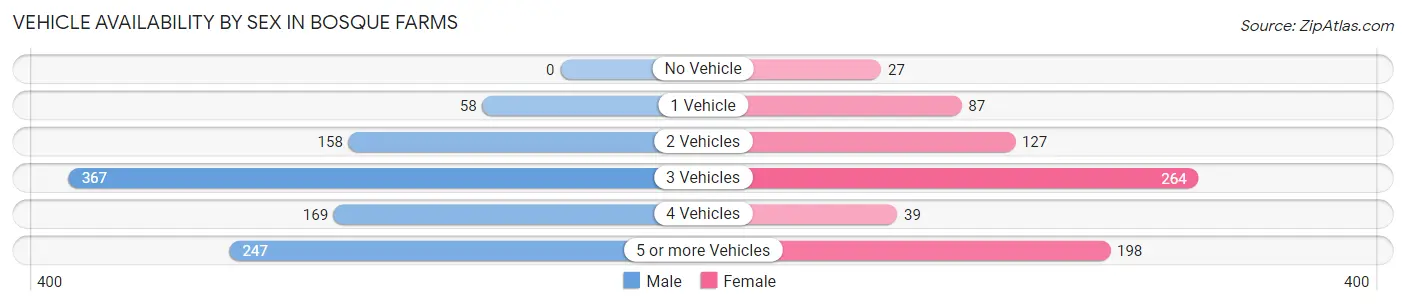
Vehicle Availability by Sex in Bosque Farms
The most prevalent vehicle ownership categories in Bosque Farms are males with 3 vehicles (367, accounting for 36.7%) and females with 3 vehicles (264, making up 49.5%).
| Vehicles Available | Male | Female |
| No Vehicle | 0 (0.0%) | 27 (3.6%) |
| 1 Vehicle | 58 (5.8%) | 87 (11.7%) |
| 2 Vehicles | 158 (15.8%) | 127 (17.1%) |
| 3 Vehicles | 367 (36.7%) | 264 (35.6%) |
| 4 Vehicles | 169 (16.9%) | 39 (5.3%) |
| 5 or more Vehicles | 247 (24.7%) | 198 (26.7%) |
| Total | 999 (100.0%) | 742 (100.0%) |
Commute Time in Bosque Farms
The most frequently occuring commute durations in Bosque Farms are 20 to 24 minutes (290 commuters, 20.8%), 30 to 34 minutes (225 commuters, 16.2%), and 45 to 59 minutes (203 commuters, 14.6%).
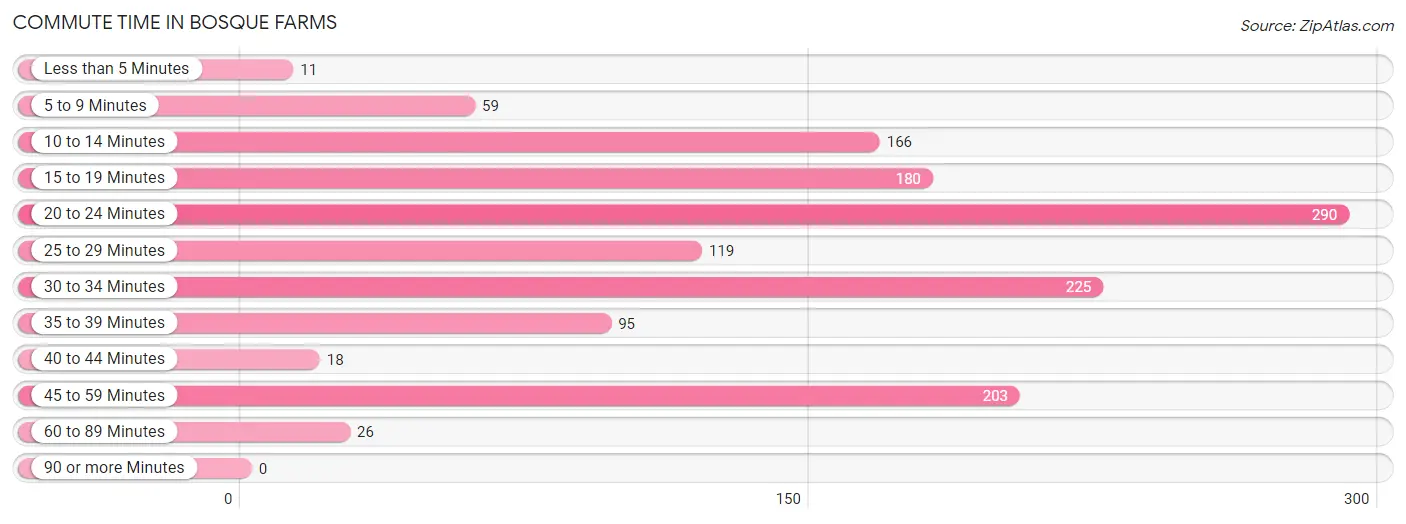
| Commute Time | # Commuters | % Commuters |
| Less than 5 Minutes | 11 | 0.8% |
| 5 to 9 Minutes | 59 | 4.2% |
| 10 to 14 Minutes | 166 | 11.9% |
| 15 to 19 Minutes | 180 | 12.9% |
| 20 to 24 Minutes | 290 | 20.8% |
| 25 to 29 Minutes | 119 | 8.6% |
| 30 to 34 Minutes | 225 | 16.2% |
| 35 to 39 Minutes | 95 | 6.8% |
| 40 to 44 Minutes | 18 | 1.3% |
| 45 to 59 Minutes | 203 | 14.6% |
| 60 to 89 Minutes | 26 | 1.9% |
| 90 or more Minutes | 0 | 0.0% |
Commute Time by Sex in Bosque Farms
The most common commute times in Bosque Farms are 20 to 24 minutes (198 commuters, 22.6%) for males and 45 to 59 minutes (127 commuters, 24.7%) for females.
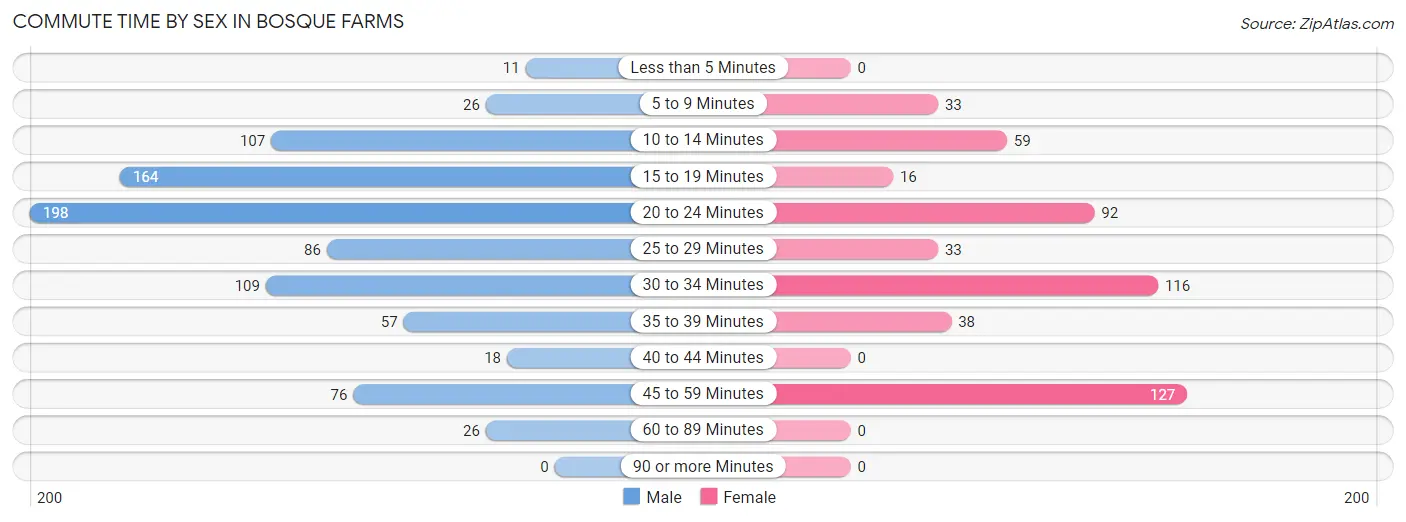
| Commute Time | Male | Female |
| Less than 5 Minutes | 11 (1.3%) | 0 (0.0%) |
| 5 to 9 Minutes | 26 (3.0%) | 33 (6.4%) |
| 10 to 14 Minutes | 107 (12.2%) | 59 (11.5%) |
| 15 to 19 Minutes | 164 (18.7%) | 16 (3.1%) |
| 20 to 24 Minutes | 198 (22.6%) | 92 (17.9%) |
| 25 to 29 Minutes | 86 (9.8%) | 33 (6.4%) |
| 30 to 34 Minutes | 109 (12.4%) | 116 (22.6%) |
| 35 to 39 Minutes | 57 (6.5%) | 38 (7.4%) |
| 40 to 44 Minutes | 18 (2.1%) | 0 (0.0%) |
| 45 to 59 Minutes | 76 (8.7%) | 127 (24.7%) |
| 60 to 89 Minutes | 26 (3.0%) | 0 (0.0%) |
| 90 or more Minutes | 0 (0.0%) | 0 (0.0%) |
Time of Departure to Work by Sex in Bosque Farms
The most frequent times of departure to work in Bosque Farms are 6:00 AM to 6:29 AM (322, 36.7%) for males and 7:30 AM to 7:59 AM (133, 25.9%) for females.
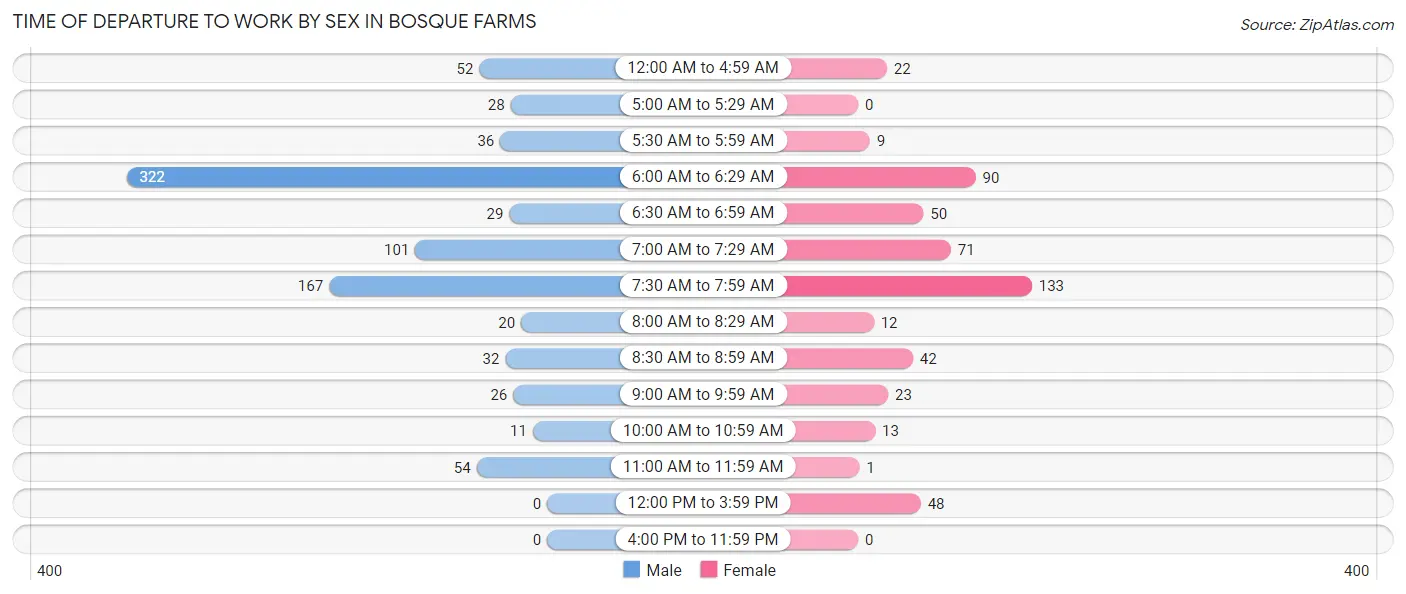
| Time of Departure | Male | Female |
| 12:00 AM to 4:59 AM | 52 (5.9%) | 22 (4.3%) |
| 5:00 AM to 5:29 AM | 28 (3.2%) | 0 (0.0%) |
| 5:30 AM to 5:59 AM | 36 (4.1%) | 9 (1.8%) |
| 6:00 AM to 6:29 AM | 322 (36.7%) | 90 (17.5%) |
| 6:30 AM to 6:59 AM | 29 (3.3%) | 50 (9.7%) |
| 7:00 AM to 7:29 AM | 101 (11.5%) | 71 (13.8%) |
| 7:30 AM to 7:59 AM | 167 (19.0%) | 133 (25.9%) |
| 8:00 AM to 8:29 AM | 20 (2.3%) | 12 (2.3%) |
| 8:30 AM to 8:59 AM | 32 (3.6%) | 42 (8.2%) |
| 9:00 AM to 9:59 AM | 26 (3.0%) | 23 (4.5%) |
| 10:00 AM to 10:59 AM | 11 (1.3%) | 13 (2.5%) |
| 11:00 AM to 11:59 AM | 54 (6.1%) | 1 (0.2%) |
| 12:00 PM to 3:59 PM | 0 (0.0%) | 48 (9.3%) |
| 4:00 PM to 11:59 PM | 0 (0.0%) | 0 (0.0%) |
| Total | 878 (100.0%) | 514 (100.0%) |
Housing Occupancy in Bosque Farms
Occupancy by Ownership in Bosque Farms
Of the total 1,569 dwellings in Bosque Farms, owner-occupied units account for 1,426 (90.9%), while renter-occupied units make up 143 (9.1%).
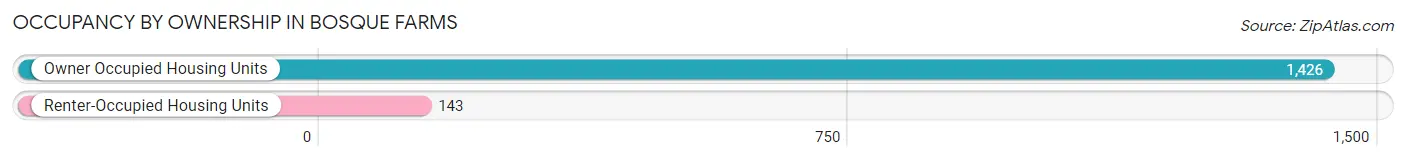
| Occupancy | # Housing Units | % Housing Units |
| Owner Occupied Housing Units | 1,426 | 90.9% |
| Renter-Occupied Housing Units | 143 | 9.1% |
| Total Occupied Housing Units | 1,569 | 100.0% |
Occupancy by Household Size in Bosque Farms
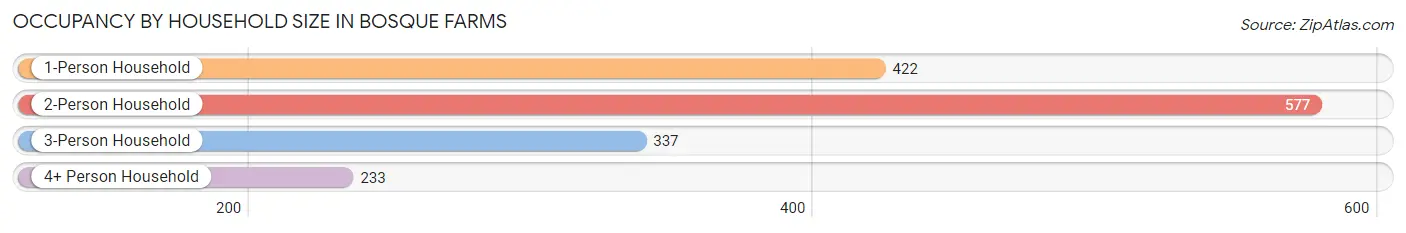
| Household Size | # Housing Units | % Housing Units |
| 1-Person Household | 422 | 26.9% |
| 2-Person Household | 577 | 36.8% |
| 3-Person Household | 337 | 21.5% |
| 4+ Person Household | 233 | 14.8% |
| Total Housing Units | 1,569 | 100.0% |
Occupancy by Ownership by Household Size in Bosque Farms
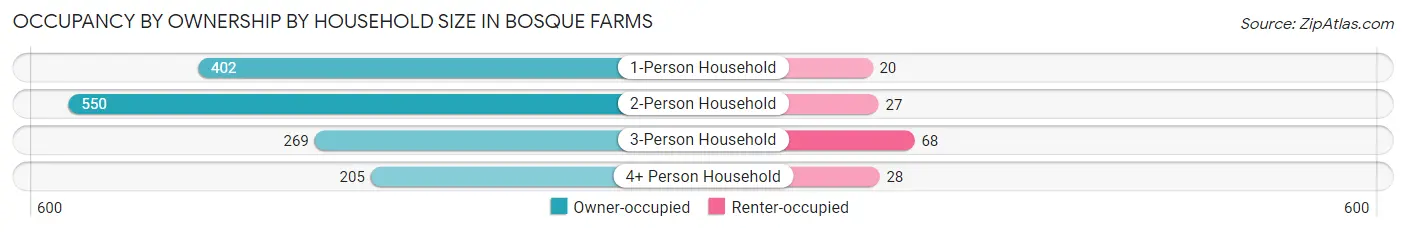
| Household Size | Owner-occupied | Renter-occupied |
| 1-Person Household | 402 (95.3%) | 20 (4.7%) |
| 2-Person Household | 550 (95.3%) | 27 (4.7%) |
| 3-Person Household | 269 (79.8%) | 68 (20.2%) |
| 4+ Person Household | 205 (88.0%) | 28 (12.0%) |
| Total Housing Units | 1,426 (90.9%) | 143 (9.1%) |
Occupancy by Educational Attainment in Bosque Farms
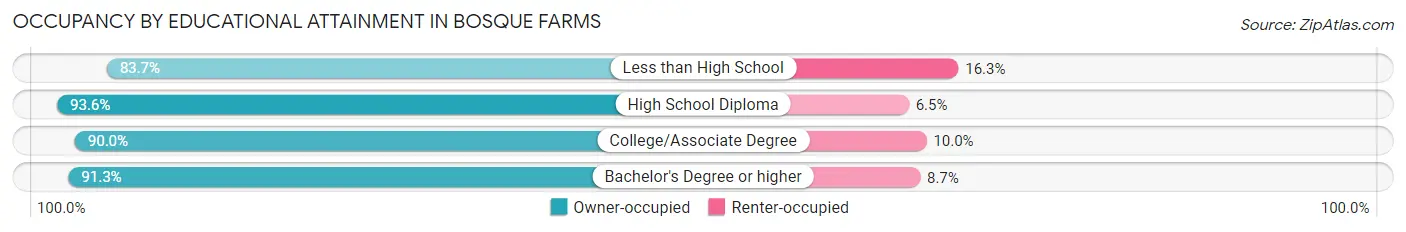
| Household Size | Owner-occupied | Renter-occupied |
| Less than High School | 72 (83.7%) | 14 (16.3%) |
| High School Diploma | 348 (93.5%) | 24 (6.5%) |
| College/Associate Degree | 596 (90.0%) | 66 (10.0%) |
| Bachelor's Degree or higher | 410 (91.3%) | 39 (8.7%) |
Occupancy by Age of Householder in Bosque Farms
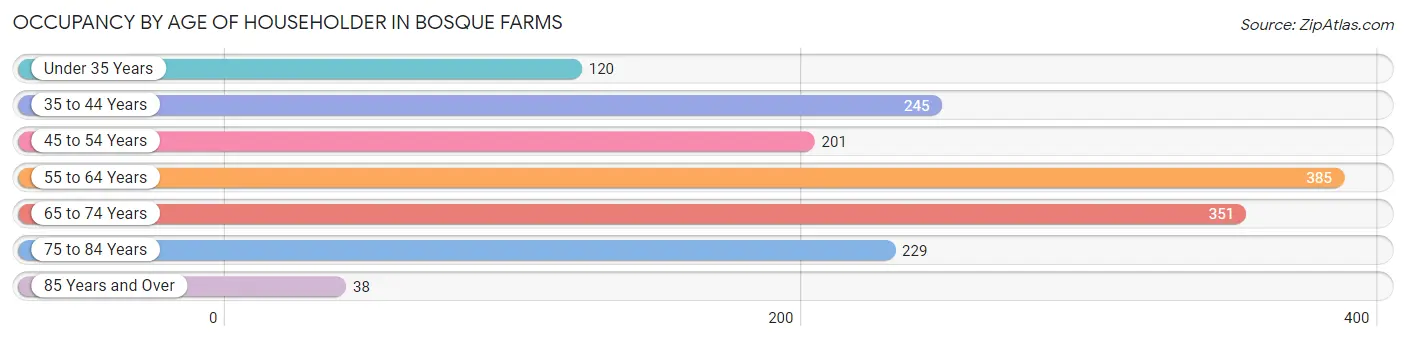
| Age Bracket | # Households | % Households |
| Under 35 Years | 120 | 7.6% |
| 35 to 44 Years | 245 | 15.6% |
| 45 to 54 Years | 201 | 12.8% |
| 55 to 64 Years | 385 | 24.5% |
| 65 to 74 Years | 351 | 22.4% |
| 75 to 84 Years | 229 | 14.6% |
| 85 Years and Over | 38 | 2.4% |
| Total | 1,569 | 100.0% |
Housing Finances in Bosque Farms
Median Income by Occupancy in Bosque Farms
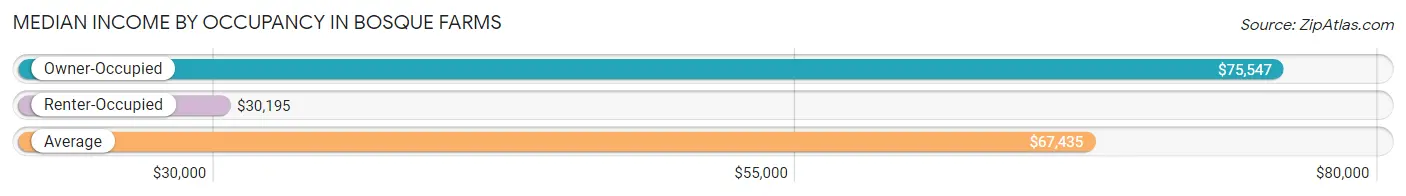
| Occupancy Type | # Households | Median Income |
| Owner-Occupied | 1,426 (90.9%) | $75,547 |
| Renter-Occupied | 143 (9.1%) | $30,195 |
| Average | 1,569 (100.0%) | $67,435 |
Occupancy by Householder Income Bracket in Bosque Farms
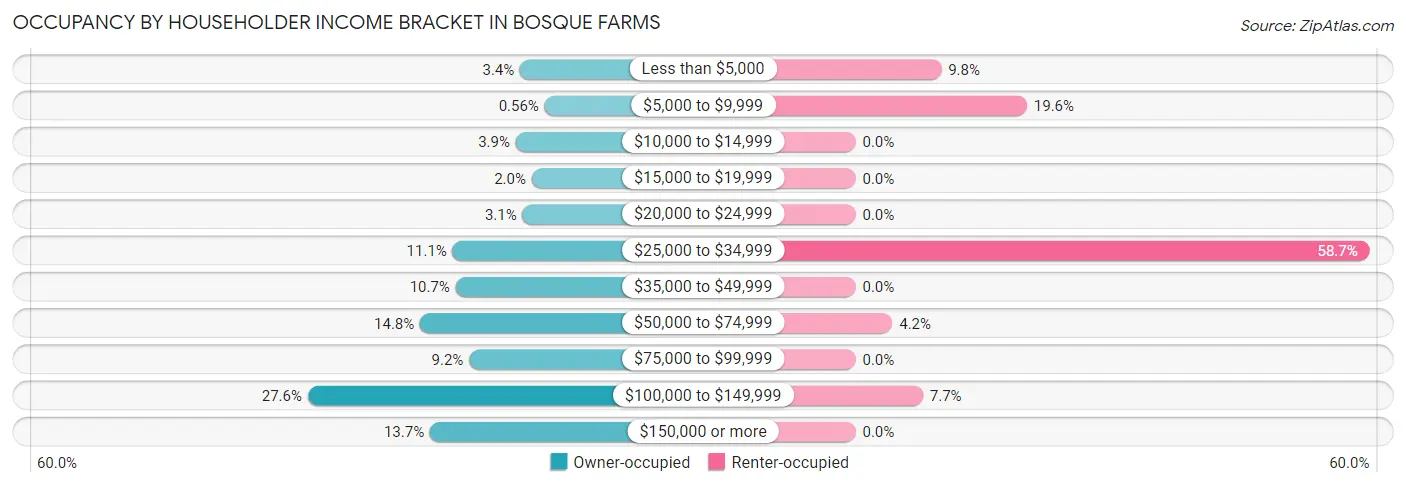
| Income Bracket | Owner-occupied | Renter-occupied |
| Less than $5,000 | 48 (3.4%) | 14 (9.8%) |
| $5,000 to $9,999 | 8 (0.6%) | 28 (19.6%) |
| $10,000 to $14,999 | 55 (3.9%) | 0 (0.0%) |
| $15,000 to $19,999 | 29 (2.0%) | 0 (0.0%) |
| $20,000 to $24,999 | 44 (3.1%) | 0 (0.0%) |
| $25,000 to $34,999 | 158 (11.1%) | 84 (58.7%) |
| $35,000 to $49,999 | 153 (10.7%) | 0 (0.0%) |
| $50,000 to $74,999 | 211 (14.8%) | 6 (4.2%) |
| $75,000 to $99,999 | 131 (9.2%) | 0 (0.0%) |
| $100,000 to $149,999 | 394 (27.6%) | 11 (7.7%) |
| $150,000 or more | 195 (13.7%) | 0 (0.0%) |
| Total | 1,426 (100.0%) | 143 (100.0%) |
Monthly Housing Cost Tiers in Bosque Farms
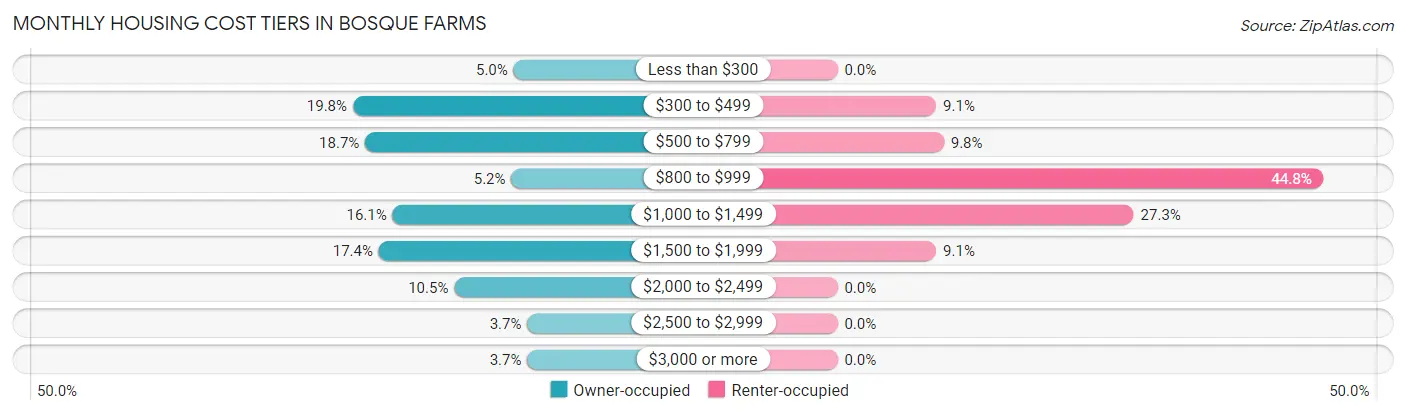
| Monthly Cost | Owner-occupied | Renter-occupied |
| Less than $300 | 71 (5.0%) | 0 (0.0%) |
| $300 to $499 | 282 (19.8%) | 13 (9.1%) |
| $500 to $799 | 266 (18.6%) | 14 (9.8%) |
| $800 to $999 | 74 (5.2%) | 64 (44.8%) |
| $1,000 to $1,499 | 230 (16.1%) | 39 (27.3%) |
| $1,500 to $1,999 | 248 (17.4%) | 13 (9.1%) |
| $2,000 to $2,499 | 149 (10.4%) | 0 (0.0%) |
| $2,500 to $2,999 | 53 (3.7%) | 0 (0.0%) |
| $3,000 or more | 53 (3.7%) | 0 (0.0%) |
| Total | 1,426 (100.0%) | 143 (100.0%) |
Physical Housing Characteristics in Bosque Farms
Housing Structures in Bosque Farms
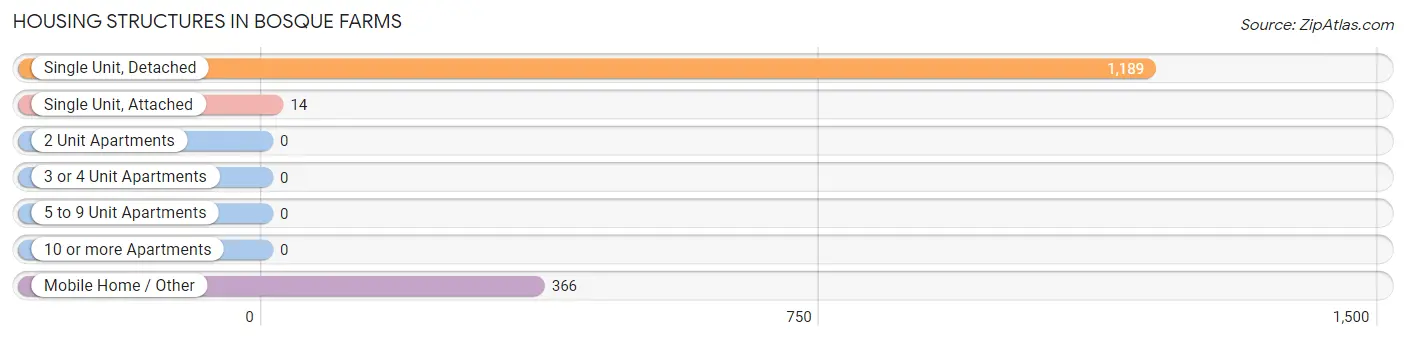
| Structure Type | # Housing Units | % Housing Units |
| Single Unit, Detached | 1,189 | 75.8% |
| Single Unit, Attached | 14 | 0.9% |
| 2 Unit Apartments | 0 | 0.0% |
| 3 or 4 Unit Apartments | 0 | 0.0% |
| 5 to 9 Unit Apartments | 0 | 0.0% |
| 10 or more Apartments | 0 | 0.0% |
| Mobile Home / Other | 366 | 23.3% |
| Total | 1,569 | 100.0% |
Housing Structures by Occupancy in Bosque Farms
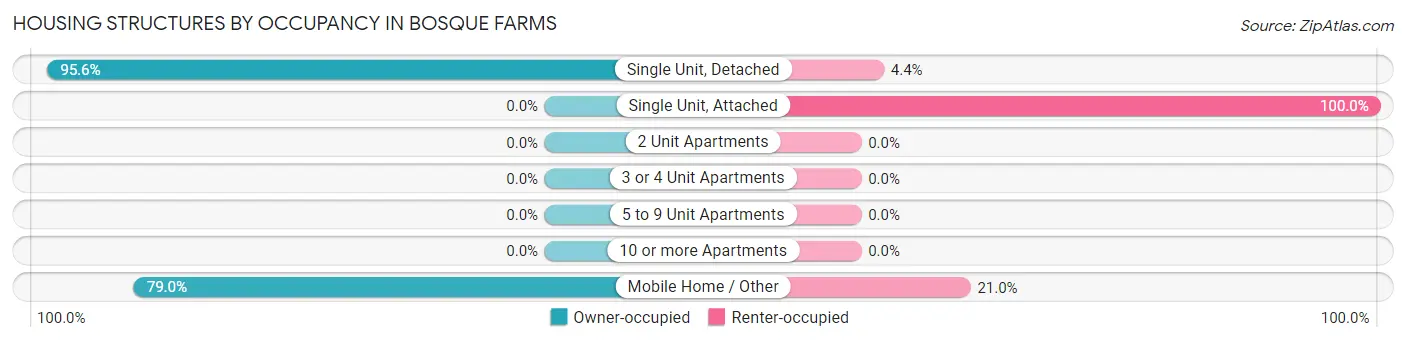
| Structure Type | Owner-occupied | Renter-occupied |
| Single Unit, Detached | 1,137 (95.6%) | 52 (4.4%) |
| Single Unit, Attached | 0 (0.0%) | 14 (100.0%) |
| 2 Unit Apartments | 0 (0.0%) | 0 (0.0%) |
| 3 or 4 Unit Apartments | 0 (0.0%) | 0 (0.0%) |
| 5 to 9 Unit Apartments | 0 (0.0%) | 0 (0.0%) |
| 10 or more Apartments | 0 (0.0%) | 0 (0.0%) |
| Mobile Home / Other | 289 (79.0%) | 77 (21.0%) |
| Total | 1,426 (90.9%) | 143 (9.1%) |
Housing Structures by Number of Rooms in Bosque Farms
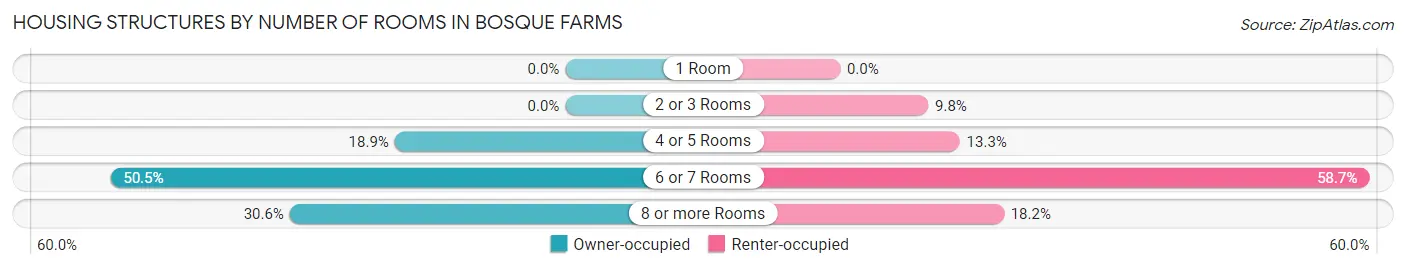
| Number of Rooms | Owner-occupied | Renter-occupied |
| 1 Room | 0 (0.0%) | 0 (0.0%) |
| 2 or 3 Rooms | 0 (0.0%) | 14 (9.8%) |
| 4 or 5 Rooms | 270 (18.9%) | 19 (13.3%) |
| 6 or 7 Rooms | 720 (50.5%) | 84 (58.7%) |
| 8 or more Rooms | 436 (30.6%) | 26 (18.2%) |
| Total | 1,426 (100.0%) | 143 (100.0%) |
Housing Structure by Heating Type in Bosque Farms
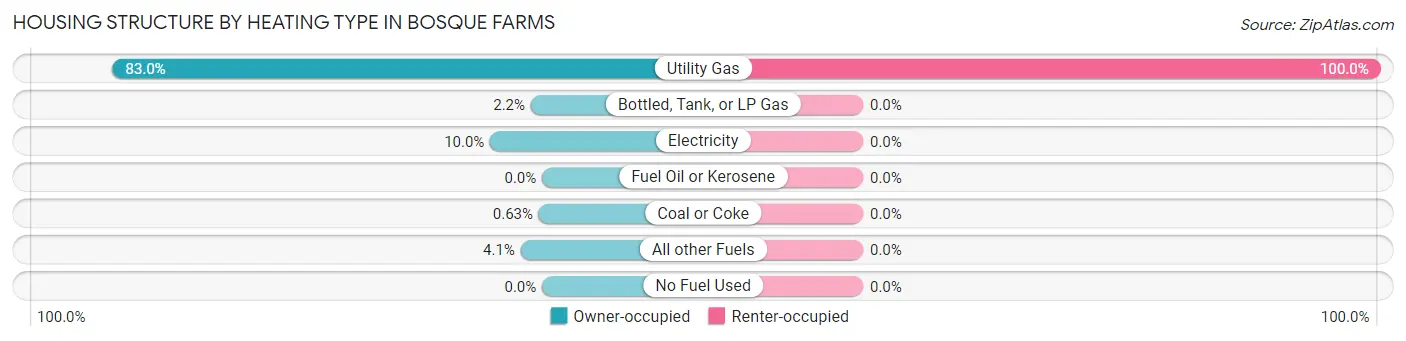
| Heating Type | Owner-occupied | Renter-occupied |
| Utility Gas | 1,184 (83.0%) | 143 (100.0%) |
| Bottled, Tank, or LP Gas | 31 (2.2%) | 0 (0.0%) |
| Electricity | 143 (10.0%) | 0 (0.0%) |
| Fuel Oil or Kerosene | 0 (0.0%) | 0 (0.0%) |
| Coal or Coke | 9 (0.6%) | 0 (0.0%) |
| All other Fuels | 59 (4.1%) | 0 (0.0%) |
| No Fuel Used | 0 (0.0%) | 0 (0.0%) |
| Total | 1,426 (100.0%) | 143 (100.0%) |
Household Vehicle Usage in Bosque Farms
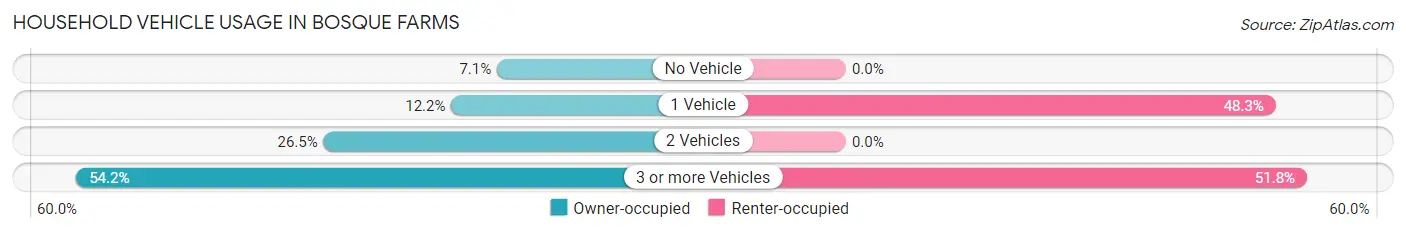
| Vehicles per Household | Owner-occupied | Renter-occupied |
| No Vehicle | 101 (7.1%) | 0 (0.0%) |
| 1 Vehicle | 174 (12.2%) | 69 (48.2%) |
| 2 Vehicles | 378 (26.5%) | 0 (0.0%) |
| 3 or more Vehicles | 773 (54.2%) | 74 (51.7%) |
| Total | 1,426 (100.0%) | 143 (100.0%) |
Real Estate & Mortgages in Bosque Farms
Real Estate and Mortgage Overview in Bosque Farms
| Characteristic | Without Mortgage | With Mortgage |
| Housing Units | 681 | 745 |
| Median Property Value | $270,400 | $235,900 |
| Median Household Income | $60,313 | $86 |
| Monthly Housing Costs | $488 | $53 |
| Real Estate Taxes | $1,931 | $76 |
Property Value by Mortgage Status in Bosque Farms
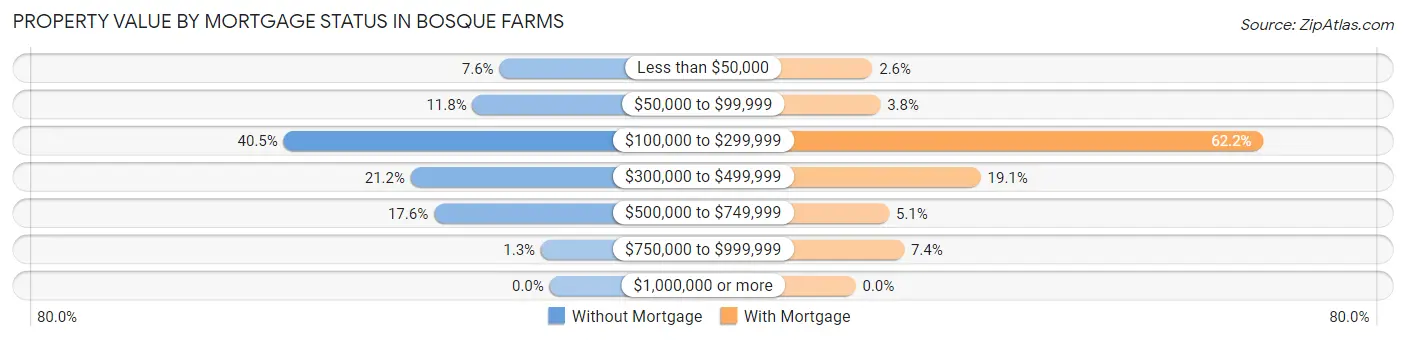
| Property Value | Without Mortgage | With Mortgage |
| Less than $50,000 | 52 (7.6%) | 19 (2.5%) |
| $50,000 to $99,999 | 80 (11.7%) | 28 (3.8%) |
| $100,000 to $299,999 | 276 (40.5%) | 463 (62.2%) |
| $300,000 to $499,999 | 144 (21.1%) | 142 (19.1%) |
| $500,000 to $749,999 | 120 (17.6%) | 38 (5.1%) |
| $750,000 to $999,999 | 9 (1.3%) | 55 (7.4%) |
| $1,000,000 or more | 0 (0.0%) | 0 (0.0%) |
| Total | 681 (100.0%) | 745 (100.0%) |
Household Income by Mortgage Status in Bosque Farms
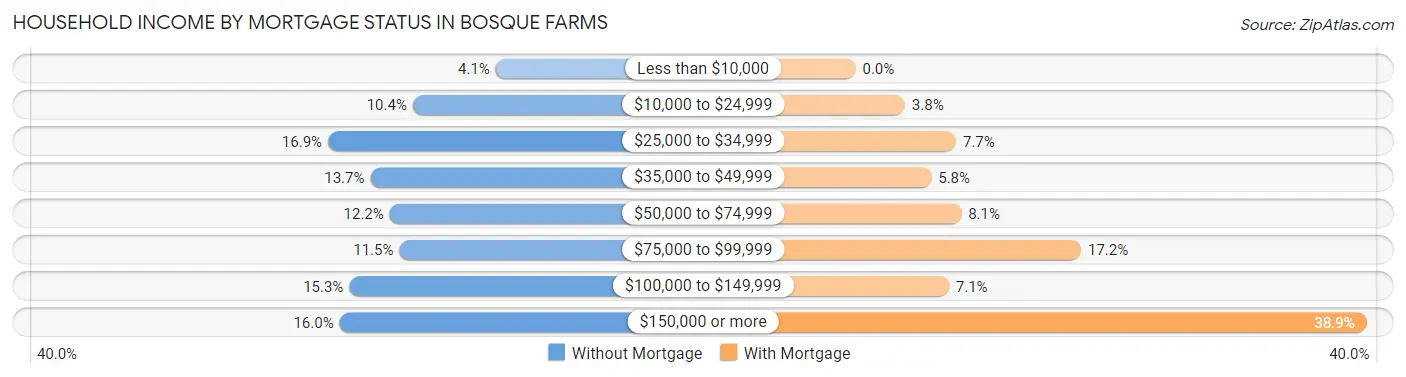
| Household Income | Without Mortgage | With Mortgage |
| Less than $10,000 | 28 (4.1%) | 0 (0.0%) |
| $10,000 to $24,999 | 71 (10.4%) | 28 (3.8%) |
| $25,000 to $34,999 | 115 (16.9%) | 57 (7.6%) |
| $35,000 to $49,999 | 93 (13.7%) | 43 (5.8%) |
| $50,000 to $74,999 | 83 (12.2%) | 60 (8.1%) |
| $75,000 to $99,999 | 78 (11.5%) | 128 (17.2%) |
| $100,000 to $149,999 | 104 (15.3%) | 53 (7.1%) |
| $150,000 or more | 109 (16.0%) | 290 (38.9%) |
| Total | 681 (100.0%) | 745 (100.0%) |
Property Value to Household Income Ratio in Bosque Farms
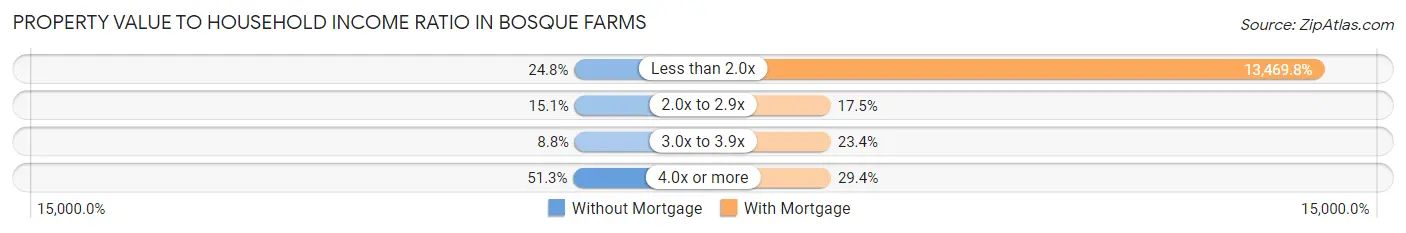
| Value-to-Income Ratio | Without Mortgage | With Mortgage |
| Less than 2.0x | 169 (24.8%) | 100,350 (13,469.8%) |
| 2.0x to 2.9x | 103 (15.1%) | 130 (17.4%) |
| 3.0x to 3.9x | 60 (8.8%) | 174 (23.4%) |
| 4.0x or more | 349 (51.2%) | 219 (29.4%) |
| Total | 681 (100.0%) | 745 (100.0%) |
Real Estate Taxes by Mortgage Status in Bosque Farms
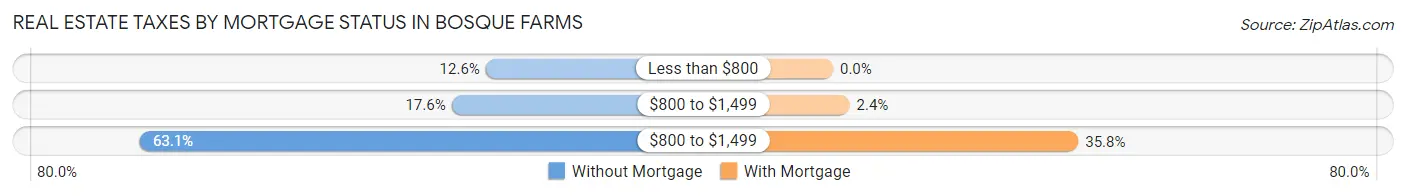
| Property Taxes | Without Mortgage | With Mortgage |
| Less than $800 | 86 (12.6%) | 0 (0.0%) |
| $800 to $1,499 | 120 (17.6%) | 18 (2.4%) |
| $800 to $1,499 | 430 (63.1%) | 267 (35.8%) |
| Total | 681 (100.0%) | 745 (100.0%) |
Health & Disability in Bosque Farms
Health Insurance Coverage by Age in Bosque Farms
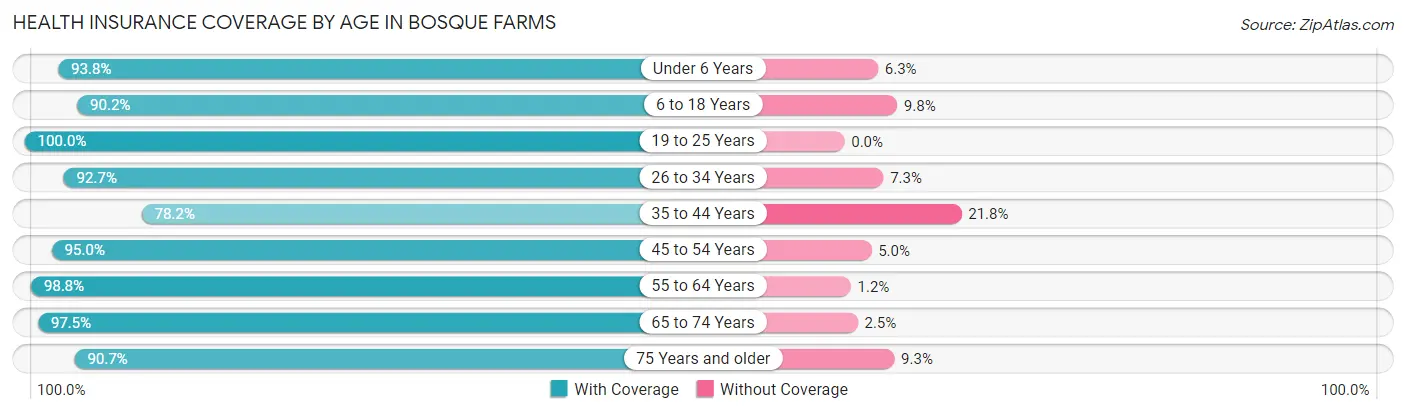
| Age Bracket | With Coverage | Without Coverage |
| Under 6 Years | 345 (93.8%) | 23 (6.2%) |
| 6 to 18 Years | 432 (90.2%) | 47 (9.8%) |
| 19 to 25 Years | 266 (100.0%) | 0 (0.0%) |
| 26 to 34 Years | 281 (92.7%) | 22 (7.3%) |
| 35 to 44 Years | 430 (78.2%) | 120 (21.8%) |
| 45 to 54 Years | 454 (95.0%) | 24 (5.0%) |
| 55 to 64 Years | 585 (98.8%) | 7 (1.2%) |
| 65 to 74 Years | 553 (97.5%) | 14 (2.5%) |
| 75 Years and older | 361 (90.7%) | 37 (9.3%) |
| Total | 3,707 (92.6%) | 294 (7.3%) |
Health Insurance Coverage by Citizenship Status in Bosque Farms
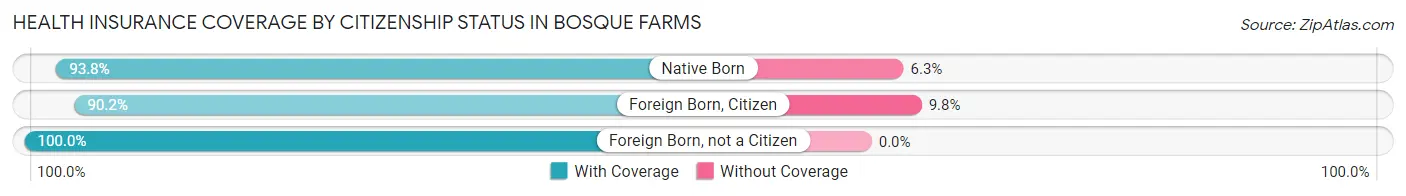
| Citizenship Status | With Coverage | Without Coverage |
| Native Born | 345 (93.8%) | 23 (6.2%) |
| Foreign Born, Citizen | 432 (90.2%) | 47 (9.8%) |
| Foreign Born, not a Citizen | 266 (100.0%) | 0 (0.0%) |
Health Insurance Coverage by Household Income in Bosque Farms
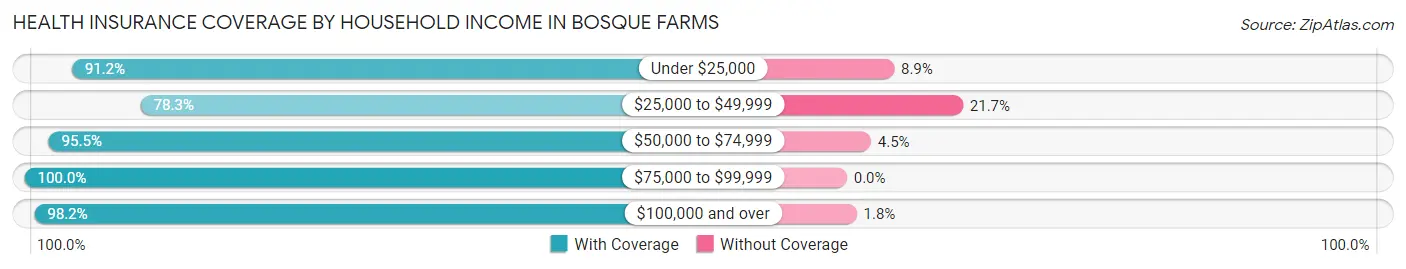
| Household Income | With Coverage | Without Coverage |
| Under $25,000 | 659 (91.1%) | 64 (8.8%) |
| $25,000 to $49,999 | 630 (78.3%) | 175 (21.7%) |
| $50,000 to $74,999 | 529 (95.5%) | 25 (4.5%) |
| $75,000 to $99,999 | 286 (100.0%) | 0 (0.0%) |
| $100,000 and over | 1,603 (98.2%) | 30 (1.8%) |
Public vs Private Health Insurance Coverage by Age in Bosque Farms
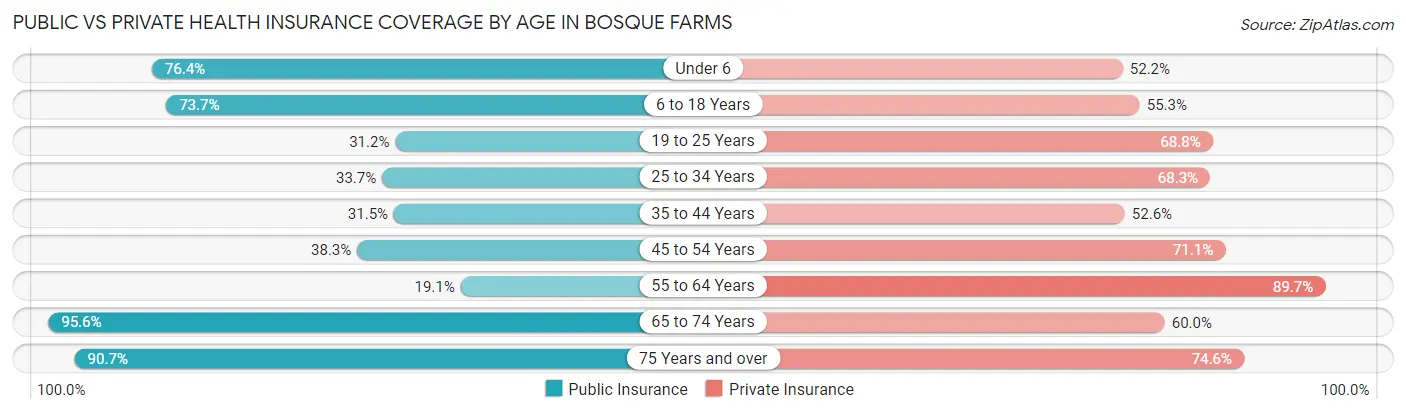
| Age Bracket | Public Insurance | Private Insurance |
| Under 6 | 281 (76.4%) | 192 (52.2%) |
| 6 to 18 Years | 353 (73.7%) | 265 (55.3%) |
| 19 to 25 Years | 83 (31.2%) | 183 (68.8%) |
| 25 to 34 Years | 102 (33.7%) | 207 (68.3%) |
| 35 to 44 Years | 173 (31.5%) | 289 (52.5%) |
| 45 to 54 Years | 183 (38.3%) | 340 (71.1%) |
| 55 to 64 Years | 113 (19.1%) | 531 (89.7%) |
| 65 to 74 Years | 542 (95.6%) | 340 (60.0%) |
| 75 Years and over | 361 (90.7%) | 297 (74.6%) |
| Total | 2,191 (54.8%) | 2,644 (66.1%) |
Disability Status by Sex by Age in Bosque Farms
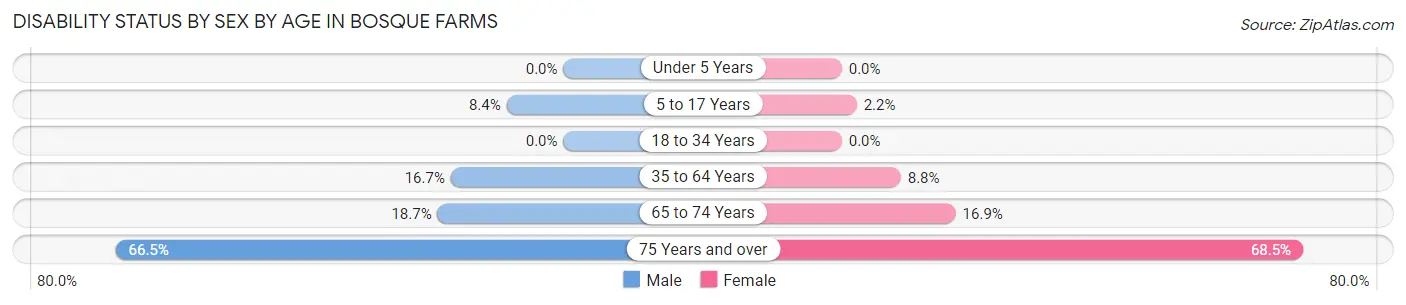
| Age Bracket | Male | Female |
| Under 5 Years | 0 (0.0%) | 0 (0.0%) |
| 5 to 17 Years | 15 (8.4%) | 7 (2.2%) |
| 18 to 34 Years | 0 (0.0%) | 0 (0.0%) |
| 35 to 64 Years | 162 (16.7%) | 57 (8.8%) |
| 65 to 74 Years | 54 (18.7%) | 47 (16.9%) |
| 75 Years and over | 117 (66.5%) | 152 (68.5%) |
Disability Class by Sex by Age in Bosque Farms
Disability Class: Hearing Difficulty
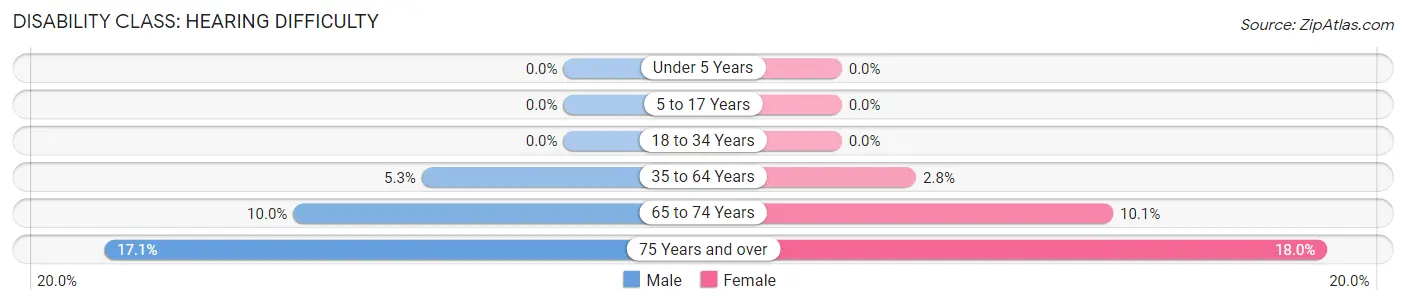
| Age Bracket | Male | Female |
| Under 5 Years | 0 (0.0%) | 0 (0.0%) |
| 5 to 17 Years | 0 (0.0%) | 0 (0.0%) |
| 18 to 34 Years | 0 (0.0%) | 0 (0.0%) |
| 35 to 64 Years | 51 (5.3%) | 18 (2.8%) |
| 65 to 74 Years | 29 (10.0%) | 28 (10.1%) |
| 75 Years and over | 30 (17.1%) | 40 (18.0%) |
Disability Class: Vision Difficulty
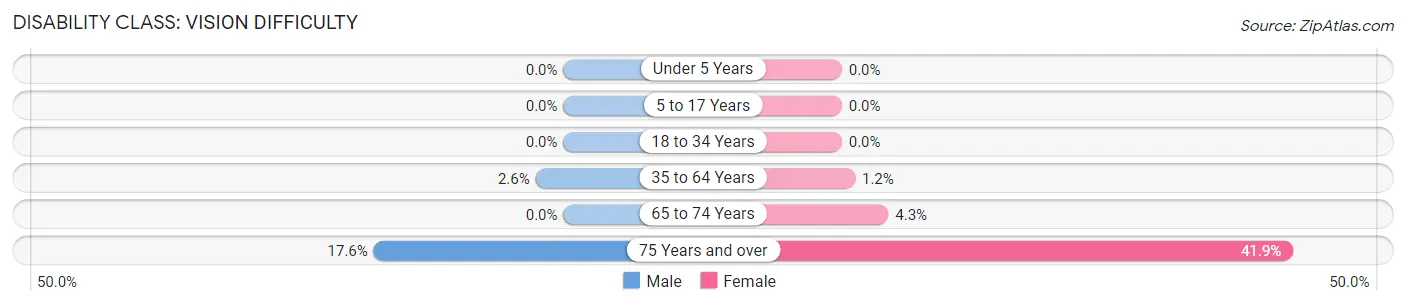
| Age Bracket | Male | Female |
| Under 5 Years | 0 (0.0%) | 0 (0.0%) |
| 5 to 17 Years | 0 (0.0%) | 0 (0.0%) |
| 18 to 34 Years | 0 (0.0%) | 0 (0.0%) |
| 35 to 64 Years | 25 (2.6%) | 8 (1.2%) |
| 65 to 74 Years | 0 (0.0%) | 12 (4.3%) |
| 75 Years and over | 31 (17.6%) | 93 (41.9%) |
Disability Class: Cognitive Difficulty
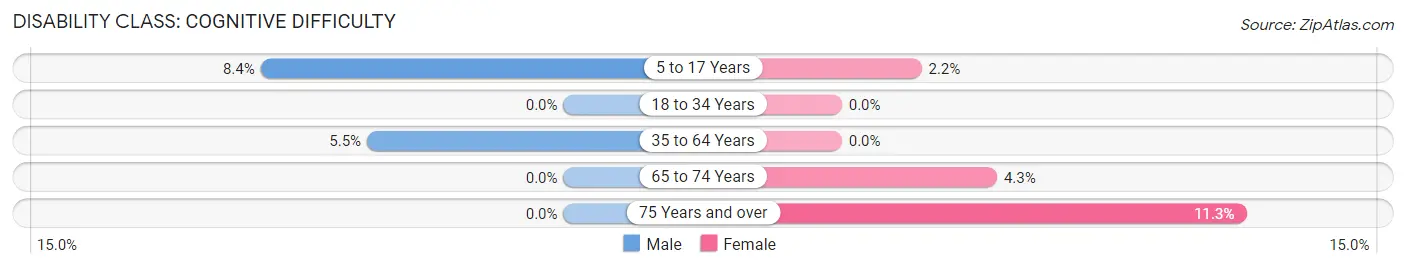
| Age Bracket | Male | Female |
| 5 to 17 Years | 15 (8.4%) | 7 (2.2%) |
| 18 to 34 Years | 0 (0.0%) | 0 (0.0%) |
| 35 to 64 Years | 53 (5.5%) | 0 (0.0%) |
| 65 to 74 Years | 0 (0.0%) | 12 (4.3%) |
| 75 Years and over | 0 (0.0%) | 25 (11.3%) |
Disability Class: Ambulatory Difficulty
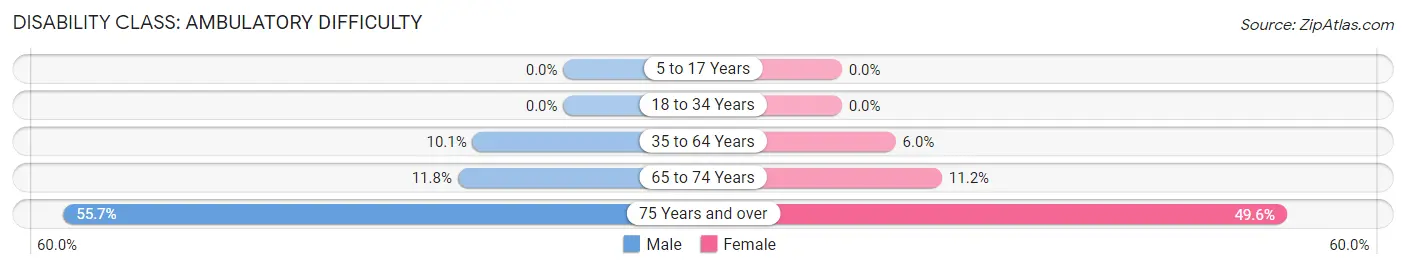
| Age Bracket | Male | Female |
| 5 to 17 Years | 0 (0.0%) | 0 (0.0%) |
| 18 to 34 Years | 0 (0.0%) | 0 (0.0%) |
| 35 to 64 Years | 98 (10.1%) | 39 (6.0%) |
| 65 to 74 Years | 34 (11.8%) | 31 (11.2%) |
| 75 Years and over | 98 (55.7%) | 110 (49.5%) |
Disability Class: Self-Care Difficulty
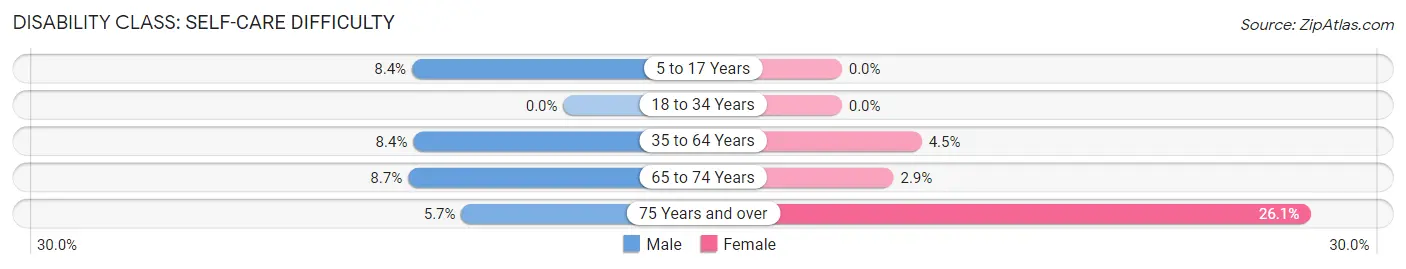
| Age Bracket | Male | Female |
| 5 to 17 Years | 15 (8.4%) | 0 (0.0%) |
| 18 to 34 Years | 0 (0.0%) | 0 (0.0%) |
| 35 to 64 Years | 81 (8.4%) | 29 (4.4%) |
| 65 to 74 Years | 25 (8.6%) | 8 (2.9%) |
| 75 Years and over | 10 (5.7%) | 58 (26.1%) |
Technology Access in Bosque Farms
Computing Device Access in Bosque Farms
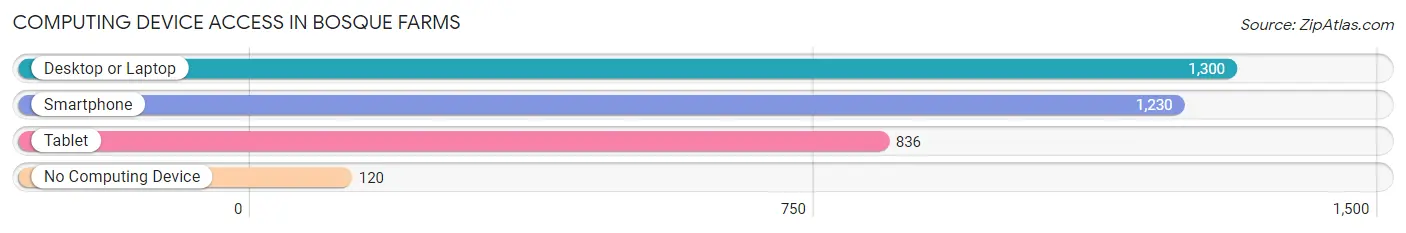
| Device Type | # Households | % Households |
| Desktop or Laptop | 1,300 | 82.9% |
| Smartphone | 1,230 | 78.4% |
| Tablet | 836 | 53.3% |
| No Computing Device | 120 | 7.6% |
| Total | 1,569 | 100.0% |
Internet Access in Bosque Farms
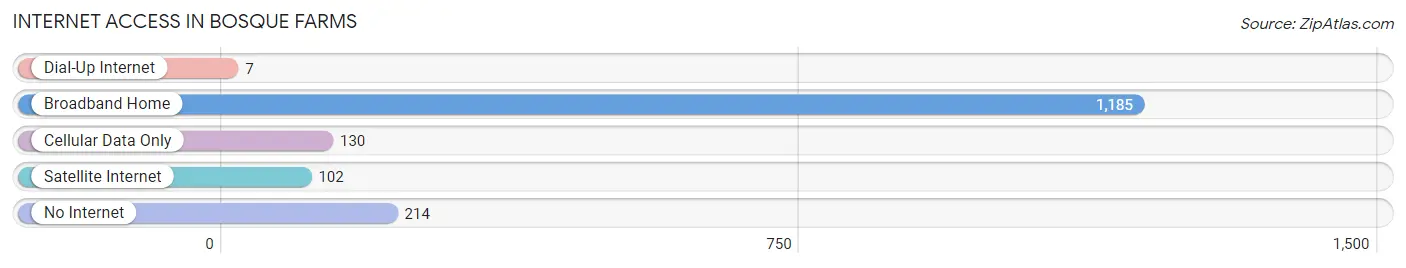
| Internet Type | # Households | % Households |
| Dial-Up Internet | 7 | 0.4% |
| Broadband Home | 1,185 | 75.5% |
| Cellular Data Only | 130 | 8.3% |
| Satellite Internet | 102 | 6.5% |
| No Internet | 214 | 13.6% |
| Total | 1,569 | 100.0% |
Bosque Farms Summary
Bosque Farms is a small village located in Valencia County, New Mexico. It is situated in the Rio Grande Valley, about 15 miles south of Albuquerque. The village was founded in the early 1900s by a group of settlers who were looking for a place to farm and raise livestock. The village has a population of approximately 4,000 people and is home to a variety of businesses, including a grocery store, a bank, a post office, and several restaurants.
Geography
Bosque Farms is located in the Rio Grande Valley, which is a large valley that stretches from the Rio Grande River in the south to the Sandia Mountains in the north. The village is situated on the east side of the valley, and is surrounded by agricultural land. The village is located at an elevation of 4,800 feet, and the average annual temperature is around 60 degrees Fahrenheit. The village is located in a semi-arid climate, and receives an average of 12 inches of precipitation per year.
Economy
The economy of Bosque Farms is largely based on agriculture. The village is home to several farms, which produce a variety of crops, including alfalfa, corn, wheat, and hay. The village also has a number of businesses, including a grocery store, a bank, a post office, and several restaurants. The village is also home to a number of small manufacturing companies, which produce a variety of products, including furniture, clothing, and electronics.
Demographics
As of the 2010 census, the population of Bosque Farms was 4,037. The racial makeup of the village was 79.3% White, 0.7% African American, 0.7% Native American, 0.3% Asian, 0.1% Pacific Islander, 16.2% from other races, and 2.9% from two or more races. Hispanic or Latino of any race were 44.3% of the population. The median household income in the village was $37,917, and the median family income was $45,938.
Conclusion
Bosque Farms is a small village located in Valencia County, New Mexico. It is situated in the Rio Grande Valley, about 15 miles south of Albuquerque. The village was founded in the early 1900s by a group of settlers who were looking for a place to farm and raise livestock. The village has a population of approximately 4,000 people and is home to a variety of businesses, including a grocery store, a bank, a post office, and several restaurants. The economy of Bosque Farms is largely based on agriculture, and the village is home to several farms, which produce a variety of crops. The racial makeup of the village is 79.3% White, 0.7% African American, 0.7% Native American, 0.3% Asian, 0.1% Pacific Islander, 16.2% from other races, and 2.9% from two or more races. The median household income in the village was $37,917, and the median family income was $45,938.
Common Questions
What is Per Capita Income in Bosque Farms?
Per Capita income in Bosque Farms is $35,091.
What is the Median Family Income in Bosque Farms?
Median Family Income in Bosque Farms is $95,870.
What is the Median Household income in Bosque Farms?
Median Household Income in Bosque Farms is $67,435.
What is Income or Wage Gap in Bosque Farms?
Income or Wage Gap in Bosque Farms is 26.5%.
Women in Bosque Farms earn 73.5 cents for every dollar earned by a man.
What is Inequality or Gini Index in Bosque Farms?
Inequality or Gini Index in Bosque Farms is 0.43.
What is the Total Population of Bosque Farms?
Total Population of Bosque Farms is 4,001.
What is the Total Male Population of Bosque Farms?
Total Male Population of Bosque Farms is 2,034.
What is the Total Female Population of Bosque Farms?
Total Female Population of Bosque Farms is 1,967.
What is the Ratio of Males per 100 Females in Bosque Farms?
There are 103.41 Males per 100 Females in Bosque Farms.
What is the Ratio of Females per 100 Males in Bosque Farms?
There are 96.71 Females per 100 Males in Bosque Farms.
What is the Median Population Age in Bosque Farms?
Median Population Age in Bosque Farms is 45.9 Years.
What is the Average Family Size in Bosque Farms
Average Family Size in Bosque Farms is 3.0 People.
What is the Average Household Size in Bosque Farms
Average Household Size in Bosque Farms is 2.5 People.
How Large is the Labor Force in Bosque Farms?
There are 1,844 People in the Labor Forcein in Bosque Farms.
What is the Percentage of People in the Labor Force in Bosque Farms?
55.8% of People are in the Labor Force in Bosque Farms.
What is the Unemployment Rate in Bosque Farms?
Unemployment Rate in Bosque Farms is 3.4%.