Belen, NM Map & Demographics
Belen Map
Belen Overview
$22,192
PER CAPITA INCOME
$57,443
AVG FAMILY INCOME
$38,838
AVG HOUSEHOLD INCOME
9.2%
WAGE / INCOME GAP [ % ]
90.8¢/ $1
WAGE / INCOME GAP [ $ ]
$15,867
FAMILY INCOME DEFICIT
0.43
INEQUALITY / GINI INDEX
7,367
TOTAL POPULATION
3,675
MALE POPULATION
3,692
FEMALE POPULATION
99.54
MALES / 100 FEMALES
100.46
FEMALES / 100 MALES
44.4
MEDIAN AGE
3.5
AVG FAMILY SIZE
2.7
AVG HOUSEHOLD SIZE
2,891
LABOR FORCE [ PEOPLE ]
45.4%
PERCENT IN LABOR FORCE
8.0%
UNEMPLOYMENT RATE
Belen Zip Codes
Belen Area Codes
Income in Belen
Income Overview in Belen
Per Capita Income in Belen is $22,192, while median incomes of families and households are $57,443 and $38,838 respectively.
| Characteristic | Number | Measure |
| Per Capita Income | 7,367 | $22,192 |
| Median Family Income | 1,635 | $57,443 |
| Mean Family Income | 1,635 | $56,900 |
| Median Household Income | 2,684 | $38,838 |
| Mean Household Income | 2,684 | $49,899 |
| Income Deficit | 1,635 | $15,867 |
| Wage / Income Gap (%) | 7,367 | 9.15% |
| Wage / Income Gap ($) | 7,367 | 90.85¢ per $1 |
| Gini / Inequality Index | 7,367 | 0.43 |
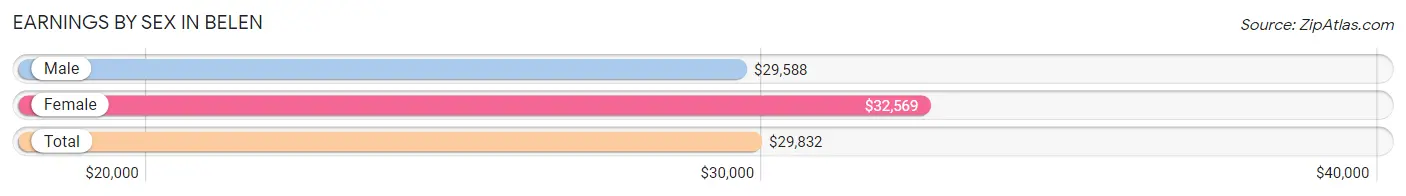
Earnings by Sex in Belen
Average Earnings in Belen are $29,832, $29,588 for men and $32,569 for women, a difference of 9.1%.
| Sex | Number | Average Earnings |
| Male | 1,500 (48.2%) | $29,588 |
| Female | 1,613 (51.8%) | $32,569 |
| Total | 3,113 (100.0%) | $29,832 |
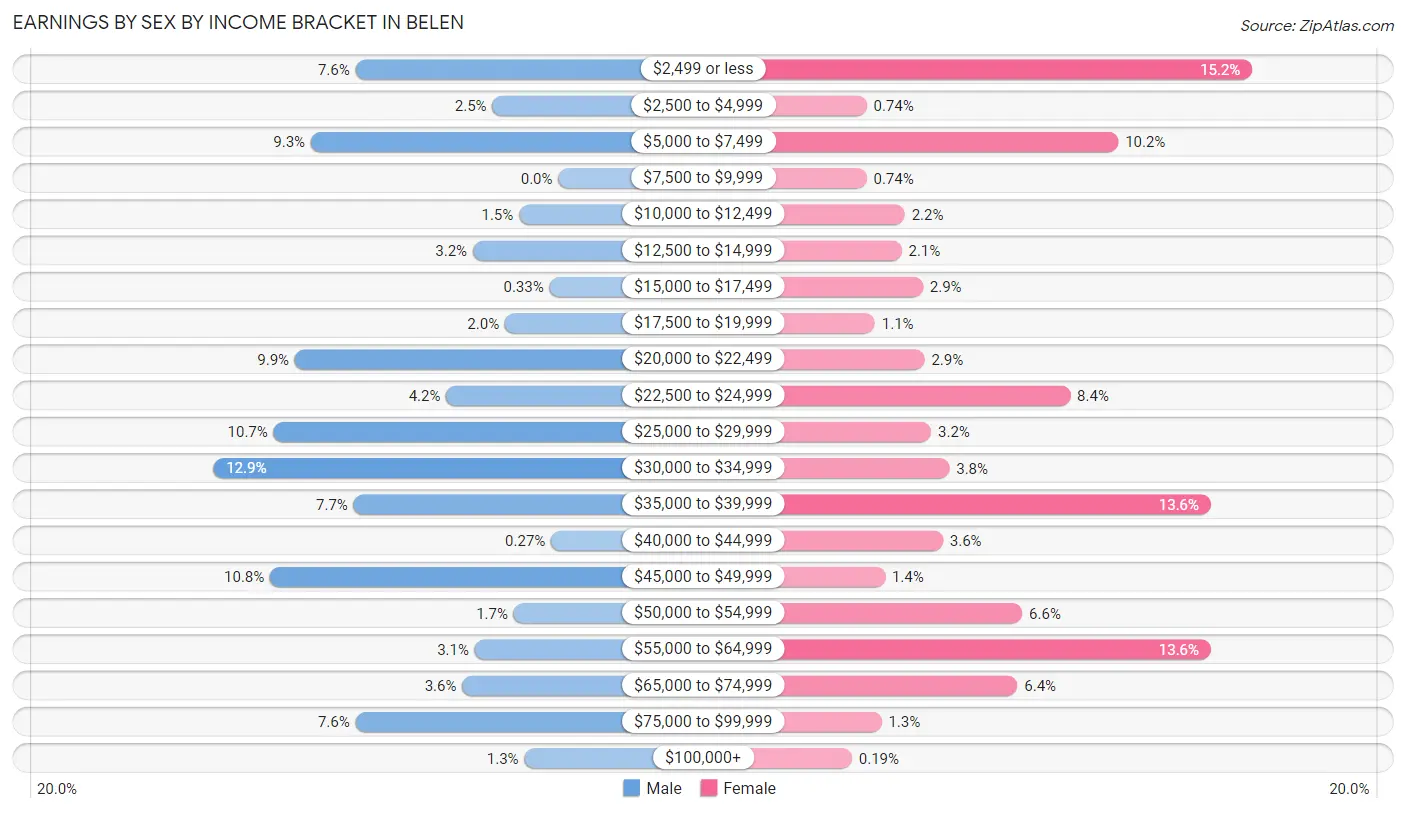
Earnings by Sex by Income Bracket in Belen
The most common earnings brackets in Belen are $30,000 to $34,999 for men (194 | 12.9%) and $2,499 or less for women (245 | 15.2%).
| Income | Male | Female |
| $2,499 or less | 114 (7.6%) | 245 (15.2%) |
| $2,500 to $4,999 | 37 (2.5%) | 12 (0.7%) |
| $5,000 to $7,499 | 139 (9.3%) | 164 (10.2%) |
| $7,500 to $9,999 | 0 (0.0%) | 12 (0.7%) |
| $10,000 to $12,499 | 22 (1.5%) | 35 (2.2%) |
| $12,500 to $14,999 | 48 (3.2%) | 33 (2.1%) |
| $15,000 to $17,499 | 5 (0.3%) | 46 (2.9%) |
| $17,500 to $19,999 | 30 (2.0%) | 17 (1.1%) |
| $20,000 to $22,499 | 148 (9.9%) | 47 (2.9%) |
| $22,500 to $24,999 | 63 (4.2%) | 135 (8.4%) |
| $25,000 to $29,999 | 160 (10.7%) | 51 (3.2%) |
| $30,000 to $34,999 | 194 (12.9%) | 62 (3.8%) |
| $35,000 to $39,999 | 115 (7.7%) | 220 (13.6%) |
| $40,000 to $44,999 | 4 (0.3%) | 58 (3.6%) |
| $45,000 to $49,999 | 162 (10.8%) | 23 (1.4%) |
| $50,000 to $54,999 | 25 (1.7%) | 106 (6.6%) |
| $55,000 to $64,999 | 47 (3.1%) | 220 (13.6%) |
| $65,000 to $74,999 | 54 (3.6%) | 103 (6.4%) |
| $75,000 to $99,999 | 114 (7.6%) | 21 (1.3%) |
| $100,000+ | 19 (1.3%) | 3 (0.2%) |
| Total | 1,500 (100.0%) | 1,613 (100.0%) |
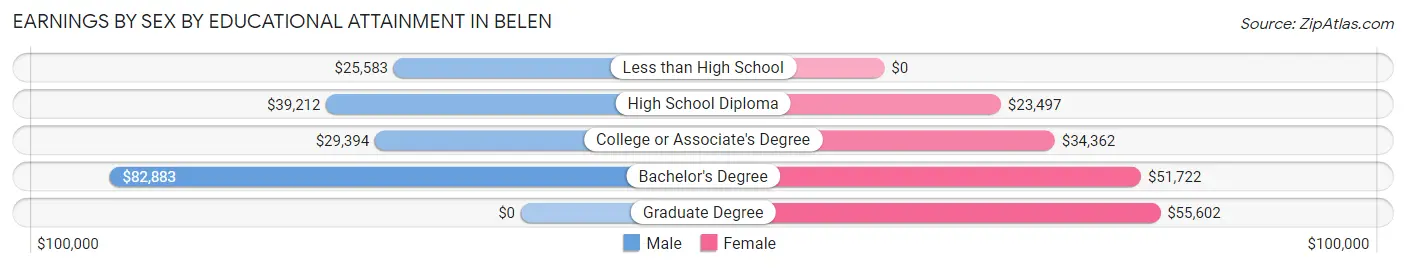
Earnings by Sex by Educational Attainment in Belen
Average earnings in Belen are $32,261 for men and $36,806 for women, a difference of 12.3%. Men with an educational attainment of bachelor's degree enjoy the highest average annual earnings of $82,883, while those with less than high school education earn the least with $25,583. Women with an educational attainment of graduate degree earn the most with the average annual earnings of $55,602, while those with high school diploma education have the smallest earnings of $23,497.
| Educational Attainment | Male Income | Female Income |
| Less than High School | $25,583 | $0 |
| High School Diploma | $39,212 | $23,497 |
| College or Associate's Degree | $29,394 | $34,362 |
| Bachelor's Degree | $82,883 | $51,722 |
| Graduate Degree | - | - |
| Total | $32,261 | $36,806 |
Family Income in Belen
Family Income Brackets in Belen
According to the Belen family income data, there are 500 families falling into the $50,000 to $74,999 income range, which is the most common income bracket and makes up 30.6% of all families. Conversely, the $200,000+ income bracket is the least frequent group with only 8 families (0.5%) belonging to this category.
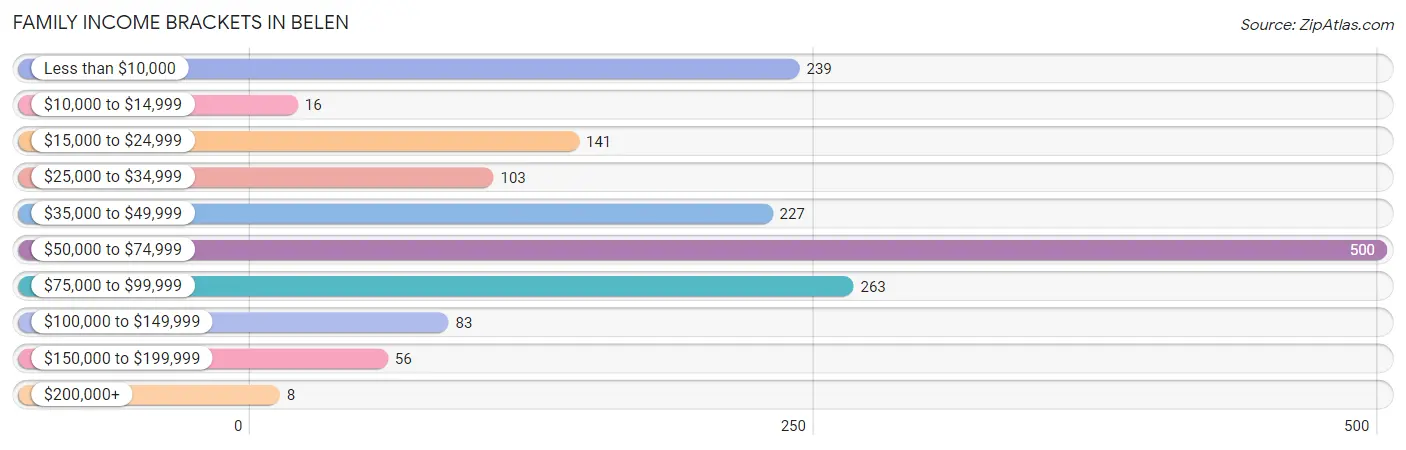
| Income Bracket | # Families | % Families |
| Less than $10,000 | 239 | 14.6% |
| $10,000 to $14,999 | 16 | 1.0% |
| $15,000 to $24,999 | 141 | 8.6% |
| $25,000 to $34,999 | 103 | 6.3% |
| $35,000 to $49,999 | 227 | 13.9% |
| $50,000 to $74,999 | 500 | 30.6% |
| $75,000 to $99,999 | 263 | 16.1% |
| $100,000 to $149,999 | 83 | 5.1% |
| $150,000 to $199,999 | 56 | 3.4% |
| $200,000+ | 8 | 0.5% |
Family Income by Famaliy Size in Belen
4-person families (158 | 9.7%) account for the highest median family income in Belen with $78,625 per family, while 2-person families (958 | 58.6%) have the highest median income of $30,010 per family member.
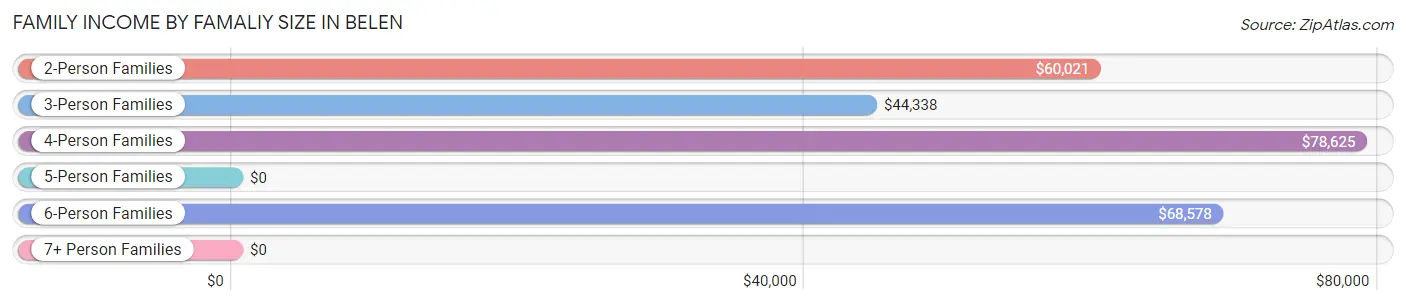
| Income Bracket | # Families | Median Income |
| 2-Person Families | 958 (58.6%) | $60,021 |
| 3-Person Families | 408 (24.9%) | $44,338 |
| 4-Person Families | 158 (9.7%) | $78,625 |
| 5-Person Families | 17 (1.0%) | $0 |
| 6-Person Families | 82 (5.0%) | $68,578 |
| 7+ Person Families | 12 (0.7%) | $0 |
| Total | 1,635 (100.0%) | $57,443 |
Family Income by Number of Earners in Belen
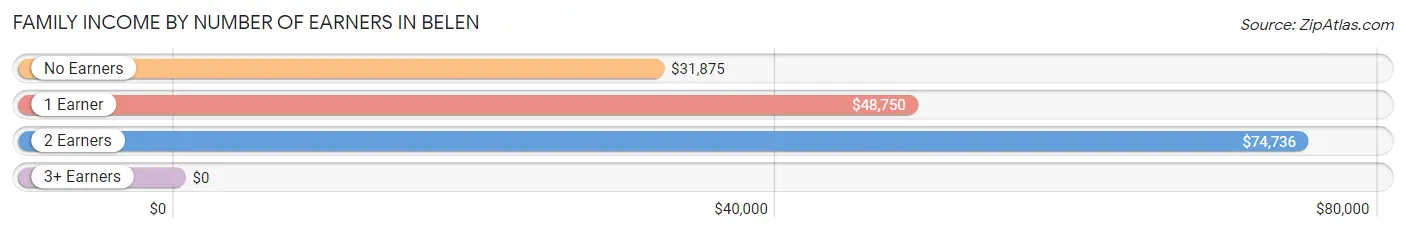
| Number of Earners | # Families | Median Income |
| No Earners | 447 (27.3%) | $31,875 |
| 1 Earner | 664 (40.6%) | $48,750 |
| 2 Earners | 421 (25.8%) | $74,736 |
| 3+ Earners | 103 (6.3%) | $0 |
| Total | 1,635 (100.0%) | $57,443 |
Household Income in Belen
Household Income Brackets in Belen
With 577 households falling in the category, the $50,000 to $74,999 income range is the most frequent in Belen, accounting for 21.5% of all households. In contrast, only 30 households (1.1%) fall into the $200,000+ income bracket, making it the least populous group.
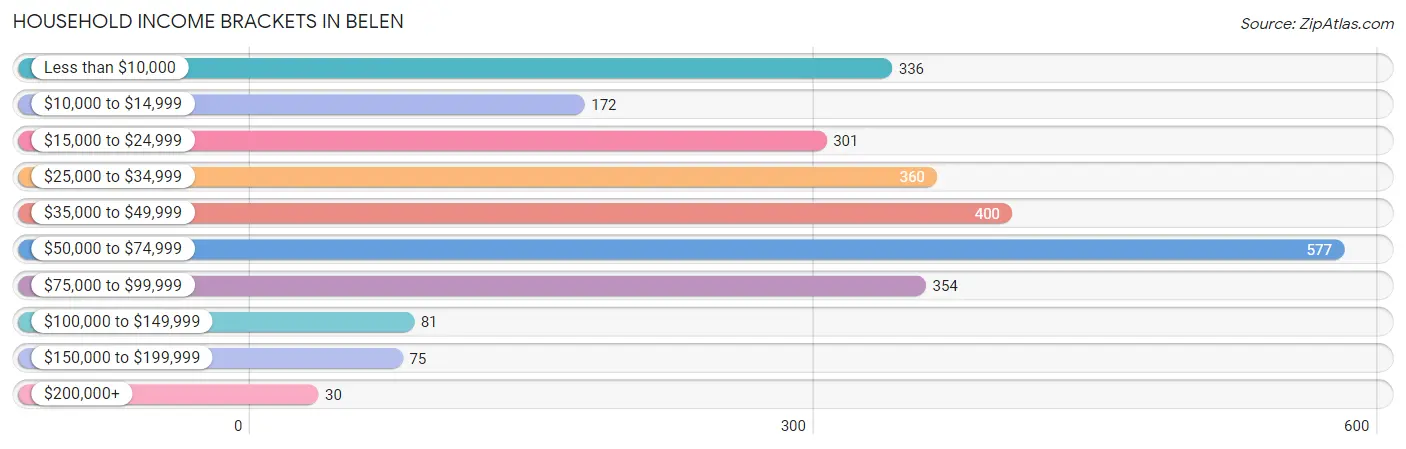
| Income Bracket | # Households | % Households |
| Less than $10,000 | 336 | 12.5% |
| $10,000 to $14,999 | 172 | 6.4% |
| $15,000 to $24,999 | 301 | 11.2% |
| $25,000 to $34,999 | 360 | 13.4% |
| $35,000 to $49,999 | 400 | 14.9% |
| $50,000 to $74,999 | 577 | 21.5% |
| $75,000 to $99,999 | 354 | 13.2% |
| $100,000 to $149,999 | 81 | 3.0% |
| $150,000 to $199,999 | 75 | 2.8% |
| $200,000+ | 30 | 1.1% |
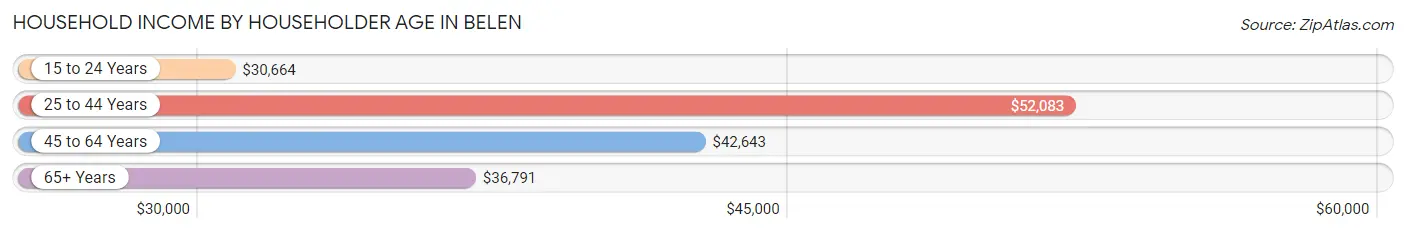
Household Income by Householder Age in Belen
The median household income in Belen is $38,838, with the highest median household income of $52,083 found in the 25 to 44 years age bracket for the primary householder. A total of 487 households (18.1%) fall into this category. Meanwhile, the 15 to 24 years age bracket for the primary householder has the lowest median household income of $30,664, with 155 households (5.8%) in this group.
| Income Bracket | # Households | Median Income |
| 15 to 24 Years | 155 (5.8%) | $30,664 |
| 25 to 44 Years | 487 (18.1%) | $52,083 |
| 45 to 64 Years | 1,220 (45.5%) | $42,643 |
| 65+ Years | 822 (30.6%) | $36,791 |
| Total | 2,684 (100.0%) | $38,838 |
Poverty in Belen
Income Below Poverty by Sex and Age in Belen
With 18.5% poverty level for males and 31.5% for females among the residents of Belen, 12 to 14 year old males and 12 to 14 year old females are the most vulnerable to poverty, with 124 males (75.1%) and 44 females (100.0%) in their respective age groups living below the poverty level.
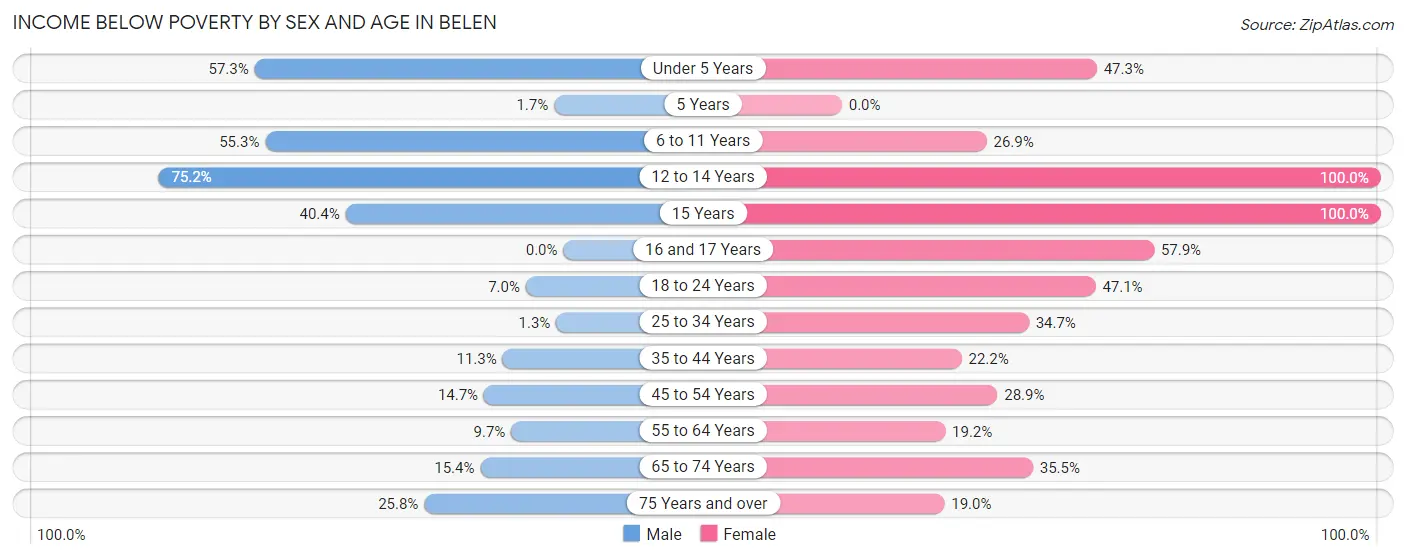
| Age Bracket | Male | Female |
| Under 5 Years | 90 (57.3%) | 53 (47.3%) |
| 5 Years | 1 (1.7%) | 0 (0.0%) |
| 6 to 11 Years | 135 (55.3%) | 36 (26.9%) |
| 12 to 14 Years | 124 (75.1%) | 44 (100.0%) |
| 15 Years | 19 (40.4%) | 20 (100.0%) |
| 16 and 17 Years | 0 (0.0%) | 62 (57.9%) |
| 18 to 24 Years | 31 (7.0%) | 129 (47.1%) |
| 25 to 34 Years | 8 (1.3%) | 204 (34.7%) |
| 35 to 44 Years | 30 (11.3%) | 86 (22.2%) |
| 45 to 54 Years | 56 (14.7%) | 177 (28.9%) |
| 55 to 64 Years | 66 (9.7%) | 108 (19.2%) |
| 65 to 74 Years | 39 (15.4%) | 162 (35.4%) |
| 75 Years and over | 70 (25.8%) | 63 (19.0%) |
| Total | 669 (18.5%) | 1,144 (31.5%) |
Income Above Poverty by Sex and Age in Belen
According to the poverty statistics in Belen, males aged 16 and 17 years and females aged 75 years and over are the age groups that are most secure financially, with 100.0% of males and 81.0% of females in these age groups living above the poverty line.
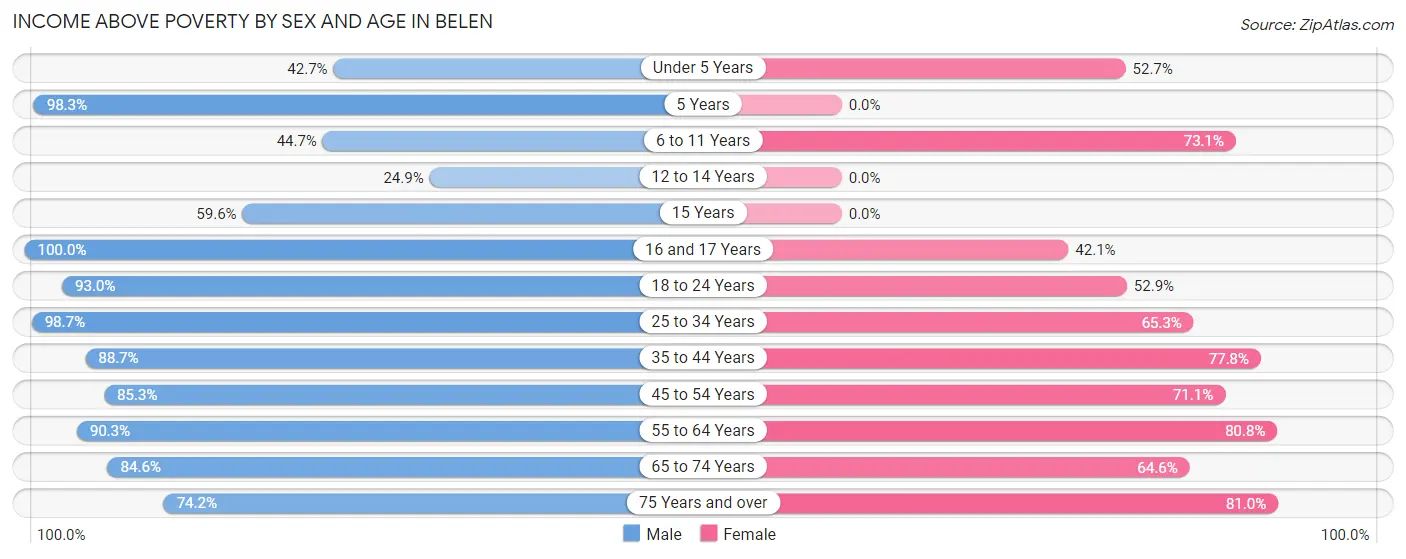
| Age Bracket | Male | Female |
| Under 5 Years | 67 (42.7%) | 59 (52.7%) |
| 5 Years | 57 (98.3%) | 0 (0.0%) |
| 6 to 11 Years | 109 (44.7%) | 98 (73.1%) |
| 12 to 14 Years | 41 (24.8%) | 0 (0.0%) |
| 15 Years | 28 (59.6%) | 0 (0.0%) |
| 16 and 17 Years | 45 (100.0%) | 45 (42.1%) |
| 18 to 24 Years | 414 (93.0%) | 145 (52.9%) |
| 25 to 34 Years | 592 (98.7%) | 384 (65.3%) |
| 35 to 44 Years | 236 (88.7%) | 301 (77.8%) |
| 45 to 54 Years | 324 (85.3%) | 436 (71.1%) |
| 55 to 64 Years | 615 (90.3%) | 455 (80.8%) |
| 65 to 74 Years | 214 (84.6%) | 295 (64.5%) |
| 75 Years and over | 201 (74.2%) | 268 (81.0%) |
| Total | 2,943 (81.5%) | 2,486 (68.5%) |
Income Below Poverty Among Married-Couple Families in Belen
The poverty statistics for married-couple families in Belen show that 9.6% or 63 of the total 660 families live below the poverty line. Families with 1 or 2 children have the highest poverty rate of 15.7%, comprising of 19 families. On the other hand, families with 3 or 4 children have the lowest poverty rate of 0.0%, which includes 0 families.
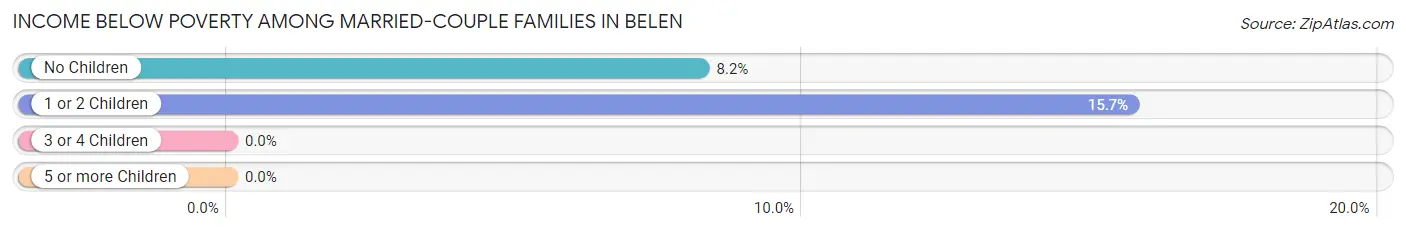
| Children | Above Poverty | Below Poverty |
| No Children | 492 (91.8%) | 44 (8.2%) |
| 1 or 2 Children | 102 (84.3%) | 19 (15.7%) |
| 3 or 4 Children | 3 (100.0%) | 0 (0.0%) |
| 5 or more Children | 0 (0.0%) | 0 (0.0%) |
| Total | 597 (90.4%) | 63 (9.6%) |
Income Below Poverty Among Single-Parent Households in Belen
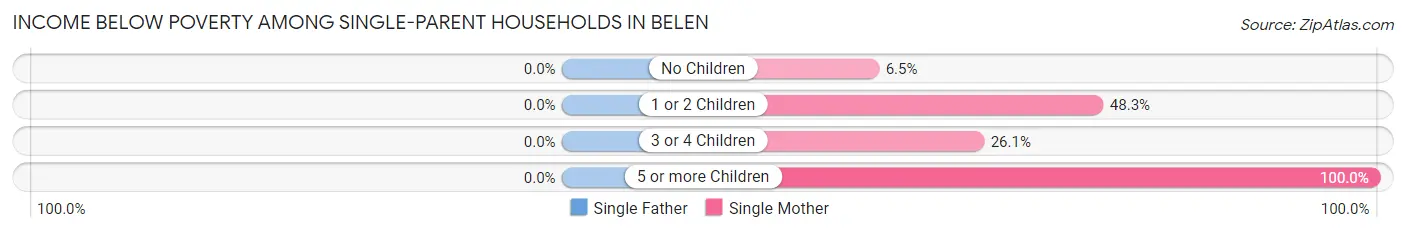
| Children | Single Father | Single Mother |
| No Children | 0 (0.0%) | 27 (6.5%) |
| 1 or 2 Children | 0 (0.0%) | 184 (48.3%) |
| 3 or 4 Children | 0 (0.0%) | 18 (26.1%) |
| 5 or more Children | 0 (0.0%) | 12 (100.0%) |
| Total | 0 (0.0%) | 241 (27.5%) |
Income Below Poverty Among Married-Couple vs Single-Parent Households in Belen
The poverty data for Belen shows that 63 of the married-couple family households (9.6%) and 241 of the single-parent households (24.7%) are living below the poverty level. Within the married-couple family households, those with 1 or 2 children have the highest poverty rate, with 19 households (15.7%) falling below the poverty line. Among the single-parent households, those with 5 or more children have the highest poverty rate, with 12 household (100.0%) living below poverty.
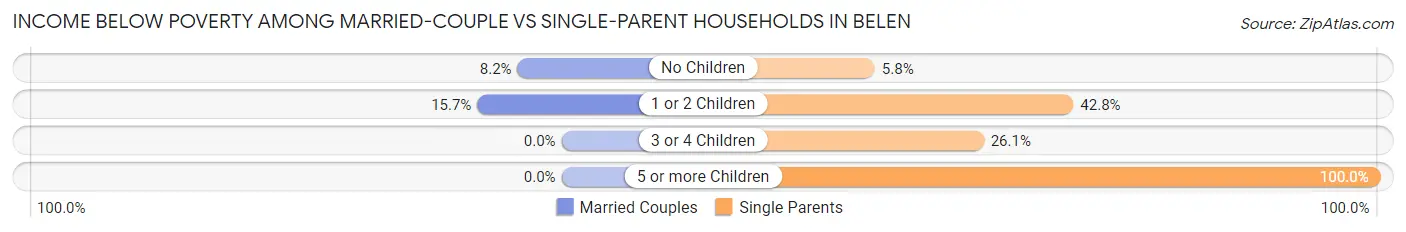
| Children | Married-Couple Families | Single-Parent Households |
| No Children | 44 (8.2%) | 27 (5.8%) |
| 1 or 2 Children | 19 (15.7%) | 184 (42.8%) |
| 3 or 4 Children | 0 (0.0%) | 18 (26.1%) |
| 5 or more Children | 0 (0.0%) | 12 (100.0%) |
| Total | 63 (9.6%) | 241 (24.7%) |
Race in Belen
The most populous races in Belen are Hispanic or Latino (5,139 | 69.8%), White / Caucasian (4,404 | 59.8%), and Two or more Races (1,704 | 23.1%).
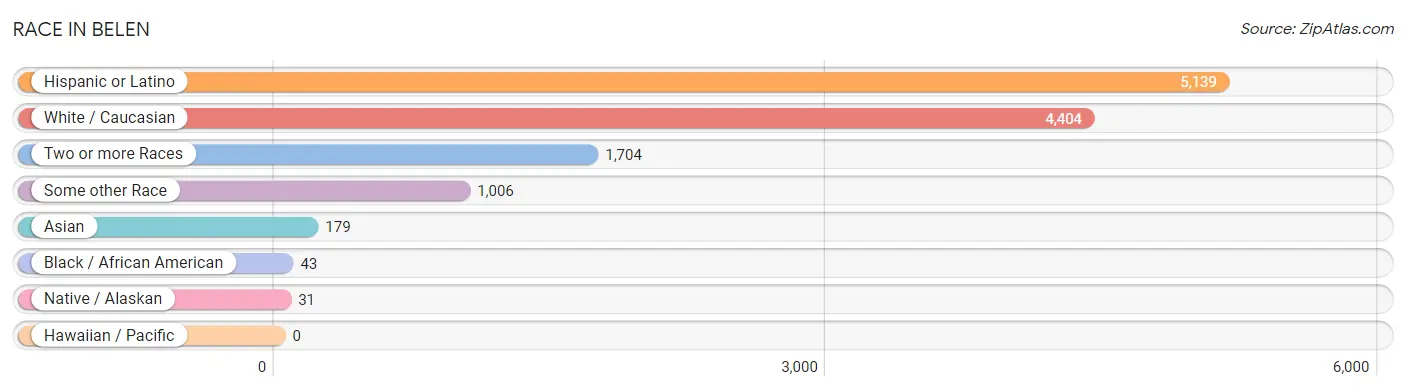
| Race | # Population | % Population |
| Asian | 179 | 2.4% |
| Black / African American | 43 | 0.6% |
| Hawaiian / Pacific | 0 | 0.0% |
| Hispanic or Latino | 5,139 | 69.8% |
| Native / Alaskan | 31 | 0.4% |
| White / Caucasian | 4,404 | 59.8% |
| Two or more Races | 1,704 | 23.1% |
| Some other Race | 1,006 | 13.7% |
| Total | 7,367 | 100.0% |
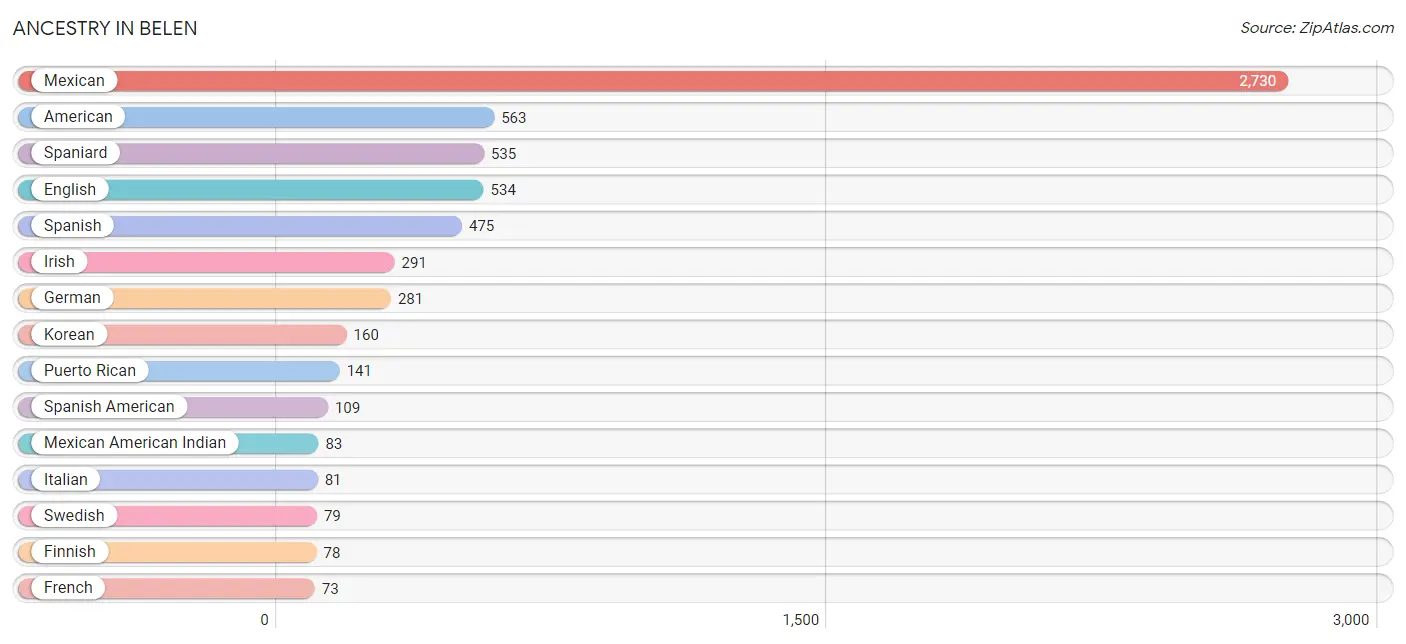
Ancestry in Belen
The most populous ancestries reported in Belen are Mexican (2,730 | 37.1%), American (563 | 7.6%), Spaniard (535 | 7.3%), English (534 | 7.2%), and Spanish (475 | 6.5%), together accounting for 65.7% of all Belen residents.
| Ancestry | # Population | % Population |
| Albanian | 4 | 0.1% |
| American | 563 | 7.6% |
| Apache | 24 | 0.3% |
| Austrian | 4 | 0.1% |
| Belgian | 2 | 0.0% |
| Bhutanese | 42 | 0.6% |
| British | 28 | 0.4% |
| Comanche | 11 | 0.2% |
| Cuban | 30 | 0.4% |
| Czech | 5 | 0.1% |
| Dutch | 27 | 0.4% |
| Eastern European | 12 | 0.2% |
| English | 534 | 7.2% |
| European | 66 | 0.9% |
| Finnish | 78 | 1.1% |
| French | 73 | 1.0% |
| French Canadian | 12 | 0.2% |
| German | 281 | 3.8% |
| Greek | 4 | 0.1% |
| Irish | 291 | 4.0% |
| Iroquois | 19 | 0.3% |
| Italian | 81 | 1.1% |
| Korean | 160 | 2.2% |
| Mexican | 2,730 | 37.1% |
| Mexican American Indian | 83 | 1.1% |
| Navajo | 57 | 0.8% |
| Norwegian | 26 | 0.4% |
| Polish | 4 | 0.1% |
| Portuguese | 24 | 0.3% |
| Potawatomi | 66 | 0.9% |
| Puerto Rican | 141 | 1.9% |
| Scandinavian | 12 | 0.2% |
| Scotch-Irish | 28 | 0.4% |
| Scottish | 43 | 0.6% |
| Spaniard | 535 | 7.3% |
| Spanish | 475 | 6.5% |
| Spanish American | 109 | 1.5% |
| Swedish | 79 | 1.1% |
| Ukrainian | 16 | 0.2% |
| Ute | 38 | 0.5% |
| Welsh | 28 | 0.4% | View All 41 Rows |
Immigrants in Belen
The most numerous immigrant groups reported in Belen came from Central America (597 | 8.1%), Latin America (597 | 8.1%), Mexico (597 | 8.1%), Asia (137 | 1.9%), and Philippines (137 | 1.9%), together accounting for 28.0% of all Belen residents.
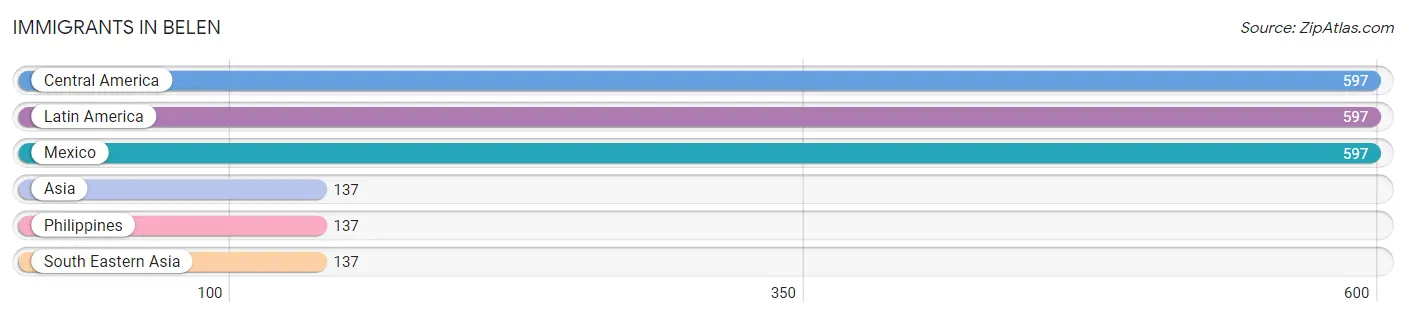
| Immigration Origin | # Population | % Population |
| Asia | 137 | 1.9% |
| Central America | 597 | 8.1% |
| Latin America | 597 | 8.1% |
| Mexico | 597 | 8.1% |
| Philippines | 137 | 1.9% |
| South Eastern Asia | 137 | 1.9% | View All 6 Rows |
Sex and Age in Belen
Sex and Age in Belen
The most populous age groups in Belen are 60 to 64 Years (532 | 14.5%) for men and 35 to 39 Years (339 | 9.2%) for women.
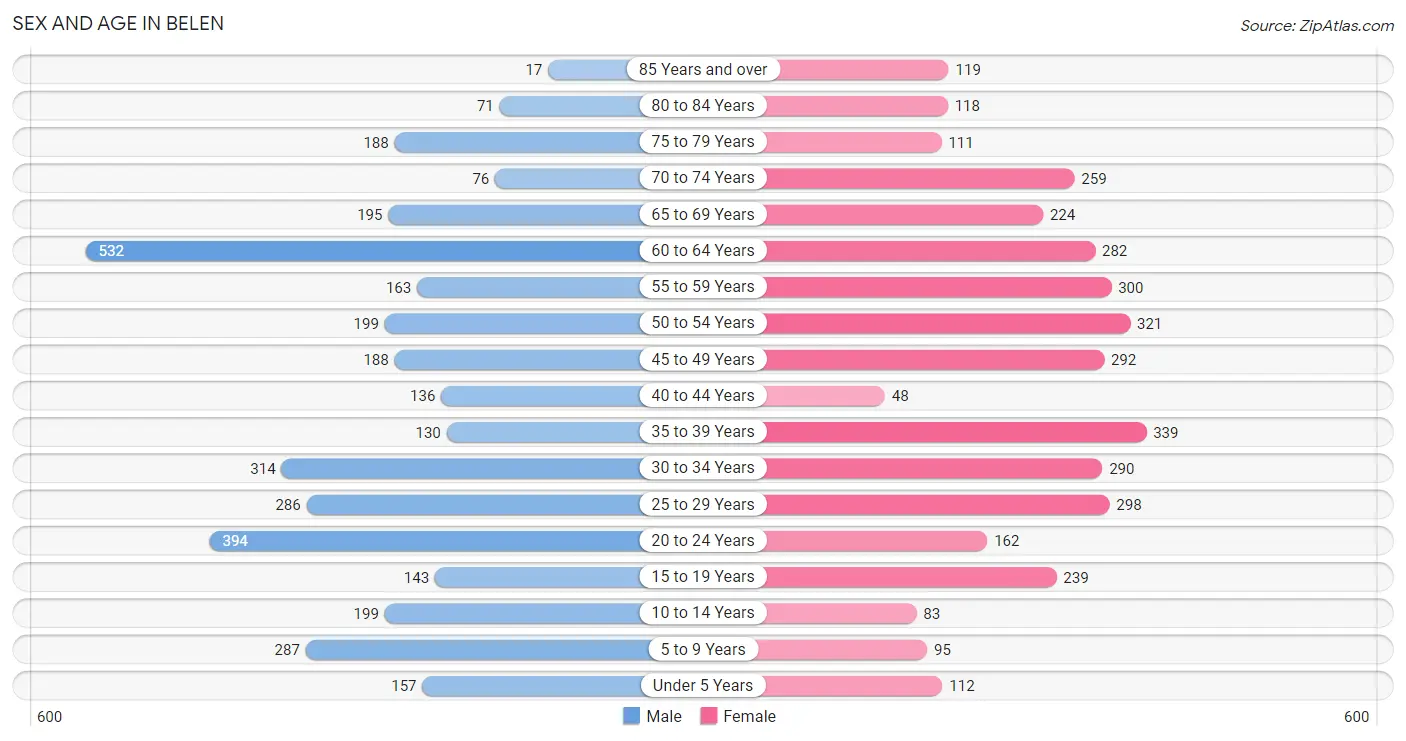
| Age Bracket | Male | Female |
| Under 5 Years | 157 (4.3%) | 112 (3.0%) |
| 5 to 9 Years | 287 (7.8%) | 95 (2.6%) |
| 10 to 14 Years | 199 (5.4%) | 83 (2.2%) |
| 15 to 19 Years | 143 (3.9%) | 239 (6.5%) |
| 20 to 24 Years | 394 (10.7%) | 162 (4.4%) |
| 25 to 29 Years | 286 (7.8%) | 298 (8.1%) |
| 30 to 34 Years | 314 (8.5%) | 290 (7.9%) |
| 35 to 39 Years | 130 (3.5%) | 339 (9.2%) |
| 40 to 44 Years | 136 (3.7%) | 48 (1.3%) |
| 45 to 49 Years | 188 (5.1%) | 292 (7.9%) |
| 50 to 54 Years | 199 (5.4%) | 321 (8.7%) |
| 55 to 59 Years | 163 (4.4%) | 300 (8.1%) |
| 60 to 64 Years | 532 (14.5%) | 282 (7.6%) |
| 65 to 69 Years | 195 (5.3%) | 224 (6.1%) |
| 70 to 74 Years | 76 (2.1%) | 259 (7.0%) |
| 75 to 79 Years | 188 (5.1%) | 111 (3.0%) |
| 80 to 84 Years | 71 (1.9%) | 118 (3.2%) |
| 85 Years and over | 17 (0.5%) | 119 (3.2%) |
| Total | 3,675 (100.0%) | 3,692 (100.0%) |
Families and Households in Belen
Median Family Size in Belen
The median family size in Belen is 3.48 persons per family, with single female/mother families (876 | 53.6%) accounting for the largest median family size of 3.99 persons per family. On the other hand, married-couple families (660 | 40.4%) represent the smallest median family size with 2.82 persons per family.
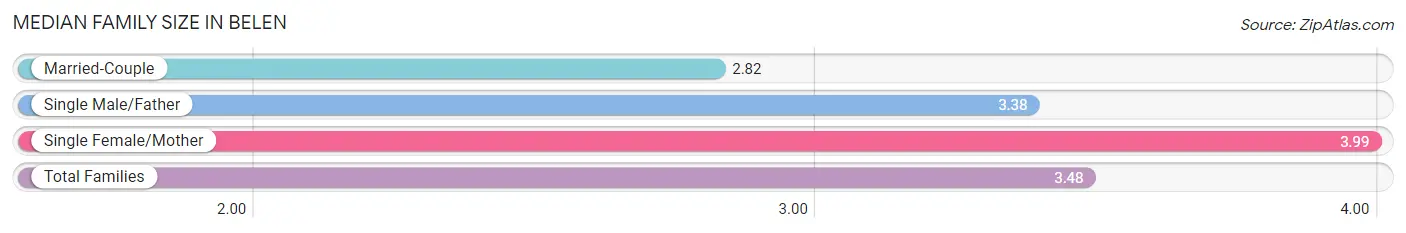
| Family Type | # Families | Family Size |
| Married-Couple | 660 (40.4%) | 2.82 |
| Single Male/Father | 99 (6.1%) | 3.38 |
| Single Female/Mother | 876 (53.6%) | 3.99 |
| Total Families | 1,635 (100.0%) | 3.48 |
Median Household Size in Belen
The median household size in Belen is 2.70 persons per household, with single female/mother households (876 | 32.6%) accounting for the largest median household size of 4.28 persons per household. non-family households (1,049 | 39.1%) represent the smallest median household size with 1.22 persons per household.
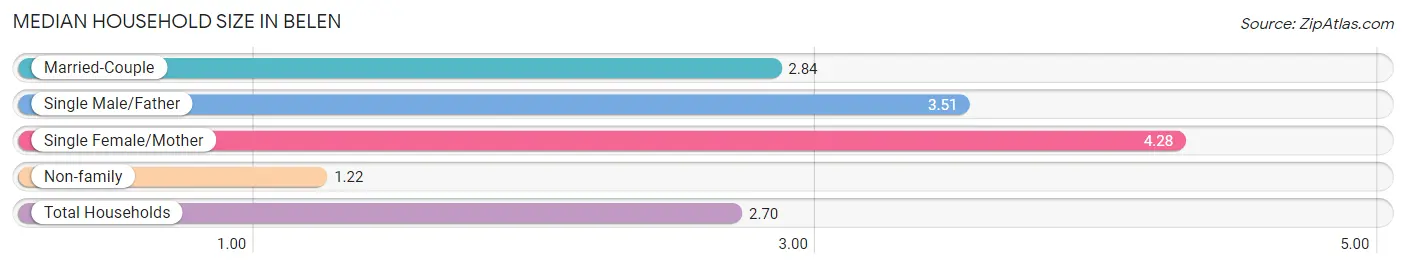
| Household Type | # Households | Household Size |
| Married-Couple | 660 (24.6%) | 2.84 |
| Single Male/Father | 99 (3.7%) | 3.51 |
| Single Female/Mother | 876 (32.6%) | 4.28 |
| Non-family | 1,049 (39.1%) | 1.22 |
| Total Households | 2,684 (100.0%) | 2.70 |
Household Size by Marriage Status in Belen
Out of a total of 2,684 households in Belen, 1,635 (60.9%) are family households, while 1,049 (39.1%) are nonfamily households. The most numerous type of family households are 2-person households, comprising 913, and the most common type of nonfamily households are 1-person households, comprising 900.
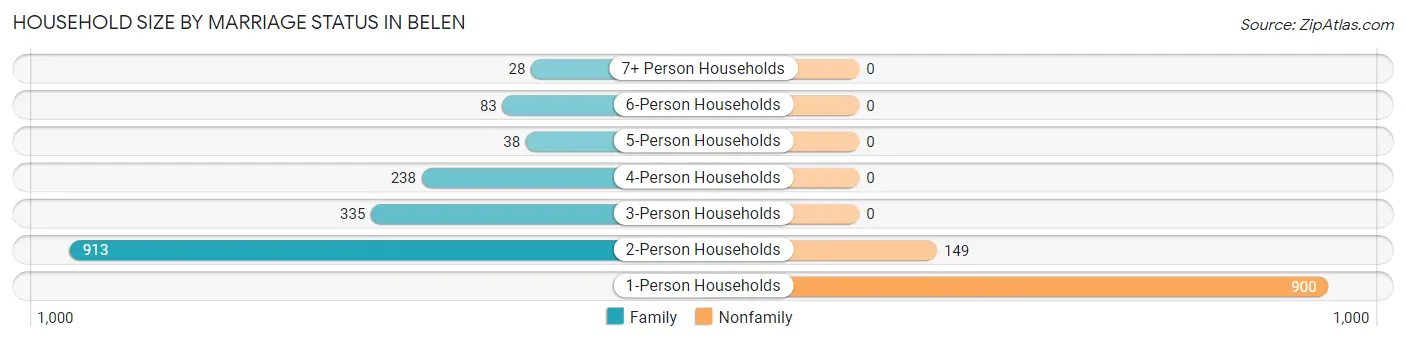
| Household Size | Family Households | Nonfamily Households |
| 1-Person Households | - | 900 (33.5%) |
| 2-Person Households | 913 (34.0%) | 149 (5.6%) |
| 3-Person Households | 335 (12.5%) | 0 (0.0%) |
| 4-Person Households | 238 (8.9%) | 0 (0.0%) |
| 5-Person Households | 38 (1.4%) | 0 (0.0%) |
| 6-Person Households | 83 (3.1%) | 0 (0.0%) |
| 7+ Person Households | 28 (1.0%) | 0 (0.0%) |
| Total | 1,635 (60.9%) | 1,049 (39.1%) |
Female Fertility in Belen
Fertility by Age in Belen
Average fertility rate in Belen is 134.0 births per 1,000 women. Women in the age bracket of 20 to 34 years have the highest fertility rate with 237.0 births per 1,000 women. Women in the age bracket of 20 to 34 years acount for 76.7% of all women with births.
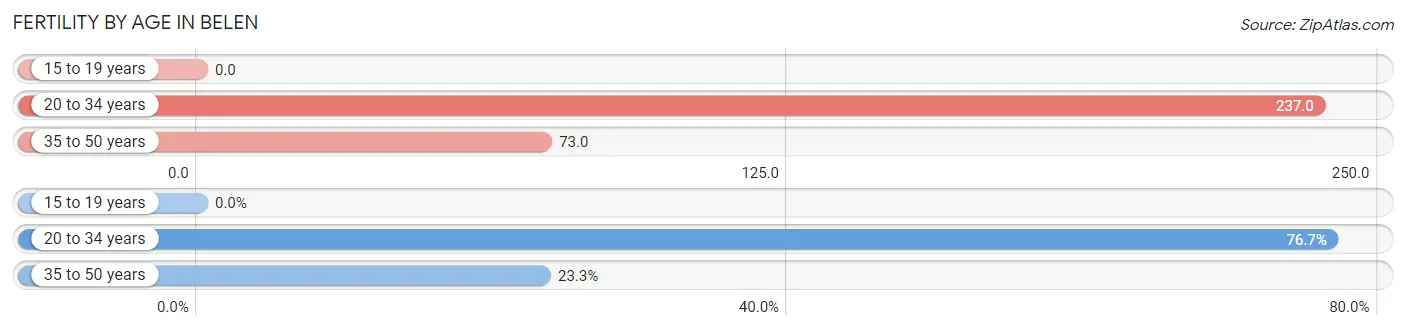
| Age Bracket | Women with Births | Births / 1,000 Women |
| 15 to 19 years | 0 (0.0%) | 0.0 |
| 20 to 34 years | 178 (76.7%) | 237.0 |
| 35 to 50 years | 54 (23.3%) | 73.0 |
| Total | 232 (100.0%) | 134.0 |
Fertility by Age by Marriage Status in Belen
29.3% of women with births (232) in Belen are married. The highest percentage of unmarried women with births falls into 20 to 34 years age bracket with 92.1% of them unmarried at the time of birth, while the lowest percentage of unmarried women with births belong to 35 to 50 years age bracket with 0.0% of them unmarried.
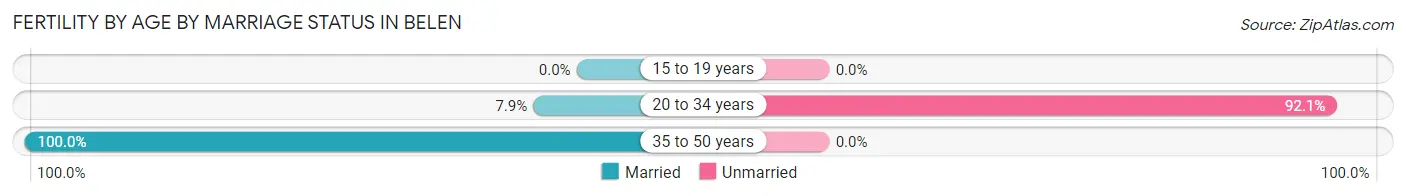
| Age Bracket | Married | Unmarried |
| 15 to 19 years | 0 (0.0%) | 0 (0.0%) |
| 20 to 34 years | 14 (7.9%) | 164 (92.1%) |
| 35 to 50 years | 54 (100.0%) | 0 (0.0%) |
| Total | 68 (29.3%) | 164 (70.7%) |
Fertility by Education in Belen
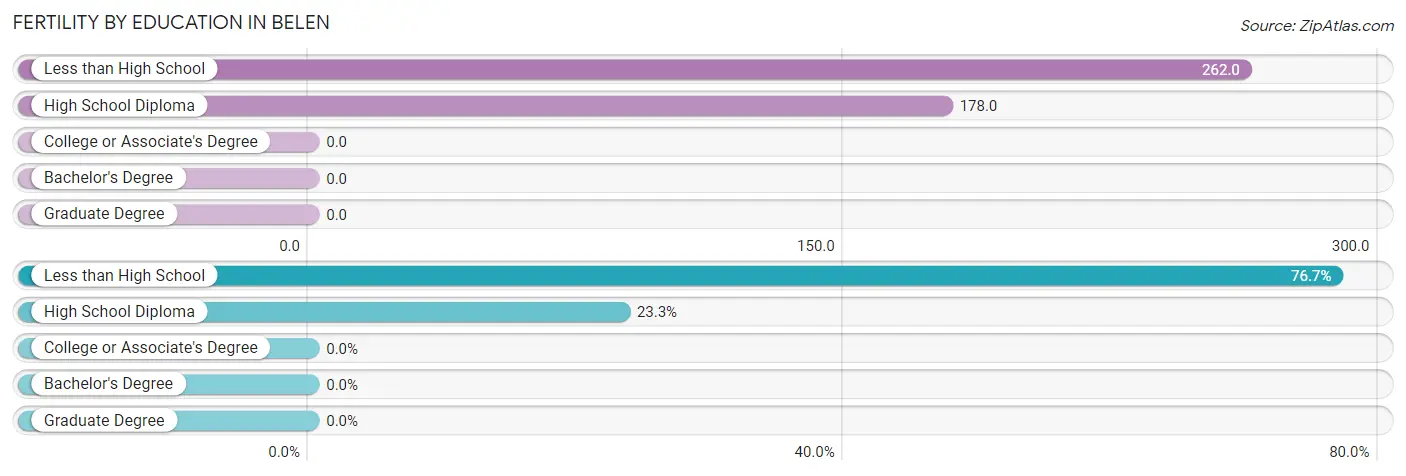
| Educational Attainment | Women with Births | Births / 1,000 Women |
| Less than High School | 178 (76.7%) | 262.0 |
| High School Diploma | 54 (23.3%) | 178.0 |
| College or Associate's Degree | 0 (0.0%) | 0.0 |
| Bachelor's Degree | 0 (0.0%) | 0.0 |
| Graduate Degree | 0 (0.0%) | 0.0 |
| Total | 232 (100.0%) | 134.0 |
Fertility by Education by Marriage Status in Belen
70.7% of women with births in Belen are unmarried. Women with the educational attainment of high school diploma are most likely to be married with 100.0% of them married at childbirth, while women with the educational attainment of less than high school are least likely to be married with 92.1% of them unmarried at childbirth.
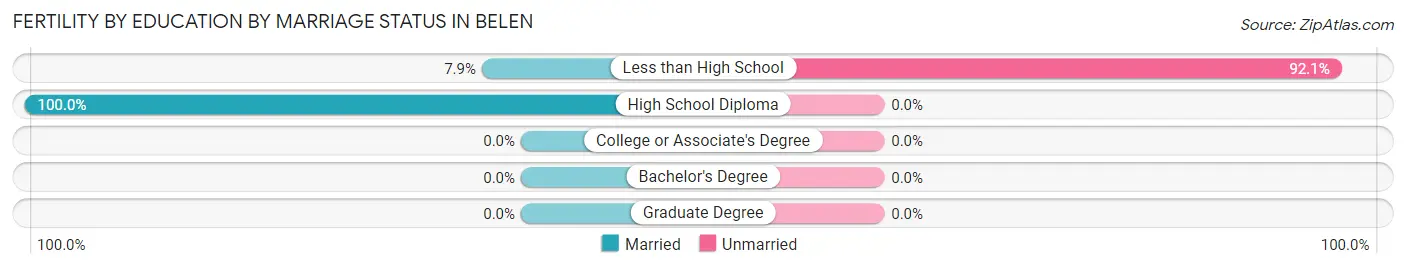
| Educational Attainment | Married | Unmarried |
| Less than High School | 14 (7.9%) | 164 (92.1%) |
| High School Diploma | 54 (100.0%) | 0 (0.0%) |
| College or Associate's Degree | 0 (0.0%) | 0 (0.0%) |
| Bachelor's Degree | 0 (0.0%) | 0 (0.0%) |
| Graduate Degree | 0 (0.0%) | 0 (0.0%) |
| Total | 68 (29.3%) | 164 (70.7%) |
Employment Characteristics in Belen
Employment by Class of Employer in Belen
Among the 2,585 employed individuals in Belen, private company employees (1,545 | 59.8%), state government employees (475 | 18.4%), and local government employees (297 | 11.5%) make up the most common classes of employment.
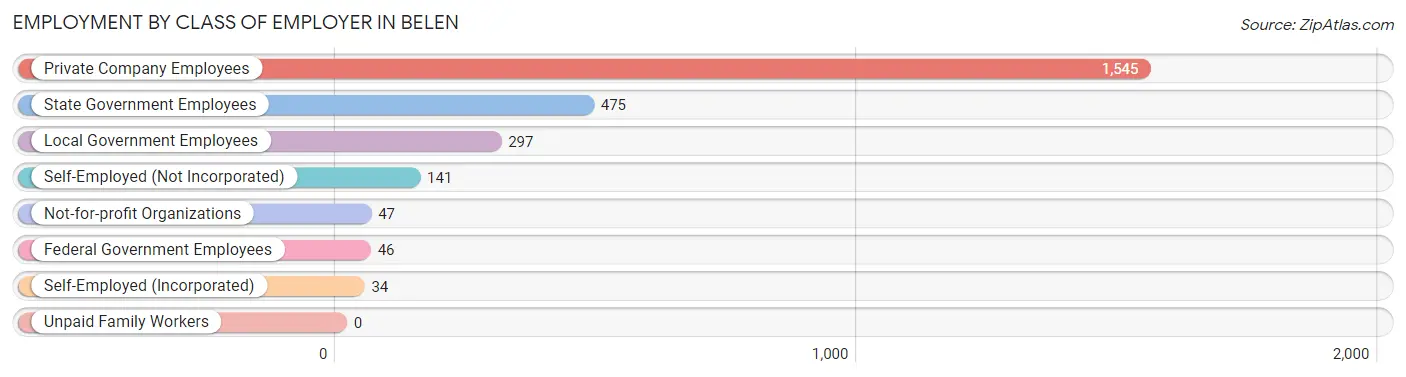
| Employer Class | # Employees | % Employees |
| Private Company Employees | 1,545 | 59.8% |
| Self-Employed (Incorporated) | 34 | 1.3% |
| Self-Employed (Not Incorporated) | 141 | 5.4% |
| Not-for-profit Organizations | 47 | 1.8% |
| Local Government Employees | 297 | 11.5% |
| State Government Employees | 475 | 18.4% |
| Federal Government Employees | 46 | 1.8% |
| Unpaid Family Workers | 0 | 0.0% |
| Total | 2,585 | 100.0% |
Employment Status by Age in Belen
According to the labor force statistics for Belen, out of the total population over 16 years of age (6,367), 45.4% or 2,891 individuals are in the labor force, with 8.0% or 231 of them unemployed. The age group with the highest labor force participation rate is 55 to 59 years, with 72.1% or 334 individuals in the labor force. Within the labor force, the 20 to 24 years age range has the highest percentage of unemployed individuals, with 30.9% or 117 of them being unemployed.
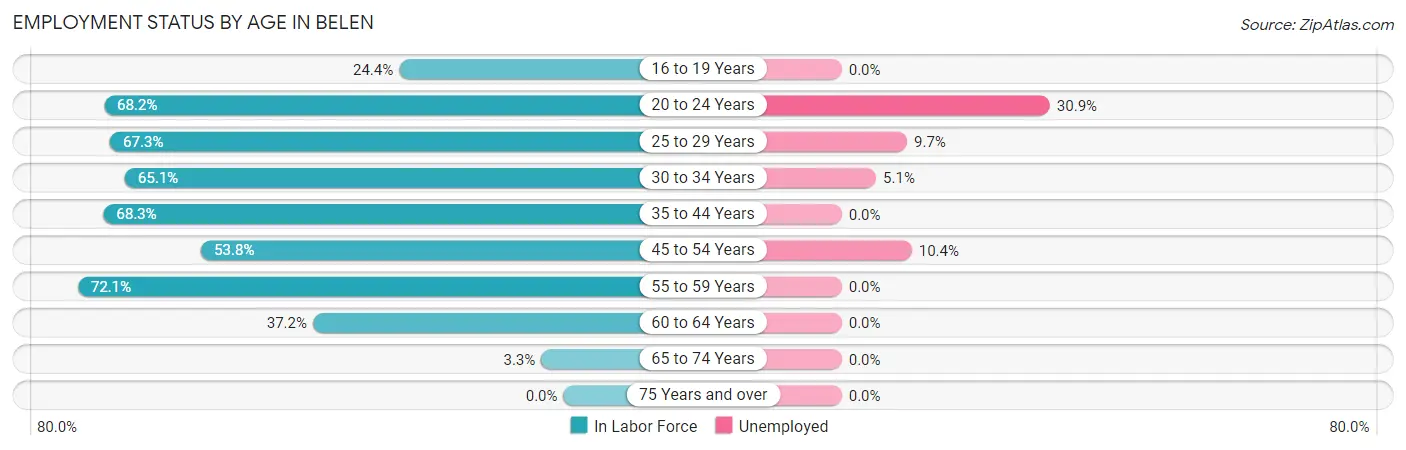
| Age Bracket | In Labor Force | Unemployed |
| 16 to 19 Years | 77 (24.4%) | 0 (0.0%) |
| 20 to 24 Years | 379 (68.2%) | 117 (30.9%) |
| 25 to 29 Years | 393 (67.3%) | 38 (9.7%) |
| 30 to 34 Years | 393 (65.1%) | 20 (5.1%) |
| 35 to 44 Years | 446 (68.3%) | 0 (0.0%) |
| 45 to 54 Years | 538 (53.8%) | 56 (10.4%) |
| 55 to 59 Years | 334 (72.1%) | 0 (0.0%) |
| 60 to 64 Years | 303 (37.2%) | 0 (0.0%) |
| 65 to 74 Years | 25 (3.3%) | 0 (0.0%) |
| 75 Years and over | 0 (0.0%) | 0 (0.0%) |
| Total | 2,891 (45.4%) | 231 (8.0%) |
Employment Status by Educational Attainment in Belen
According to labor force statistics for Belen, 58.5% of individuals (2,409) out of the total population between 25 and 64 years of age (4,118) are in the labor force, with 4.7% or 113 of them being unemployed. The group with the highest labor force participation rate are those with the educational attainment of bachelor's degree or higher, with 74.2% or 564 individuals in the labor force. Within the labor force, individuals with high school diploma education have the highest percentage of unemployment, with 6.3% or 38 of them being unemployed.
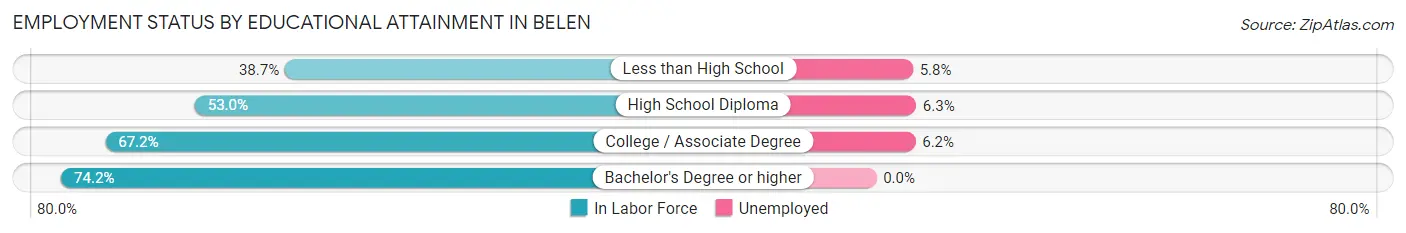
| Educational Attainment | In Labor Force | Unemployed |
| Less than High School | 343 (38.7%) | 51 (5.8%) |
| High School Diploma | 600 (53.0%) | 71 (6.3%) |
| College / Associate Degree | 899 (67.2%) | 83 (6.2%) |
| Bachelor's Degree or higher | 564 (74.2%) | 0 (0.0%) |
| Total | 2,409 (58.5%) | 194 (4.7%) |
Employment Occupations by Sex in Belen
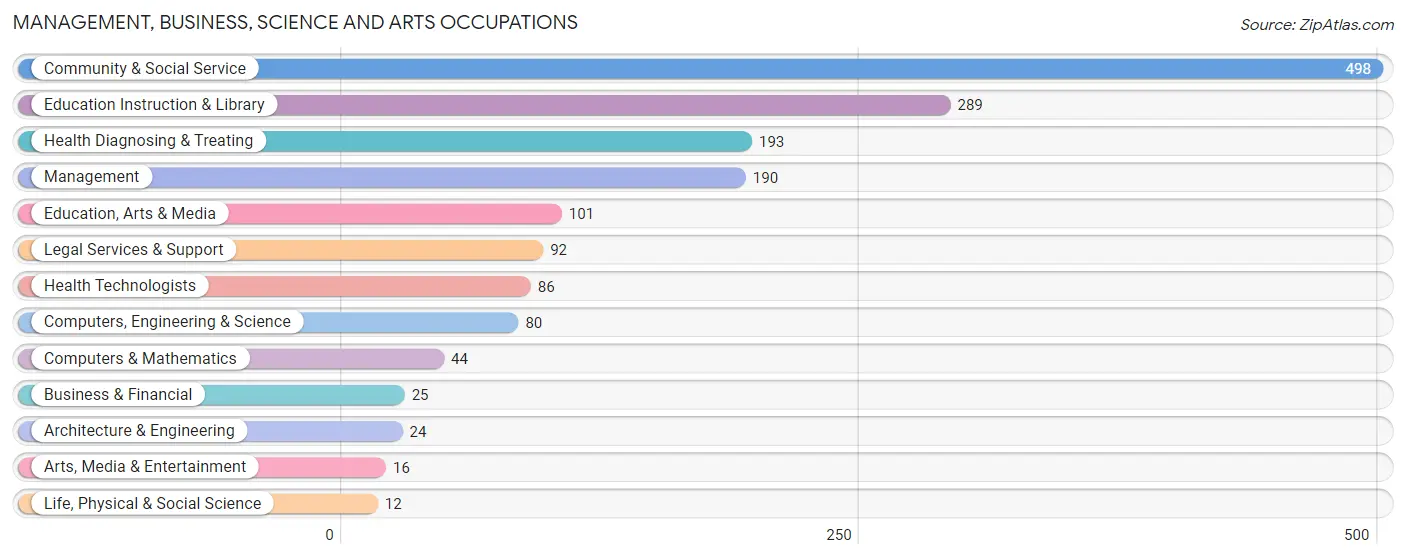
Management, Business, Science and Arts Occupations
The most common Management, Business, Science and Arts occupations in Belen are Community & Social Service (498 | 18.7%), Education Instruction & Library (289 | 10.9%), Health Diagnosing & Treating (193 | 7.3%), Management (190 | 7.1%), and Education, Arts & Media (101 | 3.8%).
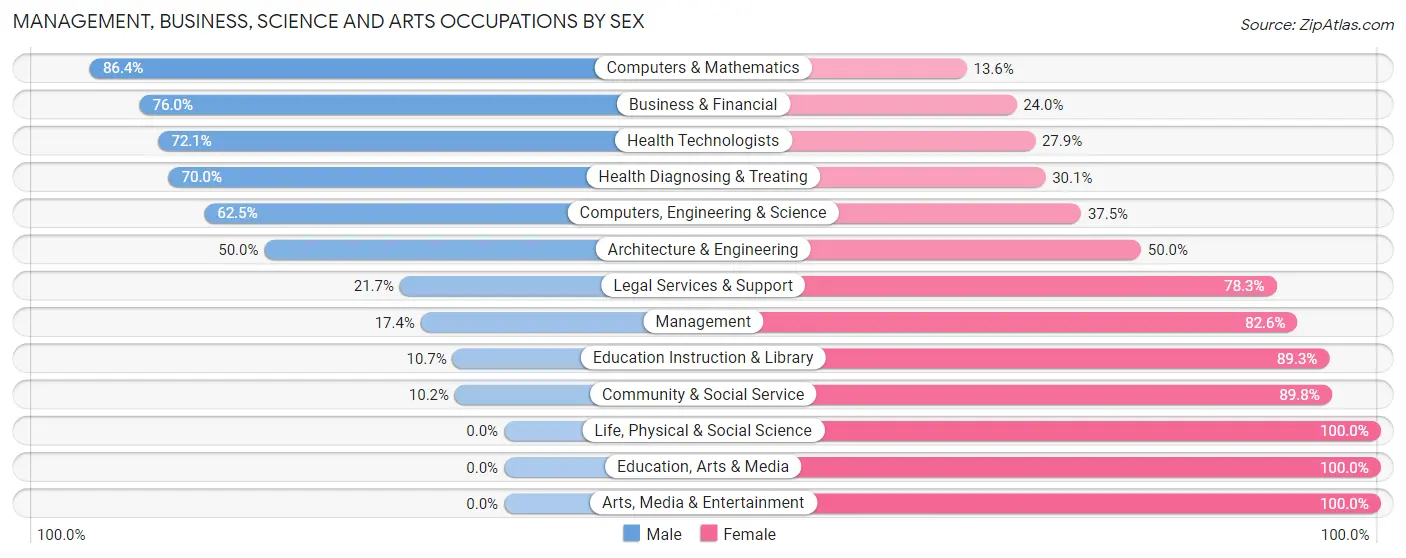
Management, Business, Science and Arts Occupations by Sex
Within the Management, Business, Science and Arts occupations in Belen, the most male-oriented occupations are Computers & Mathematics (86.4%), Business & Financial (76.0%), and Health Technologists (72.1%), while the most female-oriented occupations are Life, Physical & Social Science (100.0%), Education, Arts & Media (100.0%), and Arts, Media & Entertainment (100.0%).
| Occupation | Male | Female |
| Management | 33 (17.4%) | 157 (82.6%) |
| Business & Financial | 19 (76.0%) | 6 (24.0%) |
| Computers, Engineering & Science | 50 (62.5%) | 30 (37.5%) |
| Computers & Mathematics | 38 (86.4%) | 6 (13.6%) |
| Architecture & Engineering | 12 (50.0%) | 12 (50.0%) |
| Life, Physical & Social Science | 0 (0.0%) | 12 (100.0%) |
| Community & Social Service | 51 (10.2%) | 447 (89.8%) |
| Education, Arts & Media | 0 (0.0%) | 101 (100.0%) |
| Legal Services & Support | 20 (21.7%) | 72 (78.3%) |
| Education Instruction & Library | 31 (10.7%) | 258 (89.3%) |
| Arts, Media & Entertainment | 0 (0.0%) | 16 (100.0%) |
| Health Diagnosing & Treating | 135 (70.0%) | 58 (30.0%) |
| Health Technologists | 62 (72.1%) | 24 (27.9%) |
| Total (Category) | 288 (29.2%) | 698 (70.8%) |
| Total (Overall) | 1,237 (46.6%) | 1,420 (53.4%) |
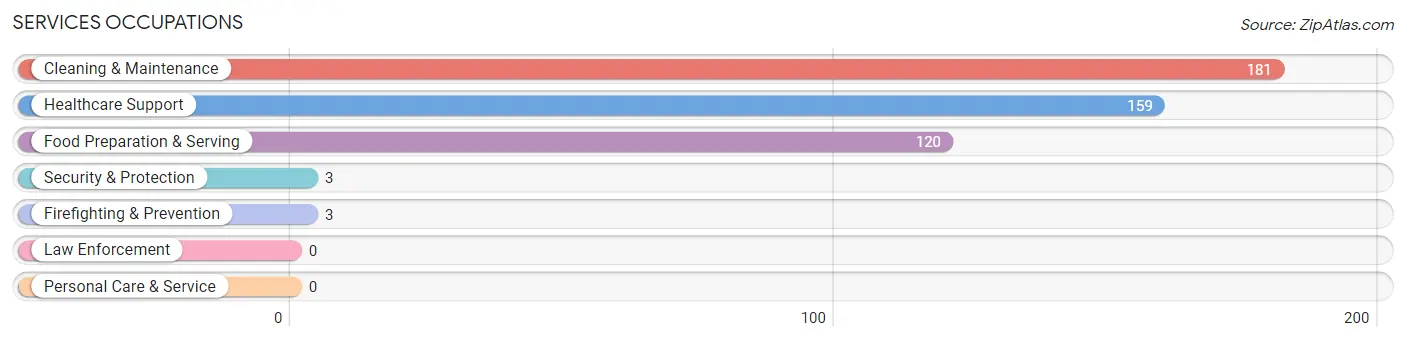
Services Occupations
The most common Services occupations in Belen are Cleaning & Maintenance (181 | 6.8%), Healthcare Support (159 | 6.0%), Food Preparation & Serving (120 | 4.5%), Security & Protection (3 | 0.1%), and Firefighting & Prevention (3 | 0.1%).
Services Occupations by Sex
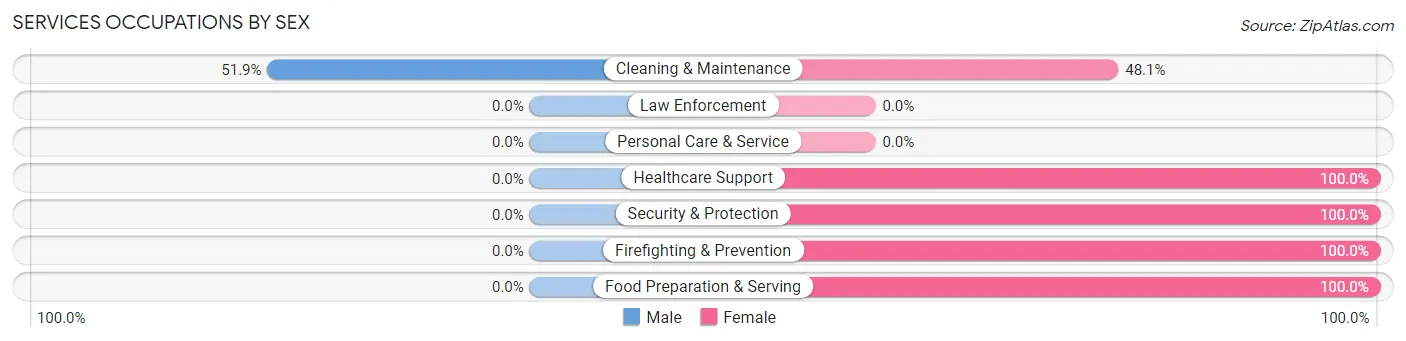
| Occupation | Male | Female |
| Healthcare Support | 0 (0.0%) | 159 (100.0%) |
| Security & Protection | 0 (0.0%) | 3 (100.0%) |
| Firefighting & Prevention | 0 (0.0%) | 3 (100.0%) |
| Law Enforcement | 0 (0.0%) | 0 (0.0%) |
| Food Preparation & Serving | 0 (0.0%) | 120 (100.0%) |
| Cleaning & Maintenance | 94 (51.9%) | 87 (48.1%) |
| Personal Care & Service | 0 (0.0%) | 0 (0.0%) |
| Total (Category) | 94 (20.3%) | 369 (79.7%) |
| Total (Overall) | 1,237 (46.6%) | 1,420 (53.4%) |
Sales and Office Occupations
The most common Sales and Office occupations in Belen are Office & Administration (317 | 11.9%), and Sales & Related (177 | 6.7%).
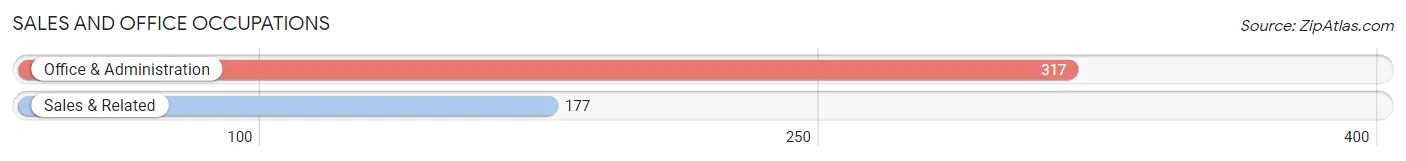
Sales and Office Occupations by Sex
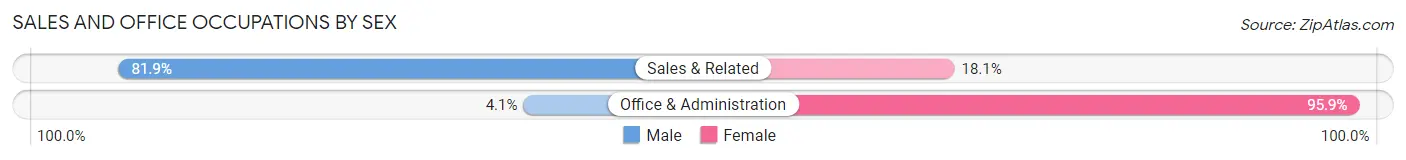
| Occupation | Male | Female |
| Sales & Related | 145 (81.9%) | 32 (18.1%) |
| Office & Administration | 13 (4.1%) | 304 (95.9%) |
| Total (Category) | 158 (32.0%) | 336 (68.0%) |
| Total (Overall) | 1,237 (46.6%) | 1,420 (53.4%) |
Natural Resources, Construction and Maintenance Occupations
The most common Natural Resources, Construction and Maintenance occupations in Belen are Farming, Fishing & Forestry (124 | 4.7%), Construction & Extraction (98 | 3.7%), and Installation, Maintenance & Repair (30 | 1.1%).
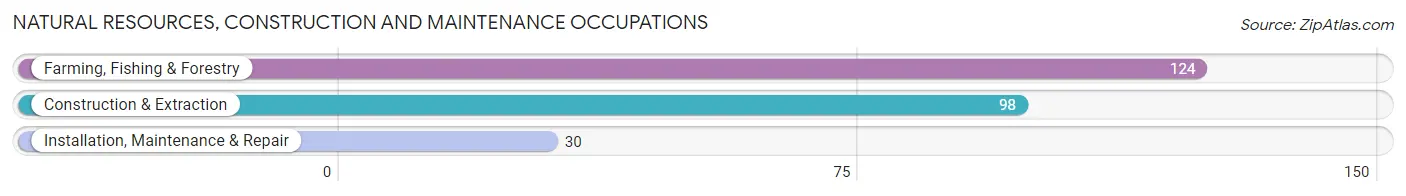
Natural Resources, Construction and Maintenance Occupations by Sex
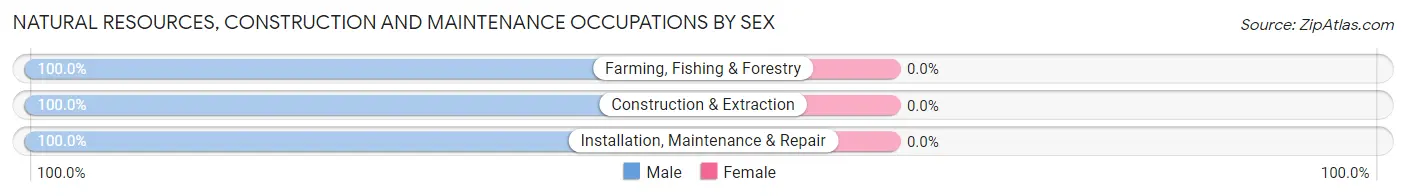
| Occupation | Male | Female |
| Farming, Fishing & Forestry | 124 (100.0%) | 0 (0.0%) |
| Construction & Extraction | 98 (100.0%) | 0 (0.0%) |
| Installation, Maintenance & Repair | 30 (100.0%) | 0 (0.0%) |
| Total (Category) | 252 (100.0%) | 0 (0.0%) |
| Total (Overall) | 1,237 (46.6%) | 1,420 (53.4%) |
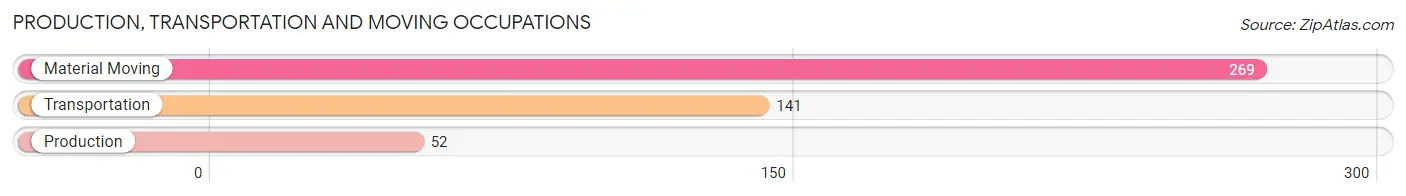
Production, Transportation and Moving Occupations
The most common Production, Transportation and Moving occupations in Belen are Material Moving (269 | 10.1%), Transportation (141 | 5.3%), and Production (52 | 2.0%).
Production, Transportation and Moving Occupations by Sex
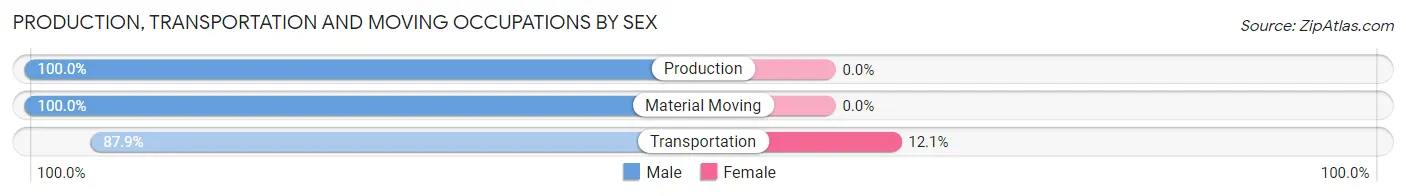
| Occupation | Male | Female |
| Production | 52 (100.0%) | 0 (0.0%) |
| Transportation | 124 (87.9%) | 17 (12.1%) |
| Material Moving | 269 (100.0%) | 0 (0.0%) |
| Total (Category) | 445 (96.3%) | 17 (3.7%) |
| Total (Overall) | 1,237 (46.6%) | 1,420 (53.4%) |
Employment Industries by Sex in Belen
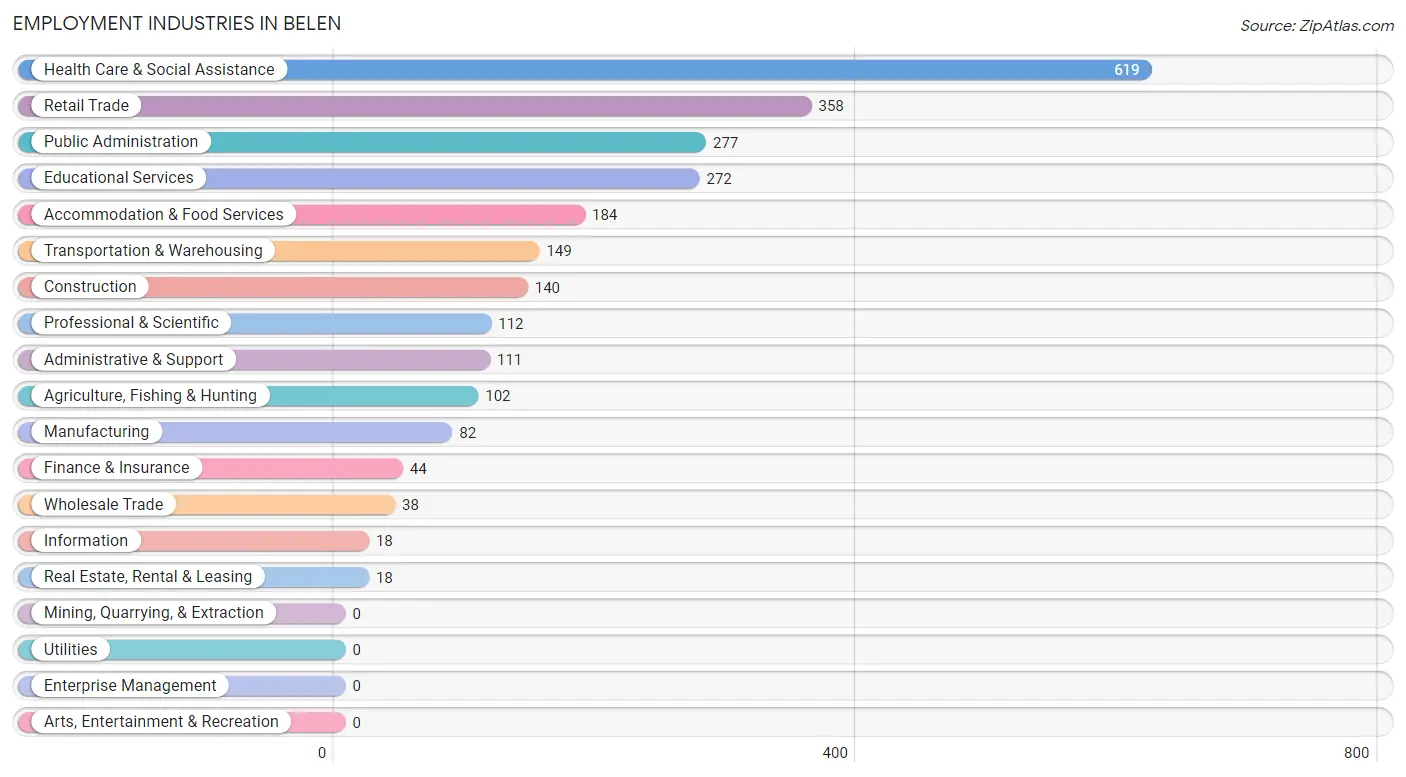
Employment Industries in Belen
The major employment industries in Belen include Health Care & Social Assistance (619 | 23.3%), Retail Trade (358 | 13.5%), Public Administration (277 | 10.4%), Educational Services (272 | 10.2%), and Accommodation & Food Services (184 | 6.9%).
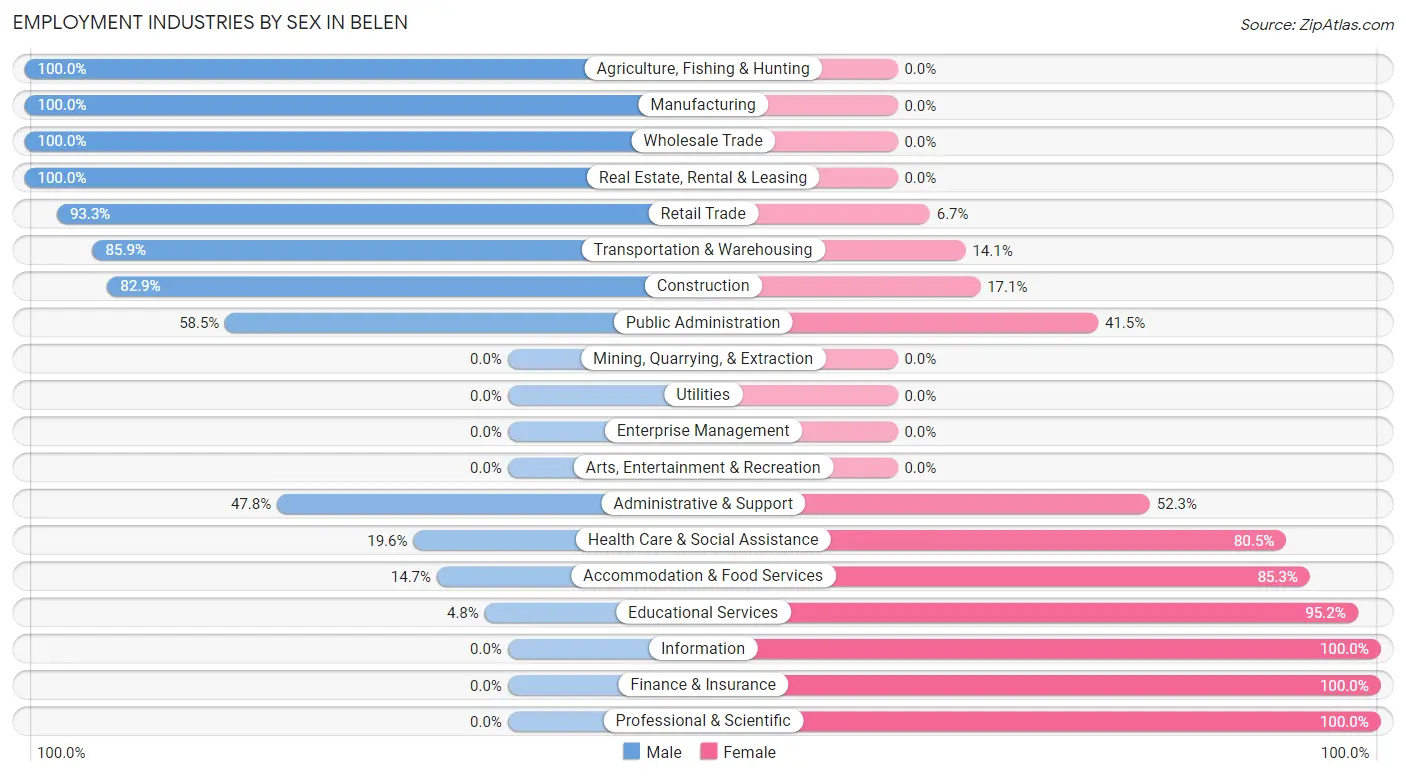
Employment Industries by Sex in Belen
The Belen industries that see more men than women are Agriculture, Fishing & Hunting (100.0%), Manufacturing (100.0%), and Wholesale Trade (100.0%), whereas the industries that tend to have a higher number of women are Information (100.0%), Finance & Insurance (100.0%), and Professional & Scientific (100.0%).
| Industry | Male | Female |
| Agriculture, Fishing & Hunting | 102 (100.0%) | 0 (0.0%) |
| Mining, Quarrying, & Extraction | 0 (0.0%) | 0 (0.0%) |
| Construction | 116 (82.9%) | 24 (17.1%) |
| Manufacturing | 82 (100.0%) | 0 (0.0%) |
| Wholesale Trade | 38 (100.0%) | 0 (0.0%) |
| Retail Trade | 334 (93.3%) | 24 (6.7%) |
| Transportation & Warehousing | 128 (85.9%) | 21 (14.1%) |
| Utilities | 0 (0.0%) | 0 (0.0%) |
| Information | 0 (0.0%) | 18 (100.0%) |
| Finance & Insurance | 0 (0.0%) | 44 (100.0%) |
| Real Estate, Rental & Leasing | 18 (100.0%) | 0 (0.0%) |
| Professional & Scientific | 0 (0.0%) | 112 (100.0%) |
| Enterprise Management | 0 (0.0%) | 0 (0.0%) |
| Administrative & Support | 53 (47.7%) | 58 (52.2%) |
| Educational Services | 13 (4.8%) | 259 (95.2%) |
| Health Care & Social Assistance | 121 (19.6%) | 498 (80.4%) |
| Arts, Entertainment & Recreation | 0 (0.0%) | 0 (0.0%) |
| Accommodation & Food Services | 27 (14.7%) | 157 (85.3%) |
| Public Administration | 162 (58.5%) | 115 (41.5%) |
| Total | 1,237 (46.6%) | 1,420 (53.4%) |
Education in Belen
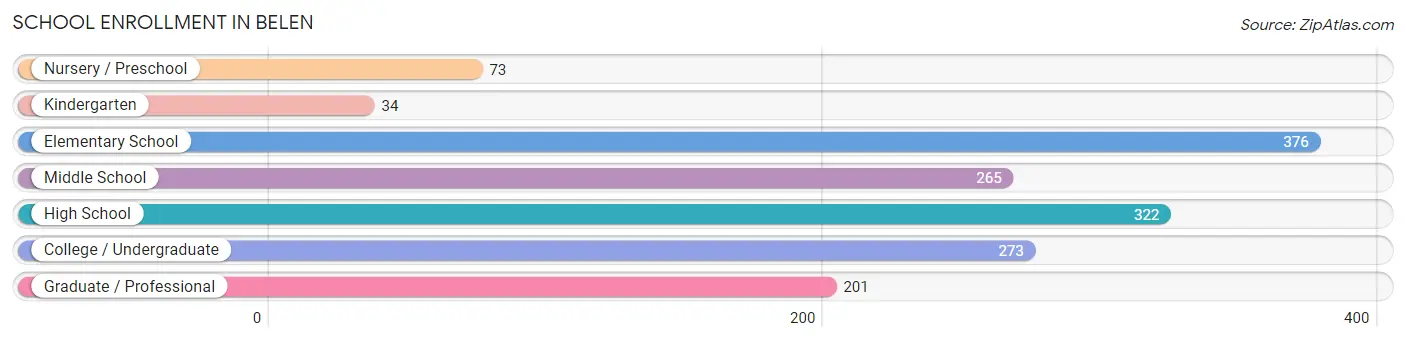
School Enrollment in Belen
The most common levels of schooling among the 1,544 students in Belen are elementary school (376 | 24.3%), high school (322 | 20.8%), and college / undergraduate (273 | 17.7%).
| School Level | # Students | % Students |
| Nursery / Preschool | 73 | 4.7% |
| Kindergarten | 34 | 2.2% |
| Elementary School | 376 | 24.3% |
| Middle School | 265 | 17.2% |
| High School | 322 | 20.8% |
| College / Undergraduate | 273 | 17.7% |
| Graduate / Professional | 201 | 13.0% |
| Total | 1,544 | 100.0% |
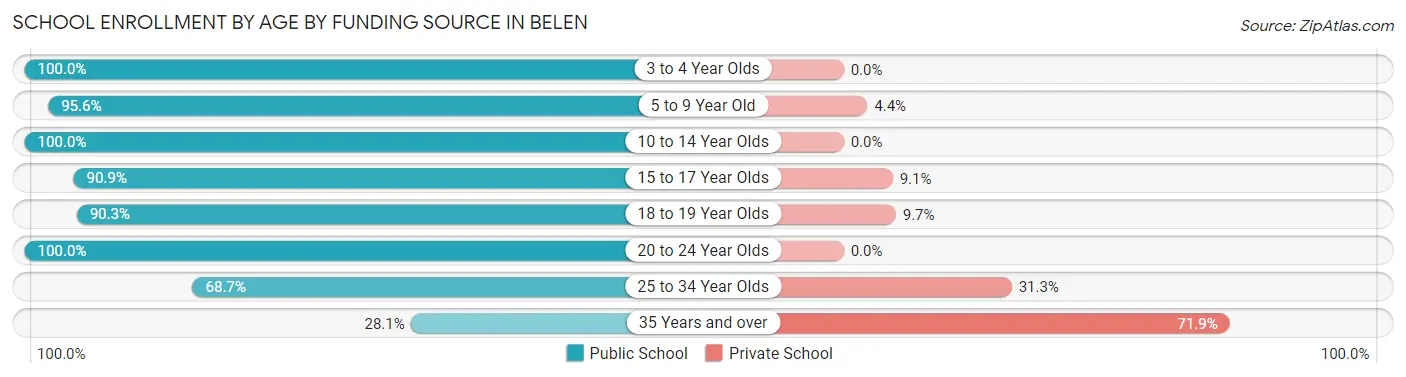
School Enrollment by Age by Funding Source in Belen
Out of a total of 1,544 students who are enrolled in schools in Belen, 202 (13.1%) attend a private institution, while the remaining 1,342 (86.9%) are enrolled in public schools. The age group of 35 years and over has the highest likelihood of being enrolled in private schools, with 115 (71.9% in the age bracket) enrolled. Conversely, the age group of 3 to 4 year olds has the lowest likelihood of being enrolled in a private school, with 103 (100.0% in the age bracket) attending a public institution.
| Age Bracket | Public School | Private School |
| 3 to 4 Year Olds | 103 (100.0%) | 0 (0.0%) |
| 5 to 9 Year Old | 347 (95.6%) | 16 (4.4%) |
| 10 to 14 Year Olds | 282 (100.0%) | 0 (0.0%) |
| 15 to 17 Year Olds | 199 (90.9%) | 20 (9.1%) |
| 18 to 19 Year Olds | 93 (90.3%) | 10 (9.7%) |
| 20 to 24 Year Olds | 183 (100.0%) | 0 (0.0%) |
| 25 to 34 Year Olds | 90 (68.7%) | 41 (31.3%) |
| 35 Years and over | 45 (28.1%) | 115 (71.9%) |
| Total | 1,342 (86.9%) | 202 (13.1%) |
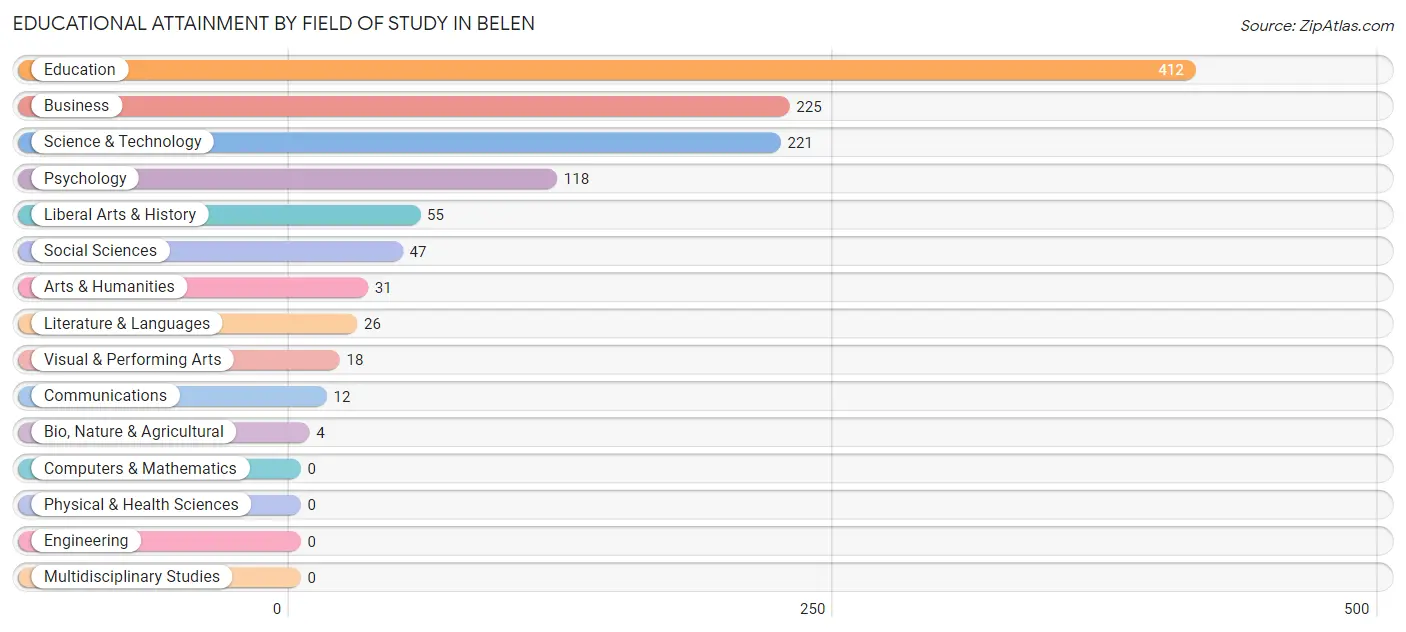
Educational Attainment by Field of Study in Belen
Education (412 | 35.2%), business (225 | 19.3%), science & technology (221 | 18.9%), psychology (118 | 10.1%), and liberal arts & history (55 | 4.7%) are the most common fields of study among 1,169 individuals in Belen who have obtained a bachelor's degree or higher.
| Field of Study | # Graduates | % Graduates |
| Computers & Mathematics | 0 | 0.0% |
| Bio, Nature & Agricultural | 4 | 0.3% |
| Physical & Health Sciences | 0 | 0.0% |
| Psychology | 118 | 10.1% |
| Social Sciences | 47 | 4.0% |
| Engineering | 0 | 0.0% |
| Multidisciplinary Studies | 0 | 0.0% |
| Science & Technology | 221 | 18.9% |
| Business | 225 | 19.3% |
| Education | 412 | 35.2% |
| Literature & Languages | 26 | 2.2% |
| Liberal Arts & History | 55 | 4.7% |
| Visual & Performing Arts | 18 | 1.5% |
| Communications | 12 | 1.0% |
| Arts & Humanities | 31 | 2.6% |
| Total | 1,169 | 100.0% |
Transportation & Commute in Belen
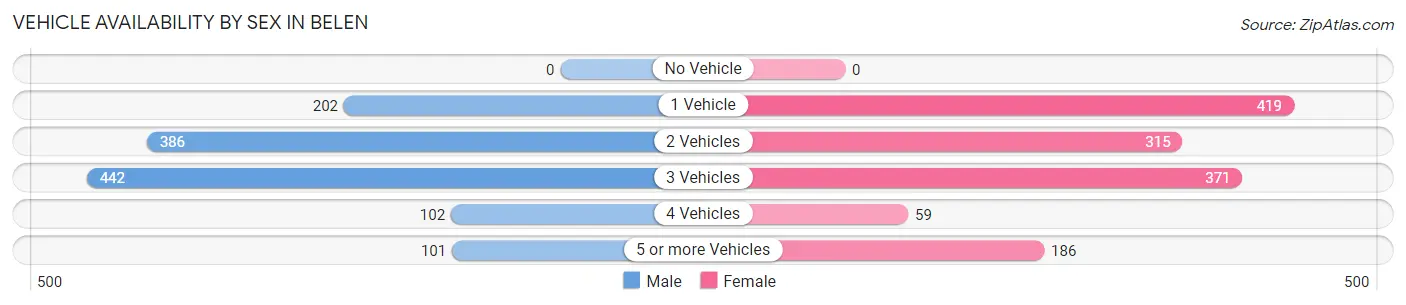
Vehicle Availability by Sex in Belen
The most prevalent vehicle ownership categories in Belen are males with 3 vehicles (442, accounting for 35.8%) and females with 3 vehicles (371, making up 32.7%).
| Vehicles Available | Male | Female |
| No Vehicle | 0 (0.0%) | 0 (0.0%) |
| 1 Vehicle | 202 (16.4%) | 419 (31.0%) |
| 2 Vehicles | 386 (31.3%) | 315 (23.3%) |
| 3 Vehicles | 442 (35.8%) | 371 (27.5%) |
| 4 Vehicles | 102 (8.3%) | 59 (4.4%) |
| 5 or more Vehicles | 101 (8.2%) | 186 (13.8%) |
| Total | 1,233 (100.0%) | 1,350 (100.0%) |
Commute Time in Belen
The most frequently occuring commute durations in Belen are 10 to 14 minutes (506 commuters, 21.2%), 30 to 34 minutes (348 commuters, 14.6%), and 45 to 59 minutes (271 commuters, 11.4%).
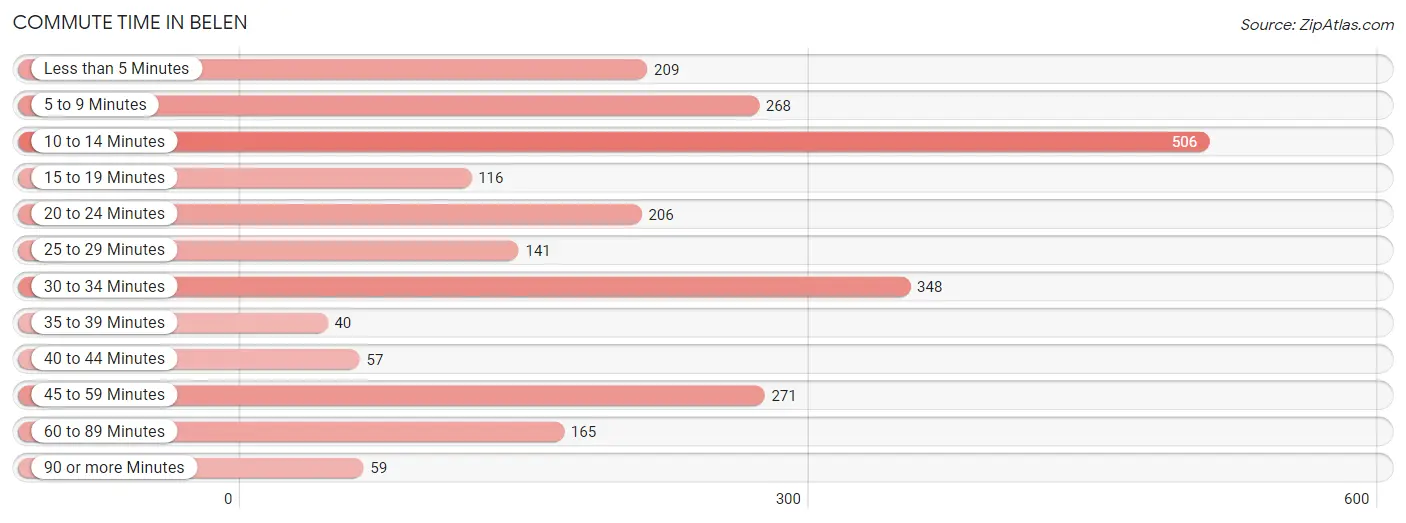
| Commute Time | # Commuters | % Commuters |
| Less than 5 Minutes | 209 | 8.8% |
| 5 to 9 Minutes | 268 | 11.2% |
| 10 to 14 Minutes | 506 | 21.2% |
| 15 to 19 Minutes | 116 | 4.9% |
| 20 to 24 Minutes | 206 | 8.6% |
| 25 to 29 Minutes | 141 | 5.9% |
| 30 to 34 Minutes | 348 | 14.6% |
| 35 to 39 Minutes | 40 | 1.7% |
| 40 to 44 Minutes | 57 | 2.4% |
| 45 to 59 Minutes | 271 | 11.4% |
| 60 to 89 Minutes | 165 | 6.9% |
| 90 or more Minutes | 59 | 2.5% |
Commute Time by Sex in Belen
The most common commute times in Belen are 30 to 34 minutes (259 commuters, 21.8%) for males and 10 to 14 minutes (269 commuters, 22.5%) for females.
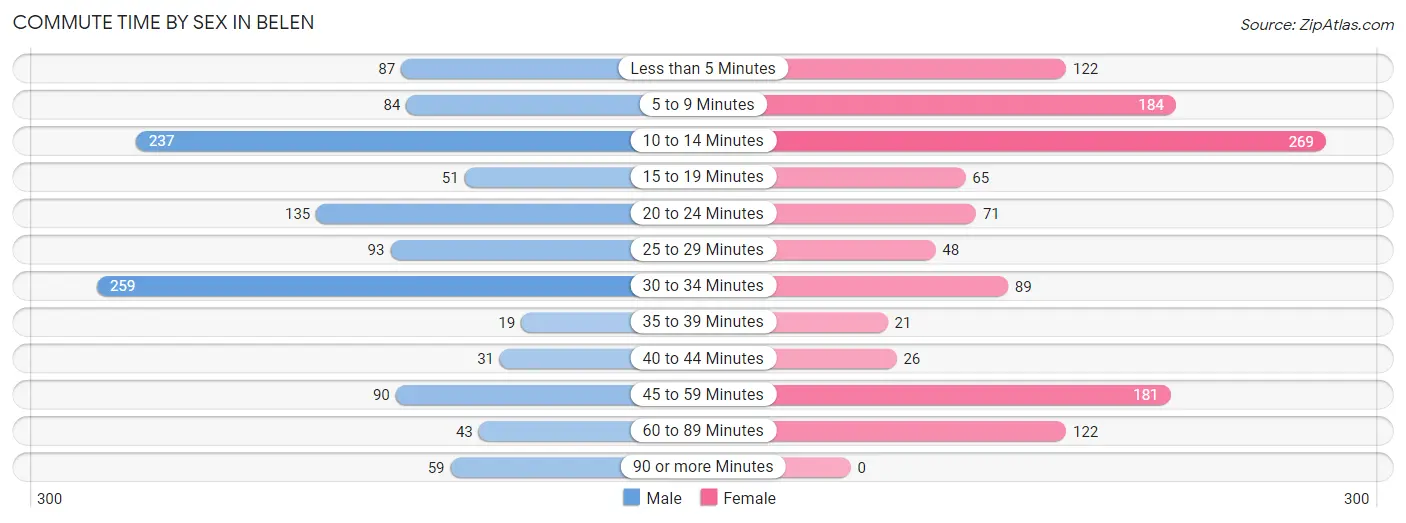
| Commute Time | Male | Female |
| Less than 5 Minutes | 87 (7.3%) | 122 (10.2%) |
| 5 to 9 Minutes | 84 (7.1%) | 184 (15.4%) |
| 10 to 14 Minutes | 237 (20.0%) | 269 (22.5%) |
| 15 to 19 Minutes | 51 (4.3%) | 65 (5.4%) |
| 20 to 24 Minutes | 135 (11.4%) | 71 (5.9%) |
| 25 to 29 Minutes | 93 (7.8%) | 48 (4.0%) |
| 30 to 34 Minutes | 259 (21.8%) | 89 (7.4%) |
| 35 to 39 Minutes | 19 (1.6%) | 21 (1.8%) |
| 40 to 44 Minutes | 31 (2.6%) | 26 (2.2%) |
| 45 to 59 Minutes | 90 (7.6%) | 181 (15.1%) |
| 60 to 89 Minutes | 43 (3.6%) | 122 (10.2%) |
| 90 or more Minutes | 59 (5.0%) | 0 (0.0%) |
Time of Departure to Work by Sex in Belen
The most frequent times of departure to work in Belen are 6:00 AM to 6:29 AM (335, 28.2%) for males and 7:00 AM to 7:29 AM (307, 25.6%) for females.
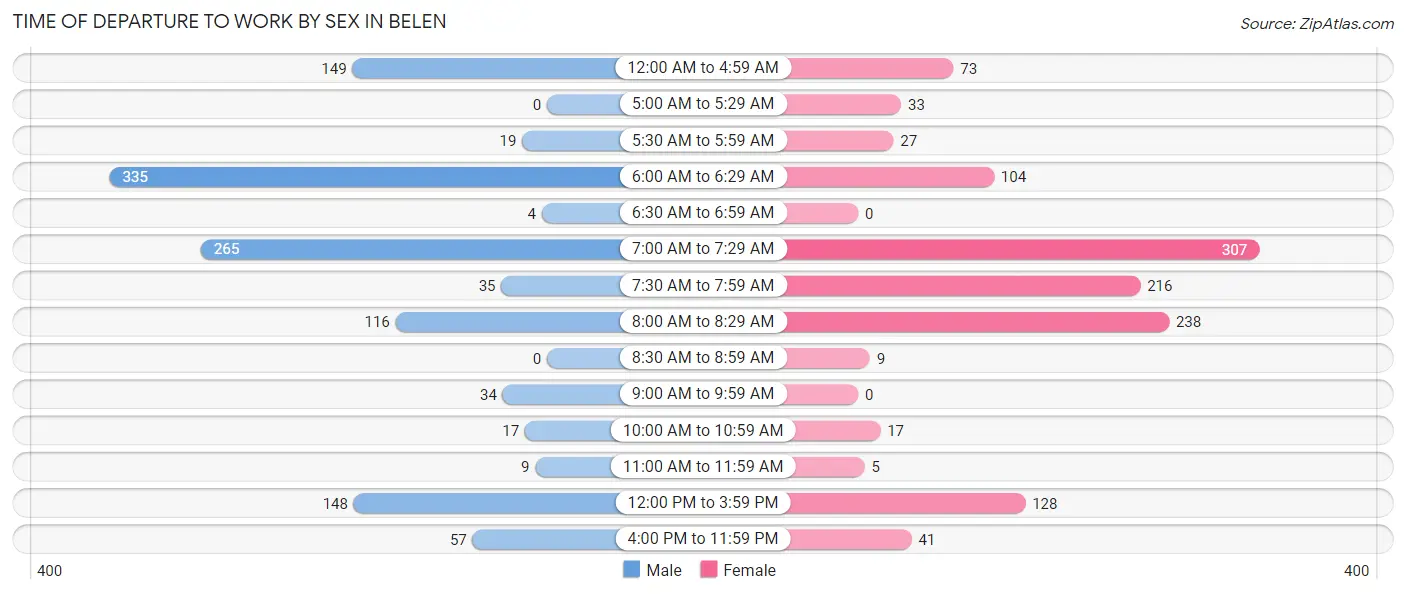
| Time of Departure | Male | Female |
| 12:00 AM to 4:59 AM | 149 (12.5%) | 73 (6.1%) |
| 5:00 AM to 5:29 AM | 0 (0.0%) | 33 (2.8%) |
| 5:30 AM to 5:59 AM | 19 (1.6%) | 27 (2.2%) |
| 6:00 AM to 6:29 AM | 335 (28.2%) | 104 (8.7%) |
| 6:30 AM to 6:59 AM | 4 (0.3%) | 0 (0.0%) |
| 7:00 AM to 7:29 AM | 265 (22.3%) | 307 (25.6%) |
| 7:30 AM to 7:59 AM | 35 (2.9%) | 216 (18.0%) |
| 8:00 AM to 8:29 AM | 116 (9.8%) | 238 (19.9%) |
| 8:30 AM to 8:59 AM | 0 (0.0%) | 9 (0.7%) |
| 9:00 AM to 9:59 AM | 34 (2.9%) | 0 (0.0%) |
| 10:00 AM to 10:59 AM | 17 (1.4%) | 17 (1.4%) |
| 11:00 AM to 11:59 AM | 9 (0.8%) | 5 (0.4%) |
| 12:00 PM to 3:59 PM | 148 (12.5%) | 128 (10.7%) |
| 4:00 PM to 11:59 PM | 57 (4.8%) | 41 (3.4%) |
| Total | 1,188 (100.0%) | 1,198 (100.0%) |
Housing Occupancy in Belen
Occupancy by Ownership in Belen
Of the total 2,684 dwellings in Belen, owner-occupied units account for 1,901 (70.8%), while renter-occupied units make up 783 (29.2%).
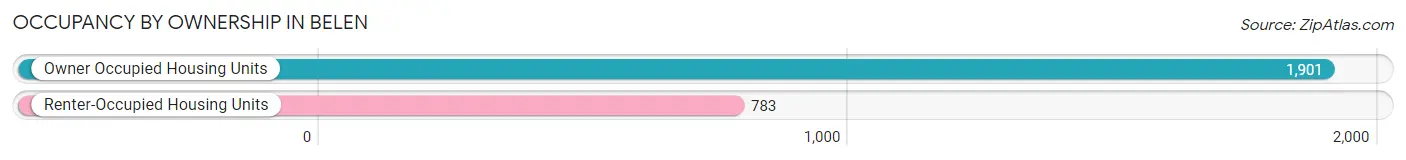
| Occupancy | # Housing Units | % Housing Units |
| Owner Occupied Housing Units | 1,901 | 70.8% |
| Renter-Occupied Housing Units | 783 | 29.2% |
| Total Occupied Housing Units | 2,684 | 100.0% |
Occupancy by Household Size in Belen
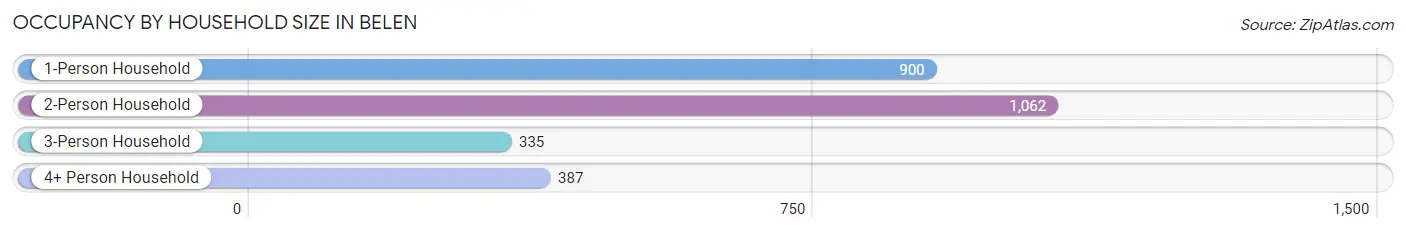
| Household Size | # Housing Units | % Housing Units |
| 1-Person Household | 900 | 33.5% |
| 2-Person Household | 1,062 | 39.6% |
| 3-Person Household | 335 | 12.5% |
| 4+ Person Household | 387 | 14.4% |
| Total Housing Units | 2,684 | 100.0% |
Occupancy by Ownership by Household Size in Belen
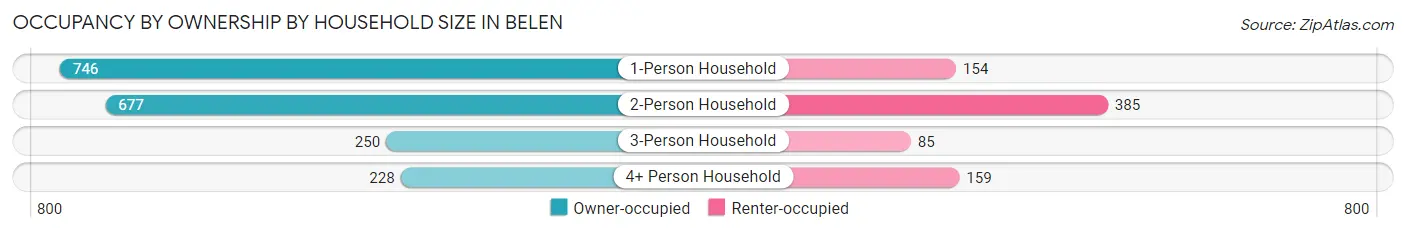
| Household Size | Owner-occupied | Renter-occupied |
| 1-Person Household | 746 (82.9%) | 154 (17.1%) |
| 2-Person Household | 677 (63.7%) | 385 (36.2%) |
| 3-Person Household | 250 (74.6%) | 85 (25.4%) |
| 4+ Person Household | 228 (58.9%) | 159 (41.1%) |
| Total Housing Units | 1,901 (70.8%) | 783 (29.2%) |
Occupancy by Educational Attainment in Belen
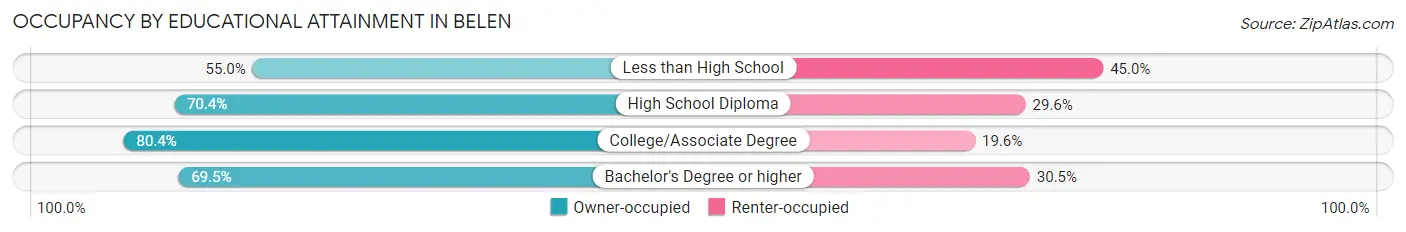
| Household Size | Owner-occupied | Renter-occupied |
| Less than High School | 303 (55.0%) | 248 (45.0%) |
| High School Diploma | 430 (70.4%) | 181 (29.6%) |
| College/Associate Degree | 812 (80.4%) | 198 (19.6%) |
| Bachelor's Degree or higher | 356 (69.5%) | 156 (30.5%) |
Occupancy by Age of Householder in Belen
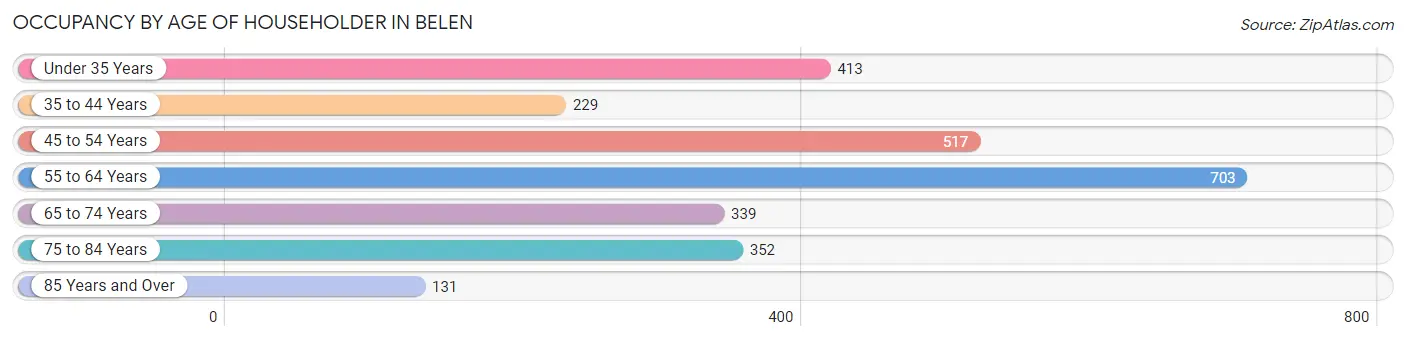
| Age Bracket | # Households | % Households |
| Under 35 Years | 413 | 15.4% |
| 35 to 44 Years | 229 | 8.5% |
| 45 to 54 Years | 517 | 19.3% |
| 55 to 64 Years | 703 | 26.2% |
| 65 to 74 Years | 339 | 12.6% |
| 75 to 84 Years | 352 | 13.1% |
| 85 Years and Over | 131 | 4.9% |
| Total | 2,684 | 100.0% |
Housing Finances in Belen
Median Income by Occupancy in Belen
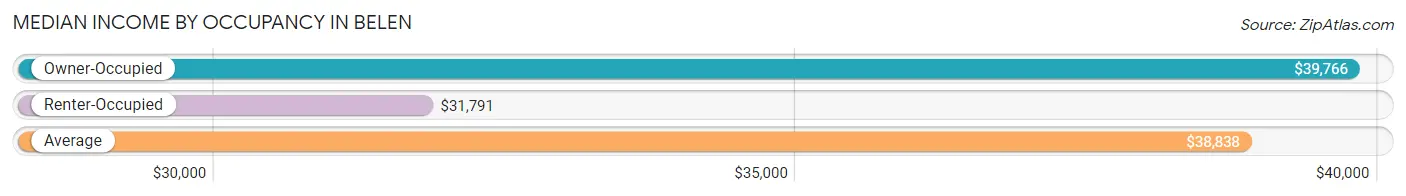
| Occupancy Type | # Households | Median Income |
| Owner-Occupied | 1,901 (70.8%) | $39,766 |
| Renter-Occupied | 783 (29.2%) | $31,791 |
| Average | 2,684 (100.0%) | $38,838 |
Occupancy by Householder Income Bracket in Belen
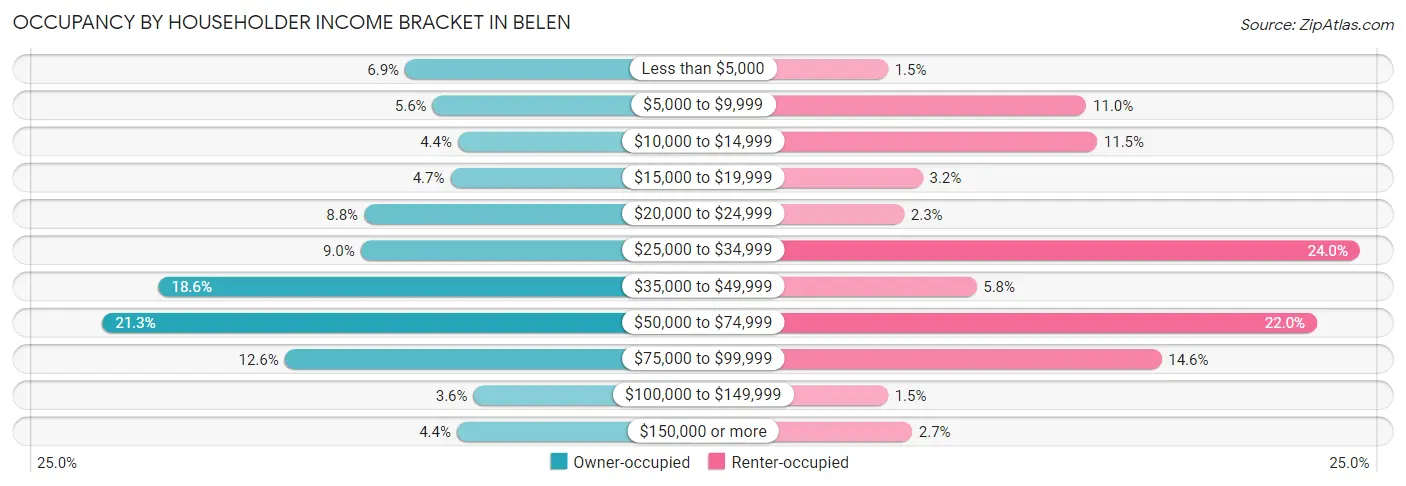
| Income Bracket | Owner-occupied | Renter-occupied |
| Less than $5,000 | 131 (6.9%) | 12 (1.5%) |
| $5,000 to $9,999 | 106 (5.6%) | 86 (11.0%) |
| $10,000 to $14,999 | 83 (4.4%) | 90 (11.5%) |
| $15,000 to $19,999 | 90 (4.7%) | 25 (3.2%) |
| $20,000 to $24,999 | 168 (8.8%) | 18 (2.3%) |
| $25,000 to $34,999 | 171 (9.0%) | 188 (24.0%) |
| $35,000 to $49,999 | 354 (18.6%) | 45 (5.8%) |
| $50,000 to $74,999 | 405 (21.3%) | 172 (22.0%) |
| $75,000 to $99,999 | 240 (12.6%) | 114 (14.6%) |
| $100,000 to $149,999 | 69 (3.6%) | 12 (1.5%) |
| $150,000 or more | 84 (4.4%) | 21 (2.7%) |
| Total | 1,901 (100.0%) | 783 (100.0%) |
Monthly Housing Cost Tiers in Belen
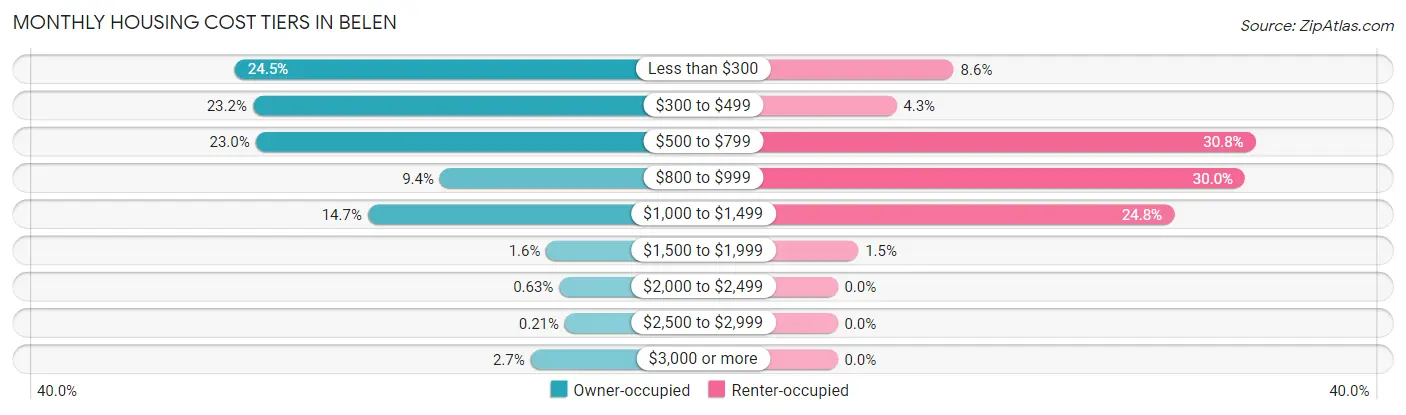
| Monthly Cost | Owner-occupied | Renter-occupied |
| Less than $300 | 466 (24.5%) | 67 (8.6%) |
| $300 to $499 | 441 (23.2%) | 34 (4.3%) |
| $500 to $799 | 437 (23.0%) | 241 (30.8%) |
| $800 to $999 | 179 (9.4%) | 235 (30.0%) |
| $1,000 to $1,499 | 280 (14.7%) | 194 (24.8%) |
| $1,500 to $1,999 | 30 (1.6%) | 12 (1.5%) |
| $2,000 to $2,499 | 12 (0.6%) | 0 (0.0%) |
| $2,500 to $2,999 | 4 (0.2%) | 0 (0.0%) |
| $3,000 or more | 52 (2.7%) | 0 (0.0%) |
| Total | 1,901 (100.0%) | 783 (100.0%) |
Physical Housing Characteristics in Belen
Housing Structures in Belen
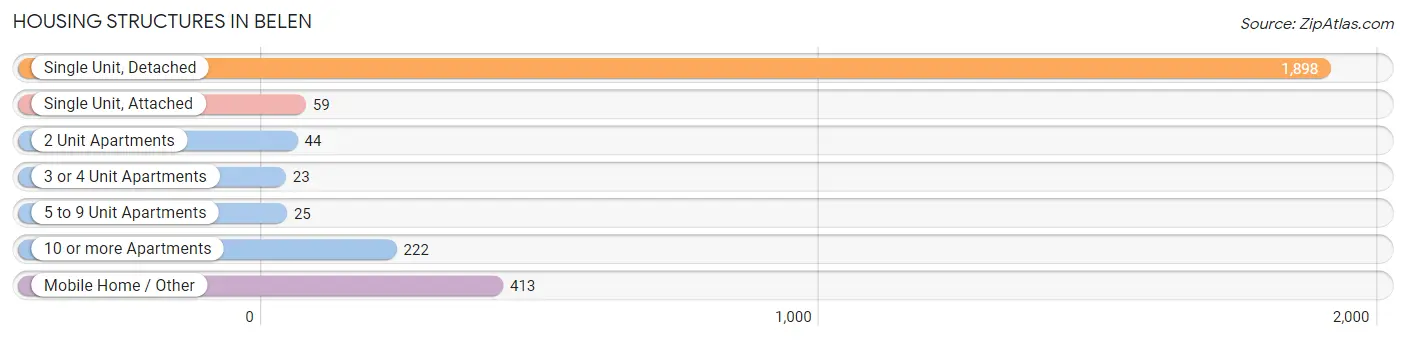
| Structure Type | # Housing Units | % Housing Units |
| Single Unit, Detached | 1,898 | 70.7% |
| Single Unit, Attached | 59 | 2.2% |
| 2 Unit Apartments | 44 | 1.6% |
| 3 or 4 Unit Apartments | 23 | 0.9% |
| 5 to 9 Unit Apartments | 25 | 0.9% |
| 10 or more Apartments | 222 | 8.3% |
| Mobile Home / Other | 413 | 15.4% |
| Total | 2,684 | 100.0% |
Housing Structures by Occupancy in Belen
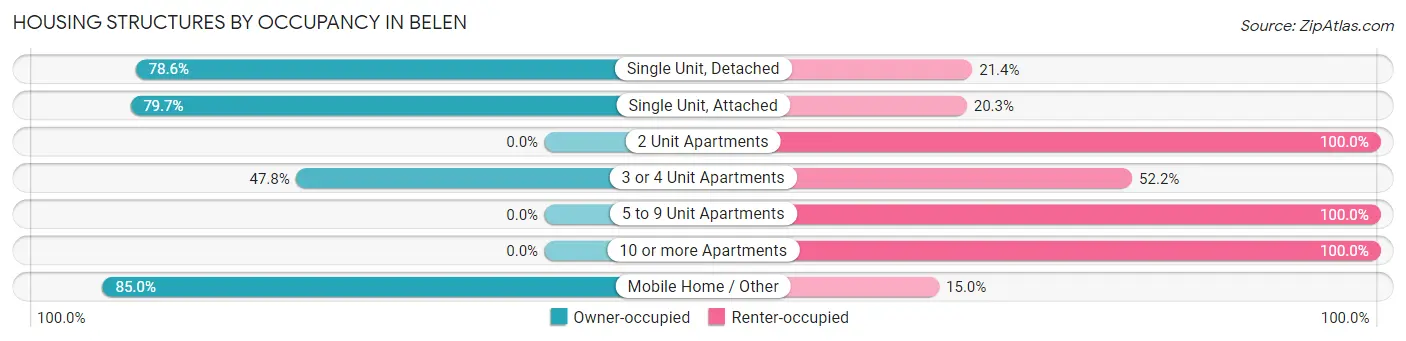
| Structure Type | Owner-occupied | Renter-occupied |
| Single Unit, Detached | 1,492 (78.6%) | 406 (21.4%) |
| Single Unit, Attached | 47 (79.7%) | 12 (20.3%) |
| 2 Unit Apartments | 0 (0.0%) | 44 (100.0%) |
| 3 or 4 Unit Apartments | 11 (47.8%) | 12 (52.2%) |
| 5 to 9 Unit Apartments | 0 (0.0%) | 25 (100.0%) |
| 10 or more Apartments | 0 (0.0%) | 222 (100.0%) |
| Mobile Home / Other | 351 (85.0%) | 62 (15.0%) |
| Total | 1,901 (70.8%) | 783 (29.2%) |
Housing Structures by Number of Rooms in Belen
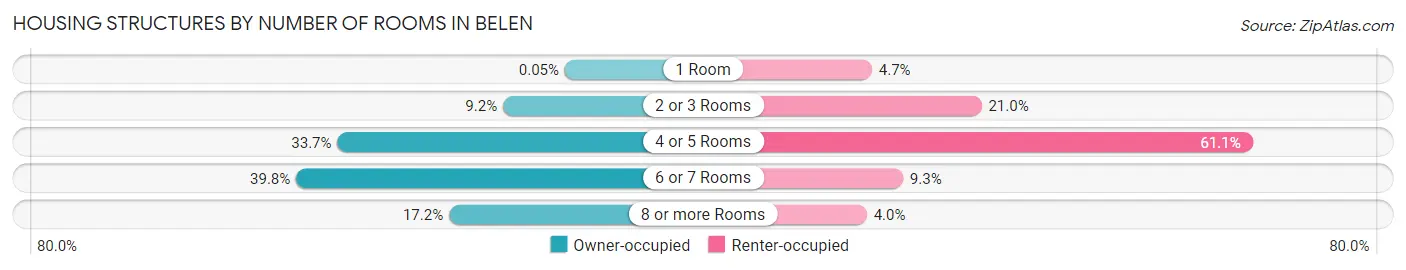
| Number of Rooms | Owner-occupied | Renter-occupied |
| 1 Room | 1 (0.1%) | 37 (4.7%) |
| 2 or 3 Rooms | 175 (9.2%) | 164 (20.9%) |
| 4 or 5 Rooms | 641 (33.7%) | 478 (61.1%) |
| 6 or 7 Rooms | 757 (39.8%) | 73 (9.3%) |
| 8 or more Rooms | 327 (17.2%) | 31 (4.0%) |
| Total | 1,901 (100.0%) | 783 (100.0%) |
Housing Structure by Heating Type in Belen
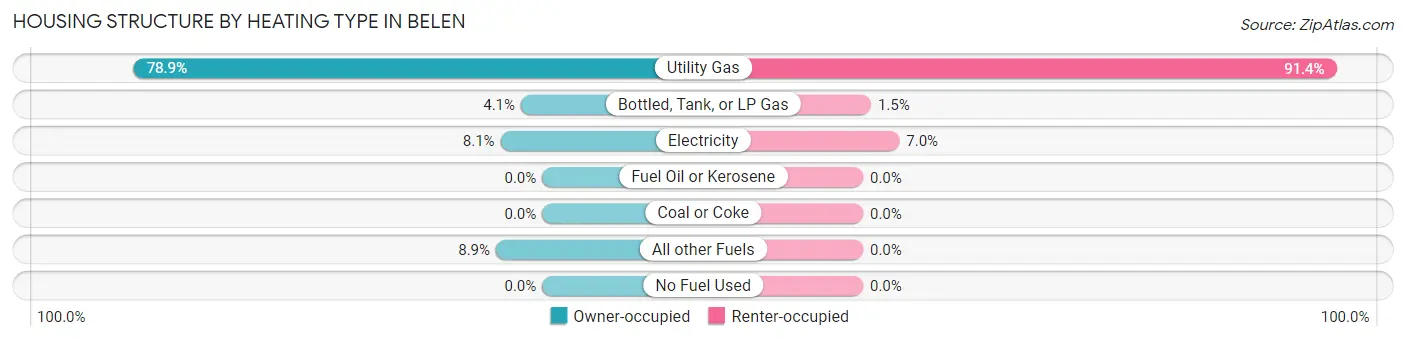
| Heating Type | Owner-occupied | Renter-occupied |
| Utility Gas | 1,500 (78.9%) | 716 (91.4%) |
| Bottled, Tank, or LP Gas | 78 (4.1%) | 12 (1.5%) |
| Electricity | 153 (8.1%) | 55 (7.0%) |
| Fuel Oil or Kerosene | 0 (0.0%) | 0 (0.0%) |
| Coal or Coke | 0 (0.0%) | 0 (0.0%) |
| All other Fuels | 170 (8.9%) | 0 (0.0%) |
| No Fuel Used | 0 (0.0%) | 0 (0.0%) |
| Total | 1,901 (100.0%) | 783 (100.0%) |
Household Vehicle Usage in Belen
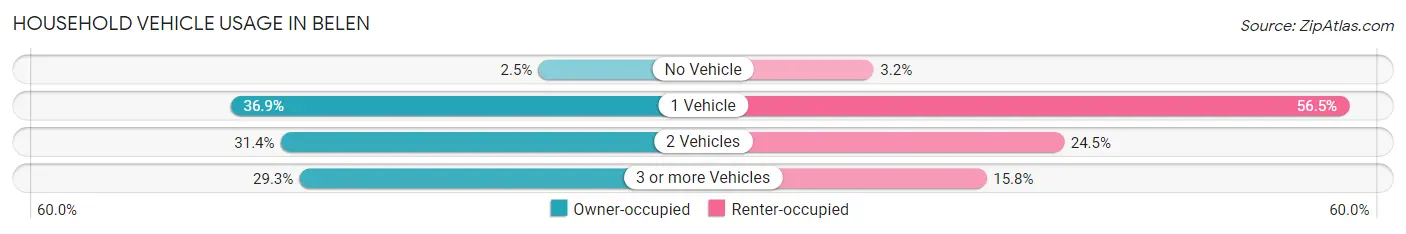
| Vehicles per Household | Owner-occupied | Renter-occupied |
| No Vehicle | 47 (2.5%) | 25 (3.2%) |
| 1 Vehicle | 702 (36.9%) | 442 (56.5%) |
| 2 Vehicles | 596 (31.4%) | 192 (24.5%) |
| 3 or more Vehicles | 556 (29.2%) | 124 (15.8%) |
| Total | 1,901 (100.0%) | 783 (100.0%) |
Real Estate & Mortgages in Belen
Real Estate and Mortgage Overview in Belen
| Characteristic | Without Mortgage | With Mortgage |
| Housing Units | 1,190 | 711 |
| Median Property Value | $102,100 | $127,700 |
| Median Household Income | $35,000 | $73 |
| Monthly Housing Costs | $333 | $52 |
| Real Estate Taxes | $827 | $62 |
Property Value by Mortgage Status in Belen
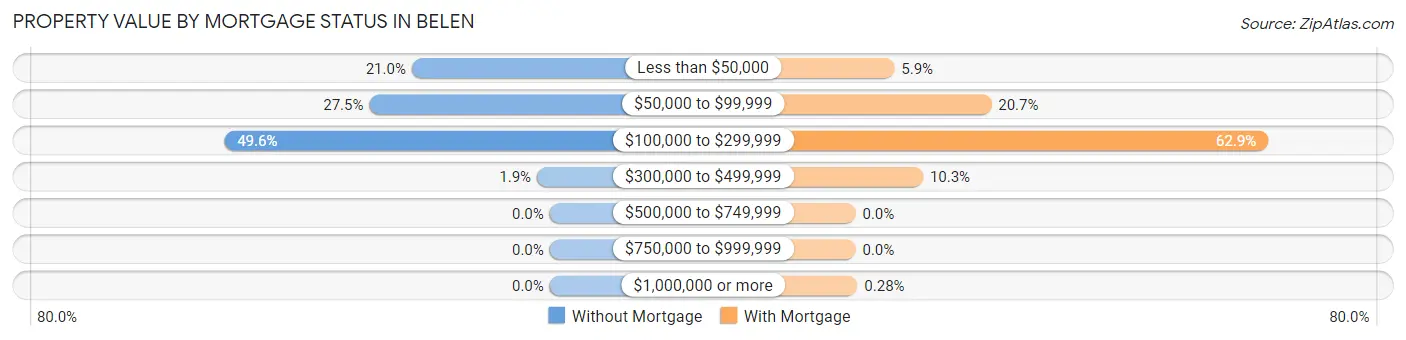
| Property Value | Without Mortgage | With Mortgage |
| Less than $50,000 | 250 (21.0%) | 42 (5.9%) |
| $50,000 to $99,999 | 327 (27.5%) | 147 (20.7%) |
| $100,000 to $299,999 | 590 (49.6%) | 447 (62.9%) |
| $300,000 to $499,999 | 23 (1.9%) | 73 (10.3%) |
| $500,000 to $749,999 | 0 (0.0%) | 0 (0.0%) |
| $750,000 to $999,999 | 0 (0.0%) | 0 (0.0%) |
| $1,000,000 or more | 0 (0.0%) | 2 (0.3%) |
| Total | 1,190 (100.0%) | 711 (100.0%) |
Household Income by Mortgage Status in Belen
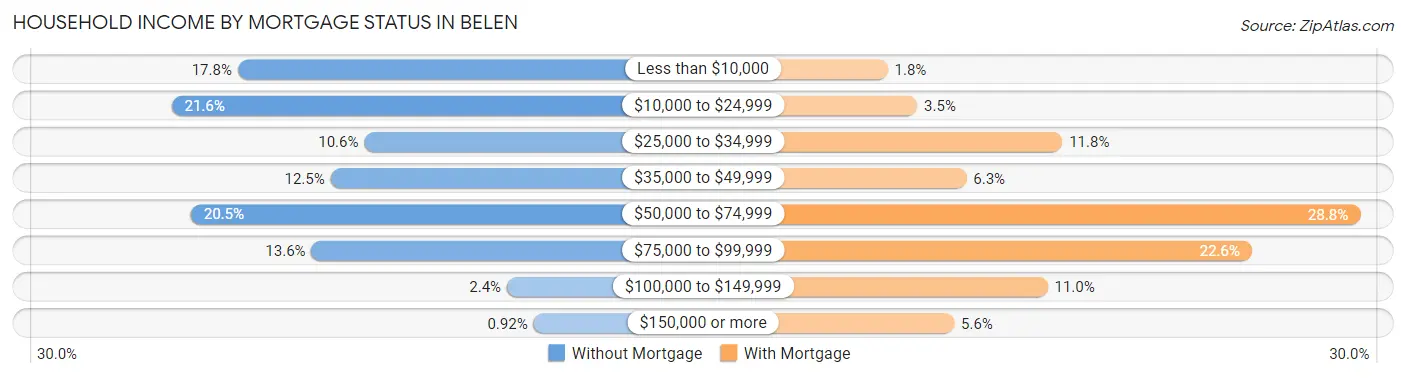
| Household Income | Without Mortgage | With Mortgage |
| Less than $10,000 | 212 (17.8%) | 13 (1.8%) |
| $10,000 to $24,999 | 257 (21.6%) | 25 (3.5%) |
| $25,000 to $34,999 | 126 (10.6%) | 84 (11.8%) |
| $35,000 to $49,999 | 149 (12.5%) | 45 (6.3%) |
| $50,000 to $74,999 | 244 (20.5%) | 205 (28.8%) |
| $75,000 to $99,999 | 162 (13.6%) | 161 (22.6%) |
| $100,000 to $149,999 | 29 (2.4%) | 78 (11.0%) |
| $150,000 or more | 11 (0.9%) | 40 (5.6%) |
| Total | 1,190 (100.0%) | 711 (100.0%) |
Property Value to Household Income Ratio in Belen
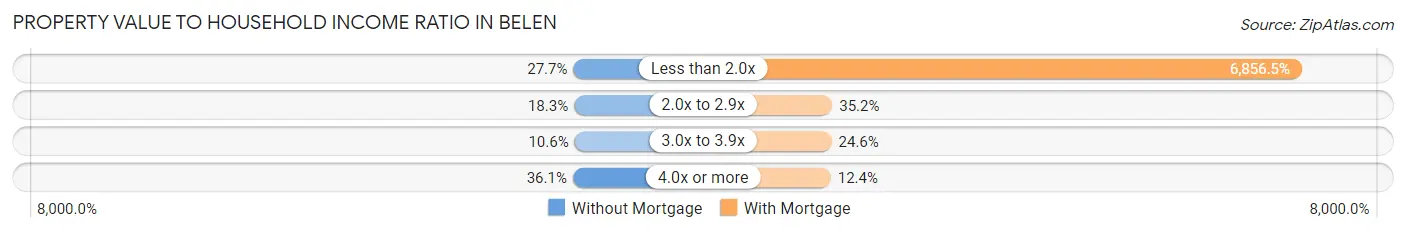
| Value-to-Income Ratio | Without Mortgage | With Mortgage |
| Less than 2.0x | 329 (27.7%) | 48,750 (6,856.5%) |
| 2.0x to 2.9x | 218 (18.3%) | 250 (35.2%) |
| 3.0x to 3.9x | 126 (10.6%) | 175 (24.6%) |
| 4.0x or more | 429 (36.0%) | 88 (12.4%) |
| Total | 1,190 (100.0%) | 711 (100.0%) |
Real Estate Taxes by Mortgage Status in Belen
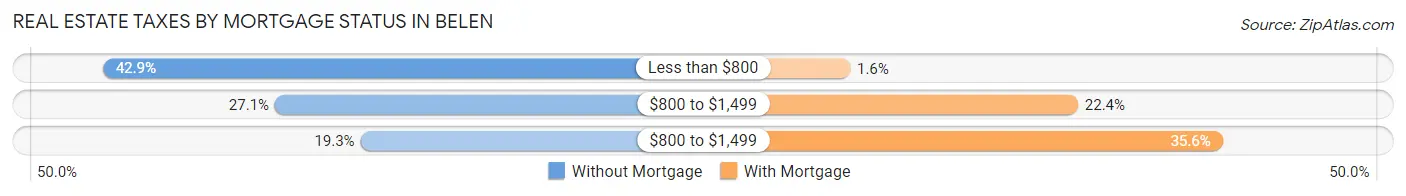
| Property Taxes | Without Mortgage | With Mortgage |
| Less than $800 | 510 (42.9%) | 11 (1.5%) |
| $800 to $1,499 | 323 (27.1%) | 159 (22.4%) |
| $800 to $1,499 | 230 (19.3%) | 253 (35.6%) |
| Total | 1,190 (100.0%) | 711 (100.0%) |
Health & Disability in Belen
Health Insurance Coverage by Age in Belen
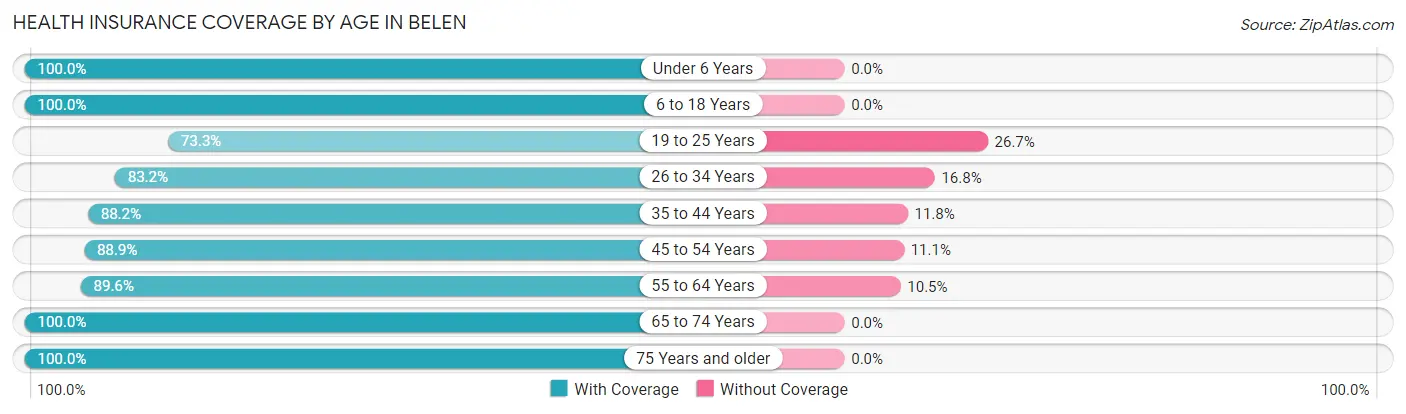
| Age Bracket | With Coverage | Without Coverage |
| Under 6 Years | 327 (100.0%) | 0 (0.0%) |
| 6 to 18 Years | 875 (100.0%) | 0 (0.0%) |
| 19 to 25 Years | 655 (73.3%) | 239 (26.7%) |
| 26 to 34 Years | 801 (83.2%) | 162 (16.8%) |
| 35 to 44 Years | 576 (88.2%) | 77 (11.8%) |
| 45 to 54 Years | 883 (88.9%) | 110 (11.1%) |
| 55 to 64 Years | 1,114 (89.5%) | 130 (10.4%) |
| 65 to 74 Years | 710 (100.0%) | 0 (0.0%) |
| 75 Years and older | 602 (100.0%) | 0 (0.0%) |
| Total | 6,543 (90.1%) | 718 (9.9%) |
Health Insurance Coverage by Citizenship Status in Belen
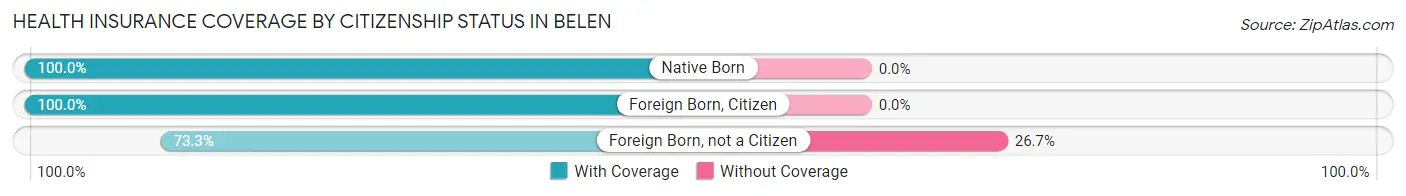
| Citizenship Status | With Coverage | Without Coverage |
| Native Born | 327 (100.0%) | 0 (0.0%) |
| Foreign Born, Citizen | 875 (100.0%) | 0 (0.0%) |
| Foreign Born, not a Citizen | 655 (73.3%) | 239 (26.7%) |
Health Insurance Coverage by Household Income in Belen
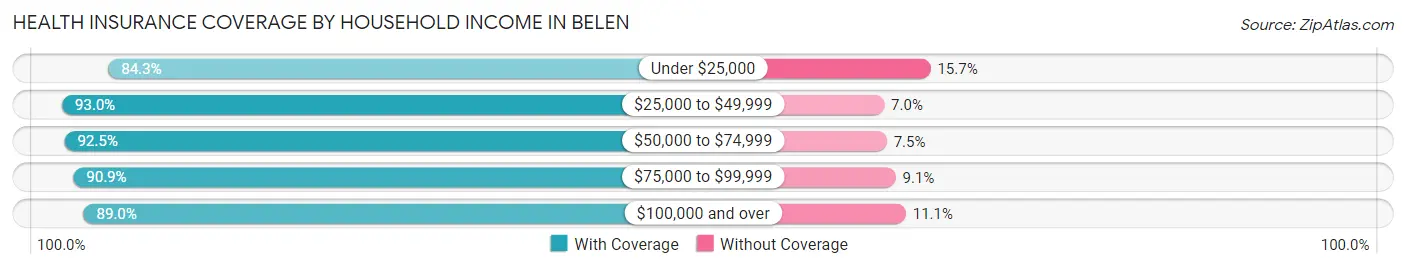
| Household Income | With Coverage | Without Coverage |
| Under $25,000 | 1,420 (84.3%) | 264 (15.7%) |
| $25,000 to $49,999 | 1,713 (93.0%) | 129 (7.0%) |
| $50,000 to $74,999 | 1,644 (92.5%) | 133 (7.5%) |
| $75,000 to $99,999 | 1,114 (90.9%) | 112 (9.1%) |
| $100,000 and over | 644 (88.9%) | 80 (11.1%) |
Public vs Private Health Insurance Coverage by Age in Belen
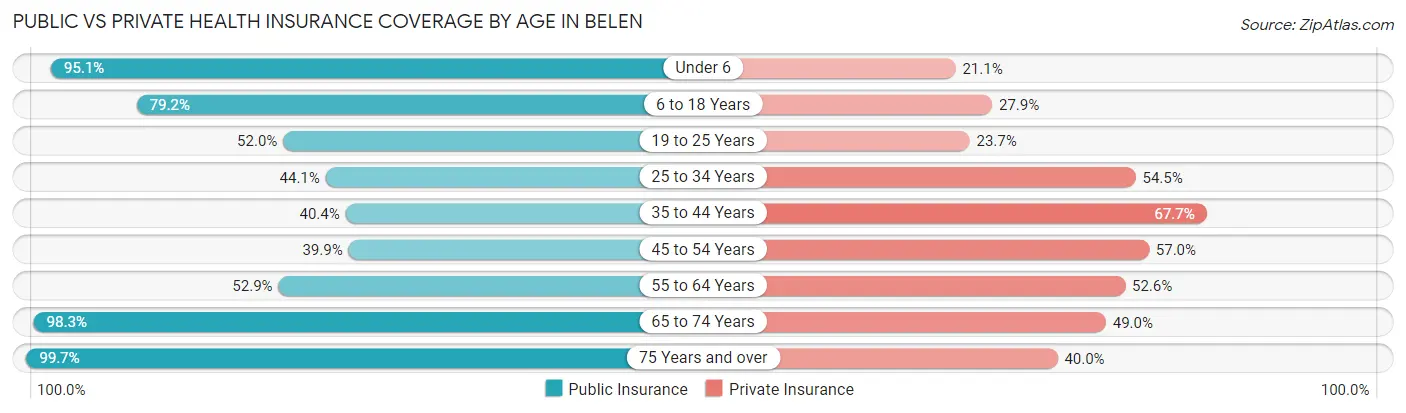
| Age Bracket | Public Insurance | Private Insurance |
| Under 6 | 311 (95.1%) | 69 (21.1%) |
| 6 to 18 Years | 693 (79.2%) | 244 (27.9%) |
| 19 to 25 Years | 465 (52.0%) | 212 (23.7%) |
| 25 to 34 Years | 425 (44.1%) | 525 (54.5%) |
| 35 to 44 Years | 264 (40.4%) | 442 (67.7%) |
| 45 to 54 Years | 396 (39.9%) | 566 (57.0%) |
| 55 to 64 Years | 658 (52.9%) | 654 (52.6%) |
| 65 to 74 Years | 698 (98.3%) | 348 (49.0%) |
| 75 Years and over | 600 (99.7%) | 241 (40.0%) |
| Total | 4,510 (62.1%) | 3,301 (45.5%) |
Disability Status by Sex by Age in Belen
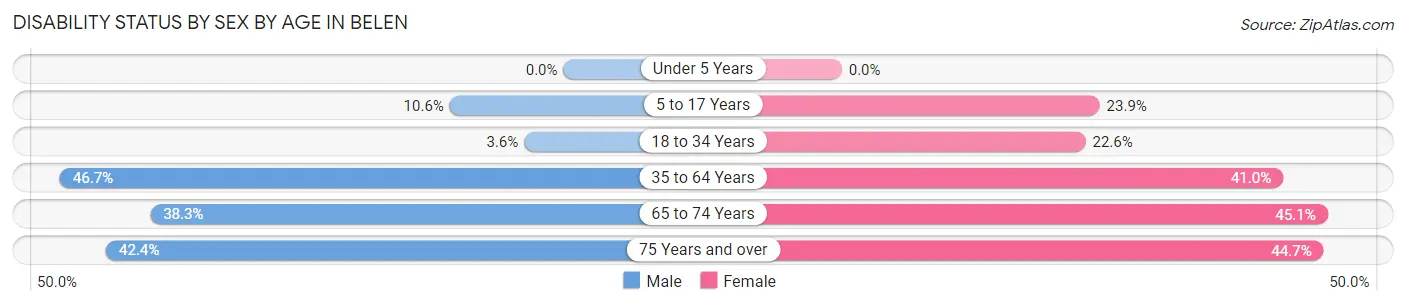
| Age Bracket | Male | Female |
| Under 5 Years | 0 (0.0%) | 0 (0.0%) |
| 5 to 17 Years | 61 (10.5%) | 73 (23.9%) |
| 18 to 34 Years | 38 (3.6%) | 195 (22.6%) |
| 35 to 64 Years | 620 (46.7%) | 640 (40.9%) |
| 65 to 74 Years | 97 (38.3%) | 206 (45.1%) |
| 75 Years and over | 115 (42.4%) | 148 (44.7%) |
Disability Class by Sex by Age in Belen
Disability Class: Hearing Difficulty
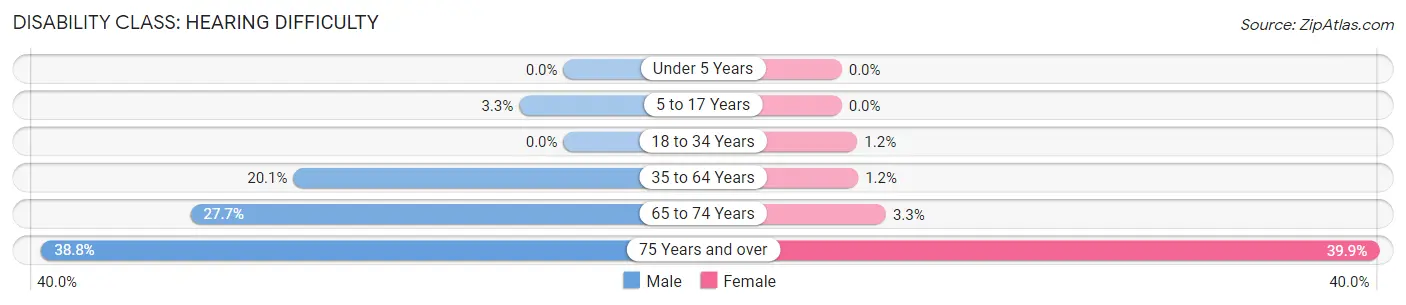
| Age Bracket | Male | Female |
| Under 5 Years | 0 (0.0%) | 0 (0.0%) |
| 5 to 17 Years | 19 (3.3%) | 0 (0.0%) |
| 18 to 34 Years | 0 (0.0%) | 10 (1.2%) |
| 35 to 64 Years | 266 (20.1%) | 19 (1.2%) |
| 65 to 74 Years | 70 (27.7%) | 15 (3.3%) |
| 75 Years and over | 105 (38.8%) | 132 (39.9%) |
Disability Class: Vision Difficulty
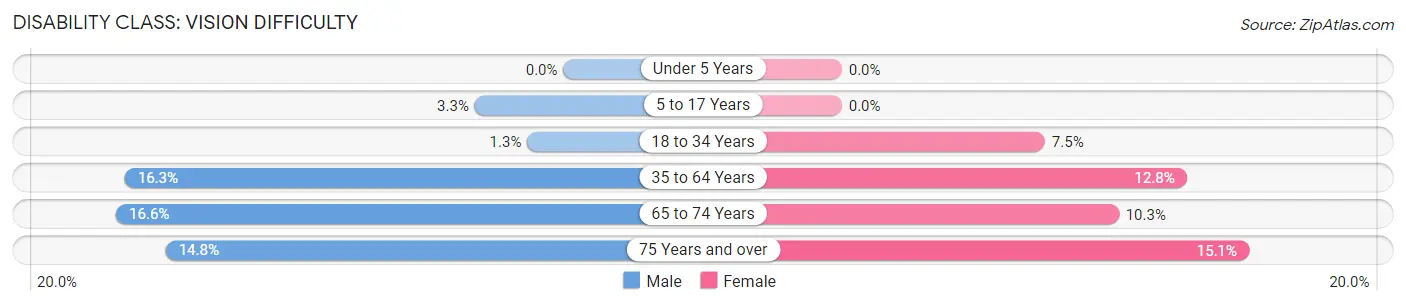
| Age Bracket | Male | Female |
| Under 5 Years | 0 (0.0%) | 0 (0.0%) |
| 5 to 17 Years | 19 (3.3%) | 0 (0.0%) |
| 18 to 34 Years | 14 (1.3%) | 65 (7.5%) |
| 35 to 64 Years | 216 (16.3%) | 200 (12.8%) |
| 65 to 74 Years | 42 (16.6%) | 47 (10.3%) |
| 75 Years and over | 40 (14.8%) | 50 (15.1%) |
Disability Class: Cognitive Difficulty
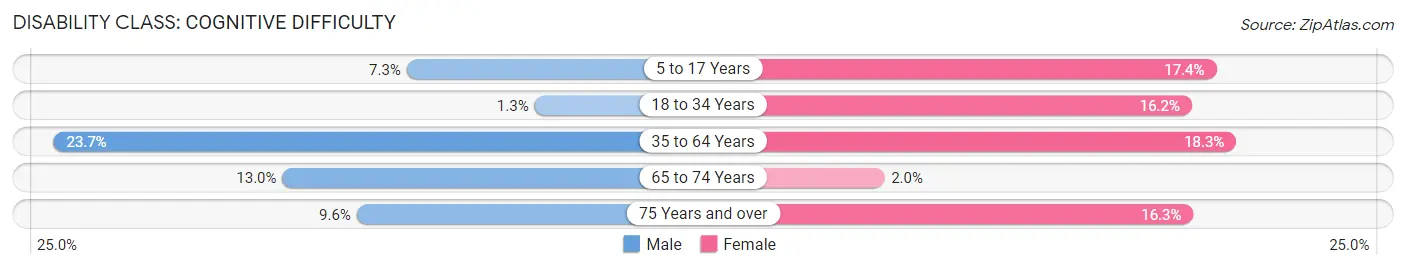
| Age Bracket | Male | Female |
| 5 to 17 Years | 42 (7.3%) | 53 (17.4%) |
| 18 to 34 Years | 14 (1.3%) | 140 (16.2%) |
| 35 to 64 Years | 314 (23.7%) | 286 (18.3%) |
| 65 to 74 Years | 33 (13.0%) | 9 (2.0%) |
| 75 Years and over | 26 (9.6%) | 54 (16.3%) |
Disability Class: Ambulatory Difficulty
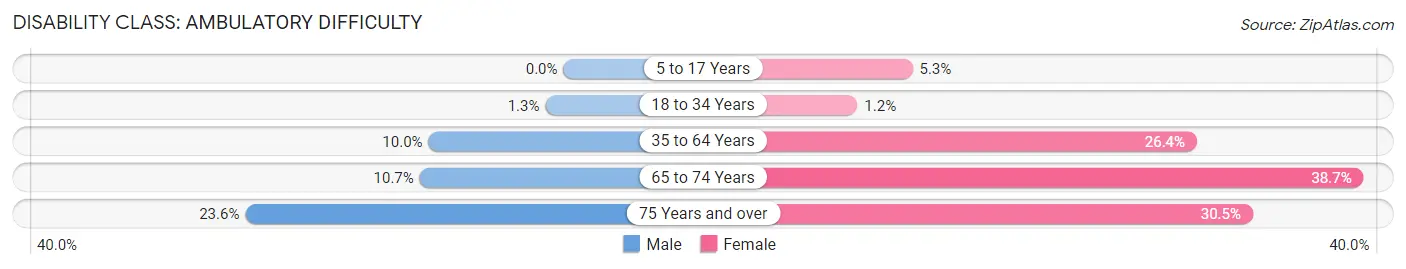
| Age Bracket | Male | Female |
| 5 to 17 Years | 0 (0.0%) | 16 (5.2%) |
| 18 to 34 Years | 14 (1.3%) | 10 (1.2%) |
| 35 to 64 Years | 133 (10.0%) | 412 (26.4%) |
| 65 to 74 Years | 27 (10.7%) | 177 (38.7%) |
| 75 Years and over | 64 (23.6%) | 101 (30.5%) |
Disability Class: Self-Care Difficulty
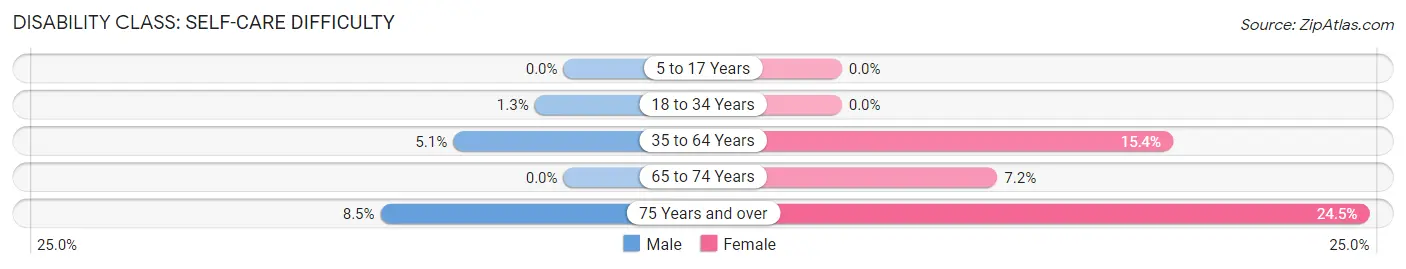
| Age Bracket | Male | Female |
| 5 to 17 Years | 0 (0.0%) | 0 (0.0%) |
| 18 to 34 Years | 14 (1.3%) | 0 (0.0%) |
| 35 to 64 Years | 68 (5.1%) | 240 (15.4%) |
| 65 to 74 Years | 0 (0.0%) | 33 (7.2%) |
| 75 Years and over | 23 (8.5%) | 81 (24.5%) |
Technology Access in Belen
Computing Device Access in Belen
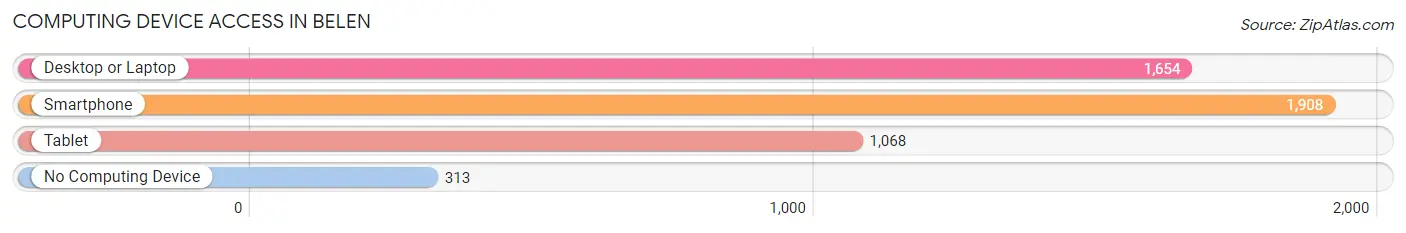
| Device Type | # Households | % Households |
| Desktop or Laptop | 1,654 | 61.6% |
| Smartphone | 1,908 | 71.1% |
| Tablet | 1,068 | 39.8% |
| No Computing Device | 313 | 11.7% |
| Total | 2,684 | 100.0% |
Internet Access in Belen
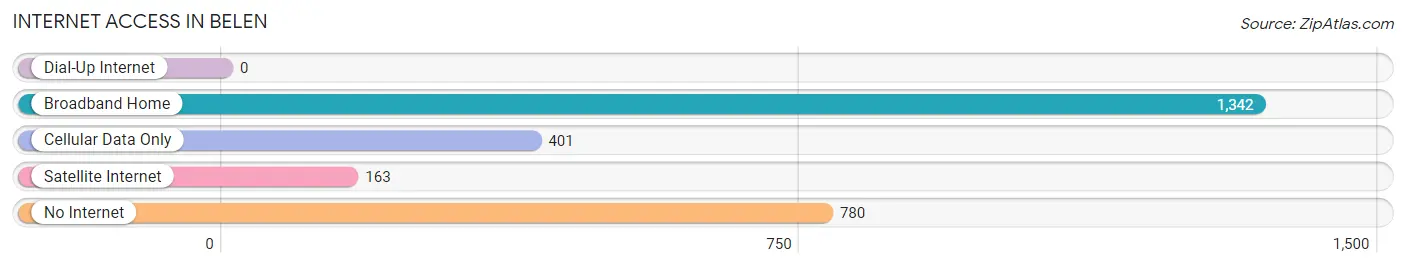
| Internet Type | # Households | % Households |
| Dial-Up Internet | 0 | 0.0% |
| Broadband Home | 1,342 | 50.0% |
| Cellular Data Only | 401 | 14.9% |
| Satellite Internet | 163 | 6.1% |
| No Internet | 780 | 29.1% |
| Total | 2,684 | 100.0% |
Belen Summary
Belen, New Mexico is a small city located in Valencia County, in the central part of the state. It is situated along the Rio Grande River, about 35 miles south of Albuquerque. The city has a population of around 7,000 people, and is the county seat of Valencia County.
Geography
Belen is located in the Rio Grande Valley, which is a large agricultural area. The city is situated at an elevation of 4,719 feet, and is surrounded by the Manzano Mountains to the east and the Sandia Mountains to the west. The Rio Grande River runs through the city, and is a major source of irrigation for the surrounding agricultural lands. The climate in Belen is semi-arid, with hot summers and mild winters.
History
Belen was founded in 1835 by Spanish settlers, and was originally known as San Antonio de Belen. The city was named after the biblical town of Bethlehem, and was the first settlement in Valencia County. The city was an important stop on the Santa Fe Trail, and was a major trading center for the region. In the late 19th century, the city was a major hub for the railroad industry, and was home to several large rail yards.
Economy
Belen’s economy is largely based on agriculture, with the surrounding area being a major producer of cotton, alfalfa, and other crops. The city is also home to several manufacturing companies, including a large paper mill and a steel mill. The city is also home to a number of retail stores, restaurants, and other businesses.
Demographics
As of the 2010 census, Belen had a population of 7,269 people. The racial makeup of the city was 73.3% White, 0.9% African American, 1.2% Native American, 0.4% Asian, 0.1% Pacific Islander, 21.2% from other races, and 3.0% from two or more races. Hispanic or Latino of any race were 63.2% of the population.
Belen is a small city with a rich history and a diverse population. The city is home to a variety of businesses and industries, and is a major agricultural center in the region. The city is also home to a number of cultural attractions, including the Belen Museum of Art and the Belen Historic District. Belen is a great place to live, work, and visit, and is a great example of the unique culture and history of New Mexico.
Common Questions
What is Per Capita Income in Belen?
Per Capita income in Belen is $22,192.
What is the Median Family Income in Belen?
Median Family Income in Belen is $57,443.
What is the Median Household income in Belen?
Median Household Income in Belen is $38,838.
What is Income or Wage Gap in Belen?
Income or Wage Gap in Belen is 9.2%.
Women in Belen earn 90.8 cents for every dollar earned by a man.
What is Family Income Deficit in Belen?
Family Income Deficit in Belen is $15,867.
Families that are below poverty line in Belen earn $15,867 less on average than the poverty threshold level.
What is Inequality or Gini Index in Belen?
Inequality or Gini Index in Belen is 0.43.
What is the Total Population of Belen?
Total Population of Belen is 7,367.
What is the Total Male Population of Belen?
Total Male Population of Belen is 3,675.
What is the Total Female Population of Belen?
Total Female Population of Belen is 3,692.
What is the Ratio of Males per 100 Females in Belen?
There are 99.54 Males per 100 Females in Belen.
What is the Ratio of Females per 100 Males in Belen?
There are 100.46 Females per 100 Males in Belen.
What is the Median Population Age in Belen?
Median Population Age in Belen is 44.4 Years.
What is the Average Family Size in Belen
Average Family Size in Belen is 3.5 People.
What is the Average Household Size in Belen
Average Household Size in Belen is 2.7 People.
How Large is the Labor Force in Belen?
There are 2,891 People in the Labor Forcein in Belen.
What is the Percentage of People in the Labor Force in Belen?
45.4% of People are in the Labor Force in Belen.
What is the Unemployment Rate in Belen?
Unemployment Rate in Belen is 8.0%.