Artesia, NM Map & Demographics
Artesia Map
Artesia Overview
$33,886
PER CAPITA INCOME
$89,100
AVG FAMILY INCOME
$75,389
AVG HOUSEHOLD INCOME
59.2%
WAGE / INCOME GAP [ % ]
40.8¢/ $1
WAGE / INCOME GAP [ $ ]
0.40
INEQUALITY / GINI INDEX
12,632
TOTAL POPULATION
6,673
MALE POPULATION
5,959
FEMALE POPULATION
111.98
MALES / 100 FEMALES
89.30
FEMALES / 100 MALES
33.9
MEDIAN AGE
3.1
AVG FAMILY SIZE
2.6
AVG HOUSEHOLD SIZE
6,065
LABOR FORCE [ PEOPLE ]
66.2%
PERCENT IN LABOR FORCE
4.5%
UNEMPLOYMENT RATE
Artesia Zip Codes
Income in Artesia
Income Overview in Artesia
Per Capita Income in Artesia is $33,886, while median incomes of families and households are $89,100 and $75,389 respectively.
| Characteristic | Number | Measure |
| Per Capita Income | 12,632 | $33,886 |
| Median Family Income | 3,480 | $89,100 |
| Mean Family Income | 3,480 | $94,680 |
| Median Household Income | 4,811 | $75,389 |
| Mean Household Income | 4,811 | $90,529 |
| Income Deficit | 3,480 | $0 |
| Wage / Income Gap (%) | 12,632 | 59.19% |
| Wage / Income Gap ($) | 12,632 | 40.81¢ per $1 |
| Gini / Inequality Index | 12,632 | 0.40 |
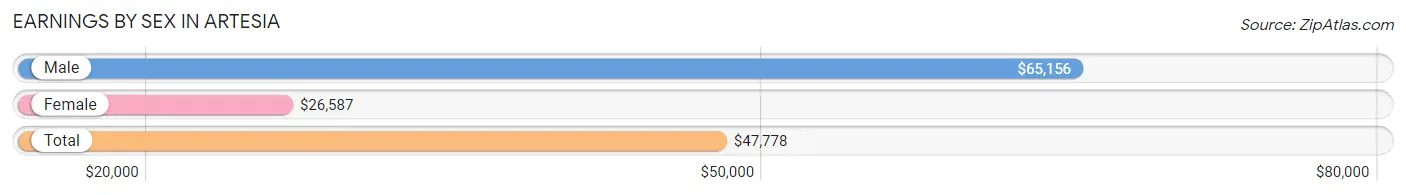
Earnings by Sex in Artesia
Average Earnings in Artesia are $47,778, $65,156 for men and $26,587 for women, a difference of 59.2%.
| Sex | Number | Average Earnings |
| Male | 3,437 (55.4%) | $65,156 |
| Female | 2,769 (44.6%) | $26,587 |
| Total | 6,206 (100.0%) | $47,778 |
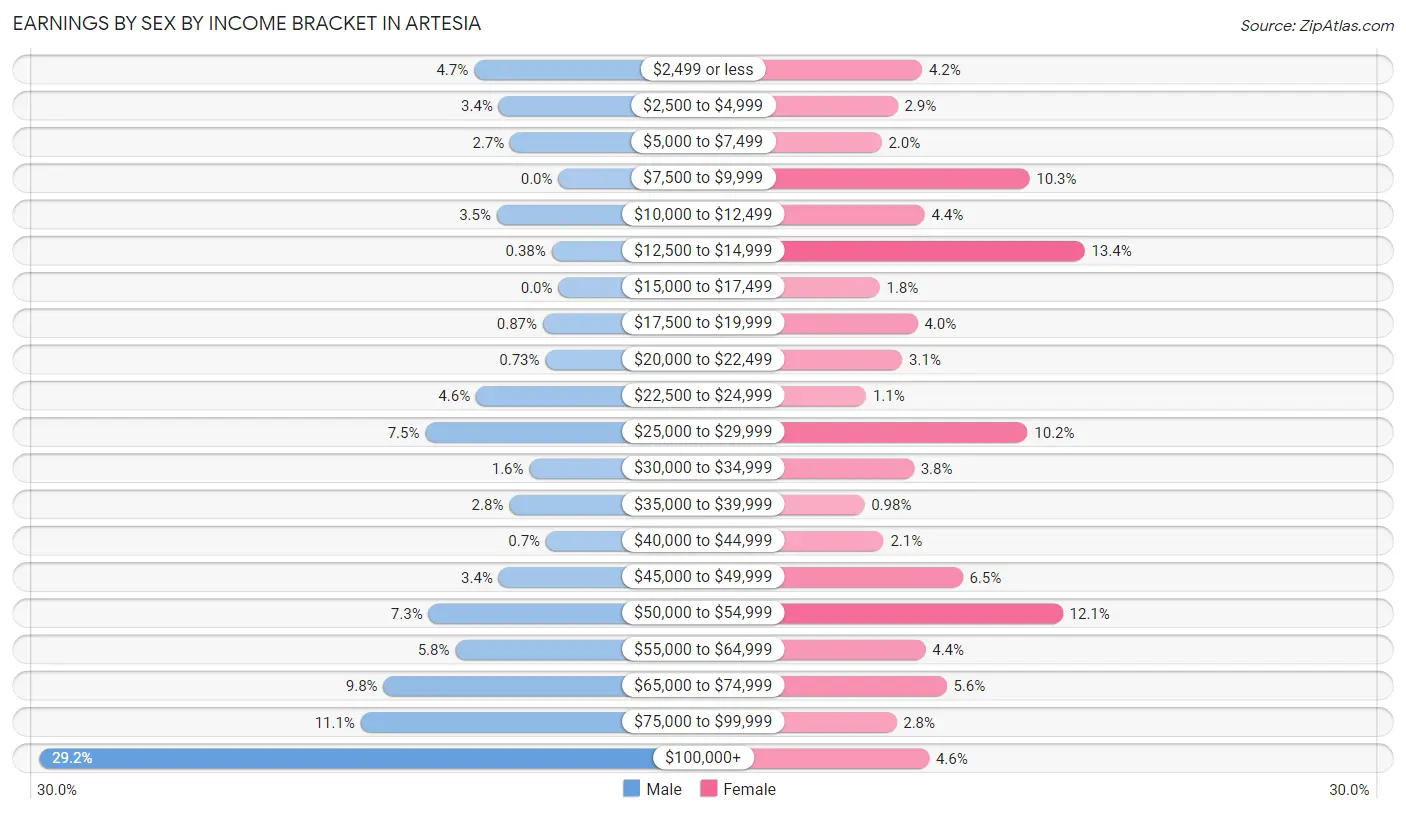
Earnings by Sex by Income Bracket in Artesia
The most common earnings brackets in Artesia are $100,000+ for men (1,003 | 29.2%) and $12,500 to $14,999 for women (370 | 13.4%).
| Income | Male | Female |
| $2,499 or less | 163 (4.7%) | 117 (4.2%) |
| $2,500 to $4,999 | 115 (3.4%) | 79 (2.9%) |
| $5,000 to $7,499 | 93 (2.7%) | 54 (1.9%) |
| $7,500 to $9,999 | 0 (0.0%) | 284 (10.3%) |
| $10,000 to $12,499 | 119 (3.5%) | 121 (4.4%) |
| $12,500 to $14,999 | 13 (0.4%) | 370 (13.4%) |
| $15,000 to $17,499 | 0 (0.0%) | 51 (1.8%) |
| $17,500 to $19,999 | 30 (0.9%) | 110 (4.0%) |
| $20,000 to $22,499 | 25 (0.7%) | 86 (3.1%) |
| $22,500 to $24,999 | 159 (4.6%) | 30 (1.1%) |
| $25,000 to $29,999 | 257 (7.5%) | 281 (10.2%) |
| $30,000 to $34,999 | 56 (1.6%) | 104 (3.8%) |
| $35,000 to $39,999 | 95 (2.8%) | 27 (1.0%) |
| $40,000 to $44,999 | 24 (0.7%) | 57 (2.1%) |
| $45,000 to $49,999 | 115 (3.4%) | 180 (6.5%) |
| $50,000 to $54,999 | 251 (7.3%) | 336 (12.1%) |
| $55,000 to $64,999 | 199 (5.8%) | 122 (4.4%) |
| $65,000 to $74,999 | 338 (9.8%) | 155 (5.6%) |
| $75,000 to $99,999 | 382 (11.1%) | 77 (2.8%) |
| $100,000+ | 1,003 (29.2%) | 128 (4.6%) |
| Total | 3,437 (100.0%) | 2,769 (100.0%) |
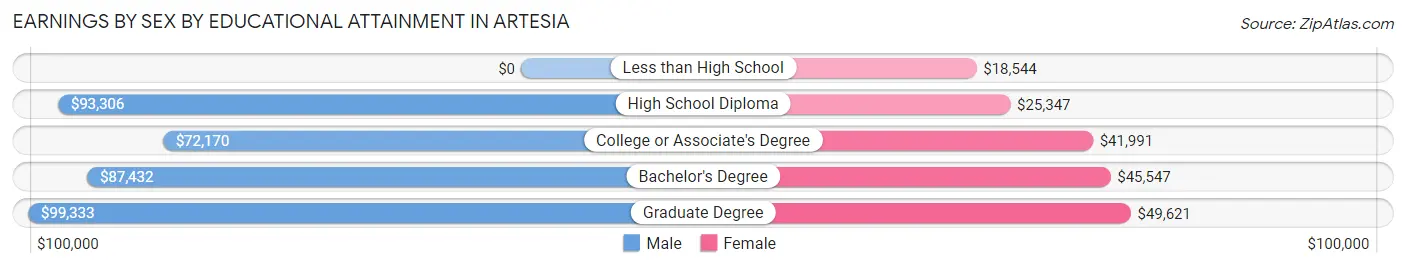
Earnings by Sex by Educational Attainment in Artesia
Average earnings in Artesia are $68,409 for men and $32,117 for women, a difference of 53.0%. Men with an educational attainment of graduate degree enjoy the highest average annual earnings of $99,333, while those with college or associate's degree education earn the least with $72,170. Women with an educational attainment of graduate degree earn the most with the average annual earnings of $49,621, while those with less than high school education have the smallest earnings of $18,544.
| Educational Attainment | Male Income | Female Income |
| Less than High School | - | - |
| High School Diploma | $93,306 | $25,347 |
| College or Associate's Degree | $72,170 | $41,991 |
| Bachelor's Degree | $87,432 | $45,547 |
| Graduate Degree | $99,333 | $49,621 |
| Total | $68,409 | $32,117 |
Family Income in Artesia
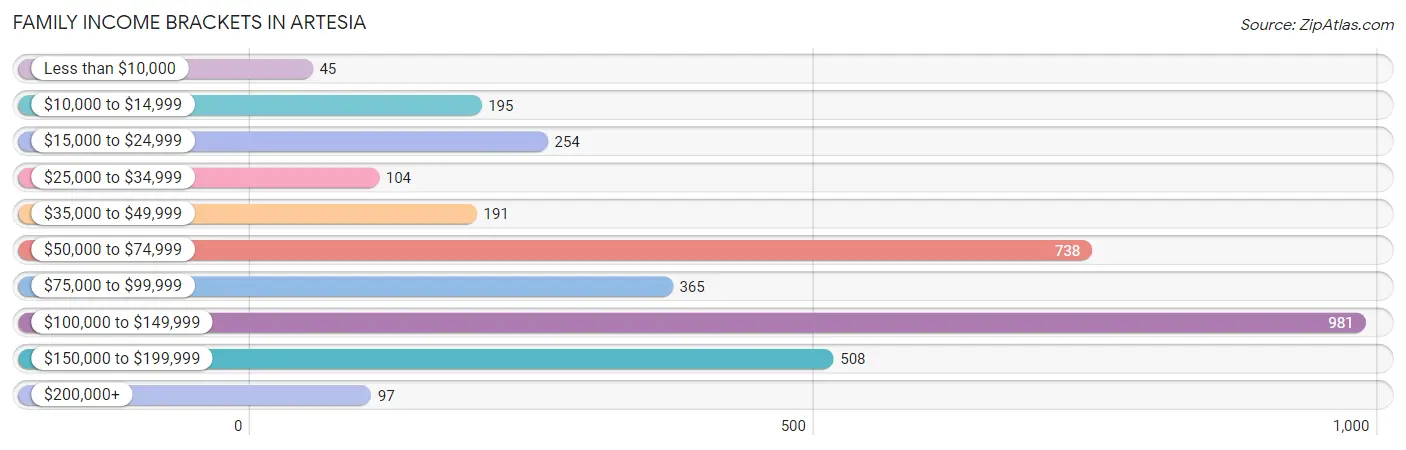
Family Income Brackets in Artesia
According to the Artesia family income data, there are 981 families falling into the $100,000 to $149,999 income range, which is the most common income bracket and makes up 28.2% of all families. Conversely, the less than $10,000 income bracket is the least frequent group with only 45 families (1.3%) belonging to this category.
| Income Bracket | # Families | % Families |
| Less than $10,000 | 45 | 1.3% |
| $10,000 to $14,999 | 195 | 5.6% |
| $15,000 to $24,999 | 254 | 7.3% |
| $25,000 to $34,999 | 104 | 3.0% |
| $35,000 to $49,999 | 191 | 5.5% |
| $50,000 to $74,999 | 738 | 21.2% |
| $75,000 to $99,999 | 365 | 10.5% |
| $100,000 to $149,999 | 981 | 28.2% |
| $150,000 to $199,999 | 508 | 14.6% |
| $200,000+ | 97 | 2.8% |
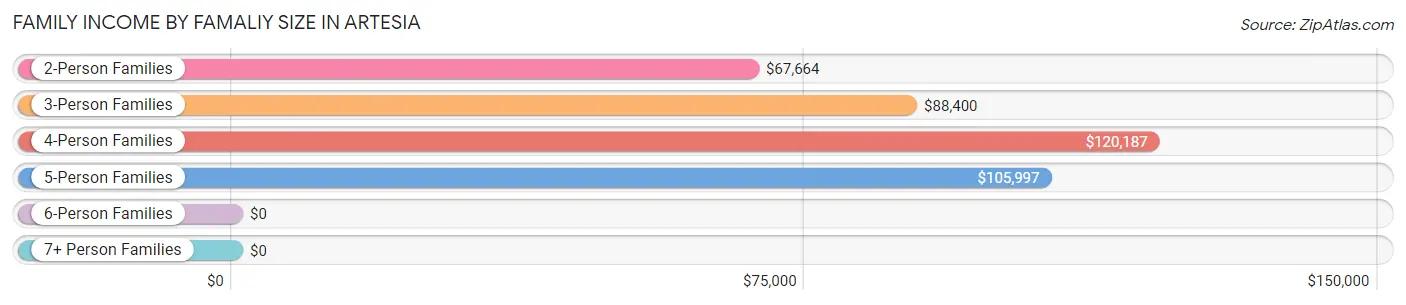
Family Income by Famaliy Size in Artesia
4-person families (678 | 19.5%) account for the highest median family income in Artesia with $120,187 per family, while 2-person families (1,527 | 43.9%) have the highest median income of $33,832 per family member.
| Income Bracket | # Families | Median Income |
| 2-Person Families | 1,527 (43.9%) | $67,664 |
| 3-Person Families | 742 (21.3%) | $88,400 |
| 4-Person Families | 678 (19.5%) | $120,187 |
| 5-Person Families | 365 (10.5%) | $105,997 |
| 6-Person Families | 147 (4.2%) | $0 |
| 7+ Person Families | 21 (0.6%) | $0 |
| Total | 3,480 (100.0%) | $89,100 |
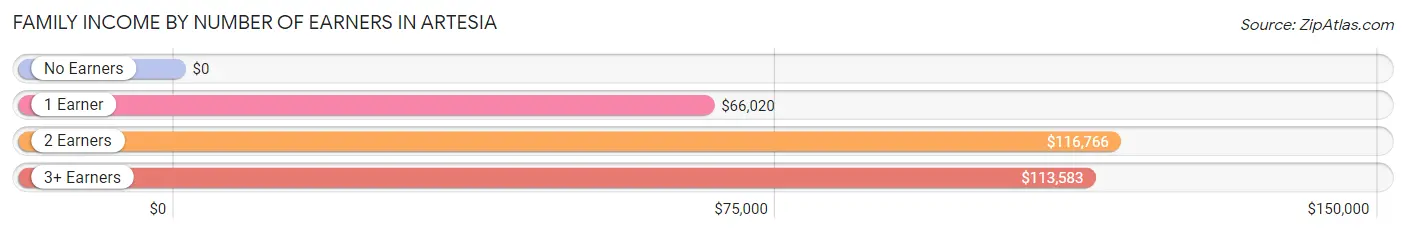
Family Income by Number of Earners in Artesia
| Number of Earners | # Families | Median Income |
| No Earners | 422 (12.1%) | $0 |
| 1 Earner | 1,238 (35.6%) | $66,020 |
| 2 Earners | 1,667 (47.9%) | $116,766 |
| 3+ Earners | 153 (4.4%) | $113,583 |
| Total | 3,480 (100.0%) | $89,100 |
Household Income in Artesia
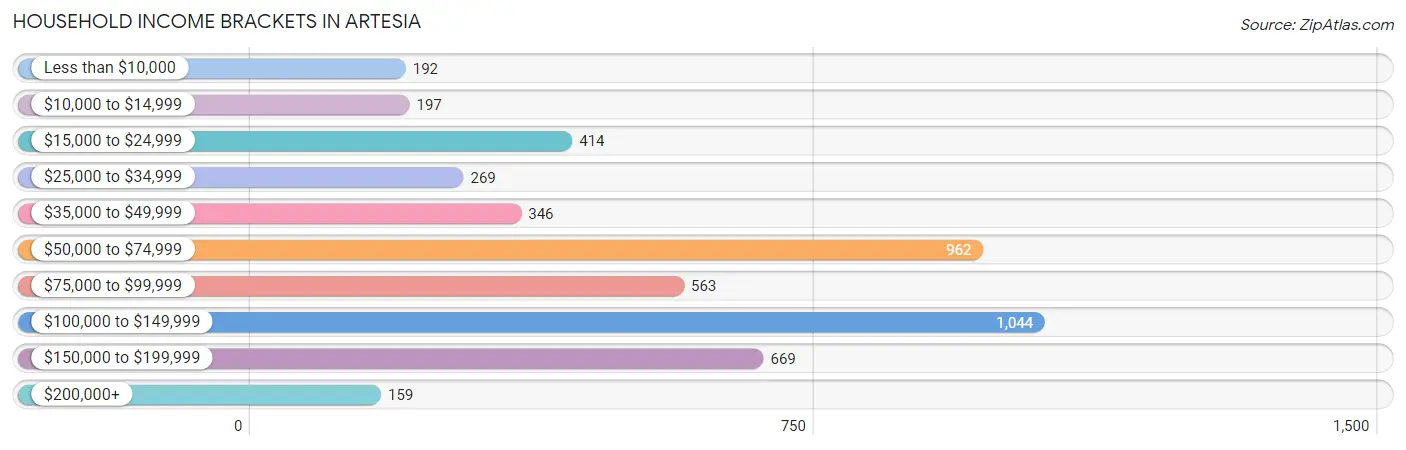
Household Income Brackets in Artesia
With 1,044 households falling in the category, the $100,000 to $149,999 income range is the most frequent in Artesia, accounting for 21.7% of all households. In contrast, only 159 households (3.3%) fall into the $200,000+ income bracket, making it the least populous group.
| Income Bracket | # Households | % Households |
| Less than $10,000 | 192 | 4.0% |
| $10,000 to $14,999 | 197 | 4.1% |
| $15,000 to $24,999 | 414 | 8.6% |
| $25,000 to $34,999 | 269 | 5.6% |
| $35,000 to $49,999 | 346 | 7.2% |
| $50,000 to $74,999 | 962 | 20.0% |
| $75,000 to $99,999 | 563 | 11.7% |
| $100,000 to $149,999 | 1,044 | 21.7% |
| $150,000 to $199,999 | 669 | 13.9% |
| $200,000+ | 159 | 3.3% |
Household Income by Householder Age in Artesia
The median household income in Artesia is $75,389, with the highest median household income of $97,596 found in the 45 to 64 years age bracket for the primary householder. A total of 1,726 households (35.9%) fall into this category. Meanwhile, the 15 to 24 years age bracket for the primary householder has the lowest median household income of $0, with 30 households (0.6%) in this group.
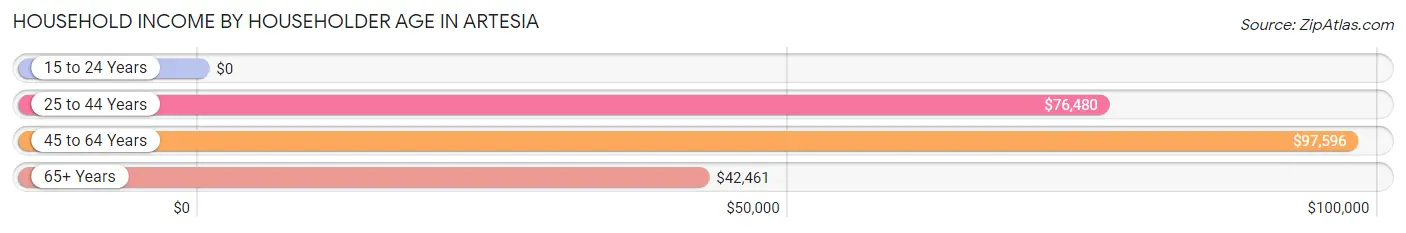
| Income Bracket | # Households | Median Income |
| 15 to 24 Years | 30 (0.6%) | $0 |
| 25 to 44 Years | 2,094 (43.5%) | $76,480 |
| 45 to 64 Years | 1,726 (35.9%) | $97,596 |
| 65+ Years | 961 (20.0%) | $42,461 |
| Total | 4,811 (100.0%) | $75,389 |
Poverty in Artesia
Income Below Poverty by Sex and Age in Artesia
With 12.8% poverty level for males and 11.8% for females among the residents of Artesia, 12 to 14 year old males and 45 to 54 year old females are the most vulnerable to poverty, with 363 males (56.7%) and 247 females (34.2%) in their respective age groups living below the poverty level.
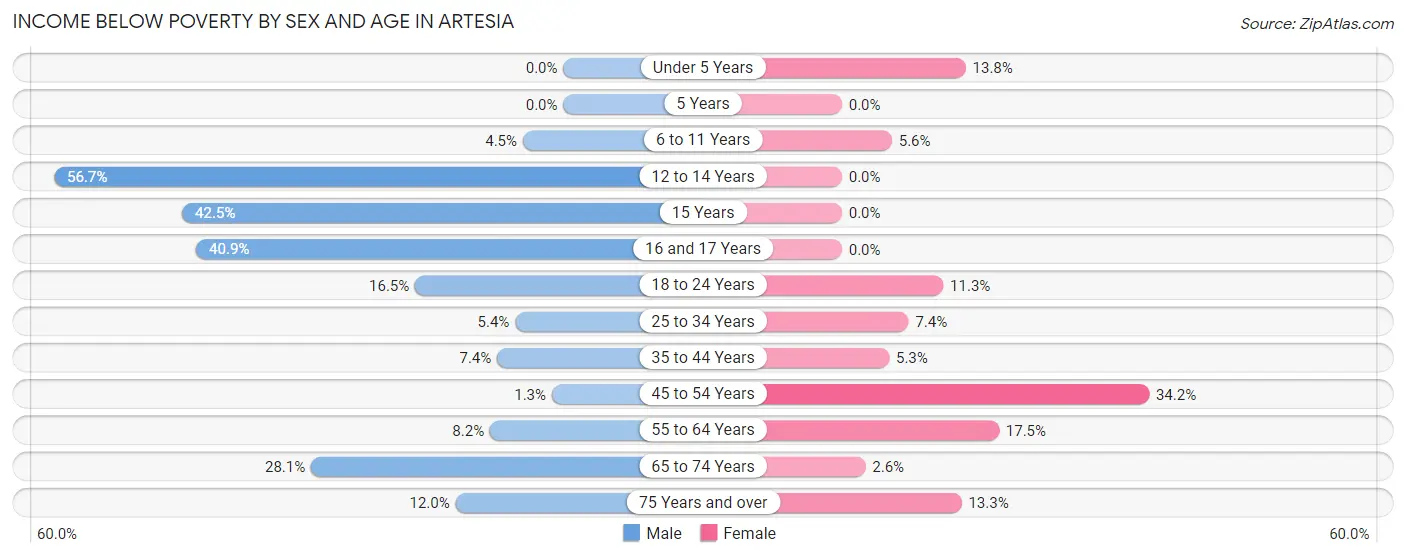
| Age Bracket | Male | Female |
| Under 5 Years | 0 (0.0%) | 56 (13.8%) |
| 5 Years | 0 (0.0%) | 0 (0.0%) |
| 6 to 11 Years | 30 (4.5%) | 33 (5.6%) |
| 12 to 14 Years | 363 (56.7%) | 0 (0.0%) |
| 15 Years | 31 (42.5%) | 0 (0.0%) |
| 16 and 17 Years | 83 (40.9%) | 0 (0.0%) |
| 18 to 24 Years | 36 (16.5%) | 77 (11.3%) |
| 25 to 34 Years | 52 (5.4%) | 71 (7.4%) |
| 35 to 44 Years | 69 (7.4%) | 51 (5.3%) |
| 45 to 54 Years | 9 (1.3%) | 247 (34.2%) |
| 55 to 64 Years | 66 (8.2%) | 117 (17.5%) |
| 65 to 74 Years | 77 (28.1%) | 10 (2.6%) |
| 75 Years and over | 37 (12.0%) | 36 (13.3%) |
| Total | 853 (12.8%) | 698 (11.8%) |
Income Above Poverty by Sex and Age in Artesia
According to the poverty statistics in Artesia, males aged under 5 years and females aged 5 years are the age groups that are most secure financially, with 100.0% of males and 100.0% of females in these age groups living above the poverty line.
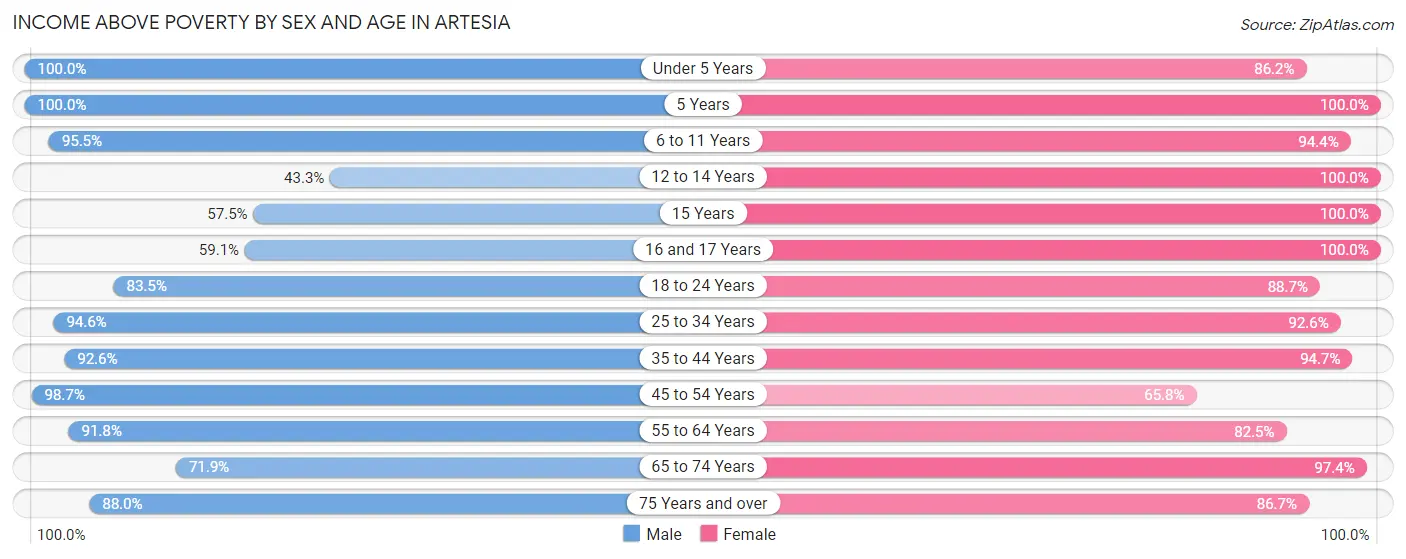
| Age Bracket | Male | Female |
| Under 5 Years | 696 (100.0%) | 350 (86.2%) |
| 5 Years | 165 (100.0%) | 32 (100.0%) |
| 6 to 11 Years | 635 (95.5%) | 559 (94.4%) |
| 12 to 14 Years | 277 (43.3%) | 158 (100.0%) |
| 15 Years | 42 (57.5%) | 18 (100.0%) |
| 16 and 17 Years | 120 (59.1%) | 36 (100.0%) |
| 18 to 24 Years | 182 (83.5%) | 605 (88.7%) |
| 25 to 34 Years | 918 (94.6%) | 884 (92.6%) |
| 35 to 44 Years | 866 (92.6%) | 919 (94.7%) |
| 45 to 54 Years | 696 (98.7%) | 475 (65.8%) |
| 55 to 64 Years | 742 (91.8%) | 552 (82.5%) |
| 65 to 74 Years | 197 (71.9%) | 372 (97.4%) |
| 75 Years and over | 271 (88.0%) | 234 (86.7%) |
| Total | 5,807 (87.2%) | 5,194 (88.1%) |
Income Below Poverty Among Married-Couple Families in Artesia
The poverty statistics for married-couple families in Artesia show that 1.5% or 37 of the total 2,503 families live below the poverty line. Families with no children have the highest poverty rate of 3.2%, comprising of 37 families. On the other hand, families with 1 or 2 children have the lowest poverty rate of 0.0%, which includes 0 families.
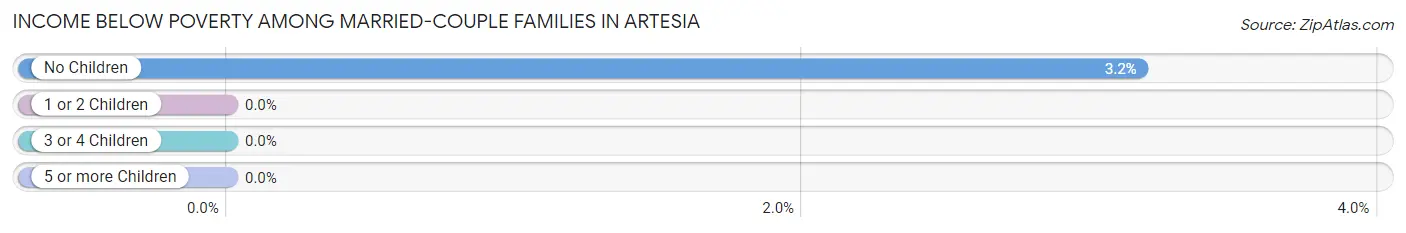
| Children | Above Poverty | Below Poverty |
| No Children | 1,130 (96.8%) | 37 (3.2%) |
| 1 or 2 Children | 1,039 (100.0%) | 0 (0.0%) |
| 3 or 4 Children | 297 (100.0%) | 0 (0.0%) |
| 5 or more Children | 0 (0.0%) | 0 (0.0%) |
| Total | 2,466 (98.5%) | 37 (1.5%) |
Income Below Poverty Among Single-Parent Households in Artesia
According to the poverty data in Artesia, 19.2% or 63 single-father households and 36.7% or 238 single-mother households are living below the poverty line. Among single-father households, those with no children have the highest poverty rate, with 63 households (30.4%) experiencing poverty. Likewise, among single-mother households, those with 3 or 4 children have the highest poverty rate, with 65 households (56.0%) falling below the poverty line.
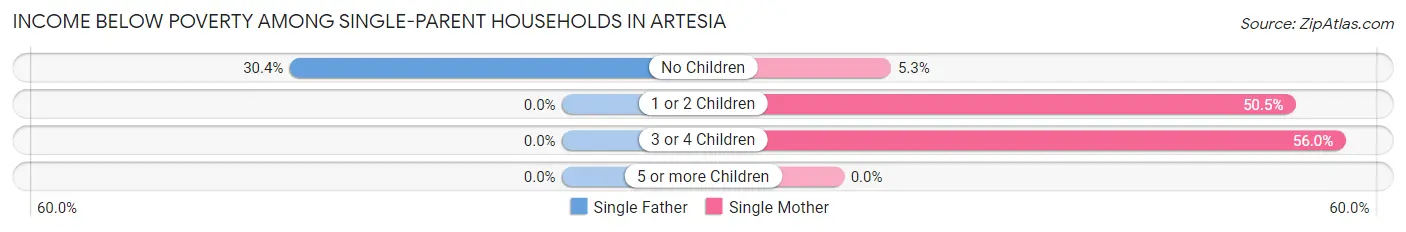
| Children | Single Father | Single Mother |
| No Children | 63 (30.4%) | 10 (5.3%) |
| 1 or 2 Children | 0 (0.0%) | 163 (50.5%) |
| 3 or 4 Children | 0 (0.0%) | 65 (56.0%) |
| 5 or more Children | 0 (0.0%) | 0 (0.0%) |
| Total | 63 (19.2%) | 238 (36.7%) |
Income Below Poverty Among Married-Couple vs Single-Parent Households in Artesia
The poverty data for Artesia shows that 37 of the married-couple family households (1.5%) and 301 of the single-parent households (30.8%) are living below the poverty level. Within the married-couple family households, those with no children have the highest poverty rate, with 37 households (3.2%) falling below the poverty line. Among the single-parent households, those with 3 or 4 children have the highest poverty rate, with 65 household (56.0%) living below poverty.
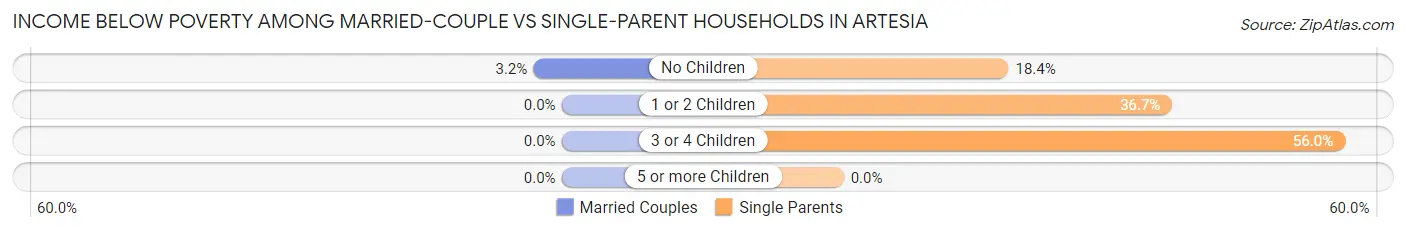
| Children | Married-Couple Families | Single-Parent Households |
| No Children | 37 (3.2%) | 73 (18.4%) |
| 1 or 2 Children | 0 (0.0%) | 163 (36.7%) |
| 3 or 4 Children | 0 (0.0%) | 65 (56.0%) |
| 5 or more Children | 0 (0.0%) | 0 (0.0%) |
| Total | 37 (1.5%) | 301 (30.8%) |
Race in Artesia
The most populous races in Artesia are White / Caucasian (8,564 | 67.8%), Hispanic or Latino (6,759 | 53.5%), and Two or more Races (2,180 | 17.3%).
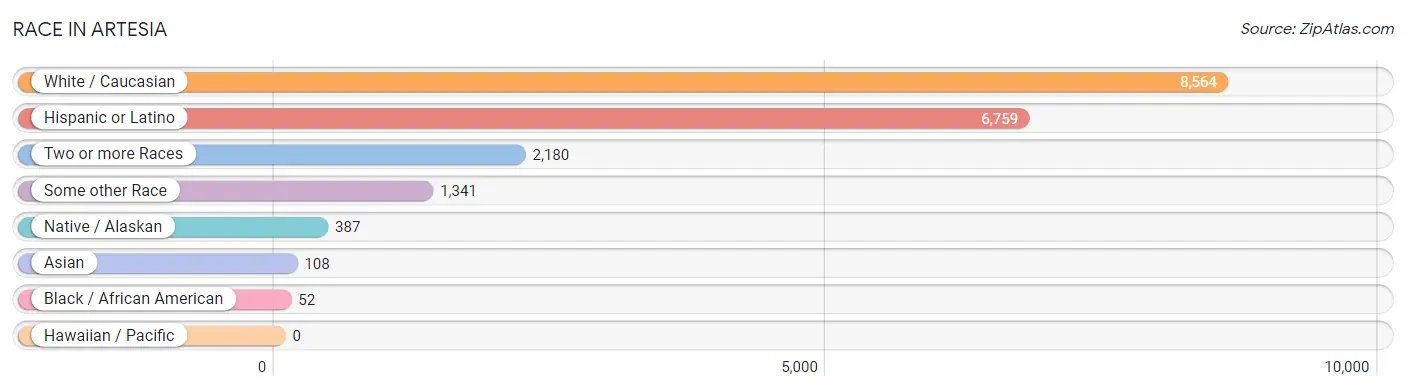
| Race | # Population | % Population |
| Asian | 108 | 0.9% |
| Black / African American | 52 | 0.4% |
| Hawaiian / Pacific | 0 | 0.0% |
| Hispanic or Latino | 6,759 | 53.5% |
| Native / Alaskan | 387 | 3.1% |
| White / Caucasian | 8,564 | 67.8% |
| Two or more Races | 2,180 | 17.3% |
| Some other Race | 1,341 | 10.6% |
| Total | 12,632 | 100.0% |
Ancestry in Artesia
The most populous ancestries reported in Artesia are Mexican (6,085 | 48.2%), German (1,222 | 9.7%), English (1,092 | 8.6%), Irish (812 | 6.4%), and American (697 | 5.5%), together accounting for 78.4% of all Artesia residents.
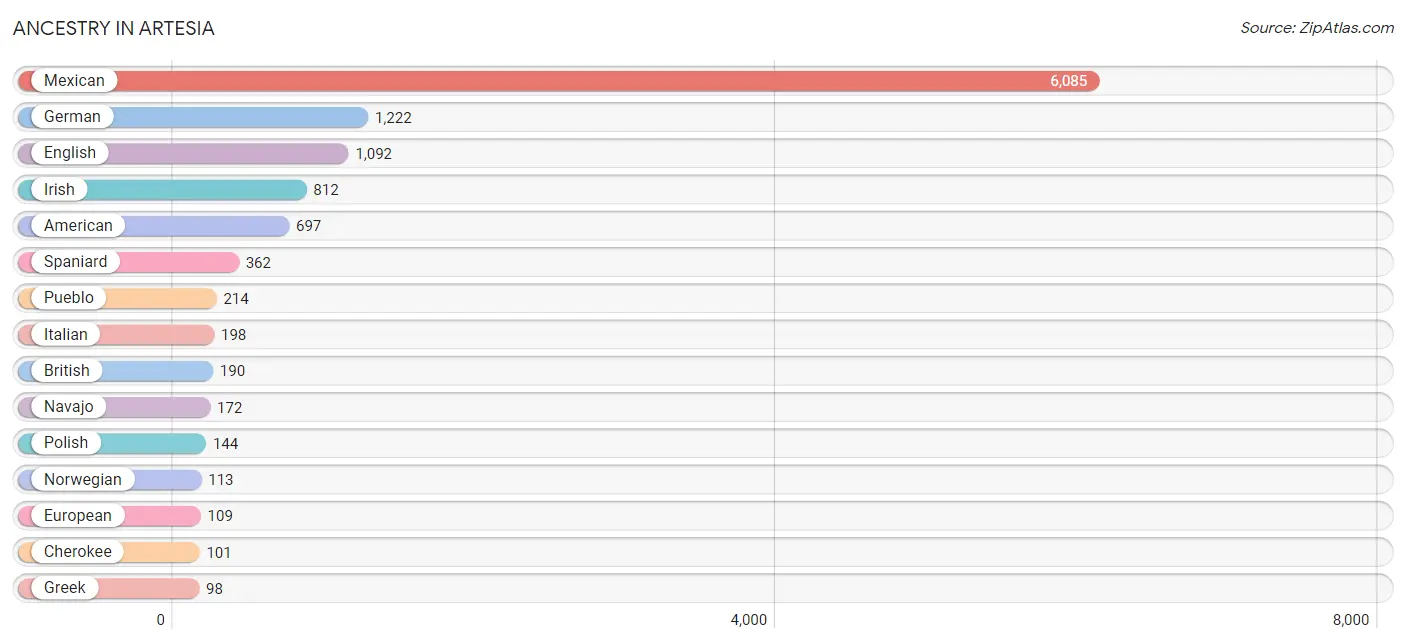
| Ancestry | # Population | % Population |
| American | 697 | 5.5% |
| British | 190 | 1.5% |
| Burmese | 43 | 0.3% |
| Central American | 39 | 0.3% |
| Central American Indian | 13 | 0.1% |
| Cherokee | 101 | 0.8% |
| Dutch | 35 | 0.3% |
| Dutch West Indian | 65 | 0.5% |
| Eastern European | 84 | 0.7% |
| English | 1,092 | 8.6% |
| European | 109 | 0.9% |
| French | 22 | 0.2% |
| German | 1,222 | 9.7% |
| Greek | 98 | 0.8% |
| Guatemalan | 39 | 0.3% |
| Hungarian | 29 | 0.2% |
| Irish | 812 | 6.4% |
| Italian | 198 | 1.6% |
| Korean | 16 | 0.1% |
| Mexican | 6,085 | 48.2% |
| Navajo | 172 | 1.4% |
| Norwegian | 113 | 0.9% |
| Polish | 144 | 1.1% |
| Pueblo | 214 | 1.7% |
| Scandinavian | 19 | 0.2% |
| Scottish | 59 | 0.5% |
| Spaniard | 362 | 2.9% |
| Spanish | 11 | 0.1% |
| Thai | 49 | 0.4% |
| Welsh | 32 | 0.3% | View All 30 Rows |
Immigrants in Artesia
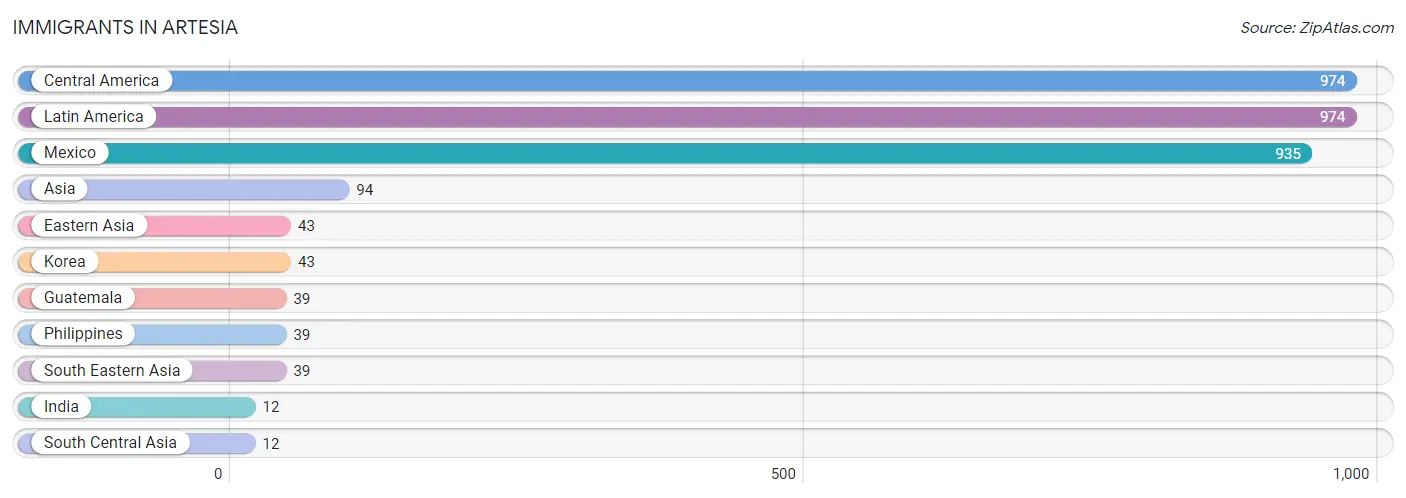
The most numerous immigrant groups reported in Artesia came from Central America (974 | 7.7%), Latin America (974 | 7.7%), Mexico (935 | 7.4%), Asia (94 | 0.7%), and Eastern Asia (43 | 0.3%), together accounting for 23.9% of all Artesia residents.
| Immigration Origin | # Population | % Population |
| Asia | 94 | 0.7% |
| Central America | 974 | 7.7% |
| Eastern Asia | 43 | 0.3% |
| Guatemala | 39 | 0.3% |
| India | 12 | 0.1% |
| Korea | 43 | 0.3% |
| Latin America | 974 | 7.7% |
| Mexico | 935 | 7.4% |
| Philippines | 39 | 0.3% |
| South Central Asia | 12 | 0.1% |
| South Eastern Asia | 39 | 0.3% | View All 11 Rows |
Sex and Age in Artesia
Sex and Age in Artesia
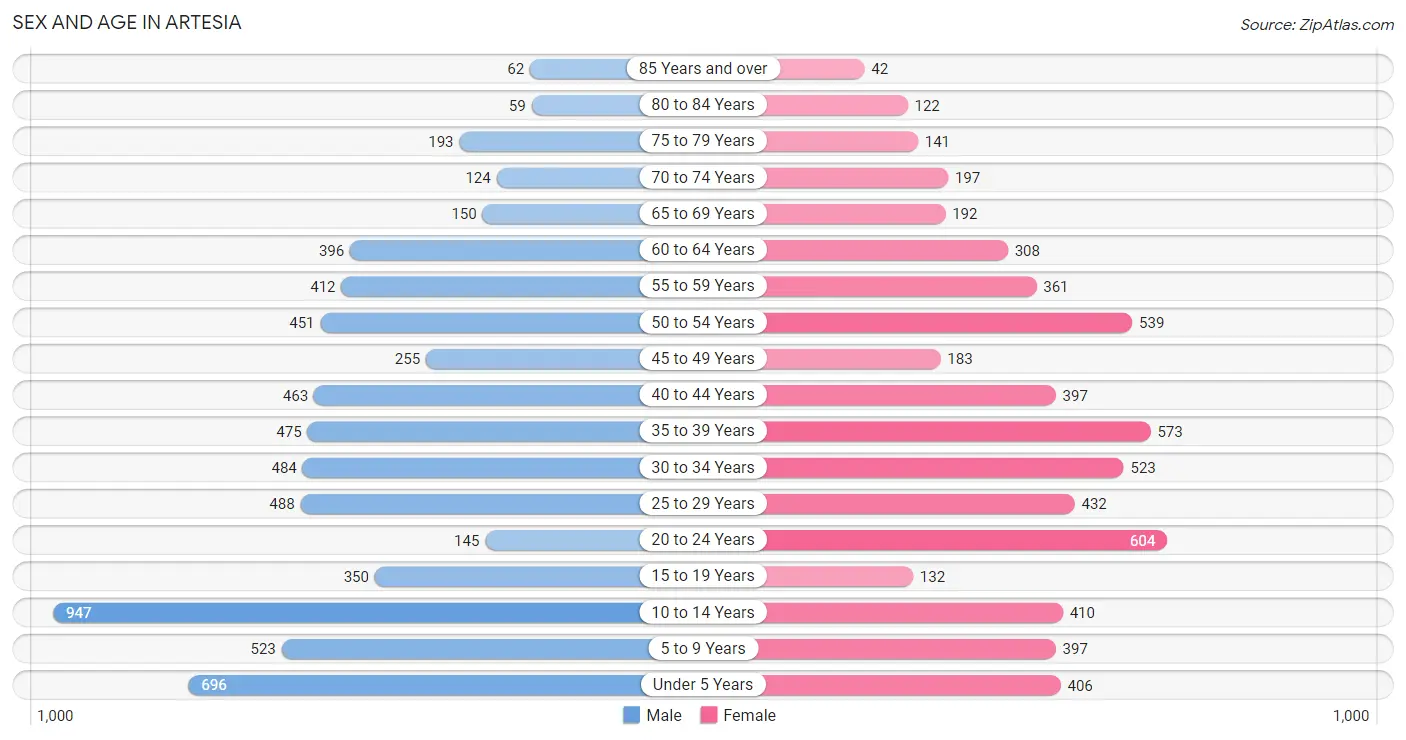
The most populous age groups in Artesia are 10 to 14 Years (947 | 14.2%) for men and 20 to 24 Years (604 | 10.1%) for women.
| Age Bracket | Male | Female |
| Under 5 Years | 696 (10.4%) | 406 (6.8%) |
| 5 to 9 Years | 523 (7.8%) | 397 (6.7%) |
| 10 to 14 Years | 947 (14.2%) | 410 (6.9%) |
| 15 to 19 Years | 350 (5.2%) | 132 (2.2%) |
| 20 to 24 Years | 145 (2.2%) | 604 (10.1%) |
| 25 to 29 Years | 488 (7.3%) | 432 (7.2%) |
| 30 to 34 Years | 484 (7.2%) | 523 (8.8%) |
| 35 to 39 Years | 475 (7.1%) | 573 (9.6%) |
| 40 to 44 Years | 463 (6.9%) | 397 (6.7%) |
| 45 to 49 Years | 255 (3.8%) | 183 (3.1%) |
| 50 to 54 Years | 451 (6.8%) | 539 (9.0%) |
| 55 to 59 Years | 412 (6.2%) | 361 (6.1%) |
| 60 to 64 Years | 396 (5.9%) | 308 (5.2%) |
| 65 to 69 Years | 150 (2.2%) | 192 (3.2%) |
| 70 to 74 Years | 124 (1.9%) | 197 (3.3%) |
| 75 to 79 Years | 193 (2.9%) | 141 (2.4%) |
| 80 to 84 Years | 59 (0.9%) | 122 (2.1%) |
| 85 Years and over | 62 (0.9%) | 42 (0.7%) |
| Total | 6,673 (100.0%) | 5,959 (100.0%) |
Families and Households in Artesia
Median Family Size in Artesia
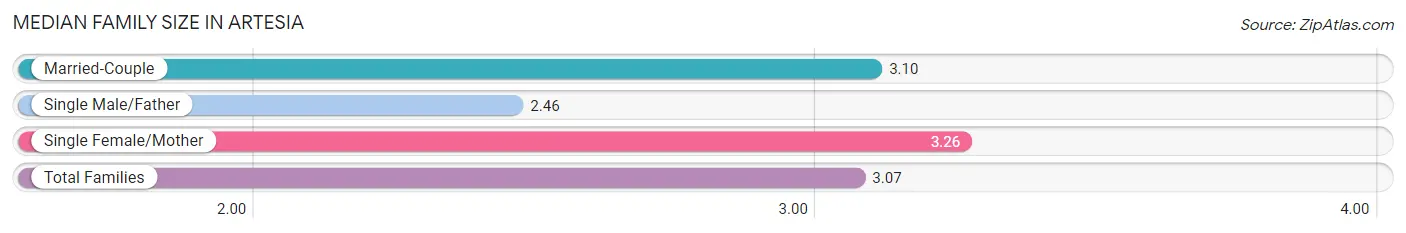
The median family size in Artesia is 3.07 persons per family, with single female/mother families (649 | 18.6%) accounting for the largest median family size of 3.26 persons per family. On the other hand, single male/father families (328 | 9.4%) represent the smallest median family size with 2.46 persons per family.
| Family Type | # Families | Family Size |
| Married-Couple | 2,503 (71.9%) | 3.10 |
| Single Male/Father | 328 (9.4%) | 2.46 |
| Single Female/Mother | 649 (18.6%) | 3.26 |
| Total Families | 3,480 (100.0%) | 3.07 |
Median Household Size in Artesia
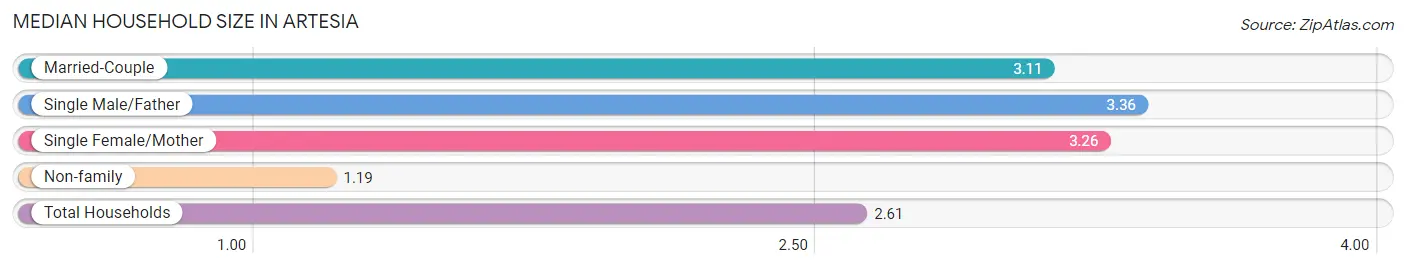
The median household size in Artesia is 2.61 persons per household, with single male/father households (328 | 6.8%) accounting for the largest median household size of 3.36 persons per household. non-family households (1,331 | 27.7%) represent the smallest median household size with 1.19 persons per household.
| Household Type | # Households | Household Size |
| Married-Couple | 2,503 (52.0%) | 3.11 |
| Single Male/Father | 328 (6.8%) | 3.36 |
| Single Female/Mother | 649 (13.5%) | 3.26 |
| Non-family | 1,331 (27.7%) | 1.19 |
| Total Households | 4,811 (100.0%) | 2.61 |
Household Size by Marriage Status in Artesia
Out of a total of 4,811 households in Artesia, 3,480 (72.3%) are family households, while 1,331 (27.7%) are nonfamily households. The most numerous type of family households are 2-person households, comprising 1,431, and the most common type of nonfamily households are 1-person households, comprising 1,192.
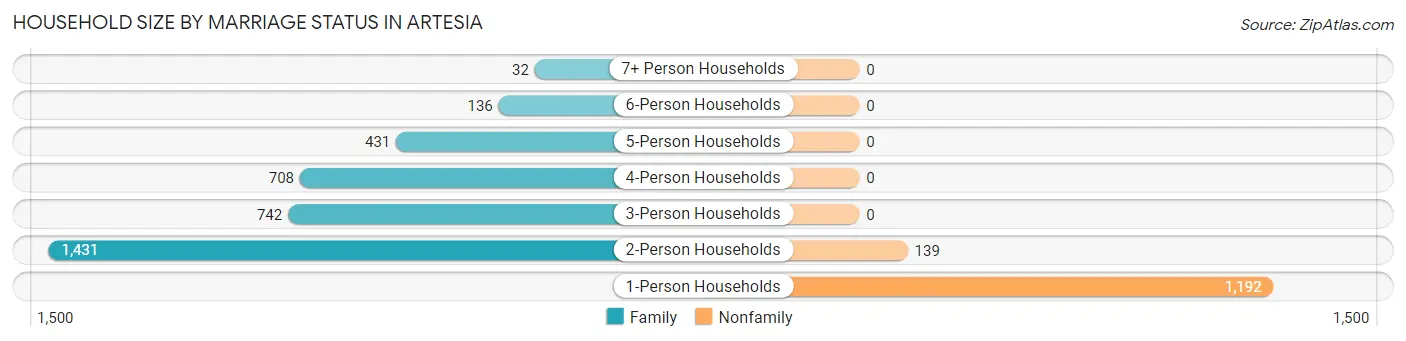
| Household Size | Family Households | Nonfamily Households |
| 1-Person Households | - | 1,192 (24.8%) |
| 2-Person Households | 1,431 (29.7%) | 139 (2.9%) |
| 3-Person Households | 742 (15.4%) | 0 (0.0%) |
| 4-Person Households | 708 (14.7%) | 0 (0.0%) |
| 5-Person Households | 431 (9.0%) | 0 (0.0%) |
| 6-Person Households | 136 (2.8%) | 0 (0.0%) |
| 7+ Person Households | 32 (0.7%) | 0 (0.0%) |
| Total | 3,480 (72.3%) | 1,331 (27.7%) |
Female Fertility in Artesia
Fertility by Age in Artesia
Average fertility rate in Artesia is 80.0 births per 1,000 women. Women in the age bracket of 20 to 34 years have the highest fertility rate with 123.0 births per 1,000 women. Women in the age bracket of 20 to 34 years acount for 82.7% of all women with births.
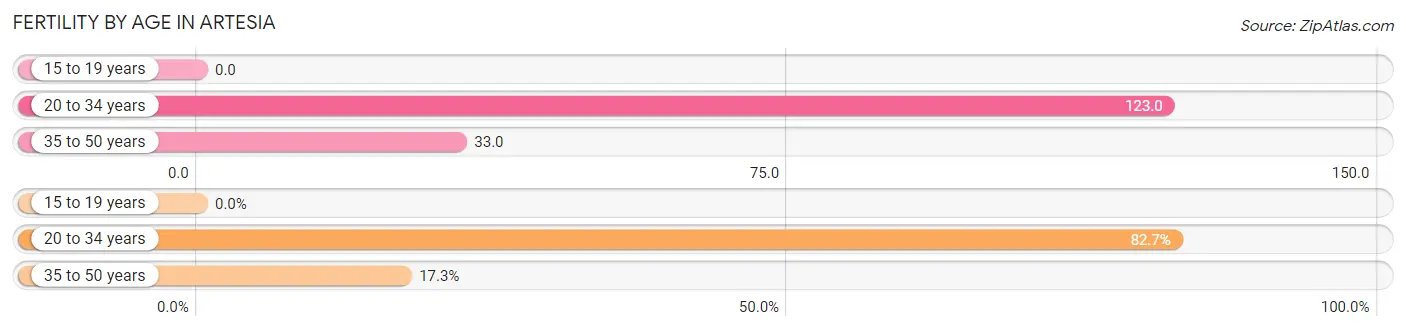
| Age Bracket | Women with Births | Births / 1,000 Women |
| 15 to 19 years | 0 (0.0%) | 0.0 |
| 20 to 34 years | 191 (82.7%) | 123.0 |
| 35 to 50 years | 40 (17.3%) | 33.0 |
| Total | 231 (100.0%) | 80.0 |
Fertility by Age by Marriage Status in Artesia
69.3% of women with births (231) in Artesia are married. The highest percentage of unmarried women with births falls into 35 to 50 years age bracket with 52.5% of them unmarried at the time of birth, while the lowest percentage of unmarried women with births belong to 20 to 34 years age bracket with 26.2% of them unmarried.
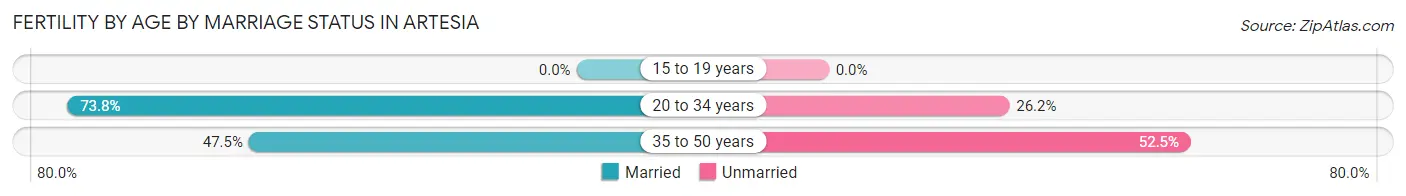
| Age Bracket | Married | Unmarried |
| 15 to 19 years | 0 (0.0%) | 0 (0.0%) |
| 20 to 34 years | 141 (73.8%) | 50 (26.2%) |
| 35 to 50 years | 19 (47.5%) | 21 (52.5%) |
| Total | 160 (69.3%) | 71 (30.7%) |
Fertility by Education in Artesia
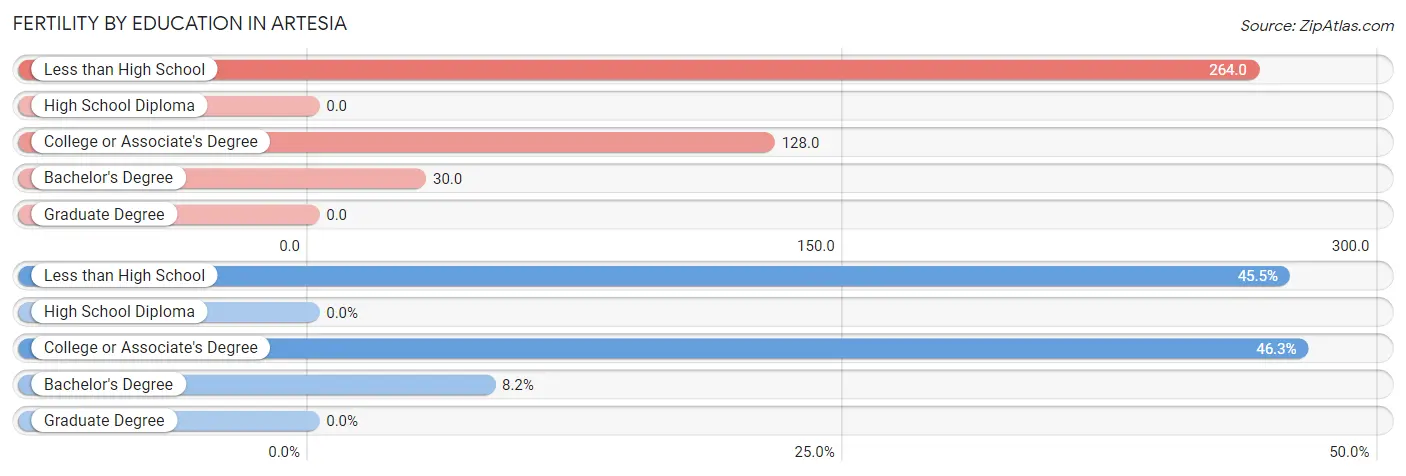
| Educational Attainment | Women with Births | Births / 1,000 Women |
| Less than High School | 105 (45.5%) | 264.0 |
| High School Diploma | 0 (0.0%) | 0.0 |
| College or Associate's Degree | 107 (46.3%) | 128.0 |
| Bachelor's Degree | 19 (8.2%) | 30.0 |
| Graduate Degree | 0 (0.0%) | 0.0 |
| Total | 231 (100.0%) | 80.0 |
Fertility by Education by Marriage Status in Artesia
30.7% of women with births in Artesia are unmarried. Women with the educational attainment of college or associate's degree are most likely to be married with 100.0% of them married at childbirth, while women with the educational attainment of less than high school are least likely to be married with 67.6% of them unmarried at childbirth.
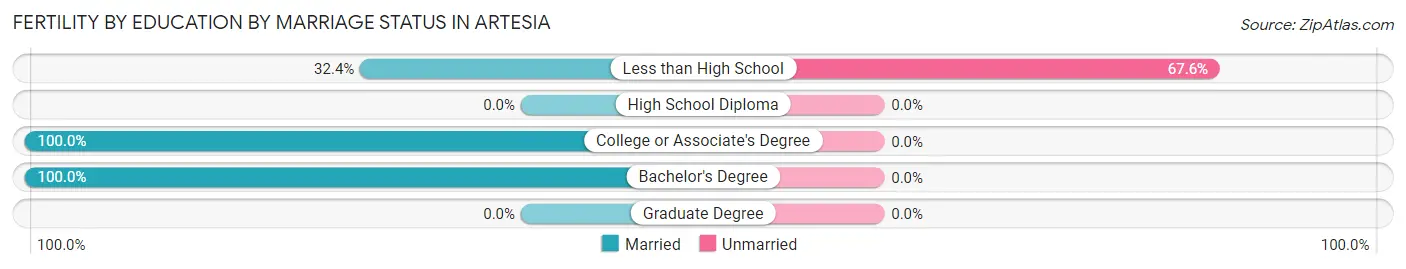
| Educational Attainment | Married | Unmarried |
| Less than High School | 34 (32.4%) | 71 (67.6%) |
| High School Diploma | 0 (0.0%) | 0 (0.0%) |
| College or Associate's Degree | 107 (100.0%) | 0 (0.0%) |
| Bachelor's Degree | 19 (100.0%) | 0 (0.0%) |
| Graduate Degree | 0 (0.0%) | 0 (0.0%) |
| Total | 160 (69.3%) | 71 (30.7%) |
Employment Characteristics in Artesia
Employment by Class of Employer in Artesia
Among the 5,764 employed individuals in Artesia, private company employees (3,615 | 62.7%), not-for-profit organizations (1,073 | 18.6%), and state government employees (379 | 6.6%) make up the most common classes of employment.
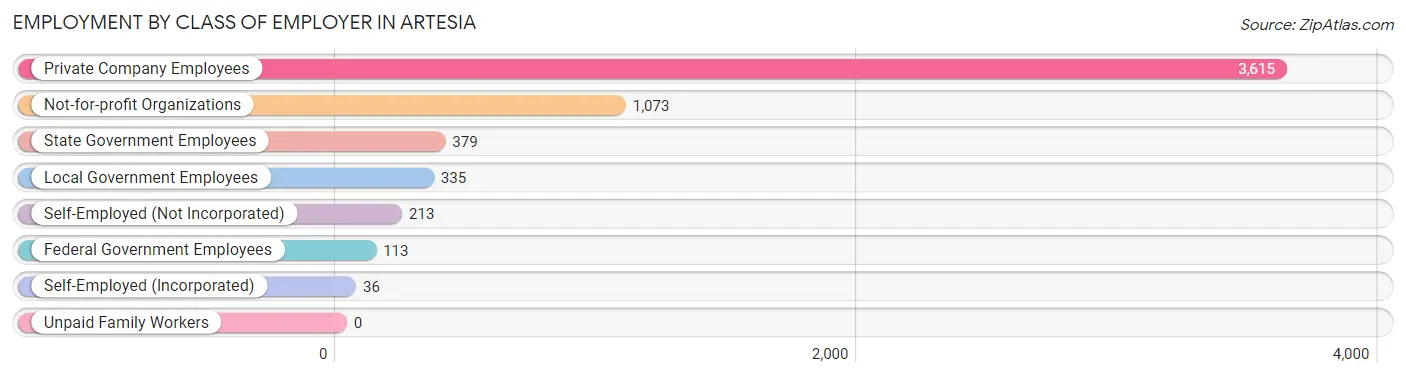
| Employer Class | # Employees | % Employees |
| Private Company Employees | 3,615 | 62.7% |
| Self-Employed (Incorporated) | 36 | 0.6% |
| Self-Employed (Not Incorporated) | 213 | 3.7% |
| Not-for-profit Organizations | 1,073 | 18.6% |
| Local Government Employees | 335 | 5.8% |
| State Government Employees | 379 | 6.6% |
| Federal Government Employees | 113 | 2.0% |
| Unpaid Family Workers | 0 | 0.0% |
| Total | 5,764 | 100.0% |
Employment Status by Age in Artesia
According to the labor force statistics for Artesia, out of the total population over 16 years of age (9,162), 66.2% or 6,065 individuals are in the labor force, with 4.5% or 273 of them unemployed. The age group with the highest labor force participation rate is 35 to 44 years, with 90.8% or 1,732 individuals in the labor force. Within the labor force, the 75 years and over age range has the highest percentage of unemployed individuals, with 67.8% or 61 of them being unemployed.
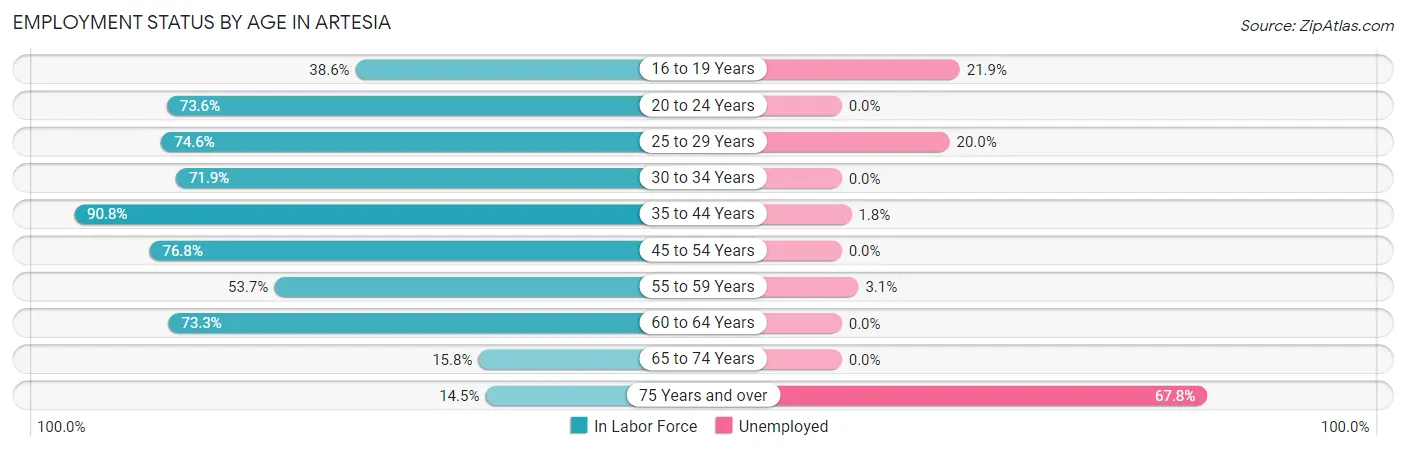
| Age Bracket | In Labor Force | Unemployed |
| 16 to 19 Years | 151 (38.6%) | 33 (21.9%) |
| 20 to 24 Years | 551 (73.6%) | 0 (0.0%) |
| 25 to 29 Years | 686 (74.6%) | 137 (20.0%) |
| 30 to 34 Years | 724 (71.9%) | 0 (0.0%) |
| 35 to 44 Years | 1,732 (90.8%) | 31 (1.8%) |
| 45 to 54 Years | 1,097 (76.8%) | 0 (0.0%) |
| 55 to 59 Years | 415 (53.7%) | 13 (3.1%) |
| 60 to 64 Years | 516 (73.3%) | 0 (0.0%) |
| 65 to 74 Years | 105 (15.8%) | 0 (0.0%) |
| 75 Years and over | 90 (14.5%) | 61 (67.8%) |
| Total | 6,065 (66.2%) | 273 (4.5%) |
Employment Status by Educational Attainment in Artesia
According to labor force statistics for Artesia, 76.7% of individuals (5,170) out of the total population between 25 and 64 years of age (6,740) are in the labor force, with 3.5% or 181 of them being unemployed. The group with the highest labor force participation rate are those with the educational attainment of bachelor's degree or higher, with 92.2% or 1,117 individuals in the labor force. Within the labor force, individuals with high school diploma education have the highest percentage of unemployment, with 6.1% or 76 of them being unemployed.
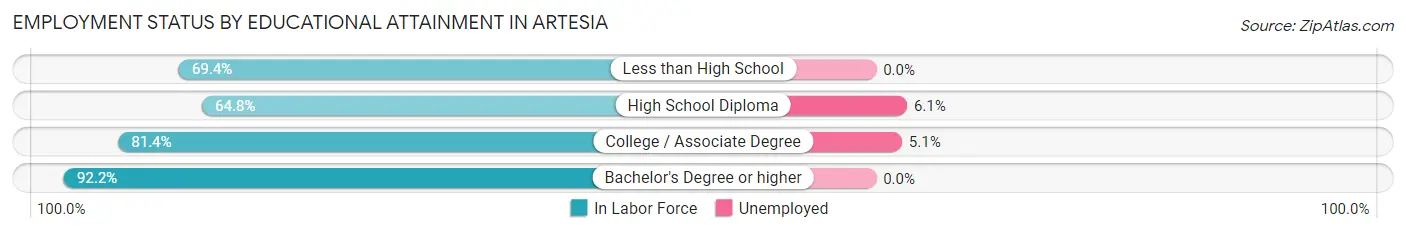
| Educational Attainment | In Labor Force | Unemployed |
| Less than High School | 728 (69.4%) | 0 (0.0%) |
| High School Diploma | 1,248 (64.8%) | 117 (6.1%) |
| College / Associate Degree | 2,079 (81.4%) | 130 (5.1%) |
| Bachelor's Degree or higher | 1,117 (92.2%) | 0 (0.0%) |
| Total | 5,170 (76.7%) | 236 (3.5%) |
Employment Occupations by Sex in Artesia
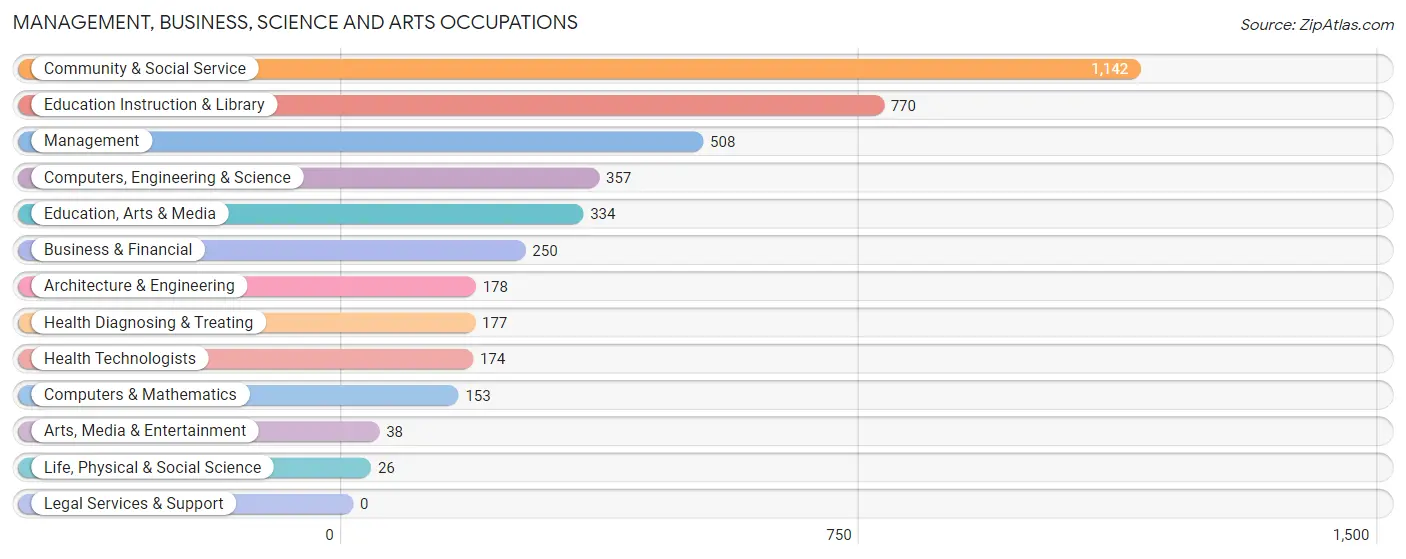
Management, Business, Science and Arts Occupations
The most common Management, Business, Science and Arts occupations in Artesia are Community & Social Service (1,142 | 19.7%), Education Instruction & Library (770 | 13.3%), Management (508 | 8.8%), Computers, Engineering & Science (357 | 6.2%), and Education, Arts & Media (334 | 5.8%).
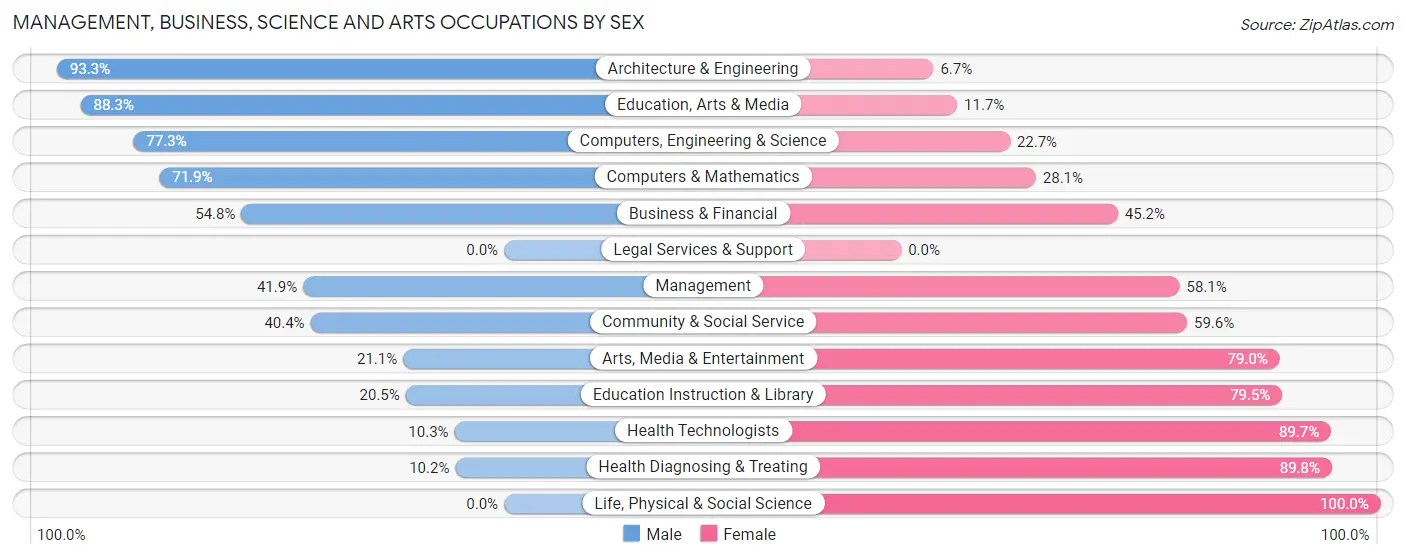
Management, Business, Science and Arts Occupations by Sex
Within the Management, Business, Science and Arts occupations in Artesia, the most male-oriented occupations are Architecture & Engineering (93.3%), Education, Arts & Media (88.3%), and Computers, Engineering & Science (77.3%), while the most female-oriented occupations are Life, Physical & Social Science (100.0%), Health Diagnosing & Treating (89.8%), and Health Technologists (89.7%).
| Occupation | Male | Female |
| Management | 213 (41.9%) | 295 (58.1%) |
| Business & Financial | 137 (54.8%) | 113 (45.2%) |
| Computers, Engineering & Science | 276 (77.3%) | 81 (22.7%) |
| Computers & Mathematics | 110 (71.9%) | 43 (28.1%) |
| Architecture & Engineering | 166 (93.3%) | 12 (6.7%) |
| Life, Physical & Social Science | 0 (0.0%) | 26 (100.0%) |
| Community & Social Service | 461 (40.4%) | 681 (59.6%) |
| Education, Arts & Media | 295 (88.3%) | 39 (11.7%) |
| Legal Services & Support | 0 (0.0%) | 0 (0.0%) |
| Education Instruction & Library | 158 (20.5%) | 612 (79.5%) |
| Arts, Media & Entertainment | 8 (21.0%) | 30 (78.9%) |
| Health Diagnosing & Treating | 18 (10.2%) | 159 (89.8%) |
| Health Technologists | 18 (10.3%) | 156 (89.7%) |
| Total (Category) | 1,105 (45.4%) | 1,329 (54.6%) |
| Total (Overall) | 3,189 (55.1%) | 2,603 (44.9%) |
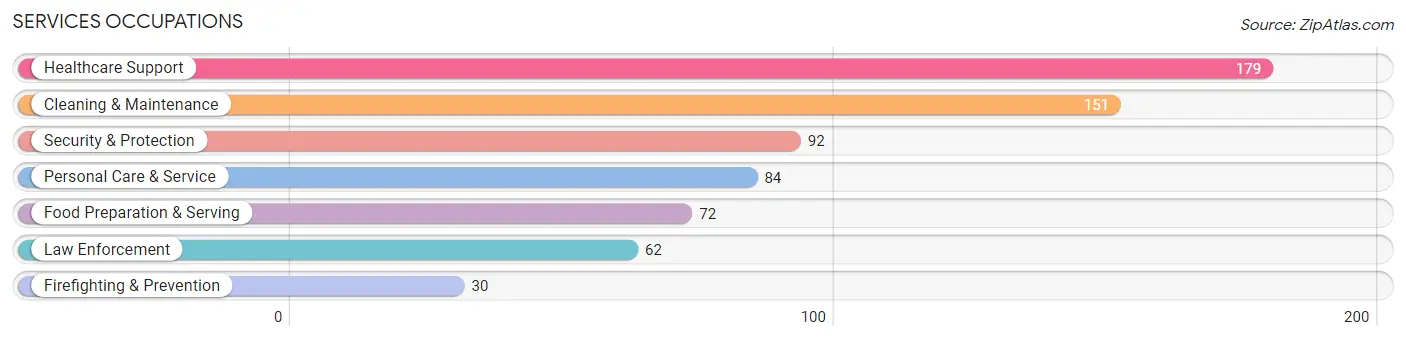
Services Occupations
The most common Services occupations in Artesia are Healthcare Support (179 | 3.1%), Cleaning & Maintenance (151 | 2.6%), Security & Protection (92 | 1.6%), Personal Care & Service (84 | 1.5%), and Food Preparation & Serving (72 | 1.2%).
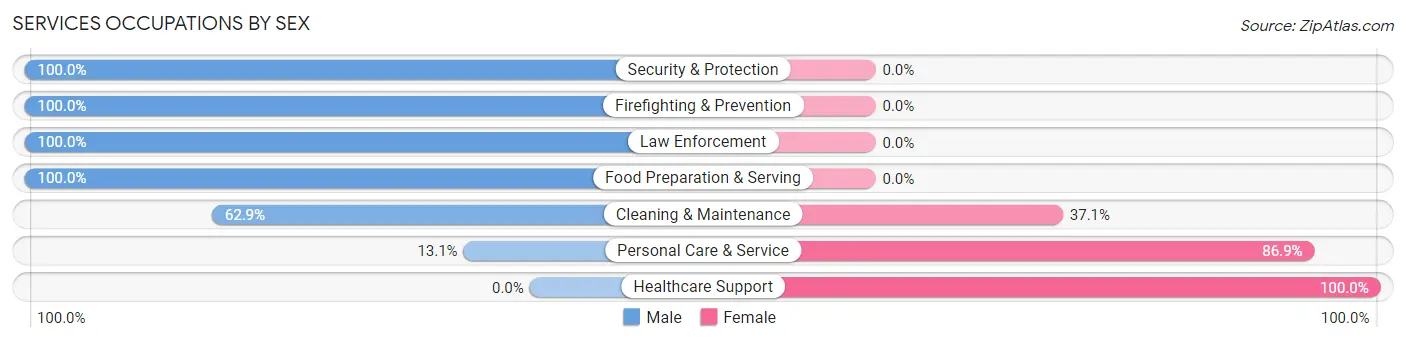
Services Occupations by Sex
Within the Services occupations in Artesia, the most male-oriented occupations are Security & Protection (100.0%), Firefighting & Prevention (100.0%), and Law Enforcement (100.0%), while the most female-oriented occupations are Healthcare Support (100.0%), Personal Care & Service (86.9%), and Cleaning & Maintenance (37.1%).
| Occupation | Male | Female |
| Healthcare Support | 0 (0.0%) | 179 (100.0%) |
| Security & Protection | 92 (100.0%) | 0 (0.0%) |
| Firefighting & Prevention | 30 (100.0%) | 0 (0.0%) |
| Law Enforcement | 62 (100.0%) | 0 (0.0%) |
| Food Preparation & Serving | 72 (100.0%) | 0 (0.0%) |
| Cleaning & Maintenance | 95 (62.9%) | 56 (37.1%) |
| Personal Care & Service | 11 (13.1%) | 73 (86.9%) |
| Total (Category) | 270 (46.7%) | 308 (53.3%) |
| Total (Overall) | 3,189 (55.1%) | 2,603 (44.9%) |
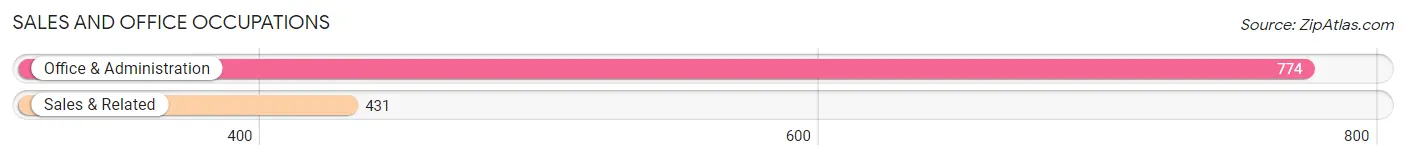
Sales and Office Occupations
The most common Sales and Office occupations in Artesia are Office & Administration (774 | 13.4%), and Sales & Related (431 | 7.4%).
Sales and Office Occupations by Sex
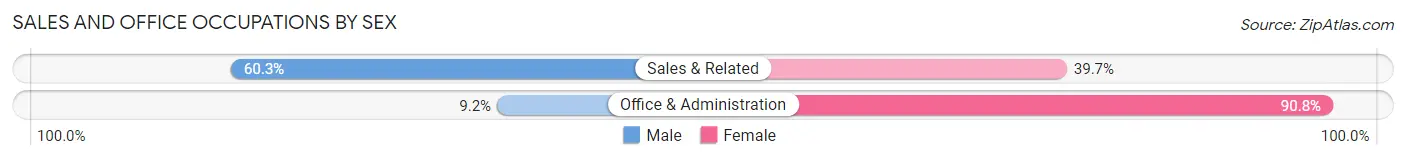
| Occupation | Male | Female |
| Sales & Related | 260 (60.3%) | 171 (39.7%) |
| Office & Administration | 71 (9.2%) | 703 (90.8%) |
| Total (Category) | 331 (27.5%) | 874 (72.5%) |
| Total (Overall) | 3,189 (55.1%) | 2,603 (44.9%) |
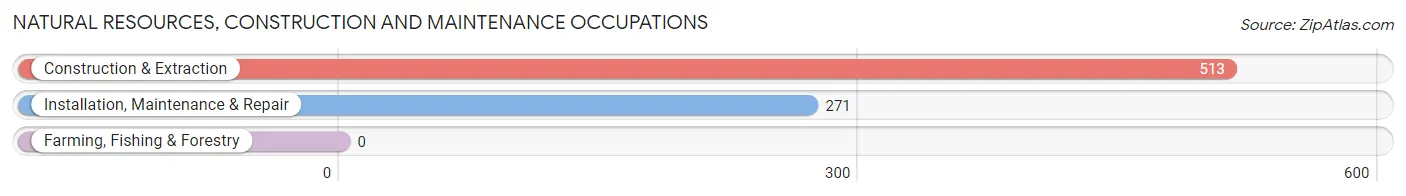
Natural Resources, Construction and Maintenance Occupations
The most common Natural Resources, Construction and Maintenance occupations in Artesia are Construction & Extraction (513 | 8.9%), and Installation, Maintenance & Repair (271 | 4.7%).
Natural Resources, Construction and Maintenance Occupations by Sex
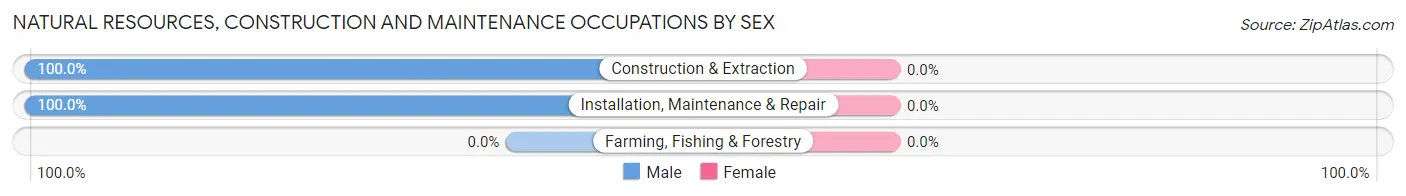
| Occupation | Male | Female |
| Farming, Fishing & Forestry | 0 (0.0%) | 0 (0.0%) |
| Construction & Extraction | 513 (100.0%) | 0 (0.0%) |
| Installation, Maintenance & Repair | 271 (100.0%) | 0 (0.0%) |
| Total (Category) | 784 (100.0%) | 0 (0.0%) |
| Total (Overall) | 3,189 (55.1%) | 2,603 (44.9%) |
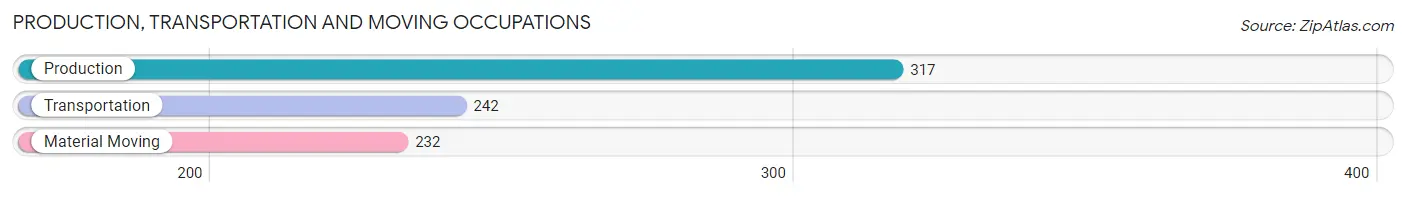
Production, Transportation and Moving Occupations
The most common Production, Transportation and Moving occupations in Artesia are Production (317 | 5.5%), Transportation (242 | 4.2%), and Material Moving (232 | 4.0%).
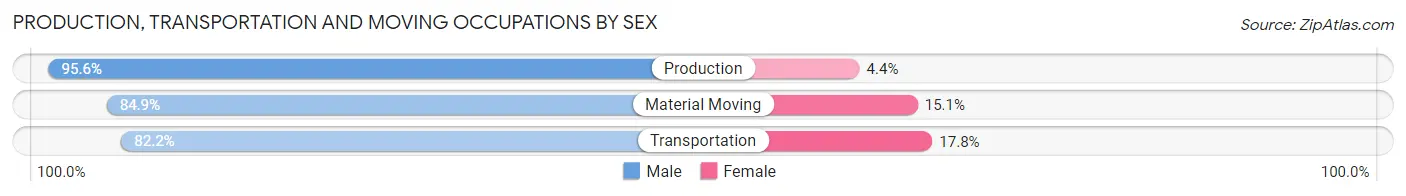
Production, Transportation and Moving Occupations by Sex
| Occupation | Male | Female |
| Production | 303 (95.6%) | 14 (4.4%) |
| Transportation | 199 (82.2%) | 43 (17.8%) |
| Material Moving | 197 (84.9%) | 35 (15.1%) |
| Total (Category) | 699 (88.4%) | 92 (11.6%) |
| Total (Overall) | 3,189 (55.1%) | 2,603 (44.9%) |
Employment Industries by Sex in Artesia
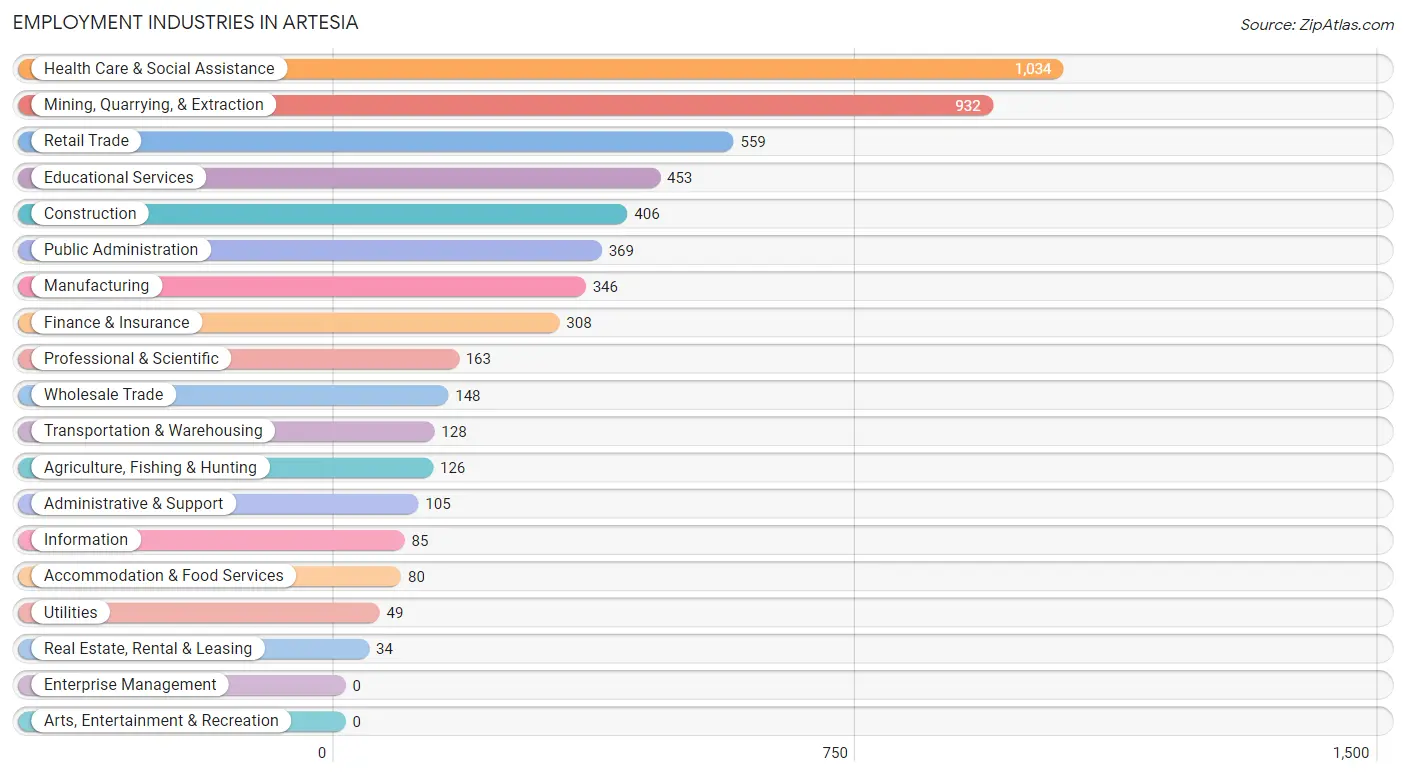
Employment Industries in Artesia
The major employment industries in Artesia include Health Care & Social Assistance (1,034 | 17.8%), Mining, Quarrying, & Extraction (932 | 16.1%), Retail Trade (559 | 9.7%), Educational Services (453 | 7.8%), and Construction (406 | 7.0%).
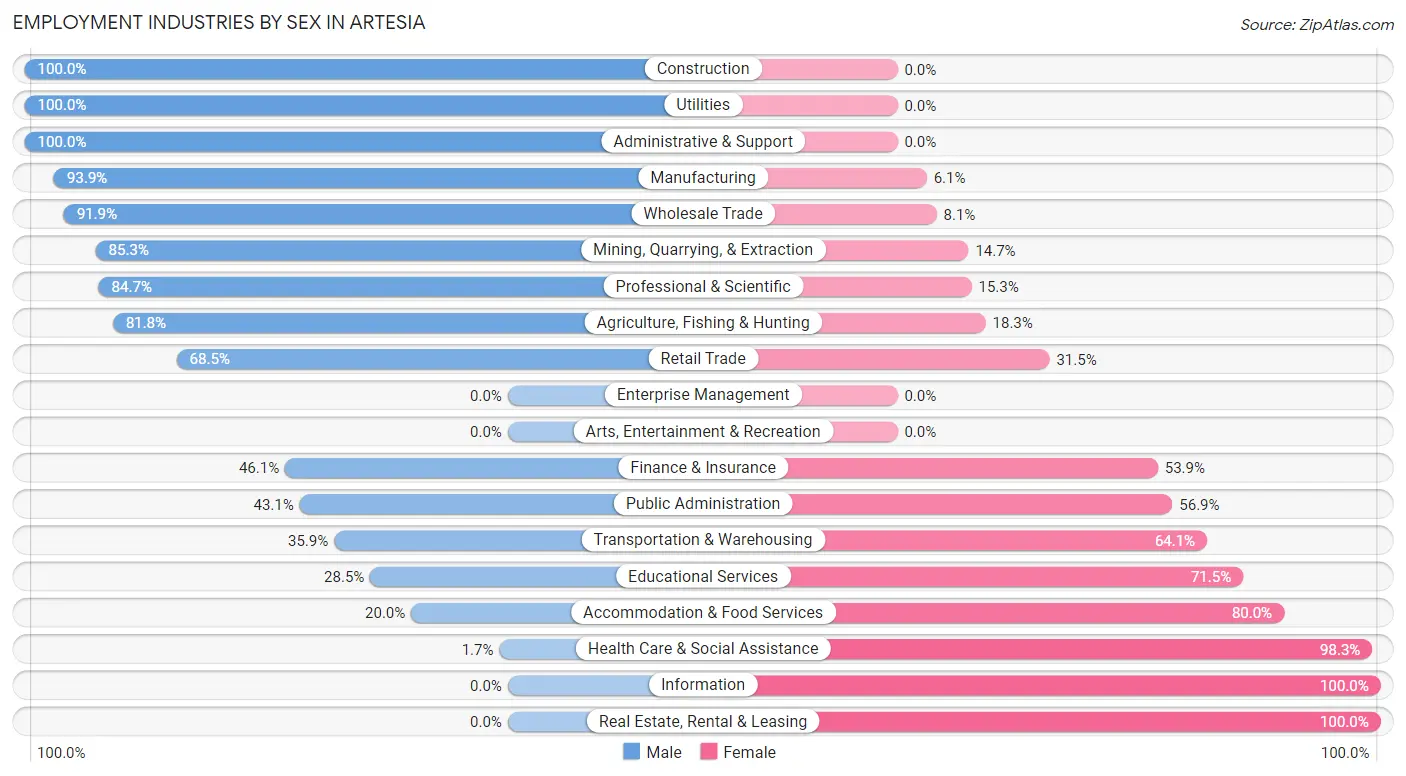
Employment Industries by Sex in Artesia
The Artesia industries that see more men than women are Construction (100.0%), Utilities (100.0%), and Administrative & Support (100.0%), whereas the industries that tend to have a higher number of women are Information (100.0%), Real Estate, Rental & Leasing (100.0%), and Health Care & Social Assistance (98.3%).
| Industry | Male | Female |
| Agriculture, Fishing & Hunting | 103 (81.8%) | 23 (18.2%) |
| Mining, Quarrying, & Extraction | 795 (85.3%) | 137 (14.7%) |
| Construction | 406 (100.0%) | 0 (0.0%) |
| Manufacturing | 325 (93.9%) | 21 (6.1%) |
| Wholesale Trade | 136 (91.9%) | 12 (8.1%) |
| Retail Trade | 383 (68.5%) | 176 (31.5%) |
| Transportation & Warehousing | 46 (35.9%) | 82 (64.1%) |
| Utilities | 49 (100.0%) | 0 (0.0%) |
| Information | 0 (0.0%) | 85 (100.0%) |
| Finance & Insurance | 142 (46.1%) | 166 (53.9%) |
| Real Estate, Rental & Leasing | 0 (0.0%) | 34 (100.0%) |
| Professional & Scientific | 138 (84.7%) | 25 (15.3%) |
| Enterprise Management | 0 (0.0%) | 0 (0.0%) |
| Administrative & Support | 105 (100.0%) | 0 (0.0%) |
| Educational Services | 129 (28.5%) | 324 (71.5%) |
| Health Care & Social Assistance | 18 (1.7%) | 1,016 (98.3%) |
| Arts, Entertainment & Recreation | 0 (0.0%) | 0 (0.0%) |
| Accommodation & Food Services | 16 (20.0%) | 64 (80.0%) |
| Public Administration | 159 (43.1%) | 210 (56.9%) |
| Total | 3,189 (55.1%) | 2,603 (44.9%) |
Education in Artesia
School Enrollment in Artesia
The most common levels of schooling among the 3,497 students in Artesia are middle school (1,135 | 32.5%), elementary school (840 | 24.0%), and college / undergraduate (530 | 15.2%).
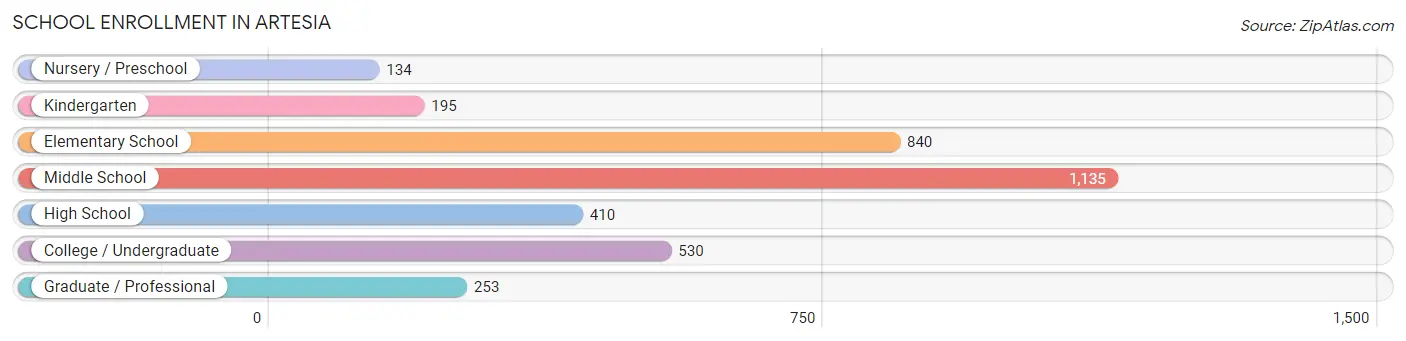
| School Level | # Students | % Students |
| Nursery / Preschool | 134 | 3.8% |
| Kindergarten | 195 | 5.6% |
| Elementary School | 840 | 24.0% |
| Middle School | 1,135 | 32.5% |
| High School | 410 | 11.7% |
| College / Undergraduate | 530 | 15.2% |
| Graduate / Professional | 253 | 7.2% |
| Total | 3,497 | 100.0% |
School Enrollment by Age by Funding Source in Artesia
Out of a total of 3,497 students who are enrolled in schools in Artesia, 273 (7.8%) attend a private institution, while the remaining 3,224 (92.2%) are enrolled in public schools. The age group of 25 to 34 year olds has the highest likelihood of being enrolled in private schools, with 182 (33.6% in the age bracket) enrolled. Conversely, the age group of 3 to 4 year olds has the lowest likelihood of being enrolled in a private school, with 69 (100.0% in the age bracket) attending a public institution.
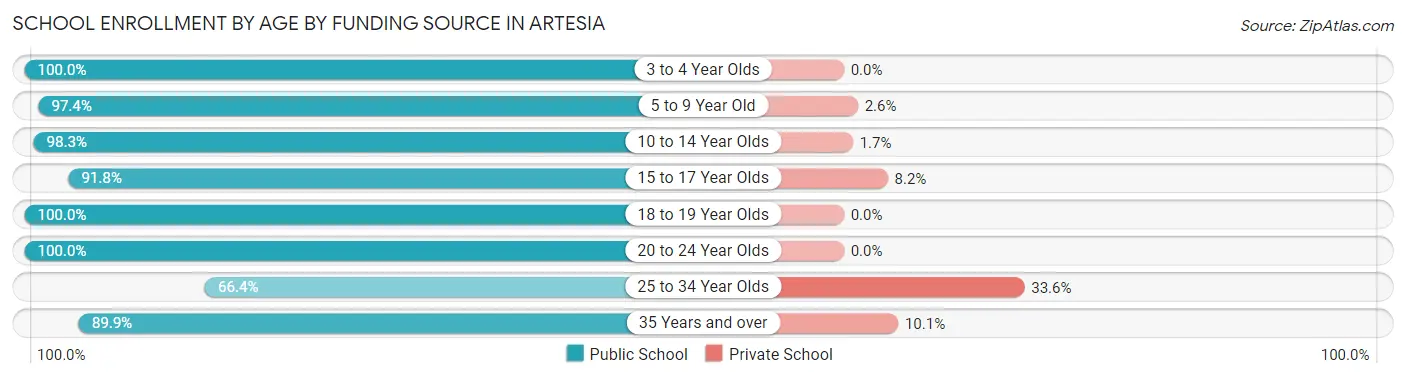
| Age Bracket | Public School | Private School |
| 3 to 4 Year Olds | 69 (100.0%) | 0 (0.0%) |
| 5 to 9 Year Old | 896 (97.4%) | 24 (2.6%) |
| 10 to 14 Year Olds | 1,334 (98.3%) | 23 (1.7%) |
| 15 to 17 Year Olds | 303 (91.8%) | 27 (8.2%) |
| 18 to 19 Year Olds | 85 (100.0%) | 0 (0.0%) |
| 20 to 24 Year Olds | 27 (100.0%) | 0 (0.0%) |
| 25 to 34 Year Olds | 359 (66.4%) | 182 (33.6%) |
| 35 Years and over | 151 (89.9%) | 17 (10.1%) |
| Total | 3,224 (92.2%) | 273 (7.8%) |
Educational Attainment by Field of Study in Artesia
Business (316 | 19.5%), education (283 | 17.5%), bio, nature & agricultural (180 | 11.1%), communications (115 | 7.1%), and science & technology (105 | 6.5%) are the most common fields of study among 1,617 individuals in Artesia who have obtained a bachelor's degree or higher.
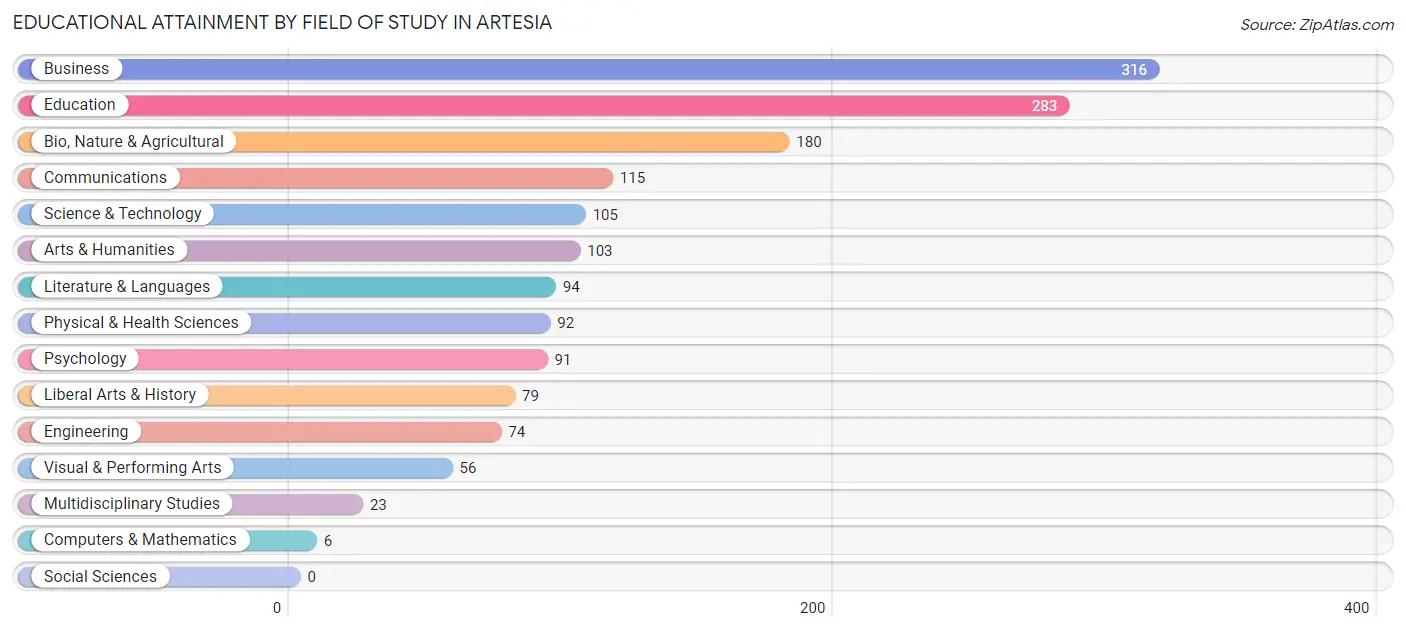
| Field of Study | # Graduates | % Graduates |
| Computers & Mathematics | 6 | 0.4% |
| Bio, Nature & Agricultural | 180 | 11.1% |
| Physical & Health Sciences | 92 | 5.7% |
| Psychology | 91 | 5.6% |
| Social Sciences | 0 | 0.0% |
| Engineering | 74 | 4.6% |
| Multidisciplinary Studies | 23 | 1.4% |
| Science & Technology | 105 | 6.5% |
| Business | 316 | 19.5% |
| Education | 283 | 17.5% |
| Literature & Languages | 94 | 5.8% |
| Liberal Arts & History | 79 | 4.9% |
| Visual & Performing Arts | 56 | 3.5% |
| Communications | 115 | 7.1% |
| Arts & Humanities | 103 | 6.4% |
| Total | 1,617 | 100.0% |
Transportation & Commute in Artesia
Vehicle Availability by Sex in Artesia
The most prevalent vehicle ownership categories in Artesia are males with 2 vehicles (1,348, accounting for 42.6%) and females with 2 vehicles (872, making up 51.8%).
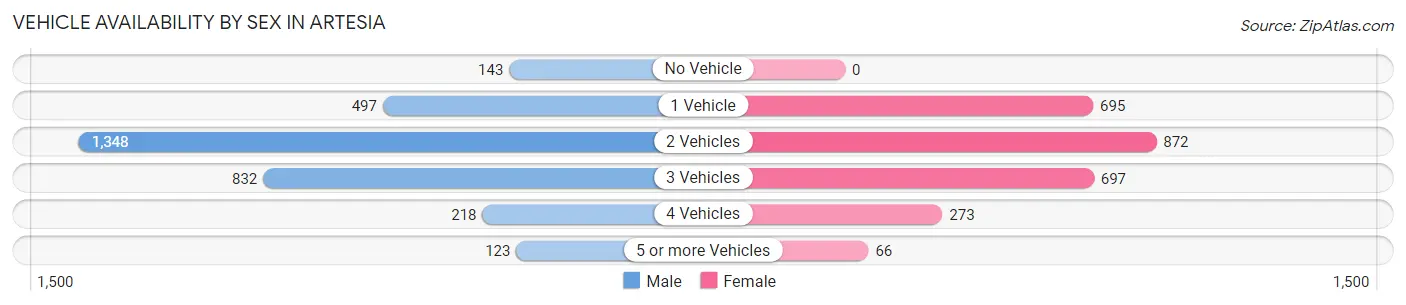
| Vehicles Available | Male | Female |
| No Vehicle | 143 (4.5%) | 0 (0.0%) |
| 1 Vehicle | 497 (15.7%) | 695 (26.7%) |
| 2 Vehicles | 1,348 (42.6%) | 872 (33.5%) |
| 3 Vehicles | 832 (26.3%) | 697 (26.8%) |
| 4 Vehicles | 218 (6.9%) | 273 (10.5%) |
| 5 or more Vehicles | 123 (3.9%) | 66 (2.5%) |
| Total | 3,161 (100.0%) | 2,603 (100.0%) |
Commute Time in Artesia
The most frequently occuring commute durations in Artesia are 10 to 14 minutes (2,045 commuters, 38.6%), 5 to 9 minutes (1,696 commuters, 32.0%), and less than 5 minutes (337 commuters, 6.4%).
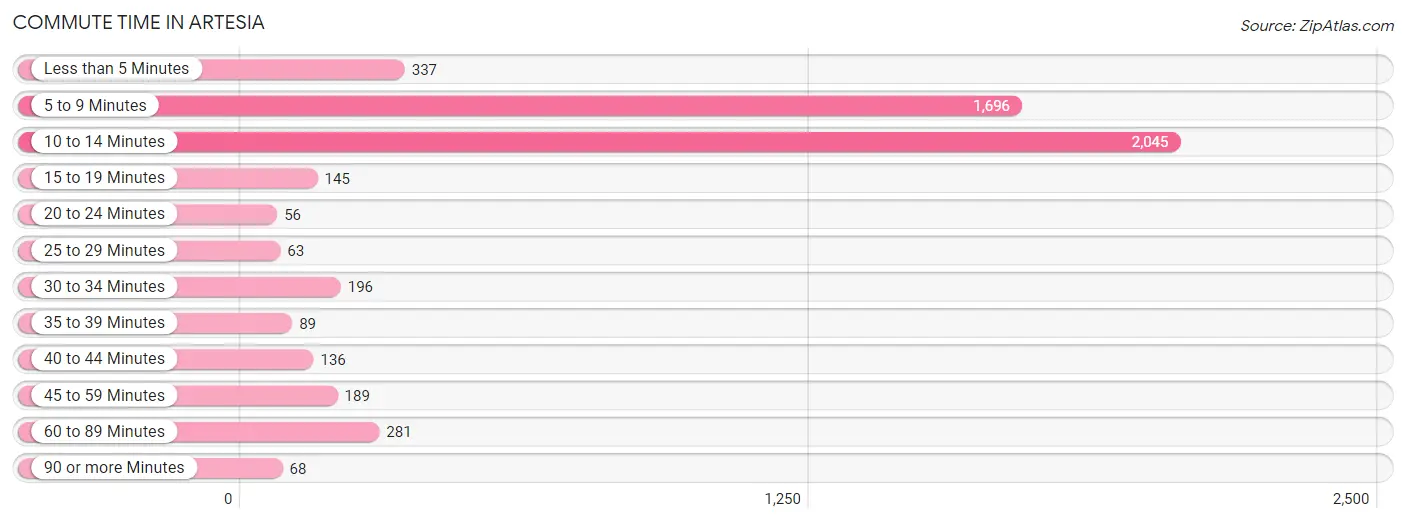
| Commute Time | # Commuters | % Commuters |
| Less than 5 Minutes | 337 | 6.4% |
| 5 to 9 Minutes | 1,696 | 32.0% |
| 10 to 14 Minutes | 2,045 | 38.6% |
| 15 to 19 Minutes | 145 | 2.7% |
| 20 to 24 Minutes | 56 | 1.1% |
| 25 to 29 Minutes | 63 | 1.2% |
| 30 to 34 Minutes | 196 | 3.7% |
| 35 to 39 Minutes | 89 | 1.7% |
| 40 to 44 Minutes | 136 | 2.6% |
| 45 to 59 Minutes | 189 | 3.6% |
| 60 to 89 Minutes | 281 | 5.3% |
| 90 or more Minutes | 68 | 1.3% |
Commute Time by Sex in Artesia
The most common commute times in Artesia are 10 to 14 minutes (1,150 commuters, 37.8%) for males and 10 to 14 minutes (895 commuters, 39.6%) for females.
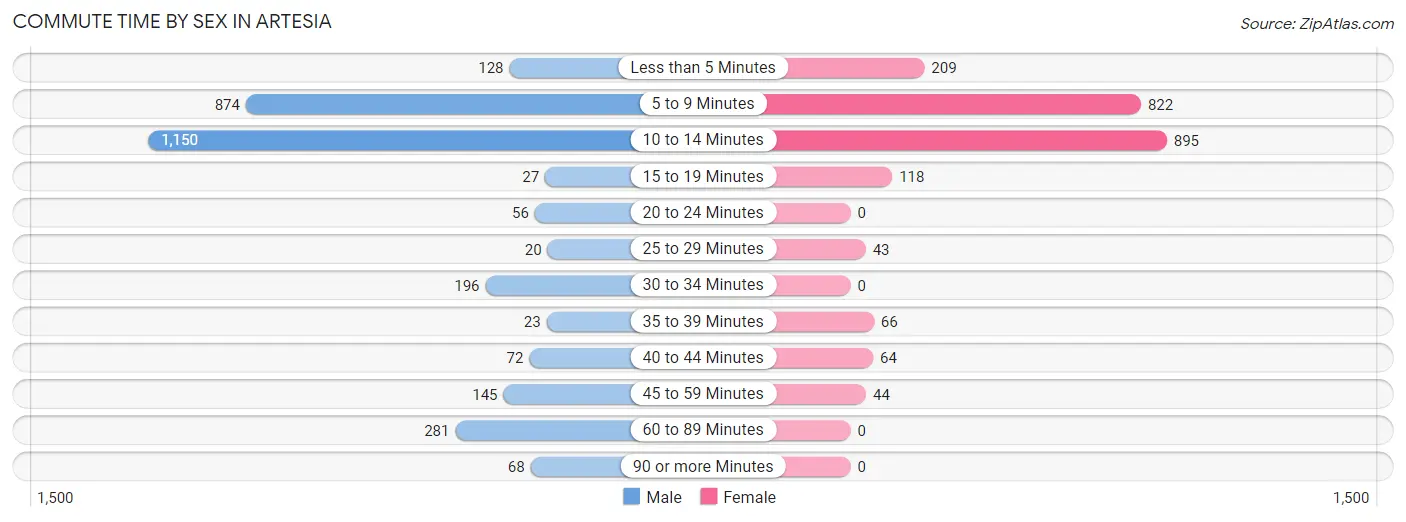
| Commute Time | Male | Female |
| Less than 5 Minutes | 128 (4.2%) | 209 (9.2%) |
| 5 to 9 Minutes | 874 (28.7%) | 822 (36.4%) |
| 10 to 14 Minutes | 1,150 (37.8%) | 895 (39.6%) |
| 15 to 19 Minutes | 27 (0.9%) | 118 (5.2%) |
| 20 to 24 Minutes | 56 (1.8%) | 0 (0.0%) |
| 25 to 29 Minutes | 20 (0.7%) | 43 (1.9%) |
| 30 to 34 Minutes | 196 (6.5%) | 0 (0.0%) |
| 35 to 39 Minutes | 23 (0.8%) | 66 (2.9%) |
| 40 to 44 Minutes | 72 (2.4%) | 64 (2.8%) |
| 45 to 59 Minutes | 145 (4.8%) | 44 (1.9%) |
| 60 to 89 Minutes | 281 (9.2%) | 0 (0.0%) |
| 90 or more Minutes | 68 (2.2%) | 0 (0.0%) |
Time of Departure to Work by Sex in Artesia
The most frequent times of departure to work in Artesia are 7:00 AM to 7:29 AM (535, 17.6%) for males and 7:00 AM to 7:29 AM (692, 30.6%) for females.
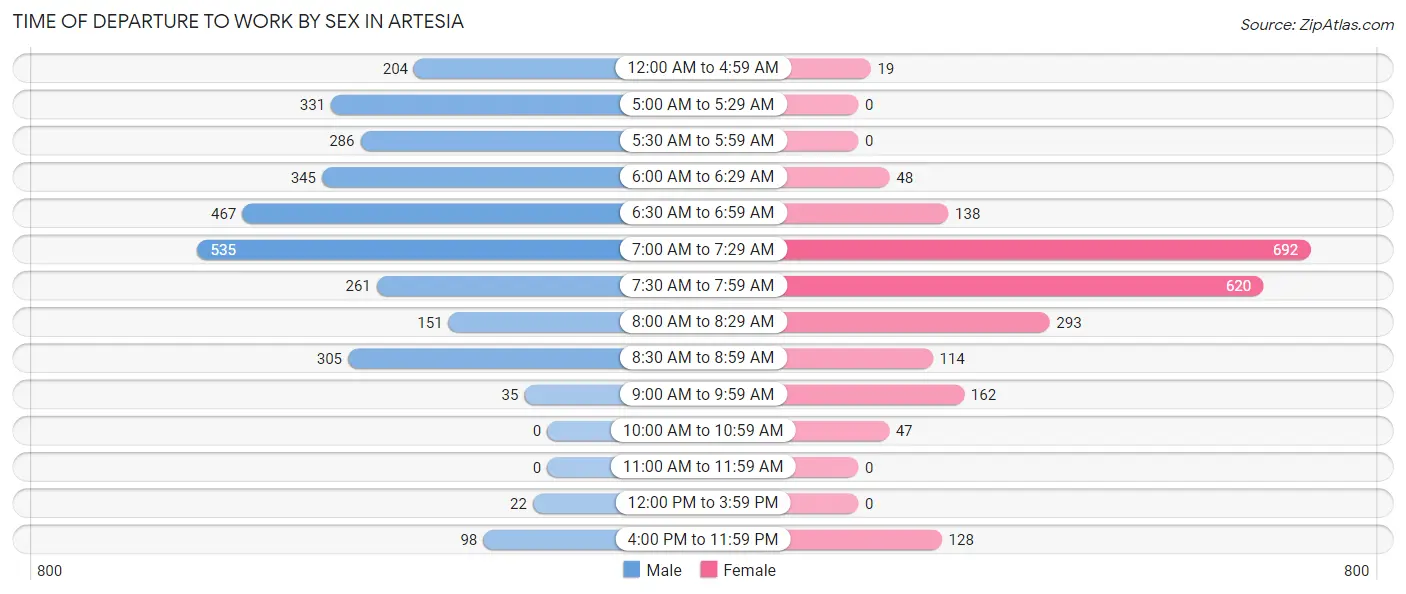
| Time of Departure | Male | Female |
| 12:00 AM to 4:59 AM | 204 (6.7%) | 19 (0.8%) |
| 5:00 AM to 5:29 AM | 331 (10.9%) | 0 (0.0%) |
| 5:30 AM to 5:59 AM | 286 (9.4%) | 0 (0.0%) |
| 6:00 AM to 6:29 AM | 345 (11.4%) | 48 (2.1%) |
| 6:30 AM to 6:59 AM | 467 (15.4%) | 138 (6.1%) |
| 7:00 AM to 7:29 AM | 535 (17.6%) | 692 (30.6%) |
| 7:30 AM to 7:59 AM | 261 (8.6%) | 620 (27.4%) |
| 8:00 AM to 8:29 AM | 151 (5.0%) | 293 (13.0%) |
| 8:30 AM to 8:59 AM | 305 (10.0%) | 114 (5.0%) |
| 9:00 AM to 9:59 AM | 35 (1.1%) | 162 (7.2%) |
| 10:00 AM to 10:59 AM | 0 (0.0%) | 47 (2.1%) |
| 11:00 AM to 11:59 AM | 0 (0.0%) | 0 (0.0%) |
| 12:00 PM to 3:59 PM | 22 (0.7%) | 0 (0.0%) |
| 4:00 PM to 11:59 PM | 98 (3.2%) | 128 (5.7%) |
| Total | 3,040 (100.0%) | 2,261 (100.0%) |
Housing Occupancy in Artesia
Occupancy by Ownership in Artesia
Of the total 4,811 dwellings in Artesia, owner-occupied units account for 3,075 (63.9%), while renter-occupied units make up 1,736 (36.1%).
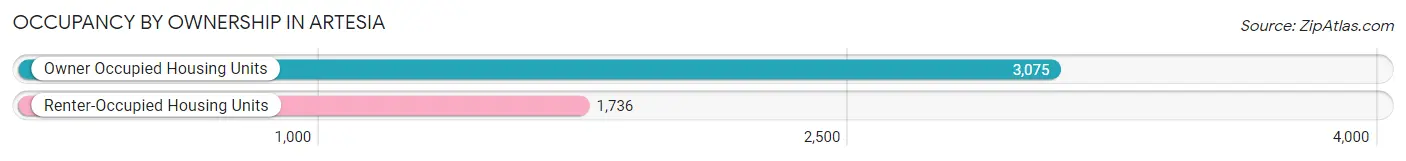
| Occupancy | # Housing Units | % Housing Units |
| Owner Occupied Housing Units | 3,075 | 63.9% |
| Renter-Occupied Housing Units | 1,736 | 36.1% |
| Total Occupied Housing Units | 4,811 | 100.0% |
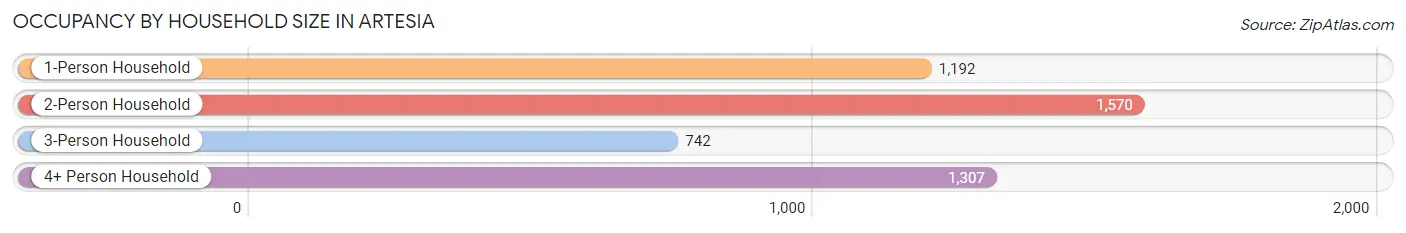
Occupancy by Household Size in Artesia
| Household Size | # Housing Units | % Housing Units |
| 1-Person Household | 1,192 | 24.8% |
| 2-Person Household | 1,570 | 32.6% |
| 3-Person Household | 742 | 15.4% |
| 4+ Person Household | 1,307 | 27.2% |
| Total Housing Units | 4,811 | 100.0% |
Occupancy by Ownership by Household Size in Artesia
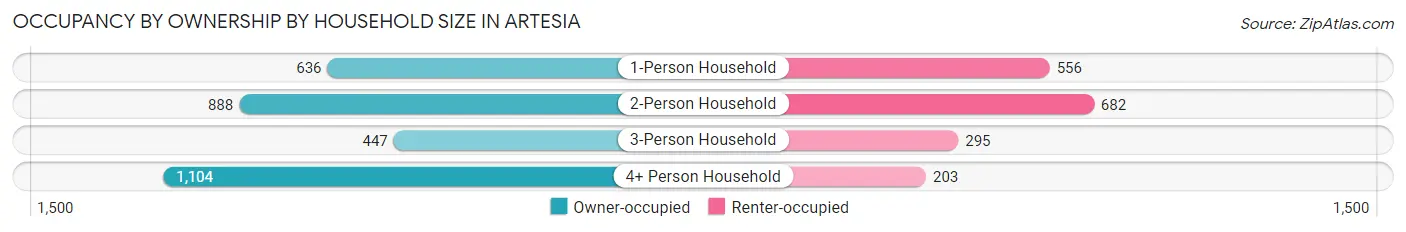
| Household Size | Owner-occupied | Renter-occupied |
| 1-Person Household | 636 (53.4%) | 556 (46.6%) |
| 2-Person Household | 888 (56.6%) | 682 (43.4%) |
| 3-Person Household | 447 (60.2%) | 295 (39.8%) |
| 4+ Person Household | 1,104 (84.5%) | 203 (15.5%) |
| Total Housing Units | 3,075 (63.9%) | 1,736 (36.1%) |
Occupancy by Educational Attainment in Artesia
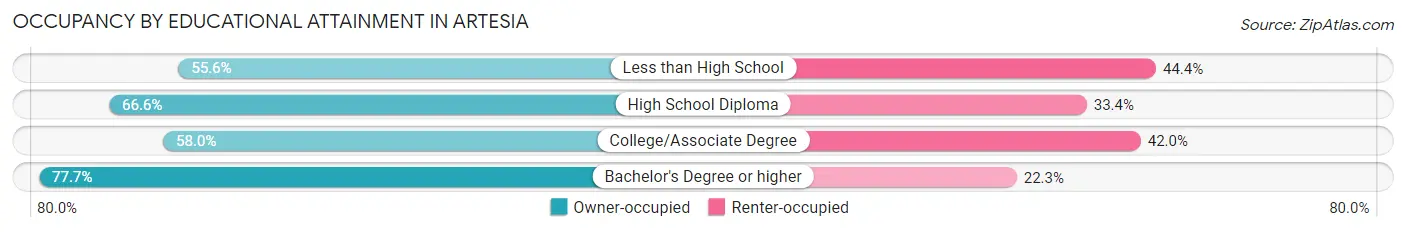
| Household Size | Owner-occupied | Renter-occupied |
| Less than High School | 367 (55.6%) | 293 (44.4%) |
| High School Diploma | 847 (66.6%) | 425 (33.4%) |
| College/Associate Degree | 1,109 (58.0%) | 802 (42.0%) |
| Bachelor's Degree or higher | 752 (77.7%) | 216 (22.3%) |
Occupancy by Age of Householder in Artesia
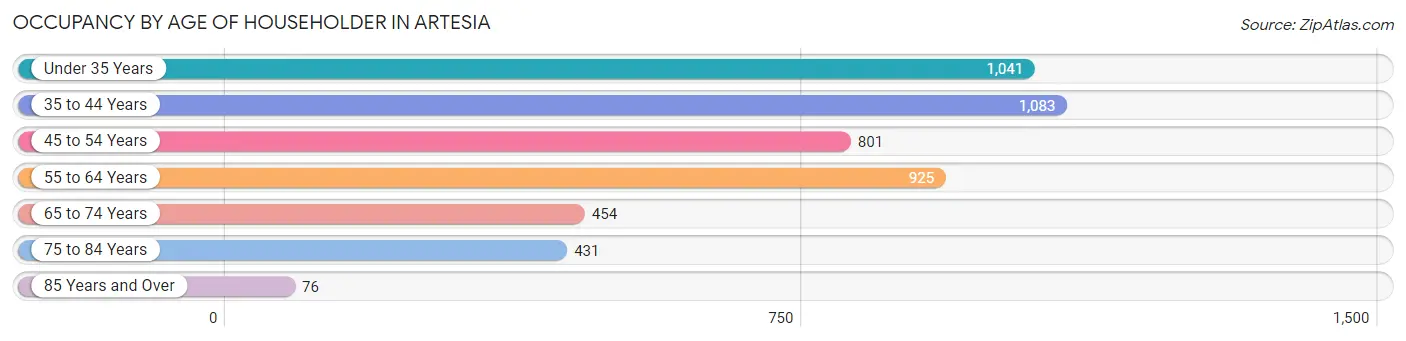
| Age Bracket | # Households | % Households |
| Under 35 Years | 1,041 | 21.6% |
| 35 to 44 Years | 1,083 | 22.5% |
| 45 to 54 Years | 801 | 16.7% |
| 55 to 64 Years | 925 | 19.2% |
| 65 to 74 Years | 454 | 9.4% |
| 75 to 84 Years | 431 | 9.0% |
| 85 Years and Over | 76 | 1.6% |
| Total | 4,811 | 100.0% |
Housing Finances in Artesia
Median Income by Occupancy in Artesia
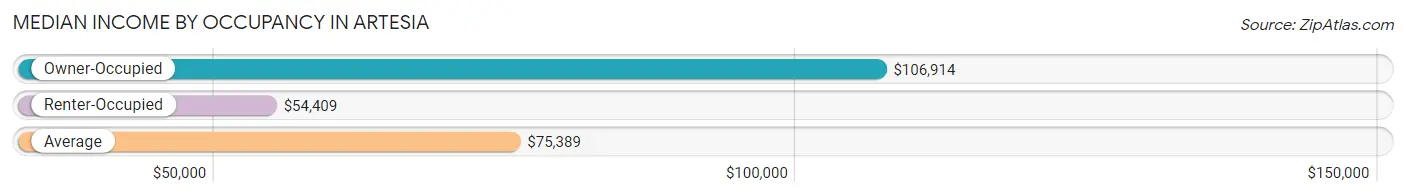
| Occupancy Type | # Households | Median Income |
| Owner-Occupied | 3,075 (63.9%) | $106,914 |
| Renter-Occupied | 1,736 (36.1%) | $54,409 |
| Average | 4,811 (100.0%) | $75,389 |
Occupancy by Householder Income Bracket in Artesia
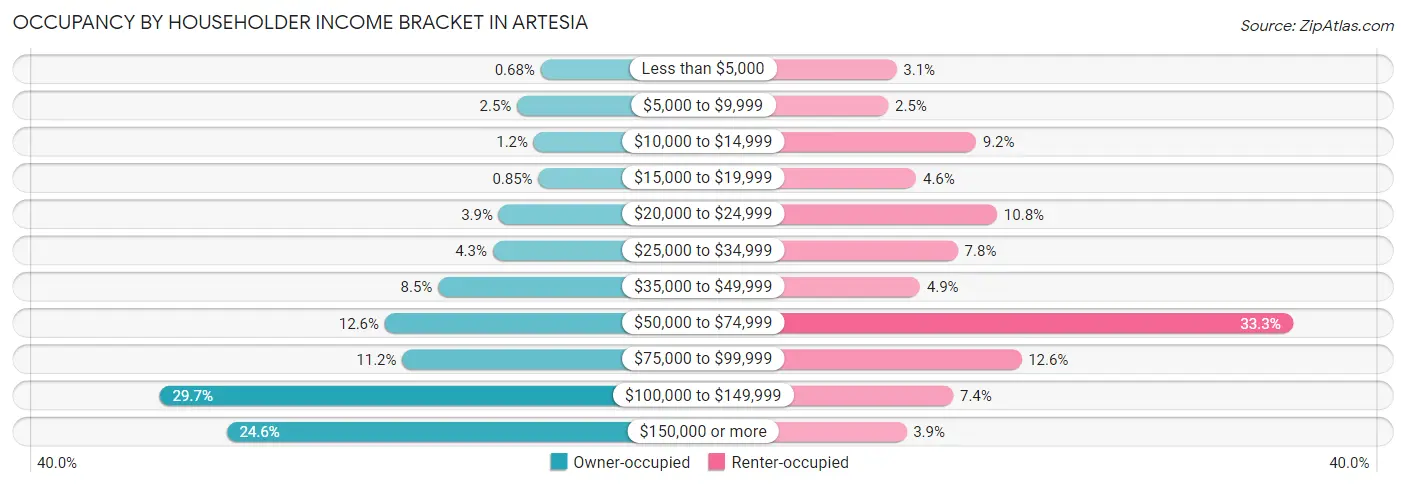
| Income Bracket | Owner-occupied | Renter-occupied |
| Less than $5,000 | 21 (0.7%) | 54 (3.1%) |
| $5,000 to $9,999 | 76 (2.5%) | 43 (2.5%) |
| $10,000 to $14,999 | 37 (1.2%) | 159 (9.2%) |
| $15,000 to $19,999 | 26 (0.9%) | 80 (4.6%) |
| $20,000 to $24,999 | 119 (3.9%) | 187 (10.8%) |
| $25,000 to $34,999 | 133 (4.3%) | 135 (7.8%) |
| $35,000 to $49,999 | 261 (8.5%) | 85 (4.9%) |
| $50,000 to $74,999 | 386 (12.6%) | 578 (33.3%) |
| $75,000 to $99,999 | 345 (11.2%) | 219 (12.6%) |
| $100,000 to $149,999 | 914 (29.7%) | 129 (7.4%) |
| $150,000 or more | 757 (24.6%) | 67 (3.9%) |
| Total | 3,075 (100.0%) | 1,736 (100.0%) |
Monthly Housing Cost Tiers in Artesia
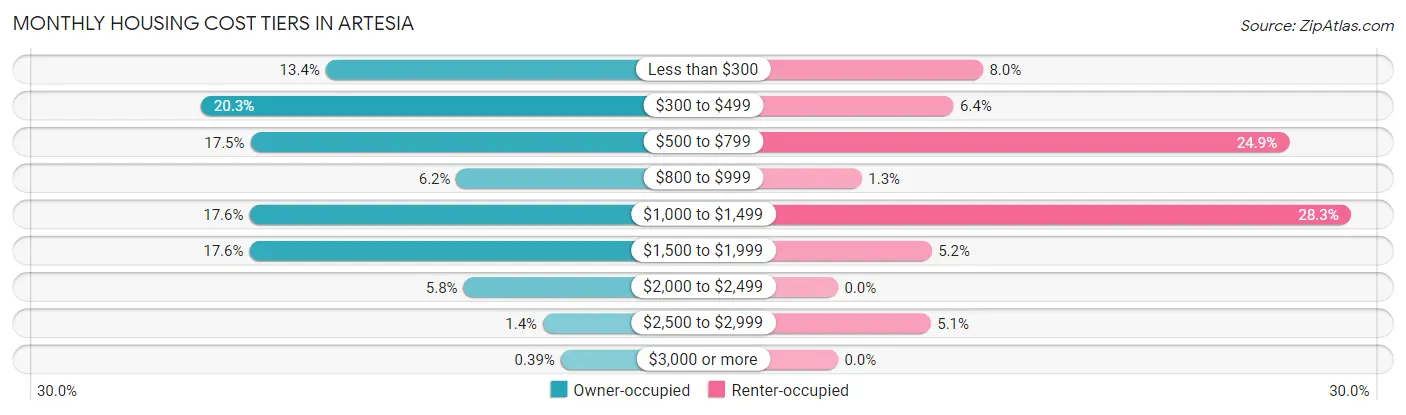
| Monthly Cost | Owner-occupied | Renter-occupied |
| Less than $300 | 411 (13.4%) | 139 (8.0%) |
| $300 to $499 | 623 (20.3%) | 111 (6.4%) |
| $500 to $799 | 539 (17.5%) | 433 (24.9%) |
| $800 to $999 | 189 (6.1%) | 23 (1.3%) |
| $1,000 to $1,499 | 541 (17.6%) | 492 (28.3%) |
| $1,500 to $1,999 | 541 (17.6%) | 90 (5.2%) |
| $2,000 to $2,499 | 177 (5.8%) | 0 (0.0%) |
| $2,500 to $2,999 | 42 (1.4%) | 89 (5.1%) |
| $3,000 or more | 12 (0.4%) | 0 (0.0%) |
| Total | 3,075 (100.0%) | 1,736 (100.0%) |
Physical Housing Characteristics in Artesia
Housing Structures in Artesia
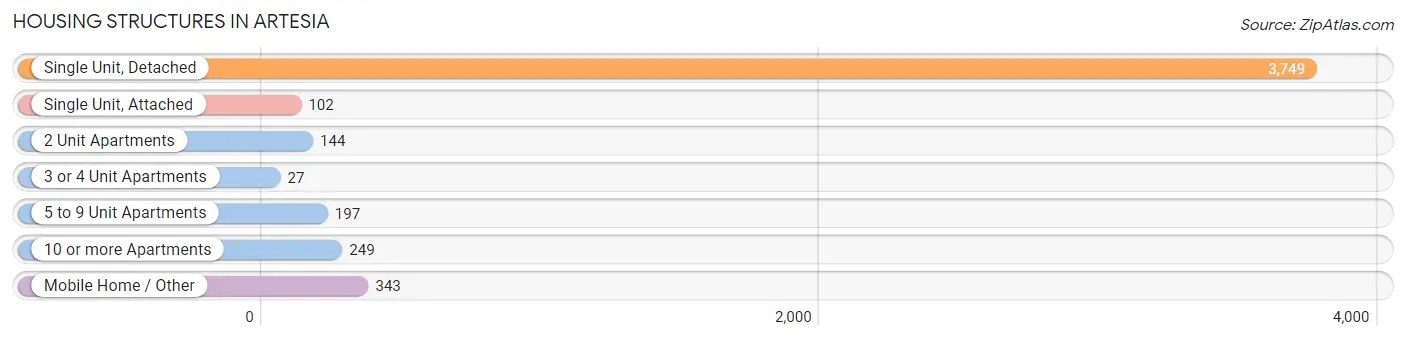
| Structure Type | # Housing Units | % Housing Units |
| Single Unit, Detached | 3,749 | 77.9% |
| Single Unit, Attached | 102 | 2.1% |
| 2 Unit Apartments | 144 | 3.0% |
| 3 or 4 Unit Apartments | 27 | 0.6% |
| 5 to 9 Unit Apartments | 197 | 4.1% |
| 10 or more Apartments | 249 | 5.2% |
| Mobile Home / Other | 343 | 7.1% |
| Total | 4,811 | 100.0% |
Housing Structures by Occupancy in Artesia
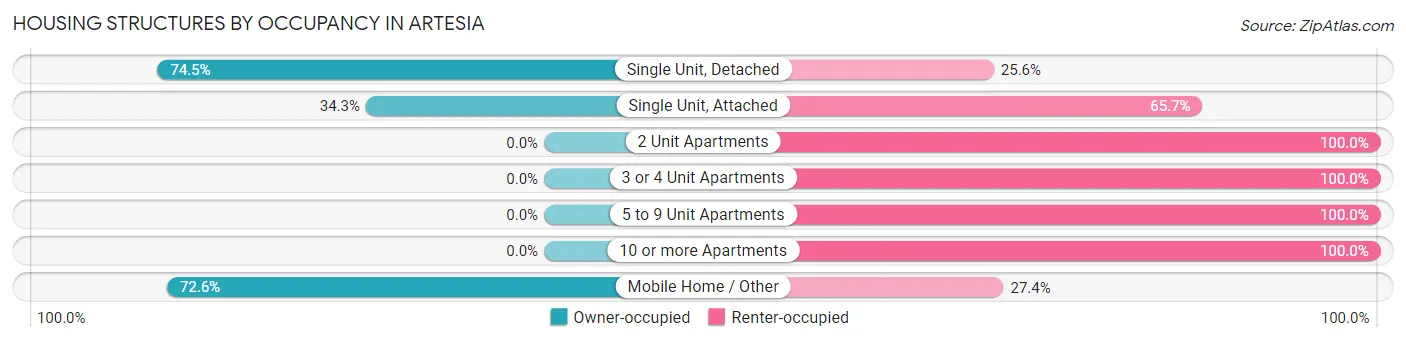
| Structure Type | Owner-occupied | Renter-occupied |
| Single Unit, Detached | 2,791 (74.5%) | 958 (25.6%) |
| Single Unit, Attached | 35 (34.3%) | 67 (65.7%) |
| 2 Unit Apartments | 0 (0.0%) | 144 (100.0%) |
| 3 or 4 Unit Apartments | 0 (0.0%) | 27 (100.0%) |
| 5 to 9 Unit Apartments | 0 (0.0%) | 197 (100.0%) |
| 10 or more Apartments | 0 (0.0%) | 249 (100.0%) |
| Mobile Home / Other | 249 (72.6%) | 94 (27.4%) |
| Total | 3,075 (63.9%) | 1,736 (36.1%) |
Housing Structures by Number of Rooms in Artesia
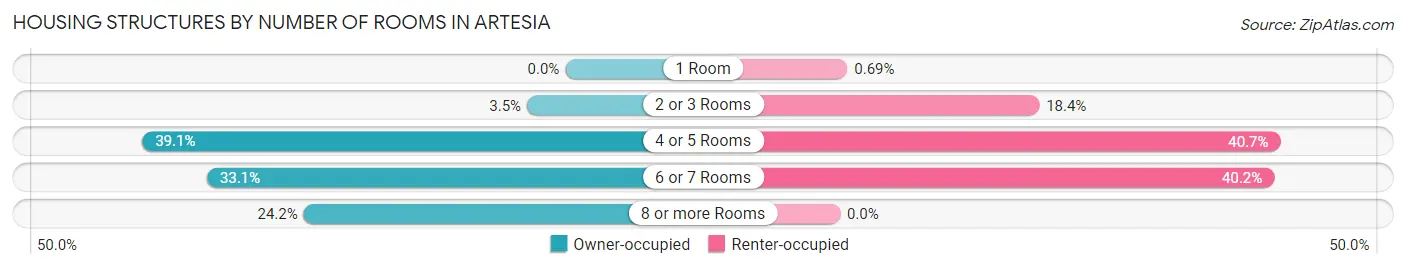
| Number of Rooms | Owner-occupied | Renter-occupied |
| 1 Room | 0 (0.0%) | 12 (0.7%) |
| 2 or 3 Rooms | 109 (3.5%) | 320 (18.4%) |
| 4 or 5 Rooms | 1,203 (39.1%) | 707 (40.7%) |
| 6 or 7 Rooms | 1,019 (33.1%) | 697 (40.2%) |
| 8 or more Rooms | 744 (24.2%) | 0 (0.0%) |
| Total | 3,075 (100.0%) | 1,736 (100.0%) |
Housing Structure by Heating Type in Artesia
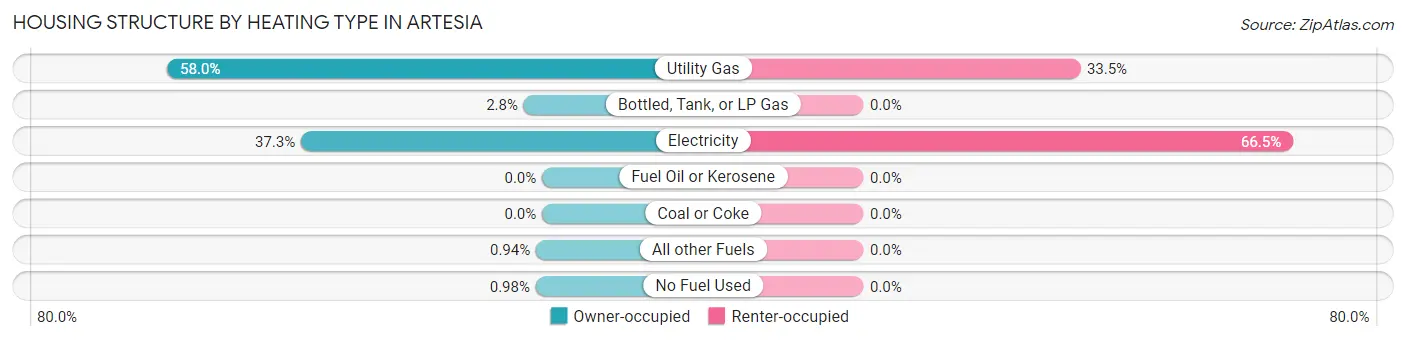
| Heating Type | Owner-occupied | Renter-occupied |
| Utility Gas | 1,783 (58.0%) | 582 (33.5%) |
| Bottled, Tank, or LP Gas | 87 (2.8%) | 0 (0.0%) |
| Electricity | 1,146 (37.3%) | 1,154 (66.5%) |
| Fuel Oil or Kerosene | 0 (0.0%) | 0 (0.0%) |
| Coal or Coke | 0 (0.0%) | 0 (0.0%) |
| All other Fuels | 29 (0.9%) | 0 (0.0%) |
| No Fuel Used | 30 (1.0%) | 0 (0.0%) |
| Total | 3,075 (100.0%) | 1,736 (100.0%) |
Household Vehicle Usage in Artesia
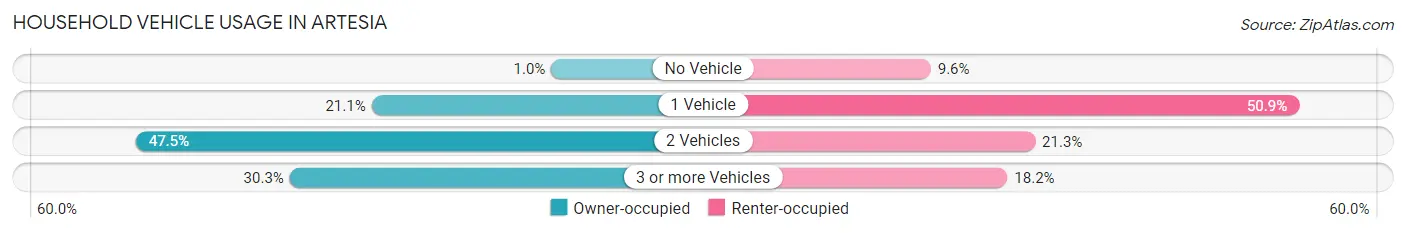
| Vehicles per Household | Owner-occupied | Renter-occupied |
| No Vehicle | 31 (1.0%) | 167 (9.6%) |
| 1 Vehicle | 650 (21.1%) | 883 (50.9%) |
| 2 Vehicles | 1,462 (47.5%) | 370 (21.3%) |
| 3 or more Vehicles | 932 (30.3%) | 316 (18.2%) |
| Total | 3,075 (100.0%) | 1,736 (100.0%) |
Real Estate & Mortgages in Artesia
Real Estate and Mortgage Overview in Artesia
| Characteristic | Without Mortgage | With Mortgage |
| Housing Units | 1,394 | 1,681 |
| Median Property Value | $191,000 | $235,900 |
| Median Household Income | $106,250 | $471 |
| Monthly Housing Costs | $392 | $12 |
| Real Estate Taxes | $883 | $41 |
Property Value by Mortgage Status in Artesia
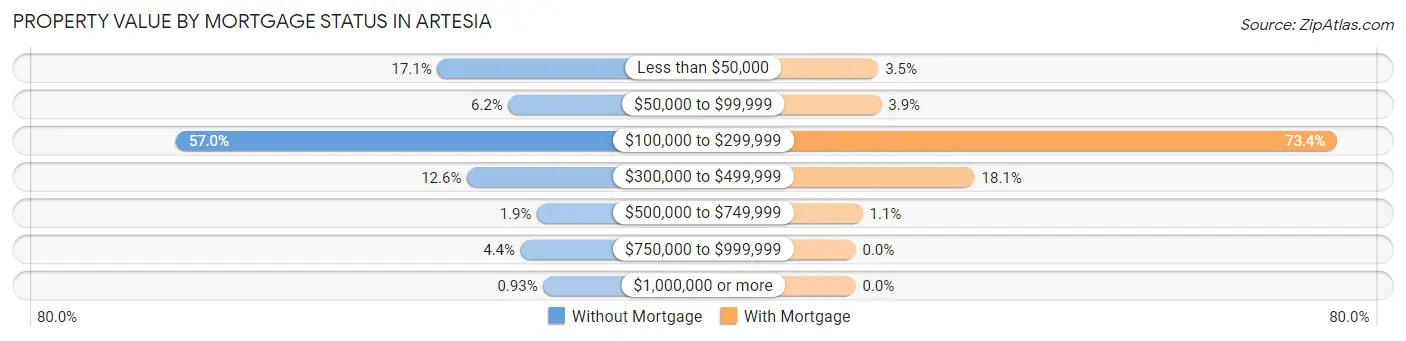
| Property Value | Without Mortgage | With Mortgage |
| Less than $50,000 | 238 (17.1%) | 58 (3.5%) |
| $50,000 to $99,999 | 87 (6.2%) | 66 (3.9%) |
| $100,000 to $299,999 | 794 (57.0%) | 1,234 (73.4%) |
| $300,000 to $499,999 | 175 (12.6%) | 305 (18.1%) |
| $500,000 to $749,999 | 26 (1.9%) | 18 (1.1%) |
| $750,000 to $999,999 | 61 (4.4%) | 0 (0.0%) |
| $1,000,000 or more | 13 (0.9%) | 0 (0.0%) |
| Total | 1,394 (100.0%) | 1,681 (100.0%) |
Household Income by Mortgage Status in Artesia
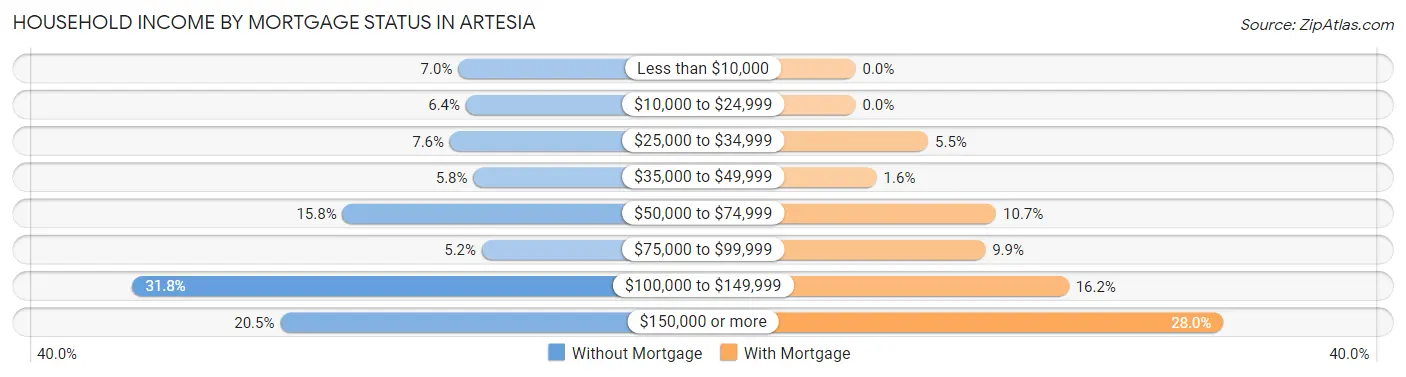
| Household Income | Without Mortgage | With Mortgage |
| Less than $10,000 | 97 (7.0%) | 0 (0.0%) |
| $10,000 to $24,999 | 89 (6.4%) | 0 (0.0%) |
| $25,000 to $34,999 | 106 (7.6%) | 93 (5.5%) |
| $35,000 to $49,999 | 81 (5.8%) | 27 (1.6%) |
| $50,000 to $74,999 | 220 (15.8%) | 180 (10.7%) |
| $75,000 to $99,999 | 72 (5.2%) | 166 (9.9%) |
| $100,000 to $149,999 | 443 (31.8%) | 273 (16.2%) |
| $150,000 or more | 286 (20.5%) | 471 (28.0%) |
| Total | 1,394 (100.0%) | 1,681 (100.0%) |
Property Value to Household Income Ratio in Artesia
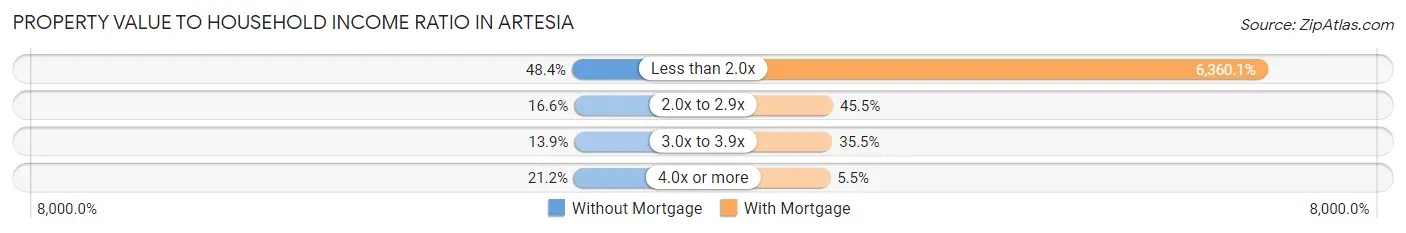
| Value-to-Income Ratio | Without Mortgage | With Mortgage |
| Less than 2.0x | 674 (48.3%) | 106,914 (6,360.1%) |
| 2.0x to 2.9x | 232 (16.6%) | 764 (45.5%) |
| 3.0x to 3.9x | 193 (13.9%) | 596 (35.5%) |
| 4.0x or more | 295 (21.2%) | 93 (5.5%) |
| Total | 1,394 (100.0%) | 1,681 (100.0%) |
Real Estate Taxes by Mortgage Status in Artesia
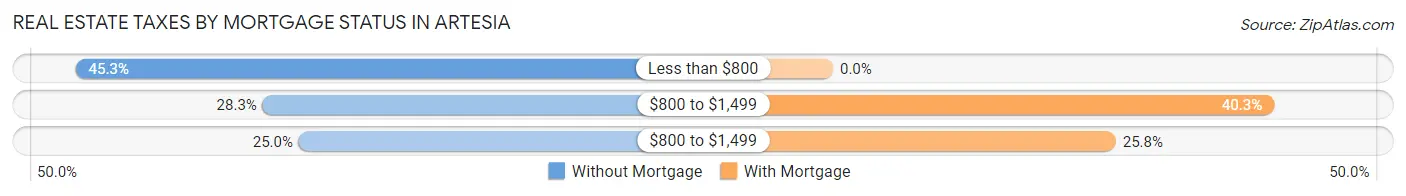
| Property Taxes | Without Mortgage | With Mortgage |
| Less than $800 | 632 (45.3%) | 0 (0.0%) |
| $800 to $1,499 | 394 (28.3%) | 677 (40.3%) |
| $800 to $1,499 | 348 (25.0%) | 434 (25.8%) |
| Total | 1,394 (100.0%) | 1,681 (100.0%) |
Health & Disability in Artesia
Health Insurance Coverage by Age in Artesia
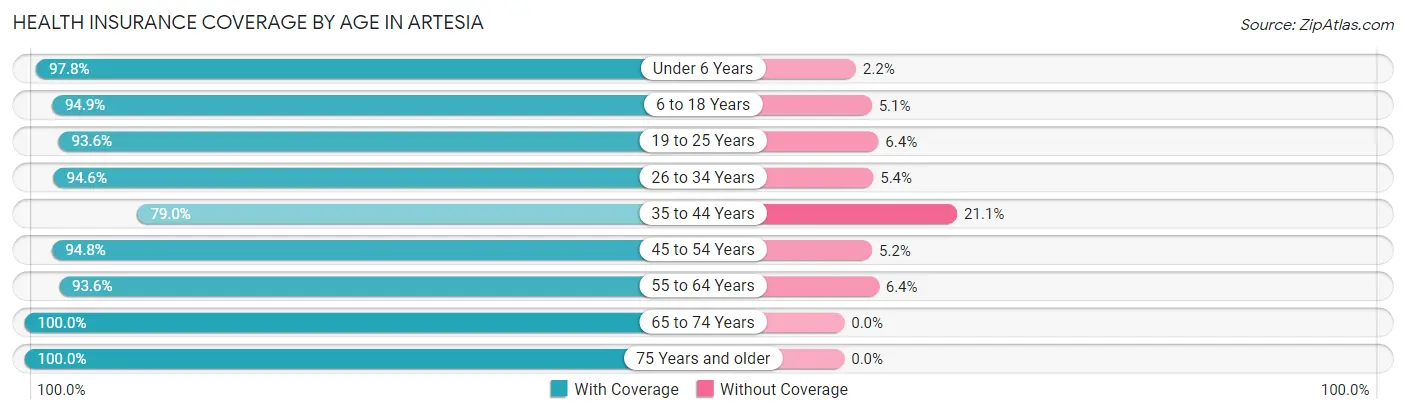
| Age Bracket | With Coverage | Without Coverage |
| Under 6 Years | 1,271 (97.8%) | 28 (2.2%) |
| 6 to 18 Years | 2,323 (94.9%) | 125 (5.1%) |
| 19 to 25 Years | 1,016 (93.6%) | 69 (6.4%) |
| 26 to 34 Years | 1,610 (94.6%) | 92 (5.4%) |
| 35 to 44 Years | 1,504 (78.9%) | 401 (21.0%) |
| 45 to 54 Years | 1,353 (94.8%) | 74 (5.2%) |
| 55 to 64 Years | 1,382 (93.6%) | 95 (6.4%) |
| 65 to 74 Years | 656 (100.0%) | 0 (0.0%) |
| 75 Years and older | 578 (100.0%) | 0 (0.0%) |
| Total | 11,693 (93.0%) | 884 (7.0%) |
Health Insurance Coverage by Citizenship Status in Artesia
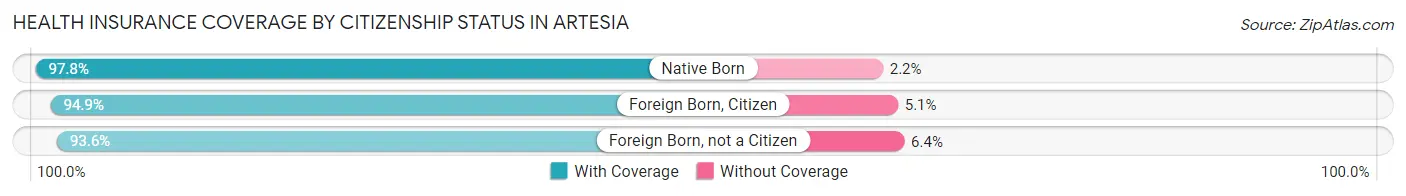
| Citizenship Status | With Coverage | Without Coverage |
| Native Born | 1,271 (97.8%) | 28 (2.2%) |
| Foreign Born, Citizen | 2,323 (94.9%) | 125 (5.1%) |
| Foreign Born, not a Citizen | 1,016 (93.6%) | 69 (6.4%) |
Health Insurance Coverage by Household Income in Artesia
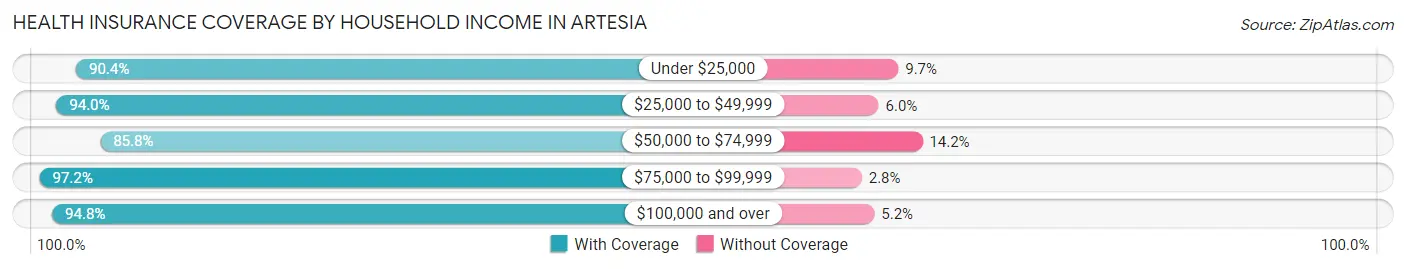
| Household Income | With Coverage | Without Coverage |
| Under $25,000 | 1,451 (90.3%) | 155 (9.7%) |
| $25,000 to $49,999 | 1,262 (94.0%) | 80 (6.0%) |
| $50,000 to $74,999 | 1,890 (85.8%) | 312 (14.2%) |
| $75,000 to $99,999 | 1,940 (97.2%) | 56 (2.8%) |
| $100,000 and over | 5,150 (94.8%) | 281 (5.2%) |
Public vs Private Health Insurance Coverage by Age in Artesia
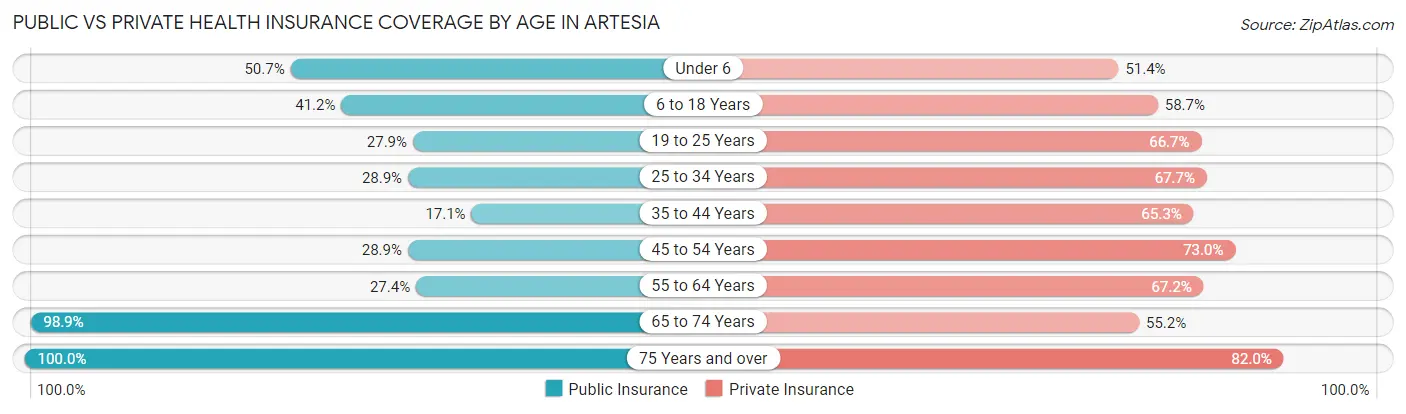
| Age Bracket | Public Insurance | Private Insurance |
| Under 6 | 658 (50.6%) | 667 (51.3%) |
| 6 to 18 Years | 1,009 (41.2%) | 1,436 (58.7%) |
| 19 to 25 Years | 303 (27.9%) | 724 (66.7%) |
| 25 to 34 Years | 491 (28.8%) | 1,153 (67.7%) |
| 35 to 44 Years | 325 (17.1%) | 1,244 (65.3%) |
| 45 to 54 Years | 412 (28.9%) | 1,042 (73.0%) |
| 55 to 64 Years | 404 (27.4%) | 992 (67.2%) |
| 65 to 74 Years | 649 (98.9%) | 362 (55.2%) |
| 75 Years and over | 578 (100.0%) | 474 (82.0%) |
| Total | 4,829 (38.4%) | 8,094 (64.4%) |
Disability Status by Sex by Age in Artesia
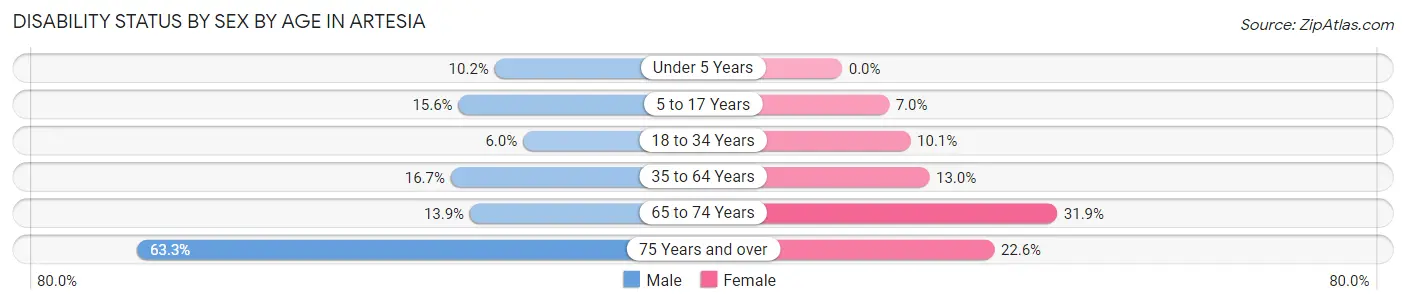
| Age Bracket | Male | Female |
| Under 5 Years | 71 (10.2%) | 0 (0.0%) |
| 5 to 17 Years | 272 (15.6%) | 60 (7.0%) |
| 18 to 34 Years | 71 (6.0%) | 166 (10.1%) |
| 35 to 64 Years | 409 (16.7%) | 306 (13.0%) |
| 65 to 74 Years | 38 (13.9%) | 122 (31.9%) |
| 75 Years and over | 195 (63.3%) | 61 (22.6%) |
Disability Class by Sex by Age in Artesia
Disability Class: Hearing Difficulty
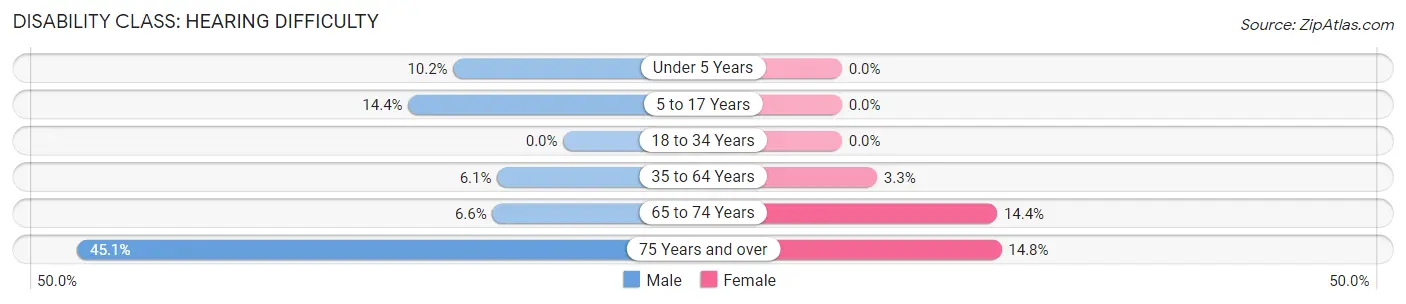
| Age Bracket | Male | Female |
| Under 5 Years | 71 (10.2%) | 0 (0.0%) |
| 5 to 17 Years | 251 (14.4%) | 0 (0.0%) |
| 18 to 34 Years | 0 (0.0%) | 0 (0.0%) |
| 35 to 64 Years | 150 (6.1%) | 77 (3.3%) |
| 65 to 74 Years | 18 (6.6%) | 55 (14.4%) |
| 75 Years and over | 139 (45.1%) | 40 (14.8%) |
Disability Class: Vision Difficulty
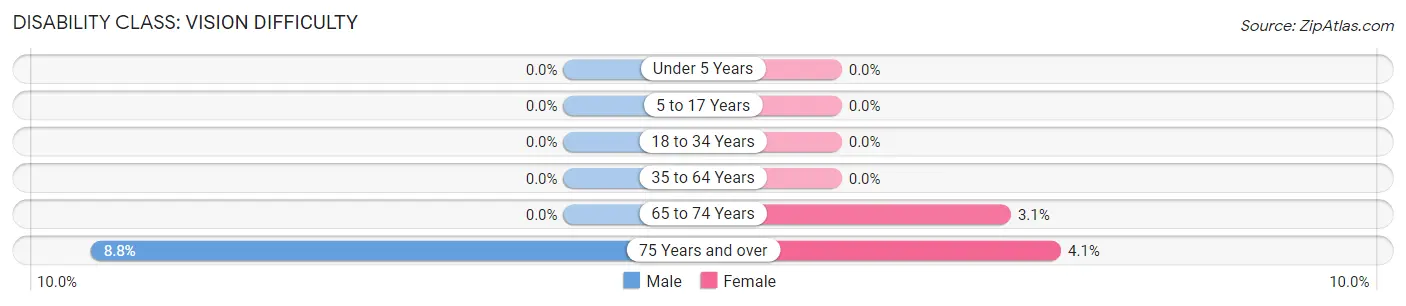
| Age Bracket | Male | Female |
| Under 5 Years | 0 (0.0%) | 0 (0.0%) |
| 5 to 17 Years | 0 (0.0%) | 0 (0.0%) |
| 18 to 34 Years | 0 (0.0%) | 0 (0.0%) |
| 35 to 64 Years | 0 (0.0%) | 0 (0.0%) |
| 65 to 74 Years | 0 (0.0%) | 12 (3.1%) |
| 75 Years and over | 27 (8.8%) | 11 (4.1%) |
Disability Class: Cognitive Difficulty
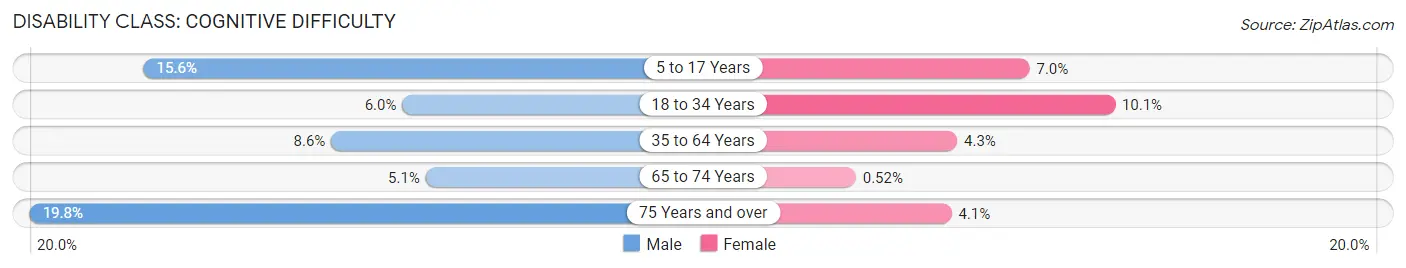
| Age Bracket | Male | Female |
| 5 to 17 Years | 272 (15.6%) | 60 (7.0%) |
| 18 to 34 Years | 71 (6.0%) | 166 (10.1%) |
| 35 to 64 Years | 211 (8.6%) | 101 (4.3%) |
| 65 to 74 Years | 14 (5.1%) | 2 (0.5%) |
| 75 Years and over | 61 (19.8%) | 11 (4.1%) |
Disability Class: Ambulatory Difficulty
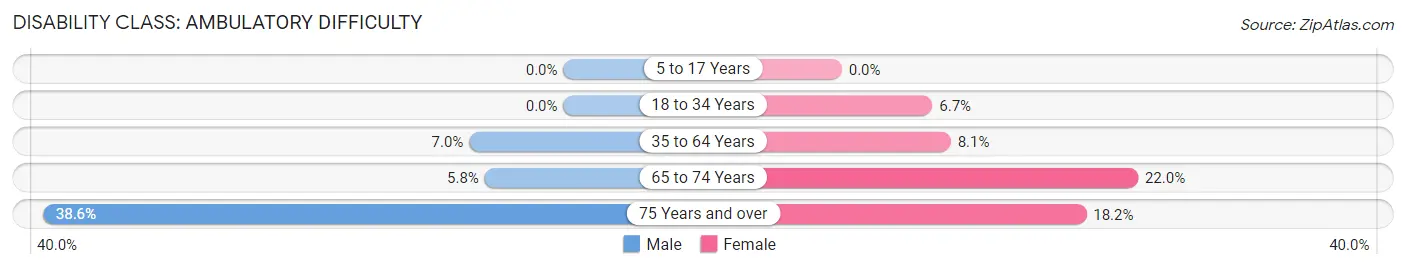
| Age Bracket | Male | Female |
| 5 to 17 Years | 0 (0.0%) | 0 (0.0%) |
| 18 to 34 Years | 0 (0.0%) | 110 (6.7%) |
| 35 to 64 Years | 171 (7.0%) | 191 (8.1%) |
| 65 to 74 Years | 16 (5.8%) | 84 (22.0%) |
| 75 Years and over | 119 (38.6%) | 49 (18.1%) |
Disability Class: Self-Care Difficulty
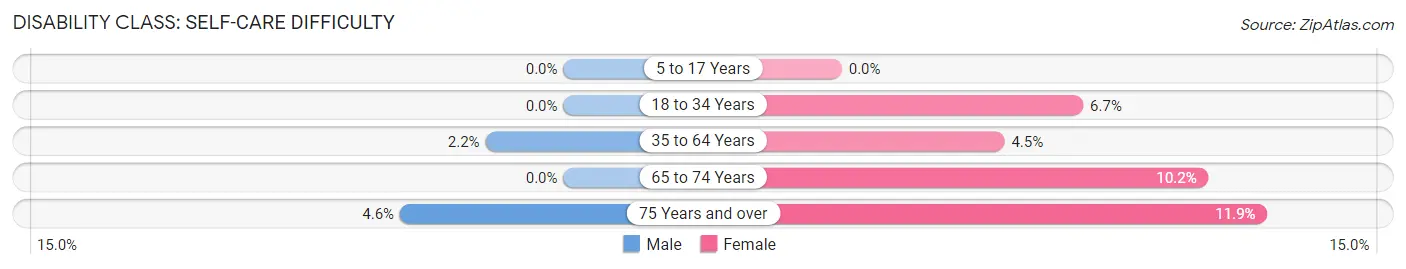
| Age Bracket | Male | Female |
| 5 to 17 Years | 0 (0.0%) | 0 (0.0%) |
| 18 to 34 Years | 0 (0.0%) | 110 (6.7%) |
| 35 to 64 Years | 53 (2.2%) | 107 (4.5%) |
| 65 to 74 Years | 0 (0.0%) | 39 (10.2%) |
| 75 Years and over | 14 (4.5%) | 32 (11.8%) |
Technology Access in Artesia
Computing Device Access in Artesia
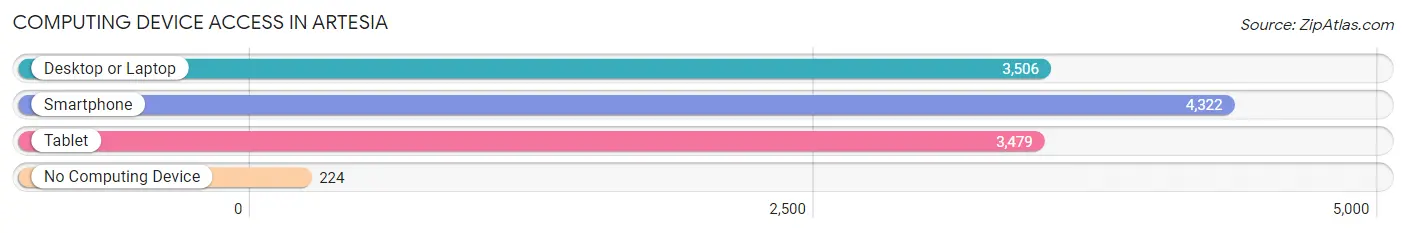
| Device Type | # Households | % Households |
| Desktop or Laptop | 3,506 | 72.9% |
| Smartphone | 4,322 | 89.8% |
| Tablet | 3,479 | 72.3% |
| No Computing Device | 224 | 4.7% |
| Total | 4,811 | 100.0% |
Internet Access in Artesia
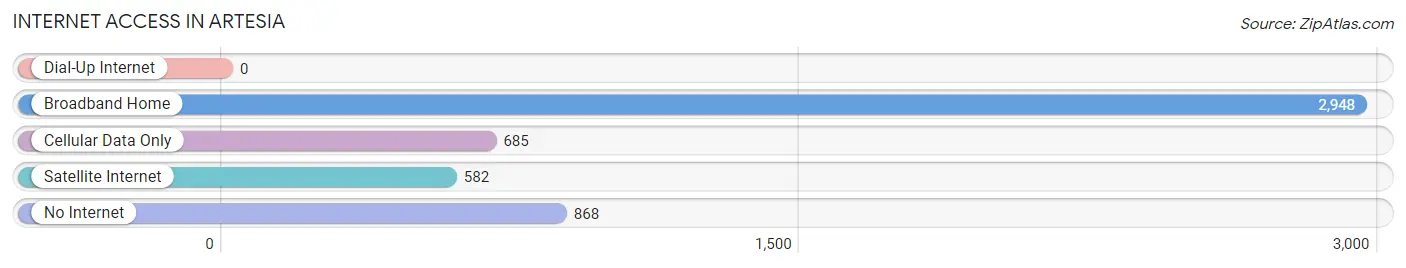
| Internet Type | # Households | % Households |
| Dial-Up Internet | 0 | 0.0% |
| Broadband Home | 2,948 | 61.3% |
| Cellular Data Only | 685 | 14.2% |
| Satellite Internet | 582 | 12.1% |
| No Internet | 868 | 18.0% |
| Total | 4,811 | 100.0% |
Artesia Summary
Artesia, New Mexico is a small city located in the southeastern corner of the state. It is the county seat of Eddy County and is located in the Chihuahuan Desert. The city has a population of 11,301 as of the 2020 census.
History
Artesia was founded in 1903 by the Artesia Townsite Company. The company was formed by a group of investors from Texas who wanted to develop the area for agricultural and ranching purposes. The town was named after the nearby Artesia Springs, which were discovered by Spanish explorers in the late 1700s.
The town grew quickly and by 1910, it had a population of 1,000. The town was incorporated in 1912 and the first mayor was elected in 1913.
In the 1920s, oil was discovered in the area and the town quickly became a boomtown. The population grew to over 5,000 by 1930. The oil industry continued to be a major part of the local economy until the 1980s.
Geography
Artesia is located in the southeastern corner of New Mexico, in Eddy County. It is situated in the Chihuahuan Desert and is surrounded by the Pecos River to the east and the Hondo River to the west. The city is located at an elevation of 3,845 feet above sea level.
The climate in Artesia is semi-arid, with hot summers and mild winters. The average annual temperature is 64°F and the average annual precipitation is 12.5 inches.
Economy
The economy of Artesia is largely based on oil and gas production, agriculture, and tourism. The oil and gas industry is the largest employer in the city, with over 1,000 people employed in the industry.
Agriculture is also an important part of the local economy. The area is known for its production of cotton, onions, and pecans.
Tourism is also an important part of the local economy. The city is home to several museums, including the Artesia Historical Museum and the Eddy County Museum. The city also hosts several annual festivals, including the Artesia Days Festival and the Artesia Rodeo.
Demographics
As of the 2020 census, the population of Artesia was 11,301. The racial makeup of the city was 75.3% White, 0.9% African American, 1.2% Native American, 0.3% Asian, 0.1% Pacific Islander, 19.2% from other races, and 3.1% from two or more races. Hispanic or Latino of any race were 44.2% of the population.
The median household income in Artesia was $37,945 and the median family income was $45,938. The per capita income was $19,945. About 17.2% of the population was below the poverty line.
Artesia is a small city with a rich history and a diverse economy. The city is home to a variety of industries, including oil and gas production, agriculture, and tourism. The city also has a diverse population, with a majority of the population being Hispanic or Latino.
Common Questions
What is Per Capita Income in Artesia?
Per Capita income in Artesia is $33,886.
What is the Median Family Income in Artesia?
Median Family Income in Artesia is $89,100.
What is the Median Household income in Artesia?
Median Household Income in Artesia is $75,389.
What is Income or Wage Gap in Artesia?
Income or Wage Gap in Artesia is 59.2%.
Women in Artesia earn 40.8 cents for every dollar earned by a man.
What is Inequality or Gini Index in Artesia?
Inequality or Gini Index in Artesia is 0.40.
What is the Total Population of Artesia?
Total Population of Artesia is 12,632.
What is the Total Male Population of Artesia?
Total Male Population of Artesia is 6,673.
What is the Total Female Population of Artesia?
Total Female Population of Artesia is 5,959.
What is the Ratio of Males per 100 Females in Artesia?
There are 111.98 Males per 100 Females in Artesia.
What is the Ratio of Females per 100 Males in Artesia?
There are 89.30 Females per 100 Males in Artesia.
What is the Median Population Age in Artesia?
Median Population Age in Artesia is 33.9 Years.
What is the Average Family Size in Artesia
Average Family Size in Artesia is 3.1 People.
What is the Average Household Size in Artesia
Average Household Size in Artesia is 2.6 People.
How Large is the Labor Force in Artesia?
There are 6,065 People in the Labor Forcein in Artesia.
What is the Percentage of People in the Labor Force in Artesia?
66.2% of People are in the Labor Force in Artesia.
What is the Unemployment Rate in Artesia?
Unemployment Rate in Artesia is 4.5%.