Arenas Valley, NM Map & Demographics
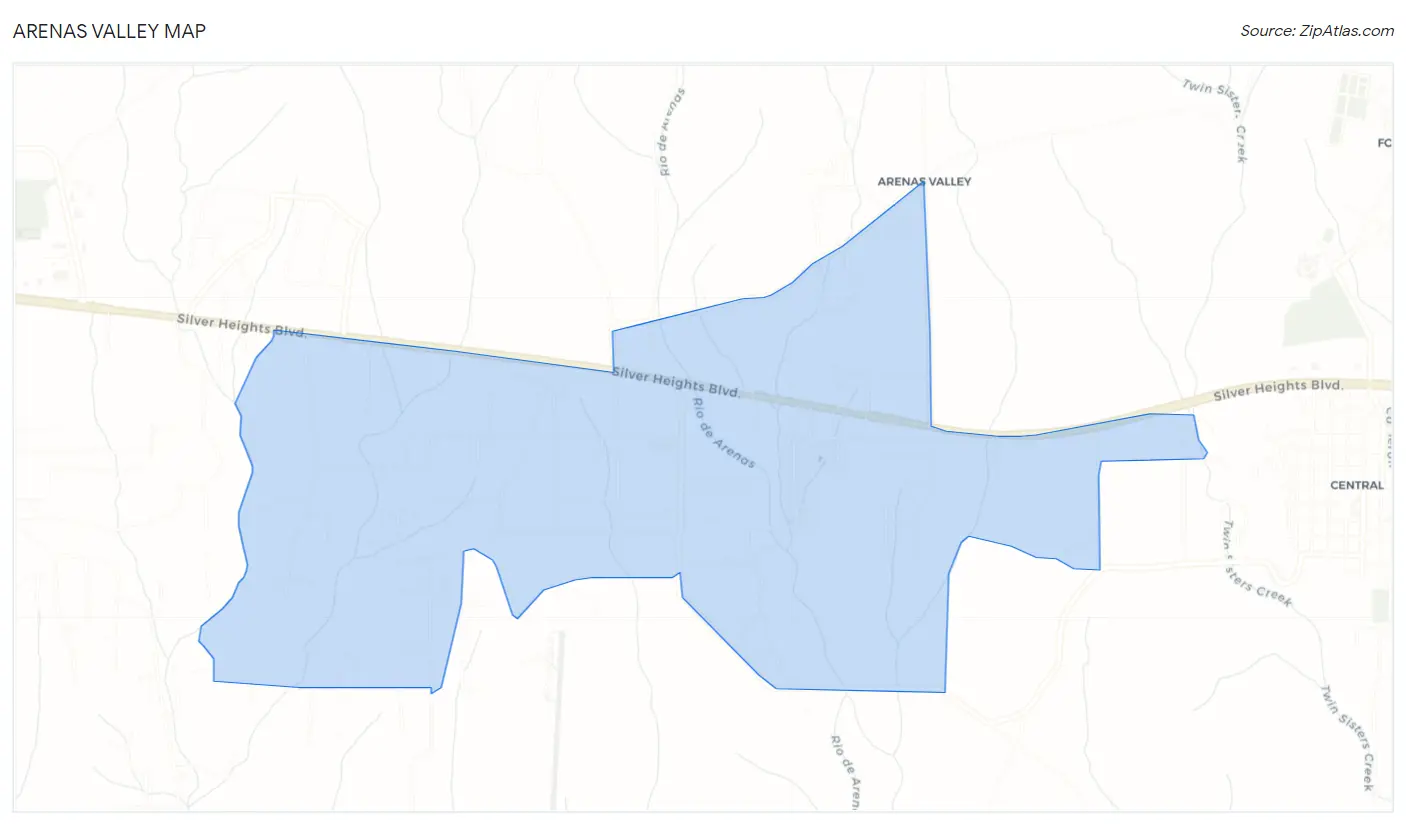
Arenas Valley Map
Arenas Valley Overview
$35,333
PER CAPITA INCOME
$97,292
AVG FAMILY INCOME
$68,068
AVG HOUSEHOLD INCOME
0.44
INEQUALITY / GINI INDEX
1,060
TOTAL POPULATION
389
MALE POPULATION
671
FEMALE POPULATION
57.97
MALES / 100 FEMALES
172.49
FEMALES / 100 MALES
65.3
MEDIAN AGE
2.9
AVG FAMILY SIZE
2.6
AVG HOUSEHOLD SIZE
380
LABOR FORCE [ PEOPLE ]
39.0%
PERCENT IN LABOR FORCE
5.3%
UNEMPLOYMENT RATE
Arenas Valley Zip Codes
Arenas Valley Area Codes
Income in Arenas Valley
Income Overview in Arenas Valley
Per Capita Income in Arenas Valley is $35,333, while median incomes of families and households are $97,292 and $68,068 respectively.
| Characteristic | Number | Measure |
| Per Capita Income | 1,060 | $35,333 |
| Median Family Income | 326 | $97,292 |
| Mean Family Income | 326 | $127,379 |
| Median Household Income | 409 | $68,068 |
| Mean Household Income | 409 | $107,679 |
| Income Deficit | 326 | $0 |
| Wage / Income Gap (%) | 1,060 | 0.00% |
| Wage / Income Gap ($) | 1,060 | 100.00¢ per $1 |
| Gini / Inequality Index | 1,060 | 0.44 |
Earnings by Sex in Arenas Valley
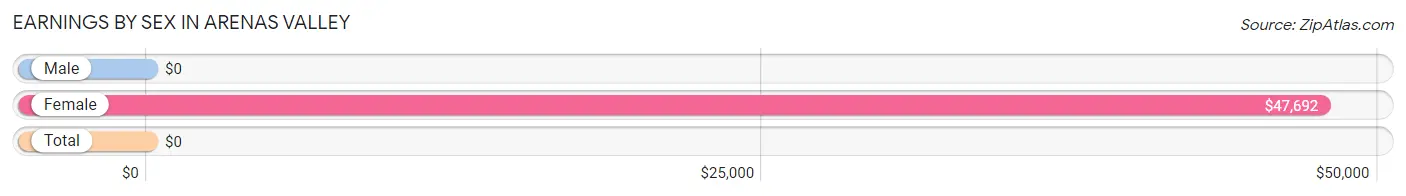
| Sex | Number | Average Earnings |
| Male | 206 (47.5%) | $0 |
| Female | 228 (52.5%) | $47,692 |
| Total | 434 (100.0%) | $0 |
Earnings by Sex by Income Bracket in Arenas Valley
The most common earnings brackets in Arenas Valley are $100,000+ for men (55 | 26.7%) and $65,000 to $74,999 for women (83 | 36.4%).
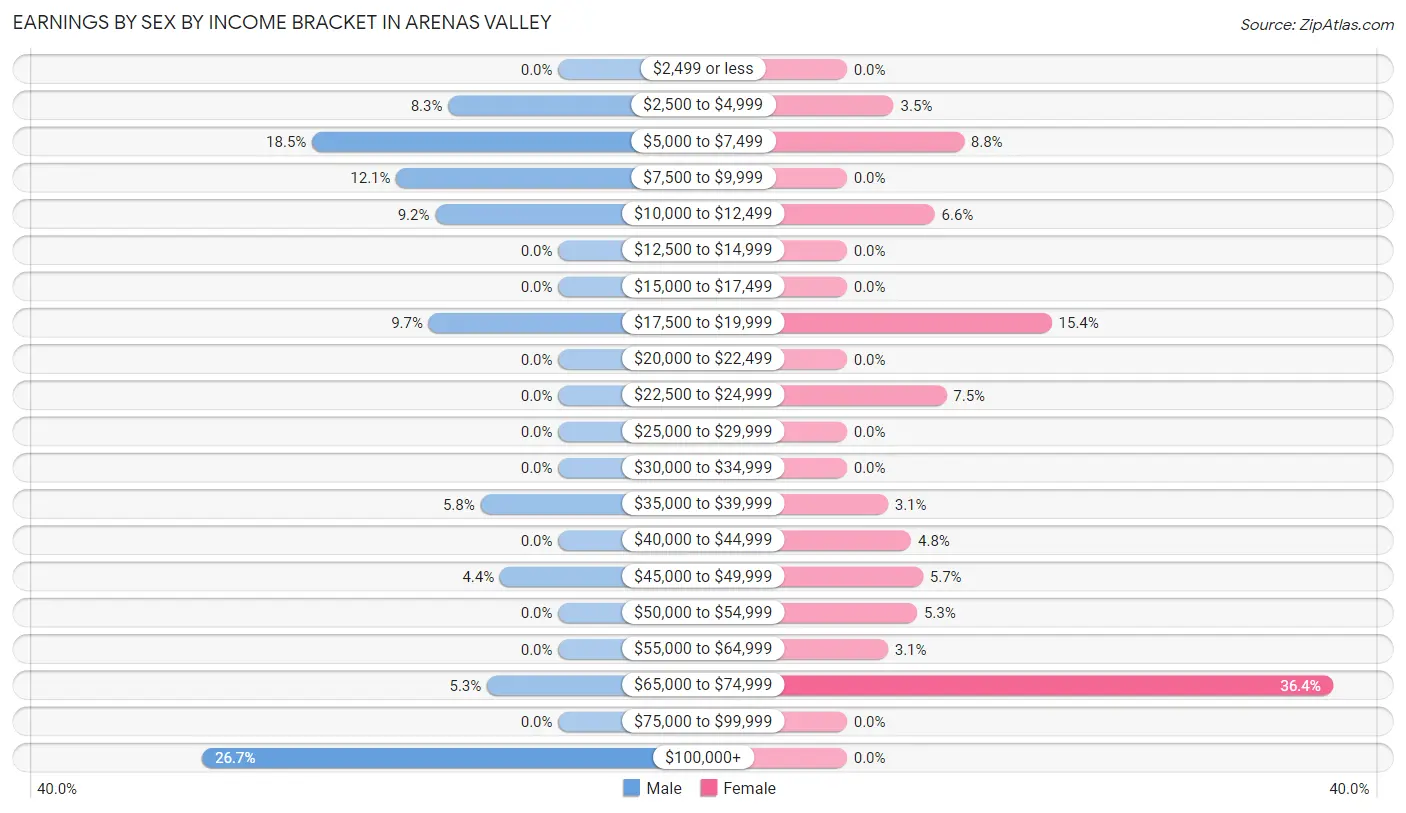
| Income | Male | Female |
| $2,499 or less | 0 (0.0%) | 0 (0.0%) |
| $2,500 to $4,999 | 17 (8.3%) | 8 (3.5%) |
| $5,000 to $7,499 | 38 (18.4%) | 20 (8.8%) |
| $7,500 to $9,999 | 25 (12.1%) | 0 (0.0%) |
| $10,000 to $12,499 | 19 (9.2%) | 15 (6.6%) |
| $12,500 to $14,999 | 0 (0.0%) | 0 (0.0%) |
| $15,000 to $17,499 | 0 (0.0%) | 0 (0.0%) |
| $17,500 to $19,999 | 20 (9.7%) | 35 (15.3%) |
| $20,000 to $22,499 | 0 (0.0%) | 0 (0.0%) |
| $22,500 to $24,999 | 0 (0.0%) | 17 (7.5%) |
| $25,000 to $29,999 | 0 (0.0%) | 0 (0.0%) |
| $30,000 to $34,999 | 0 (0.0%) | 0 (0.0%) |
| $35,000 to $39,999 | 12 (5.8%) | 7 (3.1%) |
| $40,000 to $44,999 | 0 (0.0%) | 11 (4.8%) |
| $45,000 to $49,999 | 9 (4.4%) | 13 (5.7%) |
| $50,000 to $54,999 | 0 (0.0%) | 12 (5.3%) |
| $55,000 to $64,999 | 0 (0.0%) | 7 (3.1%) |
| $65,000 to $74,999 | 11 (5.3%) | 83 (36.4%) |
| $75,000 to $99,999 | 0 (0.0%) | 0 (0.0%) |
| $100,000+ | 55 (26.7%) | 0 (0.0%) |
| Total | 206 (100.0%) | 228 (100.0%) |
Earnings by Sex by Educational Attainment in Arenas Valley
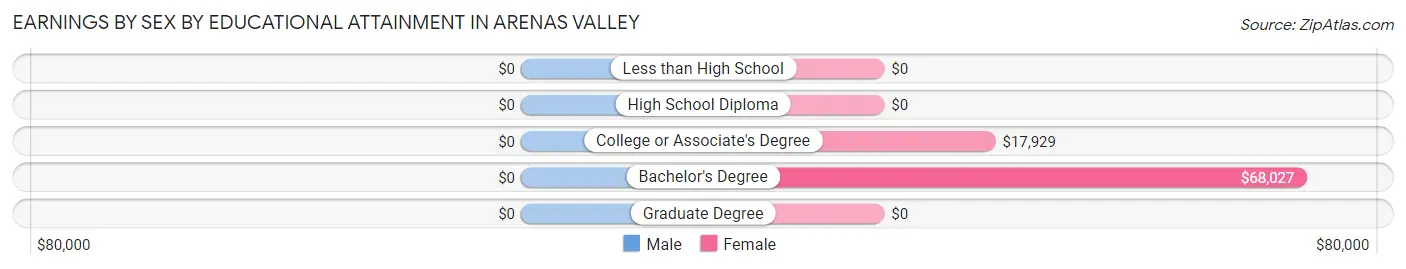
| Educational Attainment | Male Income | Female Income |
| Less than High School | - | - |
| High School Diploma | - | - |
| College or Associate's Degree | - | - |
| Bachelor's Degree | - | - |
| Graduate Degree | - | - |
| Total | - | - |
Family Income in Arenas Valley
Family Income Brackets in Arenas Valley
According to the Arenas Valley family income data, there are 83 families falling into the $150,000 to $199,999 income range, which is the most common income bracket and makes up 25.5% of all families.
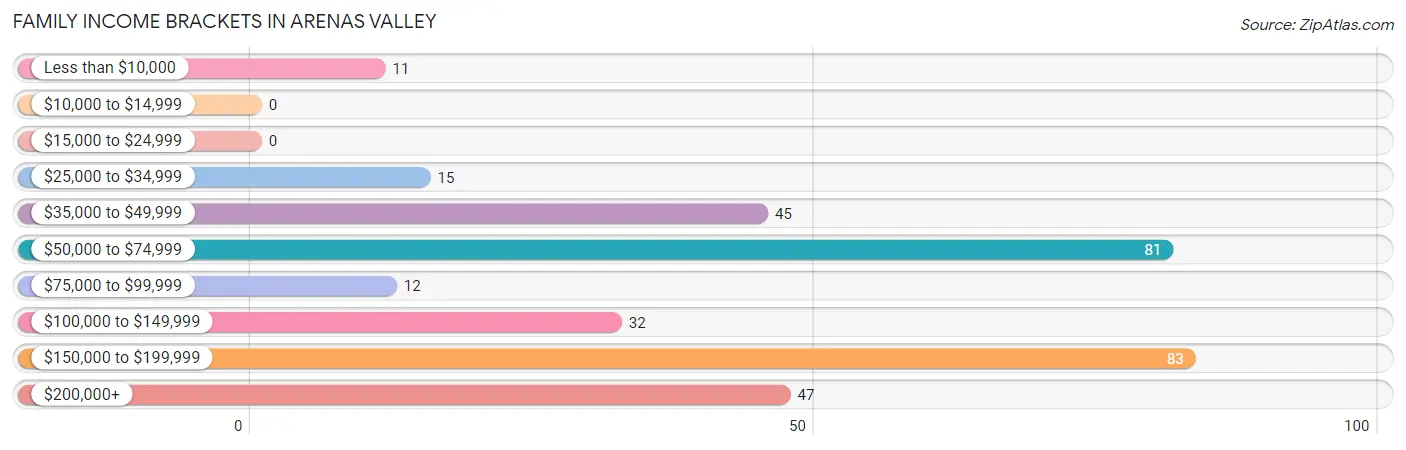
| Income Bracket | # Families | % Families |
| Less than $10,000 | 11 | 3.4% |
| $10,000 to $14,999 | 0 | 0.0% |
| $15,000 to $24,999 | 0 | 0.0% |
| $25,000 to $34,999 | 15 | 4.6% |
| $35,000 to $49,999 | 45 | 13.8% |
| $50,000 to $74,999 | 81 | 24.8% |
| $75,000 to $99,999 | 12 | 3.7% |
| $100,000 to $149,999 | 32 | 9.8% |
| $150,000 to $199,999 | 83 | 25.5% |
| $200,000+ | 47 | 14.4% |
Family Income by Famaliy Size in Arenas Valley
3-person families (70 | 21.5%) account for the highest median family income in Arenas Valley with $250,001 per family, while 3-person families (70 | 21.5%) have the highest median income of $83,334 per family member.
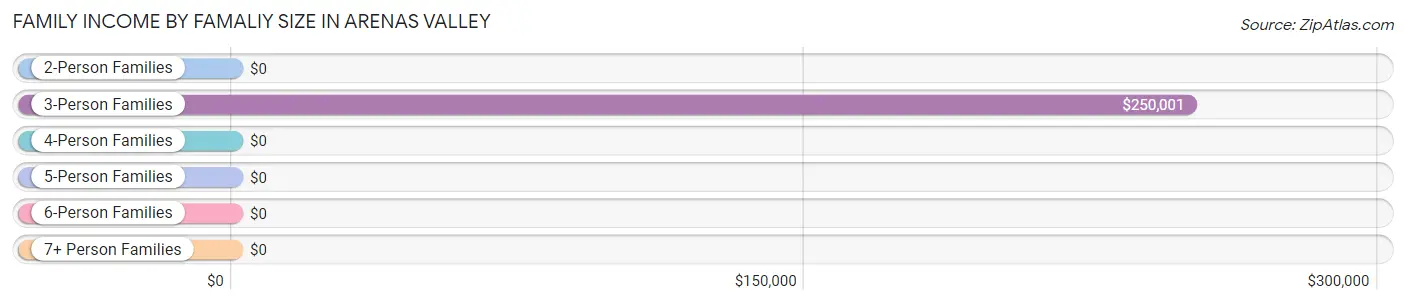
| Income Bracket | # Families | Median Income |
| 2-Person Families | 225 (69.0%) | $0 |
| 3-Person Families | 70 (21.5%) | $250,001 |
| 4-Person Families | 20 (6.1%) | $0 |
| 5-Person Families | 11 (3.4%) | $0 |
| 6-Person Families | 0 (0.0%) | $0 |
| 7+ Person Families | 0 (0.0%) | $0 |
| Total | 326 (100.0%) | $97,292 |
Family Income by Number of Earners in Arenas Valley
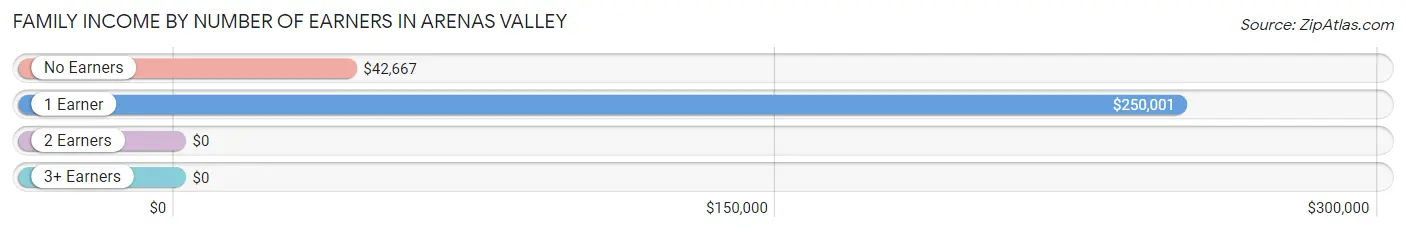
| Number of Earners | # Families | Median Income |
| No Earners | 56 (17.2%) | $42,667 |
| 1 Earner | 84 (25.8%) | $250,001 |
| 2 Earners | 175 (53.7%) | $0 |
| 3+ Earners | 11 (3.4%) | $0 |
| Total | 326 (100.0%) | $97,292 |
Household Income in Arenas Valley
Household Income Brackets in Arenas Valley
With 97 households falling in the category, the $35,000 to $49,999 income range is the most frequent in Arenas Valley, accounting for 23.7% of all households.
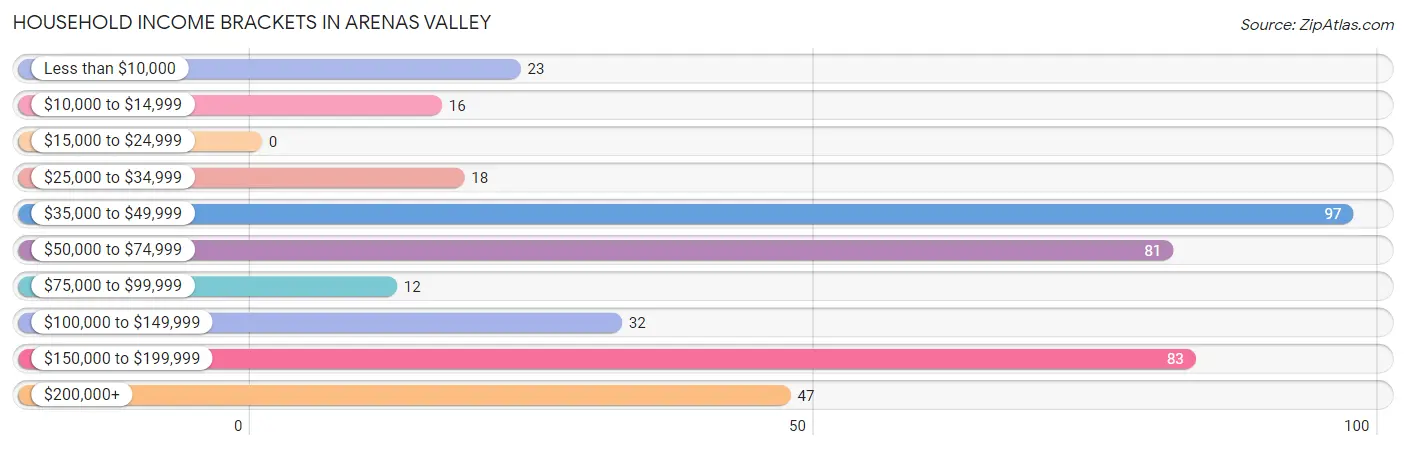
| Income Bracket | # Households | % Households |
| Less than $10,000 | 23 | 5.6% |
| $10,000 to $14,999 | 16 | 3.9% |
| $15,000 to $24,999 | 0 | 0.0% |
| $25,000 to $34,999 | 18 | 4.4% |
| $35,000 to $49,999 | 97 | 23.7% |
| $50,000 to $74,999 | 81 | 19.8% |
| $75,000 to $99,999 | 12 | 2.9% |
| $100,000 to $149,999 | 32 | 7.8% |
| $150,000 to $199,999 | 83 | 20.3% |
| $200,000+ | 47 | 11.5% |
Household Income by Householder Age in Arenas Valley
The median household income in Arenas Valley is $68,068, with the highest median household income of $176,310 found in the 45 to 64 years age bracket for the primary householder. A total of 173 households (42.3%) fall into this category.
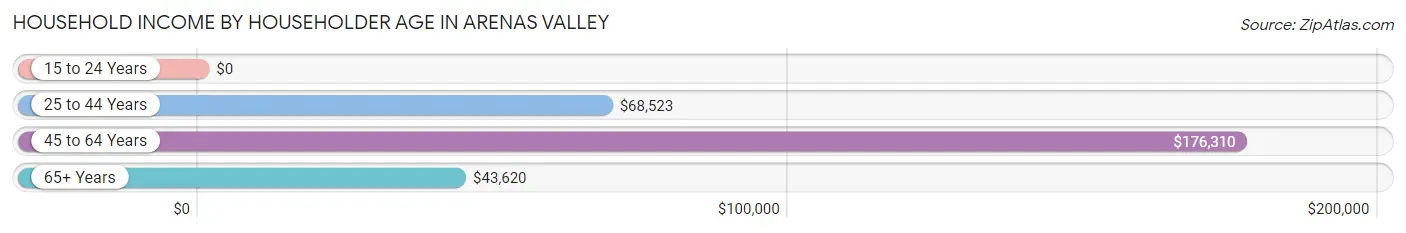
| Income Bracket | # Households | Median Income |
| 15 to 24 Years | 0 (0.0%) | $0 |
| 25 to 44 Years | 35 (8.6%) | $68,523 |
| 45 to 64 Years | 173 (42.3%) | $176,310 |
| 65+ Years | 201 (49.1%) | $43,620 |
| Total | 409 (100.0%) | $68,068 |
Poverty in Arenas Valley
Income Below Poverty by Sex and Age in Arenas Valley
With 27.8% poverty level for males and 7.9% for females among the residents of Arenas Valley, 35 to 44 year old males and 65 to 74 year old females are the most vulnerable to poverty, with 97 males (77.6%) and 16 females (12.4%) in their respective age groups living below the poverty level.
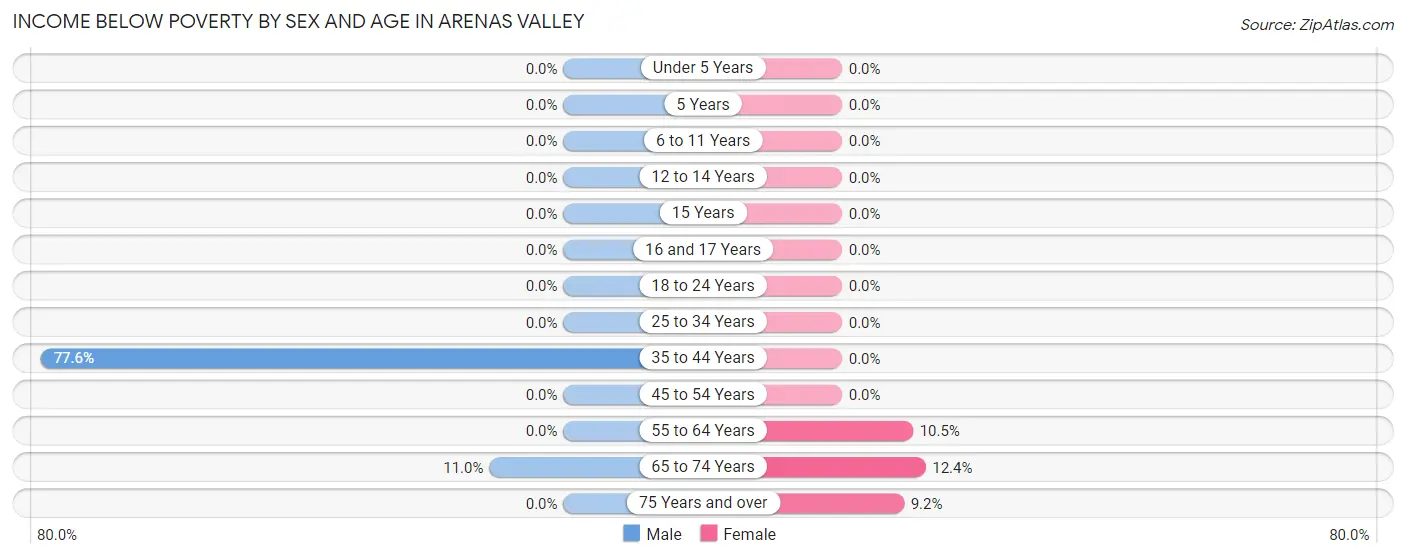
| Age Bracket | Male | Female |
| Under 5 Years | 0 (0.0%) | 0 (0.0%) |
| 5 Years | 0 (0.0%) | 0 (0.0%) |
| 6 to 11 Years | 0 (0.0%) | 0 (0.0%) |
| 12 to 14 Years | 0 (0.0%) | 0 (0.0%) |
| 15 Years | 0 (0.0%) | 0 (0.0%) |
| 16 and 17 Years | 0 (0.0%) | 0 (0.0%) |
| 18 to 24 Years | 0 (0.0%) | 0 (0.0%) |
| 25 to 34 Years | 0 (0.0%) | 0 (0.0%) |
| 35 to 44 Years | 97 (77.6%) | 0 (0.0%) |
| 45 to 54 Years | 0 (0.0%) | 0 (0.0%) |
| 55 to 64 Years | 0 (0.0%) | 12 (10.5%) |
| 65 to 74 Years | 11 (11.0%) | 16 (12.4%) |
| 75 Years and over | 0 (0.0%) | 25 (9.2%) |
| Total | 108 (27.8%) | 53 (7.9%) |
Income Above Poverty by Sex and Age in Arenas Valley
According to the poverty statistics in Arenas Valley, males aged 12 to 14 years and females aged 6 to 11 years are the age groups that are most secure financially, with 100.0% of males and 100.0% of females in these age groups living above the poverty line.
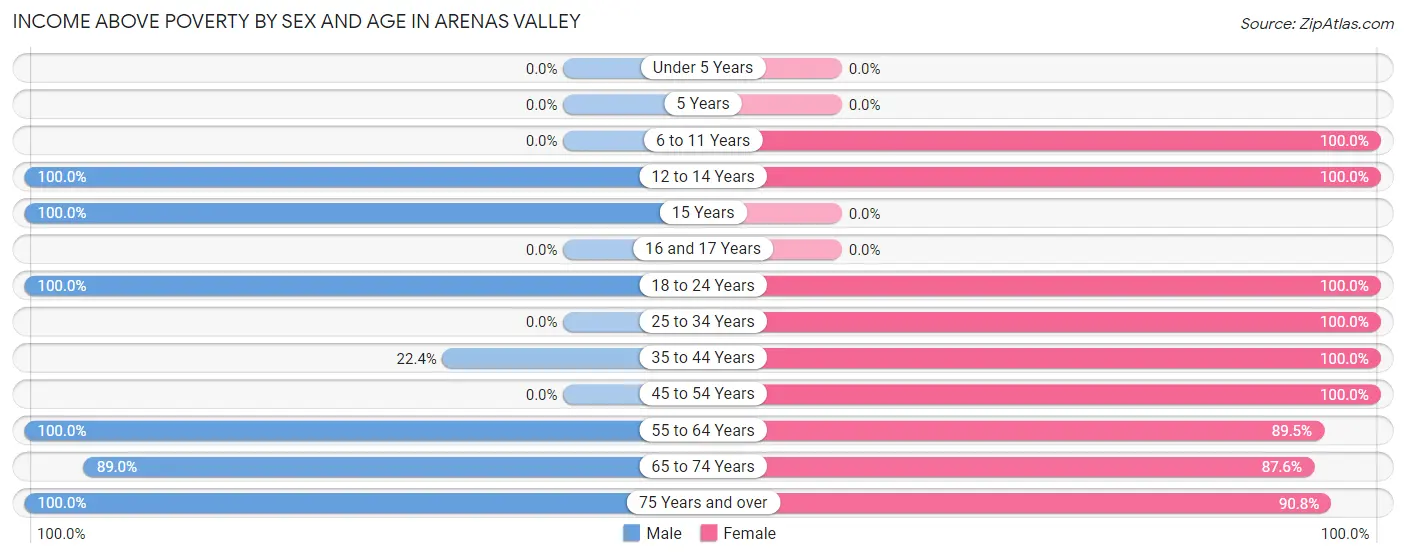
| Age Bracket | Male | Female |
| Under 5 Years | 0 (0.0%) | 0 (0.0%) |
| 5 Years | 0 (0.0%) | 0 (0.0%) |
| 6 to 11 Years | 0 (0.0%) | 24 (100.0%) |
| 12 to 14 Years | 16 (100.0%) | 37 (100.0%) |
| 15 Years | 8 (100.0%) | 0 (0.0%) |
| 16 and 17 Years | 0 (0.0%) | 0 (0.0%) |
| 18 to 24 Years | 20 (100.0%) | 39 (100.0%) |
| 25 to 34 Years | 0 (0.0%) | 13 (100.0%) |
| 35 to 44 Years | 28 (22.4%) | 19 (100.0%) |
| 45 to 54 Years | 0 (0.0%) | 24 (100.0%) |
| 55 to 64 Years | 67 (100.0%) | 102 (89.5%) |
| 65 to 74 Years | 89 (89.0%) | 113 (87.6%) |
| 75 Years and over | 53 (100.0%) | 247 (90.8%) |
| Total | 281 (72.2%) | 618 (92.1%) |
Income Below Poverty Among Married-Couple Families in Arenas Valley
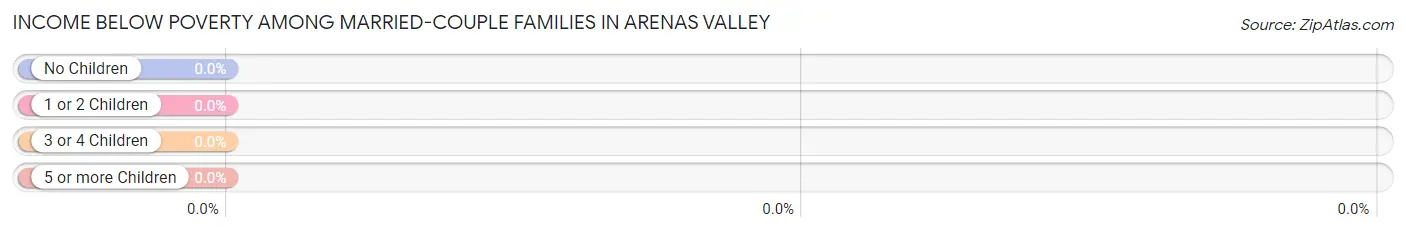
| Children | Above Poverty | Below Poverty |
| No Children | 284 (100.0%) | 0 (0.0%) |
| 1 or 2 Children | 18 (100.0%) | 0 (0.0%) |
| 3 or 4 Children | 0 (0.0%) | 0 (0.0%) |
| 5 or more Children | 0 (0.0%) | 0 (0.0%) |
| Total | 302 (100.0%) | 0 (0.0%) |
Income Below Poverty Among Single-Parent Households in Arenas Valley
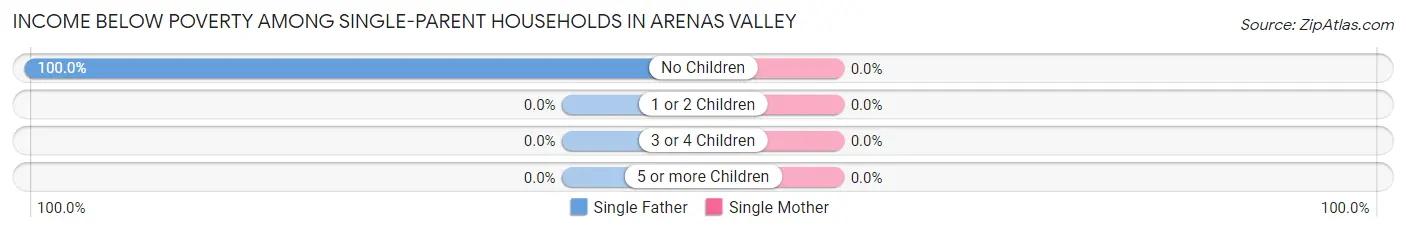
| Children | Single Father | Single Mother |
| No Children | 11 (100.0%) | 0 (0.0%) |
| 1 or 2 Children | 0 (0.0%) | 0 (0.0%) |
| 3 or 4 Children | 0 (0.0%) | 0 (0.0%) |
| 5 or more Children | 0 (0.0%) | 0 (0.0%) |
| Total | 11 (100.0%) | 0 (0.0%) |
Income Below Poverty Among Married-Couple vs Single-Parent Households in Arenas Valley
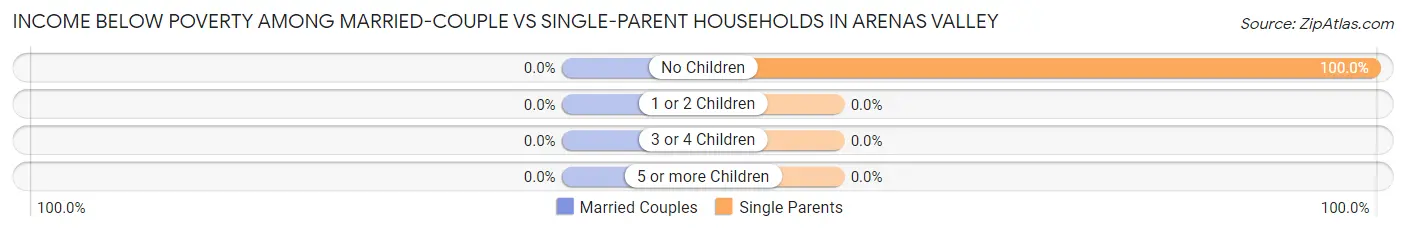
| Children | Married-Couple Families | Single-Parent Households |
| No Children | 0 (0.0%) | 11 (100.0%) |
| 1 or 2 Children | 0 (0.0%) | 0 (0.0%) |
| 3 or 4 Children | 0 (0.0%) | 0 (0.0%) |
| 5 or more Children | 0 (0.0%) | 0 (0.0%) |
| Total | 0 (0.0%) | 11 (45.8%) |
Race in Arenas Valley
The most populous races in Arenas Valley are White / Caucasian (861 | 81.2%), Hispanic or Latino (373 | 35.2%), and Native / Alaskan (116 | 10.9%).
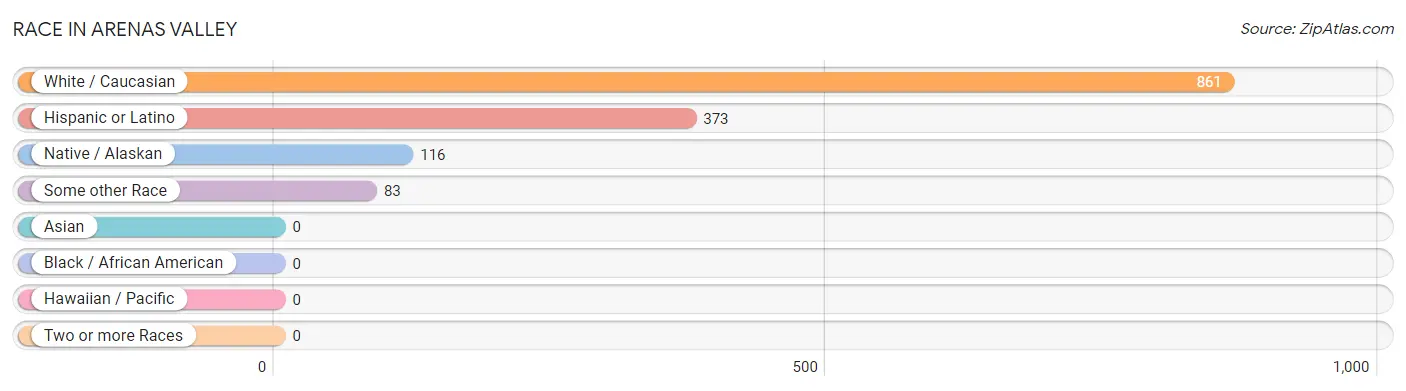
| Race | # Population | % Population |
| Asian | 0 | 0.0% |
| Black / African American | 0 | 0.0% |
| Hawaiian / Pacific | 0 | 0.0% |
| Hispanic or Latino | 373 | 35.2% |
| Native / Alaskan | 116 | 10.9% |
| White / Caucasian | 861 | 81.2% |
| Two or more Races | 0 | 0.0% |
| Some other Race | 83 | 7.8% |
| Total | 1,060 | 100.0% |
Ancestry in Arenas Valley
The most populous ancestries reported in Arenas Valley are Mexican (373 | 35.2%), American (193 | 18.2%), Pueblo (116 | 10.9%), English (80 | 7.5%), and Hopi (80 | 7.5%), together accounting for 79.4% of all Arenas Valley residents.
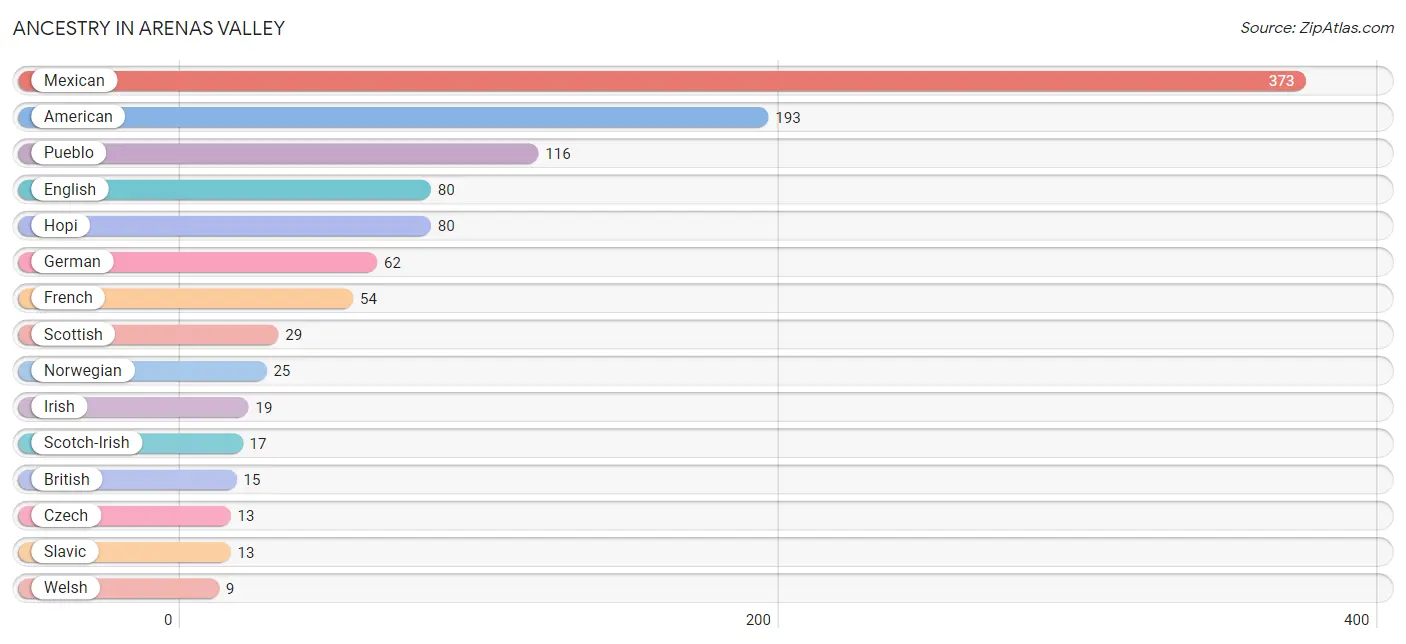
| Ancestry | # Population | % Population |
| American | 193 | 18.2% |
| British | 15 | 1.4% |
| Czech | 13 | 1.2% |
| English | 80 | 7.5% |
| French | 54 | 5.1% |
| German | 62 | 5.9% |
| Hopi | 80 | 7.5% |
| Irish | 19 | 1.8% |
| Mexican | 373 | 35.2% |
| Norwegian | 25 | 2.4% |
| Pueblo | 116 | 10.9% |
| Scotch-Irish | 17 | 1.6% |
| Scottish | 29 | 2.7% |
| Slavic | 13 | 1.2% |
| Swedish | 5 | 0.5% |
| Welsh | 9 | 0.9% | View All 16 Rows |
Immigrants in Arenas Valley

| Immigration Origin | # Population | % Population | View All 0 Rows |
Sex and Age in Arenas Valley
Sex and Age in Arenas Valley
The most populous age groups in Arenas Valley are 35 to 39 Years (108 | 27.8%) for men and 85 Years and over (202 | 30.1%) for women.
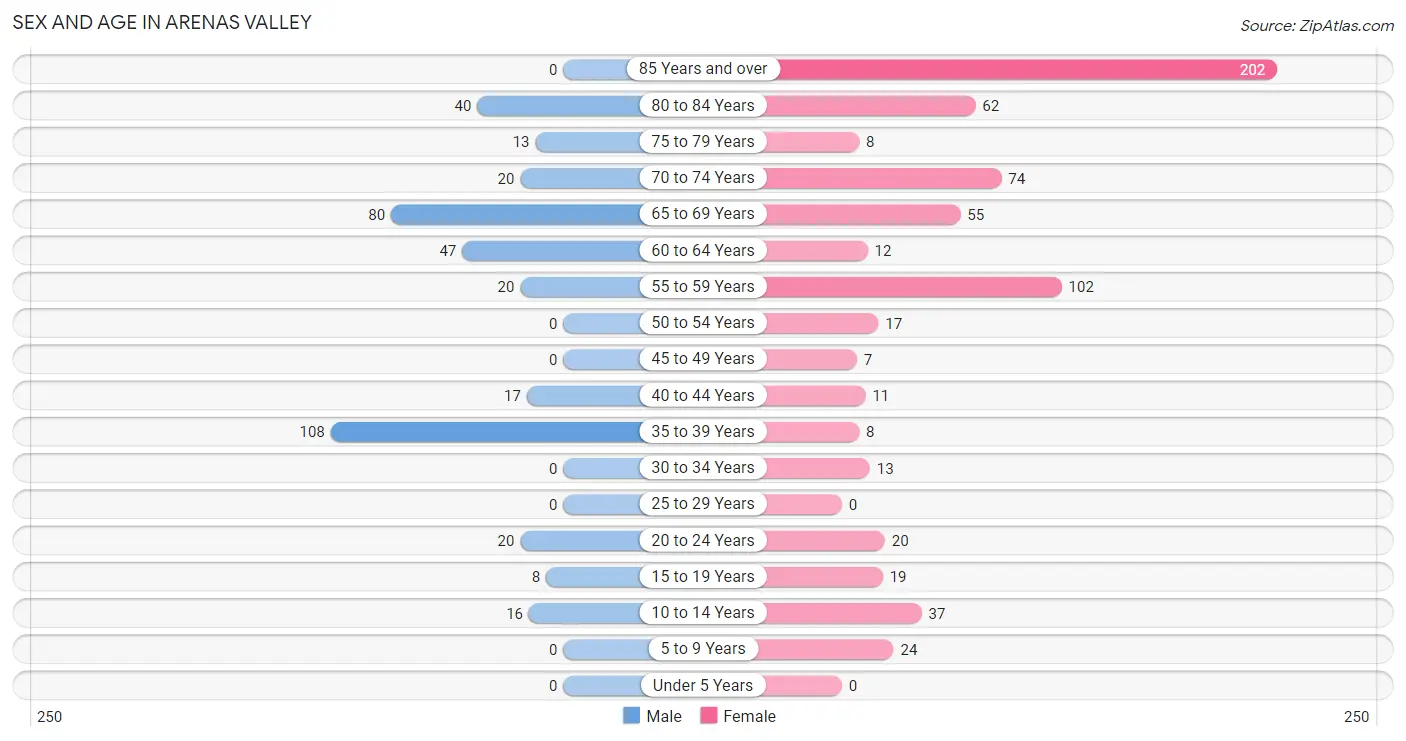
| Age Bracket | Male | Female |
| Under 5 Years | 0 (0.0%) | 0 (0.0%) |
| 5 to 9 Years | 0 (0.0%) | 24 (3.6%) |
| 10 to 14 Years | 16 (4.1%) | 37 (5.5%) |
| 15 to 19 Years | 8 (2.1%) | 19 (2.8%) |
| 20 to 24 Years | 20 (5.1%) | 20 (3.0%) |
| 25 to 29 Years | 0 (0.0%) | 0 (0.0%) |
| 30 to 34 Years | 0 (0.0%) | 13 (1.9%) |
| 35 to 39 Years | 108 (27.8%) | 8 (1.2%) |
| 40 to 44 Years | 17 (4.4%) | 11 (1.6%) |
| 45 to 49 Years | 0 (0.0%) | 7 (1.0%) |
| 50 to 54 Years | 0 (0.0%) | 17 (2.5%) |
| 55 to 59 Years | 20 (5.1%) | 102 (15.2%) |
| 60 to 64 Years | 47 (12.1%) | 12 (1.8%) |
| 65 to 69 Years | 80 (20.6%) | 55 (8.2%) |
| 70 to 74 Years | 20 (5.1%) | 74 (11.0%) |
| 75 to 79 Years | 13 (3.3%) | 8 (1.2%) |
| 80 to 84 Years | 40 (10.3%) | 62 (9.2%) |
| 85 Years and over | 0 (0.0%) | 202 (30.1%) |
| Total | 389 (100.0%) | 671 (100.0%) |
Families and Households in Arenas Valley
Median Family Size in Arenas Valley
The median family size in Arenas Valley is 2.94 persons per family, with single male/father families (11 | 3.4%) accounting for the largest median family size of 10.55 persons per family. On the other hand, married-couple families (302 | 92.6%) represent the smallest median family size with 2.54 persons per family.
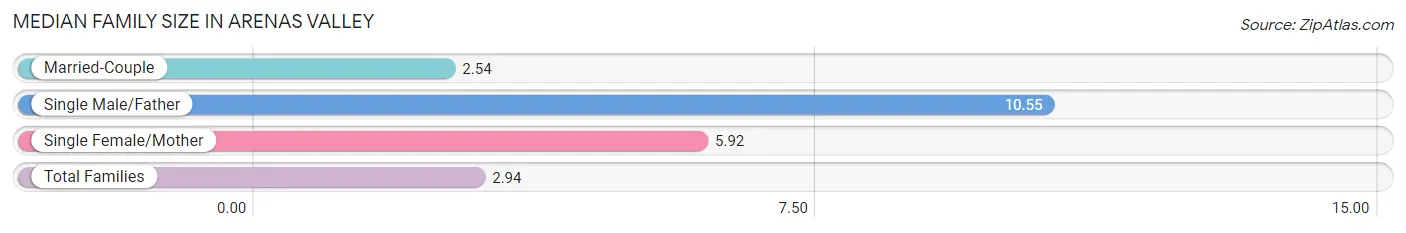
| Family Type | # Families | Family Size |
| Married-Couple | 302 (92.6%) | 2.54 |
| Single Male/Father | 11 (3.4%) | 10.55 |
| Single Female/Mother | 13 (4.0%) | 5.92 |
| Total Families | 326 (100.0%) | 2.94 |
Median Household Size in Arenas Valley
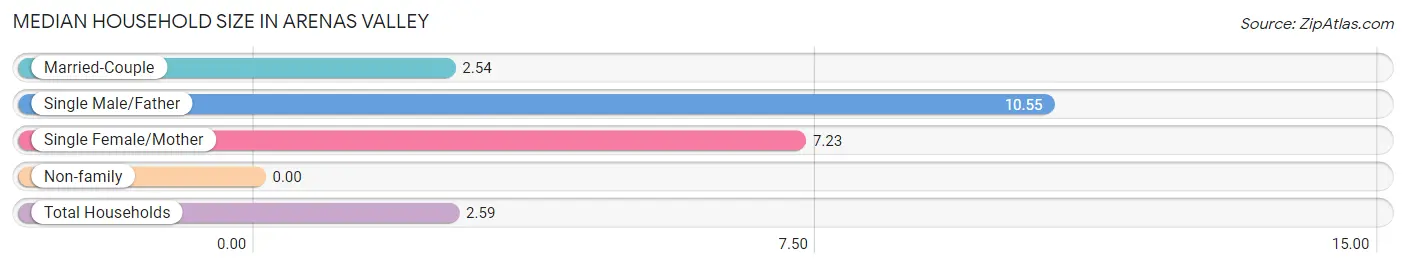
| Household Type | # Households | Household Size |
| Married-Couple | 302 (73.8%) | 2.54 |
| Single Male/Father | 11 (2.7%) | 10.55 |
| Single Female/Mother | 13 (3.2%) | 7.23 |
| Non-family | 83 (20.3%) | - |
| Total Households | 409 (100.0%) | 2.59 |
Household Size by Marriage Status in Arenas Valley
Out of a total of 409 households in Arenas Valley, 326 (79.7%) are family households, while 83 (20.3%) are nonfamily households. The most numerous type of family households are 2-person households, comprising 225, and the most common type of nonfamily households are 1-person households, comprising 83.
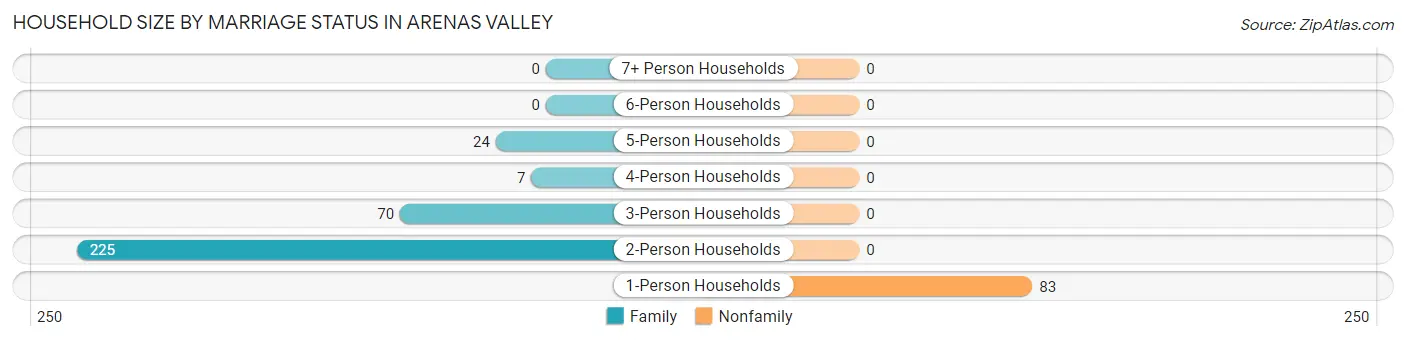
| Household Size | Family Households | Nonfamily Households |
| 1-Person Households | - | 83 (20.3%) |
| 2-Person Households | 225 (55.0%) | 0 (0.0%) |
| 3-Person Households | 70 (17.1%) | 0 (0.0%) |
| 4-Person Households | 7 (1.7%) | 0 (0.0%) |
| 5-Person Households | 24 (5.9%) | 0 (0.0%) |
| 6-Person Households | 0 (0.0%) | 0 (0.0%) |
| 7+ Person Households | 0 (0.0%) | 0 (0.0%) |
| Total | 326 (79.7%) | 83 (20.3%) |
Female Fertility in Arenas Valley
Fertility by Age in Arenas Valley
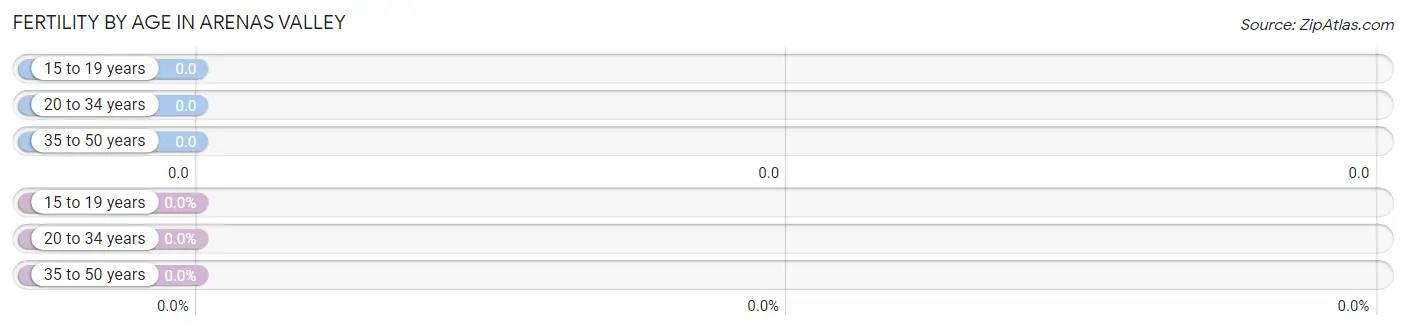
| Age Bracket | Women with Births | Births / 1,000 Women |
| 15 to 19 years | 0 (0.0%) | 0.0 |
| 20 to 34 years | 0 (0.0%) | 0.0 |
| 35 to 50 years | 0 (0.0%) | 0.0 |
| Total | 0 (0.0%) | 0.0 |
Fertility by Age by Marriage Status in Arenas Valley
| Age Bracket | Married | Unmarried |
| 15 to 19 years | 0 (0.0%) | 0 (0.0%) |
| 20 to 34 years | 0 (0.0%) | 0 (0.0%) |
| 35 to 50 years | 0 (0.0%) | 0 (0.0%) |
| Total | 0 (0.0%) | 0 (0.0%) |
Fertility by Education in Arenas Valley
| Educational Attainment | Women with Births | Births / 1,000 Women |
| Less than High School | 0 (0.0%) | 0.0 |
| High School Diploma | 0 (0.0%) | 0.0 |
| College or Associate's Degree | 0 (0.0%) | 0.0 |
| Bachelor's Degree | 0 (0.0%) | 0.0 |
| Graduate Degree | 0 (0.0%) | 0.0 |
| Total | 0 (0.0%) | 0.0 |
Fertility by Education by Marriage Status in Arenas Valley
| Educational Attainment | Married | Unmarried |
| Less than High School | 0 (0.0%) | 0 (0.0%) |
| High School Diploma | 0 (0.0%) | 0 (0.0%) |
| College or Associate's Degree | 0 (0.0%) | 0 (0.0%) |
| Bachelor's Degree | 0 (0.0%) | 0 (0.0%) |
| Graduate Degree | 0 (0.0%) | 0 (0.0%) |
| Total | 0 (0.0%) | 0 (0.0%) |
Employment Characteristics in Arenas Valley
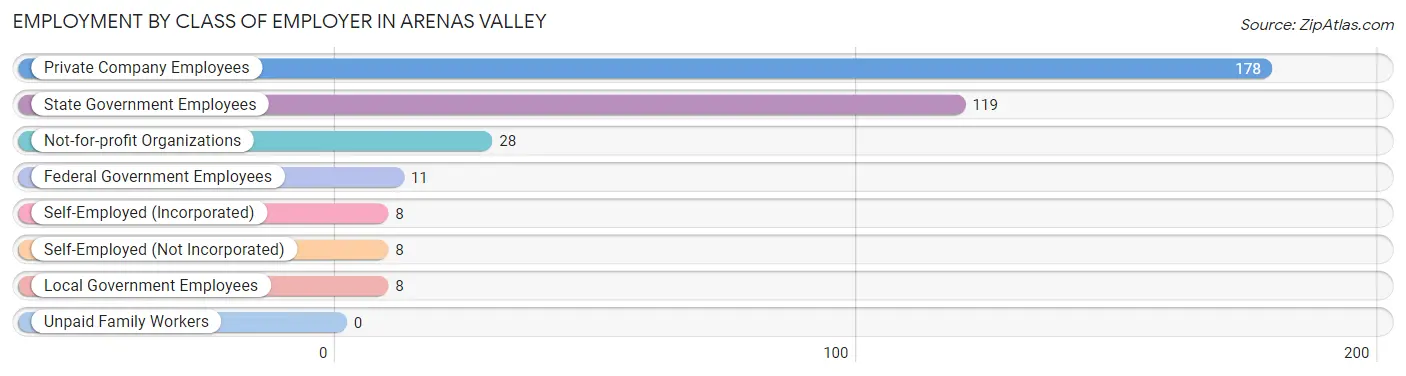
Employment by Class of Employer in Arenas Valley
Among the 360 employed individuals in Arenas Valley, private company employees (178 | 49.4%), state government employees (119 | 33.1%), and not-for-profit organizations (28 | 7.8%) make up the most common classes of employment.
| Employer Class | # Employees | % Employees |
| Private Company Employees | 178 | 49.4% |
| Self-Employed (Incorporated) | 8 | 2.2% |
| Self-Employed (Not Incorporated) | 8 | 2.2% |
| Not-for-profit Organizations | 28 | 7.8% |
| Local Government Employees | 8 | 2.2% |
| State Government Employees | 119 | 33.1% |
| Federal Government Employees | 11 | 3.1% |
| Unpaid Family Workers | 0 | 0.0% |
| Total | 360 | 100.0% |
Employment Status by Age in Arenas Valley
According to the labor force statistics for Arenas Valley, out of the total population over 16 years of age (975), 39.0% or 380 individuals are in the labor force, with 5.3% or 20 of them unemployed. The age group with the highest labor force participation rate is 20 to 24 years, with 100.0% or 40 individuals in the labor force. Within the labor force, the 20 to 24 years age range has the highest percentage of unemployed individuals, with 50.0% or 20 of them being unemployed.
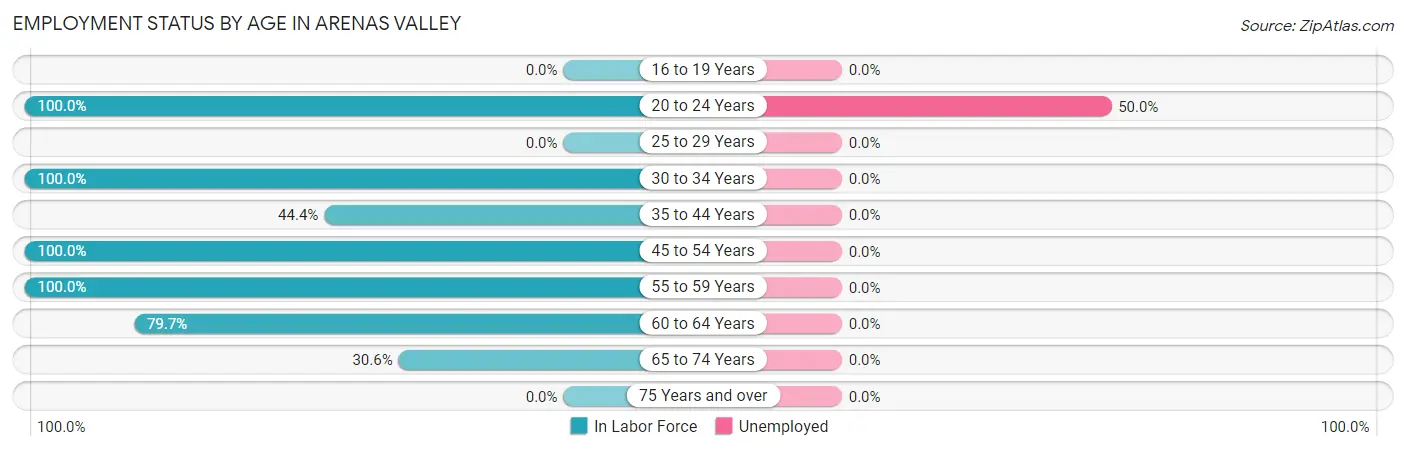
| Age Bracket | In Labor Force | Unemployed |
| 16 to 19 Years | 0 (0.0%) | 0 (0.0%) |
| 20 to 24 Years | 40 (100.0%) | 20 (50.0%) |
| 25 to 29 Years | 0 (0.0%) | 0 (0.0%) |
| 30 to 34 Years | 13 (100.0%) | 0 (0.0%) |
| 35 to 44 Years | 64 (44.4%) | 0 (0.0%) |
| 45 to 54 Years | 24 (100.0%) | 0 (0.0%) |
| 55 to 59 Years | 122 (100.0%) | 0 (0.0%) |
| 60 to 64 Years | 47 (79.7%) | 0 (0.0%) |
| 65 to 74 Years | 70 (30.6%) | 0 (0.0%) |
| 75 Years and over | 0 (0.0%) | 0 (0.0%) |
| Total | 380 (39.0%) | 20 (5.3%) |
Employment Status by Educational Attainment in Arenas Valley
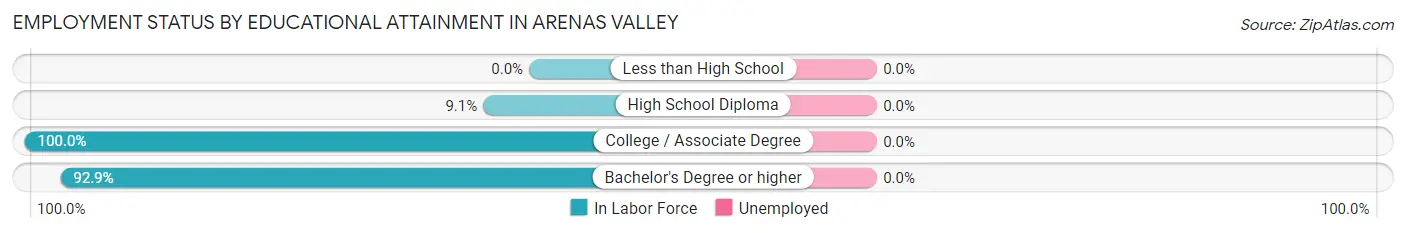
| Educational Attainment | In Labor Force | Unemployed |
| Less than High School | 0 (0.0%) | 0 (0.0%) |
| High School Diploma | 8 (9.1%) | 0 (0.0%) |
| College / Associate Degree | 104 (100.0%) | 0 (0.0%) |
| Bachelor's Degree or higher | 158 (92.9%) | 0 (0.0%) |
| Total | 270 (74.6%) | 0 (0.0%) |
Employment Occupations by Sex in Arenas Valley
Management, Business, Science and Arts Occupations
The most common Management, Business, Science and Arts occupations in Arenas Valley are Health Diagnosing & Treating (83 | 23.1%), Health Technologists (83 | 23.1%), Management (52 | 14.4%), Community & Social Service (28 | 7.8%), and Business & Financial (20 | 5.6%).
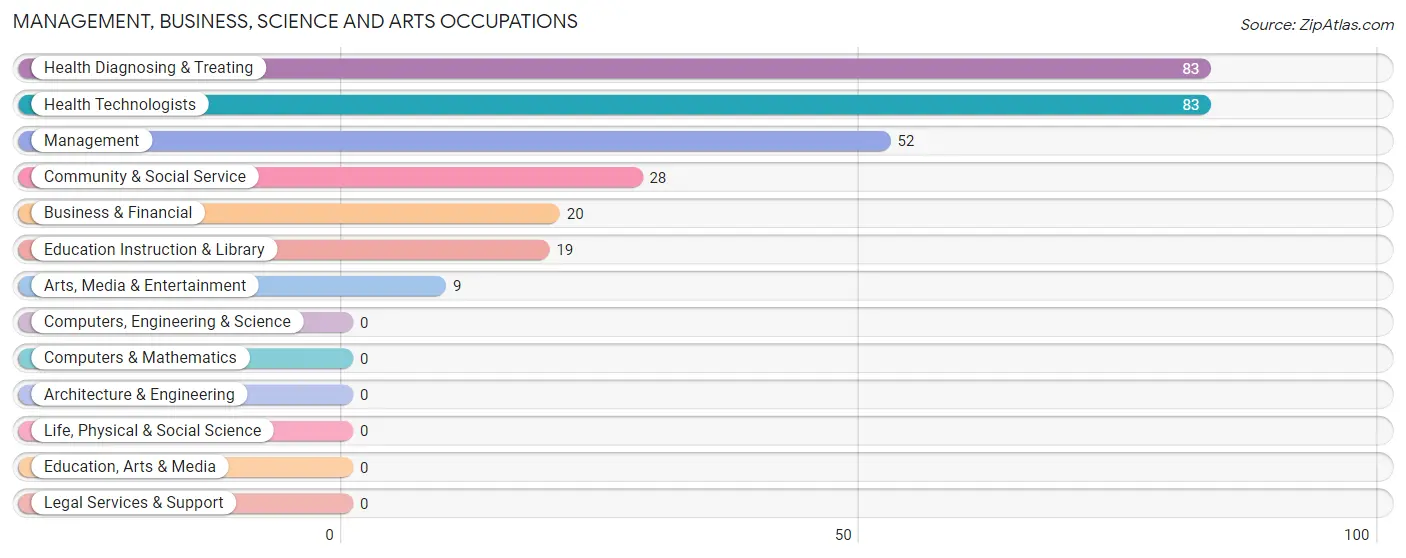
Management, Business, Science and Arts Occupations by Sex
Within the Management, Business, Science and Arts occupations in Arenas Valley, the most male-oriented occupations are Arts, Media & Entertainment (100.0%), Management (46.2%), and Community & Social Service (32.1%), while the most female-oriented occupations are Business & Financial (100.0%), Education Instruction & Library (100.0%), and Health Diagnosing & Treating (100.0%).
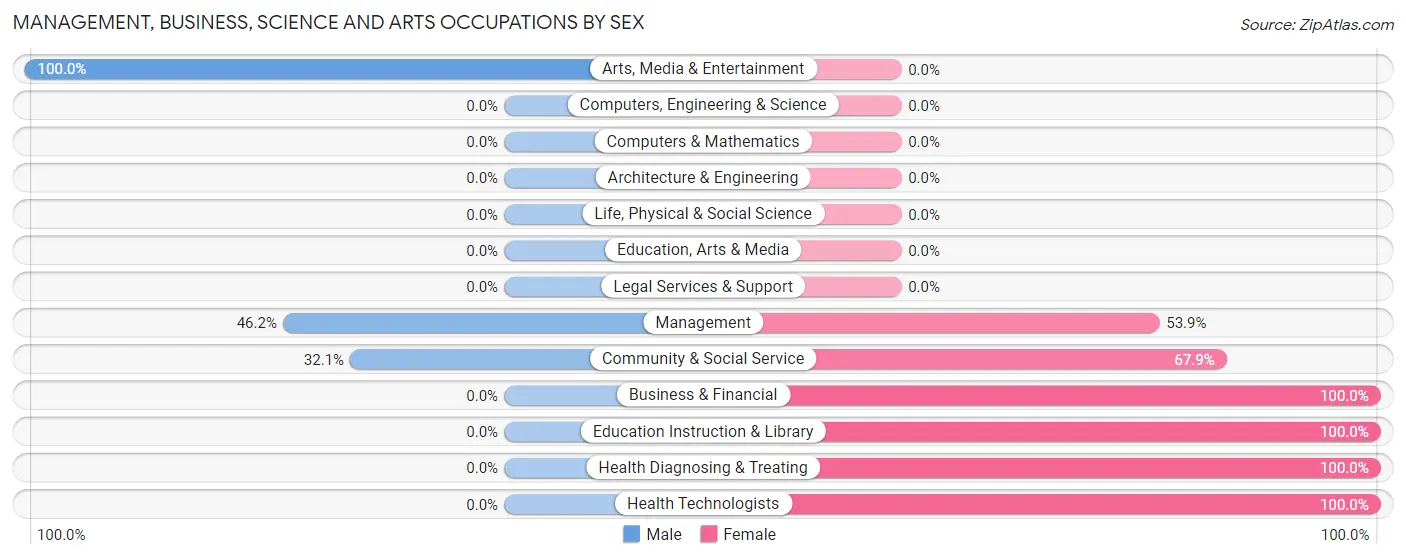
| Occupation | Male | Female |
| Management | 24 (46.2%) | 28 (53.8%) |
| Business & Financial | 0 (0.0%) | 20 (100.0%) |
| Computers, Engineering & Science | 0 (0.0%) | 0 (0.0%) |
| Computers & Mathematics | 0 (0.0%) | 0 (0.0%) |
| Architecture & Engineering | 0 (0.0%) | 0 (0.0%) |
| Life, Physical & Social Science | 0 (0.0%) | 0 (0.0%) |
| Community & Social Service | 9 (32.1%) | 19 (67.9%) |
| Education, Arts & Media | 0 (0.0%) | 0 (0.0%) |
| Legal Services & Support | 0 (0.0%) | 0 (0.0%) |
| Education Instruction & Library | 0 (0.0%) | 19 (100.0%) |
| Arts, Media & Entertainment | 9 (100.0%) | 0 (0.0%) |
| Health Diagnosing & Treating | 0 (0.0%) | 83 (100.0%) |
| Health Technologists | 0 (0.0%) | 83 (100.0%) |
| Total (Category) | 33 (18.0%) | 150 (82.0%) |
| Total (Overall) | 132 (36.7%) | 228 (63.3%) |
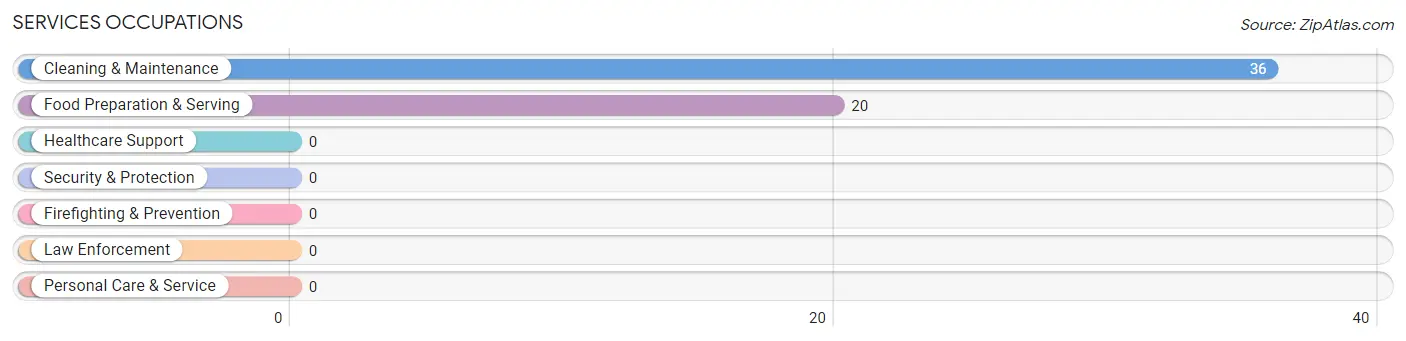
Services Occupations
The most common Services occupations in Arenas Valley are Cleaning & Maintenance (36 | 10.0%), and Food Preparation & Serving (20 | 5.6%).
Services Occupations by Sex
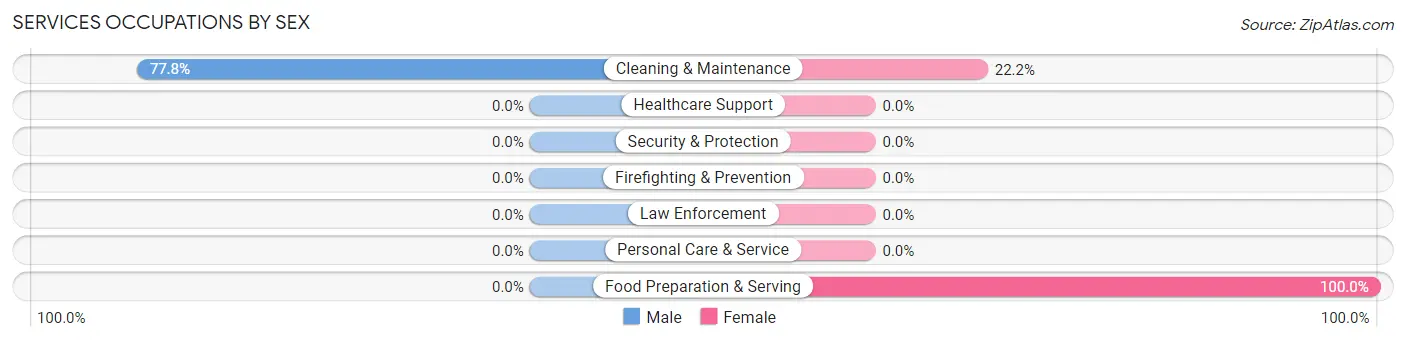
| Occupation | Male | Female |
| Healthcare Support | 0 (0.0%) | 0 (0.0%) |
| Security & Protection | 0 (0.0%) | 0 (0.0%) |
| Firefighting & Prevention | 0 (0.0%) | 0 (0.0%) |
| Law Enforcement | 0 (0.0%) | 0 (0.0%) |
| Food Preparation & Serving | 0 (0.0%) | 20 (100.0%) |
| Cleaning & Maintenance | 28 (77.8%) | 8 (22.2%) |
| Personal Care & Service | 0 (0.0%) | 0 (0.0%) |
| Total (Category) | 28 (50.0%) | 28 (50.0%) |
| Total (Overall) | 132 (36.7%) | 228 (63.3%) |
Sales and Office Occupations
The most common Sales and Office occupations in Arenas Valley are , and Office & Administration (50 | 13.9%).
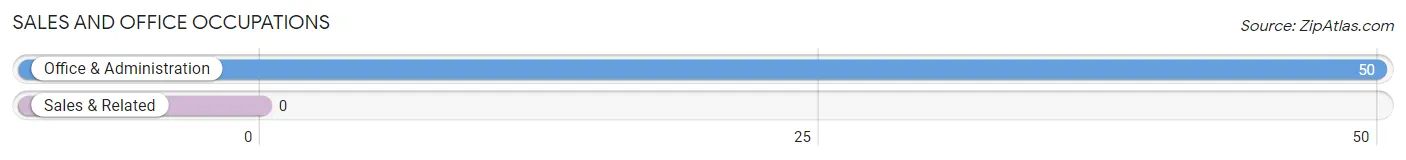
Sales and Office Occupations by Sex

| Occupation | Male | Female |
| Sales & Related | 0 (0.0%) | 0 (0.0%) |
| Office & Administration | 0 (0.0%) | 50 (100.0%) |
| Total (Category) | 0 (0.0%) | 50 (100.0%) |
| Total (Overall) | 132 (36.7%) | 228 (63.3%) |
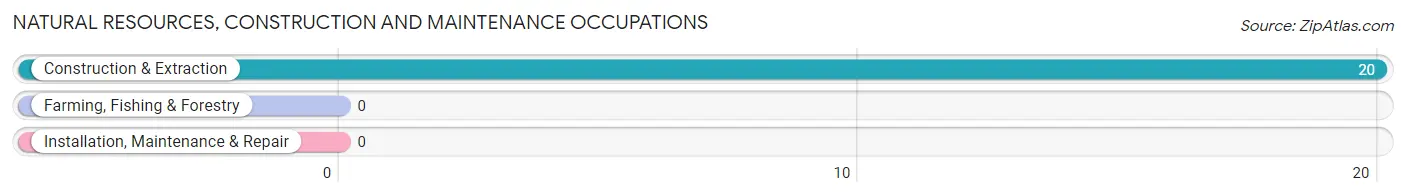
Natural Resources, Construction and Maintenance Occupations
The most common Natural Resources, Construction and Maintenance occupations in Arenas Valley are , and Construction & Extraction (20 | 5.6%).
Natural Resources, Construction and Maintenance Occupations by Sex
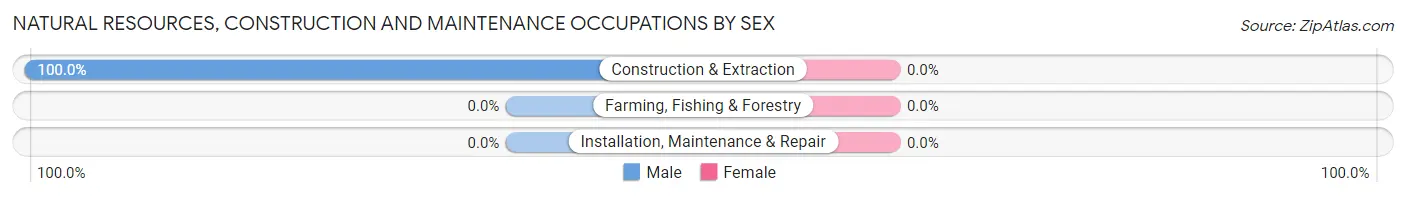
| Occupation | Male | Female |
| Farming, Fishing & Forestry | 0 (0.0%) | 0 (0.0%) |
| Construction & Extraction | 20 (100.0%) | 0 (0.0%) |
| Installation, Maintenance & Repair | 0 (0.0%) | 0 (0.0%) |
| Total (Category) | 20 (100.0%) | 0 (0.0%) |
| Total (Overall) | 132 (36.7%) | 228 (63.3%) |
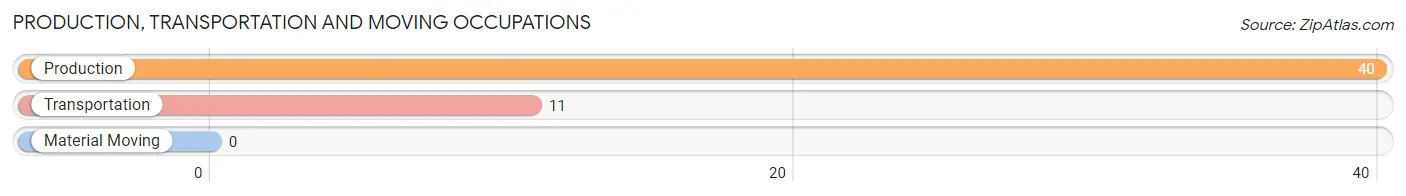
Production, Transportation and Moving Occupations
The most common Production, Transportation and Moving occupations in Arenas Valley are Production (40 | 11.1%), and Transportation (11 | 3.1%).
Production, Transportation and Moving Occupations by Sex
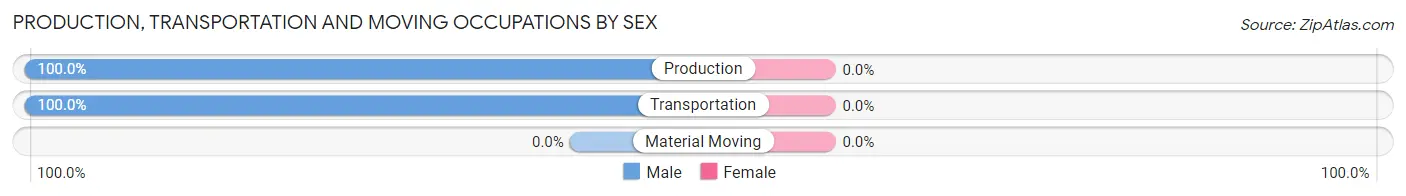
| Occupation | Male | Female |
| Production | 40 (100.0%) | 0 (0.0%) |
| Transportation | 11 (100.0%) | 0 (0.0%) |
| Material Moving | 0 (0.0%) | 0 (0.0%) |
| Total (Category) | 51 (100.0%) | 0 (0.0%) |
| Total (Overall) | 132 (36.7%) | 228 (63.3%) |
Employment Industries by Sex in Arenas Valley
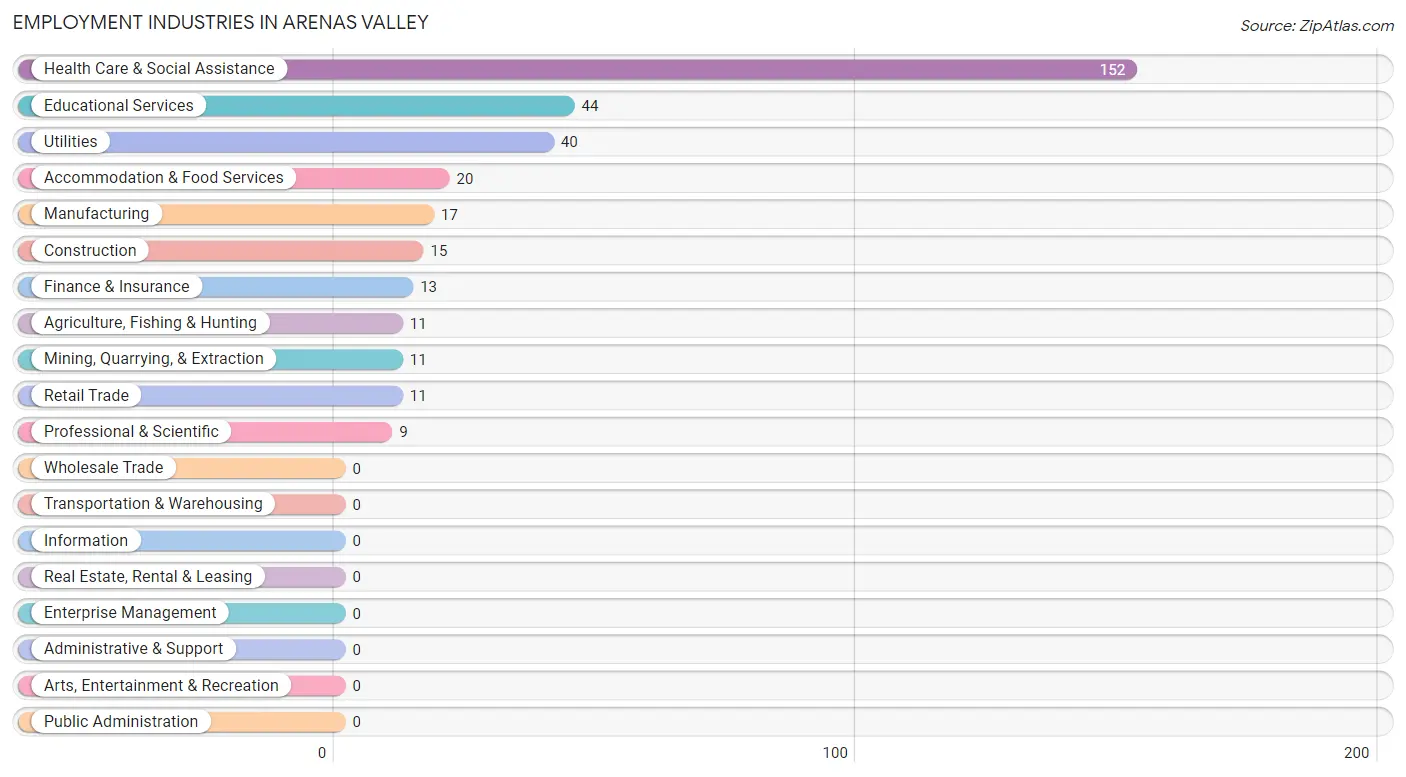
Employment Industries in Arenas Valley
The major employment industries in Arenas Valley include Health Care & Social Assistance (152 | 42.2%), Educational Services (44 | 12.2%), Utilities (40 | 11.1%), Accommodation & Food Services (20 | 5.6%), and Manufacturing (17 | 4.7%).
Employment Industries by Sex in Arenas Valley
The Arenas Valley industries that see more men than women are Mining, Quarrying, & Extraction (100.0%), Construction (100.0%), and Retail Trade (100.0%), whereas the industries that tend to have a higher number of women are Agriculture, Fishing & Hunting (100.0%), Manufacturing (100.0%), and Finance & Insurance (100.0%).
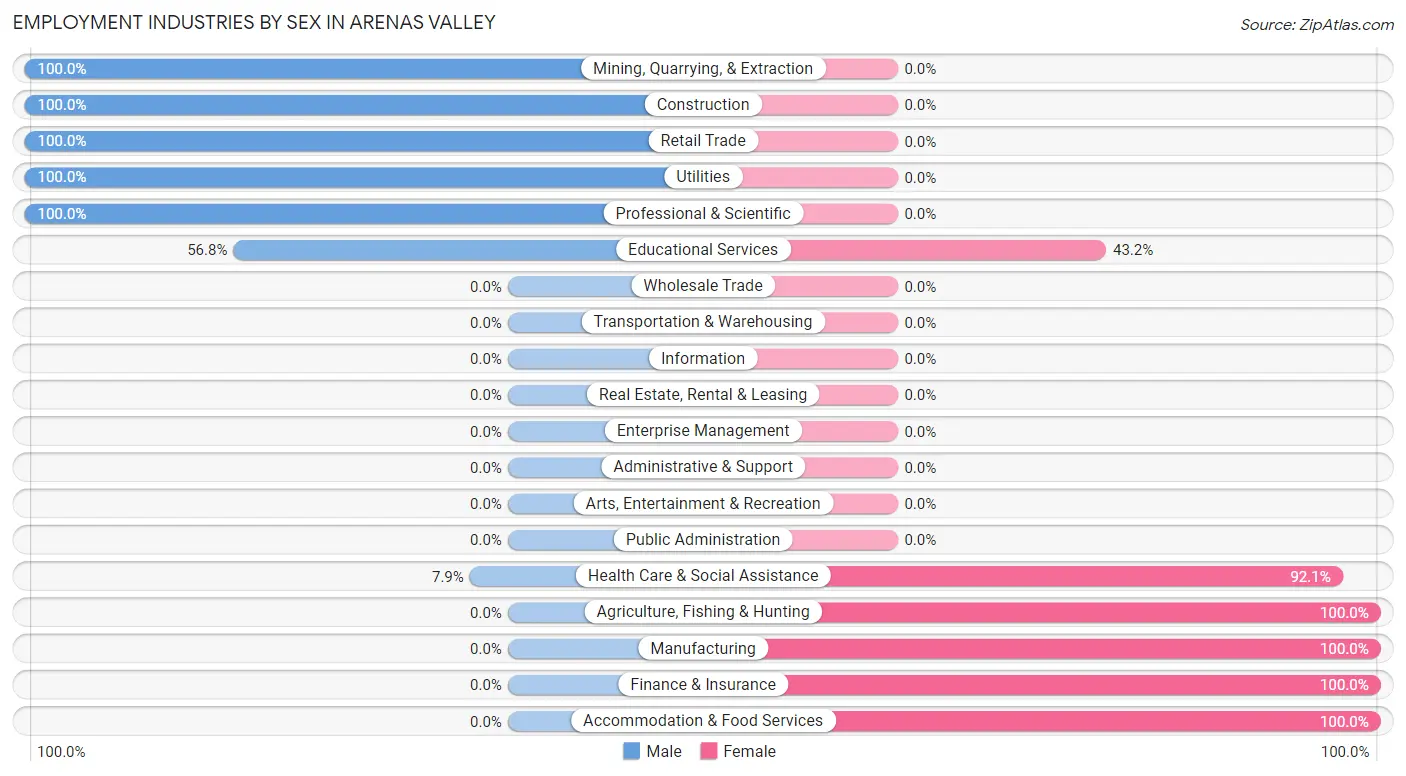
| Industry | Male | Female |
| Agriculture, Fishing & Hunting | 0 (0.0%) | 11 (100.0%) |
| Mining, Quarrying, & Extraction | 11 (100.0%) | 0 (0.0%) |
| Construction | 15 (100.0%) | 0 (0.0%) |
| Manufacturing | 0 (0.0%) | 17 (100.0%) |
| Wholesale Trade | 0 (0.0%) | 0 (0.0%) |
| Retail Trade | 11 (100.0%) | 0 (0.0%) |
| Transportation & Warehousing | 0 (0.0%) | 0 (0.0%) |
| Utilities | 40 (100.0%) | 0 (0.0%) |
| Information | 0 (0.0%) | 0 (0.0%) |
| Finance & Insurance | 0 (0.0%) | 13 (100.0%) |
| Real Estate, Rental & Leasing | 0 (0.0%) | 0 (0.0%) |
| Professional & Scientific | 9 (100.0%) | 0 (0.0%) |
| Enterprise Management | 0 (0.0%) | 0 (0.0%) |
| Administrative & Support | 0 (0.0%) | 0 (0.0%) |
| Educational Services | 25 (56.8%) | 19 (43.2%) |
| Health Care & Social Assistance | 12 (7.9%) | 140 (92.1%) |
| Arts, Entertainment & Recreation | 0 (0.0%) | 0 (0.0%) |
| Accommodation & Food Services | 0 (0.0%) | 20 (100.0%) |
| Public Administration | 0 (0.0%) | 0 (0.0%) |
| Total | 132 (36.7%) | 228 (63.3%) |
Education in Arenas Valley
School Enrollment in Arenas Valley
The most common levels of schooling among the 122 students in Arenas Valley are middle school (53 | 43.4%), college / undergraduate (37 | 30.3%), and elementary school (24 | 19.7%).
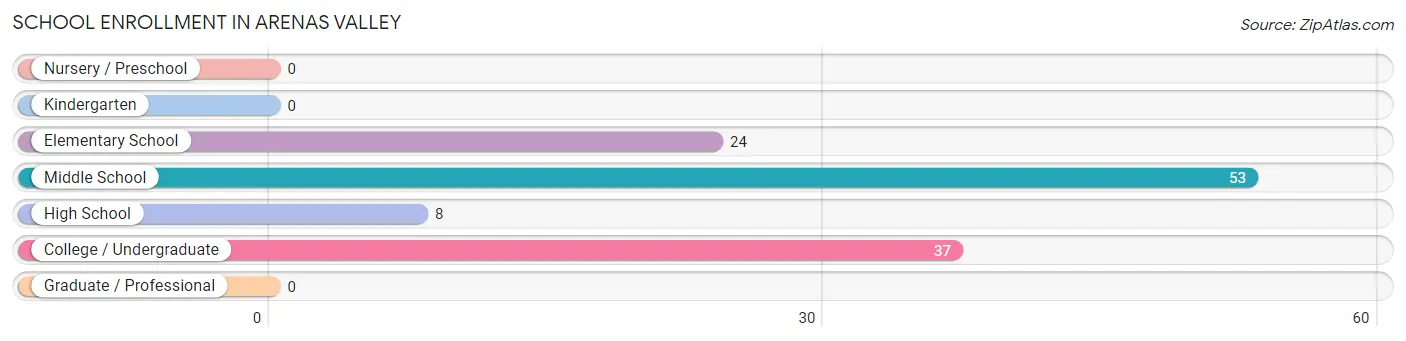
| School Level | # Students | % Students |
| Nursery / Preschool | 0 | 0.0% |
| Kindergarten | 0 | 0.0% |
| Elementary School | 24 | 19.7% |
| Middle School | 53 | 43.4% |
| High School | 8 | 6.6% |
| College / Undergraduate | 37 | 30.3% |
| Graduate / Professional | 0 | 0.0% |
| Total | 122 | 100.0% |
School Enrollment by Age by Funding Source in Arenas Valley
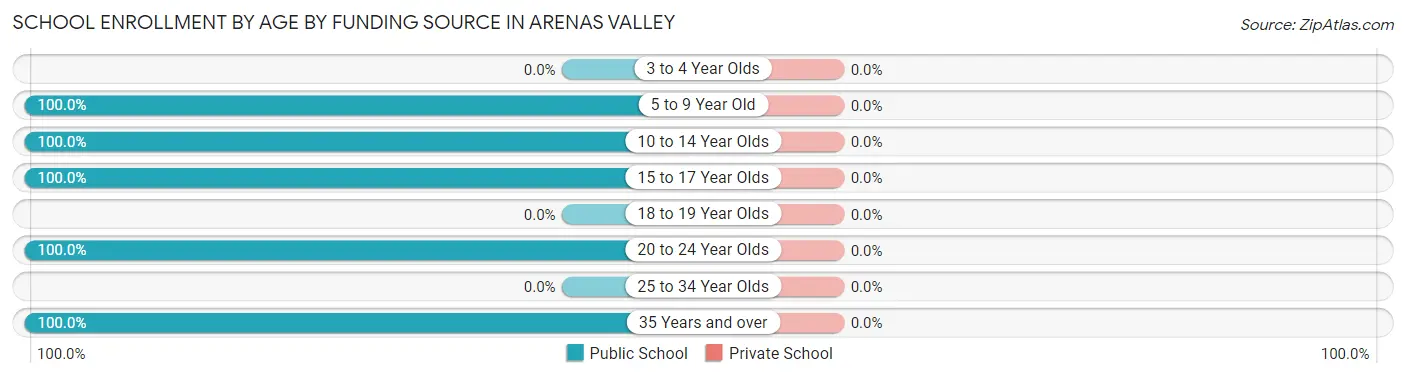
| Age Bracket | Public School | Private School |
| 3 to 4 Year Olds | 0 (0.0%) | 0 (0.0%) |
| 5 to 9 Year Old | 24 (100.0%) | 0 (0.0%) |
| 10 to 14 Year Olds | 53 (100.0%) | 0 (0.0%) |
| 15 to 17 Year Olds | 8 (100.0%) | 0 (0.0%) |
| 18 to 19 Year Olds | 0 (0.0%) | 0 (0.0%) |
| 20 to 24 Year Olds | 20 (100.0%) | 0 (0.0%) |
| 25 to 34 Year Olds | 0 (0.0%) | 0 (0.0%) |
| 35 Years and over | 17 (100.0%) | 0 (0.0%) |
| Total | 122 (100.0%) | 0 (0.0%) |
Educational Attainment by Field of Study in Arenas Valley
Science & technology (83 | 39.0%), business (52 | 24.4%), education (33 | 15.5%), visual & performing arts (17 | 8.0%), and social sciences (16 | 7.5%) are the most common fields of study among 213 individuals in Arenas Valley who have obtained a bachelor's degree or higher.
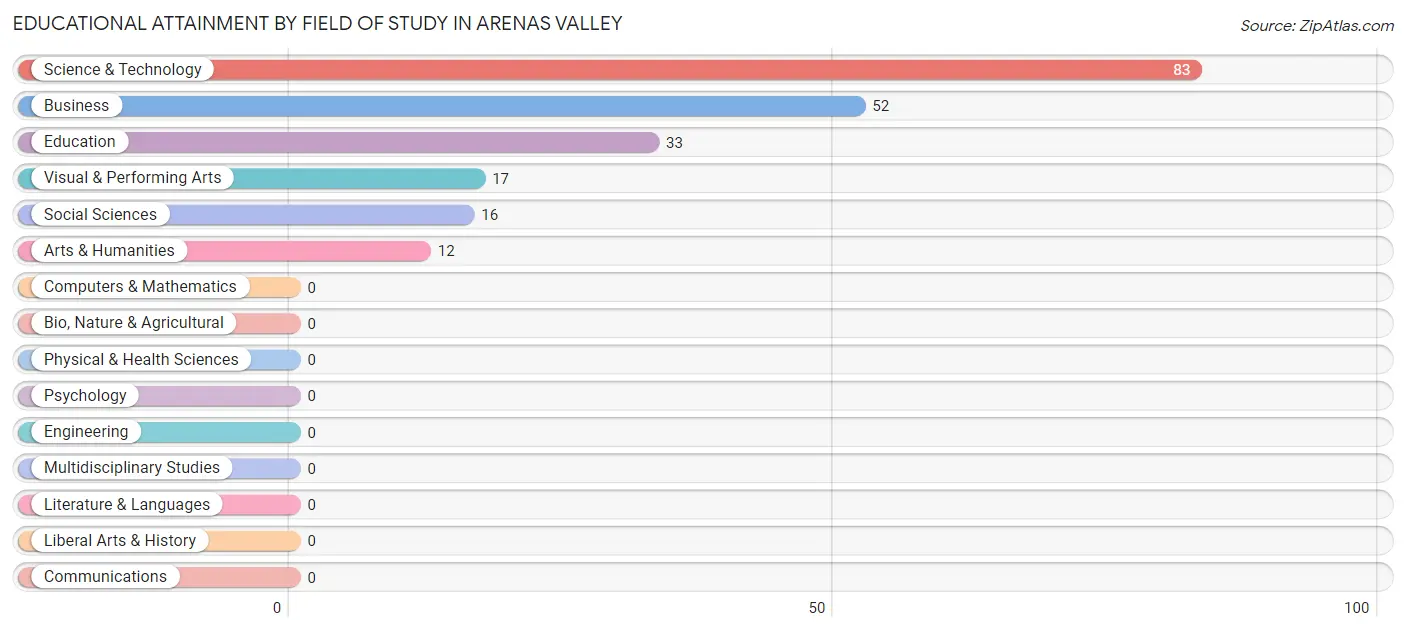
| Field of Study | # Graduates | % Graduates |
| Computers & Mathematics | 0 | 0.0% |
| Bio, Nature & Agricultural | 0 | 0.0% |
| Physical & Health Sciences | 0 | 0.0% |
| Psychology | 0 | 0.0% |
| Social Sciences | 16 | 7.5% |
| Engineering | 0 | 0.0% |
| Multidisciplinary Studies | 0 | 0.0% |
| Science & Technology | 83 | 39.0% |
| Business | 52 | 24.4% |
| Education | 33 | 15.5% |
| Literature & Languages | 0 | 0.0% |
| Liberal Arts & History | 0 | 0.0% |
| Visual & Performing Arts | 17 | 8.0% |
| Communications | 0 | 0.0% |
| Arts & Humanities | 12 | 5.6% |
| Total | 213 | 100.0% |
Transportation & Commute in Arenas Valley
Vehicle Availability by Sex in Arenas Valley
The most prevalent vehicle ownership categories in Arenas Valley are males with 2 vehicles (64, accounting for 48.5%) and females with 2 vehicles (150, making up 28.1%).
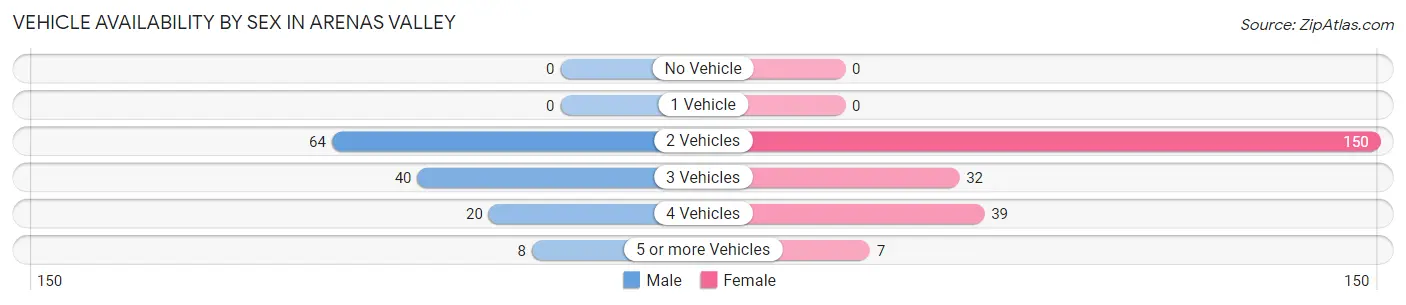
| Vehicles Available | Male | Female |
| No Vehicle | 0 (0.0%) | 0 (0.0%) |
| 1 Vehicle | 0 (0.0%) | 0 (0.0%) |
| 2 Vehicles | 64 (48.5%) | 150 (65.8%) |
| 3 Vehicles | 40 (30.3%) | 32 (14.0%) |
| 4 Vehicles | 20 (15.1%) | 39 (17.1%) |
| 5 or more Vehicles | 8 (6.1%) | 7 (3.1%) |
| Total | 132 (100.0%) | 228 (100.0%) |
Commute Time in Arenas Valley
The most frequently occuring commute durations in Arenas Valley are 10 to 14 minutes (121 commuters, 36.9%), 15 to 19 minutes (72 commuters, 22.0%), and 90 or more minutes (47 commuters, 14.3%).
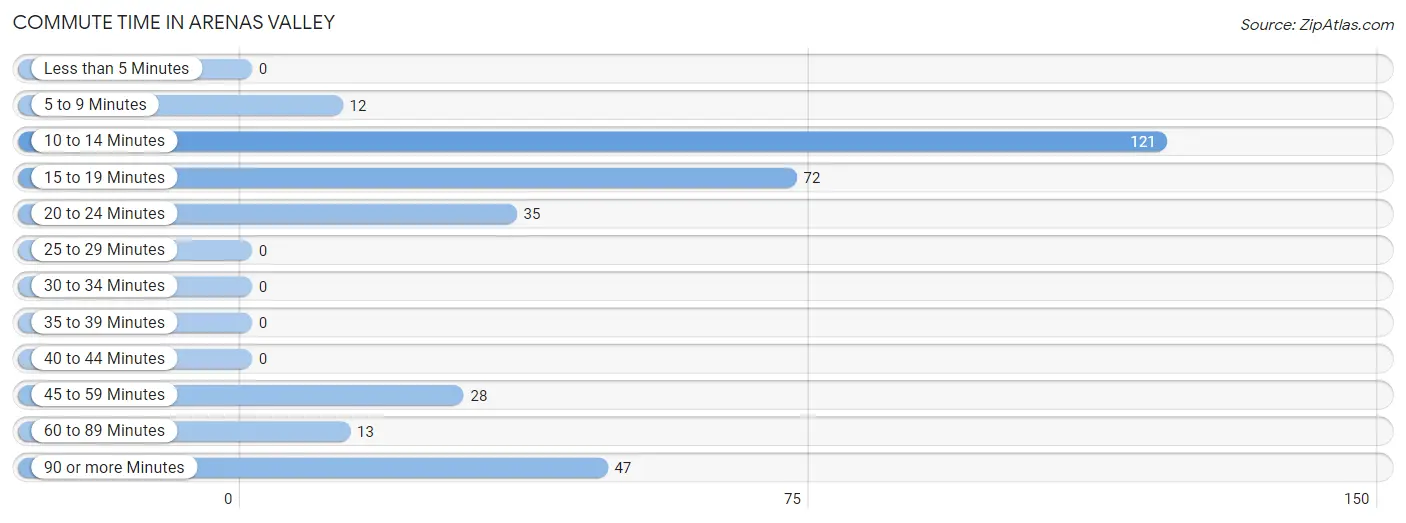
| Commute Time | # Commuters | % Commuters |
| Less than 5 Minutes | 0 | 0.0% |
| 5 to 9 Minutes | 12 | 3.7% |
| 10 to 14 Minutes | 121 | 36.9% |
| 15 to 19 Minutes | 72 | 22.0% |
| 20 to 24 Minutes | 35 | 10.7% |
| 25 to 29 Minutes | 0 | 0.0% |
| 30 to 34 Minutes | 0 | 0.0% |
| 35 to 39 Minutes | 0 | 0.0% |
| 40 to 44 Minutes | 0 | 0.0% |
| 45 to 59 Minutes | 28 | 8.5% |
| 60 to 89 Minutes | 13 | 4.0% |
| 90 or more Minutes | 47 | 14.3% |
Commute Time by Sex in Arenas Valley
The most common commute times in Arenas Valley are 90 or more minutes (47 commuters, 35.6%) for males and 10 to 14 minutes (101 commuters, 51.5%) for females.
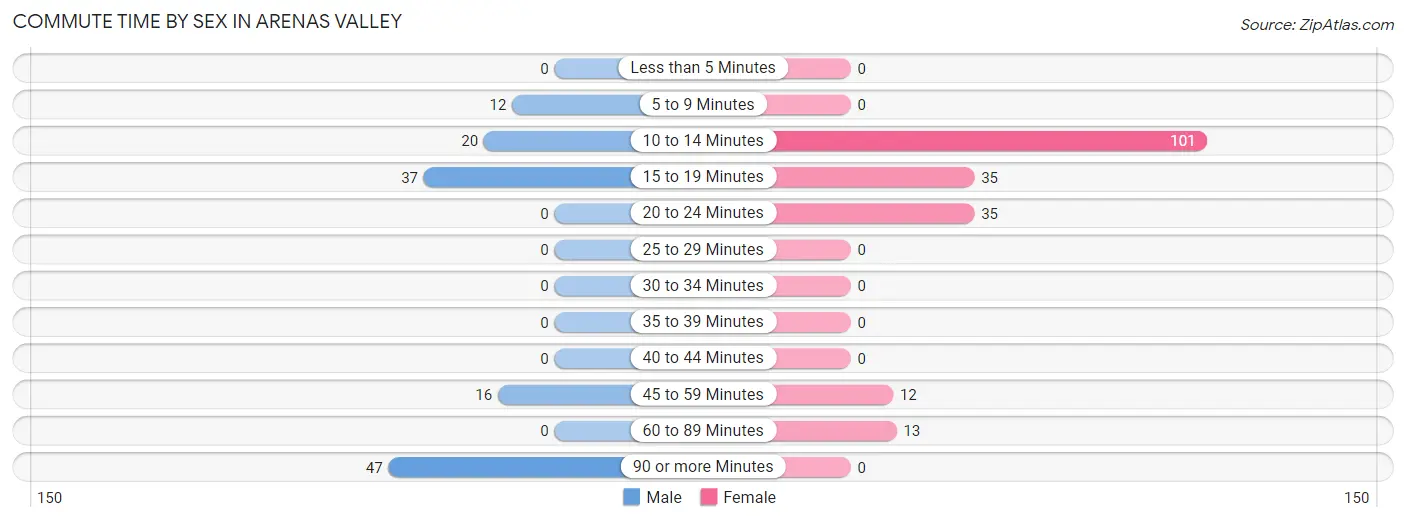
| Commute Time | Male | Female |
| Less than 5 Minutes | 0 (0.0%) | 0 (0.0%) |
| 5 to 9 Minutes | 12 (9.1%) | 0 (0.0%) |
| 10 to 14 Minutes | 20 (15.1%) | 101 (51.5%) |
| 15 to 19 Minutes | 37 (28.0%) | 35 (17.9%) |
| 20 to 24 Minutes | 0 (0.0%) | 35 (17.9%) |
| 25 to 29 Minutes | 0 (0.0%) | 0 (0.0%) |
| 30 to 34 Minutes | 0 (0.0%) | 0 (0.0%) |
| 35 to 39 Minutes | 0 (0.0%) | 0 (0.0%) |
| 40 to 44 Minutes | 0 (0.0%) | 0 (0.0%) |
| 45 to 59 Minutes | 16 (12.1%) | 12 (6.1%) |
| 60 to 89 Minutes | 0 (0.0%) | 13 (6.6%) |
| 90 or more Minutes | 47 (35.6%) | 0 (0.0%) |
Time of Departure to Work by Sex in Arenas Valley
The most frequent times of departure to work in Arenas Valley are 12:00 AM to 4:59 AM (47, 35.6%) for males and 8:00 AM to 8:29 AM (83, 42.3%) for females.
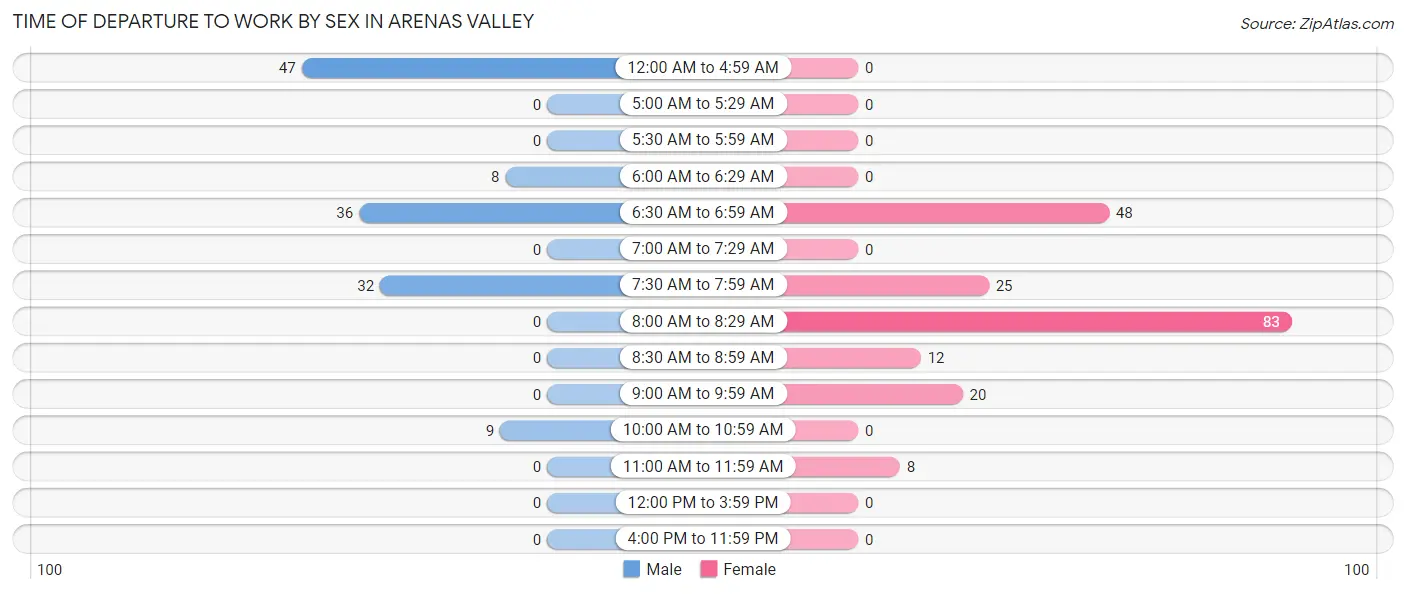
| Time of Departure | Male | Female |
| 12:00 AM to 4:59 AM | 47 (35.6%) | 0 (0.0%) |
| 5:00 AM to 5:29 AM | 0 (0.0%) | 0 (0.0%) |
| 5:30 AM to 5:59 AM | 0 (0.0%) | 0 (0.0%) |
| 6:00 AM to 6:29 AM | 8 (6.1%) | 0 (0.0%) |
| 6:30 AM to 6:59 AM | 36 (27.3%) | 48 (24.5%) |
| 7:00 AM to 7:29 AM | 0 (0.0%) | 0 (0.0%) |
| 7:30 AM to 7:59 AM | 32 (24.2%) | 25 (12.8%) |
| 8:00 AM to 8:29 AM | 0 (0.0%) | 83 (42.3%) |
| 8:30 AM to 8:59 AM | 0 (0.0%) | 12 (6.1%) |
| 9:00 AM to 9:59 AM | 0 (0.0%) | 20 (10.2%) |
| 10:00 AM to 10:59 AM | 9 (6.8%) | 0 (0.0%) |
| 11:00 AM to 11:59 AM | 0 (0.0%) | 8 (4.1%) |
| 12:00 PM to 3:59 PM | 0 (0.0%) | 0 (0.0%) |
| 4:00 PM to 11:59 PM | 0 (0.0%) | 0 (0.0%) |
| Total | 132 (100.0%) | 196 (100.0%) |
Housing Occupancy in Arenas Valley
Occupancy by Ownership in Arenas Valley
Of the total 409 dwellings in Arenas Valley, owner-occupied units account for 335 (81.9%), while renter-occupied units make up 74 (18.1%).
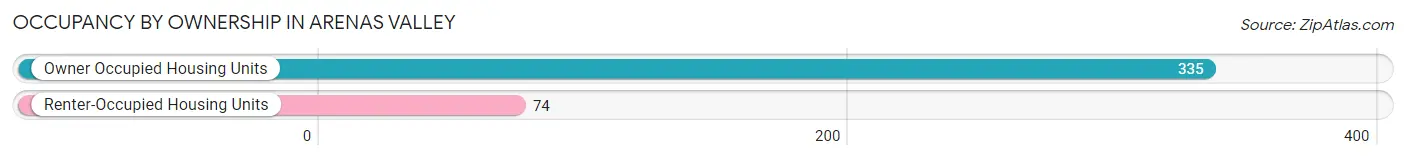
| Occupancy | # Housing Units | % Housing Units |
| Owner Occupied Housing Units | 335 | 81.9% |
| Renter-Occupied Housing Units | 74 | 18.1% |
| Total Occupied Housing Units | 409 | 100.0% |
Occupancy by Household Size in Arenas Valley
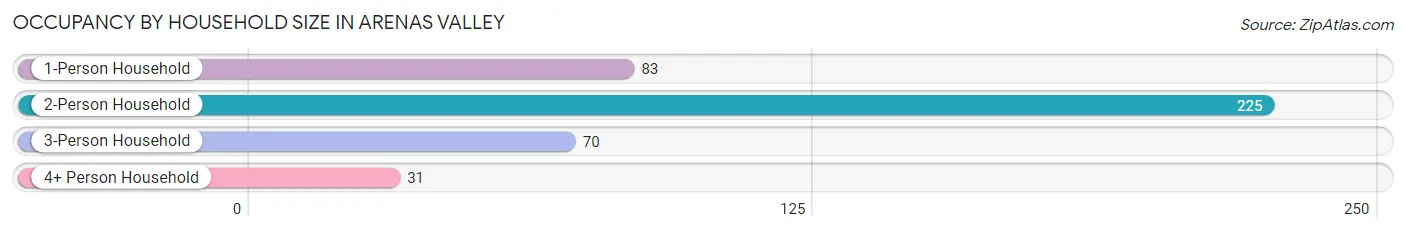
| Household Size | # Housing Units | % Housing Units |
| 1-Person Household | 83 | 20.3% |
| 2-Person Household | 225 | 55.0% |
| 3-Person Household | 70 | 17.1% |
| 4+ Person Household | 31 | 7.6% |
| Total Housing Units | 409 | 100.0% |
Occupancy by Ownership by Household Size in Arenas Valley
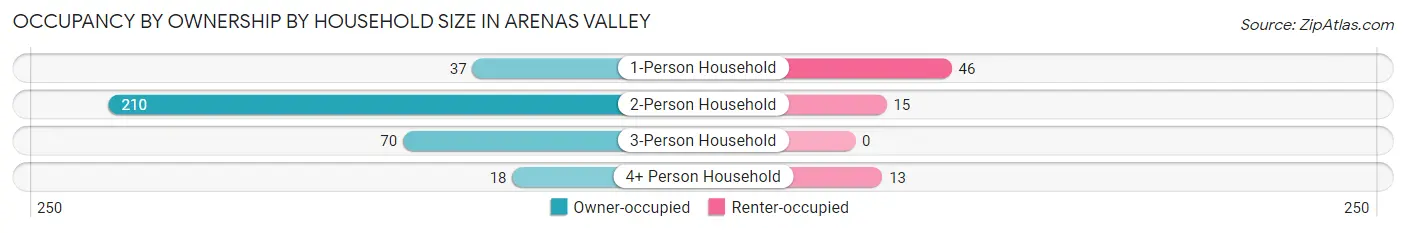
| Household Size | Owner-occupied | Renter-occupied |
| 1-Person Household | 37 (44.6%) | 46 (55.4%) |
| 2-Person Household | 210 (93.3%) | 15 (6.7%) |
| 3-Person Household | 70 (100.0%) | 0 (0.0%) |
| 4+ Person Household | 18 (58.1%) | 13 (41.9%) |
| Total Housing Units | 335 (81.9%) | 74 (18.1%) |
Occupancy by Educational Attainment in Arenas Valley
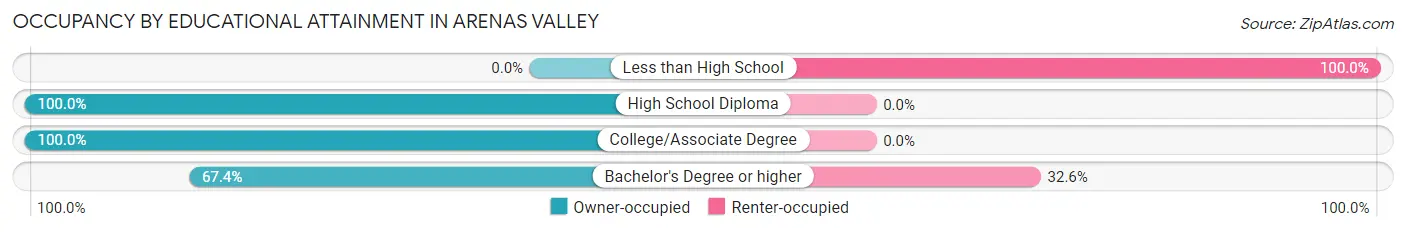
| Household Size | Owner-occupied | Renter-occupied |
| Less than High School | 0 (0.0%) | 15 (100.0%) |
| High School Diploma | 36 (100.0%) | 0 (0.0%) |
| College/Associate Degree | 177 (100.0%) | 0 (0.0%) |
| Bachelor's Degree or higher | 122 (67.4%) | 59 (32.6%) |
Occupancy by Age of Householder in Arenas Valley
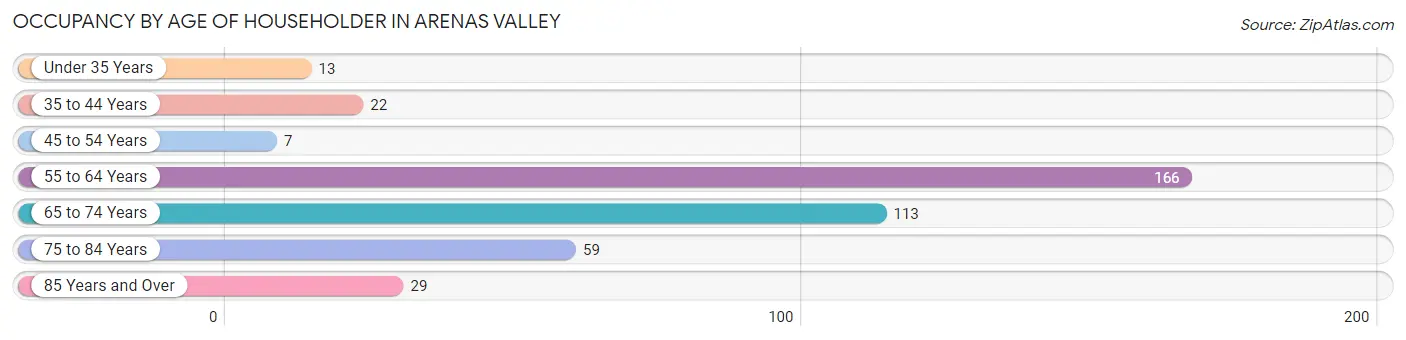
| Age Bracket | # Households | % Households |
| Under 35 Years | 13 | 3.2% |
| 35 to 44 Years | 22 | 5.4% |
| 45 to 54 Years | 7 | 1.7% |
| 55 to 64 Years | 166 | 40.6% |
| 65 to 74 Years | 113 | 27.6% |
| 75 to 84 Years | 59 | 14.4% |
| 85 Years and Over | 29 | 7.1% |
| Total | 409 | 100.0% |
Housing Finances in Arenas Valley
Median Income by Occupancy in Arenas Valley
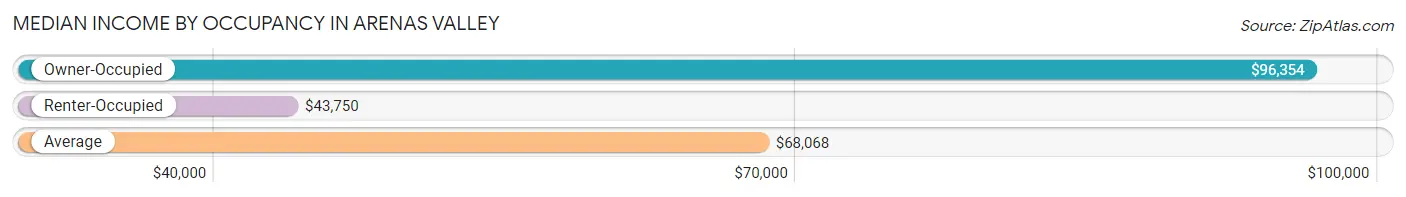
| Occupancy Type | # Households | Median Income |
| Owner-Occupied | 335 (81.9%) | $96,354 |
| Renter-Occupied | 74 (18.1%) | $43,750 |
| Average | 409 (100.0%) | $68,068 |
Occupancy by Householder Income Bracket in Arenas Valley
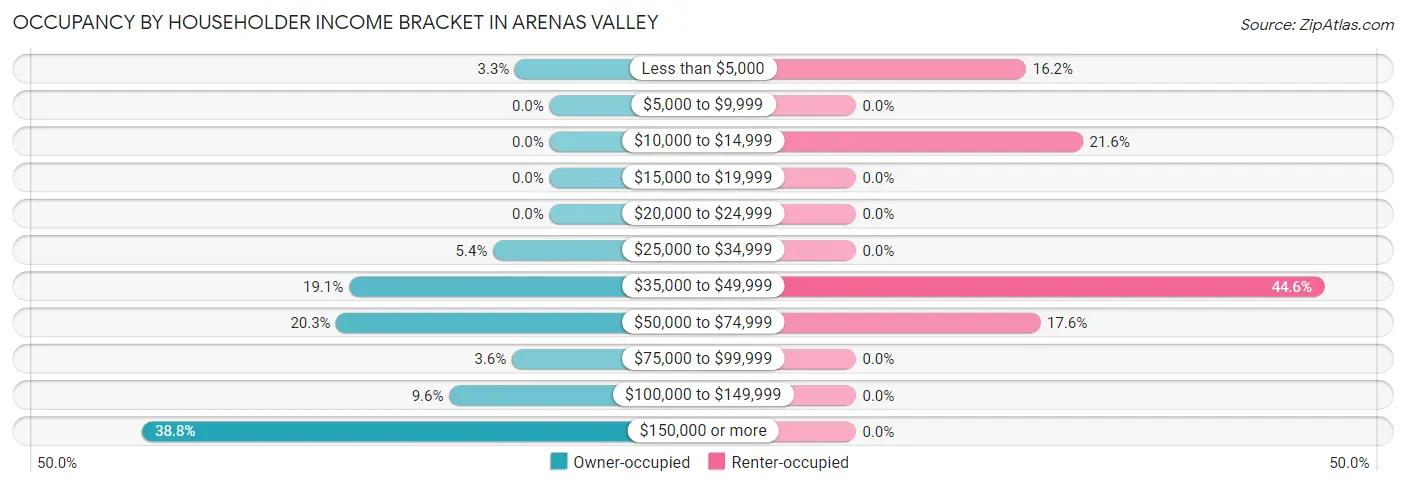
| Income Bracket | Owner-occupied | Renter-occupied |
| Less than $5,000 | 11 (3.3%) | 12 (16.2%) |
| $5,000 to $9,999 | 0 (0.0%) | 0 (0.0%) |
| $10,000 to $14,999 | 0 (0.0%) | 16 (21.6%) |
| $15,000 to $19,999 | 0 (0.0%) | 0 (0.0%) |
| $20,000 to $24,999 | 0 (0.0%) | 0 (0.0%) |
| $25,000 to $34,999 | 18 (5.4%) | 0 (0.0%) |
| $35,000 to $49,999 | 64 (19.1%) | 33 (44.6%) |
| $50,000 to $74,999 | 68 (20.3%) | 13 (17.6%) |
| $75,000 to $99,999 | 12 (3.6%) | 0 (0.0%) |
| $100,000 to $149,999 | 32 (9.6%) | 0 (0.0%) |
| $150,000 or more | 130 (38.8%) | 0 (0.0%) |
| Total | 335 (100.0%) | 74 (100.0%) |
Monthly Housing Cost Tiers in Arenas Valley
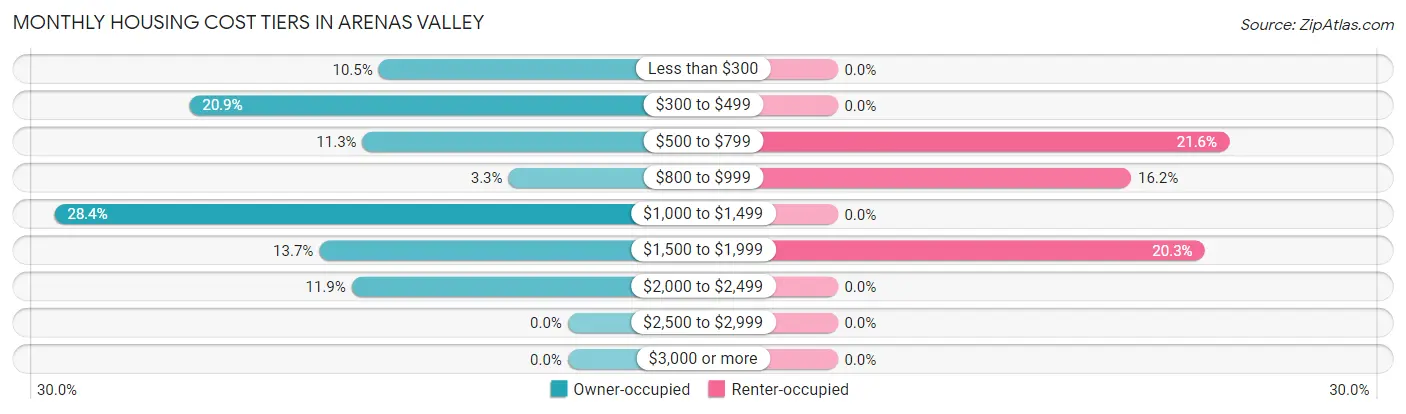
| Monthly Cost | Owner-occupied | Renter-occupied |
| Less than $300 | 35 (10.4%) | 0 (0.0%) |
| $300 to $499 | 70 (20.9%) | 0 (0.0%) |
| $500 to $799 | 38 (11.3%) | 16 (21.6%) |
| $800 to $999 | 11 (3.3%) | 12 (16.2%) |
| $1,000 to $1,499 | 95 (28.4%) | 0 (0.0%) |
| $1,500 to $1,999 | 46 (13.7%) | 15 (20.3%) |
| $2,000 to $2,499 | 40 (11.9%) | 0 (0.0%) |
| $2,500 to $2,999 | 0 (0.0%) | 0 (0.0%) |
| $3,000 or more | 0 (0.0%) | 0 (0.0%) |
| Total | 335 (100.0%) | 74 (100.0%) |
Physical Housing Characteristics in Arenas Valley
Housing Structures in Arenas Valley
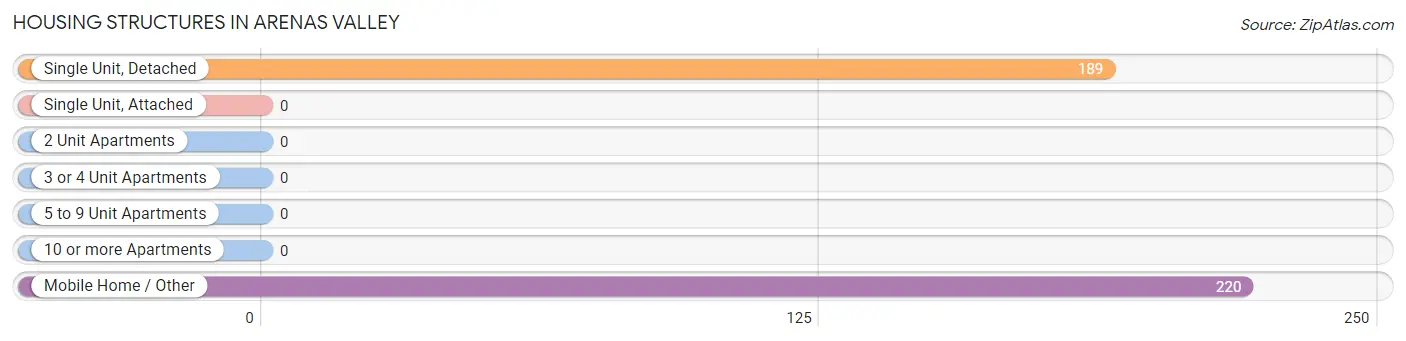
| Structure Type | # Housing Units | % Housing Units |
| Single Unit, Detached | 189 | 46.2% |
| Single Unit, Attached | 0 | 0.0% |
| 2 Unit Apartments | 0 | 0.0% |
| 3 or 4 Unit Apartments | 0 | 0.0% |
| 5 to 9 Unit Apartments | 0 | 0.0% |
| 10 or more Apartments | 0 | 0.0% |
| Mobile Home / Other | 220 | 53.8% |
| Total | 409 | 100.0% |
Housing Structures by Occupancy in Arenas Valley
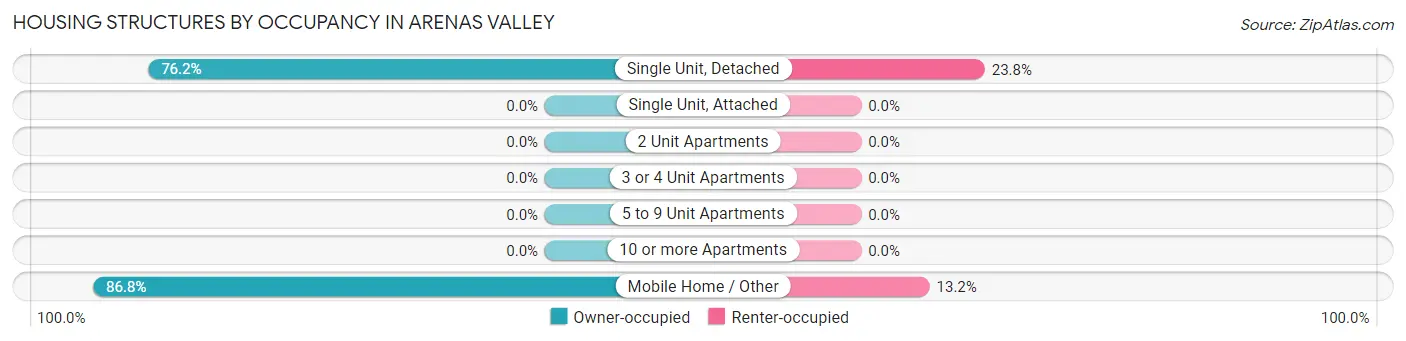
| Structure Type | Owner-occupied | Renter-occupied |
| Single Unit, Detached | 144 (76.2%) | 45 (23.8%) |
| Single Unit, Attached | 0 (0.0%) | 0 (0.0%) |
| 2 Unit Apartments | 0 (0.0%) | 0 (0.0%) |
| 3 or 4 Unit Apartments | 0 (0.0%) | 0 (0.0%) |
| 5 to 9 Unit Apartments | 0 (0.0%) | 0 (0.0%) |
| 10 or more Apartments | 0 (0.0%) | 0 (0.0%) |
| Mobile Home / Other | 191 (86.8%) | 29 (13.2%) |
| Total | 335 (81.9%) | 74 (18.1%) |
Housing Structures by Number of Rooms in Arenas Valley
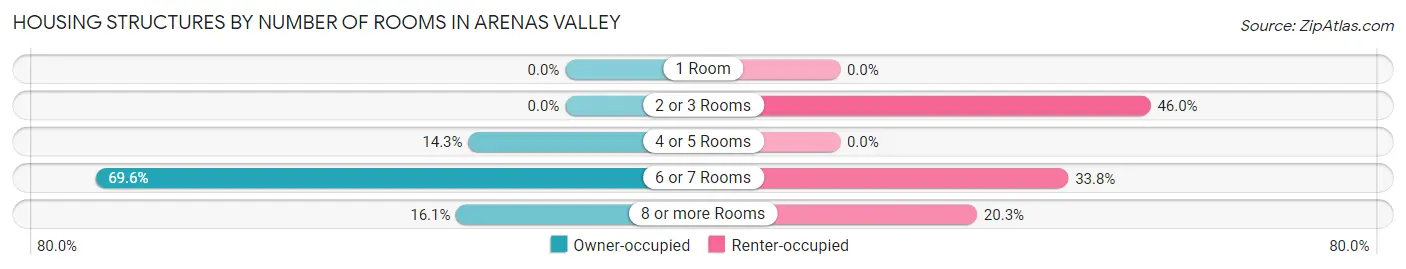
| Number of Rooms | Owner-occupied | Renter-occupied |
| 1 Room | 0 (0.0%) | 0 (0.0%) |
| 2 or 3 Rooms | 0 (0.0%) | 34 (46.0%) |
| 4 or 5 Rooms | 48 (14.3%) | 0 (0.0%) |
| 6 or 7 Rooms | 233 (69.6%) | 25 (33.8%) |
| 8 or more Rooms | 54 (16.1%) | 15 (20.3%) |
| Total | 335 (100.0%) | 74 (100.0%) |
Housing Structure by Heating Type in Arenas Valley
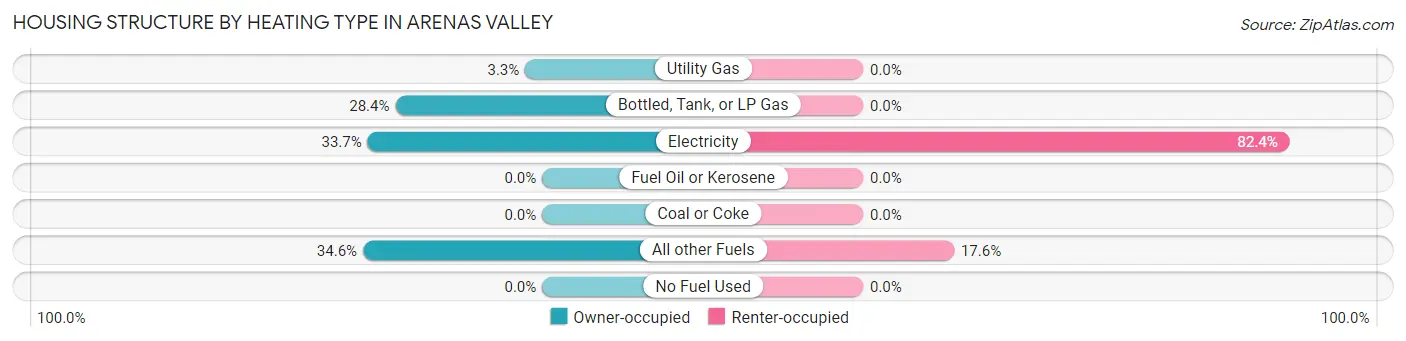
| Heating Type | Owner-occupied | Renter-occupied |
| Utility Gas | 11 (3.3%) | 0 (0.0%) |
| Bottled, Tank, or LP Gas | 95 (28.4%) | 0 (0.0%) |
| Electricity | 113 (33.7%) | 61 (82.4%) |
| Fuel Oil or Kerosene | 0 (0.0%) | 0 (0.0%) |
| Coal or Coke | 0 (0.0%) | 0 (0.0%) |
| All other Fuels | 116 (34.6%) | 13 (17.6%) |
| No Fuel Used | 0 (0.0%) | 0 (0.0%) |
| Total | 335 (100.0%) | 74 (100.0%) |
Household Vehicle Usage in Arenas Valley
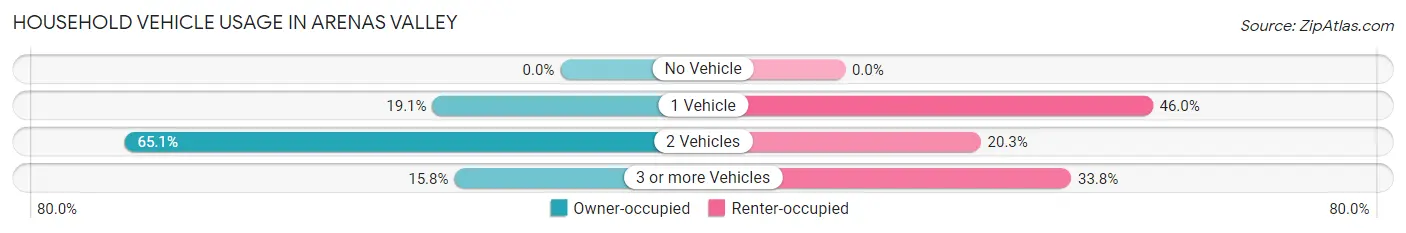
| Vehicles per Household | Owner-occupied | Renter-occupied |
| No Vehicle | 0 (0.0%) | 0 (0.0%) |
| 1 Vehicle | 64 (19.1%) | 34 (46.0%) |
| 2 Vehicles | 218 (65.1%) | 15 (20.3%) |
| 3 or more Vehicles | 53 (15.8%) | 25 (33.8%) |
| Total | 335 (100.0%) | 74 (100.0%) |
Real Estate & Mortgages in Arenas Valley
Real Estate and Mortgage Overview in Arenas Valley
| Characteristic | Without Mortgage | With Mortgage |
| Housing Units | 127 | 208 |
| Median Property Value | $255,900 | $172,900 |
| Median Household Income | $65,393 | $123 |
| Monthly Housing Costs | $399 | $0 |
| Real Estate Taxes | $832 | $7 |
Property Value by Mortgage Status in Arenas Valley
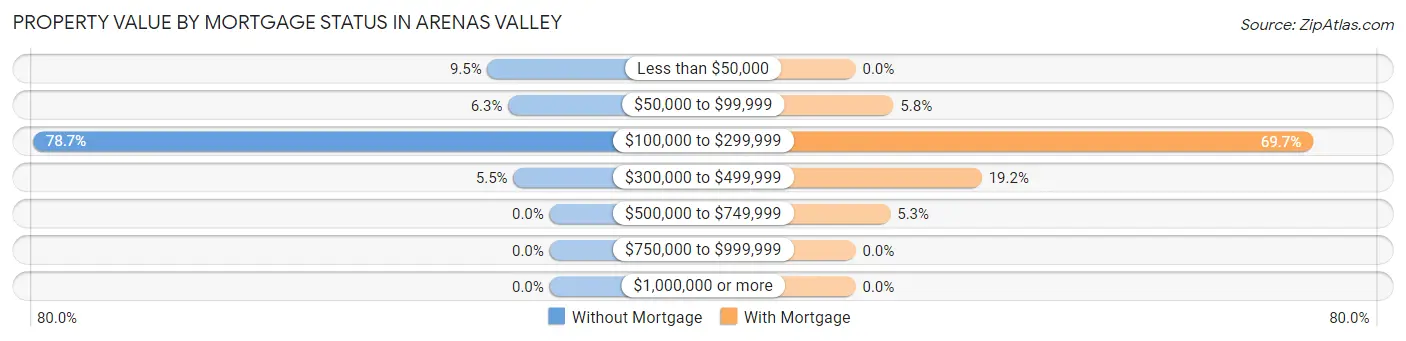
| Property Value | Without Mortgage | With Mortgage |
| Less than $50,000 | 12 (9.5%) | 0 (0.0%) |
| $50,000 to $99,999 | 8 (6.3%) | 12 (5.8%) |
| $100,000 to $299,999 | 100 (78.7%) | 145 (69.7%) |
| $300,000 to $499,999 | 7 (5.5%) | 40 (19.2%) |
| $500,000 to $749,999 | 0 (0.0%) | 11 (5.3%) |
| $750,000 to $999,999 | 0 (0.0%) | 0 (0.0%) |
| $1,000,000 or more | 0 (0.0%) | 0 (0.0%) |
| Total | 127 (100.0%) | 208 (100.0%) |
Household Income by Mortgage Status in Arenas Valley
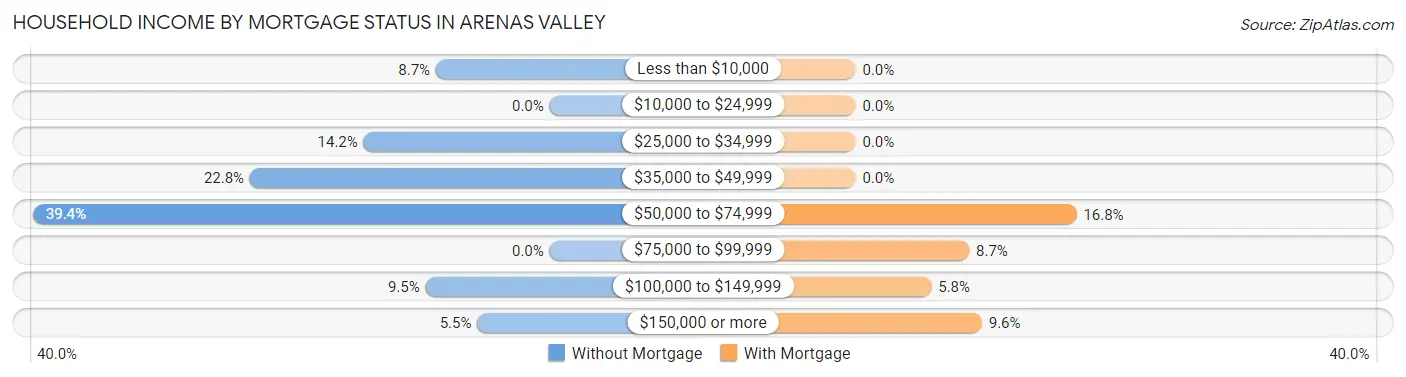
| Household Income | Without Mortgage | With Mortgage |
| Less than $10,000 | 11 (8.7%) | 0 (0.0%) |
| $10,000 to $24,999 | 0 (0.0%) | 0 (0.0%) |
| $25,000 to $34,999 | 18 (14.2%) | 0 (0.0%) |
| $35,000 to $49,999 | 29 (22.8%) | 0 (0.0%) |
| $50,000 to $74,999 | 50 (39.4%) | 35 (16.8%) |
| $75,000 to $99,999 | 0 (0.0%) | 18 (8.6%) |
| $100,000 to $149,999 | 12 (9.5%) | 12 (5.8%) |
| $150,000 or more | 7 (5.5%) | 20 (9.6%) |
| Total | 127 (100.0%) | 208 (100.0%) |
Property Value to Household Income Ratio in Arenas Valley
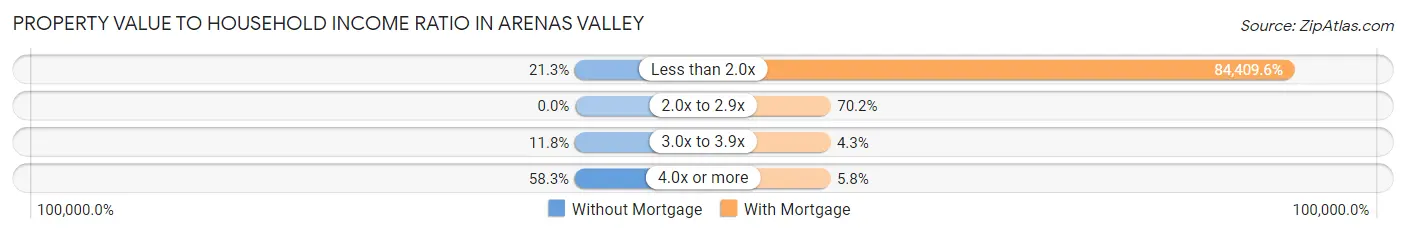
| Value-to-Income Ratio | Without Mortgage | With Mortgage |
| Less than 2.0x | 27 (21.3%) | 175,572 (84,409.6%) |
| 2.0x to 2.9x | 0 (0.0%) | 146 (70.2%) |
| 3.0x to 3.9x | 15 (11.8%) | 9 (4.3%) |
| 4.0x or more | 74 (58.3%) | 12 (5.8%) |
| Total | 127 (100.0%) | 208 (100.0%) |
Real Estate Taxes by Mortgage Status in Arenas Valley
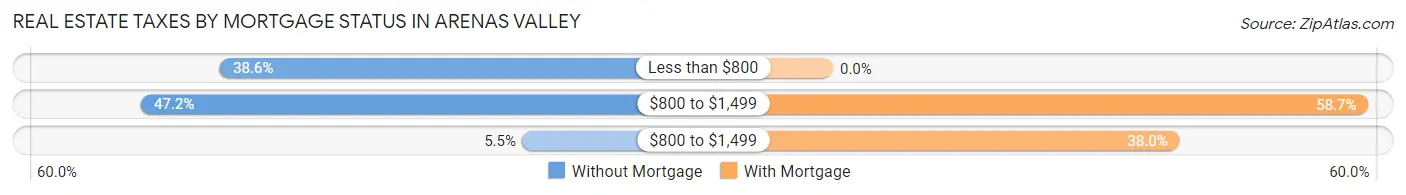
| Property Taxes | Without Mortgage | With Mortgage |
| Less than $800 | 49 (38.6%) | 0 (0.0%) |
| $800 to $1,499 | 60 (47.2%) | 122 (58.7%) |
| $800 to $1,499 | 7 (5.5%) | 79 (38.0%) |
| Total | 127 (100.0%) | 208 (100.0%) |
Health & Disability in Arenas Valley
Health Insurance Coverage by Age in Arenas Valley
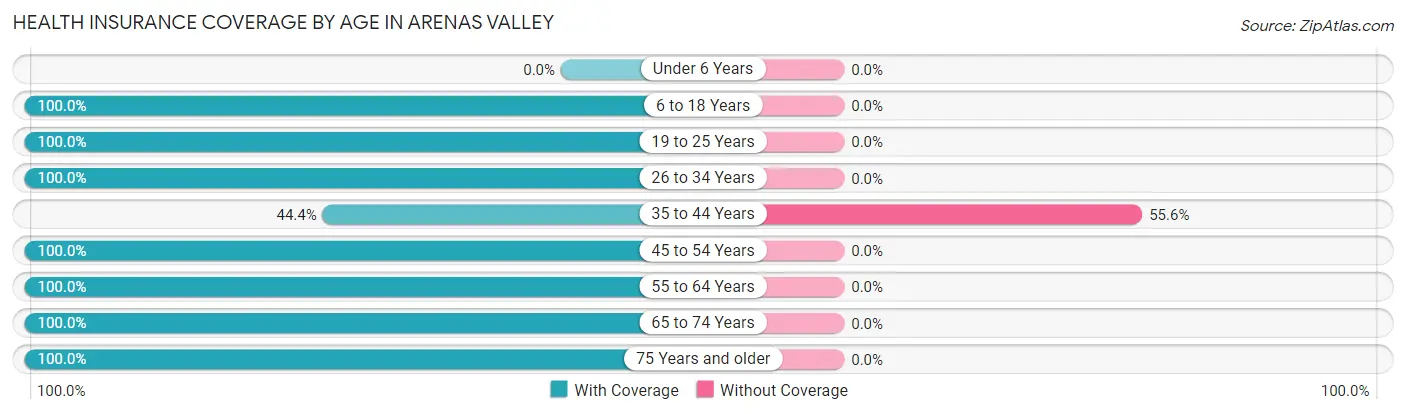
| Age Bracket | With Coverage | Without Coverage |
| Under 6 Years | 0 (0.0%) | 0 (0.0%) |
| 6 to 18 Years | 104 (100.0%) | 0 (0.0%) |
| 19 to 25 Years | 40 (100.0%) | 0 (0.0%) |
| 26 to 34 Years | 13 (100.0%) | 0 (0.0%) |
| 35 to 44 Years | 64 (44.4%) | 80 (55.6%) |
| 45 to 54 Years | 24 (100.0%) | 0 (0.0%) |
| 55 to 64 Years | 181 (100.0%) | 0 (0.0%) |
| 65 to 74 Years | 229 (100.0%) | 0 (0.0%) |
| 75 Years and older | 325 (100.0%) | 0 (0.0%) |
| Total | 980 (92.4%) | 80 (7.5%) |
Health Insurance Coverage by Citizenship Status in Arenas Valley

| Citizenship Status | With Coverage | Without Coverage |
| Native Born | 0 (0.0%) | 0 (0.0%) |
| Foreign Born, Citizen | 104 (100.0%) | 0 (0.0%) |
| Foreign Born, not a Citizen | 40 (100.0%) | 0 (0.0%) |
Health Insurance Coverage by Household Income in Arenas Valley
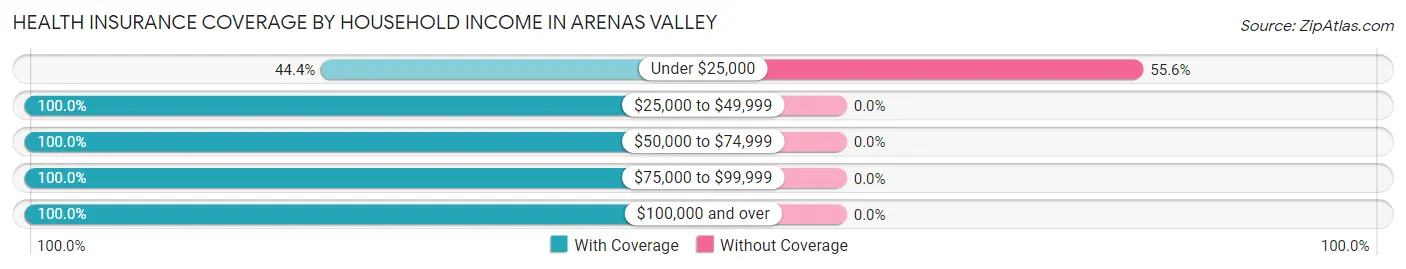
| Household Income | With Coverage | Without Coverage |
| Under $25,000 | 64 (44.4%) | 80 (55.6%) |
| $25,000 to $49,999 | 182 (100.0%) | 0 (0.0%) |
| $50,000 to $74,999 | 259 (100.0%) | 0 (0.0%) |
| $75,000 to $99,999 | 33 (100.0%) | 0 (0.0%) |
| $100,000 and over | 442 (100.0%) | 0 (0.0%) |
Public vs Private Health Insurance Coverage by Age in Arenas Valley
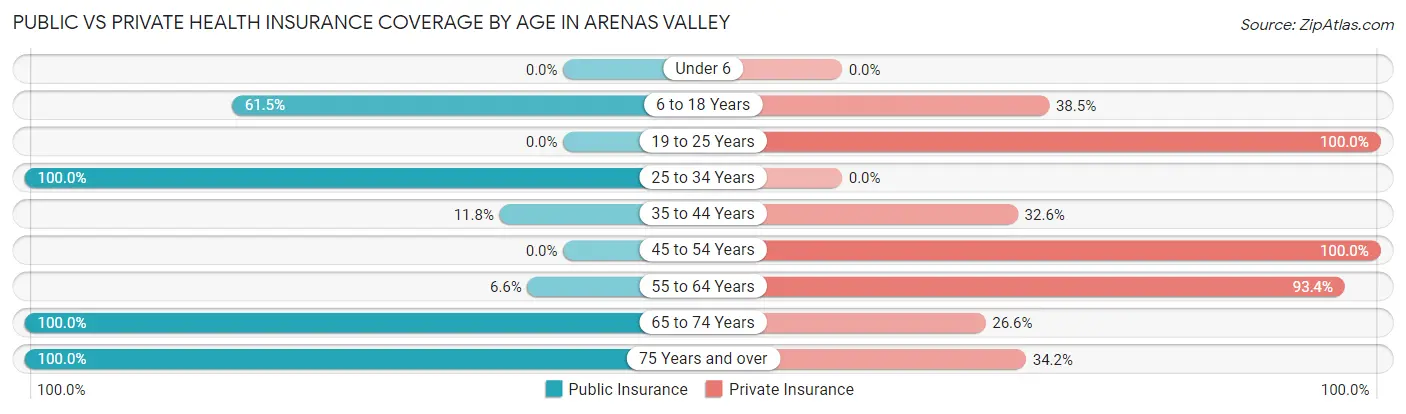
| Age Bracket | Public Insurance | Private Insurance |
| Under 6 | 0 (0.0%) | 0 (0.0%) |
| 6 to 18 Years | 64 (61.5%) | 40 (38.5%) |
| 19 to 25 Years | 0 (0.0%) | 40 (100.0%) |
| 25 to 34 Years | 13 (100.0%) | 0 (0.0%) |
| 35 to 44 Years | 17 (11.8%) | 47 (32.6%) |
| 45 to 54 Years | 0 (0.0%) | 24 (100.0%) |
| 55 to 64 Years | 12 (6.6%) | 169 (93.4%) |
| 65 to 74 Years | 229 (100.0%) | 61 (26.6%) |
| 75 Years and over | 325 (100.0%) | 111 (34.2%) |
| Total | 660 (62.3%) | 492 (46.4%) |
Disability Status by Sex by Age in Arenas Valley
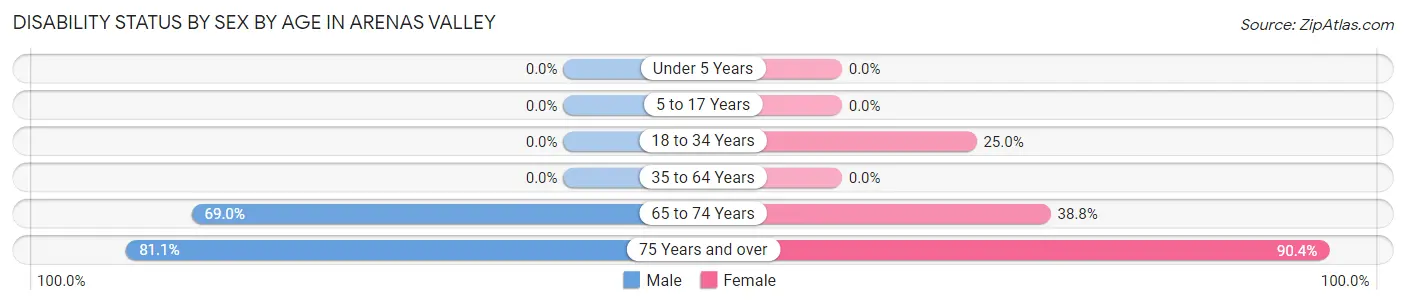
| Age Bracket | Male | Female |
| Under 5 Years | 0 (0.0%) | 0 (0.0%) |
| 5 to 17 Years | 0 (0.0%) | 0 (0.0%) |
| 18 to 34 Years | 0 (0.0%) | 13 (25.0%) |
| 35 to 64 Years | 0 (0.0%) | 0 (0.0%) |
| 65 to 74 Years | 69 (69.0%) | 50 (38.8%) |
| 75 Years and over | 43 (81.1%) | 246 (90.4%) |
Disability Class by Sex by Age in Arenas Valley
Disability Class: Hearing Difficulty
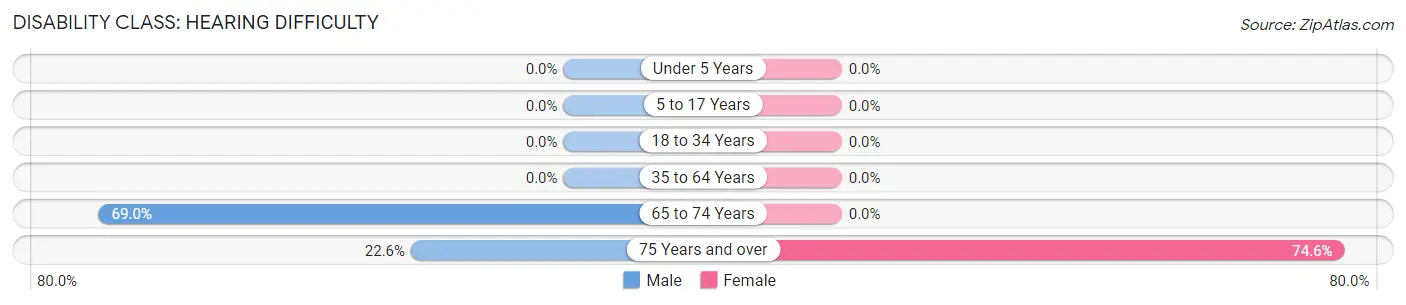
| Age Bracket | Male | Female |
| Under 5 Years | 0 (0.0%) | 0 (0.0%) |
| 5 to 17 Years | 0 (0.0%) | 0 (0.0%) |
| 18 to 34 Years | 0 (0.0%) | 0 (0.0%) |
| 35 to 64 Years | 0 (0.0%) | 0 (0.0%) |
| 65 to 74 Years | 69 (69.0%) | 0 (0.0%) |
| 75 Years and over | 12 (22.6%) | 203 (74.6%) |
Disability Class: Vision Difficulty
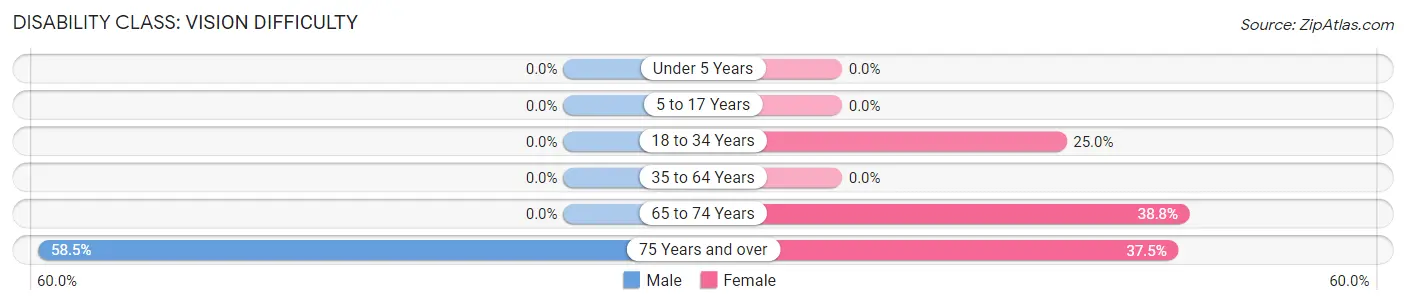
| Age Bracket | Male | Female |
| Under 5 Years | 0 (0.0%) | 0 (0.0%) |
| 5 to 17 Years | 0 (0.0%) | 0 (0.0%) |
| 18 to 34 Years | 0 (0.0%) | 13 (25.0%) |
| 35 to 64 Years | 0 (0.0%) | 0 (0.0%) |
| 65 to 74 Years | 0 (0.0%) | 50 (38.8%) |
| 75 Years and over | 31 (58.5%) | 102 (37.5%) |
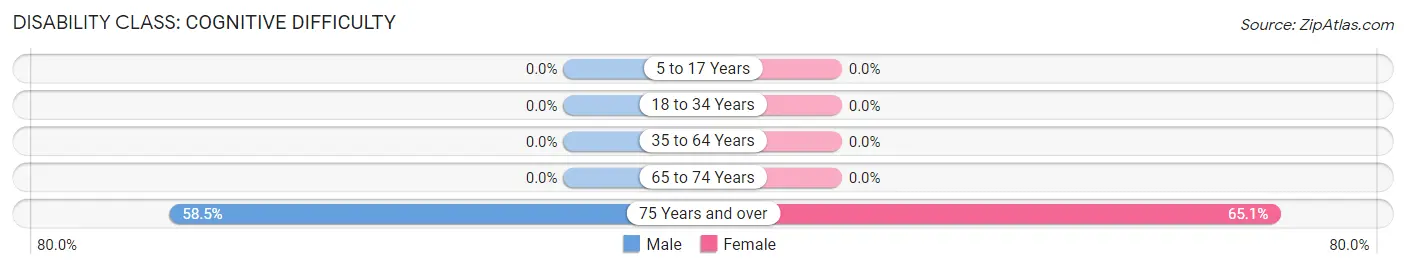
Disability Class: Cognitive Difficulty
| Age Bracket | Male | Female |
| 5 to 17 Years | 0 (0.0%) | 0 (0.0%) |
| 18 to 34 Years | 0 (0.0%) | 0 (0.0%) |
| 35 to 64 Years | 0 (0.0%) | 0 (0.0%) |
| 65 to 74 Years | 0 (0.0%) | 0 (0.0%) |
| 75 Years and over | 31 (58.5%) | 177 (65.1%) |
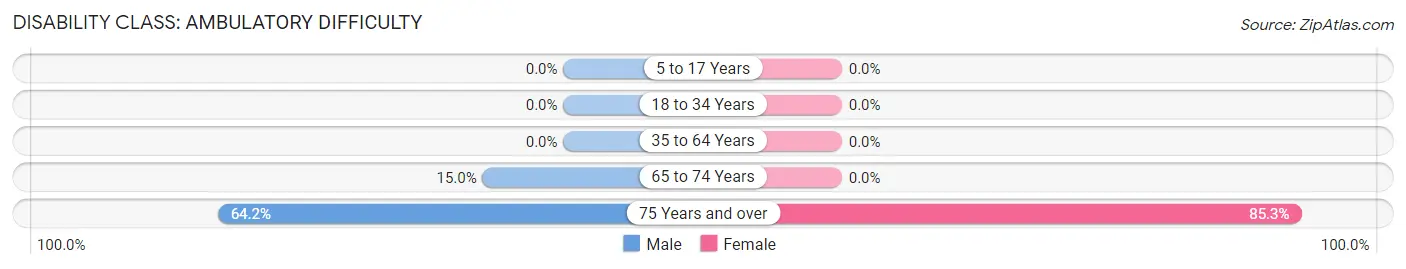
Disability Class: Ambulatory Difficulty
| Age Bracket | Male | Female |
| 5 to 17 Years | 0 (0.0%) | 0 (0.0%) |
| 18 to 34 Years | 0 (0.0%) | 0 (0.0%) |
| 35 to 64 Years | 0 (0.0%) | 0 (0.0%) |
| 65 to 74 Years | 15 (15.0%) | 0 (0.0%) |
| 75 Years and over | 34 (64.1%) | 232 (85.3%) |
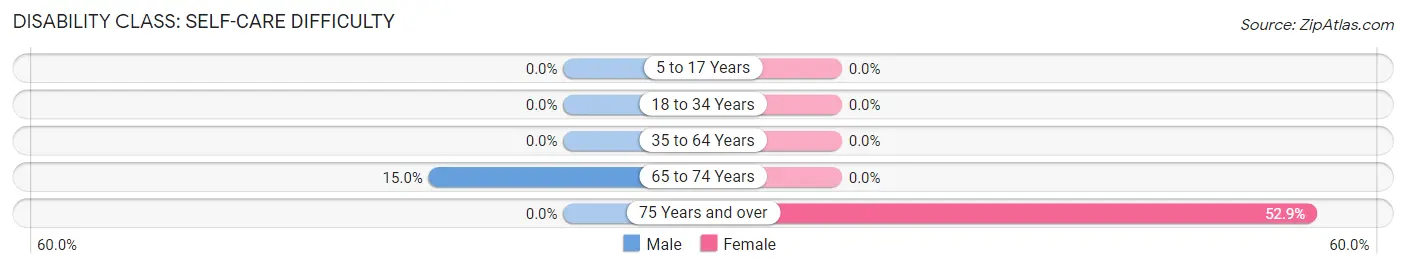
Disability Class: Self-Care Difficulty
| Age Bracket | Male | Female |
| 5 to 17 Years | 0 (0.0%) | 0 (0.0%) |
| 18 to 34 Years | 0 (0.0%) | 0 (0.0%) |
| 35 to 64 Years | 0 (0.0%) | 0 (0.0%) |
| 65 to 74 Years | 15 (15.0%) | 0 (0.0%) |
| 75 Years and over | 0 (0.0%) | 144 (52.9%) |
Technology Access in Arenas Valley
Computing Device Access in Arenas Valley
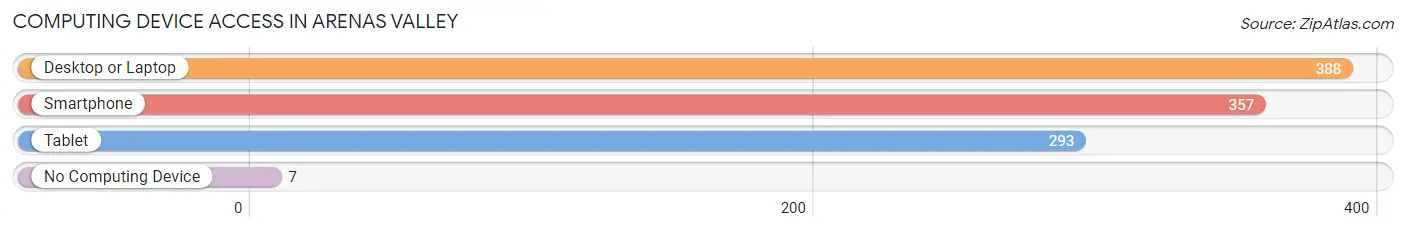
| Device Type | # Households | % Households |
| Desktop or Laptop | 388 | 94.9% |
| Smartphone | 357 | 87.3% |
| Tablet | 293 | 71.6% |
| No Computing Device | 7 | 1.7% |
| Total | 409 | 100.0% |
Internet Access in Arenas Valley
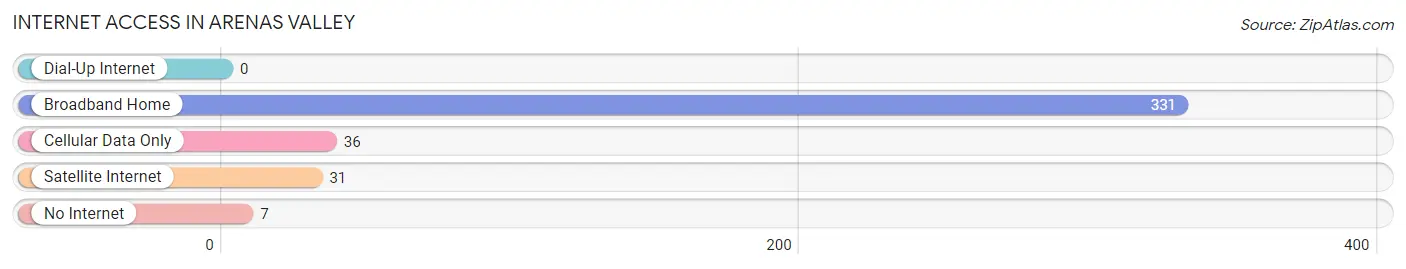
| Internet Type | # Households | % Households |
| Dial-Up Internet | 0 | 0.0% |
| Broadband Home | 331 | 80.9% |
| Cellular Data Only | 36 | 8.8% |
| Satellite Internet | 31 | 7.6% |
| No Internet | 7 | 1.7% |
| Total | 409 | 100.0% |
Arenas Valley Summary
Arenas Valley is a small unincorporated community located in the southwestern corner of New Mexico, in the foothills of the San Mateo Mountains. It is situated in the Chihuahuan Desert, approximately 25 miles south of Silver City. The population of Arenas Valley was estimated to be around 1,000 in 2020.
History
The area that is now Arenas Valley was originally inhabited by the Mimbres people, who were part of the Mogollon culture. The Mimbres were a semi-nomadic people who lived in the area for centuries before the arrival of Europeans.
The first Europeans to settle in the area were Spanish explorers, who arrived in the late 1700s. They established a mission in the area, which was later abandoned. The area was then settled by Mexican ranchers in the early 1800s.
In 1854, the United States acquired the area as part of the Gadsden Purchase. The area was then settled by American ranchers and miners. The town of Arenas Valley was established in 1881, and the post office was established in 1883.
Geography
Arenas Valley is located in the southwestern corner of New Mexico, in the foothills of the San Mateo Mountains. It is situated in the Chihuahuan Desert, approximately 25 miles south of Silver City. The area is characterized by rolling hills, mesas, and canyons. The climate is arid, with hot summers and mild winters.
Economy
The economy of Arenas Valley is largely based on agriculture and ranching. The area is home to several cattle ranches, as well as some small farms. The area is also home to several mining operations, including copper, gold, and silver mines.
The area is also home to several small businesses, including restaurants, stores, and gas stations. The area is also home to several tourist attractions, including the Gila National Forest and the Gila Cliff Dwellings National Monument.
Demographics
As of the 2010 census, the population of Arenas Valley was estimated to be 1,000. The population is largely Hispanic, with a small percentage of Native Americans. The median household income is $30,000, and the median age is 35.
Conclusion
Arenas Valley is a small unincorporated community located in the southwestern corner of New Mexico, in the foothills of the San Mateo Mountains. It is situated in the Chihuahuan Desert, approximately 25 miles south of Silver City. The population of Arenas Valley was estimated to be around 1,000 in 2020. The economy of Arenas Valley is largely based on agriculture and ranching, as well as mining and tourism. The population is largely Hispanic, with a small percentage of Native Americans.
Common Questions
What is Per Capita Income in Arenas Valley?
Per Capita income in Arenas Valley is $35,333.
What is the Median Family Income in Arenas Valley?
Median Family Income in Arenas Valley is $97,292.
What is the Median Household income in Arenas Valley?
Median Household Income in Arenas Valley is $68,068.
What is Inequality or Gini Index in Arenas Valley?
Inequality or Gini Index in Arenas Valley is 0.44.
What is the Total Population of Arenas Valley?
Total Population of Arenas Valley is 1,060.
What is the Total Male Population of Arenas Valley?
Total Male Population of Arenas Valley is 389.
What is the Total Female Population of Arenas Valley?
Total Female Population of Arenas Valley is 671.
What is the Ratio of Males per 100 Females in Arenas Valley?
There are 57.97 Males per 100 Females in Arenas Valley.
What is the Ratio of Females per 100 Males in Arenas Valley?
There are 172.49 Females per 100 Males in Arenas Valley.
What is the Median Population Age in Arenas Valley?
Median Population Age in Arenas Valley is 65.3 Years.
What is the Average Family Size in Arenas Valley
Average Family Size in Arenas Valley is 2.9 People.
What is the Average Household Size in Arenas Valley
Average Household Size in Arenas Valley is 2.6 People.
How Large is the Labor Force in Arenas Valley?
There are 380 People in the Labor Forcein in Arenas Valley.
What is the Percentage of People in the Labor Force in Arenas Valley?
39.0% of People are in the Labor Force in Arenas Valley.
What is the Unemployment Rate in Arenas Valley?
Unemployment Rate in Arenas Valley is 5.3%.