Zip Codes with the Highest Percentage of Population Employed in Legal Services & Support in Vineland, NJ
RELATED REPORTS & OPTIONS
Legal Services & Support
Vineland
Compare Zip Codes
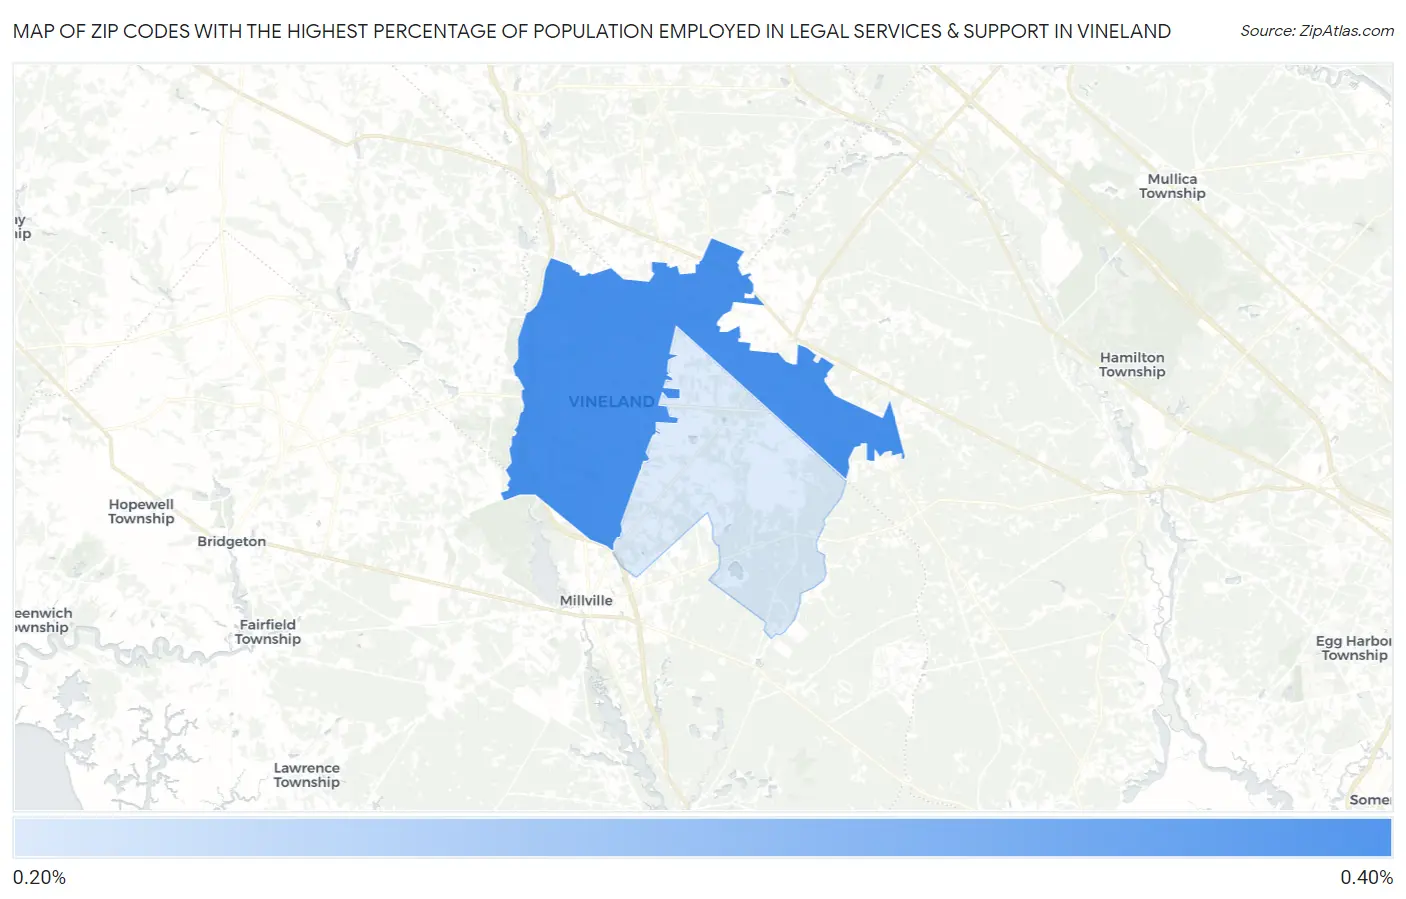
Map of Zip Codes with the Highest Percentage of Population Employed in Legal Services & Support in Vineland
0.23%
0.35%
Zip Codes with the Highest Percentage of Population Employed in Legal Services & Support in Vineland, NJ
| Zip Code | % Employed | vs State | vs National | |
| 1. | 08360 | 0.35% | 1.5%(-1.20)#471 | 1.2%(-0.834)#14,467 |
| 2. | 08361 | 0.23% | 1.5%(-1.32)#489 | 1.2%(-0.958)#15,929 |
1
Common Questions
What are the Top Zip Codes with the Highest Percentage of Population Employed in Legal Services & Support in Vineland, NJ?
Top Zip Codes with the Highest Percentage of Population Employed in Legal Services & Support in Vineland, NJ are:
What zip code has the Highest Percentage of Population Employed in Legal Services & Support in Vineland, NJ?
08360 has the Highest Percentage of Population Employed in Legal Services & Support in Vineland, NJ with 0.35%.
What is the Percentage of Population Employed in Legal Services & Support in Vineland, NJ?
Percentage of Population Employed in Legal Services & Support in Vineland is 0.37%.
What is the Percentage of Population Employed in Legal Services & Support in New Jersey?
Percentage of Population Employed in Legal Services & Support in New Jersey is 1.5%.
What is the Percentage of Population Employed in Legal Services & Support in the United States?
Percentage of Population Employed in Legal Services & Support in the United States is 1.2%.