Zip Codes with the Highest Percentage of Households Without a Vehicle in Princeton, NJ
RELATED REPORTS & OPTIONS
Households without a Cars
Princeton
Compare Zip Codes
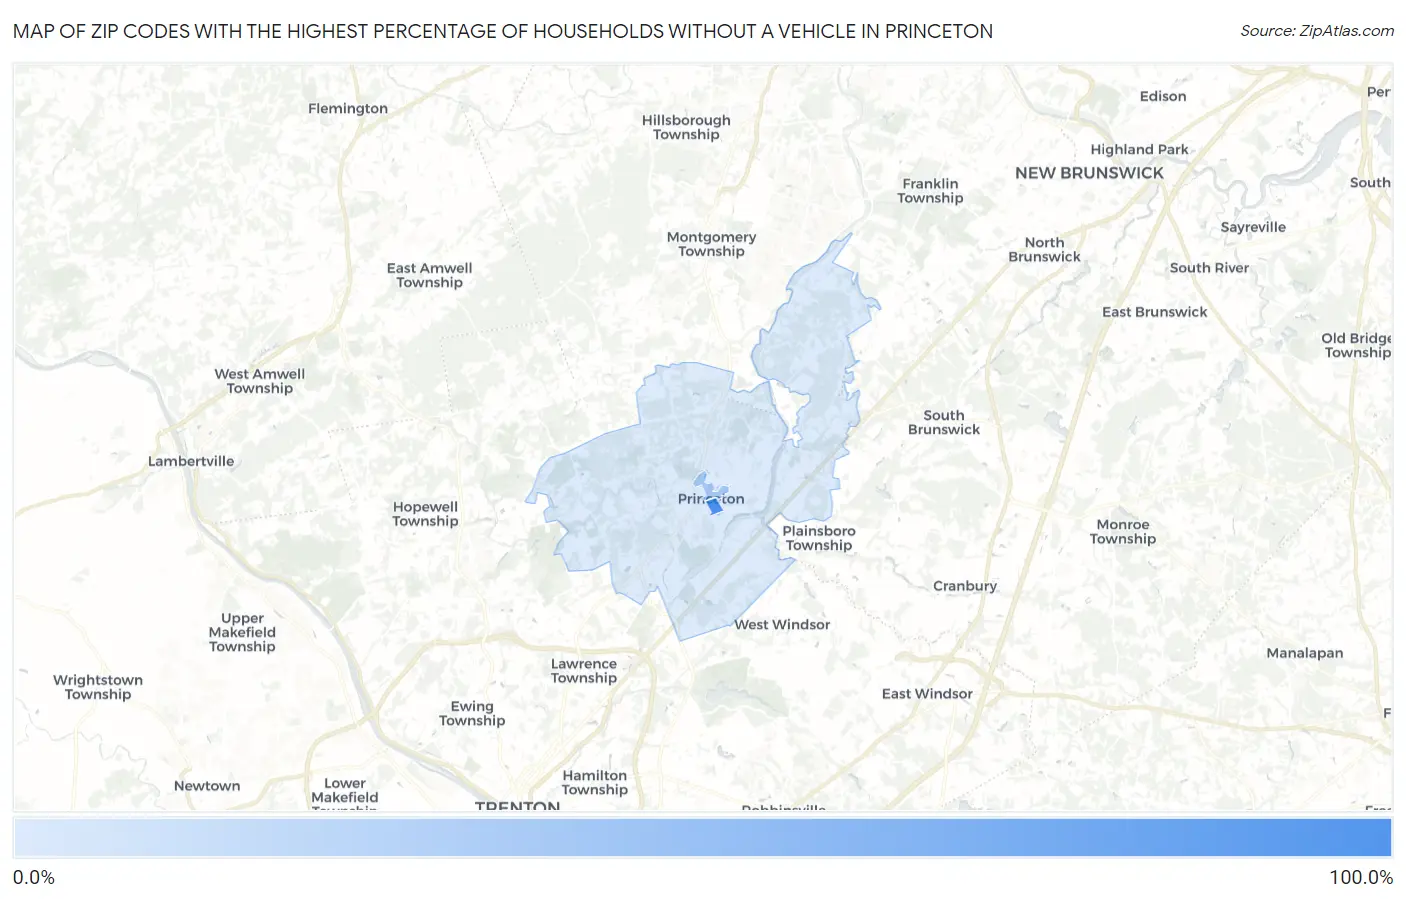
Map of Zip Codes with the Highest Percentage of Households Without a Vehicle in Princeton
7.0%
100.0%
Zip Codes with the Highest Percentage of Households Without a Vehicle in Princeton, NJ
| Zip Code | Housholds Without a Car | vs State | vs National | |
| 1. | 08544 | 100.0% | 11.3%(+88.7)#1 | 8.3%(+91.7)#4 |
| 2. | 08542 | 36.5% | 11.3%(+25.2)#20 | 8.3%(+28.2)#606 |
| 3. | 08540 | 7.0% | 11.3%(-4.30)#182 | 8.3%(-1.30)#8,521 |
1
Common Questions
What are the Top Zip Codes with the Highest Percentage of Households Without a Vehicle in Princeton, NJ?
Top Zip Codes with the Highest Percentage of Households Without a Vehicle in Princeton, NJ are:
What zip code has the Highest Percentage of Households Without a Vehicle in Princeton, NJ?
08544 has the Highest Percentage of Households Without a Vehicle in Princeton, NJ with 100.0%.
What is the Percentage of Households Without a Vehicle in Princeton, NJ?
Percentage of Households Without a Vehicle in Princeton is 13.2%.
What is the Percentage of Households Without a Vehicle in New Jersey?
Percentage of Households Without a Vehicle in New Jersey is 11.3%.
What is the Percentage of Households Without a Vehicle in the United States?
Percentage of Households Without a Vehicle in the United States is 8.3%.