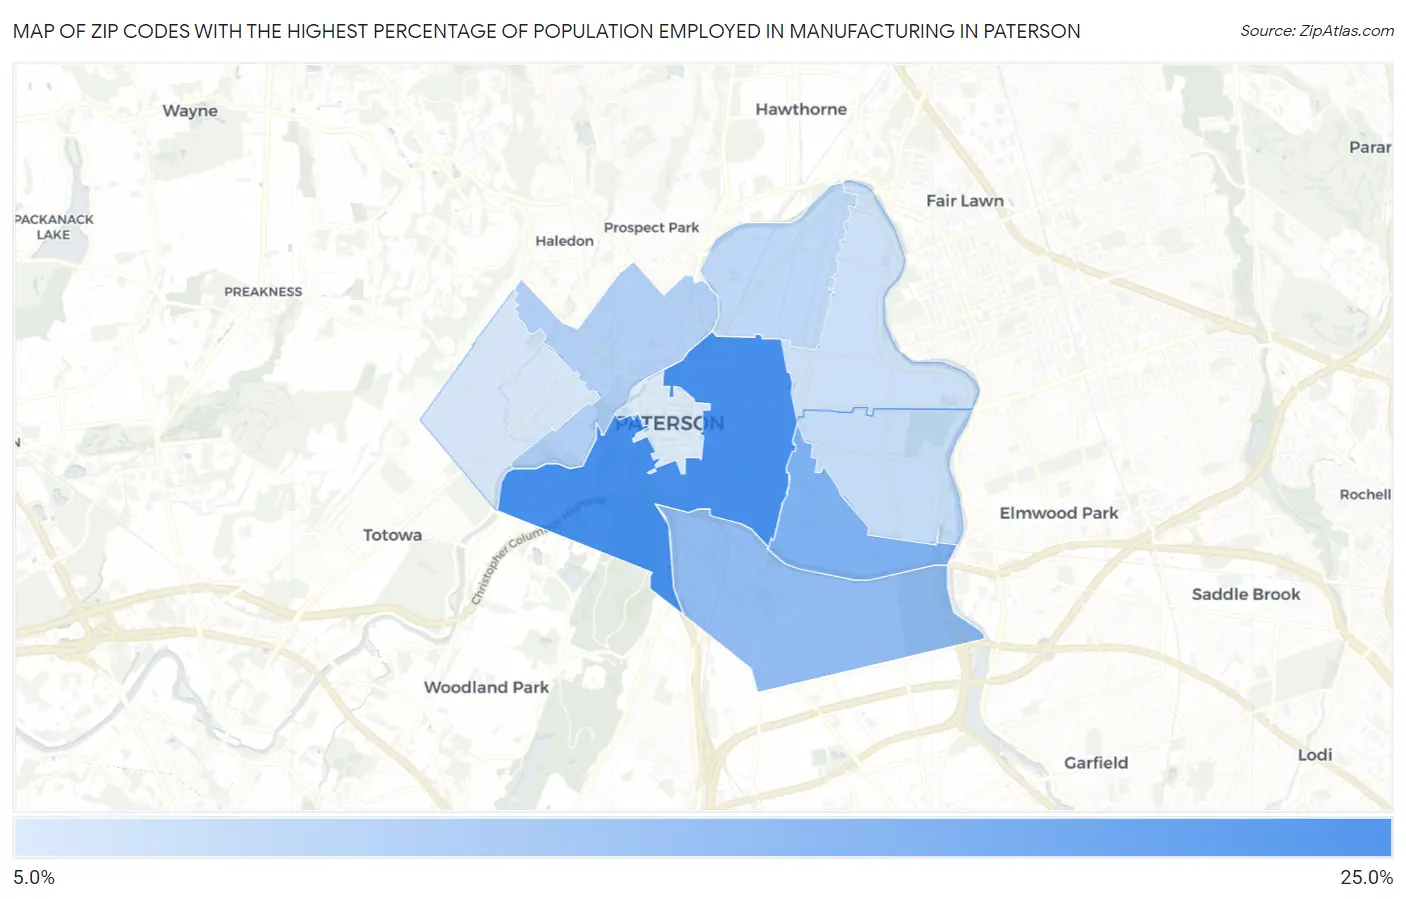
Zip Codes with the Highest Percentage of Population Employed in Manufacturing in Paterson, NJ
RELATED REPORTS & OPTIONS
Manufacturing
Paterson
Compare Zip Codes
Map of Zip Codes with the Highest Percentage of Population Employed in Manufacturing in Paterson
0.0%
25.0%
Zip Codes with the Highest Percentage of Population Employed in Manufacturing in Paterson, NJ
| Zip Code | % Employed | vs State | vs National | |
| 1. | 07501 | 23.9% | 8.1%(+15.8)#6 | 10.0%(+13.9)#2,904 |
| 2. | 07513 | 19.1% | 8.1%(+11.0)#11 | 10.0%(+9.10)#5,480 |
| 3. | 07503 | 17.6% | 8.1%(+9.52)#17 | 10.0%(+7.64)#6,608 |
| 4. | 07522 | 14.7% | 8.1%(+6.64)#32 | 10.0%(+4.75)#9,334 |
| 5. | 07524 | 13.7% | 8.1%(+5.57)#46 | 10.0%(+3.69)#10,537 |
| 6. | 07504 | 13.1% | 8.1%(+5.01)#55 | 10.0%(+3.12)#11,232 |
| 7. | 07514 | 12.6% | 8.1%(+4.46)#67 | 10.0%(+2.57)#11,922 |
| 8. | 07502 | 11.7% | 8.1%(+3.55)#88 | 10.0%(+1.66)#13,177 |
| 9. | 07505 | 11.4% | 8.1%(+3.26)#97 | 10.0%(+1.37)#13,622 |
1
Common Questions
What are the Top 5 Zip Codes with the Highest Percentage of Population Employed in Manufacturing in Paterson, NJ?
Top 5 Zip Codes with the Highest Percentage of Population Employed in Manufacturing in Paterson, NJ are:
What zip code has the Highest Percentage of Population Employed in Manufacturing in Paterson, NJ?
07501 has the Highest Percentage of Population Employed in Manufacturing in Paterson, NJ with 23.9%.
What is the Percentage of Population Employed in Manufacturing in Paterson, NJ?
Percentage of Population Employed in Manufacturing in Paterson is 16.5%.
What is the Percentage of Population Employed in Manufacturing in New Jersey?
Percentage of Population Employed in Manufacturing in New Jersey is 8.1%.
What is the Percentage of Population Employed in Manufacturing in the United States?
Percentage of Population Employed in Manufacturing in the United States is 10.0%.